User login
Discharge Summary Survey
Twelve percent of patients have been reported to have preventable or ameliorable adverse events in the period immediately following hospital discharge.1, 2 A potential contributor to the number of adverse events is inadequate transfer of clinical information at hospital discharge. The discharge summary is a vital component of the transfer of information from the inpatient to the outpatient setting. Unfortunately, discharge summaries are often unavailable when follow‐up care occurs and often lack important content.36
Many hospitals are implementing an electronic medical record systems. This creates the opportunity at hospital discharge to immediately assemble the major components of a discharge summary. With enhanced communication systems, this information can be delivered in a variety of ways with minimal delay. We report the results and evaluation of a survey of medicine faculty at an urban academic medical center about the timeliness and quality of discharge summaries, the perceived incidence of adverse events related to suboptimal information transfer at discharge, and the need for the electronically generated discharge summary we plan to design.
METHODS
Study Site
The study was conducted at a 753‐bed academic hospital in Chicago, Illinois. Discharge summaries have traditionally been dictated by inpatient physicians and delivered to outpatient physicians by both mail and facsimile via the medical records department. The hospital has used an electronic medical record and computerized physician order entry system (PowerChart Millennium from Cerner Corporation) since August 2004. Although all history and physicals and progress notes were documented in the electronic medical record, the system did not provide a method for delivering the discharge summaries contained in the electronic medical record to outpatient physician offices. Because of this, inpatient physicians continued to dictate discharge summaries during this study.
Participants
An advisory board consisting of 16 physicians from the Department of Medicine was convened. The advisory board gave input on needs assessment and helped to create a survey to be administered to all 425 medicine faculty who have an outpatient practice. All respondents who had at least 1 patient admitted to the hospital within the 6 months prior to the survey were eligible.
Survey Content
Our survey consisted of 2 parts. In the first part, we asked respondents to estimate how many of their patients had been discharged from the hospital in the past 6 months and to reflect on these patients as they completed the survey. Satisfaction with the timeliness and quality of discharge summaries was assessed using a 5‐point Likert scale, from 5, very satisfied, to 1, very unsatisfied. The frequency of hospital follow‐up of a patient occurring prior to arrival of the discharge summary was assessed as the percentage of times this occurred in 20% increments (0%‐19%, 20%‐39%, 40%‐59%, 60%‐79%, and 80%‐100%). The number of discharge summaries missing critical information and the number of summaries containing unnecessary information were similarly assessed using 20% increments. We then asked respondents to estimate the number of patients who had sustained a preventable adverse event related to suboptimal transfer of information at discharge. We defined a preventable adverse event as a preventable medical problem or worsening of an existing problem.
In the second part of the survey, we elicited preferences for discharge summary content and method of delivery. We assessed preferences for discharge summary content by asking respondents to rank items on a scale from 1 to 10, from 10, most important, to 1, least important. Preferences for delivery of discharge summaries were assessed by asking respondents to indicate one or more delivery methods, including facsimile, mail, the electronic medical record, and E‐mail.
Survey Process
The survey was sent out in March 2005. A postcard reminder was sent out approximately 2 weeks after the initial survey was mailed. A second survey was sent to nonresponders 6 weeks after the initial survey. Simultaneously, the survey was also sent in Web‐based format to nonresponders via email.
Data Analysis
Physician characteristics, including practice type, faculty appointment type, and year of medical school graduation, were provided by the hospital's medical staff office. Physician respondents and nonrespondents were compared using the chi‐square test and logistic regression to determine potential response biases. We calculated means and standard deviations and percentages for categorical variables. Logistic regression was used to examine the likelihood of participants reporting any preventable adverse event related to suboptimal transfer of information. The regression model tested the likelihood of one or more preventable adverse events reported with the frequency of seeing patients for follow‐up prior to the arrival of discharge summaries, controlling for participant characteristics and the number of hospitalized patients each physician had in the previous 6 months.
RESULTS
Physician Characteristics
The survey was sent to 425 physicians, 9 of whom were excluded because they had had no patients admitted within the past 6 months. Of the 416 eligible respondents, 2 returned a survey that was incomplete and not usable, and 226 returned a completed survey (response rate of 54%). The characteristics of responders and nonresponders are shown in Table 1. General medicine physicians completed the survey more often than specialist physicians (56% vs. 44%, P .001). Affiliated faculty were also more likely to complete the survey than full‐time faculty; multivariate logistic regression revealed this was purely a function of the larger number of specialists among the full‐time faculty.
| Responders (N = 226) | Nonresponders (N = 188) | P value | |
|---|---|---|---|
| |||
| Practice type | |||
| Generalist, N (%) | 127 (56.2) | 65 (34.6) | .001 |
| Specialist, N (%) | 99 (43.8) | 123 (65.4) | |
| Faculty appointment | |||
| Full‐time, N (%) | 104 (46.0 | 106 (56.4) | .04 |
| Affiliated, N (%) | 122 (54.0) | 82 (43.6) | |
| Year of medical school graduation | |||
| Before 1990, N (%) | 131 (58.0) | 127 (67.6) | .04 |
| 1990 or later, N (%) | 95 (42.0) | 61 (32.4) | |
| Number of patients hospitalized in last 6 monthsa | |||
| 1‐4, N (%) | 15 (7.9) | ||
| 5‐10, N (%) | 62 (32.5) | ||
| 11‐19, N (%) | 35 (18.3) | ||
| 20 or more, N (%) | 79 (41.4) | ||
Timeliness and Content
Only 19% of the participants were satisfied or very satisfied with the timeliness of discharge summaries. Among all participants, 33% indicated that 60% or more of their patients were seen for their follow‐up outpatient visit prior to the arrival of the discharge summary, and 22% indicated that for 60% or more of their patients they never received a discharge summary at all.
Only 32% of the participants were satisfied or very satisfied with the quality of discharge summaries. Among all participants, 17% believed that 60% or more of discharge summaries missed critical information. Unnecessary information in the discharge summary was less problematic; only 9% of participants indicated that 60% or more of discharge summaries contained unnecessary information.
Preventable Adverse Events
Overall, 41% of participants believed that in the previous 6 months at least one of their patients had sustained a preventable adverse event related to poor transfer of information at hospital discharge. Reporting one or more preventable adverse events was positively associated with physicians' reports of how often they saw patients for a first postdischarge follow‐up without having a discharge summary available. After adjusting for participant characteristics and the number of patients hospitalized by each physician, logistic regression results indicated that each 20% increase in the frequency of discharge summaries not arriving prior to patient follow‐up appointments was associated with a 28% increase in the odds of a reported preventable adverse event (adjusted OR = 1.28, P = .04).
Preferences for Content and Delivery
The mean rating for importance of discharge summary elements is shown in Table 2. No discharge summary element had a mean rating of less than 5. Participants preferred discharge summaries be delivered via the following methods: facsimile, 48%; mail, 30%; electronic medical record, 41%; and E‐mail, 30%.
| Mean rating (scale of 1‐10) | |
|---|---|
| Medications at discharge | 9.69 |
| Follow‐up issues | 9.09 |
| Discharge diagnosis | 9.02 |
| List of procedures performed | 8.79 |
| Pathology reports | 8.78 |
| Pending test results | 8.68 |
| Procedure reports | 8.16 |
| Stress test reports | 8.07 |
| Dates of admission and discharge | 8.01 |
| Problem list | 7.99 |
| List of radiology tests performed | 7.84 |
| Echocardiogram reports | 7.79 |
| Follow‐up appointments | 7.79 |
| Radiology reports | 7.76 |
| Names of consulting attendings | 7.64 |
| Name of inpatient attending | 7.28 |
| Labs from last hospital day | 7.08 |
| Medications at admission | 6.91 |
| Allergies | 6.56 |
| All lab results | 6.22 |
| Code status | 6.09 |
| Names of inpatient house officers | 5.64 |
DISCUSSION
Our study found that outpatient physicians were not satisfied with the timeliness or the quality of current discharge summaries. Our findings are in agreement with previous studies demonstrating that discharge summaries were often not available to outpatient physicians3,4 and were often of poor quality.5, 6
Preventable or ameliorable adverse events have been reported to occur in 12% of patients in the period immediately following hospital discharge.1, 2 No studies have evaluated the relationship between discharge summaries and preventable adverse events following discharge. Our study found that 41% of outpatient physicians believed that at least one of their patients in the 6 months prior to the survey had sustained a preventable adverse event related to the suboptimal transfer of information at hospital discharge. In addition, the likelihood of physicians reporting one or more preventable adverse events increased with the frequency of seeing patients for follow‐up prior to discharge summary arrival.
In preparation for revising the discharge summary, we asked outpatient physicians to rate the importance of discharge summary content and their preference for method of delivery of discharge summaries. As in previous studies, the outpatient physicians rated discharge medications, discharge diagnosis, test results, and follow‐up plans as highly important.7, 8 Much of this clinical data is now available in the electronic medical record. Therefore, it is possible to electronically assemble much, if not all, of discharge summary content. One recent study demonstrated that database‐generated discharge summaries significantly increased the likelihood that a discharge summary was generated within 4 weeks of hospital discharge.9 The database used in that study required manual data input from a handwritten form. To our knowledge, no study has reported the experience of discharge summaries generated from an electronic medical record.
Our study had several limitations. First, our study used physician survey to assess the timeliness of receiving discharge summaries. Measuring the time to actual receipt of discharge summaries by physicians was beyond the scope of our study. Second, our study did not measure adverse events directly. Instead, we asked outpatient physicians to estimate how many of their patients discharged in the last 6 months had sustained a preventable adverse event related to suboptimal information transfer at discharge. We had limited space in the questionnaire to define the meaning of a preventable adverse event; therefore, the description in the survey does not exactly match previous definitions.1, 2 Our study had a response rate of 54%. It is possible that nonresponders may have been more satisfied with the quality and timeliness of discharge summaries and may have believed fewer patients experienced preventable adverse events related to suboptimal information transfer at discharge.
The results of our study suggest that the use of systems to improve the quality and delivery of discharge summaries has the potential to improve outpatient physician satisfaction and to reduce the number of preventable adverse events that occur during the vulnerable period following hospital discharge. With the use of electronic medical records, we now have the potential to automate the process of assembling and delivering clinical information with minimal delay. We are now using the information from this study to design a partially automated, high‐quality discharge summary that can be delivered to outpatient physicians immediately on discharge.
- ,,, et al.Adverse events among medical patient after hospital discharge.CMAJ.2004;170:345–349.
- ,,,,.The incidence and severity of adverse events affecting patients after discharge from the hospital.Ann Intern Med.2003;138:161–167.
- ,,.Dissemination of discharge summaries. Not reaching follow‐up physicians.Can Fam Physician.2002;48:737–742.
- ,,,.Effect of discharge summary availability during post‐discharge visits on hospital readmission.J Gen Intern Med.2002;17:186–192.
- ,,,.General practitioner‐hospital communications: a review of discharge summaries.J Qual Clin Pract.2001;21:104–108.
- ,,,,.Quality assessment of discharge letters in a French university hospital.Int J Health Care Qual Assur.1998;11:90–95.
- ,,.Content of a discharge summary from a medical ward: views of general practitioners and hospital doctors.J R Coll Physicians Lond.1995;29:307–310.
- ,.What is necessary for high‐quality discharge summaries?Am J Med Qual.1999;14:160–169.
- ,,,.Dictated versus database‐generated discharge summaries: a randomized clinical trial.CMAJ.1999;160:319–326.
Twelve percent of patients have been reported to have preventable or ameliorable adverse events in the period immediately following hospital discharge.1, 2 A potential contributor to the number of adverse events is inadequate transfer of clinical information at hospital discharge. The discharge summary is a vital component of the transfer of information from the inpatient to the outpatient setting. Unfortunately, discharge summaries are often unavailable when follow‐up care occurs and often lack important content.36
Many hospitals are implementing an electronic medical record systems. This creates the opportunity at hospital discharge to immediately assemble the major components of a discharge summary. With enhanced communication systems, this information can be delivered in a variety of ways with minimal delay. We report the results and evaluation of a survey of medicine faculty at an urban academic medical center about the timeliness and quality of discharge summaries, the perceived incidence of adverse events related to suboptimal information transfer at discharge, and the need for the electronically generated discharge summary we plan to design.
METHODS
Study Site
The study was conducted at a 753‐bed academic hospital in Chicago, Illinois. Discharge summaries have traditionally been dictated by inpatient physicians and delivered to outpatient physicians by both mail and facsimile via the medical records department. The hospital has used an electronic medical record and computerized physician order entry system (PowerChart Millennium from Cerner Corporation) since August 2004. Although all history and physicals and progress notes were documented in the electronic medical record, the system did not provide a method for delivering the discharge summaries contained in the electronic medical record to outpatient physician offices. Because of this, inpatient physicians continued to dictate discharge summaries during this study.
Participants
An advisory board consisting of 16 physicians from the Department of Medicine was convened. The advisory board gave input on needs assessment and helped to create a survey to be administered to all 425 medicine faculty who have an outpatient practice. All respondents who had at least 1 patient admitted to the hospital within the 6 months prior to the survey were eligible.
Survey Content
Our survey consisted of 2 parts. In the first part, we asked respondents to estimate how many of their patients had been discharged from the hospital in the past 6 months and to reflect on these patients as they completed the survey. Satisfaction with the timeliness and quality of discharge summaries was assessed using a 5‐point Likert scale, from 5, very satisfied, to 1, very unsatisfied. The frequency of hospital follow‐up of a patient occurring prior to arrival of the discharge summary was assessed as the percentage of times this occurred in 20% increments (0%‐19%, 20%‐39%, 40%‐59%, 60%‐79%, and 80%‐100%). The number of discharge summaries missing critical information and the number of summaries containing unnecessary information were similarly assessed using 20% increments. We then asked respondents to estimate the number of patients who had sustained a preventable adverse event related to suboptimal transfer of information at discharge. We defined a preventable adverse event as a preventable medical problem or worsening of an existing problem.
In the second part of the survey, we elicited preferences for discharge summary content and method of delivery. We assessed preferences for discharge summary content by asking respondents to rank items on a scale from 1 to 10, from 10, most important, to 1, least important. Preferences for delivery of discharge summaries were assessed by asking respondents to indicate one or more delivery methods, including facsimile, mail, the electronic medical record, and E‐mail.
Survey Process
The survey was sent out in March 2005. A postcard reminder was sent out approximately 2 weeks after the initial survey was mailed. A second survey was sent to nonresponders 6 weeks after the initial survey. Simultaneously, the survey was also sent in Web‐based format to nonresponders via email.
Data Analysis
Physician characteristics, including practice type, faculty appointment type, and year of medical school graduation, were provided by the hospital's medical staff office. Physician respondents and nonrespondents were compared using the chi‐square test and logistic regression to determine potential response biases. We calculated means and standard deviations and percentages for categorical variables. Logistic regression was used to examine the likelihood of participants reporting any preventable adverse event related to suboptimal transfer of information. The regression model tested the likelihood of one or more preventable adverse events reported with the frequency of seeing patients for follow‐up prior to the arrival of discharge summaries, controlling for participant characteristics and the number of hospitalized patients each physician had in the previous 6 months.
RESULTS
Physician Characteristics
The survey was sent to 425 physicians, 9 of whom were excluded because they had had no patients admitted within the past 6 months. Of the 416 eligible respondents, 2 returned a survey that was incomplete and not usable, and 226 returned a completed survey (response rate of 54%). The characteristics of responders and nonresponders are shown in Table 1. General medicine physicians completed the survey more often than specialist physicians (56% vs. 44%, P .001). Affiliated faculty were also more likely to complete the survey than full‐time faculty; multivariate logistic regression revealed this was purely a function of the larger number of specialists among the full‐time faculty.
| Responders (N = 226) | Nonresponders (N = 188) | P value | |
|---|---|---|---|
| |||
| Practice type | |||
| Generalist, N (%) | 127 (56.2) | 65 (34.6) | .001 |
| Specialist, N (%) | 99 (43.8) | 123 (65.4) | |
| Faculty appointment | |||
| Full‐time, N (%) | 104 (46.0 | 106 (56.4) | .04 |
| Affiliated, N (%) | 122 (54.0) | 82 (43.6) | |
| Year of medical school graduation | |||
| Before 1990, N (%) | 131 (58.0) | 127 (67.6) | .04 |
| 1990 or later, N (%) | 95 (42.0) | 61 (32.4) | |
| Number of patients hospitalized in last 6 monthsa | |||
| 1‐4, N (%) | 15 (7.9) | ||
| 5‐10, N (%) | 62 (32.5) | ||
| 11‐19, N (%) | 35 (18.3) | ||
| 20 or more, N (%) | 79 (41.4) | ||
Timeliness and Content
Only 19% of the participants were satisfied or very satisfied with the timeliness of discharge summaries. Among all participants, 33% indicated that 60% or more of their patients were seen for their follow‐up outpatient visit prior to the arrival of the discharge summary, and 22% indicated that for 60% or more of their patients they never received a discharge summary at all.
Only 32% of the participants were satisfied or very satisfied with the quality of discharge summaries. Among all participants, 17% believed that 60% or more of discharge summaries missed critical information. Unnecessary information in the discharge summary was less problematic; only 9% of participants indicated that 60% or more of discharge summaries contained unnecessary information.
Preventable Adverse Events
Overall, 41% of participants believed that in the previous 6 months at least one of their patients had sustained a preventable adverse event related to poor transfer of information at hospital discharge. Reporting one or more preventable adverse events was positively associated with physicians' reports of how often they saw patients for a first postdischarge follow‐up without having a discharge summary available. After adjusting for participant characteristics and the number of patients hospitalized by each physician, logistic regression results indicated that each 20% increase in the frequency of discharge summaries not arriving prior to patient follow‐up appointments was associated with a 28% increase in the odds of a reported preventable adverse event (adjusted OR = 1.28, P = .04).
Preferences for Content and Delivery
The mean rating for importance of discharge summary elements is shown in Table 2. No discharge summary element had a mean rating of less than 5. Participants preferred discharge summaries be delivered via the following methods: facsimile, 48%; mail, 30%; electronic medical record, 41%; and E‐mail, 30%.
| Mean rating (scale of 1‐10) | |
|---|---|
| Medications at discharge | 9.69 |
| Follow‐up issues | 9.09 |
| Discharge diagnosis | 9.02 |
| List of procedures performed | 8.79 |
| Pathology reports | 8.78 |
| Pending test results | 8.68 |
| Procedure reports | 8.16 |
| Stress test reports | 8.07 |
| Dates of admission and discharge | 8.01 |
| Problem list | 7.99 |
| List of radiology tests performed | 7.84 |
| Echocardiogram reports | 7.79 |
| Follow‐up appointments | 7.79 |
| Radiology reports | 7.76 |
| Names of consulting attendings | 7.64 |
| Name of inpatient attending | 7.28 |
| Labs from last hospital day | 7.08 |
| Medications at admission | 6.91 |
| Allergies | 6.56 |
| All lab results | 6.22 |
| Code status | 6.09 |
| Names of inpatient house officers | 5.64 |
DISCUSSION
Our study found that outpatient physicians were not satisfied with the timeliness or the quality of current discharge summaries. Our findings are in agreement with previous studies demonstrating that discharge summaries were often not available to outpatient physicians3,4 and were often of poor quality.5, 6
Preventable or ameliorable adverse events have been reported to occur in 12% of patients in the period immediately following hospital discharge.1, 2 No studies have evaluated the relationship between discharge summaries and preventable adverse events following discharge. Our study found that 41% of outpatient physicians believed that at least one of their patients in the 6 months prior to the survey had sustained a preventable adverse event related to the suboptimal transfer of information at hospital discharge. In addition, the likelihood of physicians reporting one or more preventable adverse events increased with the frequency of seeing patients for follow‐up prior to discharge summary arrival.
In preparation for revising the discharge summary, we asked outpatient physicians to rate the importance of discharge summary content and their preference for method of delivery of discharge summaries. As in previous studies, the outpatient physicians rated discharge medications, discharge diagnosis, test results, and follow‐up plans as highly important.7, 8 Much of this clinical data is now available in the electronic medical record. Therefore, it is possible to electronically assemble much, if not all, of discharge summary content. One recent study demonstrated that database‐generated discharge summaries significantly increased the likelihood that a discharge summary was generated within 4 weeks of hospital discharge.9 The database used in that study required manual data input from a handwritten form. To our knowledge, no study has reported the experience of discharge summaries generated from an electronic medical record.
Our study had several limitations. First, our study used physician survey to assess the timeliness of receiving discharge summaries. Measuring the time to actual receipt of discharge summaries by physicians was beyond the scope of our study. Second, our study did not measure adverse events directly. Instead, we asked outpatient physicians to estimate how many of their patients discharged in the last 6 months had sustained a preventable adverse event related to suboptimal information transfer at discharge. We had limited space in the questionnaire to define the meaning of a preventable adverse event; therefore, the description in the survey does not exactly match previous definitions.1, 2 Our study had a response rate of 54%. It is possible that nonresponders may have been more satisfied with the quality and timeliness of discharge summaries and may have believed fewer patients experienced preventable adverse events related to suboptimal information transfer at discharge.
The results of our study suggest that the use of systems to improve the quality and delivery of discharge summaries has the potential to improve outpatient physician satisfaction and to reduce the number of preventable adverse events that occur during the vulnerable period following hospital discharge. With the use of electronic medical records, we now have the potential to automate the process of assembling and delivering clinical information with minimal delay. We are now using the information from this study to design a partially automated, high‐quality discharge summary that can be delivered to outpatient physicians immediately on discharge.
Twelve percent of patients have been reported to have preventable or ameliorable adverse events in the period immediately following hospital discharge.1, 2 A potential contributor to the number of adverse events is inadequate transfer of clinical information at hospital discharge. The discharge summary is a vital component of the transfer of information from the inpatient to the outpatient setting. Unfortunately, discharge summaries are often unavailable when follow‐up care occurs and often lack important content.36
Many hospitals are implementing an electronic medical record systems. This creates the opportunity at hospital discharge to immediately assemble the major components of a discharge summary. With enhanced communication systems, this information can be delivered in a variety of ways with minimal delay. We report the results and evaluation of a survey of medicine faculty at an urban academic medical center about the timeliness and quality of discharge summaries, the perceived incidence of adverse events related to suboptimal information transfer at discharge, and the need for the electronically generated discharge summary we plan to design.
METHODS
Study Site
The study was conducted at a 753‐bed academic hospital in Chicago, Illinois. Discharge summaries have traditionally been dictated by inpatient physicians and delivered to outpatient physicians by both mail and facsimile via the medical records department. The hospital has used an electronic medical record and computerized physician order entry system (PowerChart Millennium from Cerner Corporation) since August 2004. Although all history and physicals and progress notes were documented in the electronic medical record, the system did not provide a method for delivering the discharge summaries contained in the electronic medical record to outpatient physician offices. Because of this, inpatient physicians continued to dictate discharge summaries during this study.
Participants
An advisory board consisting of 16 physicians from the Department of Medicine was convened. The advisory board gave input on needs assessment and helped to create a survey to be administered to all 425 medicine faculty who have an outpatient practice. All respondents who had at least 1 patient admitted to the hospital within the 6 months prior to the survey were eligible.
Survey Content
Our survey consisted of 2 parts. In the first part, we asked respondents to estimate how many of their patients had been discharged from the hospital in the past 6 months and to reflect on these patients as they completed the survey. Satisfaction with the timeliness and quality of discharge summaries was assessed using a 5‐point Likert scale, from 5, very satisfied, to 1, very unsatisfied. The frequency of hospital follow‐up of a patient occurring prior to arrival of the discharge summary was assessed as the percentage of times this occurred in 20% increments (0%‐19%, 20%‐39%, 40%‐59%, 60%‐79%, and 80%‐100%). The number of discharge summaries missing critical information and the number of summaries containing unnecessary information were similarly assessed using 20% increments. We then asked respondents to estimate the number of patients who had sustained a preventable adverse event related to suboptimal transfer of information at discharge. We defined a preventable adverse event as a preventable medical problem or worsening of an existing problem.
In the second part of the survey, we elicited preferences for discharge summary content and method of delivery. We assessed preferences for discharge summary content by asking respondents to rank items on a scale from 1 to 10, from 10, most important, to 1, least important. Preferences for delivery of discharge summaries were assessed by asking respondents to indicate one or more delivery methods, including facsimile, mail, the electronic medical record, and E‐mail.
Survey Process
The survey was sent out in March 2005. A postcard reminder was sent out approximately 2 weeks after the initial survey was mailed. A second survey was sent to nonresponders 6 weeks after the initial survey. Simultaneously, the survey was also sent in Web‐based format to nonresponders via email.
Data Analysis
Physician characteristics, including practice type, faculty appointment type, and year of medical school graduation, were provided by the hospital's medical staff office. Physician respondents and nonrespondents were compared using the chi‐square test and logistic regression to determine potential response biases. We calculated means and standard deviations and percentages for categorical variables. Logistic regression was used to examine the likelihood of participants reporting any preventable adverse event related to suboptimal transfer of information. The regression model tested the likelihood of one or more preventable adverse events reported with the frequency of seeing patients for follow‐up prior to the arrival of discharge summaries, controlling for participant characteristics and the number of hospitalized patients each physician had in the previous 6 months.
RESULTS
Physician Characteristics
The survey was sent to 425 physicians, 9 of whom were excluded because they had had no patients admitted within the past 6 months. Of the 416 eligible respondents, 2 returned a survey that was incomplete and not usable, and 226 returned a completed survey (response rate of 54%). The characteristics of responders and nonresponders are shown in Table 1. General medicine physicians completed the survey more often than specialist physicians (56% vs. 44%, P .001). Affiliated faculty were also more likely to complete the survey than full‐time faculty; multivariate logistic regression revealed this was purely a function of the larger number of specialists among the full‐time faculty.
| Responders (N = 226) | Nonresponders (N = 188) | P value | |
|---|---|---|---|
| |||
| Practice type | |||
| Generalist, N (%) | 127 (56.2) | 65 (34.6) | .001 |
| Specialist, N (%) | 99 (43.8) | 123 (65.4) | |
| Faculty appointment | |||
| Full‐time, N (%) | 104 (46.0 | 106 (56.4) | .04 |
| Affiliated, N (%) | 122 (54.0) | 82 (43.6) | |
| Year of medical school graduation | |||
| Before 1990, N (%) | 131 (58.0) | 127 (67.6) | .04 |
| 1990 or later, N (%) | 95 (42.0) | 61 (32.4) | |
| Number of patients hospitalized in last 6 monthsa | |||
| 1‐4, N (%) | 15 (7.9) | ||
| 5‐10, N (%) | 62 (32.5) | ||
| 11‐19, N (%) | 35 (18.3) | ||
| 20 or more, N (%) | 79 (41.4) | ||
Timeliness and Content
Only 19% of the participants were satisfied or very satisfied with the timeliness of discharge summaries. Among all participants, 33% indicated that 60% or more of their patients were seen for their follow‐up outpatient visit prior to the arrival of the discharge summary, and 22% indicated that for 60% or more of their patients they never received a discharge summary at all.
Only 32% of the participants were satisfied or very satisfied with the quality of discharge summaries. Among all participants, 17% believed that 60% or more of discharge summaries missed critical information. Unnecessary information in the discharge summary was less problematic; only 9% of participants indicated that 60% or more of discharge summaries contained unnecessary information.
Preventable Adverse Events
Overall, 41% of participants believed that in the previous 6 months at least one of their patients had sustained a preventable adverse event related to poor transfer of information at hospital discharge. Reporting one or more preventable adverse events was positively associated with physicians' reports of how often they saw patients for a first postdischarge follow‐up without having a discharge summary available. After adjusting for participant characteristics and the number of patients hospitalized by each physician, logistic regression results indicated that each 20% increase in the frequency of discharge summaries not arriving prior to patient follow‐up appointments was associated with a 28% increase in the odds of a reported preventable adverse event (adjusted OR = 1.28, P = .04).
Preferences for Content and Delivery
The mean rating for importance of discharge summary elements is shown in Table 2. No discharge summary element had a mean rating of less than 5. Participants preferred discharge summaries be delivered via the following methods: facsimile, 48%; mail, 30%; electronic medical record, 41%; and E‐mail, 30%.
| Mean rating (scale of 1‐10) | |
|---|---|
| Medications at discharge | 9.69 |
| Follow‐up issues | 9.09 |
| Discharge diagnosis | 9.02 |
| List of procedures performed | 8.79 |
| Pathology reports | 8.78 |
| Pending test results | 8.68 |
| Procedure reports | 8.16 |
| Stress test reports | 8.07 |
| Dates of admission and discharge | 8.01 |
| Problem list | 7.99 |
| List of radiology tests performed | 7.84 |
| Echocardiogram reports | 7.79 |
| Follow‐up appointments | 7.79 |
| Radiology reports | 7.76 |
| Names of consulting attendings | 7.64 |
| Name of inpatient attending | 7.28 |
| Labs from last hospital day | 7.08 |
| Medications at admission | 6.91 |
| Allergies | 6.56 |
| All lab results | 6.22 |
| Code status | 6.09 |
| Names of inpatient house officers | 5.64 |
DISCUSSION
Our study found that outpatient physicians were not satisfied with the timeliness or the quality of current discharge summaries. Our findings are in agreement with previous studies demonstrating that discharge summaries were often not available to outpatient physicians3,4 and were often of poor quality.5, 6
Preventable or ameliorable adverse events have been reported to occur in 12% of patients in the period immediately following hospital discharge.1, 2 No studies have evaluated the relationship between discharge summaries and preventable adverse events following discharge. Our study found that 41% of outpatient physicians believed that at least one of their patients in the 6 months prior to the survey had sustained a preventable adverse event related to the suboptimal transfer of information at hospital discharge. In addition, the likelihood of physicians reporting one or more preventable adverse events increased with the frequency of seeing patients for follow‐up prior to discharge summary arrival.
In preparation for revising the discharge summary, we asked outpatient physicians to rate the importance of discharge summary content and their preference for method of delivery of discharge summaries. As in previous studies, the outpatient physicians rated discharge medications, discharge diagnosis, test results, and follow‐up plans as highly important.7, 8 Much of this clinical data is now available in the electronic medical record. Therefore, it is possible to electronically assemble much, if not all, of discharge summary content. One recent study demonstrated that database‐generated discharge summaries significantly increased the likelihood that a discharge summary was generated within 4 weeks of hospital discharge.9 The database used in that study required manual data input from a handwritten form. To our knowledge, no study has reported the experience of discharge summaries generated from an electronic medical record.
Our study had several limitations. First, our study used physician survey to assess the timeliness of receiving discharge summaries. Measuring the time to actual receipt of discharge summaries by physicians was beyond the scope of our study. Second, our study did not measure adverse events directly. Instead, we asked outpatient physicians to estimate how many of their patients discharged in the last 6 months had sustained a preventable adverse event related to suboptimal information transfer at discharge. We had limited space in the questionnaire to define the meaning of a preventable adverse event; therefore, the description in the survey does not exactly match previous definitions.1, 2 Our study had a response rate of 54%. It is possible that nonresponders may have been more satisfied with the quality and timeliness of discharge summaries and may have believed fewer patients experienced preventable adverse events related to suboptimal information transfer at discharge.
The results of our study suggest that the use of systems to improve the quality and delivery of discharge summaries has the potential to improve outpatient physician satisfaction and to reduce the number of preventable adverse events that occur during the vulnerable period following hospital discharge. With the use of electronic medical records, we now have the potential to automate the process of assembling and delivering clinical information with minimal delay. We are now using the information from this study to design a partially automated, high‐quality discharge summary that can be delivered to outpatient physicians immediately on discharge.
- ,,, et al.Adverse events among medical patient after hospital discharge.CMAJ.2004;170:345–349.
- ,,,,.The incidence and severity of adverse events affecting patients after discharge from the hospital.Ann Intern Med.2003;138:161–167.
- ,,.Dissemination of discharge summaries. Not reaching follow‐up physicians.Can Fam Physician.2002;48:737–742.
- ,,,.Effect of discharge summary availability during post‐discharge visits on hospital readmission.J Gen Intern Med.2002;17:186–192.
- ,,,.General practitioner‐hospital communications: a review of discharge summaries.J Qual Clin Pract.2001;21:104–108.
- ,,,,.Quality assessment of discharge letters in a French university hospital.Int J Health Care Qual Assur.1998;11:90–95.
- ,,.Content of a discharge summary from a medical ward: views of general practitioners and hospital doctors.J R Coll Physicians Lond.1995;29:307–310.
- ,.What is necessary for high‐quality discharge summaries?Am J Med Qual.1999;14:160–169.
- ,,,.Dictated versus database‐generated discharge summaries: a randomized clinical trial.CMAJ.1999;160:319–326.
- ,,, et al.Adverse events among medical patient after hospital discharge.CMAJ.2004;170:345–349.
- ,,,,.The incidence and severity of adverse events affecting patients after discharge from the hospital.Ann Intern Med.2003;138:161–167.
- ,,.Dissemination of discharge summaries. Not reaching follow‐up physicians.Can Fam Physician.2002;48:737–742.
- ,,,.Effect of discharge summary availability during post‐discharge visits on hospital readmission.J Gen Intern Med.2002;17:186–192.
- ,,,.General practitioner‐hospital communications: a review of discharge summaries.J Qual Clin Pract.2001;21:104–108.
- ,,,,.Quality assessment of discharge letters in a French university hospital.Int J Health Care Qual Assur.1998;11:90–95.
- ,,.Content of a discharge summary from a medical ward: views of general practitioners and hospital doctors.J R Coll Physicians Lond.1995;29:307–310.
- ,.What is necessary for high‐quality discharge summaries?Am J Med Qual.1999;14:160–169.
- ,,,.Dictated versus database‐generated discharge summaries: a randomized clinical trial.CMAJ.1999;160:319–326.
Handoffs
On my first day as a nervous, third‐year medical student, a nurse offered to orient me to the pediatric ICU. I expected a litany of facts to memorize. Instead, she pointed at each room in turn and described the tragedies they had hosted.
Room 1: a little girl just died of meningitis there. Room 2: that boy's liver transplant failed, and he had a massive stroke. The father sat holding the jaundiced hand of his unresponsive son, whose stapled abdomen held back tense ascites. His wife died of cancer 2 months ago. Now he has no one. Room 3: teen with cystic fibrosis; she'll be OK. Room 4 I will never forget. A teenager died of leukemia there and refused all painkillers. He wanted to be lucid for his family, and they huddled on his bed and sang Amazing Grace until he died. Most beautiful thing I have seen.
I had thought, Beautiful? How can you even come to work?
Five years later, I remembered that conversation as if it had just happened. I was the senior resident in the medical ICU, it was 3 AM, and I was gathering my thoughts amid the whooshes, beeps, and flickering monitors of the sleeping unit. I was preparing to go tell Betsy that Joe, her 31‐year‐old husband, needed prone ventilation. Joe lay dying from, of all things, chickenpox. He was receiving 12 infusions, including 4 pressors, sedatives, antibiotics, acyclovir, full‐strength bicarbonate, his 26th amp of calcium, and liter number‐who‐knows‐what of saline. He sprouted 2 IVs, 2 central lines, a Foley catheter, endotracheal and orogastric tubes, an arterial line, and an array of monitor leads. His blood pressure would plummetfrom a systolic of 80whenever we interrupted his bicarb drip to spike a new bag, so we knew moving him might kill him. Every nurse raced to finish tasks on other patients, preparing to help.
Joe's admission began, like several of his earlier ones, with a chief complaint of Crohn's flare. This time, however, he had a new rash, and although John's ward team suspected medications were to blame, they soon started him on acyclovir. In days, hepatitis, acute renal failure, and pneumonia prompted his ICU transfer. He required intubation hours later. His course since had been like watching a pedestrian struck by a truck in slow motion: a sudden, jolting, irreversible crueltydrawn out over hours. Anasarca had folded his blistering ears in half and forced us to revise his endotracheal tube taping 3 times so it would not incise his cheeks. He had unremitting hypotension. His transaminases climbed above 6000 and his creatinine to 6; his arterial pH dropped to 7.03, and his platelets fell to 16,000. His partial pressure of oxygen sank below 60 mm Hg despite paralysis, every conceivable ventilator adjustment, and 100% oxygen. Crossing that terrible threshold felt like drifting below hull‐crush depth in a submarine. I waited for the walls and windows of the ICU to groan with the strain as disaster neared.
My intern followed me to the waiting room where Betsy slept. She hadn't left the hospital in days. I knelt beside her cot and woke her, and she supported her pregnant abdomen with her hand as she rolled to face me. We smiled. Then she remembered where she was.
Is something wrong? she asked.
No, he's about the same. But the other things we tried didn't help. We need to do what I mentioned beforeturn him over so he can use his lungs better. She nodded. We're very careful, but he has so many IV lines right now. If he loses one, he could get much worse. So I wanted to make sure you spent some time with him now, just in case.
Her eyes teared. He could die?
Just a small chance. But possible.
And if it works, he might get better?
I paused. He's very sick.
There are other things you can do?
We have to really hope this works.
This isn't supposed to happen. I don't know if I can raise 2 children without Joe. I can't be a widow at 29. I sensed I could have talked hersleep deprived and stunnedback into sleep, into a conviction her nightmare would pass by morning. Instead I squeezed her hand and listened.
We need to do this, OK? You'll have 10 minutes to talk. Remember how his blood pressure rose when they cleaned him? He's still in there. I believe he can hear you. So you tell him to keep fighting.
Betsy wiped her eyes and searched for her shoes. As we walked briskly back to the unit, I composed myself and told my intern, I'll be 29 in 3 weeks.
Me too. What day?
May 28th.
Same as mine, he said.
It took 25 minutes to prone Joe with every nurse assisting, but the maneuver went well. His oxygenation improved, but his relentless decline resumed within hours. The following afternoon, Betsy held Joe's hand and told him it was OK for him to go, and that she would look after their children. Joe's blood pressure eventually dwindled to nothing, leaving only sinus tachycardia on the monitor and the rhythmic puffs of the ventilator. Then, within 2 weeks, the resident team managed a series of unexpected tragedies: we lost young mothers to acetaminophen overdose and lung cancer, and cared for 2 young adults with septic shock and a perimenopausal woman for whom the cost of pneumonia was her first and probably only pregnancy.
Five years before, when I first stepped into an ICU, I imagined the residents held a dozen lives in their hands and faced critical illness at all hoursalone. By the time Joe died of disseminated varicella, I realized the truth was far from that vision. Joe's nurse had worked in the ICU as long as I'd been alive, and expert respiratory therapists guided his mechanical ventilation. I had coresidents and consultantseven a rabbi when I guided a family meeting on declaring CPR not indicated. Our institution's overnight attending assisted me throughout the night, and the primary attending drove in at 2 AM to supervise nitric oxide therapy. At no point did I ever care for Joe alone.
Instead, the challenge lay in facing the winning smiles of our patient Joe and his 10 month‐old son Jacob waving from a recent photo taped by the head of his bed and a young wife refusing to leave her increasingly unrecognizable husband as his body failed, despite her conspicuous 7‐month pregnancy. And it lay in the surprising futility of all our interventions. Perhaps most of all, the challenge was in the persistence of the sights and sounds and smells of that night and many others. I've seen the expression a pathologist makes on learning his daughter has anaplastic thyroid cancer. I've heard the sound a daughter makes when her mother has a ventricular free‐wall rupture while welcoming us into her room. I've smelled a teenager who had burned to the bone while conscious yet pinned in his car. I've felt the crackle of subcutaneous emphysema after chest tubes for malignant pleural effusions that was so severe the patient could not open his eyes or close his hands. And the papery skin and tremulous handshake of a man after my news of his wife's prognosis promised their 64th year of marriage would be the last.
Far from alone, I spend much of my time in the company of these ghosts, as must many health care workers. How we make our peace with them is up to us. With tears? Humor? Alcohol? Sometimes it is by numb indifference; you might wonder from most of the businesslike discussions physicians hold if these ghosts even existed. Or, we can make our peace with words. I am grateful for a chance to speak with Betsy some days after Joe died to assure her that although we did ask Joe to fight, in the end no effort could have saved him. I am grateful she later wrote us to celebrate the healthy birth of their second son, Joshua. She assured me Joe would live on for her in their sons and live on for them through her memories. Her strength helped me welcome Joe's ghost, and many others, into my life.
After 5 years of clinical medicine, I finally understood the lesson I received from the pediatric ICU nurse. Our ghost stories help us grieve, and they celebrate healing, or if there was no healing, then release. At the very least, great tragedy reminds us of the great meaning of our calling.
On my first day as a nervous, third‐year medical student, a nurse offered to orient me to the pediatric ICU. I expected a litany of facts to memorize. Instead, she pointed at each room in turn and described the tragedies they had hosted.
Room 1: a little girl just died of meningitis there. Room 2: that boy's liver transplant failed, and he had a massive stroke. The father sat holding the jaundiced hand of his unresponsive son, whose stapled abdomen held back tense ascites. His wife died of cancer 2 months ago. Now he has no one. Room 3: teen with cystic fibrosis; she'll be OK. Room 4 I will never forget. A teenager died of leukemia there and refused all painkillers. He wanted to be lucid for his family, and they huddled on his bed and sang Amazing Grace until he died. Most beautiful thing I have seen.
I had thought, Beautiful? How can you even come to work?
Five years later, I remembered that conversation as if it had just happened. I was the senior resident in the medical ICU, it was 3 AM, and I was gathering my thoughts amid the whooshes, beeps, and flickering monitors of the sleeping unit. I was preparing to go tell Betsy that Joe, her 31‐year‐old husband, needed prone ventilation. Joe lay dying from, of all things, chickenpox. He was receiving 12 infusions, including 4 pressors, sedatives, antibiotics, acyclovir, full‐strength bicarbonate, his 26th amp of calcium, and liter number‐who‐knows‐what of saline. He sprouted 2 IVs, 2 central lines, a Foley catheter, endotracheal and orogastric tubes, an arterial line, and an array of monitor leads. His blood pressure would plummetfrom a systolic of 80whenever we interrupted his bicarb drip to spike a new bag, so we knew moving him might kill him. Every nurse raced to finish tasks on other patients, preparing to help.
Joe's admission began, like several of his earlier ones, with a chief complaint of Crohn's flare. This time, however, he had a new rash, and although John's ward team suspected medications were to blame, they soon started him on acyclovir. In days, hepatitis, acute renal failure, and pneumonia prompted his ICU transfer. He required intubation hours later. His course since had been like watching a pedestrian struck by a truck in slow motion: a sudden, jolting, irreversible crueltydrawn out over hours. Anasarca had folded his blistering ears in half and forced us to revise his endotracheal tube taping 3 times so it would not incise his cheeks. He had unremitting hypotension. His transaminases climbed above 6000 and his creatinine to 6; his arterial pH dropped to 7.03, and his platelets fell to 16,000. His partial pressure of oxygen sank below 60 mm Hg despite paralysis, every conceivable ventilator adjustment, and 100% oxygen. Crossing that terrible threshold felt like drifting below hull‐crush depth in a submarine. I waited for the walls and windows of the ICU to groan with the strain as disaster neared.
My intern followed me to the waiting room where Betsy slept. She hadn't left the hospital in days. I knelt beside her cot and woke her, and she supported her pregnant abdomen with her hand as she rolled to face me. We smiled. Then she remembered where she was.
Is something wrong? she asked.
No, he's about the same. But the other things we tried didn't help. We need to do what I mentioned beforeturn him over so he can use his lungs better. She nodded. We're very careful, but he has so many IV lines right now. If he loses one, he could get much worse. So I wanted to make sure you spent some time with him now, just in case.
Her eyes teared. He could die?
Just a small chance. But possible.
And if it works, he might get better?
I paused. He's very sick.
There are other things you can do?
We have to really hope this works.
This isn't supposed to happen. I don't know if I can raise 2 children without Joe. I can't be a widow at 29. I sensed I could have talked hersleep deprived and stunnedback into sleep, into a conviction her nightmare would pass by morning. Instead I squeezed her hand and listened.
We need to do this, OK? You'll have 10 minutes to talk. Remember how his blood pressure rose when they cleaned him? He's still in there. I believe he can hear you. So you tell him to keep fighting.
Betsy wiped her eyes and searched for her shoes. As we walked briskly back to the unit, I composed myself and told my intern, I'll be 29 in 3 weeks.
Me too. What day?
May 28th.
Same as mine, he said.
It took 25 minutes to prone Joe with every nurse assisting, but the maneuver went well. His oxygenation improved, but his relentless decline resumed within hours. The following afternoon, Betsy held Joe's hand and told him it was OK for him to go, and that she would look after their children. Joe's blood pressure eventually dwindled to nothing, leaving only sinus tachycardia on the monitor and the rhythmic puffs of the ventilator. Then, within 2 weeks, the resident team managed a series of unexpected tragedies: we lost young mothers to acetaminophen overdose and lung cancer, and cared for 2 young adults with septic shock and a perimenopausal woman for whom the cost of pneumonia was her first and probably only pregnancy.
Five years before, when I first stepped into an ICU, I imagined the residents held a dozen lives in their hands and faced critical illness at all hoursalone. By the time Joe died of disseminated varicella, I realized the truth was far from that vision. Joe's nurse had worked in the ICU as long as I'd been alive, and expert respiratory therapists guided his mechanical ventilation. I had coresidents and consultantseven a rabbi when I guided a family meeting on declaring CPR not indicated. Our institution's overnight attending assisted me throughout the night, and the primary attending drove in at 2 AM to supervise nitric oxide therapy. At no point did I ever care for Joe alone.
Instead, the challenge lay in facing the winning smiles of our patient Joe and his 10 month‐old son Jacob waving from a recent photo taped by the head of his bed and a young wife refusing to leave her increasingly unrecognizable husband as his body failed, despite her conspicuous 7‐month pregnancy. And it lay in the surprising futility of all our interventions. Perhaps most of all, the challenge was in the persistence of the sights and sounds and smells of that night and many others. I've seen the expression a pathologist makes on learning his daughter has anaplastic thyroid cancer. I've heard the sound a daughter makes when her mother has a ventricular free‐wall rupture while welcoming us into her room. I've smelled a teenager who had burned to the bone while conscious yet pinned in his car. I've felt the crackle of subcutaneous emphysema after chest tubes for malignant pleural effusions that was so severe the patient could not open his eyes or close his hands. And the papery skin and tremulous handshake of a man after my news of his wife's prognosis promised their 64th year of marriage would be the last.
Far from alone, I spend much of my time in the company of these ghosts, as must many health care workers. How we make our peace with them is up to us. With tears? Humor? Alcohol? Sometimes it is by numb indifference; you might wonder from most of the businesslike discussions physicians hold if these ghosts even existed. Or, we can make our peace with words. I am grateful for a chance to speak with Betsy some days after Joe died to assure her that although we did ask Joe to fight, in the end no effort could have saved him. I am grateful she later wrote us to celebrate the healthy birth of their second son, Joshua. She assured me Joe would live on for her in their sons and live on for them through her memories. Her strength helped me welcome Joe's ghost, and many others, into my life.
After 5 years of clinical medicine, I finally understood the lesson I received from the pediatric ICU nurse. Our ghost stories help us grieve, and they celebrate healing, or if there was no healing, then release. At the very least, great tragedy reminds us of the great meaning of our calling.
On my first day as a nervous, third‐year medical student, a nurse offered to orient me to the pediatric ICU. I expected a litany of facts to memorize. Instead, she pointed at each room in turn and described the tragedies they had hosted.
Room 1: a little girl just died of meningitis there. Room 2: that boy's liver transplant failed, and he had a massive stroke. The father sat holding the jaundiced hand of his unresponsive son, whose stapled abdomen held back tense ascites. His wife died of cancer 2 months ago. Now he has no one. Room 3: teen with cystic fibrosis; she'll be OK. Room 4 I will never forget. A teenager died of leukemia there and refused all painkillers. He wanted to be lucid for his family, and they huddled on his bed and sang Amazing Grace until he died. Most beautiful thing I have seen.
I had thought, Beautiful? How can you even come to work?
Five years later, I remembered that conversation as if it had just happened. I was the senior resident in the medical ICU, it was 3 AM, and I was gathering my thoughts amid the whooshes, beeps, and flickering monitors of the sleeping unit. I was preparing to go tell Betsy that Joe, her 31‐year‐old husband, needed prone ventilation. Joe lay dying from, of all things, chickenpox. He was receiving 12 infusions, including 4 pressors, sedatives, antibiotics, acyclovir, full‐strength bicarbonate, his 26th amp of calcium, and liter number‐who‐knows‐what of saline. He sprouted 2 IVs, 2 central lines, a Foley catheter, endotracheal and orogastric tubes, an arterial line, and an array of monitor leads. His blood pressure would plummetfrom a systolic of 80whenever we interrupted his bicarb drip to spike a new bag, so we knew moving him might kill him. Every nurse raced to finish tasks on other patients, preparing to help.
Joe's admission began, like several of his earlier ones, with a chief complaint of Crohn's flare. This time, however, he had a new rash, and although John's ward team suspected medications were to blame, they soon started him on acyclovir. In days, hepatitis, acute renal failure, and pneumonia prompted his ICU transfer. He required intubation hours later. His course since had been like watching a pedestrian struck by a truck in slow motion: a sudden, jolting, irreversible crueltydrawn out over hours. Anasarca had folded his blistering ears in half and forced us to revise his endotracheal tube taping 3 times so it would not incise his cheeks. He had unremitting hypotension. His transaminases climbed above 6000 and his creatinine to 6; his arterial pH dropped to 7.03, and his platelets fell to 16,000. His partial pressure of oxygen sank below 60 mm Hg despite paralysis, every conceivable ventilator adjustment, and 100% oxygen. Crossing that terrible threshold felt like drifting below hull‐crush depth in a submarine. I waited for the walls and windows of the ICU to groan with the strain as disaster neared.
My intern followed me to the waiting room where Betsy slept. She hadn't left the hospital in days. I knelt beside her cot and woke her, and she supported her pregnant abdomen with her hand as she rolled to face me. We smiled. Then she remembered where she was.
Is something wrong? she asked.
No, he's about the same. But the other things we tried didn't help. We need to do what I mentioned beforeturn him over so he can use his lungs better. She nodded. We're very careful, but he has so many IV lines right now. If he loses one, he could get much worse. So I wanted to make sure you spent some time with him now, just in case.
Her eyes teared. He could die?
Just a small chance. But possible.
And if it works, he might get better?
I paused. He's very sick.
There are other things you can do?
We have to really hope this works.
This isn't supposed to happen. I don't know if I can raise 2 children without Joe. I can't be a widow at 29. I sensed I could have talked hersleep deprived and stunnedback into sleep, into a conviction her nightmare would pass by morning. Instead I squeezed her hand and listened.
We need to do this, OK? You'll have 10 minutes to talk. Remember how his blood pressure rose when they cleaned him? He's still in there. I believe he can hear you. So you tell him to keep fighting.
Betsy wiped her eyes and searched for her shoes. As we walked briskly back to the unit, I composed myself and told my intern, I'll be 29 in 3 weeks.
Me too. What day?
May 28th.
Same as mine, he said.
It took 25 minutes to prone Joe with every nurse assisting, but the maneuver went well. His oxygenation improved, but his relentless decline resumed within hours. The following afternoon, Betsy held Joe's hand and told him it was OK for him to go, and that she would look after their children. Joe's blood pressure eventually dwindled to nothing, leaving only sinus tachycardia on the monitor and the rhythmic puffs of the ventilator. Then, within 2 weeks, the resident team managed a series of unexpected tragedies: we lost young mothers to acetaminophen overdose and lung cancer, and cared for 2 young adults with septic shock and a perimenopausal woman for whom the cost of pneumonia was her first and probably only pregnancy.
Five years before, when I first stepped into an ICU, I imagined the residents held a dozen lives in their hands and faced critical illness at all hoursalone. By the time Joe died of disseminated varicella, I realized the truth was far from that vision. Joe's nurse had worked in the ICU as long as I'd been alive, and expert respiratory therapists guided his mechanical ventilation. I had coresidents and consultantseven a rabbi when I guided a family meeting on declaring CPR not indicated. Our institution's overnight attending assisted me throughout the night, and the primary attending drove in at 2 AM to supervise nitric oxide therapy. At no point did I ever care for Joe alone.
Instead, the challenge lay in facing the winning smiles of our patient Joe and his 10 month‐old son Jacob waving from a recent photo taped by the head of his bed and a young wife refusing to leave her increasingly unrecognizable husband as his body failed, despite her conspicuous 7‐month pregnancy. And it lay in the surprising futility of all our interventions. Perhaps most of all, the challenge was in the persistence of the sights and sounds and smells of that night and many others. I've seen the expression a pathologist makes on learning his daughter has anaplastic thyroid cancer. I've heard the sound a daughter makes when her mother has a ventricular free‐wall rupture while welcoming us into her room. I've smelled a teenager who had burned to the bone while conscious yet pinned in his car. I've felt the crackle of subcutaneous emphysema after chest tubes for malignant pleural effusions that was so severe the patient could not open his eyes or close his hands. And the papery skin and tremulous handshake of a man after my news of his wife's prognosis promised their 64th year of marriage would be the last.
Far from alone, I spend much of my time in the company of these ghosts, as must many health care workers. How we make our peace with them is up to us. With tears? Humor? Alcohol? Sometimes it is by numb indifference; you might wonder from most of the businesslike discussions physicians hold if these ghosts even existed. Or, we can make our peace with words. I am grateful for a chance to speak with Betsy some days after Joe died to assure her that although we did ask Joe to fight, in the end no effort could have saved him. I am grateful she later wrote us to celebrate the healthy birth of their second son, Joshua. She assured me Joe would live on for her in their sons and live on for them through her memories. Her strength helped me welcome Joe's ghost, and many others, into my life.
After 5 years of clinical medicine, I finally understood the lesson I received from the pediatric ICU nurse. Our ghost stories help us grieve, and they celebrate healing, or if there was no healing, then release. At the very least, great tragedy reminds us of the great meaning of our calling.
Octreotide Scan for Carcinoids
Bronchopulmonary carcinoids are relatively rare endocrine tumors. They can present with Cushing's syndrome secondary to ectopic adrenocorticotropic hormone (ACTH) secretion. They were first described in 1957, and by 1990, only 72 cases had been reported in the literature worldwide.1 The largest series reported had 7 patients seen over a 16‐year period.2 Curative resection is possible only after adequate localization of the ectopic source. In this article, we describe a case illustrating the role of octreotide scanning in the management of bronchopulmonary carcinoid.
Case
A 23‐year‐old male presented with features of Cushing's syndrome. He had a 2‐year history of abdominal striae associated with progressive fatigue, adiposity, mood swings, a 10‐kg weight gain over 6 months, and recent onset of recurrent stones in his left kidney. His past medical history was significant for delayed puberty and juvenile rheumatoid arthritis. Family history also was remarkable for rheumatoid arthritis. Physical examination of the patient at the time of presentation revealed elevated blood pressure (150‐180 mm Hg systolic and 90‐120 mm Hg diastolic) and classic cushingoid features including moon facies and abdominal and axillary striae.
Blood work performed at this time revealed elevated morning and afternoon cortisol of 841 and 918 nmol/L (30.5 and 33.3 g/dL), respectively. Thyroid‐stimulating hormone was low at 0.17 mU/L (normal 0.35‐5.5 mU/L), and free triiodothyronine (T3) and thyroxine (T4) were normal. ACTH was elevated at 70.21 pmol/L (normal 1.98‐11.6 pmol/L). Cortisol levels failed to suppress in response to our dexamethasone suppression test, as shown by the absence of suppression of urinary and serum cortisol despite administration of 0.5 mg of dexamethasone intramuscularly every 6 hours for 2 days, followed by high‐dose dexamethasone (2.0 mg) every 6 hours for 2 additional days. The chest radiograph was normal. Computed tomography (CT) could not confirm a mass but suggested a possible 1.5‐cm lesion in the superior segment of the right lower lobe of the lung. The liver, spleen, pancreas, kidneys, and adrenals were normal. There was no lymphadenopathy.
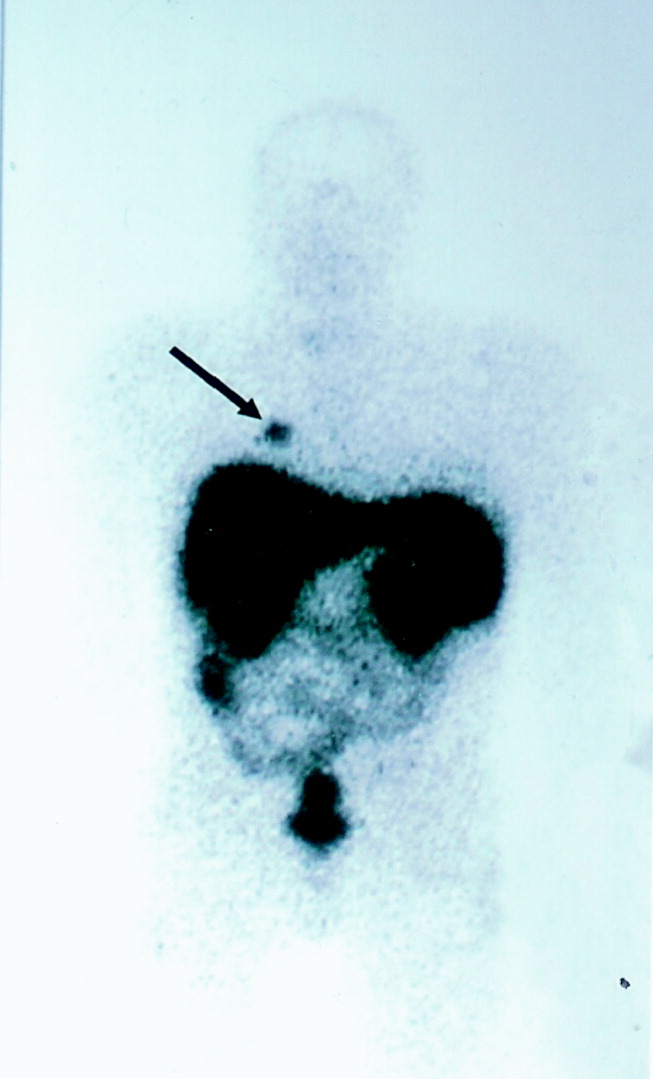
Octreotide scanning was done following intravenous administration of indium 111 Octreotide at a dose of 119 MBq. It showed a solitary focus in the superior segment of the right lower lobe, confirming the neuroendocrine nature of the suspicious lesion initially suspected on CT scan (Fig. 1). No other foci were found. The patient was diagnosed with ectopic adrenocorticotropic hormone (ACTH) secretion secondary to a bronchopulmonary carcinoid in the superior segment of the right lower lobe.
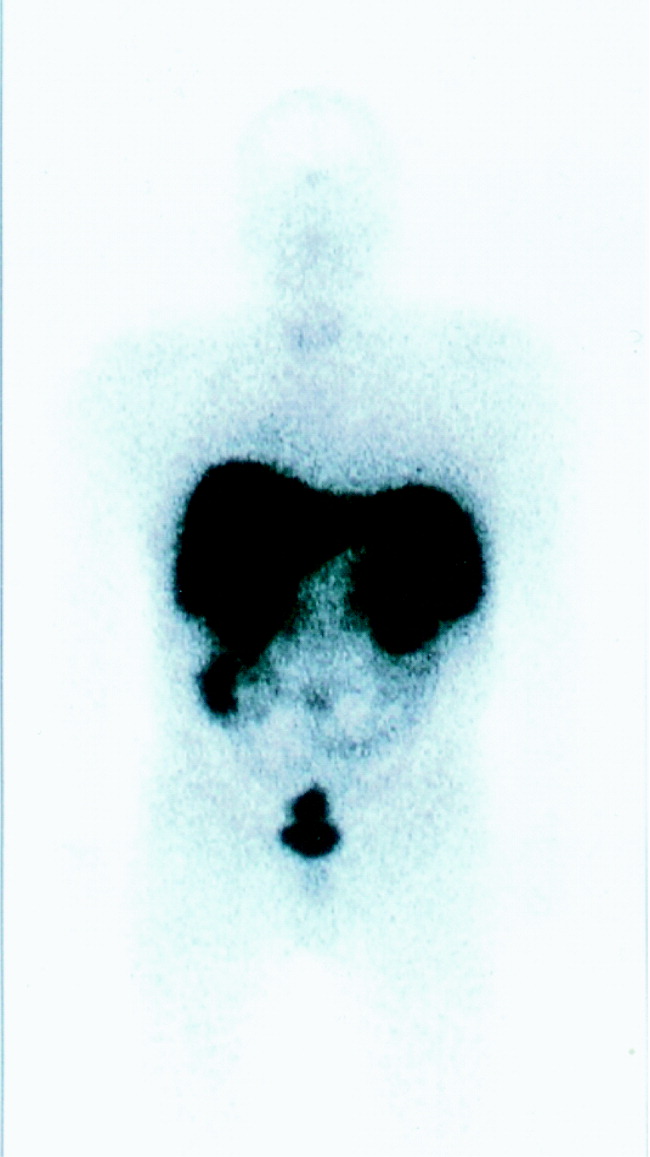
The patient was brought to the operating room for resection. Intraoperative bronchoscopy revealed no evidence of endotracheal lesions. At thoracotomy the mass was difficult to appreciate on palpation. On the basis of what preoperative imaging showed, the patient underwent a right lower lobe superior segmentectomy. Local nodes dissected at the time of the operation were negative for malignancy. To confirm adequate surgical resection, postoperative ACTH levels and octreotide scanning were performed. The ACTH level was 1.21 pmol/L (normal). A second octreotide scan showed no evidence of residual tumor (Fig. 2). The patient's blood pressure normalized, and his cushingoid features had declined by his first follow‐up visit. The final pathology confirmed carcinoid tumor, and the tumor stained with ACTH.
DISCUSSION
Ectopic ACTH secretion is responsible for 10%‐15% of the cases of Cushing's syndrome.3 Sources of the ectopic ACTH include small cell carcinoma of the lung, bronchopulmonary carcinoid, islet cell tumors, medullary carcinoma of the thyroid, and pheochromocytoma. The diagnosis of Cushing's syndrome is established by the nonsuppressibility of the serum and urinary cortisol levels. The etiology may be ACTH dependent (eg, Cushing's disease or ectopic ACTH syndrome) or ACTH independent (eg, adrenal tumor). A pituitary source is usually excluded by lack of cortisol suppression with high‐dose dexamethasone, which supports a diagnosis of ectopic ACTH. The CRH‐stimulation test can also be used to differentiate patients with Cushing's disease from those with ectopic ACTH secretion. Typically, 1 g/kg of intravenous CRH is administered to the patient, which elicits a rise in plasma ACTH or cortisol levels in a patient with Cushing's disease. However, only 5% of patients with ectopic ACTH secretion will demonstrate a plasma response,18, 19 thereby helping these 2 groups of patients. Following this differentiation, the source of ACTH can sometimes be located with traditional investigations including computed tomography of the thorax and abdomen. Finally, some authors have also advocated the use of bilateral petrosal sinus catheterization for diagnosing Cushing's syndrome if this diagnosis remains uncertain. Performed since 1982, this procedure involves the simultaneous sampling of petrosal sinuses and peripheral veins for ACTH levels both prior to and following administration of CRH. A diagnosis of ectopic ACTH secretion is strongly suggested by lack of a gradient between central and peripheral ACTH levels.
Carcinoid tumors account for 5% of lung tumors, and only a minority of these secrete ACTH. Only 1% of cases of Cushing's syndrome are accounted for by bronchial carcinoids,4 and as of 2004, only 100 cases had been reviewed in the literature worldwide.23 Pathologically, carcinoids tumors represent a low‐grade neuroendocrine malignancy arising from enterochromaffin or Kulchitsky cells, which are in the mucosa of the bronchi. There is a single line of derivation between bronchial carcinoid and small cell lung carcinoma, which was first demonstrated by Arrigoni.5
It is known that most carcinoid and other types of neuroendocrine tumors express somatostatin receptors,7, 11 and as such, a number of authors have recently described the ability to localize tumors of this type with radiolabeled somatostatin analogues.7, 1116 The sensitivity of somatostatin‐analogue scanning has been well described in the workup of gastropancreatic neuroendocrine malignancies.3, 17 although some false‐positive results do occur and have been attributed to inflammatory conditions such as sarcoidosis. Some work has been documented with this technique in other neuroendocrine malignancies.11, 14 Specifically, this technique was used by Rodriguez et al.12 to intraoperatively scan a patient's resection bed following primary removal of a bronchial carcinoid. This scan was able to identify residual disease despite gross tumor‐free margins of the primary resection specimen and thus enable complete removal of the disease.
In the past, authors have suggested that somatostatin‐analogue scanning is a useful tool in the localization of ectopic ACTH sources only after traditional modalities like CT have yielded equivocal results.3, 9, 10 Indeed, many studies have demonstrated the usefulness of octreotide scanning in localizing tumors with ectopic ACTH secretion. However, 2 recent studies have raised doubts about the clinical utility of octreotide scanning.20, 21 The study by Torpy et al. reported a significantly high false‐positive rate with octreotide scans. However, they also had false positives with conventional imaging in their series. Perhaps the best synthesis of the literature on the subject comes from Pacak et al., who looked at 17 patients with ectopic ACTH syndrome.22 They demonstrated that low‐dose octreotide scanning (L‐OCT) worked just as well as CT and better than MRI in visualizing ACTH‐secreting tumors. Moreover, they demonstrated that L‐OCT highlighted involvement of lymph nodes that was missed by CT and MRI and identified 2 abdominal lesions missed by conventional imaging. Finally, high‐dose octreotide scanning (H‐OCT) was able to pick up an intrathoracic ACTH‐secreting tumor that was not seen on CT, MRI, or L‐OCT. Although in the article the authors advocated L‐OCT as complimentary to CT and MRI, they did acknowledge that it provided additional diagnostic information, at least in their series. They advocated the use of all 3 modalities in order to provide the most comprehensive information on the location and extent of a tumor.
In this case report, we document the use of pre‐ and postoperative octreotide scanning in a patient whose CT scan was equivocal and for whom adequate surgical excision of an indistinct lesion was questionable. The use of octreotide scanning also permitted a limited resection, allowing preservation of lung parenchyma. Furthermore, it allowed us to avoid petrosal sinus catheterization. We propose that octreotide scanning can be a very important and informative test in the management of carcinoid tumors. In situations when conventional imaging is not conclusive, octreotide scanning may be of help in determining the source of ectopic ACTH syndrome. Certainly, CT scanning, currently the modality of first choice, is presently more practical and cost effective. However, octreotide scanning has been shown to be at least as sensitive in localizing ectopic ACTH‐secreting tumors and often can provide additional diagnostic information that can influence surgical management. Somatostatin‐analogue scanning, if performed initially, can guide a diagnostician about where to perform further imaging, so that limited but complete resections of this rare but curable tumor can be planned. Somatostatin‐analogue scanning also may have a role intraoperatively in ensuring complete resection despite pathologically clear tumor margins of the primary specimen, as well as an effective modality in following patients after their primary surgery for disease recurrence. These points all support the idea that octreotide scanning should play a vital and perhaps more central role in the diagnostic workup for ectopic ACTH‐secreting tumors.
CONCLUSIONS
Accurate localization of an ectopic source of ACTH in Cushing's syndrome is important for surgical cure. Octreotide scanning has been shown to be an excellent modality for both the diagnosis and the follow‐up of neuroendocrine tumors. Although computed tomography scanning of the chest and abdomen is currently used as the initial adjuncts in an attempt to localize such tumors, in the case we have presented, in which the initial CT scan was equivocal, subsequent octreotide scanning provided excellent localization of the ectopic ACTH source. We also believe that postoperative surveillance with octreotide scanning offers an excellent means of detecting residual or metastatic tumor. Indeed, somatostatin‐analogue scanning is a very useful modality for the detection, perioperative planning, and postoperative follow‐up of ectopic ACTH‐secreting tumors and neuroendocrine tumors in general and should be considered in surgical workups of such malignancies.
- ,,, et al.Management of the ectopic ACTH syndrome due to thoracic carcinoids.Ann Thorac Surg.1990;50(1):52–57.
- ,,,,,.Bronchopulmonary cacinoid tumors associated with Cushing's syndrome: a more aggressive variant of the typical carcinoid.J Thorac Cardiovasc Surg.1997;114:367–375.
- ,,,,.Ectopic ACTH secretion due to a bronchopulmonary carcinoid localized by somatostatin receptor scintigraphy.Clin Investig.1994;72:887–891.
- .Diagnostic evaluation of Cushing's syndrome.Endocrinol Metab Clin North Am.1988;17:445–472.
- ,,.Atypical carcinoid tumors of the lung.J Thorac Cardiovasc Surg.1972;64:413–421.
- ,,, et al.Somatostatin receptor scintigraphy. In:Freeman LM, ed.Nuclear Medicine Annual 1995.New York:Raven Press,1995:1–21.
- ,,.The role of somatostatin and its analogues in the diagnosis and treatment of tumors.Endocr Rev.1991;12:450–482.
- ,,.Somatostatin analogue treatment of neuroendocrine tumours.Postgrad Med J.1996;72:403–408.
- ,,, et al.Bronchial carcinoid associated with Cushing's syndrome.J Cardiovasc Surg (Torino).1995;36:511–514.
- ,,, et al.Somatostatin analogs for the localization and preoperative treatment of an adrenocorticotropin‐secreting bronchial carcinoid tumor.J Clin Endocrinol Metab.1994;78(1):20–24.
- ,,, et al.In vitro detection of somatostatin receptors in human tumors.Digestion.1993;54(suppl.):68–71.
- ,,, et al.Intraoperative detection of a bronchial carcinoid with a radiolabeled somatostatin analog.Chest.2002;121:985–988.
- ,,, et al.Localization of endocrine‐related tumours with a radioiodinated analogue of somatostatin.Lancet.1989;1:242–244.
- ,,, et al.Somatostatin receptor scintigraphy with [111In‐DTPA‐D‐Phe1]‐octreotide and [123I‐Tyr3]‐octreotide: the Rotterdam experience with more that 1,000 patients.Eur J Nucl Med.1993;20:716–731.
- ,,, et al.Comparison of somatostatin analog and meta‐iodobenzylguanidine radionuclides in the diagnosis and localization of advanced neuroendocrine tumors.J Clin Endocr Metab.2001;86:895–902.
- .MIBG and radiolabeled octreotide in neuroendocrine tumors.Q J Nucl Med.1995;39(suppl 1‐4):137–139.
- ,,, et al.Recent advances in radiological and radionuclide imaging and therapy of neuroendocrine tumours.Eur J Endocrinol2004;151:15–27.
- ,,, et al.Cushing's syndrome in children and adolescents. Presentation, diagnosis, and therapy.N Engl J Med.1994;331:629–636.
- ,,, et al.A simplified morning ovine corticotropin‐releasing hormone stimulation test for the differential diagnosis of adrenocorticotropin‐dependent Cushing's syndrome.J Clin Endocrinol Metab.1993;77:1308–1312.
- ,,, et al.Lack of utility of 111In‐pentreotide scintigraphy in localizing ectopic ACTH producing tumors: follow‐up of 18 patients.J Clin Endocrinol Metab.1999;84:1186–1192.
- ,,, et al.Usefulness of somatostatin receptor scintigraphy in patients with occult ectopic adrenocorticotropin syndrome.J Clin Endocrinol Metab.1999;84:1193–1202.
- ,,,,,.The role of [18F]fluorodeoxyglucose positron emission tomography and [111In]‐diethylenetriaminepentaacetate‐D‐Phe‐pentetreotide scintigraphy in the localization of ectopic adrenocorticotropin‐secreting tumors causing Cushing's syndrome.J Clin Endocrin Metab.2004;89:2214–2221.
- ,,, et al.Cushing's syndrome induced by bronchopulmonary carcinoid tumours: a review of 98 cases and our experience of two cases.Chir Ita.2004;56(1):63–70.
Bronchopulmonary carcinoids are relatively rare endocrine tumors. They can present with Cushing's syndrome secondary to ectopic adrenocorticotropic hormone (ACTH) secretion. They were first described in 1957, and by 1990, only 72 cases had been reported in the literature worldwide.1 The largest series reported had 7 patients seen over a 16‐year period.2 Curative resection is possible only after adequate localization of the ectopic source. In this article, we describe a case illustrating the role of octreotide scanning in the management of bronchopulmonary carcinoid.
Case
A 23‐year‐old male presented with features of Cushing's syndrome. He had a 2‐year history of abdominal striae associated with progressive fatigue, adiposity, mood swings, a 10‐kg weight gain over 6 months, and recent onset of recurrent stones in his left kidney. His past medical history was significant for delayed puberty and juvenile rheumatoid arthritis. Family history also was remarkable for rheumatoid arthritis. Physical examination of the patient at the time of presentation revealed elevated blood pressure (150‐180 mm Hg systolic and 90‐120 mm Hg diastolic) and classic cushingoid features including moon facies and abdominal and axillary striae.
Blood work performed at this time revealed elevated morning and afternoon cortisol of 841 and 918 nmol/L (30.5 and 33.3 g/dL), respectively. Thyroid‐stimulating hormone was low at 0.17 mU/L (normal 0.35‐5.5 mU/L), and free triiodothyronine (T3) and thyroxine (T4) were normal. ACTH was elevated at 70.21 pmol/L (normal 1.98‐11.6 pmol/L). Cortisol levels failed to suppress in response to our dexamethasone suppression test, as shown by the absence of suppression of urinary and serum cortisol despite administration of 0.5 mg of dexamethasone intramuscularly every 6 hours for 2 days, followed by high‐dose dexamethasone (2.0 mg) every 6 hours for 2 additional days. The chest radiograph was normal. Computed tomography (CT) could not confirm a mass but suggested a possible 1.5‐cm lesion in the superior segment of the right lower lobe of the lung. The liver, spleen, pancreas, kidneys, and adrenals were normal. There was no lymphadenopathy.
Octreotide scanning was done following intravenous administration of indium 111 Octreotide at a dose of 119 MBq. It showed a solitary focus in the superior segment of the right lower lobe, confirming the neuroendocrine nature of the suspicious lesion initially suspected on CT scan (Fig. 1). No other foci were found. The patient was diagnosed with ectopic adrenocorticotropic hormone (ACTH) secretion secondary to a bronchopulmonary carcinoid in the superior segment of the right lower lobe.
The patient was brought to the operating room for resection. Intraoperative bronchoscopy revealed no evidence of endotracheal lesions. At thoracotomy the mass was difficult to appreciate on palpation. On the basis of what preoperative imaging showed, the patient underwent a right lower lobe superior segmentectomy. Local nodes dissected at the time of the operation were negative for malignancy. To confirm adequate surgical resection, postoperative ACTH levels and octreotide scanning were performed. The ACTH level was 1.21 pmol/L (normal). A second octreotide scan showed no evidence of residual tumor (Fig. 2). The patient's blood pressure normalized, and his cushingoid features had declined by his first follow‐up visit. The final pathology confirmed carcinoid tumor, and the tumor stained with ACTH.
DISCUSSION
Ectopic ACTH secretion is responsible for 10%‐15% of the cases of Cushing's syndrome.3 Sources of the ectopic ACTH include small cell carcinoma of the lung, bronchopulmonary carcinoid, islet cell tumors, medullary carcinoma of the thyroid, and pheochromocytoma. The diagnosis of Cushing's syndrome is established by the nonsuppressibility of the serum and urinary cortisol levels. The etiology may be ACTH dependent (eg, Cushing's disease or ectopic ACTH syndrome) or ACTH independent (eg, adrenal tumor). A pituitary source is usually excluded by lack of cortisol suppression with high‐dose dexamethasone, which supports a diagnosis of ectopic ACTH. The CRH‐stimulation test can also be used to differentiate patients with Cushing's disease from those with ectopic ACTH secretion. Typically, 1 g/kg of intravenous CRH is administered to the patient, which elicits a rise in plasma ACTH or cortisol levels in a patient with Cushing's disease. However, only 5% of patients with ectopic ACTH secretion will demonstrate a plasma response,18, 19 thereby helping these 2 groups of patients. Following this differentiation, the source of ACTH can sometimes be located with traditional investigations including computed tomography of the thorax and abdomen. Finally, some authors have also advocated the use of bilateral petrosal sinus catheterization for diagnosing Cushing's syndrome if this diagnosis remains uncertain. Performed since 1982, this procedure involves the simultaneous sampling of petrosal sinuses and peripheral veins for ACTH levels both prior to and following administration of CRH. A diagnosis of ectopic ACTH secretion is strongly suggested by lack of a gradient between central and peripheral ACTH levels.
Carcinoid tumors account for 5% of lung tumors, and only a minority of these secrete ACTH. Only 1% of cases of Cushing's syndrome are accounted for by bronchial carcinoids,4 and as of 2004, only 100 cases had been reviewed in the literature worldwide.23 Pathologically, carcinoids tumors represent a low‐grade neuroendocrine malignancy arising from enterochromaffin or Kulchitsky cells, which are in the mucosa of the bronchi. There is a single line of derivation between bronchial carcinoid and small cell lung carcinoma, which was first demonstrated by Arrigoni.5
It is known that most carcinoid and other types of neuroendocrine tumors express somatostatin receptors,7, 11 and as such, a number of authors have recently described the ability to localize tumors of this type with radiolabeled somatostatin analogues.7, 1116 The sensitivity of somatostatin‐analogue scanning has been well described in the workup of gastropancreatic neuroendocrine malignancies.3, 17 although some false‐positive results do occur and have been attributed to inflammatory conditions such as sarcoidosis. Some work has been documented with this technique in other neuroendocrine malignancies.11, 14 Specifically, this technique was used by Rodriguez et al.12 to intraoperatively scan a patient's resection bed following primary removal of a bronchial carcinoid. This scan was able to identify residual disease despite gross tumor‐free margins of the primary resection specimen and thus enable complete removal of the disease.
In the past, authors have suggested that somatostatin‐analogue scanning is a useful tool in the localization of ectopic ACTH sources only after traditional modalities like CT have yielded equivocal results.3, 9, 10 Indeed, many studies have demonstrated the usefulness of octreotide scanning in localizing tumors with ectopic ACTH secretion. However, 2 recent studies have raised doubts about the clinical utility of octreotide scanning.20, 21 The study by Torpy et al. reported a significantly high false‐positive rate with octreotide scans. However, they also had false positives with conventional imaging in their series. Perhaps the best synthesis of the literature on the subject comes from Pacak et al., who looked at 17 patients with ectopic ACTH syndrome.22 They demonstrated that low‐dose octreotide scanning (L‐OCT) worked just as well as CT and better than MRI in visualizing ACTH‐secreting tumors. Moreover, they demonstrated that L‐OCT highlighted involvement of lymph nodes that was missed by CT and MRI and identified 2 abdominal lesions missed by conventional imaging. Finally, high‐dose octreotide scanning (H‐OCT) was able to pick up an intrathoracic ACTH‐secreting tumor that was not seen on CT, MRI, or L‐OCT. Although in the article the authors advocated L‐OCT as complimentary to CT and MRI, they did acknowledge that it provided additional diagnostic information, at least in their series. They advocated the use of all 3 modalities in order to provide the most comprehensive information on the location and extent of a tumor.
In this case report, we document the use of pre‐ and postoperative octreotide scanning in a patient whose CT scan was equivocal and for whom adequate surgical excision of an indistinct lesion was questionable. The use of octreotide scanning also permitted a limited resection, allowing preservation of lung parenchyma. Furthermore, it allowed us to avoid petrosal sinus catheterization. We propose that octreotide scanning can be a very important and informative test in the management of carcinoid tumors. In situations when conventional imaging is not conclusive, octreotide scanning may be of help in determining the source of ectopic ACTH syndrome. Certainly, CT scanning, currently the modality of first choice, is presently more practical and cost effective. However, octreotide scanning has been shown to be at least as sensitive in localizing ectopic ACTH‐secreting tumors and often can provide additional diagnostic information that can influence surgical management. Somatostatin‐analogue scanning, if performed initially, can guide a diagnostician about where to perform further imaging, so that limited but complete resections of this rare but curable tumor can be planned. Somatostatin‐analogue scanning also may have a role intraoperatively in ensuring complete resection despite pathologically clear tumor margins of the primary specimen, as well as an effective modality in following patients after their primary surgery for disease recurrence. These points all support the idea that octreotide scanning should play a vital and perhaps more central role in the diagnostic workup for ectopic ACTH‐secreting tumors.
CONCLUSIONS
Accurate localization of an ectopic source of ACTH in Cushing's syndrome is important for surgical cure. Octreotide scanning has been shown to be an excellent modality for both the diagnosis and the follow‐up of neuroendocrine tumors. Although computed tomography scanning of the chest and abdomen is currently used as the initial adjuncts in an attempt to localize such tumors, in the case we have presented, in which the initial CT scan was equivocal, subsequent octreotide scanning provided excellent localization of the ectopic ACTH source. We also believe that postoperative surveillance with octreotide scanning offers an excellent means of detecting residual or metastatic tumor. Indeed, somatostatin‐analogue scanning is a very useful modality for the detection, perioperative planning, and postoperative follow‐up of ectopic ACTH‐secreting tumors and neuroendocrine tumors in general and should be considered in surgical workups of such malignancies.
Bronchopulmonary carcinoids are relatively rare endocrine tumors. They can present with Cushing's syndrome secondary to ectopic adrenocorticotropic hormone (ACTH) secretion. They were first described in 1957, and by 1990, only 72 cases had been reported in the literature worldwide.1 The largest series reported had 7 patients seen over a 16‐year period.2 Curative resection is possible only after adequate localization of the ectopic source. In this article, we describe a case illustrating the role of octreotide scanning in the management of bronchopulmonary carcinoid.
Case
A 23‐year‐old male presented with features of Cushing's syndrome. He had a 2‐year history of abdominal striae associated with progressive fatigue, adiposity, mood swings, a 10‐kg weight gain over 6 months, and recent onset of recurrent stones in his left kidney. His past medical history was significant for delayed puberty and juvenile rheumatoid arthritis. Family history also was remarkable for rheumatoid arthritis. Physical examination of the patient at the time of presentation revealed elevated blood pressure (150‐180 mm Hg systolic and 90‐120 mm Hg diastolic) and classic cushingoid features including moon facies and abdominal and axillary striae.
Blood work performed at this time revealed elevated morning and afternoon cortisol of 841 and 918 nmol/L (30.5 and 33.3 g/dL), respectively. Thyroid‐stimulating hormone was low at 0.17 mU/L (normal 0.35‐5.5 mU/L), and free triiodothyronine (T3) and thyroxine (T4) were normal. ACTH was elevated at 70.21 pmol/L (normal 1.98‐11.6 pmol/L). Cortisol levels failed to suppress in response to our dexamethasone suppression test, as shown by the absence of suppression of urinary and serum cortisol despite administration of 0.5 mg of dexamethasone intramuscularly every 6 hours for 2 days, followed by high‐dose dexamethasone (2.0 mg) every 6 hours for 2 additional days. The chest radiograph was normal. Computed tomography (CT) could not confirm a mass but suggested a possible 1.5‐cm lesion in the superior segment of the right lower lobe of the lung. The liver, spleen, pancreas, kidneys, and adrenals were normal. There was no lymphadenopathy.
Octreotide scanning was done following intravenous administration of indium 111 Octreotide at a dose of 119 MBq. It showed a solitary focus in the superior segment of the right lower lobe, confirming the neuroendocrine nature of the suspicious lesion initially suspected on CT scan (Fig. 1). No other foci were found. The patient was diagnosed with ectopic adrenocorticotropic hormone (ACTH) secretion secondary to a bronchopulmonary carcinoid in the superior segment of the right lower lobe.
The patient was brought to the operating room for resection. Intraoperative bronchoscopy revealed no evidence of endotracheal lesions. At thoracotomy the mass was difficult to appreciate on palpation. On the basis of what preoperative imaging showed, the patient underwent a right lower lobe superior segmentectomy. Local nodes dissected at the time of the operation were negative for malignancy. To confirm adequate surgical resection, postoperative ACTH levels and octreotide scanning were performed. The ACTH level was 1.21 pmol/L (normal). A second octreotide scan showed no evidence of residual tumor (Fig. 2). The patient's blood pressure normalized, and his cushingoid features had declined by his first follow‐up visit. The final pathology confirmed carcinoid tumor, and the tumor stained with ACTH.
DISCUSSION
Ectopic ACTH secretion is responsible for 10%‐15% of the cases of Cushing's syndrome.3 Sources of the ectopic ACTH include small cell carcinoma of the lung, bronchopulmonary carcinoid, islet cell tumors, medullary carcinoma of the thyroid, and pheochromocytoma. The diagnosis of Cushing's syndrome is established by the nonsuppressibility of the serum and urinary cortisol levels. The etiology may be ACTH dependent (eg, Cushing's disease or ectopic ACTH syndrome) or ACTH independent (eg, adrenal tumor). A pituitary source is usually excluded by lack of cortisol suppression with high‐dose dexamethasone, which supports a diagnosis of ectopic ACTH. The CRH‐stimulation test can also be used to differentiate patients with Cushing's disease from those with ectopic ACTH secretion. Typically, 1 g/kg of intravenous CRH is administered to the patient, which elicits a rise in plasma ACTH or cortisol levels in a patient with Cushing's disease. However, only 5% of patients with ectopic ACTH secretion will demonstrate a plasma response,18, 19 thereby helping these 2 groups of patients. Following this differentiation, the source of ACTH can sometimes be located with traditional investigations including computed tomography of the thorax and abdomen. Finally, some authors have also advocated the use of bilateral petrosal sinus catheterization for diagnosing Cushing's syndrome if this diagnosis remains uncertain. Performed since 1982, this procedure involves the simultaneous sampling of petrosal sinuses and peripheral veins for ACTH levels both prior to and following administration of CRH. A diagnosis of ectopic ACTH secretion is strongly suggested by lack of a gradient between central and peripheral ACTH levels.
Carcinoid tumors account for 5% of lung tumors, and only a minority of these secrete ACTH. Only 1% of cases of Cushing's syndrome are accounted for by bronchial carcinoids,4 and as of 2004, only 100 cases had been reviewed in the literature worldwide.23 Pathologically, carcinoids tumors represent a low‐grade neuroendocrine malignancy arising from enterochromaffin or Kulchitsky cells, which are in the mucosa of the bronchi. There is a single line of derivation between bronchial carcinoid and small cell lung carcinoma, which was first demonstrated by Arrigoni.5
It is known that most carcinoid and other types of neuroendocrine tumors express somatostatin receptors,7, 11 and as such, a number of authors have recently described the ability to localize tumors of this type with radiolabeled somatostatin analogues.7, 1116 The sensitivity of somatostatin‐analogue scanning has been well described in the workup of gastropancreatic neuroendocrine malignancies.3, 17 although some false‐positive results do occur and have been attributed to inflammatory conditions such as sarcoidosis. Some work has been documented with this technique in other neuroendocrine malignancies.11, 14 Specifically, this technique was used by Rodriguez et al.12 to intraoperatively scan a patient's resection bed following primary removal of a bronchial carcinoid. This scan was able to identify residual disease despite gross tumor‐free margins of the primary resection specimen and thus enable complete removal of the disease.
In the past, authors have suggested that somatostatin‐analogue scanning is a useful tool in the localization of ectopic ACTH sources only after traditional modalities like CT have yielded equivocal results.3, 9, 10 Indeed, many studies have demonstrated the usefulness of octreotide scanning in localizing tumors with ectopic ACTH secretion. However, 2 recent studies have raised doubts about the clinical utility of octreotide scanning.20, 21 The study by Torpy et al. reported a significantly high false‐positive rate with octreotide scans. However, they also had false positives with conventional imaging in their series. Perhaps the best synthesis of the literature on the subject comes from Pacak et al., who looked at 17 patients with ectopic ACTH syndrome.22 They demonstrated that low‐dose octreotide scanning (L‐OCT) worked just as well as CT and better than MRI in visualizing ACTH‐secreting tumors. Moreover, they demonstrated that L‐OCT highlighted involvement of lymph nodes that was missed by CT and MRI and identified 2 abdominal lesions missed by conventional imaging. Finally, high‐dose octreotide scanning (H‐OCT) was able to pick up an intrathoracic ACTH‐secreting tumor that was not seen on CT, MRI, or L‐OCT. Although in the article the authors advocated L‐OCT as complimentary to CT and MRI, they did acknowledge that it provided additional diagnostic information, at least in their series. They advocated the use of all 3 modalities in order to provide the most comprehensive information on the location and extent of a tumor.
In this case report, we document the use of pre‐ and postoperative octreotide scanning in a patient whose CT scan was equivocal and for whom adequate surgical excision of an indistinct lesion was questionable. The use of octreotide scanning also permitted a limited resection, allowing preservation of lung parenchyma. Furthermore, it allowed us to avoid petrosal sinus catheterization. We propose that octreotide scanning can be a very important and informative test in the management of carcinoid tumors. In situations when conventional imaging is not conclusive, octreotide scanning may be of help in determining the source of ectopic ACTH syndrome. Certainly, CT scanning, currently the modality of first choice, is presently more practical and cost effective. However, octreotide scanning has been shown to be at least as sensitive in localizing ectopic ACTH‐secreting tumors and often can provide additional diagnostic information that can influence surgical management. Somatostatin‐analogue scanning, if performed initially, can guide a diagnostician about where to perform further imaging, so that limited but complete resections of this rare but curable tumor can be planned. Somatostatin‐analogue scanning also may have a role intraoperatively in ensuring complete resection despite pathologically clear tumor margins of the primary specimen, as well as an effective modality in following patients after their primary surgery for disease recurrence. These points all support the idea that octreotide scanning should play a vital and perhaps more central role in the diagnostic workup for ectopic ACTH‐secreting tumors.
CONCLUSIONS
Accurate localization of an ectopic source of ACTH in Cushing's syndrome is important for surgical cure. Octreotide scanning has been shown to be an excellent modality for both the diagnosis and the follow‐up of neuroendocrine tumors. Although computed tomography scanning of the chest and abdomen is currently used as the initial adjuncts in an attempt to localize such tumors, in the case we have presented, in which the initial CT scan was equivocal, subsequent octreotide scanning provided excellent localization of the ectopic ACTH source. We also believe that postoperative surveillance with octreotide scanning offers an excellent means of detecting residual or metastatic tumor. Indeed, somatostatin‐analogue scanning is a very useful modality for the detection, perioperative planning, and postoperative follow‐up of ectopic ACTH‐secreting tumors and neuroendocrine tumors in general and should be considered in surgical workups of such malignancies.
- ,,, et al.Management of the ectopic ACTH syndrome due to thoracic carcinoids.Ann Thorac Surg.1990;50(1):52–57.
- ,,,,,.Bronchopulmonary cacinoid tumors associated with Cushing's syndrome: a more aggressive variant of the typical carcinoid.J Thorac Cardiovasc Surg.1997;114:367–375.
- ,,,,.Ectopic ACTH secretion due to a bronchopulmonary carcinoid localized by somatostatin receptor scintigraphy.Clin Investig.1994;72:887–891.
- .Diagnostic evaluation of Cushing's syndrome.Endocrinol Metab Clin North Am.1988;17:445–472.
- ,,.Atypical carcinoid tumors of the lung.J Thorac Cardiovasc Surg.1972;64:413–421.
- ,,, et al.Somatostatin receptor scintigraphy. In:Freeman LM, ed.Nuclear Medicine Annual 1995.New York:Raven Press,1995:1–21.
- ,,.The role of somatostatin and its analogues in the diagnosis and treatment of tumors.Endocr Rev.1991;12:450–482.
- ,,.Somatostatin analogue treatment of neuroendocrine tumours.Postgrad Med J.1996;72:403–408.
- ,,, et al.Bronchial carcinoid associated with Cushing's syndrome.J Cardiovasc Surg (Torino).1995;36:511–514.
- ,,, et al.Somatostatin analogs for the localization and preoperative treatment of an adrenocorticotropin‐secreting bronchial carcinoid tumor.J Clin Endocrinol Metab.1994;78(1):20–24.
- ,,, et al.In vitro detection of somatostatin receptors in human tumors.Digestion.1993;54(suppl.):68–71.
- ,,, et al.Intraoperative detection of a bronchial carcinoid with a radiolabeled somatostatin analog.Chest.2002;121:985–988.
- ,,, et al.Localization of endocrine‐related tumours with a radioiodinated analogue of somatostatin.Lancet.1989;1:242–244.
- ,,, et al.Somatostatin receptor scintigraphy with [111In‐DTPA‐D‐Phe1]‐octreotide and [123I‐Tyr3]‐octreotide: the Rotterdam experience with more that 1,000 patients.Eur J Nucl Med.1993;20:716–731.
- ,,, et al.Comparison of somatostatin analog and meta‐iodobenzylguanidine radionuclides in the diagnosis and localization of advanced neuroendocrine tumors.J Clin Endocr Metab.2001;86:895–902.
- .MIBG and radiolabeled octreotide in neuroendocrine tumors.Q J Nucl Med.1995;39(suppl 1‐4):137–139.
- ,,, et al.Recent advances in radiological and radionuclide imaging and therapy of neuroendocrine tumours.Eur J Endocrinol2004;151:15–27.
- ,,, et al.Cushing's syndrome in children and adolescents. Presentation, diagnosis, and therapy.N Engl J Med.1994;331:629–636.
- ,,, et al.A simplified morning ovine corticotropin‐releasing hormone stimulation test for the differential diagnosis of adrenocorticotropin‐dependent Cushing's syndrome.J Clin Endocrinol Metab.1993;77:1308–1312.
- ,,, et al.Lack of utility of 111In‐pentreotide scintigraphy in localizing ectopic ACTH producing tumors: follow‐up of 18 patients.J Clin Endocrinol Metab.1999;84:1186–1192.
- ,,, et al.Usefulness of somatostatin receptor scintigraphy in patients with occult ectopic adrenocorticotropin syndrome.J Clin Endocrinol Metab.1999;84:1193–1202.
- ,,,,,.The role of [18F]fluorodeoxyglucose positron emission tomography and [111In]‐diethylenetriaminepentaacetate‐D‐Phe‐pentetreotide scintigraphy in the localization of ectopic adrenocorticotropin‐secreting tumors causing Cushing's syndrome.J Clin Endocrin Metab.2004;89:2214–2221.
- ,,, et al.Cushing's syndrome induced by bronchopulmonary carcinoid tumours: a review of 98 cases and our experience of two cases.Chir Ita.2004;56(1):63–70.
- ,,, et al.Management of the ectopic ACTH syndrome due to thoracic carcinoids.Ann Thorac Surg.1990;50(1):52–57.
- ,,,,,.Bronchopulmonary cacinoid tumors associated with Cushing's syndrome: a more aggressive variant of the typical carcinoid.J Thorac Cardiovasc Surg.1997;114:367–375.
- ,,,,.Ectopic ACTH secretion due to a bronchopulmonary carcinoid localized by somatostatin receptor scintigraphy.Clin Investig.1994;72:887–891.
- .Diagnostic evaluation of Cushing's syndrome.Endocrinol Metab Clin North Am.1988;17:445–472.
- ,,.Atypical carcinoid tumors of the lung.J Thorac Cardiovasc Surg.1972;64:413–421.
- ,,, et al.Somatostatin receptor scintigraphy. In:Freeman LM, ed.Nuclear Medicine Annual 1995.New York:Raven Press,1995:1–21.
- ,,.The role of somatostatin and its analogues in the diagnosis and treatment of tumors.Endocr Rev.1991;12:450–482.
- ,,.Somatostatin analogue treatment of neuroendocrine tumours.Postgrad Med J.1996;72:403–408.
- ,,, et al.Bronchial carcinoid associated with Cushing's syndrome.J Cardiovasc Surg (Torino).1995;36:511–514.
- ,,, et al.Somatostatin analogs for the localization and preoperative treatment of an adrenocorticotropin‐secreting bronchial carcinoid tumor.J Clin Endocrinol Metab.1994;78(1):20–24.
- ,,, et al.In vitro detection of somatostatin receptors in human tumors.Digestion.1993;54(suppl.):68–71.
- ,,, et al.Intraoperative detection of a bronchial carcinoid with a radiolabeled somatostatin analog.Chest.2002;121:985–988.
- ,,, et al.Localization of endocrine‐related tumours with a radioiodinated analogue of somatostatin.Lancet.1989;1:242–244.
- ,,, et al.Somatostatin receptor scintigraphy with [111In‐DTPA‐D‐Phe1]‐octreotide and [123I‐Tyr3]‐octreotide: the Rotterdam experience with more that 1,000 patients.Eur J Nucl Med.1993;20:716–731.
- ,,, et al.Comparison of somatostatin analog and meta‐iodobenzylguanidine radionuclides in the diagnosis and localization of advanced neuroendocrine tumors.J Clin Endocr Metab.2001;86:895–902.
- .MIBG and radiolabeled octreotide in neuroendocrine tumors.Q J Nucl Med.1995;39(suppl 1‐4):137–139.
- ,,, et al.Recent advances in radiological and radionuclide imaging and therapy of neuroendocrine tumours.Eur J Endocrinol2004;151:15–27.
- ,,, et al.Cushing's syndrome in children and adolescents. Presentation, diagnosis, and therapy.N Engl J Med.1994;331:629–636.
- ,,, et al.A simplified morning ovine corticotropin‐releasing hormone stimulation test for the differential diagnosis of adrenocorticotropin‐dependent Cushing's syndrome.J Clin Endocrinol Metab.1993;77:1308–1312.
- ,,, et al.Lack of utility of 111In‐pentreotide scintigraphy in localizing ectopic ACTH producing tumors: follow‐up of 18 patients.J Clin Endocrinol Metab.1999;84:1186–1192.
- ,,, et al.Usefulness of somatostatin receptor scintigraphy in patients with occult ectopic adrenocorticotropin syndrome.J Clin Endocrinol Metab.1999;84:1193–1202.
- ,,,,,.The role of [18F]fluorodeoxyglucose positron emission tomography and [111In]‐diethylenetriaminepentaacetate‐D‐Phe‐pentetreotide scintigraphy in the localization of ectopic adrenocorticotropin‐secreting tumors causing Cushing's syndrome.J Clin Endocrin Metab.2004;89:2214–2221.
- ,,, et al.Cushing's syndrome induced by bronchopulmonary carcinoid tumours: a review of 98 cases and our experience of two cases.Chir Ita.2004;56(1):63–70.
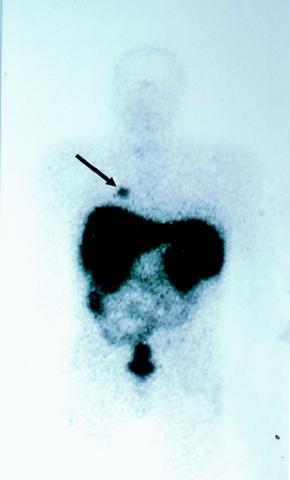
Infected pneumatocele
A 49‐year‐old woman with a history of asthma and a pneumatocele secondary to a past pneumonia (Fig. 1, prior baseline chest X‐ray) presented with fever, cough, and shortness of breath. This was her third admission for similar symptoms. In the past, these symptoms had resolved with antibiotics and percutaneous drainage of the infected pneumatocele. Her admission chest X‐ray revealed a fluid‐filled pneumatocele (Fig. 2). Given the recurrent nature of her disease, a right middle lobectomy was performed. Her recovery after surgery was uneventful, and she continues to do well 4 months later.
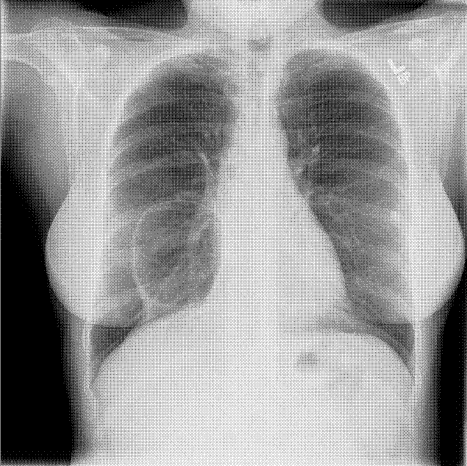
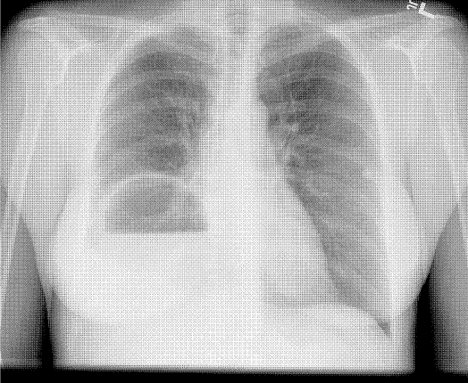
Pneumatoceles are air‐filled cysts that occur because of trauma or inflammation in the lung parenchyma. The most common cause is pneumonia and they occur most frequently in children. Complications of pneumatocele include pneumothorax and, as in this patient, secondary infection. In most instances the pneumatocele resolves after treating the underlying pneumonia, but surgical intervention is sometimes required to have a definitive cure.
A 49‐year‐old woman with a history of asthma and a pneumatocele secondary to a past pneumonia (Fig. 1, prior baseline chest X‐ray) presented with fever, cough, and shortness of breath. This was her third admission for similar symptoms. In the past, these symptoms had resolved with antibiotics and percutaneous drainage of the infected pneumatocele. Her admission chest X‐ray revealed a fluid‐filled pneumatocele (Fig. 2). Given the recurrent nature of her disease, a right middle lobectomy was performed. Her recovery after surgery was uneventful, and she continues to do well 4 months later.
Pneumatoceles are air‐filled cysts that occur because of trauma or inflammation in the lung parenchyma. The most common cause is pneumonia and they occur most frequently in children. Complications of pneumatocele include pneumothorax and, as in this patient, secondary infection. In most instances the pneumatocele resolves after treating the underlying pneumonia, but surgical intervention is sometimes required to have a definitive cure.
A 49‐year‐old woman with a history of asthma and a pneumatocele secondary to a past pneumonia (Fig. 1, prior baseline chest X‐ray) presented with fever, cough, and shortness of breath. This was her third admission for similar symptoms. In the past, these symptoms had resolved with antibiotics and percutaneous drainage of the infected pneumatocele. Her admission chest X‐ray revealed a fluid‐filled pneumatocele (Fig. 2). Given the recurrent nature of her disease, a right middle lobectomy was performed. Her recovery after surgery was uneventful, and she continues to do well 4 months later.
Pneumatoceles are air‐filled cysts that occur because of trauma or inflammation in the lung parenchyma. The most common cause is pneumonia and they occur most frequently in children. Complications of pneumatocele include pneumothorax and, as in this patient, secondary infection. In most instances the pneumatocele resolves after treating the underlying pneumonia, but surgical intervention is sometimes required to have a definitive cure.
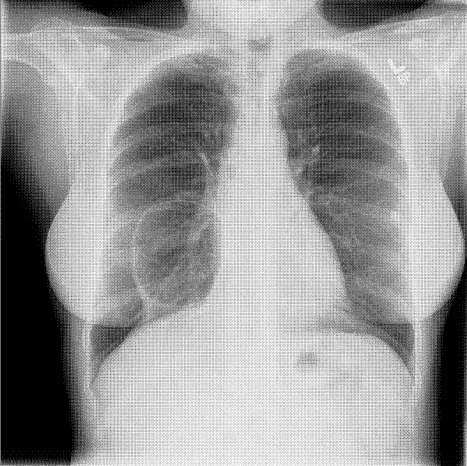
Predictors of Regaining Ambulatory Ability
Functional decline, defined as loss of the ability to care for oneself, commonly occurs during hospitalization, being experienced by up to 65% of older adults.14 Frequently, recovery of functional ability does not occur by the time of discharge from the hospital, despite resolution of the medical condition responsible for admission to the hospital.1, 5 Causes of the declining ability to perform activities of daily living (ADLs) are multiple and include both acute illness and adverse events associated with hospitalization.4, 6, 7 The functional decline experienced by older persons during hospitalization is a strong predictor of length of stay, nursing home placement, and mortality.8 Loss of ambulatory ability specifically has been noted to occur in 17%‐65% of hospitalized older patients, usually within days of admission, with few recovering this ability prior to discharge.2, 4, 5, 9 Importantly, ambulatory ability is significantly associated with a decline in other ADLs.9
Although several studies have explored risk factors associated with general functional decline during hospitalization,4, 7, 10, 11 only one study specifically examined risk factors associated with loss of ambulatory ability. In a cohort of participants who were largely independently performing ADLs on admission to the hospital, Mahoney et al. found age 85 years, white race, use of a walker, and functional impairment prior to being hospitalized were significant predictors of newly having walking dependence.12
Ambulatory ability could also be affected by a variety of other factors not examined in the Mahoney et al. study; these include severity of illness, bed rest, and hospital‐related treatments such as restraints or urinary catheters. In addition, little is known about predictors of recovery of ambulatory ability in patients expected to have activity limitations on admission who are dependent in most or all ADLs. The deconditioning associated with bed rest and reduced mobility has been described as one of the most predictable causes of functional decline, including loss of ambulatory ability, observed in older hospitalized patients.13 In one study, patients whose activity was limited to a bed or chair during hospitalization were 5.6 times more likely to develop functional decline than those who walked at all, even after controlling for other covariates including severity of illness and comorbidity.14 Those patients with both activity limitations and dependence in most or all ADLs represent an important subset of all hospitalized older patients who might be expected to be at higher risk of developing new ambulatory dependence. The ability to identify, at admission, those patients who will recover ambulatory ability may have important implications for discharge planning as well as for the development of preventive strategies.
The objective of the present study was to define patient demographic, illness severity, comorbid illness, and hospital‐related variables that are independent and significant predictors of regaining ambulatory ability prior to hospital discharge in a cohort of patients who had significant activity limitations and functional impairment at the time of admission to the hospital.
METHODS
Study Design
This study was part of a larger prospective cohort study conducted at a tertiary‐care teaching hospital that examined risk factors for pressure ulcers among patients with activity limitations.15 All patients admitted to the medical wards from December 1988 to June 1991 were screened, and research nurses confirmed eligibility within 3 days. Candidates were at least 55 years of age and were expected to be limited to a bed or chair for at least the first 5 days of hospitalization according to the assessments of their primary nurses. Participants were also eligible if admitted with a hip fracture. In all, 286 patients were included in the present analysis. These patients were included because they had been ambulatory in the 4 weeks before admission, and so they would be expected to have the potential to either maintain or regain ambulatory ability prior to discharge. Thirty‐one patients who otherwise would have been eligible for the present analysis were excluded because they had unusually long hospital stays, defined as longer than 31 days. These patients were excluded in order to remove outliers of this variable and because only the effects of relatively acute hospitalization were being studied. Study procedures were approved by the Institutional Review Board of the University of Alabama at Birmingham (UAB).
Baseline Data Collection
For each patient, baseline data were collected from interviews with physicians and nurses at admission and were abstracted from the medical record. Chart review provided information on length of stay; the demographic variables age, sex, race, and marital status; and the presence of specified medical conditions or diseases that might affect a patient's ability to ambulate. These medical conditions and diseases were hip fracture, hypotension, deep vein thrombosis, major surgery and neurological disease defined as a history of hemiparesis regardless of cause, cerebrovascular accident without residual weakness, transient ischemic attack, Parkinson's disease, or seizures. Quartiles of the Comorbidity Damage Index of the Charlson16 and the Acute Physiology Score (APS) of the APACHE II17 were used as global measures of comorbidity and illness severity, respectively. Each patient's primary physician was asked to estimate the patient's life expectancy on a 4‐point scale (<6 months, from 6 months to <1 year, 1‐5 years, >5 years). It was ascertained from each patient's primary nurse whether a urinary catheter or physical restraints were in use. Confusion was assessed according to how nurses gauged patient mental status on a 4‐point scale, from 1 = stuporous/comatose to 4 = alert, defined as being fully responsive and oriented. Any score other than 4 was coded as having altered mental status. Nurses classified patients as either independent or dependent for each of the 7 ADLs (feeding, bathing, dressing, grooming, toileting, transferring, and walking).18 Admission bed mobility was assessed by nurse rating on a 4‐point scale, from 1 = immobile to 4 = fully mobile.
In‐Hospital Outcome Assessment
Throughout the hospitalization, the primary nurse of each patient was interviewed weekly about whether the patient was expected to remain limited to a bed or chair for at least the next week. Whether patients had regained mobility was determined on the basis of the nurses' reports. Patients were defined as ambulatory if their activity was no longer confined to a bed or chair. Patients who died were included in the analysis, as the purpose of this study was to determine characteristics at admission that would predict who would likely regain ambulatory ability.
Statistical Analysis
Appropriate descriptive statistics, including means, standard deviations, and proportions, were used to describe the characteristics of those in the study group. For each variable of interest, logistic regression with dummy coding was used to examine unadjusted relationships with recovery of ambulatory ability. The independent contribution of each of the predictor variables to recovery of ambulatory ability was then tested in a series of multivariate logistic regression models that sequentially adjusted for factors considered important covariables. This was done by adding groups of similar covariates into the model in separate stages. These covariate groups were length of stay, demographics, global health measures and specific medical problems, hospital‐related factors, and admission bed mobility. All statistical analyses were performed using the Statistical Analyses System (SAS Institute, Cary, NC), and P < .05 was considered statistically significant.
RESULTS
For this study, 286 participants met all eligibility criteria, with 119 (42%) regaining ambulatory ability during hospitalization. Mean age of study participants was 73 9 years, with 12% of participants more than 85 years old. On admission, 214 patients (75%) were dependent in all 7 ADLs. Mean length of stay ( SD) was 12.3 6.5 days, with a range of 1‐31 days. Table 1 presents the cohort characteristics and the unadjusted effects of each variable for predicting those who did and did not recover ambulatory ability by characteristic. The P value of a variable in Table 1 indicates how significant that variable was, as determined with a simple logistic regression analysis. The unadjusted odds ratio of each variable is presented in Table 2 in order to facilitate comparisons with the adjusted odds ratios from the multivariate models. Analysis of the effects of the unadjusted single variables showed that age was a significant predictor, with older patients less likely to regain ambulatory ability. Several global health measures and hospital‐related factors were also significantly different between those who recovered and those who did not recover ambulatory ability, as summarized in Table 1. Importantly, length of stay was not significantly associated with recovery.
| Characteristic | No. of Subjects | Regained ambulatory ability | P valuea | ||
|---|---|---|---|---|---|
| Yes N (%) | No N(%) | ||||
| |||||
| Demographics | |||||
| Age | 55‐64 years | 46 | 19 (41) | 27 (59) | .009 |
| 65‐74 years | 118 | 63 (53) | 55 (47) | ||
| 75‐84 years | 88 | 29 (33) | 59 (67) | ||
| 85 years | 34 | 8 (24) | 26 (76) | ||
| Sex | Female | 163 | 72 (44) | 91 (56) | .31 |
| Male | 123 | 47 (38) | 76 (62) | ||
| Race | White | 168 | 72 (43) | 96 (57) | .61 |
| Black/other | 118 | 47 (40) | 71 (60) | ||
| Married | 164 | 64 (39) | 55 (45) | .30 | |
| Not married | 122 | 55 (61) | 67 (55) | ||
| Global health measures/specific medical problems | |||||
| Life expectancy | <6 months | 28 | 3 (11) | 25 (89) | < .0001 |
| 6 months‐1 year | 43 | 11 (26) | 32 (74) | ||
| 1‐5 years | 127 | 47 (37) | 80 (63) | ||
| >5 years | 88 | 58 (66) | 30 (34) | ||
| Acute Physiology Score | 0‐6 | 71 | 35 (49) | 36 (51) | < .0001 |
| 7‐10 | 83 | 46 (55) | 37 (45) | ||
| 11‐13 | 62 | 19 (31) | 43 (69) | ||
| 14+ | 61 | 13 (21) | 48 (79) | ||
| Comorbidity Index | 0‐1.0 | 89 | 48 (54) | 41 (46) | .01 |
| 1.1‐2.5 | 65 | 24 (37) | 41 (63) | ||
| 2.6‐4.0 | 55 | 23 (42) | 32 (58) | ||
| 4+ | 63 | 20 (32) | 43 (68) | ||
| Hip fracture present | Yes | 30 | 14 (47) | 16 (53) | .55 |
| No | 256 | 105 (41) | 151 (59) | ||
| Neurological disease present | Yes | 152 | 49 (32) | 103 (68) | .0007 |
| No | 134 | 70 (52) | 64 (48) | ||
| Hypotension present | Yes | 35 | 18 (51) | 17 (49) | .21 |
| No | 251 | 101 (40) | 150 (60) | ||
| Deep vein thrombosis present | Yes | 9 | 1 (11) | 8 (89) | .10 |
| No | 277 | 118 (43) | 159 (57) | ||
| Had major surgery | Yes | 73 | 47 (64) | 26 (36) | < .0001 |
| No | 213 | 72 (34) | 141 (66) | ||
| Level of consciousness | Altered mental status | 123 | 30 (24) | 93 (76) | < .0001 |
| No altered mental status | 163 | 89 (55) | 74 (45) | ||
| Hospital‐related factors | |||||
| Urinary catheter | Yes | 172 | 66 (38) | 106 (62) | .17 |
| No | 114 | 53 (46) | 61 (54) | ||
| Restraints in use | Yes | 93 | 21 (23) | 72 (77) | < .0001 |
| No | 193 | 98 (51) | 95 (49) | ||
| Initial bed mobility | Immobile | 25 | 5 (20) | 20 (80) | < .0001 |
| Very limited | 100 | 26 (26) | 74 (74) | ||
| Slightly limited | 131 | 73 (56) | 58 (44) | ||
| Fully mobile | 30 | 15 (50) | 15 (50) | ||
| Variables | Model 1 Demographics ORa (95% CI) | Model 2 Global health/specific diseases OR (95% CI) | Model 3 Hospital factors OR (95% CI) | Model 4 Mobility OR (95% CI) | Unadjusted Results OR (95% CI) |
|---|---|---|---|---|---|
| |||||
| Length of stay | 0.9 (0.9‐0.99)b | 1.0 (0.9‐1.0) | 1.0 (0.9‐1.0) | 1.0 (0.9‐1.0) | 1.0 (0.9‐1.0) |
| Age | 0.6 (0.4‐0.8)b | 0.8 (0.5‐1.1) | 0.7 (0.5‐1.1) | 0.7 (0.5‐1.1) | 0.7 (0.5‐0.9)b |
| Sexfemale | 1.1 (0.7‐1.9) | 0.9 (0.5‐1.7) | 0.8 (0.4‐1.6) | 0.9 (0.4‐1.6) | 1.3 (0.8‐2.1) |
| Racewhite | 1.3 (0.8‐2.2) | 1.3 (0.7‐2.5) | 1.3 (0.7‐2.4) | 1.2 (0.6‐2.2) | 1.1 (0.7‐1.8) |
| Not married | 1.7 (1.0‐2.9) | 2.5 (1.3‐5.0)b | 2.7 (1.3‐5.5)b | 3.0 (1.4‐6.2)b | 1.3 (0.8‐2.1) |
| APS quartilesc | 0.7 (0.5‐1.0)b | 0.8 (0.5‐1.0) | 0.8 (0.6‐1.1) | 0.6 (0.5‐0.8)b | |
| MD‐rated life expectancyc | 1.9 (1.3‐2.8)b | 1.9 (1.3‐2.9)b | 1.9 (1.3‐2.8)b | 2.5 (1.8‐3.5)b | |
| Comorbidity quartilesc | 1.0 (0.7‐1.3) | 1.0 (0.7‐1.3) | 1.0 (0.7‐1.3) | 0.8 (0.6‐0.9)b | |
| No deep vein thrombosis | 14.8 (1.6‐138.1)b | 13.1 (1.4‐121.1)b | 11.4 (1.2‐105.1)b | 5.9 (0.7‐48.1) | |
| No hip fracture | 2.1 (0.8‐5.6) | 2.1 (0.8‐6.0) | 2.2 (0.8‐6.3) | 0.8 (0.4‐1.7) | |
| No neurological diseasesc | 1.7 (0.9‐3.3) | 1.7 (0.9‐3.3) | 1.7 (0.9‐3.4) | 2.3 (1.4‐3.7)b | |
| No hypotension | 0.8 (0.3‐2.1) | 0.8 (0.3‐2.2) | 0.8 (0.3‐2.3) | 0.6 (0.3‐1.3) | |
| Having major surgery | 1.7 (0.8‐3.6) | 1.8 (0.8‐3.9) | 1.9 (0.9‐4.0) | 3.5 (2.0‐6.2)b | |
| Having normal mental statusc | 2.1 (1.1‐4.0)b | 2.0 (0.8‐4.0) | 1.6 (0.8‐3.3) | 3.7 (2.2‐6.2)b | |
| No urinary catheter | 2.1 (1.0‐4.2)b | 2.2 (1.2‐5.5)b | 1.4 (0.9‐2.3) | ||
| Not in restraints | 2.2 (1.0‐4.6)b | 2.5 (1.2‐5.5)b | 3.5 (2.0‐6.2)b | ||
| Bed mobility on admissionc | 1.7 (1.1‐2.6)b | 2.0 (1.5‐2.8)b | |||
Table 2 shows the effects of adjusting the model for important covariables in a sequential fashion. Model 1 shows that longer length of stay and older age are associated with reduced odds of regaining ambulatory ability after adjusting for other demographic variables. However, age and length of stay were no longer significant after adjusting for global health measures and specific medical problems (Model 2). As demonstrated by the full model (Model 4), the participants who regained ambulatory ability were more likely to be unmarried, have a longer physician‐rated life expectancy, not have a diagnosis of deep vein thrombosis, not have physical restraints or a urinary catheter in use, and have greater bed mobility at admission.
Predictors that remained significant in the final multivariate model (Model 4) were summed in order to determine the proportion of patients who had one predictor versus those who had more than one predictor. Figure 1 shows the percentage of those who recovered ambulatory ability according to number of predictors, ranging from one to all 6 predictors. The results demonstrate a graded relationship, with number of predictors positively correlated with percentage of those who recovered ambulatory ability (P < .0001).
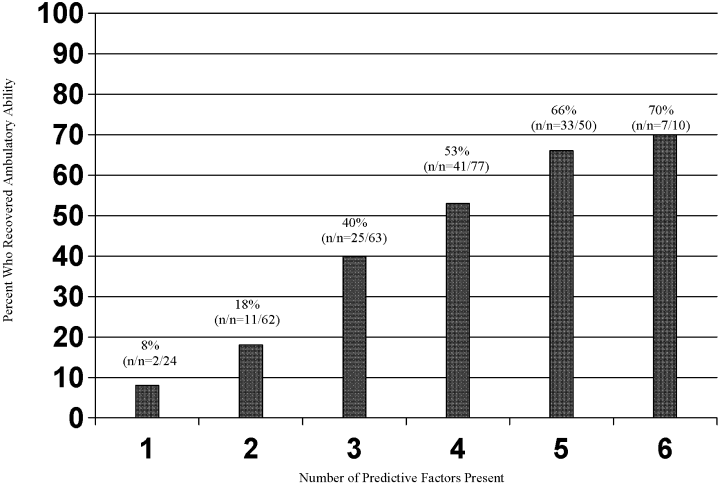
Patients who died prior to discharge were more likely to be male and have altered mental status, a urinary catheter, restraints, a shorter physician‐rated life expectancy, lower admission bed mobility, and increased severity of illness compared to those who survived. When the 34 patients who died were excluded from the multivariate analysis, the factors predicting ambulatory recovery were unchanged from those reported in Model 4 of Table 2.
DISCUSSION
In this study of older hospitalized patients, approximately 40% were able to regain their ambulatory ability despite being limited to the bed or chair on admission, having significant severity of illness, high level of use of restraints, and functional dependence on admission. Predictors of regaining ambulatory ability were identifiable at hospital admission. These predictors also were correlated with recovery of ambulatory ability in a graded fashion, lending support for the direct relationship between these predictors and recovery.
Physician‐rated life expectancy, a simple assessment that combines a physician's medical knowledge and clinical acumen, was demonstrated in our study to be a better predictor of recovery of ambulatory ability than more elaborate measures like the APACHE II17 and Charlson Comorbidity Index.16 This assessment can easily be done at the bedside and may help to guide discharge planning for the hospitalist physician. Nurse‐rated bed mobility at time of admission, which may reflect aspects of illness severity and cognitive status, was also able to predict recovery.
Of the 6 factors found to be independent predictors of recovery of ambulatory ability, 4 were related to mobility: lack of a DVT diagnosis, absence of a urinary catheter, absence of restraints, and nurse‐rated bed mobility at admission. In the group of patients initially expected to be confined to a bed or chair, those with additional mobility‐reducing factors, such as catheters and restraints, were less likely to recover, even after controlling for illness severity and comorbidity.
Marital status was not found to predict recovery of ambulatory ability in the simple unadjusted bivariate analysis, but after adjusting for other demographic, global health, and disease‐related variables, those who were unmarried were more likely to recover ambulatory ability. These interesting covariate‐adjusted effects for marital status have not been previously reported in the literature. One large study of the impact of marital status on hospital outcomes demonstrated those who were unmarried were more likely to require discharge to a nursing home and had slightly higher hospital costs and longer length of stay.19 Our findings may be related to such patients lacking support other than from themselves, with the possibility of being discharged to a nursing home an incentive to get up and walk.
Although age, race, and previous ADL status were found to be significant predictors in a previous study,12 we did not find this in our sample. This may be because, unlike in other studies, most of our patients had significant functional impairment on admission. The importance of age in our cohort disappeared when illness severity and comorbidities were added to the model.
The strengths of this study include having comprehensive patient‐related data on demographic, illness severity, comorbidity, and hospital‐related factors available, which enabled detailed analyses of predictors for regaining ambulatory ability. In particular, the ability to examine such factors as bed rest and hospital‐related treatments like restraint and catheter use, enabled this study to add significantly to the available knowledge of predictors of ambulatory recovery. The use of nurse interviews to obtain patient‐related data has been demonstrated in previous studies to be a preferred method of collecting data when compared to patient self‐report.20, 21 Examination of these factors in a cohort of patients who would be expected to be at very high risk for remaining bed‐ or chair bound, given their admission activity limitations and functional dependence, is also noteworthy.
Several important limitations deserve comment. Since the data were collected, average length of hospital stay generally has decreased. However, the patient population we studied continue to experience longer hospital stays than functionally intact patients. One recent study demonstrated that the length of hospital stay of patients who were dependent in one or more ADLs on admission was 35% longer than that of those not ADL dependent at admission.22 Seventy‐five percent of those in the present study cohort were dependent in all 7 ADLs and had a mean length of stay of 12.3 days. Despite the longer mean length of stay, 70% of those in the study cohort were discharged within 2 weeks of admission. In the university hospital where this research was conducted, mean length of stay ( SD) in 2004 was 6 8.6 days, but 10% of patients 55 years of age and older remained in the hospital for more than 2 weeks.23 This suggests there continue to be long‐stay patients in the current hospital environment, to which these findings may apply.
Standards of practice, such as for use of restraints, have also changed. In 1992, between 7.4% and 17% of all hospitalized medical patients were restrained, according to a literature review.24 A 1998 survey of 3 hospitals found the prevalence of restraints still ranged from 3.9% to 8.2% and noted that among the most common reasons reported for using restraints were to prevent patient disruption of therapy, to confine confused patients, and to reduce the number of falls.25 Thus, our study cohort would be more likely to be restrained, even in the current hospital environment, given that 43% of the cohort had altered mental status and that most were at risk for falls because of their poor functional status.26
Nevertheless, even though the use of restraints has declined since the data were collected for this study, this should affect neither the internal validity of the results nor the ability to address the question of what factors predict recovery of ambulatory ability. Indeed, the inclusion of patients on whom restraints are frequently used emphasizes the need for continued diligence in creating a restraint‐free environment in our hospitals. Data about the use of physical therapy services were not available in the study. Therefore, it is unknown to what extent the use of these services encouraged ambulation.
In this observational study, we found 6 factors associated with regaining ambulatory ability among hospitalized patients who had significant activity limitations and functional dependence on admission. These findings suggest predictors easily assessed by the hospitalist physician can help to identify those patients most likely to recover ambulatory ability prior to discharge. It also demonstrates the importance of mobility in maintaining function, given that many of the predictors are factors that either impede mobility such as restraints and urinary catheters or measure mobility such as admission bed mobility. Last, recognizing physician‐rated life expectancy as a strong independent predictor of recovery of ambulatory ability should encourage hospitalist physicians to continue to use their greatest tool, their clinical judgment, to determine who will recover ambulatory ability.
As most of these predictors can be identified on admission or shortly thereafter, these factors may be useful in helping physicians and other health care providers to predict the potential patients have to recover ambulatory ability. This information may help physicians identify patients who might benefit from early mobility programs, placement on hospital units where mobility will be enhanced, or the early initiation of discharge planning for those patients identified as unlikely to regain ambulation ability. In addition, addressing factors that are potentially modifiable, such as low bed mobility and the use of urinary catheters and restraints may not only improve the chance of recovering ambulatory ability but would also improve the quality of care provided to older patients.
- ,,, et al.Effect of a geriatric consultation team on functional status of elderly hospitalized patients.Ann Intern Med.1989;110:79‐84.
- ,,, et al.Functional disability in the hospitalized elderly.JAMA.1982;248:847‐850.
- ,,, et al.Loss of independence in activities of daily living in older adults hospitalized with medical illnesses: increased vulnerability with age.J Am Geriatr Soc.2003;51:451‐458.
- ,,, et al.Functional outcomes of acute medical illness and hospitalization in older persons.Arch Intern Med.1996;156:645‐652.
- ,,, et al.The natural history of functional morbidity in hospitalized older patients.J Am Geriatr Soc.1990;38:1296‐1303.
- ,,, et al.Hospital diagnosis, Medicare charges and nursing home admissions in the year when older persons become severely disabled.JAMA.1997;277:728‐734.
- ,,.A predictive index for functional decline in hospitalized elderly medical patients.J Gen Intern Med.1993;8:645‐652.
- ,,, et al.Predictors of immediate and 6‐month outcomes in hospitalized elderly patients: the importance of functional status.J Am Geriatr Soc.1988;36:775‐783.
- ,.Admission and discharge mobility of frail hospitalized older adults.Medsurg Nurs.2004;13:156‐163.
- ,,.Predictors of functional decline in hospitalized elderly patients: a systematic review.J Gerontol Med Sci.2002;57A:M569–M577.
- ,,, et al.Hospital admission risk profile (HARP): identifying older patients at risk for functional decline following acute medical illness and hospitalization.J Am Geriatr Soc.1996;44:251‐257.
- ,,.New walking dependence associated with hospitalization for acute medical illness: incidence and significance.J Gerontol Med Sci.1998;53A:M307–M312.
- ,,,.Geriatric hospital medicine.Med Clin North Am.2002;86:707‐729.
- ,,.Prevalence and outcomes of low mobility in hospitalized older patients.J Am Geriatr Soc.2004;52:1263‐1270.
- ,,, et al.Pressure ulcer risk factors among hospitalized patients with activity limitations.JAMA.1995;273:865‐870.
- ,,,.A new method of classifying prognostic comorbidity in longitudinal studies: development and validation.J Chronic Dis.1986;40:373‐383.
- ,,,.APACHE II. A severity of disease classification system.Crit Care Med.1985;13:818‐829.
- ,,, et al.Studies of illness in the aged: the index of ADL: a standardized measure of biological and psychosocial functioning.JAMA.1963;185:914‐919.
- ,.Impact of marital status on outcomes in hospitalized patients.Arch Intern Med.1995;155:2465‐2471.
- ,,.Current concepts in geriatrics: instruments for the functional assessment of older patients.N Engl J Med.1990;322:1207‐1214.
- ,,,,,.Comparison of subjective ratings of function with observed functional ability of frail older persons.Am J Public Health.1991;81:1127‐1130.
- ,,,,,.Diagnosis‐related group‐adjusted hospital costs are higher in older medical patients with lower functional status.J Am Geriatr Soc.2003;51:1729‐1734.
- UAB Hospital data,2005.
- .Physical restraints in the practice of medicine. Current concepts.Arch Intern Med.1992;152:2203‐2206.
- et al.Prevalence and patterns of physical restraint use in the acute care setting.J Nurs Adm.1998;28:19‐24.
- Guideline for the prevention of falls in older persons.J Am Geriatr Soc.2001;49:664‐672.
Functional decline, defined as loss of the ability to care for oneself, commonly occurs during hospitalization, being experienced by up to 65% of older adults.14 Frequently, recovery of functional ability does not occur by the time of discharge from the hospital, despite resolution of the medical condition responsible for admission to the hospital.1, 5 Causes of the declining ability to perform activities of daily living (ADLs) are multiple and include both acute illness and adverse events associated with hospitalization.4, 6, 7 The functional decline experienced by older persons during hospitalization is a strong predictor of length of stay, nursing home placement, and mortality.8 Loss of ambulatory ability specifically has been noted to occur in 17%‐65% of hospitalized older patients, usually within days of admission, with few recovering this ability prior to discharge.2, 4, 5, 9 Importantly, ambulatory ability is significantly associated with a decline in other ADLs.9
Although several studies have explored risk factors associated with general functional decline during hospitalization,4, 7, 10, 11 only one study specifically examined risk factors associated with loss of ambulatory ability. In a cohort of participants who were largely independently performing ADLs on admission to the hospital, Mahoney et al. found age 85 years, white race, use of a walker, and functional impairment prior to being hospitalized were significant predictors of newly having walking dependence.12
Ambulatory ability could also be affected by a variety of other factors not examined in the Mahoney et al. study; these include severity of illness, bed rest, and hospital‐related treatments such as restraints or urinary catheters. In addition, little is known about predictors of recovery of ambulatory ability in patients expected to have activity limitations on admission who are dependent in most or all ADLs. The deconditioning associated with bed rest and reduced mobility has been described as one of the most predictable causes of functional decline, including loss of ambulatory ability, observed in older hospitalized patients.13 In one study, patients whose activity was limited to a bed or chair during hospitalization were 5.6 times more likely to develop functional decline than those who walked at all, even after controlling for other covariates including severity of illness and comorbidity.14 Those patients with both activity limitations and dependence in most or all ADLs represent an important subset of all hospitalized older patients who might be expected to be at higher risk of developing new ambulatory dependence. The ability to identify, at admission, those patients who will recover ambulatory ability may have important implications for discharge planning as well as for the development of preventive strategies.
The objective of the present study was to define patient demographic, illness severity, comorbid illness, and hospital‐related variables that are independent and significant predictors of regaining ambulatory ability prior to hospital discharge in a cohort of patients who had significant activity limitations and functional impairment at the time of admission to the hospital.
METHODS
Study Design
This study was part of a larger prospective cohort study conducted at a tertiary‐care teaching hospital that examined risk factors for pressure ulcers among patients with activity limitations.15 All patients admitted to the medical wards from December 1988 to June 1991 were screened, and research nurses confirmed eligibility within 3 days. Candidates were at least 55 years of age and were expected to be limited to a bed or chair for at least the first 5 days of hospitalization according to the assessments of their primary nurses. Participants were also eligible if admitted with a hip fracture. In all, 286 patients were included in the present analysis. These patients were included because they had been ambulatory in the 4 weeks before admission, and so they would be expected to have the potential to either maintain or regain ambulatory ability prior to discharge. Thirty‐one patients who otherwise would have been eligible for the present analysis were excluded because they had unusually long hospital stays, defined as longer than 31 days. These patients were excluded in order to remove outliers of this variable and because only the effects of relatively acute hospitalization were being studied. Study procedures were approved by the Institutional Review Board of the University of Alabama at Birmingham (UAB).
Baseline Data Collection
For each patient, baseline data were collected from interviews with physicians and nurses at admission and were abstracted from the medical record. Chart review provided information on length of stay; the demographic variables age, sex, race, and marital status; and the presence of specified medical conditions or diseases that might affect a patient's ability to ambulate. These medical conditions and diseases were hip fracture, hypotension, deep vein thrombosis, major surgery and neurological disease defined as a history of hemiparesis regardless of cause, cerebrovascular accident without residual weakness, transient ischemic attack, Parkinson's disease, or seizures. Quartiles of the Comorbidity Damage Index of the Charlson16 and the Acute Physiology Score (APS) of the APACHE II17 were used as global measures of comorbidity and illness severity, respectively. Each patient's primary physician was asked to estimate the patient's life expectancy on a 4‐point scale (<6 months, from 6 months to <1 year, 1‐5 years, >5 years). It was ascertained from each patient's primary nurse whether a urinary catheter or physical restraints were in use. Confusion was assessed according to how nurses gauged patient mental status on a 4‐point scale, from 1 = stuporous/comatose to 4 = alert, defined as being fully responsive and oriented. Any score other than 4 was coded as having altered mental status. Nurses classified patients as either independent or dependent for each of the 7 ADLs (feeding, bathing, dressing, grooming, toileting, transferring, and walking).18 Admission bed mobility was assessed by nurse rating on a 4‐point scale, from 1 = immobile to 4 = fully mobile.
In‐Hospital Outcome Assessment
Throughout the hospitalization, the primary nurse of each patient was interviewed weekly about whether the patient was expected to remain limited to a bed or chair for at least the next week. Whether patients had regained mobility was determined on the basis of the nurses' reports. Patients were defined as ambulatory if their activity was no longer confined to a bed or chair. Patients who died were included in the analysis, as the purpose of this study was to determine characteristics at admission that would predict who would likely regain ambulatory ability.
Statistical Analysis
Appropriate descriptive statistics, including means, standard deviations, and proportions, were used to describe the characteristics of those in the study group. For each variable of interest, logistic regression with dummy coding was used to examine unadjusted relationships with recovery of ambulatory ability. The independent contribution of each of the predictor variables to recovery of ambulatory ability was then tested in a series of multivariate logistic regression models that sequentially adjusted for factors considered important covariables. This was done by adding groups of similar covariates into the model in separate stages. These covariate groups were length of stay, demographics, global health measures and specific medical problems, hospital‐related factors, and admission bed mobility. All statistical analyses were performed using the Statistical Analyses System (SAS Institute, Cary, NC), and P < .05 was considered statistically significant.
RESULTS
For this study, 286 participants met all eligibility criteria, with 119 (42%) regaining ambulatory ability during hospitalization. Mean age of study participants was 73 9 years, with 12% of participants more than 85 years old. On admission, 214 patients (75%) were dependent in all 7 ADLs. Mean length of stay ( SD) was 12.3 6.5 days, with a range of 1‐31 days. Table 1 presents the cohort characteristics and the unadjusted effects of each variable for predicting those who did and did not recover ambulatory ability by characteristic. The P value of a variable in Table 1 indicates how significant that variable was, as determined with a simple logistic regression analysis. The unadjusted odds ratio of each variable is presented in Table 2 in order to facilitate comparisons with the adjusted odds ratios from the multivariate models. Analysis of the effects of the unadjusted single variables showed that age was a significant predictor, with older patients less likely to regain ambulatory ability. Several global health measures and hospital‐related factors were also significantly different between those who recovered and those who did not recover ambulatory ability, as summarized in Table 1. Importantly, length of stay was not significantly associated with recovery.
| Characteristic | No. of Subjects | Regained ambulatory ability | P valuea | ||
|---|---|---|---|---|---|
| Yes N (%) | No N(%) | ||||
| |||||
| Demographics | |||||
| Age | 55‐64 years | 46 | 19 (41) | 27 (59) | .009 |
| 65‐74 years | 118 | 63 (53) | 55 (47) | ||
| 75‐84 years | 88 | 29 (33) | 59 (67) | ||
| 85 years | 34 | 8 (24) | 26 (76) | ||
| Sex | Female | 163 | 72 (44) | 91 (56) | .31 |
| Male | 123 | 47 (38) | 76 (62) | ||
| Race | White | 168 | 72 (43) | 96 (57) | .61 |
| Black/other | 118 | 47 (40) | 71 (60) | ||
| Married | 164 | 64 (39) | 55 (45) | .30 | |
| Not married | 122 | 55 (61) | 67 (55) | ||
| Global health measures/specific medical problems | |||||
| Life expectancy | <6 months | 28 | 3 (11) | 25 (89) | < .0001 |
| 6 months‐1 year | 43 | 11 (26) | 32 (74) | ||
| 1‐5 years | 127 | 47 (37) | 80 (63) | ||
| >5 years | 88 | 58 (66) | 30 (34) | ||
| Acute Physiology Score | 0‐6 | 71 | 35 (49) | 36 (51) | < .0001 |
| 7‐10 | 83 | 46 (55) | 37 (45) | ||
| 11‐13 | 62 | 19 (31) | 43 (69) | ||
| 14+ | 61 | 13 (21) | 48 (79) | ||
| Comorbidity Index | 0‐1.0 | 89 | 48 (54) | 41 (46) | .01 |
| 1.1‐2.5 | 65 | 24 (37) | 41 (63) | ||
| 2.6‐4.0 | 55 | 23 (42) | 32 (58) | ||
| 4+ | 63 | 20 (32) | 43 (68) | ||
| Hip fracture present | Yes | 30 | 14 (47) | 16 (53) | .55 |
| No | 256 | 105 (41) | 151 (59) | ||
| Neurological disease present | Yes | 152 | 49 (32) | 103 (68) | .0007 |
| No | 134 | 70 (52) | 64 (48) | ||
| Hypotension present | Yes | 35 | 18 (51) | 17 (49) | .21 |
| No | 251 | 101 (40) | 150 (60) | ||
| Deep vein thrombosis present | Yes | 9 | 1 (11) | 8 (89) | .10 |
| No | 277 | 118 (43) | 159 (57) | ||
| Had major surgery | Yes | 73 | 47 (64) | 26 (36) | < .0001 |
| No | 213 | 72 (34) | 141 (66) | ||
| Level of consciousness | Altered mental status | 123 | 30 (24) | 93 (76) | < .0001 |
| No altered mental status | 163 | 89 (55) | 74 (45) | ||
| Hospital‐related factors | |||||
| Urinary catheter | Yes | 172 | 66 (38) | 106 (62) | .17 |
| No | 114 | 53 (46) | 61 (54) | ||
| Restraints in use | Yes | 93 | 21 (23) | 72 (77) | < .0001 |
| No | 193 | 98 (51) | 95 (49) | ||
| Initial bed mobility | Immobile | 25 | 5 (20) | 20 (80) | < .0001 |
| Very limited | 100 | 26 (26) | 74 (74) | ||
| Slightly limited | 131 | 73 (56) | 58 (44) | ||
| Fully mobile | 30 | 15 (50) | 15 (50) | ||
| Variables | Model 1 Demographics ORa (95% CI) | Model 2 Global health/specific diseases OR (95% CI) | Model 3 Hospital factors OR (95% CI) | Model 4 Mobility OR (95% CI) | Unadjusted Results OR (95% CI) |
|---|---|---|---|---|---|
| |||||
| Length of stay | 0.9 (0.9‐0.99)b | 1.0 (0.9‐1.0) | 1.0 (0.9‐1.0) | 1.0 (0.9‐1.0) | 1.0 (0.9‐1.0) |
| Age | 0.6 (0.4‐0.8)b | 0.8 (0.5‐1.1) | 0.7 (0.5‐1.1) | 0.7 (0.5‐1.1) | 0.7 (0.5‐0.9)b |
| Sexfemale | 1.1 (0.7‐1.9) | 0.9 (0.5‐1.7) | 0.8 (0.4‐1.6) | 0.9 (0.4‐1.6) | 1.3 (0.8‐2.1) |
| Racewhite | 1.3 (0.8‐2.2) | 1.3 (0.7‐2.5) | 1.3 (0.7‐2.4) | 1.2 (0.6‐2.2) | 1.1 (0.7‐1.8) |
| Not married | 1.7 (1.0‐2.9) | 2.5 (1.3‐5.0)b | 2.7 (1.3‐5.5)b | 3.0 (1.4‐6.2)b | 1.3 (0.8‐2.1) |
| APS quartilesc | 0.7 (0.5‐1.0)b | 0.8 (0.5‐1.0) | 0.8 (0.6‐1.1) | 0.6 (0.5‐0.8)b | |
| MD‐rated life expectancyc | 1.9 (1.3‐2.8)b | 1.9 (1.3‐2.9)b | 1.9 (1.3‐2.8)b | 2.5 (1.8‐3.5)b | |
| Comorbidity quartilesc | 1.0 (0.7‐1.3) | 1.0 (0.7‐1.3) | 1.0 (0.7‐1.3) | 0.8 (0.6‐0.9)b | |
| No deep vein thrombosis | 14.8 (1.6‐138.1)b | 13.1 (1.4‐121.1)b | 11.4 (1.2‐105.1)b | 5.9 (0.7‐48.1) | |
| No hip fracture | 2.1 (0.8‐5.6) | 2.1 (0.8‐6.0) | 2.2 (0.8‐6.3) | 0.8 (0.4‐1.7) | |
| No neurological diseasesc | 1.7 (0.9‐3.3) | 1.7 (0.9‐3.3) | 1.7 (0.9‐3.4) | 2.3 (1.4‐3.7)b | |
| No hypotension | 0.8 (0.3‐2.1) | 0.8 (0.3‐2.2) | 0.8 (0.3‐2.3) | 0.6 (0.3‐1.3) | |
| Having major surgery | 1.7 (0.8‐3.6) | 1.8 (0.8‐3.9) | 1.9 (0.9‐4.0) | 3.5 (2.0‐6.2)b | |
| Having normal mental statusc | 2.1 (1.1‐4.0)b | 2.0 (0.8‐4.0) | 1.6 (0.8‐3.3) | 3.7 (2.2‐6.2)b | |
| No urinary catheter | 2.1 (1.0‐4.2)b | 2.2 (1.2‐5.5)b | 1.4 (0.9‐2.3) | ||
| Not in restraints | 2.2 (1.0‐4.6)b | 2.5 (1.2‐5.5)b | 3.5 (2.0‐6.2)b | ||
| Bed mobility on admissionc | 1.7 (1.1‐2.6)b | 2.0 (1.5‐2.8)b | |||
Table 2 shows the effects of adjusting the model for important covariables in a sequential fashion. Model 1 shows that longer length of stay and older age are associated with reduced odds of regaining ambulatory ability after adjusting for other demographic variables. However, age and length of stay were no longer significant after adjusting for global health measures and specific medical problems (Model 2). As demonstrated by the full model (Model 4), the participants who regained ambulatory ability were more likely to be unmarried, have a longer physician‐rated life expectancy, not have a diagnosis of deep vein thrombosis, not have physical restraints or a urinary catheter in use, and have greater bed mobility at admission.
Predictors that remained significant in the final multivariate model (Model 4) were summed in order to determine the proportion of patients who had one predictor versus those who had more than one predictor. Figure 1 shows the percentage of those who recovered ambulatory ability according to number of predictors, ranging from one to all 6 predictors. The results demonstrate a graded relationship, with number of predictors positively correlated with percentage of those who recovered ambulatory ability (P < .0001).
Patients who died prior to discharge were more likely to be male and have altered mental status, a urinary catheter, restraints, a shorter physician‐rated life expectancy, lower admission bed mobility, and increased severity of illness compared to those who survived. When the 34 patients who died were excluded from the multivariate analysis, the factors predicting ambulatory recovery were unchanged from those reported in Model 4 of Table 2.
DISCUSSION
In this study of older hospitalized patients, approximately 40% were able to regain their ambulatory ability despite being limited to the bed or chair on admission, having significant severity of illness, high level of use of restraints, and functional dependence on admission. Predictors of regaining ambulatory ability were identifiable at hospital admission. These predictors also were correlated with recovery of ambulatory ability in a graded fashion, lending support for the direct relationship between these predictors and recovery.
Physician‐rated life expectancy, a simple assessment that combines a physician's medical knowledge and clinical acumen, was demonstrated in our study to be a better predictor of recovery of ambulatory ability than more elaborate measures like the APACHE II17 and Charlson Comorbidity Index.16 This assessment can easily be done at the bedside and may help to guide discharge planning for the hospitalist physician. Nurse‐rated bed mobility at time of admission, which may reflect aspects of illness severity and cognitive status, was also able to predict recovery.
Of the 6 factors found to be independent predictors of recovery of ambulatory ability, 4 were related to mobility: lack of a DVT diagnosis, absence of a urinary catheter, absence of restraints, and nurse‐rated bed mobility at admission. In the group of patients initially expected to be confined to a bed or chair, those with additional mobility‐reducing factors, such as catheters and restraints, were less likely to recover, even after controlling for illness severity and comorbidity.
Marital status was not found to predict recovery of ambulatory ability in the simple unadjusted bivariate analysis, but after adjusting for other demographic, global health, and disease‐related variables, those who were unmarried were more likely to recover ambulatory ability. These interesting covariate‐adjusted effects for marital status have not been previously reported in the literature. One large study of the impact of marital status on hospital outcomes demonstrated those who were unmarried were more likely to require discharge to a nursing home and had slightly higher hospital costs and longer length of stay.19 Our findings may be related to such patients lacking support other than from themselves, with the possibility of being discharged to a nursing home an incentive to get up and walk.
Although age, race, and previous ADL status were found to be significant predictors in a previous study,12 we did not find this in our sample. This may be because, unlike in other studies, most of our patients had significant functional impairment on admission. The importance of age in our cohort disappeared when illness severity and comorbidities were added to the model.
The strengths of this study include having comprehensive patient‐related data on demographic, illness severity, comorbidity, and hospital‐related factors available, which enabled detailed analyses of predictors for regaining ambulatory ability. In particular, the ability to examine such factors as bed rest and hospital‐related treatments like restraint and catheter use, enabled this study to add significantly to the available knowledge of predictors of ambulatory recovery. The use of nurse interviews to obtain patient‐related data has been demonstrated in previous studies to be a preferred method of collecting data when compared to patient self‐report.20, 21 Examination of these factors in a cohort of patients who would be expected to be at very high risk for remaining bed‐ or chair bound, given their admission activity limitations and functional dependence, is also noteworthy.
Several important limitations deserve comment. Since the data were collected, average length of hospital stay generally has decreased. However, the patient population we studied continue to experience longer hospital stays than functionally intact patients. One recent study demonstrated that the length of hospital stay of patients who were dependent in one or more ADLs on admission was 35% longer than that of those not ADL dependent at admission.22 Seventy‐five percent of those in the present study cohort were dependent in all 7 ADLs and had a mean length of stay of 12.3 days. Despite the longer mean length of stay, 70% of those in the study cohort were discharged within 2 weeks of admission. In the university hospital where this research was conducted, mean length of stay ( SD) in 2004 was 6 8.6 days, but 10% of patients 55 years of age and older remained in the hospital for more than 2 weeks.23 This suggests there continue to be long‐stay patients in the current hospital environment, to which these findings may apply.
Standards of practice, such as for use of restraints, have also changed. In 1992, between 7.4% and 17% of all hospitalized medical patients were restrained, according to a literature review.24 A 1998 survey of 3 hospitals found the prevalence of restraints still ranged from 3.9% to 8.2% and noted that among the most common reasons reported for using restraints were to prevent patient disruption of therapy, to confine confused patients, and to reduce the number of falls.25 Thus, our study cohort would be more likely to be restrained, even in the current hospital environment, given that 43% of the cohort had altered mental status and that most were at risk for falls because of their poor functional status.26
Nevertheless, even though the use of restraints has declined since the data were collected for this study, this should affect neither the internal validity of the results nor the ability to address the question of what factors predict recovery of ambulatory ability. Indeed, the inclusion of patients on whom restraints are frequently used emphasizes the need for continued diligence in creating a restraint‐free environment in our hospitals. Data about the use of physical therapy services were not available in the study. Therefore, it is unknown to what extent the use of these services encouraged ambulation.
In this observational study, we found 6 factors associated with regaining ambulatory ability among hospitalized patients who had significant activity limitations and functional dependence on admission. These findings suggest predictors easily assessed by the hospitalist physician can help to identify those patients most likely to recover ambulatory ability prior to discharge. It also demonstrates the importance of mobility in maintaining function, given that many of the predictors are factors that either impede mobility such as restraints and urinary catheters or measure mobility such as admission bed mobility. Last, recognizing physician‐rated life expectancy as a strong independent predictor of recovery of ambulatory ability should encourage hospitalist physicians to continue to use their greatest tool, their clinical judgment, to determine who will recover ambulatory ability.
As most of these predictors can be identified on admission or shortly thereafter, these factors may be useful in helping physicians and other health care providers to predict the potential patients have to recover ambulatory ability. This information may help physicians identify patients who might benefit from early mobility programs, placement on hospital units where mobility will be enhanced, or the early initiation of discharge planning for those patients identified as unlikely to regain ambulation ability. In addition, addressing factors that are potentially modifiable, such as low bed mobility and the use of urinary catheters and restraints may not only improve the chance of recovering ambulatory ability but would also improve the quality of care provided to older patients.
Functional decline, defined as loss of the ability to care for oneself, commonly occurs during hospitalization, being experienced by up to 65% of older adults.14 Frequently, recovery of functional ability does not occur by the time of discharge from the hospital, despite resolution of the medical condition responsible for admission to the hospital.1, 5 Causes of the declining ability to perform activities of daily living (ADLs) are multiple and include both acute illness and adverse events associated with hospitalization.4, 6, 7 The functional decline experienced by older persons during hospitalization is a strong predictor of length of stay, nursing home placement, and mortality.8 Loss of ambulatory ability specifically has been noted to occur in 17%‐65% of hospitalized older patients, usually within days of admission, with few recovering this ability prior to discharge.2, 4, 5, 9 Importantly, ambulatory ability is significantly associated with a decline in other ADLs.9
Although several studies have explored risk factors associated with general functional decline during hospitalization,4, 7, 10, 11 only one study specifically examined risk factors associated with loss of ambulatory ability. In a cohort of participants who were largely independently performing ADLs on admission to the hospital, Mahoney et al. found age 85 years, white race, use of a walker, and functional impairment prior to being hospitalized were significant predictors of newly having walking dependence.12
Ambulatory ability could also be affected by a variety of other factors not examined in the Mahoney et al. study; these include severity of illness, bed rest, and hospital‐related treatments such as restraints or urinary catheters. In addition, little is known about predictors of recovery of ambulatory ability in patients expected to have activity limitations on admission who are dependent in most or all ADLs. The deconditioning associated with bed rest and reduced mobility has been described as one of the most predictable causes of functional decline, including loss of ambulatory ability, observed in older hospitalized patients.13 In one study, patients whose activity was limited to a bed or chair during hospitalization were 5.6 times more likely to develop functional decline than those who walked at all, even after controlling for other covariates including severity of illness and comorbidity.14 Those patients with both activity limitations and dependence in most or all ADLs represent an important subset of all hospitalized older patients who might be expected to be at higher risk of developing new ambulatory dependence. The ability to identify, at admission, those patients who will recover ambulatory ability may have important implications for discharge planning as well as for the development of preventive strategies.
The objective of the present study was to define patient demographic, illness severity, comorbid illness, and hospital‐related variables that are independent and significant predictors of regaining ambulatory ability prior to hospital discharge in a cohort of patients who had significant activity limitations and functional impairment at the time of admission to the hospital.
METHODS
Study Design
This study was part of a larger prospective cohort study conducted at a tertiary‐care teaching hospital that examined risk factors for pressure ulcers among patients with activity limitations.15 All patients admitted to the medical wards from December 1988 to June 1991 were screened, and research nurses confirmed eligibility within 3 days. Candidates were at least 55 years of age and were expected to be limited to a bed or chair for at least the first 5 days of hospitalization according to the assessments of their primary nurses. Participants were also eligible if admitted with a hip fracture. In all, 286 patients were included in the present analysis. These patients were included because they had been ambulatory in the 4 weeks before admission, and so they would be expected to have the potential to either maintain or regain ambulatory ability prior to discharge. Thirty‐one patients who otherwise would have been eligible for the present analysis were excluded because they had unusually long hospital stays, defined as longer than 31 days. These patients were excluded in order to remove outliers of this variable and because only the effects of relatively acute hospitalization were being studied. Study procedures were approved by the Institutional Review Board of the University of Alabama at Birmingham (UAB).
Baseline Data Collection
For each patient, baseline data were collected from interviews with physicians and nurses at admission and were abstracted from the medical record. Chart review provided information on length of stay; the demographic variables age, sex, race, and marital status; and the presence of specified medical conditions or diseases that might affect a patient's ability to ambulate. These medical conditions and diseases were hip fracture, hypotension, deep vein thrombosis, major surgery and neurological disease defined as a history of hemiparesis regardless of cause, cerebrovascular accident without residual weakness, transient ischemic attack, Parkinson's disease, or seizures. Quartiles of the Comorbidity Damage Index of the Charlson16 and the Acute Physiology Score (APS) of the APACHE II17 were used as global measures of comorbidity and illness severity, respectively. Each patient's primary physician was asked to estimate the patient's life expectancy on a 4‐point scale (<6 months, from 6 months to <1 year, 1‐5 years, >5 years). It was ascertained from each patient's primary nurse whether a urinary catheter or physical restraints were in use. Confusion was assessed according to how nurses gauged patient mental status on a 4‐point scale, from 1 = stuporous/comatose to 4 = alert, defined as being fully responsive and oriented. Any score other than 4 was coded as having altered mental status. Nurses classified patients as either independent or dependent for each of the 7 ADLs (feeding, bathing, dressing, grooming, toileting, transferring, and walking).18 Admission bed mobility was assessed by nurse rating on a 4‐point scale, from 1 = immobile to 4 = fully mobile.
In‐Hospital Outcome Assessment
Throughout the hospitalization, the primary nurse of each patient was interviewed weekly about whether the patient was expected to remain limited to a bed or chair for at least the next week. Whether patients had regained mobility was determined on the basis of the nurses' reports. Patients were defined as ambulatory if their activity was no longer confined to a bed or chair. Patients who died were included in the analysis, as the purpose of this study was to determine characteristics at admission that would predict who would likely regain ambulatory ability.
Statistical Analysis
Appropriate descriptive statistics, including means, standard deviations, and proportions, were used to describe the characteristics of those in the study group. For each variable of interest, logistic regression with dummy coding was used to examine unadjusted relationships with recovery of ambulatory ability. The independent contribution of each of the predictor variables to recovery of ambulatory ability was then tested in a series of multivariate logistic regression models that sequentially adjusted for factors considered important covariables. This was done by adding groups of similar covariates into the model in separate stages. These covariate groups were length of stay, demographics, global health measures and specific medical problems, hospital‐related factors, and admission bed mobility. All statistical analyses were performed using the Statistical Analyses System (SAS Institute, Cary, NC), and P < .05 was considered statistically significant.
RESULTS
For this study, 286 participants met all eligibility criteria, with 119 (42%) regaining ambulatory ability during hospitalization. Mean age of study participants was 73 9 years, with 12% of participants more than 85 years old. On admission, 214 patients (75%) were dependent in all 7 ADLs. Mean length of stay ( SD) was 12.3 6.5 days, with a range of 1‐31 days. Table 1 presents the cohort characteristics and the unadjusted effects of each variable for predicting those who did and did not recover ambulatory ability by characteristic. The P value of a variable in Table 1 indicates how significant that variable was, as determined with a simple logistic regression analysis. The unadjusted odds ratio of each variable is presented in Table 2 in order to facilitate comparisons with the adjusted odds ratios from the multivariate models. Analysis of the effects of the unadjusted single variables showed that age was a significant predictor, with older patients less likely to regain ambulatory ability. Several global health measures and hospital‐related factors were also significantly different between those who recovered and those who did not recover ambulatory ability, as summarized in Table 1. Importantly, length of stay was not significantly associated with recovery.
| Characteristic | No. of Subjects | Regained ambulatory ability | P valuea | ||
|---|---|---|---|---|---|
| Yes N (%) | No N(%) | ||||
| |||||
| Demographics | |||||
| Age | 55‐64 years | 46 | 19 (41) | 27 (59) | .009 |
| 65‐74 years | 118 | 63 (53) | 55 (47) | ||
| 75‐84 years | 88 | 29 (33) | 59 (67) | ||
| 85 years | 34 | 8 (24) | 26 (76) | ||
| Sex | Female | 163 | 72 (44) | 91 (56) | .31 |
| Male | 123 | 47 (38) | 76 (62) | ||
| Race | White | 168 | 72 (43) | 96 (57) | .61 |
| Black/other | 118 | 47 (40) | 71 (60) | ||
| Married | 164 | 64 (39) | 55 (45) | .30 | |
| Not married | 122 | 55 (61) | 67 (55) | ||
| Global health measures/specific medical problems | |||||
| Life expectancy | <6 months | 28 | 3 (11) | 25 (89) | < .0001 |
| 6 months‐1 year | 43 | 11 (26) | 32 (74) | ||
| 1‐5 years | 127 | 47 (37) | 80 (63) | ||
| >5 years | 88 | 58 (66) | 30 (34) | ||
| Acute Physiology Score | 0‐6 | 71 | 35 (49) | 36 (51) | < .0001 |
| 7‐10 | 83 | 46 (55) | 37 (45) | ||
| 11‐13 | 62 | 19 (31) | 43 (69) | ||
| 14+ | 61 | 13 (21) | 48 (79) | ||
| Comorbidity Index | 0‐1.0 | 89 | 48 (54) | 41 (46) | .01 |
| 1.1‐2.5 | 65 | 24 (37) | 41 (63) | ||
| 2.6‐4.0 | 55 | 23 (42) | 32 (58) | ||
| 4+ | 63 | 20 (32) | 43 (68) | ||
| Hip fracture present | Yes | 30 | 14 (47) | 16 (53) | .55 |
| No | 256 | 105 (41) | 151 (59) | ||
| Neurological disease present | Yes | 152 | 49 (32) | 103 (68) | .0007 |
| No | 134 | 70 (52) | 64 (48) | ||
| Hypotension present | Yes | 35 | 18 (51) | 17 (49) | .21 |
| No | 251 | 101 (40) | 150 (60) | ||
| Deep vein thrombosis present | Yes | 9 | 1 (11) | 8 (89) | .10 |
| No | 277 | 118 (43) | 159 (57) | ||
| Had major surgery | Yes | 73 | 47 (64) | 26 (36) | < .0001 |
| No | 213 | 72 (34) | 141 (66) | ||
| Level of consciousness | Altered mental status | 123 | 30 (24) | 93 (76) | < .0001 |
| No altered mental status | 163 | 89 (55) | 74 (45) | ||
| Hospital‐related factors | |||||
| Urinary catheter | Yes | 172 | 66 (38) | 106 (62) | .17 |
| No | 114 | 53 (46) | 61 (54) | ||
| Restraints in use | Yes | 93 | 21 (23) | 72 (77) | < .0001 |
| No | 193 | 98 (51) | 95 (49) | ||
| Initial bed mobility | Immobile | 25 | 5 (20) | 20 (80) | < .0001 |
| Very limited | 100 | 26 (26) | 74 (74) | ||
| Slightly limited | 131 | 73 (56) | 58 (44) | ||
| Fully mobile | 30 | 15 (50) | 15 (50) | ||
| Variables | Model 1 Demographics ORa (95% CI) | Model 2 Global health/specific diseases OR (95% CI) | Model 3 Hospital factors OR (95% CI) | Model 4 Mobility OR (95% CI) | Unadjusted Results OR (95% CI) |
|---|---|---|---|---|---|
| |||||
| Length of stay | 0.9 (0.9‐0.99)b | 1.0 (0.9‐1.0) | 1.0 (0.9‐1.0) | 1.0 (0.9‐1.0) | 1.0 (0.9‐1.0) |
| Age | 0.6 (0.4‐0.8)b | 0.8 (0.5‐1.1) | 0.7 (0.5‐1.1) | 0.7 (0.5‐1.1) | 0.7 (0.5‐0.9)b |
| Sexfemale | 1.1 (0.7‐1.9) | 0.9 (0.5‐1.7) | 0.8 (0.4‐1.6) | 0.9 (0.4‐1.6) | 1.3 (0.8‐2.1) |
| Racewhite | 1.3 (0.8‐2.2) | 1.3 (0.7‐2.5) | 1.3 (0.7‐2.4) | 1.2 (0.6‐2.2) | 1.1 (0.7‐1.8) |
| Not married | 1.7 (1.0‐2.9) | 2.5 (1.3‐5.0)b | 2.7 (1.3‐5.5)b | 3.0 (1.4‐6.2)b | 1.3 (0.8‐2.1) |
| APS quartilesc | 0.7 (0.5‐1.0)b | 0.8 (0.5‐1.0) | 0.8 (0.6‐1.1) | 0.6 (0.5‐0.8)b | |
| MD‐rated life expectancyc | 1.9 (1.3‐2.8)b | 1.9 (1.3‐2.9)b | 1.9 (1.3‐2.8)b | 2.5 (1.8‐3.5)b | |
| Comorbidity quartilesc | 1.0 (0.7‐1.3) | 1.0 (0.7‐1.3) | 1.0 (0.7‐1.3) | 0.8 (0.6‐0.9)b | |
| No deep vein thrombosis | 14.8 (1.6‐138.1)b | 13.1 (1.4‐121.1)b | 11.4 (1.2‐105.1)b | 5.9 (0.7‐48.1) | |
| No hip fracture | 2.1 (0.8‐5.6) | 2.1 (0.8‐6.0) | 2.2 (0.8‐6.3) | 0.8 (0.4‐1.7) | |
| No neurological diseasesc | 1.7 (0.9‐3.3) | 1.7 (0.9‐3.3) | 1.7 (0.9‐3.4) | 2.3 (1.4‐3.7)b | |
| No hypotension | 0.8 (0.3‐2.1) | 0.8 (0.3‐2.2) | 0.8 (0.3‐2.3) | 0.6 (0.3‐1.3) | |
| Having major surgery | 1.7 (0.8‐3.6) | 1.8 (0.8‐3.9) | 1.9 (0.9‐4.0) | 3.5 (2.0‐6.2)b | |
| Having normal mental statusc | 2.1 (1.1‐4.0)b | 2.0 (0.8‐4.0) | 1.6 (0.8‐3.3) | 3.7 (2.2‐6.2)b | |
| No urinary catheter | 2.1 (1.0‐4.2)b | 2.2 (1.2‐5.5)b | 1.4 (0.9‐2.3) | ||
| Not in restraints | 2.2 (1.0‐4.6)b | 2.5 (1.2‐5.5)b | 3.5 (2.0‐6.2)b | ||
| Bed mobility on admissionc | 1.7 (1.1‐2.6)b | 2.0 (1.5‐2.8)b | |||
Table 2 shows the effects of adjusting the model for important covariables in a sequential fashion. Model 1 shows that longer length of stay and older age are associated with reduced odds of regaining ambulatory ability after adjusting for other demographic variables. However, age and length of stay were no longer significant after adjusting for global health measures and specific medical problems (Model 2). As demonstrated by the full model (Model 4), the participants who regained ambulatory ability were more likely to be unmarried, have a longer physician‐rated life expectancy, not have a diagnosis of deep vein thrombosis, not have physical restraints or a urinary catheter in use, and have greater bed mobility at admission.
Predictors that remained significant in the final multivariate model (Model 4) were summed in order to determine the proportion of patients who had one predictor versus those who had more than one predictor. Figure 1 shows the percentage of those who recovered ambulatory ability according to number of predictors, ranging from one to all 6 predictors. The results demonstrate a graded relationship, with number of predictors positively correlated with percentage of those who recovered ambulatory ability (P < .0001).
Patients who died prior to discharge were more likely to be male and have altered mental status, a urinary catheter, restraints, a shorter physician‐rated life expectancy, lower admission bed mobility, and increased severity of illness compared to those who survived. When the 34 patients who died were excluded from the multivariate analysis, the factors predicting ambulatory recovery were unchanged from those reported in Model 4 of Table 2.
DISCUSSION
In this study of older hospitalized patients, approximately 40% were able to regain their ambulatory ability despite being limited to the bed or chair on admission, having significant severity of illness, high level of use of restraints, and functional dependence on admission. Predictors of regaining ambulatory ability were identifiable at hospital admission. These predictors also were correlated with recovery of ambulatory ability in a graded fashion, lending support for the direct relationship between these predictors and recovery.
Physician‐rated life expectancy, a simple assessment that combines a physician's medical knowledge and clinical acumen, was demonstrated in our study to be a better predictor of recovery of ambulatory ability than more elaborate measures like the APACHE II17 and Charlson Comorbidity Index.16 This assessment can easily be done at the bedside and may help to guide discharge planning for the hospitalist physician. Nurse‐rated bed mobility at time of admission, which may reflect aspects of illness severity and cognitive status, was also able to predict recovery.
Of the 6 factors found to be independent predictors of recovery of ambulatory ability, 4 were related to mobility: lack of a DVT diagnosis, absence of a urinary catheter, absence of restraints, and nurse‐rated bed mobility at admission. In the group of patients initially expected to be confined to a bed or chair, those with additional mobility‐reducing factors, such as catheters and restraints, were less likely to recover, even after controlling for illness severity and comorbidity.
Marital status was not found to predict recovery of ambulatory ability in the simple unadjusted bivariate analysis, but after adjusting for other demographic, global health, and disease‐related variables, those who were unmarried were more likely to recover ambulatory ability. These interesting covariate‐adjusted effects for marital status have not been previously reported in the literature. One large study of the impact of marital status on hospital outcomes demonstrated those who were unmarried were more likely to require discharge to a nursing home and had slightly higher hospital costs and longer length of stay.19 Our findings may be related to such patients lacking support other than from themselves, with the possibility of being discharged to a nursing home an incentive to get up and walk.
Although age, race, and previous ADL status were found to be significant predictors in a previous study,12 we did not find this in our sample. This may be because, unlike in other studies, most of our patients had significant functional impairment on admission. The importance of age in our cohort disappeared when illness severity and comorbidities were added to the model.
The strengths of this study include having comprehensive patient‐related data on demographic, illness severity, comorbidity, and hospital‐related factors available, which enabled detailed analyses of predictors for regaining ambulatory ability. In particular, the ability to examine such factors as bed rest and hospital‐related treatments like restraint and catheter use, enabled this study to add significantly to the available knowledge of predictors of ambulatory recovery. The use of nurse interviews to obtain patient‐related data has been demonstrated in previous studies to be a preferred method of collecting data when compared to patient self‐report.20, 21 Examination of these factors in a cohort of patients who would be expected to be at very high risk for remaining bed‐ or chair bound, given their admission activity limitations and functional dependence, is also noteworthy.
Several important limitations deserve comment. Since the data were collected, average length of hospital stay generally has decreased. However, the patient population we studied continue to experience longer hospital stays than functionally intact patients. One recent study demonstrated that the length of hospital stay of patients who were dependent in one or more ADLs on admission was 35% longer than that of those not ADL dependent at admission.22 Seventy‐five percent of those in the present study cohort were dependent in all 7 ADLs and had a mean length of stay of 12.3 days. Despite the longer mean length of stay, 70% of those in the study cohort were discharged within 2 weeks of admission. In the university hospital where this research was conducted, mean length of stay ( SD) in 2004 was 6 8.6 days, but 10% of patients 55 years of age and older remained in the hospital for more than 2 weeks.23 This suggests there continue to be long‐stay patients in the current hospital environment, to which these findings may apply.
Standards of practice, such as for use of restraints, have also changed. In 1992, between 7.4% and 17% of all hospitalized medical patients were restrained, according to a literature review.24 A 1998 survey of 3 hospitals found the prevalence of restraints still ranged from 3.9% to 8.2% and noted that among the most common reasons reported for using restraints were to prevent patient disruption of therapy, to confine confused patients, and to reduce the number of falls.25 Thus, our study cohort would be more likely to be restrained, even in the current hospital environment, given that 43% of the cohort had altered mental status and that most were at risk for falls because of their poor functional status.26
Nevertheless, even though the use of restraints has declined since the data were collected for this study, this should affect neither the internal validity of the results nor the ability to address the question of what factors predict recovery of ambulatory ability. Indeed, the inclusion of patients on whom restraints are frequently used emphasizes the need for continued diligence in creating a restraint‐free environment in our hospitals. Data about the use of physical therapy services were not available in the study. Therefore, it is unknown to what extent the use of these services encouraged ambulation.
In this observational study, we found 6 factors associated with regaining ambulatory ability among hospitalized patients who had significant activity limitations and functional dependence on admission. These findings suggest predictors easily assessed by the hospitalist physician can help to identify those patients most likely to recover ambulatory ability prior to discharge. It also demonstrates the importance of mobility in maintaining function, given that many of the predictors are factors that either impede mobility such as restraints and urinary catheters or measure mobility such as admission bed mobility. Last, recognizing physician‐rated life expectancy as a strong independent predictor of recovery of ambulatory ability should encourage hospitalist physicians to continue to use their greatest tool, their clinical judgment, to determine who will recover ambulatory ability.
As most of these predictors can be identified on admission or shortly thereafter, these factors may be useful in helping physicians and other health care providers to predict the potential patients have to recover ambulatory ability. This information may help physicians identify patients who might benefit from early mobility programs, placement on hospital units where mobility will be enhanced, or the early initiation of discharge planning for those patients identified as unlikely to regain ambulation ability. In addition, addressing factors that are potentially modifiable, such as low bed mobility and the use of urinary catheters and restraints may not only improve the chance of recovering ambulatory ability but would also improve the quality of care provided to older patients.
- ,,, et al.Effect of a geriatric consultation team on functional status of elderly hospitalized patients.Ann Intern Med.1989;110:79‐84.
- ,,, et al.Functional disability in the hospitalized elderly.JAMA.1982;248:847‐850.
- ,,, et al.Loss of independence in activities of daily living in older adults hospitalized with medical illnesses: increased vulnerability with age.J Am Geriatr Soc.2003;51:451‐458.
- ,,, et al.Functional outcomes of acute medical illness and hospitalization in older persons.Arch Intern Med.1996;156:645‐652.
- ,,, et al.The natural history of functional morbidity in hospitalized older patients.J Am Geriatr Soc.1990;38:1296‐1303.
- ,,, et al.Hospital diagnosis, Medicare charges and nursing home admissions in the year when older persons become severely disabled.JAMA.1997;277:728‐734.
- ,,.A predictive index for functional decline in hospitalized elderly medical patients.J Gen Intern Med.1993;8:645‐652.
- ,,, et al.Predictors of immediate and 6‐month outcomes in hospitalized elderly patients: the importance of functional status.J Am Geriatr Soc.1988;36:775‐783.
- ,.Admission and discharge mobility of frail hospitalized older adults.Medsurg Nurs.2004;13:156‐163.
- ,,.Predictors of functional decline in hospitalized elderly patients: a systematic review.J Gerontol Med Sci.2002;57A:M569–M577.
- ,,, et al.Hospital admission risk profile (HARP): identifying older patients at risk for functional decline following acute medical illness and hospitalization.J Am Geriatr Soc.1996;44:251‐257.
- ,,.New walking dependence associated with hospitalization for acute medical illness: incidence and significance.J Gerontol Med Sci.1998;53A:M307–M312.
- ,,,.Geriatric hospital medicine.Med Clin North Am.2002;86:707‐729.
- ,,.Prevalence and outcomes of low mobility in hospitalized older patients.J Am Geriatr Soc.2004;52:1263‐1270.
- ,,, et al.Pressure ulcer risk factors among hospitalized patients with activity limitations.JAMA.1995;273:865‐870.
- ,,,.A new method of classifying prognostic comorbidity in longitudinal studies: development and validation.J Chronic Dis.1986;40:373‐383.
- ,,,.APACHE II. A severity of disease classification system.Crit Care Med.1985;13:818‐829.
- ,,, et al.Studies of illness in the aged: the index of ADL: a standardized measure of biological and psychosocial functioning.JAMA.1963;185:914‐919.
- ,.Impact of marital status on outcomes in hospitalized patients.Arch Intern Med.1995;155:2465‐2471.
- ,,.Current concepts in geriatrics: instruments for the functional assessment of older patients.N Engl J Med.1990;322:1207‐1214.
- ,,,,,.Comparison of subjective ratings of function with observed functional ability of frail older persons.Am J Public Health.1991;81:1127‐1130.
- ,,,,,.Diagnosis‐related group‐adjusted hospital costs are higher in older medical patients with lower functional status.J Am Geriatr Soc.2003;51:1729‐1734.
- UAB Hospital data,2005.
- .Physical restraints in the practice of medicine. Current concepts.Arch Intern Med.1992;152:2203‐2206.
- et al.Prevalence and patterns of physical restraint use in the acute care setting.J Nurs Adm.1998;28:19‐24.
- Guideline for the prevention of falls in older persons.J Am Geriatr Soc.2001;49:664‐672.
- ,,, et al.Effect of a geriatric consultation team on functional status of elderly hospitalized patients.Ann Intern Med.1989;110:79‐84.
- ,,, et al.Functional disability in the hospitalized elderly.JAMA.1982;248:847‐850.
- ,,, et al.Loss of independence in activities of daily living in older adults hospitalized with medical illnesses: increased vulnerability with age.J Am Geriatr Soc.2003;51:451‐458.
- ,,, et al.Functional outcomes of acute medical illness and hospitalization in older persons.Arch Intern Med.1996;156:645‐652.
- ,,, et al.The natural history of functional morbidity in hospitalized older patients.J Am Geriatr Soc.1990;38:1296‐1303.
- ,,, et al.Hospital diagnosis, Medicare charges and nursing home admissions in the year when older persons become severely disabled.JAMA.1997;277:728‐734.
- ,,.A predictive index for functional decline in hospitalized elderly medical patients.J Gen Intern Med.1993;8:645‐652.
- ,,, et al.Predictors of immediate and 6‐month outcomes in hospitalized elderly patients: the importance of functional status.J Am Geriatr Soc.1988;36:775‐783.
- ,.Admission and discharge mobility of frail hospitalized older adults.Medsurg Nurs.2004;13:156‐163.
- ,,.Predictors of functional decline in hospitalized elderly patients: a systematic review.J Gerontol Med Sci.2002;57A:M569–M577.
- ,,, et al.Hospital admission risk profile (HARP): identifying older patients at risk for functional decline following acute medical illness and hospitalization.J Am Geriatr Soc.1996;44:251‐257.
- ,,.New walking dependence associated with hospitalization for acute medical illness: incidence and significance.J Gerontol Med Sci.1998;53A:M307–M312.
- ,,,.Geriatric hospital medicine.Med Clin North Am.2002;86:707‐729.
- ,,.Prevalence and outcomes of low mobility in hospitalized older patients.J Am Geriatr Soc.2004;52:1263‐1270.
- ,,, et al.Pressure ulcer risk factors among hospitalized patients with activity limitations.JAMA.1995;273:865‐870.
- ,,,.A new method of classifying prognostic comorbidity in longitudinal studies: development and validation.J Chronic Dis.1986;40:373‐383.
- ,,,.APACHE II. A severity of disease classification system.Crit Care Med.1985;13:818‐829.
- ,,, et al.Studies of illness in the aged: the index of ADL: a standardized measure of biological and psychosocial functioning.JAMA.1963;185:914‐919.
- ,.Impact of marital status on outcomes in hospitalized patients.Arch Intern Med.1995;155:2465‐2471.
- ,,.Current concepts in geriatrics: instruments for the functional assessment of older patients.N Engl J Med.1990;322:1207‐1214.
- ,,,,,.Comparison of subjective ratings of function with observed functional ability of frail older persons.Am J Public Health.1991;81:1127‐1130.
- ,,,,,.Diagnosis‐related group‐adjusted hospital costs are higher in older medical patients with lower functional status.J Am Geriatr Soc.2003;51:1729‐1734.
- UAB Hospital data,2005.
- .Physical restraints in the practice of medicine. Current concepts.Arch Intern Med.1992;152:2203‐2206.
- et al.Prevalence and patterns of physical restraint use in the acute care setting.J Nurs Adm.1998;28:19‐24.
- Guideline for the prevention of falls in older persons.J Am Geriatr Soc.2001;49:664‐672.
Copyright © 2006 Society of Hospital Medicine
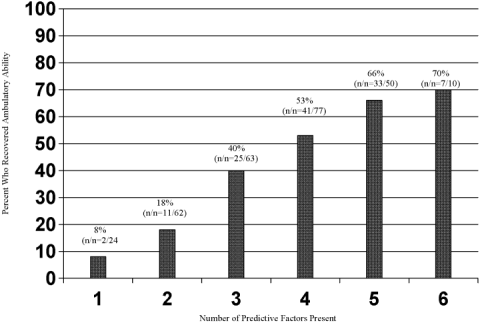
NIPPV effective for pulmonary edema
-
CLINICAL QUESTION: Is noninvasive positive pressure ventilation effective in managing patients with acute cardiogenic pulmonary edema?
-
BOTTOM LINE: Patients with acute cardiogenic pulmonary edema treated with noninvasive positive pressure ventilation (NIPPV) are less likely than those receiving standard care to die in the hospital or to require mechanical ventilation. (LOE = 1a)
-
REFERENCE: Peter JV, Moran JL, Phillips‐Hughes J, Graham P, Bersten AD. Effect of non‐invasive positive pressure ventilation (NIPPV) on mortality in patients with acute cardiogenic pulmonary oedema: a meta‐analysis. Lancet 2006;367:1155‐1163.
-
STUDY DESIGN: Meta‐analysis (randomized controlled trials)
-
SETTING: Inpatient (any location)
-
SYNOPSIS: This team systematically reviewed multiple databases, using a sensible search strategy,q to find 23 small randomized controlled trials of NIPPV. NIPPV included continuous positive airway pressure or bilevel ventilation. The data were extracted independently by 2 investigators, with discrepancies resolved by consensus. The authors don't report if the decision to include or exclude studies was similarly done independently. Additionally, they don't say if they looked for unpublished studies. The eligible studies included more than 1300 patients with cardiogenic pulmonary edema. NIPPV was more effective than standard care in preventing in‐hospital mortality (11.7% vs 21.3%; number needed to treat [NNT] =11; 95% CI, 7 ‐ 21), with no difference between continuous positive airway pressure and bilevel ventilation. Similarly, patients receiving NIPPV required mechanical ventilation less frequently (11.9% vs 28.1%; NNT = 7; 5 ‐ 9), with no difference in outcomes between continuous positive airway pressure and bilevel ventilation. The data were fairly consistent across the studies. Since there is a possibility of publication bias in favor of positive results, the results of a mega‐trial (if one occurs) may not look this good.
-
CLINICAL QUESTION: Is noninvasive positive pressure ventilation effective in managing patients with acute cardiogenic pulmonary edema?
-
BOTTOM LINE: Patients with acute cardiogenic pulmonary edema treated with noninvasive positive pressure ventilation (NIPPV) are less likely than those receiving standard care to die in the hospital or to require mechanical ventilation. (LOE = 1a)
-
REFERENCE: Peter JV, Moran JL, Phillips‐Hughes J, Graham P, Bersten AD. Effect of non‐invasive positive pressure ventilation (NIPPV) on mortality in patients with acute cardiogenic pulmonary oedema: a meta‐analysis. Lancet 2006;367:1155‐1163.
-
STUDY DESIGN: Meta‐analysis (randomized controlled trials)
-
SETTING: Inpatient (any location)
-
SYNOPSIS: This team systematically reviewed multiple databases, using a sensible search strategy,q to find 23 small randomized controlled trials of NIPPV. NIPPV included continuous positive airway pressure or bilevel ventilation. The data were extracted independently by 2 investigators, with discrepancies resolved by consensus. The authors don't report if the decision to include or exclude studies was similarly done independently. Additionally, they don't say if they looked for unpublished studies. The eligible studies included more than 1300 patients with cardiogenic pulmonary edema. NIPPV was more effective than standard care in preventing in‐hospital mortality (11.7% vs 21.3%; number needed to treat [NNT] =11; 95% CI, 7 ‐ 21), with no difference between continuous positive airway pressure and bilevel ventilation. Similarly, patients receiving NIPPV required mechanical ventilation less frequently (11.9% vs 28.1%; NNT = 7; 5 ‐ 9), with no difference in outcomes between continuous positive airway pressure and bilevel ventilation. The data were fairly consistent across the studies. Since there is a possibility of publication bias in favor of positive results, the results of a mega‐trial (if one occurs) may not look this good.
-
CLINICAL QUESTION: Is noninvasive positive pressure ventilation effective in managing patients with acute cardiogenic pulmonary edema?
-
BOTTOM LINE: Patients with acute cardiogenic pulmonary edema treated with noninvasive positive pressure ventilation (NIPPV) are less likely than those receiving standard care to die in the hospital or to require mechanical ventilation. (LOE = 1a)
-
REFERENCE: Peter JV, Moran JL, Phillips‐Hughes J, Graham P, Bersten AD. Effect of non‐invasive positive pressure ventilation (NIPPV) on mortality in patients with acute cardiogenic pulmonary oedema: a meta‐analysis. Lancet 2006;367:1155‐1163.
-
STUDY DESIGN: Meta‐analysis (randomized controlled trials)
-
SETTING: Inpatient (any location)
-
SYNOPSIS: This team systematically reviewed multiple databases, using a sensible search strategy,q to find 23 small randomized controlled trials of NIPPV. NIPPV included continuous positive airway pressure or bilevel ventilation. The data were extracted independently by 2 investigators, with discrepancies resolved by consensus. The authors don't report if the decision to include or exclude studies was similarly done independently. Additionally, they don't say if they looked for unpublished studies. The eligible studies included more than 1300 patients with cardiogenic pulmonary edema. NIPPV was more effective than standard care in preventing in‐hospital mortality (11.7% vs 21.3%; number needed to treat [NNT] =11; 95% CI, 7 ‐ 21), with no difference between continuous positive airway pressure and bilevel ventilation. Similarly, patients receiving NIPPV required mechanical ventilation less frequently (11.9% vs 28.1%; NNT = 7; 5 ‐ 9), with no difference in outcomes between continuous positive airway pressure and bilevel ventilation. The data were fairly consistent across the studies. Since there is a possibility of publication bias in favor of positive results, the results of a mega‐trial (if one occurs) may not look this good.
Noninvasive carotid imaging can replace invasive imaging
-
CLINICAL QUESTION: Can noninvasive imaging replace invasive testing in patients with suspected carotid artery disease?
-
BOTTOM LINE: Noninvasive testing, especially contrast‐enhanced magnetic resonance angiography (CEMRA), compares very favorably with invasive angiography. Since noninvasive testing appears to be less accurate in patients with less severe stenosis, a reasonable strategy might begin with CEMRA. If CEMRA demonstrates a greater than 70% stenosis, the diagnosis is settled. If the stenosis appears to be less than 70%, invasive angiography might be considered. Of course, this diagnostic approach needs formal evaluation. (LOE = 1a‐).
-
REFERENCE: Wardlaw JM, Chappell FM, Best JJ, Wartolowska K, Berry E; NHS Research and Development Health Technology Assessment Carotid Stenosis Imaging Group. Non‐invasive imaging compared with intra‐arterial angiography in the diagnosis of symptomatic carotid stenosis: a meta‐analysis. Lancet 2006;367:1503‐1512.
-
STUDY DESIGN: Systematic review
-
FUNDING: Government
-
SETTING: Various (meta‐analysis)
-
SYNOPSIS: Two members of this research team searched MEDLINE and EMBASE and hand‐searched several journals to identify 41 prospective studies of at least 20 patients with suspected carotid artery disease who underwent 1 or more noninvasive test and invasive angiography. Any disagreements were settled by discussion with a third reviewer. Similarly, 2 reviewers extracted the data and discrepancies were arbitrated by a third reviewer. The identified studies included a total of 2541 patients. Overall, CEMRA generally performed best, although computed tomographic angiography, magnetic resonance angiography, and Doppler ultrasound also performed well. The authors found some variability in test performance, mainly due to differences in accuracy on the basis of the degree of stenosis. Nonetheless, depending on the degree of stenosis, CEMRA provided the most diagnostic information (positive likelihood ratio ranged from 13 to 26 and negative likelihood ratio from 0.04 to 0.24). Generally speaking, the noninvasive tests were not as accurate in patients with moderate stenosis (50%‐69%). Since this group also has a narrow surgical risk‐benefit margin, diagnostic certainty is critical. Finally, CEMRA results may be biased because of small study sizes and, as a new technology, the potential for reporting overly positive studies. Stay tuned.
-
CLINICAL QUESTION: Can noninvasive imaging replace invasive testing in patients with suspected carotid artery disease?
-
BOTTOM LINE: Noninvasive testing, especially contrast‐enhanced magnetic resonance angiography (CEMRA), compares very favorably with invasive angiography. Since noninvasive testing appears to be less accurate in patients with less severe stenosis, a reasonable strategy might begin with CEMRA. If CEMRA demonstrates a greater than 70% stenosis, the diagnosis is settled. If the stenosis appears to be less than 70%, invasive angiography might be considered. Of course, this diagnostic approach needs formal evaluation. (LOE = 1a‐).
-
REFERENCE: Wardlaw JM, Chappell FM, Best JJ, Wartolowska K, Berry E; NHS Research and Development Health Technology Assessment Carotid Stenosis Imaging Group. Non‐invasive imaging compared with intra‐arterial angiography in the diagnosis of symptomatic carotid stenosis: a meta‐analysis. Lancet 2006;367:1503‐1512.
-
STUDY DESIGN: Systematic review
-
FUNDING: Government
-
SETTING: Various (meta‐analysis)
-
SYNOPSIS: Two members of this research team searched MEDLINE and EMBASE and hand‐searched several journals to identify 41 prospective studies of at least 20 patients with suspected carotid artery disease who underwent 1 or more noninvasive test and invasive angiography. Any disagreements were settled by discussion with a third reviewer. Similarly, 2 reviewers extracted the data and discrepancies were arbitrated by a third reviewer. The identified studies included a total of 2541 patients. Overall, CEMRA generally performed best, although computed tomographic angiography, magnetic resonance angiography, and Doppler ultrasound also performed well. The authors found some variability in test performance, mainly due to differences in accuracy on the basis of the degree of stenosis. Nonetheless, depending on the degree of stenosis, CEMRA provided the most diagnostic information (positive likelihood ratio ranged from 13 to 26 and negative likelihood ratio from 0.04 to 0.24). Generally speaking, the noninvasive tests were not as accurate in patients with moderate stenosis (50%‐69%). Since this group also has a narrow surgical risk‐benefit margin, diagnostic certainty is critical. Finally, CEMRA results may be biased because of small study sizes and, as a new technology, the potential for reporting overly positive studies. Stay tuned.
-
CLINICAL QUESTION: Can noninvasive imaging replace invasive testing in patients with suspected carotid artery disease?
-
BOTTOM LINE: Noninvasive testing, especially contrast‐enhanced magnetic resonance angiography (CEMRA), compares very favorably with invasive angiography. Since noninvasive testing appears to be less accurate in patients with less severe stenosis, a reasonable strategy might begin with CEMRA. If CEMRA demonstrates a greater than 70% stenosis, the diagnosis is settled. If the stenosis appears to be less than 70%, invasive angiography might be considered. Of course, this diagnostic approach needs formal evaluation. (LOE = 1a‐).
-
REFERENCE: Wardlaw JM, Chappell FM, Best JJ, Wartolowska K, Berry E; NHS Research and Development Health Technology Assessment Carotid Stenosis Imaging Group. Non‐invasive imaging compared with intra‐arterial angiography in the diagnosis of symptomatic carotid stenosis: a meta‐analysis. Lancet 2006;367:1503‐1512.
-
STUDY DESIGN: Systematic review
-
FUNDING: Government
-
SETTING: Various (meta‐analysis)
-
SYNOPSIS: Two members of this research team searched MEDLINE and EMBASE and hand‐searched several journals to identify 41 prospective studies of at least 20 patients with suspected carotid artery disease who underwent 1 or more noninvasive test and invasive angiography. Any disagreements were settled by discussion with a third reviewer. Similarly, 2 reviewers extracted the data and discrepancies were arbitrated by a third reviewer. The identified studies included a total of 2541 patients. Overall, CEMRA generally performed best, although computed tomographic angiography, magnetic resonance angiography, and Doppler ultrasound also performed well. The authors found some variability in test performance, mainly due to differences in accuracy on the basis of the degree of stenosis. Nonetheless, depending on the degree of stenosis, CEMRA provided the most diagnostic information (positive likelihood ratio ranged from 13 to 26 and negative likelihood ratio from 0.04 to 0.24). Generally speaking, the noninvasive tests were not as accurate in patients with moderate stenosis (50%‐69%). Since this group also has a narrow surgical risk‐benefit margin, diagnostic certainty is critical. Finally, CEMRA results may be biased because of small study sizes and, as a new technology, the potential for reporting overly positive studies. Stay tuned.
Introducing Hospital Images Dx—A call for submissions
Of the many skills a hospitalist nurtures and develops, seeing and processing visual images is paramount. From the moment we enter the hospital each day, we look at patient faces, trying to fathom their levels of pain, of illness, and of response to therapy. We look at their rashes, facial droops, surgical wounds, and neck vein elevation. When we are done visually scrutinizing our patients, we inspect their rhythm strips or electrocardiograms and then move on to their X‐rays and advanced imaging.
Although we are, in a sense, slaves to the images before us, we also enjoy medicine for the challenge that these images providethere is always something novel to see. For the experienced clinician, a deep sense of satisfaction perfuses our limbic system with the quick recognition of the delta wave of Wolf‐Parkinson‐White on an EKG or the first vesicle of a zoster outbreak in a patient with initially unexplained cutaneous pain. What we recognize easily tends to come from having seen something beforefor better or worse, we depend on pattern recognition.
Unfortunately, we are all busier than we like and receive more journals than we have time to read. To make JHM even more germane and stimulating, we are initiating Hospital Images Dx. The main goal of Hospital Images Dx will be to show interesting images that a hospitalist might encounter, both the common and the obscure. Images, whether subtle or awe‐inspiring, should generally be able to speak the proverbial thousand words. To supplement those thousand words spoken by the submitted image, accompanying text will be limited to 250 words. The text should give a brief clinical summary of the patient's problem, relevant adjunct data, and 1 or 2 succinct teaching points related to the image. Our goal, simply stated, is for the reader to walk away after reading Hospital Images Dx with an image and a couple of key teaching points stored away for a rainy day.
We anticipate a substantial number of exciting submissions to Hospital Images Dx. Health care providers clearly get excited about the things they see as well as about the recordsthe imagesthat document both mundane and unusual encounters with a patient or a patient's data. We hope to tap into this enthusiasm and to teach a few things along the way. The editors look forward to receiving your Hospital Images Dx submission soon!
Of the many skills a hospitalist nurtures and develops, seeing and processing visual images is paramount. From the moment we enter the hospital each day, we look at patient faces, trying to fathom their levels of pain, of illness, and of response to therapy. We look at their rashes, facial droops, surgical wounds, and neck vein elevation. When we are done visually scrutinizing our patients, we inspect their rhythm strips or electrocardiograms and then move on to their X‐rays and advanced imaging.
Although we are, in a sense, slaves to the images before us, we also enjoy medicine for the challenge that these images providethere is always something novel to see. For the experienced clinician, a deep sense of satisfaction perfuses our limbic system with the quick recognition of the delta wave of Wolf‐Parkinson‐White on an EKG or the first vesicle of a zoster outbreak in a patient with initially unexplained cutaneous pain. What we recognize easily tends to come from having seen something beforefor better or worse, we depend on pattern recognition.
Unfortunately, we are all busier than we like and receive more journals than we have time to read. To make JHM even more germane and stimulating, we are initiating Hospital Images Dx. The main goal of Hospital Images Dx will be to show interesting images that a hospitalist might encounter, both the common and the obscure. Images, whether subtle or awe‐inspiring, should generally be able to speak the proverbial thousand words. To supplement those thousand words spoken by the submitted image, accompanying text will be limited to 250 words. The text should give a brief clinical summary of the patient's problem, relevant adjunct data, and 1 or 2 succinct teaching points related to the image. Our goal, simply stated, is for the reader to walk away after reading Hospital Images Dx with an image and a couple of key teaching points stored away for a rainy day.
We anticipate a substantial number of exciting submissions to Hospital Images Dx. Health care providers clearly get excited about the things they see as well as about the recordsthe imagesthat document both mundane and unusual encounters with a patient or a patient's data. We hope to tap into this enthusiasm and to teach a few things along the way. The editors look forward to receiving your Hospital Images Dx submission soon!
Of the many skills a hospitalist nurtures and develops, seeing and processing visual images is paramount. From the moment we enter the hospital each day, we look at patient faces, trying to fathom their levels of pain, of illness, and of response to therapy. We look at their rashes, facial droops, surgical wounds, and neck vein elevation. When we are done visually scrutinizing our patients, we inspect their rhythm strips or electrocardiograms and then move on to their X‐rays and advanced imaging.
Although we are, in a sense, slaves to the images before us, we also enjoy medicine for the challenge that these images providethere is always something novel to see. For the experienced clinician, a deep sense of satisfaction perfuses our limbic system with the quick recognition of the delta wave of Wolf‐Parkinson‐White on an EKG or the first vesicle of a zoster outbreak in a patient with initially unexplained cutaneous pain. What we recognize easily tends to come from having seen something beforefor better or worse, we depend on pattern recognition.
Unfortunately, we are all busier than we like and receive more journals than we have time to read. To make JHM even more germane and stimulating, we are initiating Hospital Images Dx. The main goal of Hospital Images Dx will be to show interesting images that a hospitalist might encounter, both the common and the obscure. Images, whether subtle or awe‐inspiring, should generally be able to speak the proverbial thousand words. To supplement those thousand words spoken by the submitted image, accompanying text will be limited to 250 words. The text should give a brief clinical summary of the patient's problem, relevant adjunct data, and 1 or 2 succinct teaching points related to the image. Our goal, simply stated, is for the reader to walk away after reading Hospital Images Dx with an image and a couple of key teaching points stored away for a rainy day.
We anticipate a substantial number of exciting submissions to Hospital Images Dx. Health care providers clearly get excited about the things they see as well as about the recordsthe imagesthat document both mundane and unusual encounters with a patient or a patient's data. We hope to tap into this enthusiasm and to teach a few things along the way. The editors look forward to receiving your Hospital Images Dx submission soon!
Improving Cost Effectiveness of Blood Cultures
Because as many as 90% of all blood cultures grow no organisms1 developing rules that predict which patients are at the lowest risk of having bacteremia could improve the utilization of this test and markedly reduce its cost. Of the approximate 10% of cultures that do grow organisms, only about half represent true bacteremia (ie, true positives), whereas the other half are considered contaminants (ie, false positives)2; the latter are known to increase both the cost and duration of care.3 Accordingly, reducing the number of contaminants could also reduce the cost of care. We assessed which of these two strategies would be the most cost effective. Although only 6% of the blood cultures obtained at our hospital represented contaminants, their associated cost was more than twice that associated with the 87% of cultures that were true negatives.
METHODS
We conducted a retrospective review of microbiological results and hospital records of patients for whom blood cultures were obtained in January 2002 at Denver Health Medical Center, a 400‐bed university‐affiliated public safety net hospital. The study was given exempt status by the Colorado Multiple Institutional Review Board. Patients were identified using a preexisting laboratory database.
We adopted the definitions used by Bates et al.3 for the inclusion and exclusion criteria and the definition of a blood culture episode so that we could apply the financial data presented by these authors to our results. Briefly, a blood culture set was defined as a single venipuncture, regardless of the number of bottles sent for culturing, and a blood culture episode was defined as the 48‐hour period beginning when a blood culture was drawn. All sets within the same 48‐hour period were considered part of the same episode. Cultures that grew bacteria were classified as either true positive, representing bacteremia, or false positive, representing contaminants. Determination of whether a patient had a true‐positive culture versus a contaminant was made in a weekly conference attended by the chief of the Infectious Disease Division, an Infectious Disease fellow, and at least one microbiologist, during which the species of organism cultured and the associated clinical data for each patient were considered. Organisms considered to indicate false positives included diphtheroids, Bacillus sp, Propionibacterium sp, coagulase‐negative staphylococci, and micrococci. All other organisms were considered true positives in the setting of appropriate clinical criteria as specified by the CDC guidelines.4 Hospital charges and lengths of stay were obtained from our institutional database.
The cost associated with a true‐negative blood culture was determined by summing the charges for phlebotomy and microbiological testing obtained from the January 2005 Denver Health hospital charge master and applying the cost‐to‐charge ratio reported on the Medicare Cost Report for inpatient services (not including the costs of physician salaries and benefits).
The cost of a false positive was determined two ways: (a) adjusting the data reported by Bates et al.3 for changes in the Consumer Price Index5 and (b) comparing the actual hospital charges of the patients in our sample who had false‐positive cultures with those who did not (adjusting both by the hospital's inpatient cost‐to‐charge ratio, again not including the cost of physician salaries and benefits).
The length of stay and cost of care for patients with true‐ and false‐positive blood cultures were compared by chi‐square analysis. P < .05 was considered statistically significant. The data were not normally distributed and, as such, are presented as medians and interquartile ranges.
RESULTS
Table 1 summarizes the interpretation of the 939 blood cultures drawn in January 2002. Only 6 culture sets (0.6%) could not be classified. The positive predictive value of a positive blood culture was only 53%.
| Blood cultures | Bacteremia | ||
|---|---|---|---|
| Number positive (%) | Number negative (%) | Total | |
| Number positive (%) | 62 (7) | 56 (6) | 118 (13) |
| Number negative (%) | 0 (0) | 815 (87) | 815 (87) |
| Total | 62 (7) | 871 (93) | 933 (100) |
Laboratory charges for patients with true‐negative and false‐positive blood cultures in January 2002 are shown in Table 2. Annualized, the associated charges were $1,781,292, and the costs were $748,143.
| Charge ($) | Tests (N) | Total ($) | |
|---|---|---|---|
| True‐negative cultures | |||
| Phlebotomy | $13.25 | ||
| Microbiology | $147.50 | ||
| Subtotal | $160.75 | 815 | $131,011 |
| False‐positive cultures | |||
| Phlebotomy | $13.25 | ||
| Microbiology | $147.50 | ||
| Identification | $60.75 | ||
| Sensitivity | $89.75 | ||
| Subtotal | $311.25 | 56 | $17,430 |
| $148,441 |
Bates et al.3 found that false‐positive blood cultures increased the length of hospital stay by 4.5 days and increased total charges by $4385 over those for patients with no contaminants. This adjusted to $6878 in 2005 according to the Consumer Price Index.5 After grouping our blood cultures into episodes as defined by Bates et al. (Table 3), we had 41 episodes of contaminated blood cultures that would annualize to charges of $3,383,976 and costs of $1,421,270 after applying the cost‐to‐charge ratio.
| Blood cultures | Bacteremia | ||
|---|---|---|---|
| Number positive (%) | Number negative (%) | Total | |
| |||
| Number positive (%) | 39 (9) | 41 (10) | 80 (19) |
| Number negative (%) | 0 (0) | 335 (81) | 335 (81) |
| Total | 39 (9) | 376 (91) | 415 (100) |
The median length of hospital stay and total charges for the patients with true‐negative and false‐positive blood cultures at Denver Health in January 2002 are summarized in Table 4. Using this approach, patients with false‐positive blood cultures at our institution added 1450‐2200 extra hospital days and accrued additional charges of $4,305,000 and costs of $1,808,100.
| Length of stay (days) | Interquartile range (days) | Total Charges ($) | Interquartile Range ($) | |
|---|---|---|---|---|
| ||||
| True negative | 5 | 2‐12 | $15,158 | $7,007‐$40,270 |
| False positive | 8a | 4‐13.5 | $23,908a | $14,083‐$52,031 |
| Difference | 3 | $8,750 | ||
DISCUSSION
The important finding of this study is that, despite there being nearly 15 times as many true‐negative blood cultures as false‐positive ones, the savings generated by reducing contaminants would be approximately twice that saved by reducing the true negatives (eg, a 50% reduction in the rate of contamination would reduce the total number of false‐positive episodes by 246 annually, saving $710,635‐$904,050, whereas reducing the true negatives by 50% would only save approximately $375,000.
There is no independent gold standard for evaluating the operating characteristics of a blood culture.6 Data from a series of repeated blood cultures represent the closest surrogate. Weinstein et al.7 drew at least 3 sets of cultures from 282 bacteremic patients and noted that bacteremia was documented in 91.5% of the first cultures, in 99.3% in 1 of the first 2 cultures, and in 99.6% in 1 of the first 3 cultures. Because 2 blood culture sets are drawn routinely, the difference between those 2 (if negative) and a third (if it represents a true positive) is 0.3% and would represent a false‐negative culture rate. Given that the true‐negative rate of blood cultures is 87%‐90%,1 the potential 0.3% false‐negative rate would not affect our analysis, and as such, we chose to ignore it. Accordingly, all sets of blood cultures with no growth were classified as true negatives.
Although we cannot show a cause‐and‐effect relationship between false‐positive cultures and the charges associated resulting from them, a recent study suggested that much of the excess length of stay of such patients is attributable to the false‐positive culture itself.8
Because health care costs have exceeded increases in general goods and services, adjusting the results of Bates et al.3 using the Consumer Price Index likely underestimated the projected cost of the false‐positive cultures. This limitation likely accounts for the observation that the difference in actual charges for our patients between those who did and those who did not have false‐positive blood cultures was greater than the cost of these false‐positive cultures as estimated by extrapolating from the data of Bates et al.3 Given the magnitude of the financial difference we observed, however, we suggest that this difference is not of sufficient size to alter our conclusion.
Physicians working at Denver Health are directly employed by the hospital, and the cost of physician salaries and benefits is included in the cost‐to‐charge ratio reported in our Medicare Cost Report. For purposes of this study, however, we elected to utilize a cost‐to‐charge ratio that was exclusive of physician salaries and benefits (ie, 0.42 rather than 0.66) because most hospitals in the United States do not employ their physicians. Accordingly, the costs we present underestimate the true cost to our institution by approximately 32% but are more representative of the costs of services provided by most hospitals in the United States.
Recent studies have shown that the rate of false‐positive cultures is higher when blood is drawn from indwelling catheters than when it is obtained by peripheral venipuncture.9, 10 The rates we cite from the literature2 and from our own institution (Table 1) are aggregate data that include samples drawn from both sites. Separating these would not alter our conclusion that a 50% reduction in false positives would save approximately twice as much as a 50% reduction in false negatives. These studies do, however, identify an important method for reducing false positives: sampling by venipuncture whenever possible, and only drawing through a catheter under very limited circumstances.
There are additional factors that favor a strategy of reducing contaminants over one that attempts to reduce the number of true‐negative cultures. First, reducing the total number of true‐negative blood cultures by 50% would require a very ambitious prediction rule that did not reduce the number of true positives to any meaningful extent. Prediction rules to reduce blood culture testing have been developed for patients with community‐acquired pneumonia, but the rules only reduced the number of cultures by 37% and, more importantly, left 11% of true bacteremias undetected.8 Reducing contaminants would have no effect on the detection of true positives, whereas any prediction rule would inevitably increase the risk of missing true bacteremia in at least a fraction of patients. Second, methods aimed at reducing contaminants can be implemented immediately, whereas deriving a prediction rule would take years to develop and test before it could be utilized. Third, implementing prediction rules may be difficult because many physicians prefer to rely on their clinical impressions.11
Reducing contaminants would require improving the technique by which blood cultures are obtained, with the objective of shifting a portion of false positives to true negatives. This might be accomplished in many ways: increasing the time spent on antiseptic scrubbing, improving the ways in which antiseptic devices are used, waiting for the antiseptic to air‐dry completely, choosing the antiseptic that is most effective in trials, drawing blood by venipuncture instead of through an indwelling catheter, limiting the number of venipuncture attempts before requiring a second site to be prepared, requiring all cultures be drawn by trained phlebotomists, and reducing phlebotomist turnover, among others. Denver Health has a 4‐page set of directions for phlebotomists to follow when obtaining blood cultures. Accordingly, there are numerous places the process could break down. Although having 2 phlebotomists involved (ie, one to perform the procedure and the other to observe and guide the first, assuring that all the appropriate steps are followed) might be considered an extraordinary step, our findings suggest the potential saving to the institution could far outweigh the additional personnel expense resulting from such an approach. Other potential solutions we have considered but not tested include providing a monthly salary bonus to the phlebotomist with the lowest contamination rate or giving bonuses to every phlebotomist who achieves a zero contamination rate.
In summary, we have concluded that the resource utilization associated with obtaining blood cultures can best be improved by reducing the small percentage of cultures that represent contaminants rather than by developing rules to reduce the much larger number of true negatives. The magnitude of the potential savings resulting from reducing contaminants is sufficiently large to warrant expending additional resources to accomplish this task.
- .Clinically relevant, cost‐effective clinical microbiology. Strategies to decrease unnecessary testing.Am J Clin Path.1997;107:154–167.
- ,,, et al.The clinical significance of positive blood cultures in the 1990s: A prospective comprehensive evaluation of the microbiology, epidemiology, and outcome of bacteremia and fungemia in adults.Clin Infect Dis.1997;24:584–602.
- ,,.Contaminant blood cultures and resource utilization: the true consequences of false‐positive results.JAMA.1991;265:365–369.
- ,.Surveillance of nosocomial infection. In:Mayhall CG, ed.Hospital Epidemiology and Infection Control.3rd ed.Philadelphia:Lippincott Williams 106:246–253.
- ,,,.The clinical significance of positive blood cultures: a comprehensive analysis of 500 episodes of bacteremia and fungemia in adults. I. Laboratory and epidemiologic observations.Rev Infect Dis.1983;5:35–70.
- ,,,.Predicting bacteremia in patients with community acquired pneumonia.Am J Respir Crit Care Med.2004;169:342–347.
- ,,,,,.Clinical utility of blood cultures drawn from central venous or arterial catheters in critically ill surgical patients.Crit Care Med.2002;30:7–13.
- ,,.Comparison of contamination rates of catheter‐drawn and peripheral blood cultures.J Hosp Infect.2005;60:118–121.
- ,,,,.Physician response to a prediction rule for the triage of emergency department patients with chest pain.J Gen Intern Med.1994;9:241–247.
Because as many as 90% of all blood cultures grow no organisms1 developing rules that predict which patients are at the lowest risk of having bacteremia could improve the utilization of this test and markedly reduce its cost. Of the approximate 10% of cultures that do grow organisms, only about half represent true bacteremia (ie, true positives), whereas the other half are considered contaminants (ie, false positives)2; the latter are known to increase both the cost and duration of care.3 Accordingly, reducing the number of contaminants could also reduce the cost of care. We assessed which of these two strategies would be the most cost effective. Although only 6% of the blood cultures obtained at our hospital represented contaminants, their associated cost was more than twice that associated with the 87% of cultures that were true negatives.
METHODS
We conducted a retrospective review of microbiological results and hospital records of patients for whom blood cultures were obtained in January 2002 at Denver Health Medical Center, a 400‐bed university‐affiliated public safety net hospital. The study was given exempt status by the Colorado Multiple Institutional Review Board. Patients were identified using a preexisting laboratory database.
We adopted the definitions used by Bates et al.3 for the inclusion and exclusion criteria and the definition of a blood culture episode so that we could apply the financial data presented by these authors to our results. Briefly, a blood culture set was defined as a single venipuncture, regardless of the number of bottles sent for culturing, and a blood culture episode was defined as the 48‐hour period beginning when a blood culture was drawn. All sets within the same 48‐hour period were considered part of the same episode. Cultures that grew bacteria were classified as either true positive, representing bacteremia, or false positive, representing contaminants. Determination of whether a patient had a true‐positive culture versus a contaminant was made in a weekly conference attended by the chief of the Infectious Disease Division, an Infectious Disease fellow, and at least one microbiologist, during which the species of organism cultured and the associated clinical data for each patient were considered. Organisms considered to indicate false positives included diphtheroids, Bacillus sp, Propionibacterium sp, coagulase‐negative staphylococci, and micrococci. All other organisms were considered true positives in the setting of appropriate clinical criteria as specified by the CDC guidelines.4 Hospital charges and lengths of stay were obtained from our institutional database.
The cost associated with a true‐negative blood culture was determined by summing the charges for phlebotomy and microbiological testing obtained from the January 2005 Denver Health hospital charge master and applying the cost‐to‐charge ratio reported on the Medicare Cost Report for inpatient services (not including the costs of physician salaries and benefits).
The cost of a false positive was determined two ways: (a) adjusting the data reported by Bates et al.3 for changes in the Consumer Price Index5 and (b) comparing the actual hospital charges of the patients in our sample who had false‐positive cultures with those who did not (adjusting both by the hospital's inpatient cost‐to‐charge ratio, again not including the cost of physician salaries and benefits).
The length of stay and cost of care for patients with true‐ and false‐positive blood cultures were compared by chi‐square analysis. P < .05 was considered statistically significant. The data were not normally distributed and, as such, are presented as medians and interquartile ranges.
RESULTS
Table 1 summarizes the interpretation of the 939 blood cultures drawn in January 2002. Only 6 culture sets (0.6%) could not be classified. The positive predictive value of a positive blood culture was only 53%.
| Blood cultures | Bacteremia | ||
|---|---|---|---|
| Number positive (%) | Number negative (%) | Total | |
| Number positive (%) | 62 (7) | 56 (6) | 118 (13) |
| Number negative (%) | 0 (0) | 815 (87) | 815 (87) |
| Total | 62 (7) | 871 (93) | 933 (100) |
Laboratory charges for patients with true‐negative and false‐positive blood cultures in January 2002 are shown in Table 2. Annualized, the associated charges were $1,781,292, and the costs were $748,143.
| Charge ($) | Tests (N) | Total ($) | |
|---|---|---|---|
| True‐negative cultures | |||
| Phlebotomy | $13.25 | ||
| Microbiology | $147.50 | ||
| Subtotal | $160.75 | 815 | $131,011 |
| False‐positive cultures | |||
| Phlebotomy | $13.25 | ||
| Microbiology | $147.50 | ||
| Identification | $60.75 | ||
| Sensitivity | $89.75 | ||
| Subtotal | $311.25 | 56 | $17,430 |
| $148,441 |
Bates et al.3 found that false‐positive blood cultures increased the length of hospital stay by 4.5 days and increased total charges by $4385 over those for patients with no contaminants. This adjusted to $6878 in 2005 according to the Consumer Price Index.5 After grouping our blood cultures into episodes as defined by Bates et al. (Table 3), we had 41 episodes of contaminated blood cultures that would annualize to charges of $3,383,976 and costs of $1,421,270 after applying the cost‐to‐charge ratio.
| Blood cultures | Bacteremia | ||
|---|---|---|---|
| Number positive (%) | Number negative (%) | Total | |
| |||
| Number positive (%) | 39 (9) | 41 (10) | 80 (19) |
| Number negative (%) | 0 (0) | 335 (81) | 335 (81) |
| Total | 39 (9) | 376 (91) | 415 (100) |
The median length of hospital stay and total charges for the patients with true‐negative and false‐positive blood cultures at Denver Health in January 2002 are summarized in Table 4. Using this approach, patients with false‐positive blood cultures at our institution added 1450‐2200 extra hospital days and accrued additional charges of $4,305,000 and costs of $1,808,100.
| Length of stay (days) | Interquartile range (days) | Total Charges ($) | Interquartile Range ($) | |
|---|---|---|---|---|
| ||||
| True negative | 5 | 2‐12 | $15,158 | $7,007‐$40,270 |
| False positive | 8a | 4‐13.5 | $23,908a | $14,083‐$52,031 |
| Difference | 3 | $8,750 | ||
DISCUSSION
The important finding of this study is that, despite there being nearly 15 times as many true‐negative blood cultures as false‐positive ones, the savings generated by reducing contaminants would be approximately twice that saved by reducing the true negatives (eg, a 50% reduction in the rate of contamination would reduce the total number of false‐positive episodes by 246 annually, saving $710,635‐$904,050, whereas reducing the true negatives by 50% would only save approximately $375,000.
There is no independent gold standard for evaluating the operating characteristics of a blood culture.6 Data from a series of repeated blood cultures represent the closest surrogate. Weinstein et al.7 drew at least 3 sets of cultures from 282 bacteremic patients and noted that bacteremia was documented in 91.5% of the first cultures, in 99.3% in 1 of the first 2 cultures, and in 99.6% in 1 of the first 3 cultures. Because 2 blood culture sets are drawn routinely, the difference between those 2 (if negative) and a third (if it represents a true positive) is 0.3% and would represent a false‐negative culture rate. Given that the true‐negative rate of blood cultures is 87%‐90%,1 the potential 0.3% false‐negative rate would not affect our analysis, and as such, we chose to ignore it. Accordingly, all sets of blood cultures with no growth were classified as true negatives.
Although we cannot show a cause‐and‐effect relationship between false‐positive cultures and the charges associated resulting from them, a recent study suggested that much of the excess length of stay of such patients is attributable to the false‐positive culture itself.8
Because health care costs have exceeded increases in general goods and services, adjusting the results of Bates et al.3 using the Consumer Price Index likely underestimated the projected cost of the false‐positive cultures. This limitation likely accounts for the observation that the difference in actual charges for our patients between those who did and those who did not have false‐positive blood cultures was greater than the cost of these false‐positive cultures as estimated by extrapolating from the data of Bates et al.3 Given the magnitude of the financial difference we observed, however, we suggest that this difference is not of sufficient size to alter our conclusion.
Physicians working at Denver Health are directly employed by the hospital, and the cost of physician salaries and benefits is included in the cost‐to‐charge ratio reported in our Medicare Cost Report. For purposes of this study, however, we elected to utilize a cost‐to‐charge ratio that was exclusive of physician salaries and benefits (ie, 0.42 rather than 0.66) because most hospitals in the United States do not employ their physicians. Accordingly, the costs we present underestimate the true cost to our institution by approximately 32% but are more representative of the costs of services provided by most hospitals in the United States.
Recent studies have shown that the rate of false‐positive cultures is higher when blood is drawn from indwelling catheters than when it is obtained by peripheral venipuncture.9, 10 The rates we cite from the literature2 and from our own institution (Table 1) are aggregate data that include samples drawn from both sites. Separating these would not alter our conclusion that a 50% reduction in false positives would save approximately twice as much as a 50% reduction in false negatives. These studies do, however, identify an important method for reducing false positives: sampling by venipuncture whenever possible, and only drawing through a catheter under very limited circumstances.
There are additional factors that favor a strategy of reducing contaminants over one that attempts to reduce the number of true‐negative cultures. First, reducing the total number of true‐negative blood cultures by 50% would require a very ambitious prediction rule that did not reduce the number of true positives to any meaningful extent. Prediction rules to reduce blood culture testing have been developed for patients with community‐acquired pneumonia, but the rules only reduced the number of cultures by 37% and, more importantly, left 11% of true bacteremias undetected.8 Reducing contaminants would have no effect on the detection of true positives, whereas any prediction rule would inevitably increase the risk of missing true bacteremia in at least a fraction of patients. Second, methods aimed at reducing contaminants can be implemented immediately, whereas deriving a prediction rule would take years to develop and test before it could be utilized. Third, implementing prediction rules may be difficult because many physicians prefer to rely on their clinical impressions.11
Reducing contaminants would require improving the technique by which blood cultures are obtained, with the objective of shifting a portion of false positives to true negatives. This might be accomplished in many ways: increasing the time spent on antiseptic scrubbing, improving the ways in which antiseptic devices are used, waiting for the antiseptic to air‐dry completely, choosing the antiseptic that is most effective in trials, drawing blood by venipuncture instead of through an indwelling catheter, limiting the number of venipuncture attempts before requiring a second site to be prepared, requiring all cultures be drawn by trained phlebotomists, and reducing phlebotomist turnover, among others. Denver Health has a 4‐page set of directions for phlebotomists to follow when obtaining blood cultures. Accordingly, there are numerous places the process could break down. Although having 2 phlebotomists involved (ie, one to perform the procedure and the other to observe and guide the first, assuring that all the appropriate steps are followed) might be considered an extraordinary step, our findings suggest the potential saving to the institution could far outweigh the additional personnel expense resulting from such an approach. Other potential solutions we have considered but not tested include providing a monthly salary bonus to the phlebotomist with the lowest contamination rate or giving bonuses to every phlebotomist who achieves a zero contamination rate.
In summary, we have concluded that the resource utilization associated with obtaining blood cultures can best be improved by reducing the small percentage of cultures that represent contaminants rather than by developing rules to reduce the much larger number of true negatives. The magnitude of the potential savings resulting from reducing contaminants is sufficiently large to warrant expending additional resources to accomplish this task.
Because as many as 90% of all blood cultures grow no organisms1 developing rules that predict which patients are at the lowest risk of having bacteremia could improve the utilization of this test and markedly reduce its cost. Of the approximate 10% of cultures that do grow organisms, only about half represent true bacteremia (ie, true positives), whereas the other half are considered contaminants (ie, false positives)2; the latter are known to increase both the cost and duration of care.3 Accordingly, reducing the number of contaminants could also reduce the cost of care. We assessed which of these two strategies would be the most cost effective. Although only 6% of the blood cultures obtained at our hospital represented contaminants, their associated cost was more than twice that associated with the 87% of cultures that were true negatives.
METHODS
We conducted a retrospective review of microbiological results and hospital records of patients for whom blood cultures were obtained in January 2002 at Denver Health Medical Center, a 400‐bed university‐affiliated public safety net hospital. The study was given exempt status by the Colorado Multiple Institutional Review Board. Patients were identified using a preexisting laboratory database.
We adopted the definitions used by Bates et al.3 for the inclusion and exclusion criteria and the definition of a blood culture episode so that we could apply the financial data presented by these authors to our results. Briefly, a blood culture set was defined as a single venipuncture, regardless of the number of bottles sent for culturing, and a blood culture episode was defined as the 48‐hour period beginning when a blood culture was drawn. All sets within the same 48‐hour period were considered part of the same episode. Cultures that grew bacteria were classified as either true positive, representing bacteremia, or false positive, representing contaminants. Determination of whether a patient had a true‐positive culture versus a contaminant was made in a weekly conference attended by the chief of the Infectious Disease Division, an Infectious Disease fellow, and at least one microbiologist, during which the species of organism cultured and the associated clinical data for each patient were considered. Organisms considered to indicate false positives included diphtheroids, Bacillus sp, Propionibacterium sp, coagulase‐negative staphylococci, and micrococci. All other organisms were considered true positives in the setting of appropriate clinical criteria as specified by the CDC guidelines.4 Hospital charges and lengths of stay were obtained from our institutional database.
The cost associated with a true‐negative blood culture was determined by summing the charges for phlebotomy and microbiological testing obtained from the January 2005 Denver Health hospital charge master and applying the cost‐to‐charge ratio reported on the Medicare Cost Report for inpatient services (not including the costs of physician salaries and benefits).
The cost of a false positive was determined two ways: (a) adjusting the data reported by Bates et al.3 for changes in the Consumer Price Index5 and (b) comparing the actual hospital charges of the patients in our sample who had false‐positive cultures with those who did not (adjusting both by the hospital's inpatient cost‐to‐charge ratio, again not including the cost of physician salaries and benefits).
The length of stay and cost of care for patients with true‐ and false‐positive blood cultures were compared by chi‐square analysis. P < .05 was considered statistically significant. The data were not normally distributed and, as such, are presented as medians and interquartile ranges.
RESULTS
Table 1 summarizes the interpretation of the 939 blood cultures drawn in January 2002. Only 6 culture sets (0.6%) could not be classified. The positive predictive value of a positive blood culture was only 53%.
| Blood cultures | Bacteremia | ||
|---|---|---|---|
| Number positive (%) | Number negative (%) | Total | |
| Number positive (%) | 62 (7) | 56 (6) | 118 (13) |
| Number negative (%) | 0 (0) | 815 (87) | 815 (87) |
| Total | 62 (7) | 871 (93) | 933 (100) |
Laboratory charges for patients with true‐negative and false‐positive blood cultures in January 2002 are shown in Table 2. Annualized, the associated charges were $1,781,292, and the costs were $748,143.
| Charge ($) | Tests (N) | Total ($) | |
|---|---|---|---|
| True‐negative cultures | |||
| Phlebotomy | $13.25 | ||
| Microbiology | $147.50 | ||
| Subtotal | $160.75 | 815 | $131,011 |
| False‐positive cultures | |||
| Phlebotomy | $13.25 | ||
| Microbiology | $147.50 | ||
| Identification | $60.75 | ||
| Sensitivity | $89.75 | ||
| Subtotal | $311.25 | 56 | $17,430 |
| $148,441 |
Bates et al.3 found that false‐positive blood cultures increased the length of hospital stay by 4.5 days and increased total charges by $4385 over those for patients with no contaminants. This adjusted to $6878 in 2005 according to the Consumer Price Index.5 After grouping our blood cultures into episodes as defined by Bates et al. (Table 3), we had 41 episodes of contaminated blood cultures that would annualize to charges of $3,383,976 and costs of $1,421,270 after applying the cost‐to‐charge ratio.
| Blood cultures | Bacteremia | ||
|---|---|---|---|
| Number positive (%) | Number negative (%) | Total | |
| |||
| Number positive (%) | 39 (9) | 41 (10) | 80 (19) |
| Number negative (%) | 0 (0) | 335 (81) | 335 (81) |
| Total | 39 (9) | 376 (91) | 415 (100) |
The median length of hospital stay and total charges for the patients with true‐negative and false‐positive blood cultures at Denver Health in January 2002 are summarized in Table 4. Using this approach, patients with false‐positive blood cultures at our institution added 1450‐2200 extra hospital days and accrued additional charges of $4,305,000 and costs of $1,808,100.
| Length of stay (days) | Interquartile range (days) | Total Charges ($) | Interquartile Range ($) | |
|---|---|---|---|---|
| ||||
| True negative | 5 | 2‐12 | $15,158 | $7,007‐$40,270 |
| False positive | 8a | 4‐13.5 | $23,908a | $14,083‐$52,031 |
| Difference | 3 | $8,750 | ||
DISCUSSION
The important finding of this study is that, despite there being nearly 15 times as many true‐negative blood cultures as false‐positive ones, the savings generated by reducing contaminants would be approximately twice that saved by reducing the true negatives (eg, a 50% reduction in the rate of contamination would reduce the total number of false‐positive episodes by 246 annually, saving $710,635‐$904,050, whereas reducing the true negatives by 50% would only save approximately $375,000.
There is no independent gold standard for evaluating the operating characteristics of a blood culture.6 Data from a series of repeated blood cultures represent the closest surrogate. Weinstein et al.7 drew at least 3 sets of cultures from 282 bacteremic patients and noted that bacteremia was documented in 91.5% of the first cultures, in 99.3% in 1 of the first 2 cultures, and in 99.6% in 1 of the first 3 cultures. Because 2 blood culture sets are drawn routinely, the difference between those 2 (if negative) and a third (if it represents a true positive) is 0.3% and would represent a false‐negative culture rate. Given that the true‐negative rate of blood cultures is 87%‐90%,1 the potential 0.3% false‐negative rate would not affect our analysis, and as such, we chose to ignore it. Accordingly, all sets of blood cultures with no growth were classified as true negatives.
Although we cannot show a cause‐and‐effect relationship between false‐positive cultures and the charges associated resulting from them, a recent study suggested that much of the excess length of stay of such patients is attributable to the false‐positive culture itself.8
Because health care costs have exceeded increases in general goods and services, adjusting the results of Bates et al.3 using the Consumer Price Index likely underestimated the projected cost of the false‐positive cultures. This limitation likely accounts for the observation that the difference in actual charges for our patients between those who did and those who did not have false‐positive blood cultures was greater than the cost of these false‐positive cultures as estimated by extrapolating from the data of Bates et al.3 Given the magnitude of the financial difference we observed, however, we suggest that this difference is not of sufficient size to alter our conclusion.
Physicians working at Denver Health are directly employed by the hospital, and the cost of physician salaries and benefits is included in the cost‐to‐charge ratio reported in our Medicare Cost Report. For purposes of this study, however, we elected to utilize a cost‐to‐charge ratio that was exclusive of physician salaries and benefits (ie, 0.42 rather than 0.66) because most hospitals in the United States do not employ their physicians. Accordingly, the costs we present underestimate the true cost to our institution by approximately 32% but are more representative of the costs of services provided by most hospitals in the United States.
Recent studies have shown that the rate of false‐positive cultures is higher when blood is drawn from indwelling catheters than when it is obtained by peripheral venipuncture.9, 10 The rates we cite from the literature2 and from our own institution (Table 1) are aggregate data that include samples drawn from both sites. Separating these would not alter our conclusion that a 50% reduction in false positives would save approximately twice as much as a 50% reduction in false negatives. These studies do, however, identify an important method for reducing false positives: sampling by venipuncture whenever possible, and only drawing through a catheter under very limited circumstances.
There are additional factors that favor a strategy of reducing contaminants over one that attempts to reduce the number of true‐negative cultures. First, reducing the total number of true‐negative blood cultures by 50% would require a very ambitious prediction rule that did not reduce the number of true positives to any meaningful extent. Prediction rules to reduce blood culture testing have been developed for patients with community‐acquired pneumonia, but the rules only reduced the number of cultures by 37% and, more importantly, left 11% of true bacteremias undetected.8 Reducing contaminants would have no effect on the detection of true positives, whereas any prediction rule would inevitably increase the risk of missing true bacteremia in at least a fraction of patients. Second, methods aimed at reducing contaminants can be implemented immediately, whereas deriving a prediction rule would take years to develop and test before it could be utilized. Third, implementing prediction rules may be difficult because many physicians prefer to rely on their clinical impressions.11
Reducing contaminants would require improving the technique by which blood cultures are obtained, with the objective of shifting a portion of false positives to true negatives. This might be accomplished in many ways: increasing the time spent on antiseptic scrubbing, improving the ways in which antiseptic devices are used, waiting for the antiseptic to air‐dry completely, choosing the antiseptic that is most effective in trials, drawing blood by venipuncture instead of through an indwelling catheter, limiting the number of venipuncture attempts before requiring a second site to be prepared, requiring all cultures be drawn by trained phlebotomists, and reducing phlebotomist turnover, among others. Denver Health has a 4‐page set of directions for phlebotomists to follow when obtaining blood cultures. Accordingly, there are numerous places the process could break down. Although having 2 phlebotomists involved (ie, one to perform the procedure and the other to observe and guide the first, assuring that all the appropriate steps are followed) might be considered an extraordinary step, our findings suggest the potential saving to the institution could far outweigh the additional personnel expense resulting from such an approach. Other potential solutions we have considered but not tested include providing a monthly salary bonus to the phlebotomist with the lowest contamination rate or giving bonuses to every phlebotomist who achieves a zero contamination rate.
In summary, we have concluded that the resource utilization associated with obtaining blood cultures can best be improved by reducing the small percentage of cultures that represent contaminants rather than by developing rules to reduce the much larger number of true negatives. The magnitude of the potential savings resulting from reducing contaminants is sufficiently large to warrant expending additional resources to accomplish this task.
- .Clinically relevant, cost‐effective clinical microbiology. Strategies to decrease unnecessary testing.Am J Clin Path.1997;107:154–167.
- ,,, et al.The clinical significance of positive blood cultures in the 1990s: A prospective comprehensive evaluation of the microbiology, epidemiology, and outcome of bacteremia and fungemia in adults.Clin Infect Dis.1997;24:584–602.
- ,,.Contaminant blood cultures and resource utilization: the true consequences of false‐positive results.JAMA.1991;265:365–369.
- ,.Surveillance of nosocomial infection. In:Mayhall CG, ed.Hospital Epidemiology and Infection Control.3rd ed.Philadelphia:Lippincott Williams 106:246–253.
- ,,,.The clinical significance of positive blood cultures: a comprehensive analysis of 500 episodes of bacteremia and fungemia in adults. I. Laboratory and epidemiologic observations.Rev Infect Dis.1983;5:35–70.
- ,,,.Predicting bacteremia in patients with community acquired pneumonia.Am J Respir Crit Care Med.2004;169:342–347.
- ,,,,,.Clinical utility of blood cultures drawn from central venous or arterial catheters in critically ill surgical patients.Crit Care Med.2002;30:7–13.
- ,,.Comparison of contamination rates of catheter‐drawn and peripheral blood cultures.J Hosp Infect.2005;60:118–121.
- ,,,,.Physician response to a prediction rule for the triage of emergency department patients with chest pain.J Gen Intern Med.1994;9:241–247.
- .Clinically relevant, cost‐effective clinical microbiology. Strategies to decrease unnecessary testing.Am J Clin Path.1997;107:154–167.
- ,,, et al.The clinical significance of positive blood cultures in the 1990s: A prospective comprehensive evaluation of the microbiology, epidemiology, and outcome of bacteremia and fungemia in adults.Clin Infect Dis.1997;24:584–602.
- ,,.Contaminant blood cultures and resource utilization: the true consequences of false‐positive results.JAMA.1991;265:365–369.
- ,.Surveillance of nosocomial infection. In:Mayhall CG, ed.Hospital Epidemiology and Infection Control.3rd ed.Philadelphia:Lippincott Williams 106:246–253.
- ,,,.The clinical significance of positive blood cultures: a comprehensive analysis of 500 episodes of bacteremia and fungemia in adults. I. Laboratory and epidemiologic observations.Rev Infect Dis.1983;5:35–70.
- ,,,.Predicting bacteremia in patients with community acquired pneumonia.Am J Respir Crit Care Med.2004;169:342–347.
- ,,,,,.Clinical utility of blood cultures drawn from central venous or arterial catheters in critically ill surgical patients.Crit Care Med.2002;30:7–13.
- ,,.Comparison of contamination rates of catheter‐drawn and peripheral blood cultures.J Hosp Infect.2005;60:118–121.
- ,,,,.Physician response to a prediction rule for the triage of emergency department patients with chest pain.J Gen Intern Med.1994;9:241–247.
Copyright © 2006 Society of Hospital Medicine
Editorial
In addition to marking my initial transition from student to physician, the commencement address by the medical informatics pioneer, Larry Weed, is my most enduring memory of medical school graduation. A provocative thinker in the field of decision support and structured medical records, Weed was credited by my teachers with developing the organized SOAP note. During his address he depressingly equated all the knowledge we had digested during the preceding mentally strenuous 4 years to shoveling a mountain of manure with a teaspoon. Although I agreed that some of the information I learned seemed to lack relevance (still don't know why I needed to learn the details of the Krebs cycle), as I began caring for patients as an intern, I found that much of it mattered. As I launched into residency training, I also discovered that lifelong learning would be a perpetual component of my medical career.
Despite becoming a passionate advocate of practicing evidence‐based medicine (EBM), I also recognized the impossibility of keeping up with the medical literature, given the relentless arrival of journals in the mail. Learning all the evidence is impossible, so we must develop information management skills and allow others to help us in identifying, reviewing, and summarizing salient and valid clinical information.1 One of my vital goals as editor of the Journal of Hospital Medicine is to ensure we provide our readers with useful clinical information that is concise, easily digested, and usable.
To that end we are introducing Patient‐Oriented Evidence that Matters, or POEMs. As described on the InfoPOEMs website (
-
They address a question that we face as clinicians.
-
They measure outcomes that we and our patients care about: symptoms, morbidity, quality of life, and mortality.
-
They have the potential to change the way we practice.
We are not the first journal to do this and join the company of the British Medical Journal and the Cleveland Clinic Journal of Medicine.2, 3 Staff physicians at InfoPOEMs screen more than 100 peer‐reviewed medical journals for relevant articles that practicing physicians can use at the point of care, the patient. A trained physician poet then summarizes selected articles in a standardized manner into a POEM. A POEM begins with a clinical question and then provides a bottom line answer from a recently published journal article. This is followed by a structured abstract that includes the study design and setting, followed by a synopsis of the article.
We will start with at least 2 POEMs per issue focused on clinical topics relevant to hospitalists. Soon, an experienced academic hospitalist and knowledgeable expert in EBM, Dr. Jennifer Kleinbart, will be writing POEMs for hospitalists. We look forward to your opinions about whether we should increase this content. Let me know.
- ,.Teaching evidence‐based medicine: should we be teaching information management instead?Acad Med.2005;80:685‐689.
- .A POEM a week for the BMJ.Br Med J.2002;325:983.
- POEMs: Keeping up with clinical research that can change your practice.Cleve Clin J Med.2004;71:222.
In addition to marking my initial transition from student to physician, the commencement address by the medical informatics pioneer, Larry Weed, is my most enduring memory of medical school graduation. A provocative thinker in the field of decision support and structured medical records, Weed was credited by my teachers with developing the organized SOAP note. During his address he depressingly equated all the knowledge we had digested during the preceding mentally strenuous 4 years to shoveling a mountain of manure with a teaspoon. Although I agreed that some of the information I learned seemed to lack relevance (still don't know why I needed to learn the details of the Krebs cycle), as I began caring for patients as an intern, I found that much of it mattered. As I launched into residency training, I also discovered that lifelong learning would be a perpetual component of my medical career.
Despite becoming a passionate advocate of practicing evidence‐based medicine (EBM), I also recognized the impossibility of keeping up with the medical literature, given the relentless arrival of journals in the mail. Learning all the evidence is impossible, so we must develop information management skills and allow others to help us in identifying, reviewing, and summarizing salient and valid clinical information.1 One of my vital goals as editor of the Journal of Hospital Medicine is to ensure we provide our readers with useful clinical information that is concise, easily digested, and usable.
To that end we are introducing Patient‐Oriented Evidence that Matters, or POEMs. As described on the InfoPOEMs website (
-
They address a question that we face as clinicians.
-
They measure outcomes that we and our patients care about: symptoms, morbidity, quality of life, and mortality.
-
They have the potential to change the way we practice.
We are not the first journal to do this and join the company of the British Medical Journal and the Cleveland Clinic Journal of Medicine.2, 3 Staff physicians at InfoPOEMs screen more than 100 peer‐reviewed medical journals for relevant articles that practicing physicians can use at the point of care, the patient. A trained physician poet then summarizes selected articles in a standardized manner into a POEM. A POEM begins with a clinical question and then provides a bottom line answer from a recently published journal article. This is followed by a structured abstract that includes the study design and setting, followed by a synopsis of the article.
We will start with at least 2 POEMs per issue focused on clinical topics relevant to hospitalists. Soon, an experienced academic hospitalist and knowledgeable expert in EBM, Dr. Jennifer Kleinbart, will be writing POEMs for hospitalists. We look forward to your opinions about whether we should increase this content. Let me know.
In addition to marking my initial transition from student to physician, the commencement address by the medical informatics pioneer, Larry Weed, is my most enduring memory of medical school graduation. A provocative thinker in the field of decision support and structured medical records, Weed was credited by my teachers with developing the organized SOAP note. During his address he depressingly equated all the knowledge we had digested during the preceding mentally strenuous 4 years to shoveling a mountain of manure with a teaspoon. Although I agreed that some of the information I learned seemed to lack relevance (still don't know why I needed to learn the details of the Krebs cycle), as I began caring for patients as an intern, I found that much of it mattered. As I launched into residency training, I also discovered that lifelong learning would be a perpetual component of my medical career.
Despite becoming a passionate advocate of practicing evidence‐based medicine (EBM), I also recognized the impossibility of keeping up with the medical literature, given the relentless arrival of journals in the mail. Learning all the evidence is impossible, so we must develop information management skills and allow others to help us in identifying, reviewing, and summarizing salient and valid clinical information.1 One of my vital goals as editor of the Journal of Hospital Medicine is to ensure we provide our readers with useful clinical information that is concise, easily digested, and usable.
To that end we are introducing Patient‐Oriented Evidence that Matters, or POEMs. As described on the InfoPOEMs website (
-
They address a question that we face as clinicians.
-
They measure outcomes that we and our patients care about: symptoms, morbidity, quality of life, and mortality.
-
They have the potential to change the way we practice.
We are not the first journal to do this and join the company of the British Medical Journal and the Cleveland Clinic Journal of Medicine.2, 3 Staff physicians at InfoPOEMs screen more than 100 peer‐reviewed medical journals for relevant articles that practicing physicians can use at the point of care, the patient. A trained physician poet then summarizes selected articles in a standardized manner into a POEM. A POEM begins with a clinical question and then provides a bottom line answer from a recently published journal article. This is followed by a structured abstract that includes the study design and setting, followed by a synopsis of the article.
We will start with at least 2 POEMs per issue focused on clinical topics relevant to hospitalists. Soon, an experienced academic hospitalist and knowledgeable expert in EBM, Dr. Jennifer Kleinbart, will be writing POEMs for hospitalists. We look forward to your opinions about whether we should increase this content. Let me know.
- ,.Teaching evidence‐based medicine: should we be teaching information management instead?Acad Med.2005;80:685‐689.
- .A POEM a week for the BMJ.Br Med J.2002;325:983.
- POEMs: Keeping up with clinical research that can change your practice.Cleve Clin J Med.2004;71:222.
- ,.Teaching evidence‐based medicine: should we be teaching information management instead?Acad Med.2005;80:685‐689.
- .A POEM a week for the BMJ.Br Med J.2002;325:983.
- POEMs: Keeping up with clinical research that can change your practice.Cleve Clin J Med.2004;71:222.