User login
Hypoglycemia in Hospitalized Patients / Garg et al.
Glycemic control in hospitalized patients is receiving greater attention. The American Diabetes Association and the American College of Endocrinology recently issued a joint consensus statement on the need to implement tight blood glucose (BG) control in hospitalized patients.1, 2 The Joint Commission on Accreditation of Healthcare Organizations (JACHO) has developed an Advanced Inpatient Diabetes Care Certification Program for hospitals. However, despite all these efforts, it has been difficult to change how well glucose is controlled.3 A major hurdle in implementing glycemic control strategies is the prevalent fear of hypoglycemia among hospital staff. Although there are multiple protocols for insulin treatment,47 guidelines for the prevention and treatment of hypoglycemia are lacking. Once a hypoglycemic episode has occurred, reducing the dosage of diabetes medications may reduce subsequent episodes. This study was conducted to assess whether diabetes medications were decreased following an episode of hypoglycemia that led to treatment with intravenous (IV) dextrose.
METHODS
Data were collected by the Diabetes Subcommittee of the Pharmacy and Therapeutics Committee as part of a quality improvement initiative. Hypoglycemic episodes were identified by computerized orders for 50% dextrose solution. All orders in a 1‐month period (June 2006) were collected. Characteristics of patients experiencing these episodes were identified from the electronic medical records (EMR). The following data were collected: age, sex, history of diabetes, serum creatinine, diabetes medications at time of hypoglycemia, blood glucose at time of hypoglycemia, and all BG values in the 24 hours before hypoglycemia. BG values included those obtained in the laboratory as well as those obtained by bedside blood glucose testing. Treatment changes made right when the hypoglycemic episode occurred (immediate) and within 24 hours of the hypoglycemic episode (subsequent) were evaluated by 2 diabetes specialists, a board‐certified endocrinologist and a nurse‐practitioner working on the diabetes management service. The 2 practitioners regularly work together, but the data were evaluated independently. Because there are no specific guidelines, the appropriateness of change in treatment was based on general guidelines and experience. For example, if hypoglycemia developed while a patient was on insulin infusion therapy, it was appropriate to stop the drip when the episode of hypoglycemia occurred and to restart it at a lower rate according to the insulin infusion protocol. No subsequent changes would have been made in a situation such as this, and it was deemed appropriate. However, if a patient developed hypoglycemia while on subcutaneous (SC) insulin and then insulin was either completely discontinued or no change was made in subsequent orders, it was deemed inappropriate. The 2 diabetes specialists agreed in 87% of cases (kappa = 0.68, 95% CI 0.53‐0.84). In the 13% of cases in which the diabetes specialists had different opinions, they conferred to reach agreement. In patients with more than 1 episode, data related to the first episode were evaluated. Data are presented as means with SDs.
RESULTS
The EMR contained information on time of episode of hypoglycemia and medication changes for 52 patients, all of whom were in the study. Patient characteristics and mean blood glucose level are shown in Table 1. All patients were being treated with insulin when the episode of hypoglycemia occurred: 9 were on intravenous (IV) insulin alone, 3 on IV and subcutaneous (SC) insulin, 30 on scheduled SC insulin, and 10 on sliding‐scale SC insulin alone. Three patients were prescribed sulfonylurea drugs in addition to insulin. Insulin dosage of all 52 patients was held at the time of the hypoglycemic episode. Diabetes specialists agreed with this decision 100% of the time. Only 21 patients (40%) subsequently had reductions made in their treatment dosage, and diabetes specialists agreed with the changes made for 11 of these patients (52%). Thirty‐one patients (60%) had no changes made to their treatment, and diabetes specialists agreed with that decision for 10 of these patients (32%). When diabetes specialists disagreed with a decision, they would have decreased the insulin dose or changed the regimen in a different way. Details on the changes in treatment and whether diabetes specialists agreed with the changes are shown in Table 2. Twenty‐four hours after an episode of hypoglycemia, mean blood glucose of patients whose providers had made changes was 190.7 87.9 mg/dL and that of patients whose providers had not made changes was 122.6 43.2 mg/dL (P = NS). The mean BG of patients for whom the diabetologists agreed with the decision was 110.7 90.3 mg/dL, and that of patients for whom they disagreed with the decision was 139.7 42.8 mg/dL (P = NS).
| Number of patients | 52 |
| Age (years) | 64.8 15.8 |
| Sex (male:female), n | 29:23 |
| Preexisting diabetes, n (%) | |
| No diabetes | 17 (33%) |
| Type 1 diabetes | 9 (17%) |
| Type 2 diabetes | 26 (50%) |
| Serum creatinine (mg/dL) | 2.1 1.9 |
| Serum creatinine 2 mg/dL, n (%) | 21 (40%) |
| BG at time of hypoglycemia (mg/dL) | 52.1 9.3 |
| Mean BG during 24 hours before hypoglycemic episode (mg/dL) | 137.5 57.0 |
| Mean BG during 24 hours after hypoglycemic episode (mg/dL) | 112 74.7 |
| Change | Number of patients receiving change | Number of patients for whom diabetes specialists agreed with change, n (%) |
|---|---|---|
| Basal insulin decreased | 6 | 6 (100%) |
| Basal insulin stopped | 2 | 0 (0%) |
| IV insulin changed to scheduled SC insulin | 2 | 1 (50%) |
| IV insulin to SC sliding‐scale insulin | 1 | 0 (0%) |
| Change in sliding‐scale insulin dose | 3 | 1 (33%) |
| Sliding‐scale insulin stopped | 1 | 1 (100%) |
| IV insulin started | 1 | 1 (100%) |
| Sulfonylurea stopped | 1 | 1 (100%) |
| Scheduled insulin changed to sliding scale | 1 | 0 (0%) |
| Insulin discontinued | 3 | 0 (0%) |
| No change | 31 | 10 (32%) |
DISCUSSION
These results suggest that treatment modification following an episode of hypoglycemia may be suboptimal. These data provide no information about the clinical circumstances leading to the choice of treatment with IV dextrose, as opposed to oral glucose or glucagon. Presumably, dextrose was chosen for many patients whom the physician considered to require the most urgent treatment. Appropriately, immediate treatment with insulin was held for all patients. On the other hand, 60% of the patients continued to receive the same insulin dose 24 hours after the hypoglycemic episode. Diabetes specialists judged continuation of the same dose as inappropriate in two thirds of the cases. Even when changes in treatment were made, those changes were judged suboptimal in half the cases. Blood glucose level 24 hours after an episode of hypoglycemia reflects these problems. These findings suggest that opportunities to prevent hypoglycemic episodes in the future are frequently missed. Lack of knowledge and/or guidelines for adjusting insulin dose following an episode of hypoglycemia seemed to have led to suboptimal changes for most patients.
Overall incidence of hypoglycemia (60 mg/dL) among patients with diabetes admitted to a hospital has been reported to be 23%.8 In patients receiving continuous intravenous insulin infusion, the incidence of hypoglycemia has been variously reported as from 1.2% to 18.7%.9, 10 All insulin infusion protocols have guidelines for the immediate treatment of hypoglycemia and recommend steps to prevent further episodes. Although many hospitals have protocols for immediate action when hypoglycemia occurs (eg, hold insulin, give juice or dextrose), to our knowledge, no specific guidelines exist for adjustment of subcutaneous insulin following an episode of hypoglycemia. The vast majority of patients in a hospital are treated with SC insulin as opposed to IV insulin, and fear of hypoglycemia is a major barrier to intensified therapy. If widely applied, standardized protocols have the potential to be effective in preventing hypoglycemia.9
A limitation of our study was that it was a retrospective data analysis. We did not look at changes in clinical condition, in nutrition, and in other medications that might have led to the episode of hypoglycemia and affected the decision about which antidiabetic medications to treat with. Data on further episodes of hypoglycemia were also not available.
In conclusion, we have shown that treatment changes after an episode of hypoglycemia are chaotic and may be suboptimal. Standardized protocols may be helpful for making effective changes and potentially can reduce the risk of further episodes of hypoglycemia.
- American College of Endocrinology and American Diabetes Association Consensus statement on inpatient diabetes and glycemic control: a call to action.Diabetes Care.2006;29:1955–1962.
- American College of Endocrinology and American Diabetes Association consensus statement on inpatient diabetes and glycemic control.Endocr Pract.2006;12:458–468.
- ,,.Current state of inpatient diabetes burden and care, and goal of the conference.Endocr Pract.2006;12(suppl 3, sddendum):1–10.
- ,,,.Intravenous insulin infusion therapy: indications, methods, and transition to subcutaneous insulin therapy.Endocr Pract.2004;10(suppl 2):71–80.
- ,,,,.Evaluation of an intensive insulin protocol for septic patients in a medical intensive care unit.Crit Care Med.2006;34:2974–2978.
- ,,, et al.Implementation of a safe and effective insulin infusion protocol in a medical intensive care unit.Diabetes Care.2004;27:461–467.
- ,,, et al.Efficacy and safety of an insulin infusion protocol in a surgical ICU.J Am Coll Surg.2006;202(1):1–9.
- ,,.Glycemic control and sliding scale insulin use in medical inpatients with diabetes mellitus.Arch Intern Med.1997;157:545–552.
- ,,, et al.Hospital hypoglycemia: not only treatment but also prevention.Endocr Pract.2004;10(suppl 2):89–99.
- ,,, et al.Intensive insulin therapy in the medical ICU.N Engl J Med.2006;354:449–461.
Glycemic control in hospitalized patients is receiving greater attention. The American Diabetes Association and the American College of Endocrinology recently issued a joint consensus statement on the need to implement tight blood glucose (BG) control in hospitalized patients.1, 2 The Joint Commission on Accreditation of Healthcare Organizations (JACHO) has developed an Advanced Inpatient Diabetes Care Certification Program for hospitals. However, despite all these efforts, it has been difficult to change how well glucose is controlled.3 A major hurdle in implementing glycemic control strategies is the prevalent fear of hypoglycemia among hospital staff. Although there are multiple protocols for insulin treatment,47 guidelines for the prevention and treatment of hypoglycemia are lacking. Once a hypoglycemic episode has occurred, reducing the dosage of diabetes medications may reduce subsequent episodes. This study was conducted to assess whether diabetes medications were decreased following an episode of hypoglycemia that led to treatment with intravenous (IV) dextrose.
METHODS
Data were collected by the Diabetes Subcommittee of the Pharmacy and Therapeutics Committee as part of a quality improvement initiative. Hypoglycemic episodes were identified by computerized orders for 50% dextrose solution. All orders in a 1‐month period (June 2006) were collected. Characteristics of patients experiencing these episodes were identified from the electronic medical records (EMR). The following data were collected: age, sex, history of diabetes, serum creatinine, diabetes medications at time of hypoglycemia, blood glucose at time of hypoglycemia, and all BG values in the 24 hours before hypoglycemia. BG values included those obtained in the laboratory as well as those obtained by bedside blood glucose testing. Treatment changes made right when the hypoglycemic episode occurred (immediate) and within 24 hours of the hypoglycemic episode (subsequent) were evaluated by 2 diabetes specialists, a board‐certified endocrinologist and a nurse‐practitioner working on the diabetes management service. The 2 practitioners regularly work together, but the data were evaluated independently. Because there are no specific guidelines, the appropriateness of change in treatment was based on general guidelines and experience. For example, if hypoglycemia developed while a patient was on insulin infusion therapy, it was appropriate to stop the drip when the episode of hypoglycemia occurred and to restart it at a lower rate according to the insulin infusion protocol. No subsequent changes would have been made in a situation such as this, and it was deemed appropriate. However, if a patient developed hypoglycemia while on subcutaneous (SC) insulin and then insulin was either completely discontinued or no change was made in subsequent orders, it was deemed inappropriate. The 2 diabetes specialists agreed in 87% of cases (kappa = 0.68, 95% CI 0.53‐0.84). In the 13% of cases in which the diabetes specialists had different opinions, they conferred to reach agreement. In patients with more than 1 episode, data related to the first episode were evaluated. Data are presented as means with SDs.
RESULTS
The EMR contained information on time of episode of hypoglycemia and medication changes for 52 patients, all of whom were in the study. Patient characteristics and mean blood glucose level are shown in Table 1. All patients were being treated with insulin when the episode of hypoglycemia occurred: 9 were on intravenous (IV) insulin alone, 3 on IV and subcutaneous (SC) insulin, 30 on scheduled SC insulin, and 10 on sliding‐scale SC insulin alone. Three patients were prescribed sulfonylurea drugs in addition to insulin. Insulin dosage of all 52 patients was held at the time of the hypoglycemic episode. Diabetes specialists agreed with this decision 100% of the time. Only 21 patients (40%) subsequently had reductions made in their treatment dosage, and diabetes specialists agreed with the changes made for 11 of these patients (52%). Thirty‐one patients (60%) had no changes made to their treatment, and diabetes specialists agreed with that decision for 10 of these patients (32%). When diabetes specialists disagreed with a decision, they would have decreased the insulin dose or changed the regimen in a different way. Details on the changes in treatment and whether diabetes specialists agreed with the changes are shown in Table 2. Twenty‐four hours after an episode of hypoglycemia, mean blood glucose of patients whose providers had made changes was 190.7 87.9 mg/dL and that of patients whose providers had not made changes was 122.6 43.2 mg/dL (P = NS). The mean BG of patients for whom the diabetologists agreed with the decision was 110.7 90.3 mg/dL, and that of patients for whom they disagreed with the decision was 139.7 42.8 mg/dL (P = NS).
| Number of patients | 52 |
| Age (years) | 64.8 15.8 |
| Sex (male:female), n | 29:23 |
| Preexisting diabetes, n (%) | |
| No diabetes | 17 (33%) |
| Type 1 diabetes | 9 (17%) |
| Type 2 diabetes | 26 (50%) |
| Serum creatinine (mg/dL) | 2.1 1.9 |
| Serum creatinine 2 mg/dL, n (%) | 21 (40%) |
| BG at time of hypoglycemia (mg/dL) | 52.1 9.3 |
| Mean BG during 24 hours before hypoglycemic episode (mg/dL) | 137.5 57.0 |
| Mean BG during 24 hours after hypoglycemic episode (mg/dL) | 112 74.7 |
| Change | Number of patients receiving change | Number of patients for whom diabetes specialists agreed with change, n (%) |
|---|---|---|
| Basal insulin decreased | 6 | 6 (100%) |
| Basal insulin stopped | 2 | 0 (0%) |
| IV insulin changed to scheduled SC insulin | 2 | 1 (50%) |
| IV insulin to SC sliding‐scale insulin | 1 | 0 (0%) |
| Change in sliding‐scale insulin dose | 3 | 1 (33%) |
| Sliding‐scale insulin stopped | 1 | 1 (100%) |
| IV insulin started | 1 | 1 (100%) |
| Sulfonylurea stopped | 1 | 1 (100%) |
| Scheduled insulin changed to sliding scale | 1 | 0 (0%) |
| Insulin discontinued | 3 | 0 (0%) |
| No change | 31 | 10 (32%) |
DISCUSSION
These results suggest that treatment modification following an episode of hypoglycemia may be suboptimal. These data provide no information about the clinical circumstances leading to the choice of treatment with IV dextrose, as opposed to oral glucose or glucagon. Presumably, dextrose was chosen for many patients whom the physician considered to require the most urgent treatment. Appropriately, immediate treatment with insulin was held for all patients. On the other hand, 60% of the patients continued to receive the same insulin dose 24 hours after the hypoglycemic episode. Diabetes specialists judged continuation of the same dose as inappropriate in two thirds of the cases. Even when changes in treatment were made, those changes were judged suboptimal in half the cases. Blood glucose level 24 hours after an episode of hypoglycemia reflects these problems. These findings suggest that opportunities to prevent hypoglycemic episodes in the future are frequently missed. Lack of knowledge and/or guidelines for adjusting insulin dose following an episode of hypoglycemia seemed to have led to suboptimal changes for most patients.
Overall incidence of hypoglycemia (60 mg/dL) among patients with diabetes admitted to a hospital has been reported to be 23%.8 In patients receiving continuous intravenous insulin infusion, the incidence of hypoglycemia has been variously reported as from 1.2% to 18.7%.9, 10 All insulin infusion protocols have guidelines for the immediate treatment of hypoglycemia and recommend steps to prevent further episodes. Although many hospitals have protocols for immediate action when hypoglycemia occurs (eg, hold insulin, give juice or dextrose), to our knowledge, no specific guidelines exist for adjustment of subcutaneous insulin following an episode of hypoglycemia. The vast majority of patients in a hospital are treated with SC insulin as opposed to IV insulin, and fear of hypoglycemia is a major barrier to intensified therapy. If widely applied, standardized protocols have the potential to be effective in preventing hypoglycemia.9
A limitation of our study was that it was a retrospective data analysis. We did not look at changes in clinical condition, in nutrition, and in other medications that might have led to the episode of hypoglycemia and affected the decision about which antidiabetic medications to treat with. Data on further episodes of hypoglycemia were also not available.
In conclusion, we have shown that treatment changes after an episode of hypoglycemia are chaotic and may be suboptimal. Standardized protocols may be helpful for making effective changes and potentially can reduce the risk of further episodes of hypoglycemia.
Glycemic control in hospitalized patients is receiving greater attention. The American Diabetes Association and the American College of Endocrinology recently issued a joint consensus statement on the need to implement tight blood glucose (BG) control in hospitalized patients.1, 2 The Joint Commission on Accreditation of Healthcare Organizations (JACHO) has developed an Advanced Inpatient Diabetes Care Certification Program for hospitals. However, despite all these efforts, it has been difficult to change how well glucose is controlled.3 A major hurdle in implementing glycemic control strategies is the prevalent fear of hypoglycemia among hospital staff. Although there are multiple protocols for insulin treatment,47 guidelines for the prevention and treatment of hypoglycemia are lacking. Once a hypoglycemic episode has occurred, reducing the dosage of diabetes medications may reduce subsequent episodes. This study was conducted to assess whether diabetes medications were decreased following an episode of hypoglycemia that led to treatment with intravenous (IV) dextrose.
METHODS
Data were collected by the Diabetes Subcommittee of the Pharmacy and Therapeutics Committee as part of a quality improvement initiative. Hypoglycemic episodes were identified by computerized orders for 50% dextrose solution. All orders in a 1‐month period (June 2006) were collected. Characteristics of patients experiencing these episodes were identified from the electronic medical records (EMR). The following data were collected: age, sex, history of diabetes, serum creatinine, diabetes medications at time of hypoglycemia, blood glucose at time of hypoglycemia, and all BG values in the 24 hours before hypoglycemia. BG values included those obtained in the laboratory as well as those obtained by bedside blood glucose testing. Treatment changes made right when the hypoglycemic episode occurred (immediate) and within 24 hours of the hypoglycemic episode (subsequent) were evaluated by 2 diabetes specialists, a board‐certified endocrinologist and a nurse‐practitioner working on the diabetes management service. The 2 practitioners regularly work together, but the data were evaluated independently. Because there are no specific guidelines, the appropriateness of change in treatment was based on general guidelines and experience. For example, if hypoglycemia developed while a patient was on insulin infusion therapy, it was appropriate to stop the drip when the episode of hypoglycemia occurred and to restart it at a lower rate according to the insulin infusion protocol. No subsequent changes would have been made in a situation such as this, and it was deemed appropriate. However, if a patient developed hypoglycemia while on subcutaneous (SC) insulin and then insulin was either completely discontinued or no change was made in subsequent orders, it was deemed inappropriate. The 2 diabetes specialists agreed in 87% of cases (kappa = 0.68, 95% CI 0.53‐0.84). In the 13% of cases in which the diabetes specialists had different opinions, they conferred to reach agreement. In patients with more than 1 episode, data related to the first episode were evaluated. Data are presented as means with SDs.
RESULTS
The EMR contained information on time of episode of hypoglycemia and medication changes for 52 patients, all of whom were in the study. Patient characteristics and mean blood glucose level are shown in Table 1. All patients were being treated with insulin when the episode of hypoglycemia occurred: 9 were on intravenous (IV) insulin alone, 3 on IV and subcutaneous (SC) insulin, 30 on scheduled SC insulin, and 10 on sliding‐scale SC insulin alone. Three patients were prescribed sulfonylurea drugs in addition to insulin. Insulin dosage of all 52 patients was held at the time of the hypoglycemic episode. Diabetes specialists agreed with this decision 100% of the time. Only 21 patients (40%) subsequently had reductions made in their treatment dosage, and diabetes specialists agreed with the changes made for 11 of these patients (52%). Thirty‐one patients (60%) had no changes made to their treatment, and diabetes specialists agreed with that decision for 10 of these patients (32%). When diabetes specialists disagreed with a decision, they would have decreased the insulin dose or changed the regimen in a different way. Details on the changes in treatment and whether diabetes specialists agreed with the changes are shown in Table 2. Twenty‐four hours after an episode of hypoglycemia, mean blood glucose of patients whose providers had made changes was 190.7 87.9 mg/dL and that of patients whose providers had not made changes was 122.6 43.2 mg/dL (P = NS). The mean BG of patients for whom the diabetologists agreed with the decision was 110.7 90.3 mg/dL, and that of patients for whom they disagreed with the decision was 139.7 42.8 mg/dL (P = NS).
| Number of patients | 52 |
| Age (years) | 64.8 15.8 |
| Sex (male:female), n | 29:23 |
| Preexisting diabetes, n (%) | |
| No diabetes | 17 (33%) |
| Type 1 diabetes | 9 (17%) |
| Type 2 diabetes | 26 (50%) |
| Serum creatinine (mg/dL) | 2.1 1.9 |
| Serum creatinine 2 mg/dL, n (%) | 21 (40%) |
| BG at time of hypoglycemia (mg/dL) | 52.1 9.3 |
| Mean BG during 24 hours before hypoglycemic episode (mg/dL) | 137.5 57.0 |
| Mean BG during 24 hours after hypoglycemic episode (mg/dL) | 112 74.7 |
| Change | Number of patients receiving change | Number of patients for whom diabetes specialists agreed with change, n (%) |
|---|---|---|
| Basal insulin decreased | 6 | 6 (100%) |
| Basal insulin stopped | 2 | 0 (0%) |
| IV insulin changed to scheduled SC insulin | 2 | 1 (50%) |
| IV insulin to SC sliding‐scale insulin | 1 | 0 (0%) |
| Change in sliding‐scale insulin dose | 3 | 1 (33%) |
| Sliding‐scale insulin stopped | 1 | 1 (100%) |
| IV insulin started | 1 | 1 (100%) |
| Sulfonylurea stopped | 1 | 1 (100%) |
| Scheduled insulin changed to sliding scale | 1 | 0 (0%) |
| Insulin discontinued | 3 | 0 (0%) |
| No change | 31 | 10 (32%) |
DISCUSSION
These results suggest that treatment modification following an episode of hypoglycemia may be suboptimal. These data provide no information about the clinical circumstances leading to the choice of treatment with IV dextrose, as opposed to oral glucose or glucagon. Presumably, dextrose was chosen for many patients whom the physician considered to require the most urgent treatment. Appropriately, immediate treatment with insulin was held for all patients. On the other hand, 60% of the patients continued to receive the same insulin dose 24 hours after the hypoglycemic episode. Diabetes specialists judged continuation of the same dose as inappropriate in two thirds of the cases. Even when changes in treatment were made, those changes were judged suboptimal in half the cases. Blood glucose level 24 hours after an episode of hypoglycemia reflects these problems. These findings suggest that opportunities to prevent hypoglycemic episodes in the future are frequently missed. Lack of knowledge and/or guidelines for adjusting insulin dose following an episode of hypoglycemia seemed to have led to suboptimal changes for most patients.
Overall incidence of hypoglycemia (60 mg/dL) among patients with diabetes admitted to a hospital has been reported to be 23%.8 In patients receiving continuous intravenous insulin infusion, the incidence of hypoglycemia has been variously reported as from 1.2% to 18.7%.9, 10 All insulin infusion protocols have guidelines for the immediate treatment of hypoglycemia and recommend steps to prevent further episodes. Although many hospitals have protocols for immediate action when hypoglycemia occurs (eg, hold insulin, give juice or dextrose), to our knowledge, no specific guidelines exist for adjustment of subcutaneous insulin following an episode of hypoglycemia. The vast majority of patients in a hospital are treated with SC insulin as opposed to IV insulin, and fear of hypoglycemia is a major barrier to intensified therapy. If widely applied, standardized protocols have the potential to be effective in preventing hypoglycemia.9
A limitation of our study was that it was a retrospective data analysis. We did not look at changes in clinical condition, in nutrition, and in other medications that might have led to the episode of hypoglycemia and affected the decision about which antidiabetic medications to treat with. Data on further episodes of hypoglycemia were also not available.
In conclusion, we have shown that treatment changes after an episode of hypoglycemia are chaotic and may be suboptimal. Standardized protocols may be helpful for making effective changes and potentially can reduce the risk of further episodes of hypoglycemia.
- American College of Endocrinology and American Diabetes Association Consensus statement on inpatient diabetes and glycemic control: a call to action.Diabetes Care.2006;29:1955–1962.
- American College of Endocrinology and American Diabetes Association consensus statement on inpatient diabetes and glycemic control.Endocr Pract.2006;12:458–468.
- ,,.Current state of inpatient diabetes burden and care, and goal of the conference.Endocr Pract.2006;12(suppl 3, sddendum):1–10.
- ,,,.Intravenous insulin infusion therapy: indications, methods, and transition to subcutaneous insulin therapy.Endocr Pract.2004;10(suppl 2):71–80.
- ,,,,.Evaluation of an intensive insulin protocol for septic patients in a medical intensive care unit.Crit Care Med.2006;34:2974–2978.
- ,,, et al.Implementation of a safe and effective insulin infusion protocol in a medical intensive care unit.Diabetes Care.2004;27:461–467.
- ,,, et al.Efficacy and safety of an insulin infusion protocol in a surgical ICU.J Am Coll Surg.2006;202(1):1–9.
- ,,.Glycemic control and sliding scale insulin use in medical inpatients with diabetes mellitus.Arch Intern Med.1997;157:545–552.
- ,,, et al.Hospital hypoglycemia: not only treatment but also prevention.Endocr Pract.2004;10(suppl 2):89–99.
- ,,, et al.Intensive insulin therapy in the medical ICU.N Engl J Med.2006;354:449–461.
- American College of Endocrinology and American Diabetes Association Consensus statement on inpatient diabetes and glycemic control: a call to action.Diabetes Care.2006;29:1955–1962.
- American College of Endocrinology and American Diabetes Association consensus statement on inpatient diabetes and glycemic control.Endocr Pract.2006;12:458–468.
- ,,.Current state of inpatient diabetes burden and care, and goal of the conference.Endocr Pract.2006;12(suppl 3, sddendum):1–10.
- ,,,.Intravenous insulin infusion therapy: indications, methods, and transition to subcutaneous insulin therapy.Endocr Pract.2004;10(suppl 2):71–80.
- ,,,,.Evaluation of an intensive insulin protocol for septic patients in a medical intensive care unit.Crit Care Med.2006;34:2974–2978.
- ,,, et al.Implementation of a safe and effective insulin infusion protocol in a medical intensive care unit.Diabetes Care.2004;27:461–467.
- ,,, et al.Efficacy and safety of an insulin infusion protocol in a surgical ICU.J Am Coll Surg.2006;202(1):1–9.
- ,,.Glycemic control and sliding scale insulin use in medical inpatients with diabetes mellitus.Arch Intern Med.1997;157:545–552.
- ,,, et al.Hospital hypoglycemia: not only treatment but also prevention.Endocr Pract.2004;10(suppl 2):89–99.
- ,,, et al.Intensive insulin therapy in the medical ICU.N Engl J Med.2006;354:449–461.
Referral for CT Pulmonary Angiography
Approximately 10 million patients present to emergency departments each year with symptoms raising concern of thromboembolism (VTE).1 The current gold standard for diagnosis of VTE is pulmonary angiography.2 As this study is invasive, alternative imaging protocols have been sought. CTPA, when combined with measures of pretest probability, equals or surpasses the ability of pulmonary angiography to detect VTE and can improve the ability of clinicians to rule out VTE.38 In a study of 930 patients, application of clinical rules in addition to D‐dimer testing decreased the number of CTPAs ordered by 50%.9 One of the most common clinical rule sets is the Wells Score, which relies on historical features related to the risk of DVT/VTE and physical examination findings.10, 11
Other institutions have demonstrated an increase in the number of CTPAs ordered and VTE diagnoses since the study became widely available.13 Based on the observation of an increasing number of CTPAs ordered at our institution without an increase in the number of VTEs diagnosed, we aimed to ascertain the physician ordering practices for CTPA. We hypothesized that CTPAs were ordered at a greater frequency in a low‐risk population because an institutional clinical algorithm was lacking.
METHODS
Charts of all patients aged 18‐100 with CTPA ordered to rule out acute VTE were retrospectively examined. A Simplified Wells Score was applied using only the information available to the ordering physician at the time the CTPA was performed. Patients were stratified by their Simplified Wells Score to low (0‐1 points), intermediate (2‐6 points), or high (>6 points) pretest clinical probability. A D‐dimer value, if ordered, was used to further stratify patients based on a positive or negative result. The official radiologic report of the CTPA was used to determine the rate of VTE diagnosis for the study population.
RESULTS
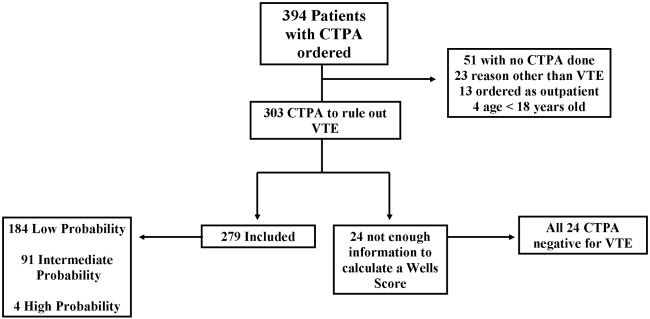
Three hundred and ninety‐four patients were referred for CTPA (Fig. 1). Two hundred and seventy‐nine had adequate clinical data to calculate a Simplified Wells Score and were included in the study. Of the 279 studies included, 75% were ordered through the emergency department and 25% from inpatient services (Table 1). The study patients were stratified according to the Simplified Wells criteria: 184 patients (66%) had low clinical probability, 91 (33%) had intermediate clinical probability, and 4 (1%) had high clinical probability. Nineteen (7%) patients had a history of DVT or VTE, and 28 (10%) had a history of active cancer at the time of their CTPA. One hundred and twenty‐five of the 279 patients had a D‐dimer performed (Fig. 2). One hundred and eight were positive, and 17 were negative. Of the 17 patients who had a negative D‐dimer and underwent CTPA testing, none were diagnosed with VTE. Eighty‐three low‐clinical‐probability patients underwent CTPA without D‐dimer testing, 4 of whom were diagnosed with VTE.
| Low (n = 184) | Intermediate (n = 91) | High (n = 4) | Total (n = 279) | |
|---|---|---|---|---|
| Age (years), mean | 52 | 59 | 62 | 58 |
| Male, n (%) | 82 (45) | 44 (48) | 1 (25) | 127 (46) |
| Female, n (%) | 102 (55) | 47 (52) | 3 (75) | 152 (54) |
| Emergency department, n (%) | 150 (82) | 47 (52) | 4 (100) | 225 (75) |
| Medical, n (%) | 22 (12) | 18 (20) | 0 | 40 (13) |
| Surgical, n (%) | 9 (5) | 14 (15) | 0 | 23 (7) |
| ICU, n (%) | 3 (1) | 12 (13) | 0 | 15 (5) |
| Wells Score, mean | 0.72 | 3.4 | 7.8 | 1.6 |
| D‐dimer performed, n (%) | 101 (55) | 21 (23) | 3 (75) | 125 (45) |
| D‐dimer positive, n (%) | 89 (88) | 16 (76) | 3 (100) | 108 (86) |
| D‐dimer negative, n (%) | 12 (12) | 5 (24) | 0 | 17 (14) |
| CTPA positive, n (%) | 8 (4) | 11 (12) | 1 (25) | 20 (7) |
| CPTA negative, n (%) | 176 (96) | 80 (88) | 3 (75) | 259 (93) |
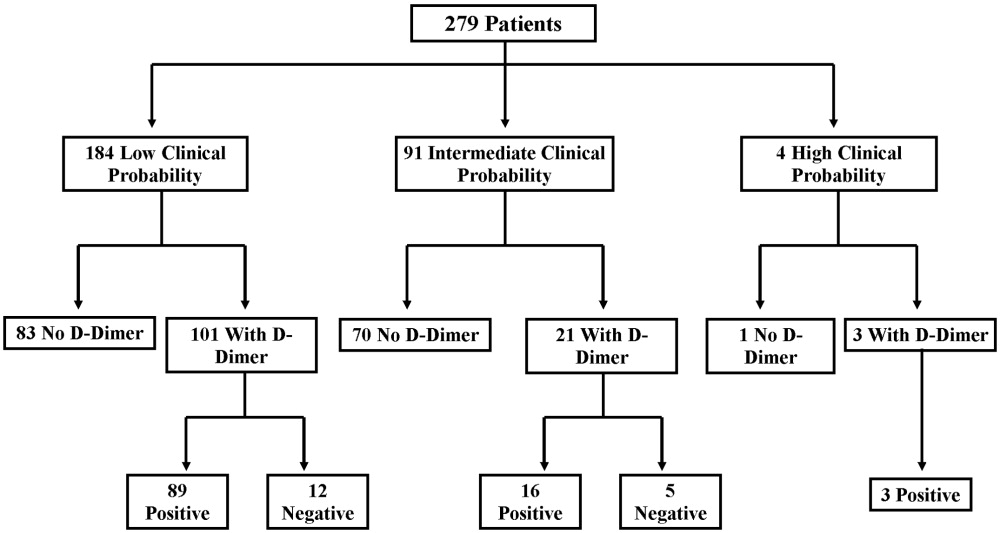
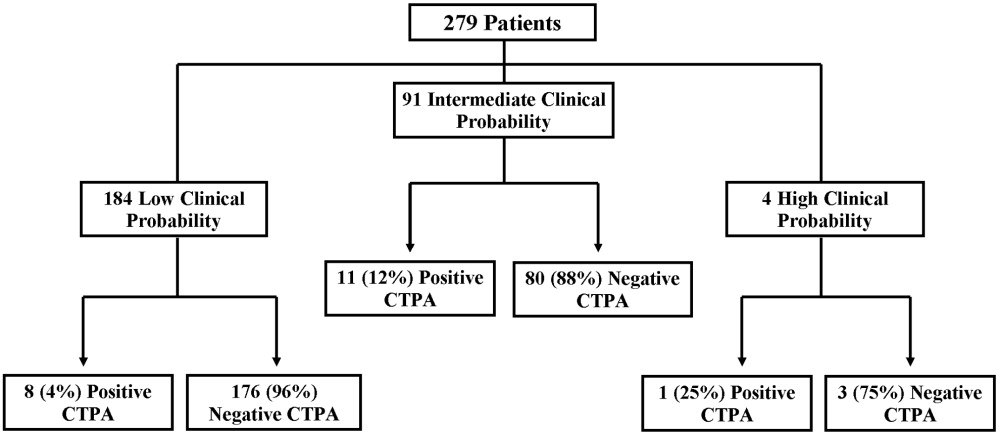
There were 20 positive CTPAs in the study group (Fig. 3). Review of the records for 3 months after the study of patients whose CTPA was negative disclosed no diagnoses of VTE by other modalities. VTE was diagnosed in 4% of patients in the low‐clinical‐probability group, 12% in the intermediate‐clinical‐probability group, and 25% in the high‐clinical‐probability group. The overall positive CTPA rate was 7.2%.
DISCUSSION
Many studies have examined the application of clinical rule sets in addition to D‐dimer testing and CTPA to exclude acute VTE.39 Most of these studies have shown that the use of an algorithm is safe and frequently reduces referral for CTPA in low‐clinical‐probability patients. However, others have noted that some physicians do not routinely use validated algorithms when making decisions related to patient evaluation.13 Our rate of positive CTPA was low compared with rates reported in the literature.3, 14 We believe the most likely explanation is the large number of low‐clinical‐probability patients who underwent CTPA, possibly because providers do not routinely use a validated clinical algorithm.
When our patient population was risk stratified by Simplified Wells criteria and compared with similar data from published studies, we had a much higher proportion of patients classified as low clinical probability.7, 8, 15 The low‐clinical‐probability group's mean Simplified Wells Score was 0.71; one‐third had a Simplified Wells Score of 0. This reflects a low‐risk population for VTE, supported by the low prevalence of prior DVT/VTE and active cancer in our population.4, 10 The rationale for referring patients with so few risk factors for CTPA is unclear. It is possible that providers used CTPA to evaluate symptoms not clearly explained and obtained the study to look for other diagnoses in addition to VTE. By not applying a clinical algorithm, very‐low‐risk patients underwent CTPA, increasing the number of negative studies and decreasing the overall positive rate.
Not using a clinical algorithm also resulted in indiscriminate D‐dimer testing. There were 83 patients risk‐stratified as low clinical probability who did not have a D‐dimer prior to undergoing CTPA. Some of these patients may well have had a negative D‐dimer, requiring no further workup to rule out VTE. Seventeen patients had a negative D‐dimer and still underwent CTPA; all these patients were negative for VTE. These aberrations likely occurred from unfamiliarity with use of the D‐dimer test or doubts about its ability to reliably exclude VTE. Appropriate application of D‐dimer testing could have decreased the number of CTPAs ordered and increased our overall rate of positive VTE diagnosis.
Perrier et al., Brown et al., and Kelly and Wells all describe different methods of introducing clinical algorithms to aid the diagnosis of VTE.46, 9 All agree that patients should be risk stratified by pretest clinical probability, and low‐probability patients should undergo intermediate testing with D‐dimer prior to CTPA. Implementation of a similar clinical algorithm at our facility would likely decrease the number of CTPAs ordered. If all patients presenting at our facility with signs and symptoms raising concern for VTE were first risk‐stratified by pretest clinical probability, and all low‐probability patients underwent highly‐sensitive D‐dimer testing as an initial step, fewer CTPAs would be performed on low‐probability patients. The largest group of patients in our study were low probability; therefore, decreasing CTPA in this group could have a significant effect on our institution.
The retrospective nature of our study resulted in the following limitations. It is impossible to determine how the ordering provider viewed the patient's pretest probability. In most of the medical records, a pretest clinical probability was not documented. We attempted to validate the ordering provider's decision by being as generous as possible in applying points to the Wells Score. For example, if a patient had a remote history of cancer and the ordering provider documented this as a risk factor for VTE, the point value for cancer was given even though the Wells Score has a much narrower definition of this category.10 This practice favors assigning patients a potentially higher clinical probability and may have increased the number of patients designated as intermediate and high clinical probability in our study.
Our hospital primarily relies on CTPA with lower extremity venogram as the diagnostic test for VTE. Indeterminate tests may have occurred and thus falsely lowered the number of VTEs diagnosed. However, no patient with a negative CTPA was diagnosed with VTE by any modality in the 3 months after their initial study at our institution; a diagnosis of VTE could have been made at another hospital. The Simplified Wells Score uses both objective and subjective components to arrive at a point total. Our results might be different if newer algorithms, such as the Revised Geneva Score,16 which relies only on objective measurements, had been used.
CONCLUSIONS
The reliance on CTPA alone to exclude a potentially life‐threatening illness without additional risk stratification or clinical information leads to overuse of this test in patients with very low to no clinical risk for VTE and a low rate of diagnosed VTE. Implementation of a clinical algorithm for the diagnosis of suspected VTE may eliminate the need for many CTPAs, improving the yield of this test without compromising patient safety, especially at institutions with a low prevalence of PE.
Acknowledgements
The authors thank Dr. John Rinard, DO, for assistance with initial editing of the abstract and Troy Patience for his assistance with statistical analysis.
- ,,, et al.Impact of a rapid‐rule out protocol for pulmonary embolism on the rate of screening, missed cases and pulmonary vascular imaging in an urban US emergency department.Ann Emerg Med.2004;44:490–502.
- ,,, et al.ATS 1999 Clinical practice guideline for the diagnostic approach to acute venous thromboembolism.Am J Respir Crit Care Med.1999;160:1043–1066.
- ,,, et al.Clinical validity of a negative computed tomography scan in patients with suspected pulmonary embolism.JAMA.2005;293:2012–2017.
- ,,, et al.Multidetector‐row computed tomography in suspected pulmonary embolism.N Engl J Med.2005;352:1760–1768.
- ,,.An emergency department guideline for the diagnosis of pulmonary embolism: an outcome study.Acad Emerg Med.2005;12:20–25.
- ,.A clinical probability assessment and D‐dimer measurement should be the initial step in the investigation of suspected venous thromboembolism.Chest.2003;124:1116–1119.
- ,,, et al.Prospective validation of Wells Criteria in the evaluation of patients with suspected pulmonary embolism.Ann Emerg Med.2004;44:503–510.
- ,.External validation and comparison of recently described prediction rules for suspected pulmonary embolism.Curr Opin Pulm Med.2004;10:345–349.
- ,,, et al.Excluding pulmonary embolism at the bedside without diagnostic imaging: management of patients with suspected pulmonary embolism presenting to the emergency department by using a simple clinical model and D‐dimer.Ann Intern Med.2001;135:98–107.
- ,,, et al.Evaluation of D‐dimer in the diagnosis of suspected deep‐vein thrombosis.N Engl J Med.2003;349:1227–1235.
- ,,, et al.Assessing the clinical probability of pulmonary embolism in the emergency ward: a simple score.Arch Intern Med.2001;161:92–97.
- ,,, et al.The effect of helical computed tomography on diagnostic and treatment strategies in patients with suspected pulmonary embolism.Am J Med.2004;116:84–90.
- Simplifying the evaluation of pulmonary embolism.Chest.2006:129:1400–1401.
- ,,, et al.Meta‐Analysis: Outcomes in patients with suspected pulmonary embolism managed with computed tomographic pulmonary angiography.Ann Intern Med.2004;141:866–874.
- ,,, et al.Multidetector computed tomography for acute pulmonary embolism.N Engl J Med.2006;354:2317–2327.
- ,,, et al.Prediction of pulmonary embolism in the emergency department: the revised Geneva score.Ann Intern Med.2006;144(3):165–171.
Approximately 10 million patients present to emergency departments each year with symptoms raising concern of thromboembolism (VTE).1 The current gold standard for diagnosis of VTE is pulmonary angiography.2 As this study is invasive, alternative imaging protocols have been sought. CTPA, when combined with measures of pretest probability, equals or surpasses the ability of pulmonary angiography to detect VTE and can improve the ability of clinicians to rule out VTE.38 In a study of 930 patients, application of clinical rules in addition to D‐dimer testing decreased the number of CTPAs ordered by 50%.9 One of the most common clinical rule sets is the Wells Score, which relies on historical features related to the risk of DVT/VTE and physical examination findings.10, 11
Other institutions have demonstrated an increase in the number of CTPAs ordered and VTE diagnoses since the study became widely available.13 Based on the observation of an increasing number of CTPAs ordered at our institution without an increase in the number of VTEs diagnosed, we aimed to ascertain the physician ordering practices for CTPA. We hypothesized that CTPAs were ordered at a greater frequency in a low‐risk population because an institutional clinical algorithm was lacking.
METHODS
Charts of all patients aged 18‐100 with CTPA ordered to rule out acute VTE were retrospectively examined. A Simplified Wells Score was applied using only the information available to the ordering physician at the time the CTPA was performed. Patients were stratified by their Simplified Wells Score to low (0‐1 points), intermediate (2‐6 points), or high (>6 points) pretest clinical probability. A D‐dimer value, if ordered, was used to further stratify patients based on a positive or negative result. The official radiologic report of the CTPA was used to determine the rate of VTE diagnosis for the study population.
RESULTS
Three hundred and ninety‐four patients were referred for CTPA (Fig. 1). Two hundred and seventy‐nine had adequate clinical data to calculate a Simplified Wells Score and were included in the study. Of the 279 studies included, 75% were ordered through the emergency department and 25% from inpatient services (Table 1). The study patients were stratified according to the Simplified Wells criteria: 184 patients (66%) had low clinical probability, 91 (33%) had intermediate clinical probability, and 4 (1%) had high clinical probability. Nineteen (7%) patients had a history of DVT or VTE, and 28 (10%) had a history of active cancer at the time of their CTPA. One hundred and twenty‐five of the 279 patients had a D‐dimer performed (Fig. 2). One hundred and eight were positive, and 17 were negative. Of the 17 patients who had a negative D‐dimer and underwent CTPA testing, none were diagnosed with VTE. Eighty‐three low‐clinical‐probability patients underwent CTPA without D‐dimer testing, 4 of whom were diagnosed with VTE.
| Low (n = 184) | Intermediate (n = 91) | High (n = 4) | Total (n = 279) | |
|---|---|---|---|---|
| Age (years), mean | 52 | 59 | 62 | 58 |
| Male, n (%) | 82 (45) | 44 (48) | 1 (25) | 127 (46) |
| Female, n (%) | 102 (55) | 47 (52) | 3 (75) | 152 (54) |
| Emergency department, n (%) | 150 (82) | 47 (52) | 4 (100) | 225 (75) |
| Medical, n (%) | 22 (12) | 18 (20) | 0 | 40 (13) |
| Surgical, n (%) | 9 (5) | 14 (15) | 0 | 23 (7) |
| ICU, n (%) | 3 (1) | 12 (13) | 0 | 15 (5) |
| Wells Score, mean | 0.72 | 3.4 | 7.8 | 1.6 |
| D‐dimer performed, n (%) | 101 (55) | 21 (23) | 3 (75) | 125 (45) |
| D‐dimer positive, n (%) | 89 (88) | 16 (76) | 3 (100) | 108 (86) |
| D‐dimer negative, n (%) | 12 (12) | 5 (24) | 0 | 17 (14) |
| CTPA positive, n (%) | 8 (4) | 11 (12) | 1 (25) | 20 (7) |
| CPTA negative, n (%) | 176 (96) | 80 (88) | 3 (75) | 259 (93) |
There were 20 positive CTPAs in the study group (Fig. 3). Review of the records for 3 months after the study of patients whose CTPA was negative disclosed no diagnoses of VTE by other modalities. VTE was diagnosed in 4% of patients in the low‐clinical‐probability group, 12% in the intermediate‐clinical‐probability group, and 25% in the high‐clinical‐probability group. The overall positive CTPA rate was 7.2%.
DISCUSSION
Many studies have examined the application of clinical rule sets in addition to D‐dimer testing and CTPA to exclude acute VTE.39 Most of these studies have shown that the use of an algorithm is safe and frequently reduces referral for CTPA in low‐clinical‐probability patients. However, others have noted that some physicians do not routinely use validated algorithms when making decisions related to patient evaluation.13 Our rate of positive CTPA was low compared with rates reported in the literature.3, 14 We believe the most likely explanation is the large number of low‐clinical‐probability patients who underwent CTPA, possibly because providers do not routinely use a validated clinical algorithm.
When our patient population was risk stratified by Simplified Wells criteria and compared with similar data from published studies, we had a much higher proportion of patients classified as low clinical probability.7, 8, 15 The low‐clinical‐probability group's mean Simplified Wells Score was 0.71; one‐third had a Simplified Wells Score of 0. This reflects a low‐risk population for VTE, supported by the low prevalence of prior DVT/VTE and active cancer in our population.4, 10 The rationale for referring patients with so few risk factors for CTPA is unclear. It is possible that providers used CTPA to evaluate symptoms not clearly explained and obtained the study to look for other diagnoses in addition to VTE. By not applying a clinical algorithm, very‐low‐risk patients underwent CTPA, increasing the number of negative studies and decreasing the overall positive rate.
Not using a clinical algorithm also resulted in indiscriminate D‐dimer testing. There were 83 patients risk‐stratified as low clinical probability who did not have a D‐dimer prior to undergoing CTPA. Some of these patients may well have had a negative D‐dimer, requiring no further workup to rule out VTE. Seventeen patients had a negative D‐dimer and still underwent CTPA; all these patients were negative for VTE. These aberrations likely occurred from unfamiliarity with use of the D‐dimer test or doubts about its ability to reliably exclude VTE. Appropriate application of D‐dimer testing could have decreased the number of CTPAs ordered and increased our overall rate of positive VTE diagnosis.
Perrier et al., Brown et al., and Kelly and Wells all describe different methods of introducing clinical algorithms to aid the diagnosis of VTE.46, 9 All agree that patients should be risk stratified by pretest clinical probability, and low‐probability patients should undergo intermediate testing with D‐dimer prior to CTPA. Implementation of a similar clinical algorithm at our facility would likely decrease the number of CTPAs ordered. If all patients presenting at our facility with signs and symptoms raising concern for VTE were first risk‐stratified by pretest clinical probability, and all low‐probability patients underwent highly‐sensitive D‐dimer testing as an initial step, fewer CTPAs would be performed on low‐probability patients. The largest group of patients in our study were low probability; therefore, decreasing CTPA in this group could have a significant effect on our institution.
The retrospective nature of our study resulted in the following limitations. It is impossible to determine how the ordering provider viewed the patient's pretest probability. In most of the medical records, a pretest clinical probability was not documented. We attempted to validate the ordering provider's decision by being as generous as possible in applying points to the Wells Score. For example, if a patient had a remote history of cancer and the ordering provider documented this as a risk factor for VTE, the point value for cancer was given even though the Wells Score has a much narrower definition of this category.10 This practice favors assigning patients a potentially higher clinical probability and may have increased the number of patients designated as intermediate and high clinical probability in our study.
Our hospital primarily relies on CTPA with lower extremity venogram as the diagnostic test for VTE. Indeterminate tests may have occurred and thus falsely lowered the number of VTEs diagnosed. However, no patient with a negative CTPA was diagnosed with VTE by any modality in the 3 months after their initial study at our institution; a diagnosis of VTE could have been made at another hospital. The Simplified Wells Score uses both objective and subjective components to arrive at a point total. Our results might be different if newer algorithms, such as the Revised Geneva Score,16 which relies only on objective measurements, had been used.
CONCLUSIONS
The reliance on CTPA alone to exclude a potentially life‐threatening illness without additional risk stratification or clinical information leads to overuse of this test in patients with very low to no clinical risk for VTE and a low rate of diagnosed VTE. Implementation of a clinical algorithm for the diagnosis of suspected VTE may eliminate the need for many CTPAs, improving the yield of this test without compromising patient safety, especially at institutions with a low prevalence of PE.
Acknowledgements
The authors thank Dr. John Rinard, DO, for assistance with initial editing of the abstract and Troy Patience for his assistance with statistical analysis.
Approximately 10 million patients present to emergency departments each year with symptoms raising concern of thromboembolism (VTE).1 The current gold standard for diagnosis of VTE is pulmonary angiography.2 As this study is invasive, alternative imaging protocols have been sought. CTPA, when combined with measures of pretest probability, equals or surpasses the ability of pulmonary angiography to detect VTE and can improve the ability of clinicians to rule out VTE.38 In a study of 930 patients, application of clinical rules in addition to D‐dimer testing decreased the number of CTPAs ordered by 50%.9 One of the most common clinical rule sets is the Wells Score, which relies on historical features related to the risk of DVT/VTE and physical examination findings.10, 11
Other institutions have demonstrated an increase in the number of CTPAs ordered and VTE diagnoses since the study became widely available.13 Based on the observation of an increasing number of CTPAs ordered at our institution without an increase in the number of VTEs diagnosed, we aimed to ascertain the physician ordering practices for CTPA. We hypothesized that CTPAs were ordered at a greater frequency in a low‐risk population because an institutional clinical algorithm was lacking.
METHODS
Charts of all patients aged 18‐100 with CTPA ordered to rule out acute VTE were retrospectively examined. A Simplified Wells Score was applied using only the information available to the ordering physician at the time the CTPA was performed. Patients were stratified by their Simplified Wells Score to low (0‐1 points), intermediate (2‐6 points), or high (>6 points) pretest clinical probability. A D‐dimer value, if ordered, was used to further stratify patients based on a positive or negative result. The official radiologic report of the CTPA was used to determine the rate of VTE diagnosis for the study population.
RESULTS
Three hundred and ninety‐four patients were referred for CTPA (Fig. 1). Two hundred and seventy‐nine had adequate clinical data to calculate a Simplified Wells Score and were included in the study. Of the 279 studies included, 75% were ordered through the emergency department and 25% from inpatient services (Table 1). The study patients were stratified according to the Simplified Wells criteria: 184 patients (66%) had low clinical probability, 91 (33%) had intermediate clinical probability, and 4 (1%) had high clinical probability. Nineteen (7%) patients had a history of DVT or VTE, and 28 (10%) had a history of active cancer at the time of their CTPA. One hundred and twenty‐five of the 279 patients had a D‐dimer performed (Fig. 2). One hundred and eight were positive, and 17 were negative. Of the 17 patients who had a negative D‐dimer and underwent CTPA testing, none were diagnosed with VTE. Eighty‐three low‐clinical‐probability patients underwent CTPA without D‐dimer testing, 4 of whom were diagnosed with VTE.
| Low (n = 184) | Intermediate (n = 91) | High (n = 4) | Total (n = 279) | |
|---|---|---|---|---|
| Age (years), mean | 52 | 59 | 62 | 58 |
| Male, n (%) | 82 (45) | 44 (48) | 1 (25) | 127 (46) |
| Female, n (%) | 102 (55) | 47 (52) | 3 (75) | 152 (54) |
| Emergency department, n (%) | 150 (82) | 47 (52) | 4 (100) | 225 (75) |
| Medical, n (%) | 22 (12) | 18 (20) | 0 | 40 (13) |
| Surgical, n (%) | 9 (5) | 14 (15) | 0 | 23 (7) |
| ICU, n (%) | 3 (1) | 12 (13) | 0 | 15 (5) |
| Wells Score, mean | 0.72 | 3.4 | 7.8 | 1.6 |
| D‐dimer performed, n (%) | 101 (55) | 21 (23) | 3 (75) | 125 (45) |
| D‐dimer positive, n (%) | 89 (88) | 16 (76) | 3 (100) | 108 (86) |
| D‐dimer negative, n (%) | 12 (12) | 5 (24) | 0 | 17 (14) |
| CTPA positive, n (%) | 8 (4) | 11 (12) | 1 (25) | 20 (7) |
| CPTA negative, n (%) | 176 (96) | 80 (88) | 3 (75) | 259 (93) |
There were 20 positive CTPAs in the study group (Fig. 3). Review of the records for 3 months after the study of patients whose CTPA was negative disclosed no diagnoses of VTE by other modalities. VTE was diagnosed in 4% of patients in the low‐clinical‐probability group, 12% in the intermediate‐clinical‐probability group, and 25% in the high‐clinical‐probability group. The overall positive CTPA rate was 7.2%.
DISCUSSION
Many studies have examined the application of clinical rule sets in addition to D‐dimer testing and CTPA to exclude acute VTE.39 Most of these studies have shown that the use of an algorithm is safe and frequently reduces referral for CTPA in low‐clinical‐probability patients. However, others have noted that some physicians do not routinely use validated algorithms when making decisions related to patient evaluation.13 Our rate of positive CTPA was low compared with rates reported in the literature.3, 14 We believe the most likely explanation is the large number of low‐clinical‐probability patients who underwent CTPA, possibly because providers do not routinely use a validated clinical algorithm.
When our patient population was risk stratified by Simplified Wells criteria and compared with similar data from published studies, we had a much higher proportion of patients classified as low clinical probability.7, 8, 15 The low‐clinical‐probability group's mean Simplified Wells Score was 0.71; one‐third had a Simplified Wells Score of 0. This reflects a low‐risk population for VTE, supported by the low prevalence of prior DVT/VTE and active cancer in our population.4, 10 The rationale for referring patients with so few risk factors for CTPA is unclear. It is possible that providers used CTPA to evaluate symptoms not clearly explained and obtained the study to look for other diagnoses in addition to VTE. By not applying a clinical algorithm, very‐low‐risk patients underwent CTPA, increasing the number of negative studies and decreasing the overall positive rate.
Not using a clinical algorithm also resulted in indiscriminate D‐dimer testing. There were 83 patients risk‐stratified as low clinical probability who did not have a D‐dimer prior to undergoing CTPA. Some of these patients may well have had a negative D‐dimer, requiring no further workup to rule out VTE. Seventeen patients had a negative D‐dimer and still underwent CTPA; all these patients were negative for VTE. These aberrations likely occurred from unfamiliarity with use of the D‐dimer test or doubts about its ability to reliably exclude VTE. Appropriate application of D‐dimer testing could have decreased the number of CTPAs ordered and increased our overall rate of positive VTE diagnosis.
Perrier et al., Brown et al., and Kelly and Wells all describe different methods of introducing clinical algorithms to aid the diagnosis of VTE.46, 9 All agree that patients should be risk stratified by pretest clinical probability, and low‐probability patients should undergo intermediate testing with D‐dimer prior to CTPA. Implementation of a similar clinical algorithm at our facility would likely decrease the number of CTPAs ordered. If all patients presenting at our facility with signs and symptoms raising concern for VTE were first risk‐stratified by pretest clinical probability, and all low‐probability patients underwent highly‐sensitive D‐dimer testing as an initial step, fewer CTPAs would be performed on low‐probability patients. The largest group of patients in our study were low probability; therefore, decreasing CTPA in this group could have a significant effect on our institution.
The retrospective nature of our study resulted in the following limitations. It is impossible to determine how the ordering provider viewed the patient's pretest probability. In most of the medical records, a pretest clinical probability was not documented. We attempted to validate the ordering provider's decision by being as generous as possible in applying points to the Wells Score. For example, if a patient had a remote history of cancer and the ordering provider documented this as a risk factor for VTE, the point value for cancer was given even though the Wells Score has a much narrower definition of this category.10 This practice favors assigning patients a potentially higher clinical probability and may have increased the number of patients designated as intermediate and high clinical probability in our study.
Our hospital primarily relies on CTPA with lower extremity venogram as the diagnostic test for VTE. Indeterminate tests may have occurred and thus falsely lowered the number of VTEs diagnosed. However, no patient with a negative CTPA was diagnosed with VTE by any modality in the 3 months after their initial study at our institution; a diagnosis of VTE could have been made at another hospital. The Simplified Wells Score uses both objective and subjective components to arrive at a point total. Our results might be different if newer algorithms, such as the Revised Geneva Score,16 which relies only on objective measurements, had been used.
CONCLUSIONS
The reliance on CTPA alone to exclude a potentially life‐threatening illness without additional risk stratification or clinical information leads to overuse of this test in patients with very low to no clinical risk for VTE and a low rate of diagnosed VTE. Implementation of a clinical algorithm for the diagnosis of suspected VTE may eliminate the need for many CTPAs, improving the yield of this test without compromising patient safety, especially at institutions with a low prevalence of PE.
Acknowledgements
The authors thank Dr. John Rinard, DO, for assistance with initial editing of the abstract and Troy Patience for his assistance with statistical analysis.
- ,,, et al.Impact of a rapid‐rule out protocol for pulmonary embolism on the rate of screening, missed cases and pulmonary vascular imaging in an urban US emergency department.Ann Emerg Med.2004;44:490–502.
- ,,, et al.ATS 1999 Clinical practice guideline for the diagnostic approach to acute venous thromboembolism.Am J Respir Crit Care Med.1999;160:1043–1066.
- ,,, et al.Clinical validity of a negative computed tomography scan in patients with suspected pulmonary embolism.JAMA.2005;293:2012–2017.
- ,,, et al.Multidetector‐row computed tomography in suspected pulmonary embolism.N Engl J Med.2005;352:1760–1768.
- ,,.An emergency department guideline for the diagnosis of pulmonary embolism: an outcome study.Acad Emerg Med.2005;12:20–25.
- ,.A clinical probability assessment and D‐dimer measurement should be the initial step in the investigation of suspected venous thromboembolism.Chest.2003;124:1116–1119.
- ,,, et al.Prospective validation of Wells Criteria in the evaluation of patients with suspected pulmonary embolism.Ann Emerg Med.2004;44:503–510.
- ,.External validation and comparison of recently described prediction rules for suspected pulmonary embolism.Curr Opin Pulm Med.2004;10:345–349.
- ,,, et al.Excluding pulmonary embolism at the bedside without diagnostic imaging: management of patients with suspected pulmonary embolism presenting to the emergency department by using a simple clinical model and D‐dimer.Ann Intern Med.2001;135:98–107.
- ,,, et al.Evaluation of D‐dimer in the diagnosis of suspected deep‐vein thrombosis.N Engl J Med.2003;349:1227–1235.
- ,,, et al.Assessing the clinical probability of pulmonary embolism in the emergency ward: a simple score.Arch Intern Med.2001;161:92–97.
- ,,, et al.The effect of helical computed tomography on diagnostic and treatment strategies in patients with suspected pulmonary embolism.Am J Med.2004;116:84–90.
- Simplifying the evaluation of pulmonary embolism.Chest.2006:129:1400–1401.
- ,,, et al.Meta‐Analysis: Outcomes in patients with suspected pulmonary embolism managed with computed tomographic pulmonary angiography.Ann Intern Med.2004;141:866–874.
- ,,, et al.Multidetector computed tomography for acute pulmonary embolism.N Engl J Med.2006;354:2317–2327.
- ,,, et al.Prediction of pulmonary embolism in the emergency department: the revised Geneva score.Ann Intern Med.2006;144(3):165–171.
- ,,, et al.Impact of a rapid‐rule out protocol for pulmonary embolism on the rate of screening, missed cases and pulmonary vascular imaging in an urban US emergency department.Ann Emerg Med.2004;44:490–502.
- ,,, et al.ATS 1999 Clinical practice guideline for the diagnostic approach to acute venous thromboembolism.Am J Respir Crit Care Med.1999;160:1043–1066.
- ,,, et al.Clinical validity of a negative computed tomography scan in patients with suspected pulmonary embolism.JAMA.2005;293:2012–2017.
- ,,, et al.Multidetector‐row computed tomography in suspected pulmonary embolism.N Engl J Med.2005;352:1760–1768.
- ,,.An emergency department guideline for the diagnosis of pulmonary embolism: an outcome study.Acad Emerg Med.2005;12:20–25.
- ,.A clinical probability assessment and D‐dimer measurement should be the initial step in the investigation of suspected venous thromboembolism.Chest.2003;124:1116–1119.
- ,,, et al.Prospective validation of Wells Criteria in the evaluation of patients with suspected pulmonary embolism.Ann Emerg Med.2004;44:503–510.
- ,.External validation and comparison of recently described prediction rules for suspected pulmonary embolism.Curr Opin Pulm Med.2004;10:345–349.
- ,,, et al.Excluding pulmonary embolism at the bedside without diagnostic imaging: management of patients with suspected pulmonary embolism presenting to the emergency department by using a simple clinical model and D‐dimer.Ann Intern Med.2001;135:98–107.
- ,,, et al.Evaluation of D‐dimer in the diagnosis of suspected deep‐vein thrombosis.N Engl J Med.2003;349:1227–1235.
- ,,, et al.Assessing the clinical probability of pulmonary embolism in the emergency ward: a simple score.Arch Intern Med.2001;161:92–97.
- ,,, et al.The effect of helical computed tomography on diagnostic and treatment strategies in patients with suspected pulmonary embolism.Am J Med.2004;116:84–90.
- Simplifying the evaluation of pulmonary embolism.Chest.2006:129:1400–1401.
- ,,, et al.Meta‐Analysis: Outcomes in patients with suspected pulmonary embolism managed with computed tomographic pulmonary angiography.Ann Intern Med.2004;141:866–874.
- ,,, et al.Multidetector computed tomography for acute pulmonary embolism.N Engl J Med.2006;354:2317–2327.
- ,,, et al.Prediction of pulmonary embolism in the emergency department: the revised Geneva score.Ann Intern Med.2006;144(3):165–171.
Statins/Beta‐Blockers and Mortality after Vascular Surgery
Vascular surgery has higher morbidity and mortality than other noncardiac surgeries. Despite the identification of vascular surgery as higher risk, 30‐day mortality for this surgery has remained at 3%10%. Few studies have examined longer‐term outcomes, but higher mortality rates have been reported, for example, 10%30% 6 months after surgery, 20%40% 1 year after surgery, and 30%50% 5 years after surgery.15 Postoperative adverse events have been found to be highly correlated with perioperative ischemia and infarction.68 Perioperative beta‐blockers have been widely studied and have been shown to benefit patients undergoing noncardiac surgery generally and vascular surgery specifically.9, 10 However, 2 recent trials of perioperative beta‐blockers in noncardiac and vascular surgery patients failed to show an association with 18‐month and 30‐day postoperative morbidity and mortality, respectively.11, 12 In addition, the authors of a recent meta‐analysis of perioperative beta‐blockers suggested more studies were needed.13 Furthermore, there have been promising new data on the use of perioperative statins.1418 Finally, as a recent clinical trial of revascularization before vascular surgery did not demonstrate an advantage over medical management, the identification of which perioperative medicines improve postoperative outcomes and in what combinations becomes even more important.19 We sought to ascertain if the ambulatory use of statins and/or beta‐blockers within 30 days of surgery was associated with a reduction in long‐term mortality.
METHODS
Setting and Subjects
We conducted a retrospective cohort study using a regional Department of Veterans Affairs (VA) administrative and relational database, the Consumer Health Information and Performance Sets (CHIPs), which automatically extracts data from electronic medical records of all facilities in the Veterans Integrated Services Network 20, which encompasses Alaska, Washington, Oregon, and Idaho. CHIPs contains information on both outpatient and inpatient environments, and a record is generated for every contact a patient makes with the VA health care system, which includes picking up prescription medications, laboratory values, demographic information, International Classification of Diseases, 9th Revision (ICD‐9), codes, and vital status. In addition, we used the Beneficiary Identification and Records Locator Subsystem database, which is the national VA death index and includes Social Security Administration data that has been shown to be 90%95% complete for assessing vital status.20
Data for all patients who had vascular surgery at 5 VA medical centers in the region from January 1998 to March 2005 was ascertained. If a patient had a second operation within 2 years of the first, the patient was censored at the date of the second operation. A patient was defined as taking a statin or beta‐blocker if a prescription for either of these medications had been picked up within 30 days before or after surgery. The IRB at the Portland VA Medical Center approved the study with a waiver of informed consent.
Data Elements
For every patient we noted the type of vascular surgery (carotid, aortic, lower extremity bypass, or lower extremity amputation), age, sex, comorbid conditions (hypertension, cerebrovascular disease, cancer, diabetes, hyperlipidemia, chronic obstructive pulmonary disease [COPD], chronic kidney disease [CKD], coronary artery disease [CAD], heart failure), tobacco use, ethnicity, nutritional status (serum albumin), and medication use, defined as filling a prescription within 30 days before surgery (insulin, aspirin, angiotensin‐converting enzyme [ACE] inhibitor, and clonidine). Each patient was assigned a revised cardiac risk index (RCRI) score.21 For each the risk factors: use of insulin, CAD, heart failure, cerebrovascular disease, CKD, and high‐risk surgery (intrathoracic, intraperitoneal, or suprainguinal vascular procedures) 1 point was assigned. These variables were defined according to ICD‐9 codes. CKD was defined as either an ICD‐9 code for CKD or a serum creatinine > 2 mg/dL. Patients were identified by the index vascular surgery using ICD‐9 codes in the CHIPs database, and both inpatient and outpatient data were extracted.
Statistical Analysis
All patients were censored at the point of last contact up to 5 years after surgery to focus on more clinically relevant long‐term outcomes possibly associated with vascular surgery. We conducted 3 separate analyses: (1) statin exposure regardless of beta‐blocker exposure; (2) beta‐blocker exposure regardless of statin exposure, and; (3) combined exposure to statins and beta‐blockers.
Propensity score methods were used to adjust for imbalance in the baseline characteristics between statin users and nonusers, beta‐blocker users and nonusers, and combination statin and beta‐blocker users and nonusers.22, 23 The range of the propensity score distribution was similar in drug users and nonusers in the individual analyses. There was sufficient overlap between the 2 groups in each stratum. To derive propensity scores for the individual drug analyses, statin use and beta‐blocker use were modeled independently with the demographic and clinical variables using stepwise logistic regression with a relaxed entry criterion of = 0.20. Only 1 variable (hyperlipidemia) remained significantly different between statin users and nonusers, and it was included in the subsequent analyses as a potential confounder. The variable albumin had 511 missing values. To keep this variable in the propensity scores, the missing values were replaced by the predicted values of albumin from the multiple linear regression model that included the other demographic variables. The propensity scores were grouped into quintiles and used as a stratification variable in the subsequent analyses. To confirm that the propensity score method reduced the imbalances, the demographic and clinical characteristics of statin and beta‐blocker users and nonusers and combination users and nonusers were compared using Cochran‐Mantel‐Haenzel tests with the respective propensity score as a stratification variable.
For the combined use of both study drugs, we performed univariate analysis with adjustment only for RCRI (as this was a powerful predictor of mortality in our dataset; Table 1) as well as a propensity score analysis in an exploratory manner. There have been limited applications of propensity score methods to multiple treatment groups. Similar to that in the study by Huang et al.,24 we developed a multinomial baseline response logit model to obtain 3 separate propensity scores (statin only vs. none, beta‐blocker only vs. none, and both vs. none). Because of the limited sample size, the data were stratified according to the median split of each propensity score. Each score had similar ranges for each treatment group. All but 5 variables (CAD, hypertension, hyperlipidemia, ACE inhibitor use, and type of surgery) were balanced after accounting for strata. These 5 variables were then included in the final stratified Cox regression model as potential confounders.
| Variable | Level | N (%) Overall N = 3062 | Hazard ratio (95% CI) | Chi‐square P value |
|---|---|---|---|---|
| ||||
| Age in years, median (IQR) | 67 (5974) | 1.04 (1.04, 1.05)a | <.0001 | |
| Sex | Female | 45 (1) | 0.89 (0.53, 1.51) | .6704 |
| Male | 3017 (99) | 1 | 1.0000 | |
| Preoperative medical conditions | HTN | 2415 (79) | 1.32 (1.13, 1.55) | .0006 |
| CVA/TIA | 589 (19) | 1.05 (0.90, 1.22) | .5753 | |
| CA | 679 (22) | 1.55 (1.36, 1.78) | <.0001 | |
| DM | 1474 (48) | 1.75 (1.54, 1.98) | <.0001 | |
| Lipid | 872 (28) | 0.84 (0.74, 0.97) | .0187 | |
| COPD | 913 (30) | 1.68 (1.48, 1.90) | <.0001 | |
| CAD | 1491 (49) | 1.46 (1.29, 1.66) | <.0001 | |
| CHF | 747 (24) | 2.44 (2.15, 2.77) | <.0001 | |
| CKD | 443 (14) | 2.32 (2.00, 2.69) | <.0001 | |
| Blood chemistry | Creatinine > 2 | 229 (7) | 2.73 (2.28, 3.28) | <.0001 |
| Albumin 3.5 | 596 (23) | 2.70 (2.35, 3.10) | <.0001 | |
| Medication use | Aspirin | 1789 (58) | 1.10 (0.97, 1.25) | .1389 |
| ACE inhibitor | 1250 (41) | 0.93 (0.82, 1.06) | .2894 | |
| Insulin | 478 (16) | 1.31 (1.12, 1.54) | .0007 | |
| Clonidine | 115 (4) | 1.68 (1.29, 2.20) | .0001 | |
| Perioperative medication | Statinb | 1346 (44) | 0.66 (0.58, 0.75) | <.0001 |
| Beta‐blockerc | 1617 (53) | 0.74 (0.66, 0.84) | <.0001 | |
| Statin only | 414 (14) | 0.69 (0.56, 0.84) | .0002 | |
| Beta‐blocker only | 685 (22) | 0.81 (0.69, 0.95) | .0079 | |
| Statin and beta‐blocker | 932 (30) | 0.57 (0.49, 0.67) | <.0001 | |
| Noned | 1031 (34) | 1 | 1.0000 | |
| Type of surgery | Aorta | 232 (8) | 1.34 (1.01, 1.77) | <.0001 |
| Carotid | 875 (29) | 1 | ||
| Amputation | 867 (28) | 2.80 (2.36, 3.32) | ||
| Bypass | 1088 (36) | 1.57 (1.32, 1.87) | ||
| RCRI | 0 | 1223 (40) | 1 | <.0001 |
| 1 | 1005 (33) | 1.33 (1.13, 1.55) | ||
| 2 | 598 (20) | 2.22 (1.88, 2.62) | ||
| 3 | 200 (7) | 3.16 (2.54, 3.93) | ||
| 4 | 36 (1) | 4.82 (3.15, 7.37) | ||
| Year surgery occurred | 1998 | 544 (18) | 1 | .6509 |
| 1999 | 463 (15) | 0.91 (0.75, 1.10) | ||
| 2000 | 420 (14) | 0.93 (0.77, 1.13) | ||
| 2001 | 407 (13) | 0.93 (0.75, 1.14) | ||
| 2002 | 374 (12) | 1.12 (0.90, 1.40) | ||
| 2003 | 371 (12) | 1.15 (0.90, 1.47) | ||
| 2004 | 407 (13) | 0.97 (0.72, 1.31) | ||
| 2005 | 76 (3) | 0.68 (0.28, 1.65) | ||
| Tobacco user | Yes | 971 (32) | 0.90 (0.76, 1.08) | .4762 |
| No | 649 (21) | 1 | ||
| Null | 1442 (47) | 0.96 (0.81, 1.13) | ||
| Ethnicity | White | 563 (18) | 1 | .0366 |
| Other | 39 (1) | 0.98 (0.55, 1.76) | ||
| Unknown | 2460 (80) | 1.24 (1.05, 1.46) | ||
To comment on patient‐specific risk by stratification with the RCRI, we used a fixed time point of the 2‐year mortality estimated from the Cox regression model to analyze use of study drugs singly or in combination compared with use of neither.
Chi‐square tests were used to categorize and compare demographic and clinical characteristics of statin users and nonusers, of beta‐blocker users and nonusers, and combination users and nonusers. Survival curves were estimated using the Kaplan‐Meier method and compared using the log‐rank test. Stratified or unstratified Cox regression was used to estimate the hazard ratios of statins and beta‐blockers, with or without adjustment for the propensity score. All analyses were performed using SAS (Statistical Analysis System) software, version 9.1.
RESULTS
Patient Characteristics
The study included 3062 patients whose median age was 67 (interquartile range, 5974; Table 1). Ninety‐nine percent of the study patients were men. Overall, ambulatory use of statins and beta‐blockers was found in 44% and 53% of patients, respectively, and combination use occurred in 30%. Sixty‐one percent of patients had an RCRI of 1 or greater; among them 71% were statin users (Table 2), 68% were beta‐blocker users (Table 3), and 75% were combination users (Table 4). Sixty‐four percent of surgeries were either lower extremity bypass or amputation, 29% were carotid, and 8% aortic. Median follow‐up for all patients was 2.7 years (interquartile range, 1.24.6). Of the whole study cohort, 53% and 62% filled a prescription for a statin or beta‐blocker within 1 year of surgery, respectively, and 58% and 67% filled a prescription within 2 years of surgery, respectively. Overall mortality at 30 days was 3%, at 1 year 14%, and at 2 years 22%.
| Variable, N (%) | Level | Overall (N = 3062) | Statin users (N = 1346 [44]) | Statin nonusers (N = 1716 [56]) | Unadjusted P value | Propensity‐adjusted P value |
|---|---|---|---|---|---|---|
| ||||||
| Age in years, median (IQR) | 67 (5974) | 66 (5973) | 68 (6075) | <.0001 | .9934 | |
| Sex | Female | 45 (1) | 15 (1) | 30 (2) | .1480 | .7822 |
| Male | 3017 (99) | 1331 (99) | 1686 (98) | |||
| Preoperative medical conditions | HTN | 2415 (79) | 1176 (87) | 1239 (72) | <.0001 | .2984 |
| CVA/TIA | 589 (19) | 328 (24) | 261 (15) | <.0001 | .3935 | |
| CA | 679 (22) | 307 (23) | 372 (22) | .4550 | .8404 | |
| DM | 1474 (48) | 666 (49) | 808 (47) | .1883 | .5504 | |
| Lipid | 872 (28) | 629 (47) | 243 (14) | <.0001 | .0246 | |
| COPD | 913 (30) | 411 (31) | 502 (29) | .4419 | .8435 | |
| CAD | 1491 (49) | 837 (62) | 654 (38) | <.0001 | .4720 | |
| CHF | 747 (24) | 370 (27) | 377 (22) | .0004 | .4839 | |
| CKD | 443 (14) | 208 (15) | 235 (14) | .1698 | .9990 | |
| Blood chemistry | Creatinine > 2 | 229 (7) | 101 (8) | 128 (7) | .9629 | .6911 |
| Albumin 3.5 | 596 (23) | 191 (16) | 405 (30) | <.0001 | .5917 | |
| Medication use | Aspirin | 1789 (58) | 904 (67) | 885 (52) | <.0001 | .6409 |
| Ace inhibitor | 1250 (41) | 712 (53) | 538 (31) | <.0001 | .6075 | |
| Beta‐blocker | 1220 (40) | 767 (57) | 453 (26) | <.0001 | .4058 | |
| Insulin | 478 (16) | 254 (19) | 224 (13) | <.0001 | .7919 | |
| Clonidine | 115 (4) | 61 (5) | 54 (3) | .0454 | .6141 | |
| Type of surgery | Aorta | 232 (8) | 106 (8) | 126 (7) | <.0001 | .9899 |
| Carotid | 875 (29) | 510 (38) | 365 (21) | |||
| Amputation | 867 (28) | 274 (20) | 593 (35) | |||
| Bypass | 1088 (36) | 456 (34) | 632 (37) | |||
| RCRI | 0 | 1223 (40) | 389 (29) | 834 (49) | <.0001 | .9831 |
| 1 | 1005 (33) | 507 (38) | 498 (29) | |||
| 2 | 598 (20) | 318 (24) | 280 (16) | |||
| 3 | 200 (7) | 109 (8) | 91 (5) | |||
| 4 | 36 (1) | 23 (1) | 13 (0.76) | |||
| Year of surgery | 1998 | 544 (18) | 134 (10) | 410 (24) | <.0001 | 1 |
| 1999 | 463 (15) | 163 (12) | 300 (17) | |||
| 2000 | 420 (13) | 178 (13) | 242 (14) | |||
| 2001 | 407 (13) | 188 (14) | 219 (13) | |||
| 2002 | 374 (12) | 194 (14) | 180 (10) | |||
| 2003 | 371 (12) | 209 (16) | 162 (9) | |||
| 2004 | 407 (13) | 229 (17) | 178 (10) | |||
| 2005 | 76 (3) | 51 (4) | 25 (1.5) | |||
| Tobacco user | Yes | 971 (32) | 494 (37) | 477 (28) | <.0001 | .9809 |
| No | 649 (21) | 335 (25) | 314 (18) | |||
| Null | 1442 (47) | 517 (38) | 925 (54) | |||
| Ethnicity | White | 563 (18) | 263 (20) | 300 (17) | .1544 | .9475 |
| Other | 39 (1) | 13 (1) | 26 (1.5) | |||
| Unknown | 2460 (80) | 1070 (79) | 1390 (81) | |||
| Variable, N (%) | Level | Overall N = 3062 | BB users N = 1617 (53) | Non‐BB users N = 1445 (47) | Unadjusted P value | Propensity‐adjusted P value |
|---|---|---|---|---|---|---|
| ||||||
| Age in years, median (IQR) | 67 (5974) | 67 (5975) | 68 (6076) | .0526 | .7671 | |
| Sex | Female | 45 (1) | 12 (1) | 33 (2) | .0004 | .585 |
| Male | 3017 (99) | 1605 (99) | 1412 (98) | |||
| Preoperative medical conditions | HTN | 2415 (79) | 1398 (86) | 1017 (70) | <.0001 | .1837 |
| CVA/TIA | 589 (19) | 364 (23) | 225 (16) | <.0001 | .3206 | |
| CA | 679 (22) | 359 (22) | 320 (22) | .9701 | .4288 | |
| DM | 1474 (48) | 739 (46) | 735 (51) | .0043 | .6329 | |
| Lipid | 872 (28) | 555 (34) | 317 (22) | <.0001 | .7180 | |
| COPD | 913 (30) | 487 (30) | 426 (29) | .7007 | .8022 | |
| CAD | 1491 (49) | 975 (60) | 516 (36) | <.0001 | .3496 | |
| CHF | 747 (24) | 439 (27) | 308 (21) | .0002 | .6509 | |
| CKD | 443 (14) | 248 (15) | 195 (13) | .1480 | .8544 | |
| Blood chemistry | Creatinine > 2 | 229 (7) | 132 (8) | 97 (7) | .1277 | .5867 |
| Albumin 3.5 | 596 (23) | 252 (18) | 344 (30) | <.0001 | .5347 | |
| Medication use | Aspirin | 1789 (58) | 1046 (65) | 743 (51) | <.0001 | .4942 |
| Ace inhibitor | 1250 (41) | 760 (47) | 490 (34) | <.0001 | .4727 | |
| Statin | 1220 (40) | 932 (58) | 414 (29) | <.0001 | .3706 | |
| Insulin | 478 (16) | 255 (16) | 223 (15) | .7973 | .5991 | |
| Clonidine | 115 (4) | 77 (5) | 38 (3) | .0019 | .8241 | |
| Type of surgery | Aorta | 232 (8) | 176 (11) | 56 (4) | <.0001 | .5664 |
| Carotid | 875 (29) | 515 (32) | 360 (25) | |||
| Amputation | 867 (28) | 339 (21) | 528 (37) | |||
| Bypass | 1088 (36) | 587 (36) | 501 (35) | |||
| RCRI | 0 | 1223 (40) | 518 (32) | 705 (49) | <.0001 | .5489 |
| 1 | 1005 (33) | 583 (36) | 422 (29) | |||
| 2 | 598 (20) | 358 (22) | 240 (17) | |||
| 3 | 200 (7) | 130 (8) | 70 (5) | |||
| 4 | 36 (1) | 28 (2) | 8 (1) | |||
| Year of surgery | 1998 | 544 (18) | 200 (12) | 344 (24) | <.0001 | .3832 |
| 1999 | 463 (15) | 211 (13) | 252 (17) | |||
| 2000 | 420 (13) | 210 (13) | 210 (15) | |||
| 2001 | 407 (13) | 209 (13) | 198 (14) | |||
| 2002 | 374 (12) | 220 (14) | 154 (11) | |||
| 2003 | 371 (12) | 238 (15) | 133 (9) | |||
| 2004 | 407 (13) | 279 (17) | 128 (9) | |||
| 2005 | 76 (3) | 50 (3) | 26 (2) | |||
| Tobacco user | Yes | 971 (32) | 569 (35) | 402 (28) | <.0001 | .9025 |
| No | 649 (21) | 370 (23) | 279 (19) | |||
| Null | 1442 (47) | 678 (42) | 764 (53) | |||
| Ethnicity | White | 563 (18) | 309 (19) | 254 (18) | .4962 | .8762 |
| Other | 39 (1) | 19 (1) | 20 (1) | |||
| Unknown | 2460 (80) | 1289 (80) | 1171 (81) | |||
| N (%) Variable | Level | Overall N = 3062 | BB alone N = 685 (22) | Statin alone N = 414 (14) | Both drugs N = 932 (30) | Neither drug N = 1031 (34) | Unadjusted P value | Propensity‐adjusted P value |
|---|---|---|---|---|---|---|---|---|
| ||||||||
| Age in years, median (IQR) | 67 (5974) | 68 (6075) | 67 (6075) | 66 (5973) | 69 (6076) | .0029 | .9824 | |
| Sex | Female | 45 (1) | 7 (1) | 10 (2) | 5 (1) | 23 (2) | .0042 | .5815 |
| Male | 3017 (99) | 678 (99) | 404 (98) | 927 (99) | 1008 (98) | |||
| Preoperative medical conditions | HTN | 2415 (79) | 560 (82) | 338 (82) | 838 (90) | 679 (66) | <.0001 | .0251 |
| CVA/TIA | 589 (19) | 127 (19) | 91 (22) | 237 (25) | 134 (13) | <.0001 | .4543 | |
| CA | 679 (22) | 150 (22) | 98 (24) | 209 (22) | 222 (22) | .8379 | .9749 | |
| DM | 1474 (48) | 291 (43) | 218 (53) | 448 (48) | 517 (50) | .0031 | .3943 | |
| Lipid | 872 (28) | 125 (18) | 199 (48) | 430 (46) | 118 (11) | <.0001 | <.0001 | |
| COPD | 913 (30) | 199 (29) | 123 (30) | 288 (9) | 303 (29) | .8475. | .9769 | |
| CAD | 1491 (49) | 327 (48) | 189 (46) | 648 (70) | 327 (32) | <.0001 | <.0001 | |
| CHF | 747 (24) | 163 (24) | 94 (23) | 276 (30) | 214 (21) | <.0001 | .7031 | |
| CKD | 443 (14) | 92 (13) | 52 (13) | 156 (17) | 143 (14) | .1120 | .8364 | |
| Blood chemistry | Creatinine > 2 | 229 (7) | 52 (8) | 21 (5) | 80 (9) | 76 (7) | .1619 | .7184 |
| Albumin 3.5 | 596 (23) | 134 (20) | 73 (20) | 118 (14) | 271 (34) | <.0001 | .2846 | |
| Medication use | Aspirin | 1789 (58) | 398 (58) | 256 (62) | 648 (70) | 487 (47) | <.0001 | .2334 |
| Ace inhibitor | 1250 (41) | 264 (39) | 216 (52) | 496 (53) | 274 (27) | <.0001 | .0216 | |
| Insulin | 478 (16) | 93 (14) | 92 (22) | 162 (17) | 131 (13) | <.0001 | .2952 | |
| Clonidine | 115 (4) | 28 (4) | 12 (3) | 49 (5) | 26 (3) | .0107 | .8035 | |
| Type of surgery | Aorta | 232 (8) | 78 (11) | 8 (2) | 98 (11) | 48 (5) | <.0001 | .008 |
| Carotid | 875 (29) | 165 (24) | 160 (39) | 350 (38) | 200 (19) | |||
| Amputation | 867 (28) | 164 (24) | 99 (24) | 175 (19) | 429 (42) | |||
| Bypass | 1088 (36) | 278 (41) | 147 (36) | 309 (33) | 354 (34) | |||
| RCRI | 0 | 1223 (40) | 288 (42) | 159 (38) | 230 (25) | 546 (53) | <.0001 | .5392 |
| 1 | 1005 (33) | 219 (32) | 143 (35) | 364 (39) | 279 (27) | |||
| 2 | 598 (20) | 125 (18) | 85 (21) | 233 (25) | 155 (15) | |||
| 3 | 200 (7) | 46 (7) | 25 (6) | 84 (9) | 45 (4) | |||
| 4 | 36 (1) | 7 (1) | 2 (0) | 21 (2) | 6 (1) | |||
| Year of surgery | 1998 | 544 (18) | 126 (18) | 60 (14) | 74 (8) | 284 (28) | <.0001 | .3105 |
| 1999 | 463 (15) | 111 (16) | 63 (15) | 100 (11) | 189 (18) | |||
| 2000 | 420 (13) | 87 (13) | 55 (13) | 123 (13) | 155 (15) | |||
| 2001 | 407 (13) | 84 (12) | 63 (15) | 125 (13) | 135 (13) | |||
| 2002 | 374 (12) | 81 (12) | 55 (13) | 139 (15) | 99 (10 | |||
| 2003 | 371 (12) | 85 (13) | 56 (14) | 153 (16) | 77 (7) | |||
| 2004 | 407 (13) | 96 (14) | 46 (11) | 183 (20) | 82 (8) | |||
| 2005 | 76 (3) | 15 (2) | 16 (4) | 35 (4) | 10 (1) | |||
| Tobacco user | Yes | 971 (32) | 227 (33) | 152 (37) | 342 (37) | 250 (24) | <.0001 | .3914 |
| No | 649 (21) | 134 (20) | 99 (24) | 236 (25) | 180 (17) | |||
| Null | 1442 (47) | 324 (47) | 163 (39) | 354 (38) | 601 (58) | |||
| Ethnicity | White | 563 (18) | 115 (17) | 69 (17) | 194 (21) | 185 (18) | .2821 | .9771 |
| Other | 39 (1) | 10 (1) | 4 (1) | 9 (1) | 16 (2) | |||
| Unknown | 2460 (80) | 560 (82) | 341 (82) | 729 (78) | 830 (81) | |||
Univariate Survival Analysis
Univariate Cox regression analysis revealed a strong effect of the composite RCRI, which was predictive of mortality in a linear fashion over the course of the study compared with an RCRI of 0 (Table 1). Univariate analysis showed significant associations with decreased mortality for statins (hazard ratio [HR] = 0.66 [95% CI 0.580.75], P < .0001) and beta‐blockers (HR = 0.74 [95% CI 0.660.84], P = .0001); see Table 1. Of note, compared with that in 1998, mortality did not change for all the years for which data were complete. In addition, compared with taking neither study drug, taking a statin only, a beta‐blocker only, or both was associated with decreased mortality (P = .0002, P = .0079, and P < .0001, respectively; Fig. 1).
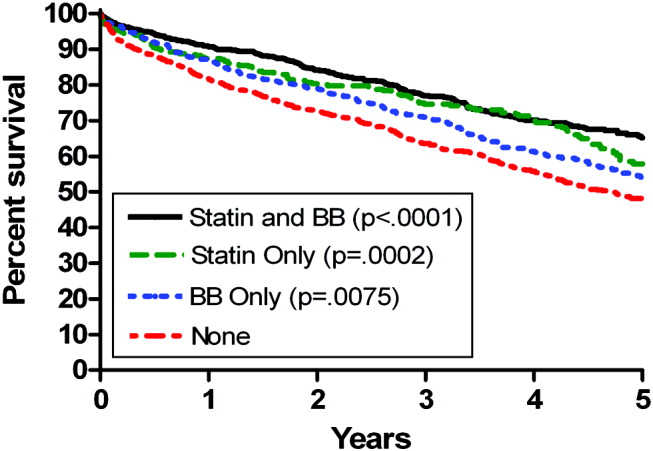
Propensity Score Analysis for Single Study Drug
There were significant differences in demographic and clinical characteristics between statin‐users versus statin nonusers, and between beta‐blocker users versus beta‐blocker nonusers. These differences became insignificant after the propensity score adjustment, with the exception of hyperlipidemia for statins, P = .02, which was added to the model as a confounder (Table 2). The distribution of the propensity scores was similar for study drug users and nonusers within each stratum. The association with decreased mortality remained significant after adjusting for propensity score (for statins, HR = 0.78 [95% CI 0.670.92, P = .0050], number needed to treat [NNT] = 22; for beta‐blockers HR = 0.84 [95% CI 0.730.96, P = .0103], NNT = 30; Fig. 2).
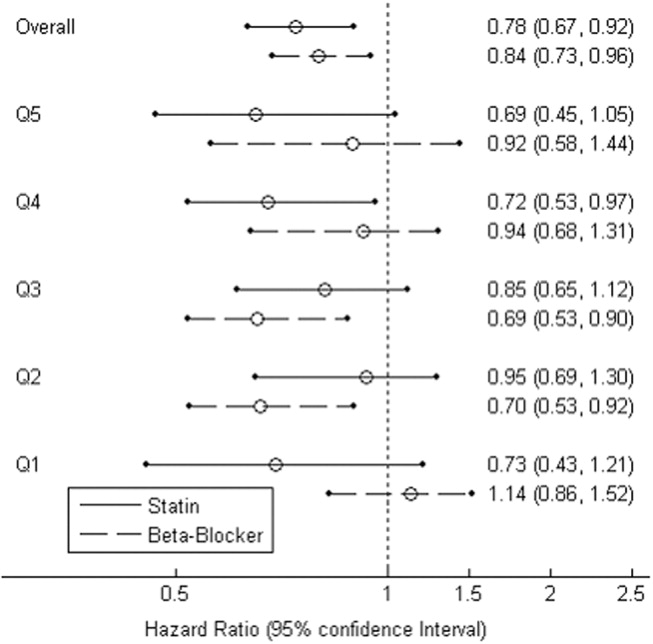
Combination Study Drugs and Revised Cardiac Risk Index: Univariate Analysis
We wanted our results to closely model those of combination use of the study drugs by patients in a clinical situation. Therefore, we first examined the effects of ambulatory statins alone, beta‐blockers alone, and a combination of statins and beta‐blockers by univariate analysis. Grouping patients by study drug use has not commonly been reported in the literature. We also examined the statistical interaction between the study drugs and the RCRI. The main‐effects model adequately explained all‐cause mortality, and the statistical interaction between the study drugs and the RCRI was not significant.
The final univariate Cox regression model, which compared use of a statin alone, a beta‐blocker alone, and a statin and beta‐blocker in combination with using neither study drug, demonstrated that the combination of statins and beta‐blockers had an HR over the whole study period of 0.43 (95% CI 0.360.51, P < .0001), statins alone had an HR of 0.59 (95% CI 0.480.72, P < .0001), and beta‐blockers alone had an HR of 0.71 (95% CI 0.610.83, P < .0001).
To clarify the effects of the study drugs on patients at different levels of risk, we stratified patients by the RCRI and evaluated the effects of the study drugs on mortality at 2 years, comparing the results to a referent of taking no study drugs. The use of both a statin and a beta‐blocker consistently produced a relative risk reduction (RRR) of approximately 50% with an NNT of 410, with highly statistically significant results for patients at all levels of risk (Table 5). As patient risk level increased, the NNT decreased, consistent with higher‐risk patients benefiting most from combination therapy with statins and beta‐blockers.
| RCRI | Drug | N (Deaths) | Mortality | NNT | RRR | P value |
|---|---|---|---|---|---|---|
| ||||||
| 0 | None | 546 (176) | 0.19 | |||
| BB | 288 (73) | 0.14 | 20 | 0.27 | .0023 | |
| Statin | 159 (30) | 0.12 | 14 | 0.39 | <.0001 | |
| Statin+BB | 230 (23) | 0.09 | 10 | 0.54 | <.0001 | |
| 1 | None | 279 (130) | 0.28 | |||
| BB | 219 (71) | 0.21 | 14 | 0.26 | .0028 | |
| Statin | 143 (41) | 0.17 | 10 | 0.37 | <.0001 | |
| Statin+BB | 364 (73) | 0.13 | 7 | 0.53 | <.0001 | |
| 2 | None | 155 (100) | 0.43 | |||
| BB | 125 (60) | 0.33 | 10 | 0.23 | .0045 | |
| Statin | 85 (42) | 0.28 | 7 | 0.35 | <.0001 | |
| Statin+BB | 233 (72) | 0.22 | 5 | 0.50 | <.0001 | |
| 3 | None | 51 (39) | 0.59 | |||
| BB | 53 (29) | 0.47 | 9 | 0.20 | .0296 | |
| Statin | 27 (14) | 0.41 | 6 | 0.31 | .0014 | |
| Statin+BB | 105 (52) | 0.32 | 4 | 0.46 | <.0001 | |
In addition, the range of outcomes can be clearly seen for both patient‐specific risk level and study drug use. For example, overall mortality at 2 years for all patients was 22%. For the study drugs, mortality ranged from 16% for patient who used both a statin and a beta‐blocker to 27% for those patients who used neither study drug. The use of the RCRI showed that the healthiest patients who were taking both a statin and a beta‐blocker did the best, with a 2‐year mortality of 9%, compared with the sickest patients who were taking neither study drug, whose 2‐year mortality was 59%. Use of both study drugs by the sickest patients was associated with a reduction in 2‐year mortality to 32% (P < .0001; Table 5).
Propensity Score Analysis of Use of Combination Study Drugs
Because there was very limited literature to guide us in the use of propensity score analysis of multiple treatment groups, we performed these analyses in an exploratory manner. There were significant differences between combination statin and beta‐blocker users and nonusers. These differences became insignificant after adjusting for propensity score, except for the 5 variables previously mentioned, which were added to the model as potential confounders (Table 4). The propensity‐adjusted Cox regression model comparing use of each study drug alone and in combination with taking neither over the whole study period still showed an association with decreased mortality. The combination of statins and beta‐blockers had an HR of 0.56 (95% CI 0.420.74), P < .0001; statins alone had an HR of 0.79 (95% CI 0.620.99), P = .0472; and beta‐blockers alone had an HR of 0.80 (95% CI 0.670.94), P = .0183.
Combination Study Drugs and Revised Cardiac Risk Index: Propensity Analysis
We performed the stratified Cox regression adjusted for the propensity scores for each level of RCRI and estimated 2‐year mortality. The use of both a statin and a beta‐blocker compared with using none was still consistently statistically significant, with an RRR of approximately 36% and an NNT of 820 for all levels of patient risk (Table 6). Possibly because of the reduced number of patients in each RCRI category, neither single‐agent study drug compared with none showed a statistically significant decrease in mortality at any level of patient‐specific risk (Table 6). Again, higher‐risk patients benefited most from combination therapy.
| RCRI | Drug | N (Deaths) | Mortality | NNT | RRR | P value |
|---|---|---|---|---|---|---|
| ||||||
| 0 | None | 546 (176) | 0.14 | |||
| BB | 288 (73) | 0.11 | 47 | 0.16 | .3778 | |
| Statin | 159 (30) | 0.11 | 40 | 0.19 | .2902 | |
| Statin+BB | 230 (23) | 0.08 | 20 | 0.38 | .0184 | |
| 1 | None | 279 (130) | 0.21 | |||
| BB | 219 (71) | 0.17 | 32 | 0.15 | .2837 | |
| Statin | 143 (41) | 0.17 | 27 | 0.18 | .1969 | |
| Statin+BB | 364 (73) | 0.13 | 14 | 0.37 | .0038 | |
| 2 | None | 155 (100) | 0.29 | |||
| BB | 125 (60) | 0.25 | 24 | 0.15 | .3295 | |
| Statin | 85 (42) | 0.24 | 20 | 0.17 | .2396 | |
| Statin+BB | 233 (72) | 0.18 | 10 | 0.36 | .0077 | |
| 3 | None | 51 (39) | 0.42 | |||
| BB | 53 (29) | 0.37 | 19 | 0.13 | .3553 | |
| Statin | 27 (14) | 0.36 | 16 | 0.15 | .2653 | |
| Statin+BB | 105 (52) | 0.28 | 8 | 0.33 | .0106 | |
Study Drug Timing: Subcohort Analysis
A subcohort analysis was performed to clarify the timing of the study drugs. Of the patients taking statins, 69 of 1346 (5.1%) took the drug before surgery only, 119 of 1346 (8.8%) took the drug after surgery only, and 1158 of 1346 (86%) took the drug both before and after surgery. Of the patients taking beta‐blockers, 54 of 1617 (3.3%) took the drug before surgery only, 397 of 1617 (24.6%) took the drug after surgery only, and 1166 of 1617 (72.1%) took the drug both before and after surgery. The use of statins and beta‐blockers had a correlation of 0.29 (contingency coefficient).
DISCUSSION
In this retrospective observational study we found that after vascular surgery the use of propensity‐adjusted statins compared with no use of statins reduced long‐term mortality over the study period by 22%, with a number needed to treat of 22, and the use of propensity‐adjusted beta‐blockers compared with no use also reduced long‐term mortality, by 16%, with a number needed to treat of 30. There were no statistically significant differences between outcomes of statin users and beta‐blocker users. In addition, using a propensity‐adjusted combination of statin and beta‐blockers compared with using neither decreased mortality overall by 44%, with a number needed to treat of 9. We focused on the use of outpatient drugs 30 days before or after surgery, as the timing of potentially beneficial medications has not been clearly established. Over time, more patients originally categorized as not taking a study drug began taking one, so that by 2 years after surgery, 58% of the patients were taking a statin, and 67% were taking a beta‐blocker, compared with 44% and 53%, respectively, of the study cohort initially. This would have made it more difficult to demonstrate a difference between these 2 groups. As more patients ended up taking the study drugs over time than the originally identified study drug users, and a mortality difference was still demonstrated, there may be an increased advantage in taking the study drugs around the time of surgery. As our focus was on long‐term postoperative mortality, which has not commonly been studied according to the literature, we preferred to also focus on long‐term, chronic ambulatory use of the study drugs. We did perform a subcohort analysis of the timing of study drug use. This confirmed that this cohort predominately comprised long‐term users of the study drugs who took the drug both before and after surgery. This study was not powered to comment on 30‐day mortality.
Perioperative beta‐blockers have been shown in retrospective cohort studies, case‐control studies, randomized clinical trials, meta‐analyses, and systematic reviews to decrease mortality and morbidity after noncardiac surgery. Although recent studies have not shown a benefit for more moderate‐ to low‐risk subjects,11, 12 perioperative beta‐blockers are still considered an indicator of health care quality in the United States.25 At present, perioperative beta‐blockers have an ACC/AHA class I indication (should be administered; Evidence level C) for patients undergoing vascular surgery with a positive stress test, and class IIa indication (reasonable to administer; Evidence level B) for vascular surgery patients with coronary heart disease or multiple clinical risk factors.26 A recent observational study in noncardiac surgery patients demonstrated perioperative beta‐blockers may be most helpful to prevent in‐hospital death after surgery of patients with an RCRI 2 and may be unhelpful or harmful for patients with an RCRI 1.27 Our univariate RCRI findings did not agree, as we found all patients whatever their level of risk benefited from perioperative use of beta‐blockers, alone or in combination. Our study population was older, had a higher RCRI, and underwent comparatively higher‐risk surgery, we were investigating longer‐term outcome, and we concentrated on ambulatory use of beta‐blockers, which may have contributed to the divergence in findings. Our propensity‐adjusted RCRI analysis did not show beta‐blockers associated with any change in mortality at any patient risk level. This may be, in part, because of the reduced number of patients in the RCRI strata. RCRI stratum‐specific analysis is limited by the number of patients and deaths in each RCRI stratum. For example, the power to detect a 2‐year difference of 10% (or 5%) between statin users and nonusers is approximately 99% (66%), 99% (59%), 92% (42%), and 61% (23%) for RCRI = 0, 1, 2, and 3, respectively.
Case‐control and retrospective cohort studies and one randomized clinical trial have shown perioperative statins to decrease either short‐term cardiovascular morbidity or mortality up to 30 days after surgery, and a limited number of retrospective cohort studies have shown reduced mortality for longer‐term follow‐up.1418, 28 There was one previous preliminary study of vascular surgery patients that demonstrated an additive benefit of using statins and beta‐blockers up to 30 days after surgery. This additive effect was only observed in patients with an RCRI 3.29 The results of our longer‐term follow‐up study of a larger cohort did not agree. Compared with patients who did not take a statin or a beta‐blocker, those patients who took both study drugs decreased their relative risk of mortality by approximately 36% in propensity‐ adjusted analysis and by about 50% in univariate analysis, regardless of patient‐specific risk level. For example, in the propensity‐adjusted analysis, the healthiest patients with an RCRI of 0 who took both study drugs had lower mortality than patients who took neither study drug, 8% versus 14%, a 38% relative reduction in mortality, with a number needed to treat of 20 (P = .0184).
In addition, the use of the RCRI for the first time highlighted the divergent long‐term mortality rates for patient‐specific risk levels and the striking long‐term associations of the perioperative use of ambulatory statins, beta‐blockers, and both drugs in combination with improved long‐term mortality. The long‐term use of the study drugs may indeed help all patients with atherosclerotic vascular disease, regardless of surgery. However, vascular surgery presents an opportunity for medical intervention, and our results are most applicable for these patients. In addition, the perioperative state has a unique physiology of acute and intense inflammation and thrombosis. Beta‐blockers and statins have antiadrenergic, anti‐inflammatory, and antithrombotic properties that may be beneficial during this high‐risk state.
Our findings should be viewed with some caution. The use of ICD‐9 codes and demographic data is dependent on the documentation and coding of comorbidities in the medical record and database. The use of statins and beta‐blockers was not random, and patients who took statins and beta‐blockers were different than those who did not. We used rigorous propensity and multivariate analysis, including controlling for clonidine, which has been shown to decrease death after vascular surgery.30 We also controlled for serum albumin level, which has been shown to be a leading predictor of postoperative death.31 We further separately stratified patients by RCRI, as this was a powerful predictor of death in the univariate analysis, but because of the retrospective nature of the study, unmeasured confounders may exist. Only 1% of the study patients were women, which is a limitation of the study. This administrative database is also limited by not having information on tobacco use for 47% of the patients and by not knowing ethnicity for 80% of the patients.
The use of perioperative statins and beta‐blockers used alone or in combination was associated with a reduction in long‐term mortality for vascular surgery patients, and combination use benefited patients at all levels of risk. Higher‐risk patients benefited most by taking both study drugs. These findings extend prior data, add to the natural history of long‐term postoperative outcomes, and also support clinical trials that would evaluate the prospective use of both these medications in vascular surgery patients with attention to patient‐specific risk level. Until the results of 2 randomized controlled trials become available, which may further clarify the use of perioperative statins and beta‐blockers in noncardiac, and noncardiac vascular surgery,13, 32 the use of statins and beta‐blockers should be considered for all patients undergoing vascular surgery. In addition, long‐term use of statins and beta‐blockers for all patients with atherosclerotic vascular disease should be considered.33
Acknowledgements
The authors thank LeAnn Snodgrass for assistance with data extraction and management. This work was funded by the Oregon Health & Science University Medical Research Foundation.
- ,,,,,.The influence of perioperative myocardial infarction on long‐term prognosis following elective vascular surgery.Chest.1998;113:681–686.
- ,,, et al.Postoperative and amputation‐free survival outcomes after femorodistal bypass grafting surgery: findings from the Department of Veterans Affairs National Surgical Quality Improvement Program.J Vasc Surg.2001;34:283–290.
- ,,,.Perioperative‐ and long‐term mortality rates after major vascular surgery: the relationship to preoperative testing in the medicare population.Anesth Analg1999;89:849–855.
- ,.Very late survival after vascular surgery.J Surg Res.2002;105(2):109–114.
- ,,, et al.Women have increased risk of perioperative myocardial infarction and higher long‐term mortality rates after lower extremity arterial bypass grafting.J Vasc Surg.1999;29:807–812; discussion12–13.
- ,,,,,.Association of perioperative myocardial ischemia with cardiac morbidity and mortality in men undergoing noncardiac surgery.The Study of Perioperative Ischemia Research Group.N Engl J Med.1990;323:1781–1788.
- ,,,,.Perioperative myocardial ischemia in patients undergoing noncardiac surgery—II: Incidence and severity during the 1st week after surgery.The Study of Perioperative Ischemia (SPI) Research Group.J Am Coll Cardiol.1991;17:851–857.
- ,,, et al.Perioperative myocardial ischemia in patients undergoing noncardiac surgery—I: Incidence and severity during the 4 day perioperative period.The Study of Perioperative Ischemia (SPI) Research Group.J Am Coll Cardiol.1991;17:843–850.
- ,,,.Effect of atenolol on mortality and cardiovascular morbidity after noncardiac surgery.Multicenter Study of Perioperative Ischemia Research Group.N Engl J Med.1996;335:1713–1720.
- ,,, et al.The effect of bisoprolol on perioperative mortality and myocardial infarction in high‐risk patients undergoing vascular surgery.Dutch Echocardiographic Cardiac Risk Evaluation Applying Stress Echocardiography Study Group.N Engl J Med.1999;341:1789–1794.
- ,,,,.Perioperative beta‐blockade (POBBLE) for patients undergoing infrarenal vascular surgery: results of a randomized double‐blind controlled trial.J Vasc Surg.2005;41:602–609.
- ,,, et al.Effect of perioperative beta blockade in patients with diabetes undergoing major non‐cardiac surgery: randomised placebo controlled, blinded multicentre trial.BMJ.2006;332:1482.
- ,,, et al.How strong is the evidence for the use of perioperative beta blockers in non‐cardiac surgery? Systematic review and meta‐analysis of randomised controlled trials.BMJ.2005;331:313–321.
- ,,, et al.Statins are associated with a reduced incidence of perioperative mortality in patients undergoing major noncardiac vascular surgery.Circulation.2003;107:1848–1851.
- ,,,,.Lipid‐lowering therapy and in‐hospital mortality following major noncardiac surgery.JAMA2004;291:2092–2099.
- ,,, et al.Reduction in cardiovascular events after vascular surgery with atorvastatin: a randomized trial.J Vasc Surg.2004;39:967–975; discussion75–6.
- ,,, et al.Statins decrease perioperative cardiac complications in patients undergoing noncardiac vascular surgery: the Statins for Risk Reduction in Surgery (StaRRS) study.J Am Coll Cardiol.2005;45:336–342.
- ,,,,,.The effect of preoperative statin therapy on cardiovascular outcomes in patients undergoing infrainguinal vascular surgery.Int J Cardiol.2005;104:264–268.
- ,,, et al.Coronary‐artery revascularization before elective major vascular surgery.N Engl J Med.2004;351:2795–2804.
- ,,.Vital status ascertainment through the files of the Department of Veterans Affairs and the Social Security Administration.Ann Epidemiol.1996;6(2):102–109.
- ,,, et al.Derivation and prospective validation of a simple index for prediction of cardiac risk of major noncardiac surgery.Circulation.1999;100:1043–1049.
- .Propensity score methods for bias reduction in the comparison of a treatment to a non‐randomized control group.Stat Med.1998;17:2265–2281.
- ,.A comparison of propensity score methods: a case‐study estimating the effectiveness of post‐AMI statin use.Stat Med.2006;25:2084–2106.
- ,,,,.Application of a propensity score approach for risk adjustment in profiling multiple physician groups on asthma care.Health Serv Res2005;40(1):253–78.
- ,,.Making Health Care Safer: A Critical Analysis of Patient Safety Practices: Evidence Report/Technology Assessment.Rockville, Md:AHRQ;2001. Report No. 43.
- ,,, et al.ACC/AHA 2006 guideline update on perioperative cardiovascular evaluation for noncardiac surgery: focused update on perioperative beta‐blocker therapy: a report of the American College of Cardiology/American Heart Association Task Force on Practice Guidelines (Writing Committee to Update the 2002 Guidelines on Perioperative Cardiovascular Evaluation for Noncardiac Surgery): developed in collaboration with the American Society of Echocardiography, American Society of Nuclear Cardiology, Heart Rhythm Society, Society of Cardiovascular Anesthesiologists, Society for Cardiovascular Angiography and Interventions, and Society for Vascular Medicine and Biology.Circulation.2006;113:2662–2674.
- ,,,,,.Perioperative beta‐blocker therapy and mortality after major noncardiac surgery.N Engl J Med.2005;353:349–361.
- ,,, et al.Association between long‐term statin use and mortality after successful abdominal aortic aneurysm surgery.Am J Med.2004;116(2):96–103.
- ,,, et al.A combination of statins and beta‐blockers is independently associated with a reduction in the incidence of perioperative mortality and nonfatal myocardial infarction in patients undergoing abdominal aortic aneurysm surgery.Eur J Vasc Endovasc Surg.2004;28:343–352.
- ,,.Alpha‐2 adrenergic agonists to prevent perioperative cardiovascular complications: a meta‐analysis.Am J Med.2003;114:742–752.
- ,,,,,.Preoperative serum albumin level as a predictor of operative mortality and morbidity: results from the National VA Surgical Risk Study.Arch Surg.1999;134(1):36–42.
- ,,, et al.Fluvastatin and bisoprolol for the reduction of perioperative cardiac mortality and morbidity in high‐risk patients undergoing non‐cardiac surgery: rationale and design of the DECREASE‐IV study.Am Heart J.2004;148:1047–1052.
- ,,, et al.ACC/AHA 2005 Practice Guidelines for the management of patients with peripheral arterial disease (lower extremity, renal, mesenteric, and abdominal aortic): a collaborative report from the American Association for Vascular Surgery/Society for Vascular Surgery, Society for Cardiovascular Angiography and Interventions, Society for Vascular Medicine and Biology, Society of Interventional Radiology, and the ACC/AHA Task Force on Practice Guidelines (Writing Committee to Develop Guidelines for the Management of Patients With Peripheral Arterial Disease): endorsed by the American Association of Cardiovascular and Pulmonary Rehabilitation; National Heart, Lung, and Blood Institute; Society for Vascular Nursing; TransAtlantic Inter‐Society Consensus; and Vascular Disease Foundation.Circulation.2006;113:e463–e654.
Vascular surgery has higher morbidity and mortality than other noncardiac surgeries. Despite the identification of vascular surgery as higher risk, 30‐day mortality for this surgery has remained at 3%10%. Few studies have examined longer‐term outcomes, but higher mortality rates have been reported, for example, 10%30% 6 months after surgery, 20%40% 1 year after surgery, and 30%50% 5 years after surgery.15 Postoperative adverse events have been found to be highly correlated with perioperative ischemia and infarction.68 Perioperative beta‐blockers have been widely studied and have been shown to benefit patients undergoing noncardiac surgery generally and vascular surgery specifically.9, 10 However, 2 recent trials of perioperative beta‐blockers in noncardiac and vascular surgery patients failed to show an association with 18‐month and 30‐day postoperative morbidity and mortality, respectively.11, 12 In addition, the authors of a recent meta‐analysis of perioperative beta‐blockers suggested more studies were needed.13 Furthermore, there have been promising new data on the use of perioperative statins.1418 Finally, as a recent clinical trial of revascularization before vascular surgery did not demonstrate an advantage over medical management, the identification of which perioperative medicines improve postoperative outcomes and in what combinations becomes even more important.19 We sought to ascertain if the ambulatory use of statins and/or beta‐blockers within 30 days of surgery was associated with a reduction in long‐term mortality.
METHODS
Setting and Subjects
We conducted a retrospective cohort study using a regional Department of Veterans Affairs (VA) administrative and relational database, the Consumer Health Information and Performance Sets (CHIPs), which automatically extracts data from electronic medical records of all facilities in the Veterans Integrated Services Network 20, which encompasses Alaska, Washington, Oregon, and Idaho. CHIPs contains information on both outpatient and inpatient environments, and a record is generated for every contact a patient makes with the VA health care system, which includes picking up prescription medications, laboratory values, demographic information, International Classification of Diseases, 9th Revision (ICD‐9), codes, and vital status. In addition, we used the Beneficiary Identification and Records Locator Subsystem database, which is the national VA death index and includes Social Security Administration data that has been shown to be 90%95% complete for assessing vital status.20
Data for all patients who had vascular surgery at 5 VA medical centers in the region from January 1998 to March 2005 was ascertained. If a patient had a second operation within 2 years of the first, the patient was censored at the date of the second operation. A patient was defined as taking a statin or beta‐blocker if a prescription for either of these medications had been picked up within 30 days before or after surgery. The IRB at the Portland VA Medical Center approved the study with a waiver of informed consent.
Data Elements
For every patient we noted the type of vascular surgery (carotid, aortic, lower extremity bypass, or lower extremity amputation), age, sex, comorbid conditions (hypertension, cerebrovascular disease, cancer, diabetes, hyperlipidemia, chronic obstructive pulmonary disease [COPD], chronic kidney disease [CKD], coronary artery disease [CAD], heart failure), tobacco use, ethnicity, nutritional status (serum albumin), and medication use, defined as filling a prescription within 30 days before surgery (insulin, aspirin, angiotensin‐converting enzyme [ACE] inhibitor, and clonidine). Each patient was assigned a revised cardiac risk index (RCRI) score.21 For each the risk factors: use of insulin, CAD, heart failure, cerebrovascular disease, CKD, and high‐risk surgery (intrathoracic, intraperitoneal, or suprainguinal vascular procedures) 1 point was assigned. These variables were defined according to ICD‐9 codes. CKD was defined as either an ICD‐9 code for CKD or a serum creatinine > 2 mg/dL. Patients were identified by the index vascular surgery using ICD‐9 codes in the CHIPs database, and both inpatient and outpatient data were extracted.
Statistical Analysis
All patients were censored at the point of last contact up to 5 years after surgery to focus on more clinically relevant long‐term outcomes possibly associated with vascular surgery. We conducted 3 separate analyses: (1) statin exposure regardless of beta‐blocker exposure; (2) beta‐blocker exposure regardless of statin exposure, and; (3) combined exposure to statins and beta‐blockers.
Propensity score methods were used to adjust for imbalance in the baseline characteristics between statin users and nonusers, beta‐blocker users and nonusers, and combination statin and beta‐blocker users and nonusers.22, 23 The range of the propensity score distribution was similar in drug users and nonusers in the individual analyses. There was sufficient overlap between the 2 groups in each stratum. To derive propensity scores for the individual drug analyses, statin use and beta‐blocker use were modeled independently with the demographic and clinical variables using stepwise logistic regression with a relaxed entry criterion of = 0.20. Only 1 variable (hyperlipidemia) remained significantly different between statin users and nonusers, and it was included in the subsequent analyses as a potential confounder. The variable albumin had 511 missing values. To keep this variable in the propensity scores, the missing values were replaced by the predicted values of albumin from the multiple linear regression model that included the other demographic variables. The propensity scores were grouped into quintiles and used as a stratification variable in the subsequent analyses. To confirm that the propensity score method reduced the imbalances, the demographic and clinical characteristics of statin and beta‐blocker users and nonusers and combination users and nonusers were compared using Cochran‐Mantel‐Haenzel tests with the respective propensity score as a stratification variable.
For the combined use of both study drugs, we performed univariate analysis with adjustment only for RCRI (as this was a powerful predictor of mortality in our dataset; Table 1) as well as a propensity score analysis in an exploratory manner. There have been limited applications of propensity score methods to multiple treatment groups. Similar to that in the study by Huang et al.,24 we developed a multinomial baseline response logit model to obtain 3 separate propensity scores (statin only vs. none, beta‐blocker only vs. none, and both vs. none). Because of the limited sample size, the data were stratified according to the median split of each propensity score. Each score had similar ranges for each treatment group. All but 5 variables (CAD, hypertension, hyperlipidemia, ACE inhibitor use, and type of surgery) were balanced after accounting for strata. These 5 variables were then included in the final stratified Cox regression model as potential confounders.
| Variable | Level | N (%) Overall N = 3062 | Hazard ratio (95% CI) | Chi‐square P value |
|---|---|---|---|---|
| ||||
| Age in years, median (IQR) | 67 (5974) | 1.04 (1.04, 1.05)a | <.0001 | |
| Sex | Female | 45 (1) | 0.89 (0.53, 1.51) | .6704 |
| Male | 3017 (99) | 1 | 1.0000 | |
| Preoperative medical conditions | HTN | 2415 (79) | 1.32 (1.13, 1.55) | .0006 |
| CVA/TIA | 589 (19) | 1.05 (0.90, 1.22) | .5753 | |
| CA | 679 (22) | 1.55 (1.36, 1.78) | <.0001 | |
| DM | 1474 (48) | 1.75 (1.54, 1.98) | <.0001 | |
| Lipid | 872 (28) | 0.84 (0.74, 0.97) | .0187 | |
| COPD | 913 (30) | 1.68 (1.48, 1.90) | <.0001 | |
| CAD | 1491 (49) | 1.46 (1.29, 1.66) | <.0001 | |
| CHF | 747 (24) | 2.44 (2.15, 2.77) | <.0001 | |
| CKD | 443 (14) | 2.32 (2.00, 2.69) | <.0001 | |
| Blood chemistry | Creatinine > 2 | 229 (7) | 2.73 (2.28, 3.28) | <.0001 |
| Albumin 3.5 | 596 (23) | 2.70 (2.35, 3.10) | <.0001 | |
| Medication use | Aspirin | 1789 (58) | 1.10 (0.97, 1.25) | .1389 |
| ACE inhibitor | 1250 (41) | 0.93 (0.82, 1.06) | .2894 | |
| Insulin | 478 (16) | 1.31 (1.12, 1.54) | .0007 | |
| Clonidine | 115 (4) | 1.68 (1.29, 2.20) | .0001 | |
| Perioperative medication | Statinb | 1346 (44) | 0.66 (0.58, 0.75) | <.0001 |
| Beta‐blockerc | 1617 (53) | 0.74 (0.66, 0.84) | <.0001 | |
| Statin only | 414 (14) | 0.69 (0.56, 0.84) | .0002 | |
| Beta‐blocker only | 685 (22) | 0.81 (0.69, 0.95) | .0079 | |
| Statin and beta‐blocker | 932 (30) | 0.57 (0.49, 0.67) | <.0001 | |
| Noned | 1031 (34) | 1 | 1.0000 | |
| Type of surgery | Aorta | 232 (8) | 1.34 (1.01, 1.77) | <.0001 |
| Carotid | 875 (29) | 1 | ||
| Amputation | 867 (28) | 2.80 (2.36, 3.32) | ||
| Bypass | 1088 (36) | 1.57 (1.32, 1.87) | ||
| RCRI | 0 | 1223 (40) | 1 | <.0001 |
| 1 | 1005 (33) | 1.33 (1.13, 1.55) | ||
| 2 | 598 (20) | 2.22 (1.88, 2.62) | ||
| 3 | 200 (7) | 3.16 (2.54, 3.93) | ||
| 4 | 36 (1) | 4.82 (3.15, 7.37) | ||
| Year surgery occurred | 1998 | 544 (18) | 1 | .6509 |
| 1999 | 463 (15) | 0.91 (0.75, 1.10) | ||
| 2000 | 420 (14) | 0.93 (0.77, 1.13) | ||
| 2001 | 407 (13) | 0.93 (0.75, 1.14) | ||
| 2002 | 374 (12) | 1.12 (0.90, 1.40) | ||
| 2003 | 371 (12) | 1.15 (0.90, 1.47) | ||
| 2004 | 407 (13) | 0.97 (0.72, 1.31) | ||
| 2005 | 76 (3) | 0.68 (0.28, 1.65) | ||
| Tobacco user | Yes | 971 (32) | 0.90 (0.76, 1.08) | .4762 |
| No | 649 (21) | 1 | ||
| Null | 1442 (47) | 0.96 (0.81, 1.13) | ||
| Ethnicity | White | 563 (18) | 1 | .0366 |
| Other | 39 (1) | 0.98 (0.55, 1.76) | ||
| Unknown | 2460 (80) | 1.24 (1.05, 1.46) | ||
To comment on patient‐specific risk by stratification with the RCRI, we used a fixed time point of the 2‐year mortality estimated from the Cox regression model to analyze use of study drugs singly or in combination compared with use of neither.
Chi‐square tests were used to categorize and compare demographic and clinical characteristics of statin users and nonusers, of beta‐blocker users and nonusers, and combination users and nonusers. Survival curves were estimated using the Kaplan‐Meier method and compared using the log‐rank test. Stratified or unstratified Cox regression was used to estimate the hazard ratios of statins and beta‐blockers, with or without adjustment for the propensity score. All analyses were performed using SAS (Statistical Analysis System) software, version 9.1.
RESULTS
Patient Characteristics
The study included 3062 patients whose median age was 67 (interquartile range, 5974; Table 1). Ninety‐nine percent of the study patients were men. Overall, ambulatory use of statins and beta‐blockers was found in 44% and 53% of patients, respectively, and combination use occurred in 30%. Sixty‐one percent of patients had an RCRI of 1 or greater; among them 71% were statin users (Table 2), 68% were beta‐blocker users (Table 3), and 75% were combination users (Table 4). Sixty‐four percent of surgeries were either lower extremity bypass or amputation, 29% were carotid, and 8% aortic. Median follow‐up for all patients was 2.7 years (interquartile range, 1.24.6). Of the whole study cohort, 53% and 62% filled a prescription for a statin or beta‐blocker within 1 year of surgery, respectively, and 58% and 67% filled a prescription within 2 years of surgery, respectively. Overall mortality at 30 days was 3%, at 1 year 14%, and at 2 years 22%.
| Variable, N (%) | Level | Overall (N = 3062) | Statin users (N = 1346 [44]) | Statin nonusers (N = 1716 [56]) | Unadjusted P value | Propensity‐adjusted P value |
|---|---|---|---|---|---|---|
| ||||||
| Age in years, median (IQR) | 67 (5974) | 66 (5973) | 68 (6075) | <.0001 | .9934 | |
| Sex | Female | 45 (1) | 15 (1) | 30 (2) | .1480 | .7822 |
| Male | 3017 (99) | 1331 (99) | 1686 (98) | |||
| Preoperative medical conditions | HTN | 2415 (79) | 1176 (87) | 1239 (72) | <.0001 | .2984 |
| CVA/TIA | 589 (19) | 328 (24) | 261 (15) | <.0001 | .3935 | |
| CA | 679 (22) | 307 (23) | 372 (22) | .4550 | .8404 | |
| DM | 1474 (48) | 666 (49) | 808 (47) | .1883 | .5504 | |
| Lipid | 872 (28) | 629 (47) | 243 (14) | <.0001 | .0246 | |
| COPD | 913 (30) | 411 (31) | 502 (29) | .4419 | .8435 | |
| CAD | 1491 (49) | 837 (62) | 654 (38) | <.0001 | .4720 | |
| CHF | 747 (24) | 370 (27) | 377 (22) | .0004 | .4839 | |
| CKD | 443 (14) | 208 (15) | 235 (14) | .1698 | .9990 | |
| Blood chemistry | Creatinine > 2 | 229 (7) | 101 (8) | 128 (7) | .9629 | .6911 |
| Albumin 3.5 | 596 (23) | 191 (16) | 405 (30) | <.0001 | .5917 | |
| Medication use | Aspirin | 1789 (58) | 904 (67) | 885 (52) | <.0001 | .6409 |
| Ace inhibitor | 1250 (41) | 712 (53) | 538 (31) | <.0001 | .6075 | |
| Beta‐blocker | 1220 (40) | 767 (57) | 453 (26) | <.0001 | .4058 | |
| Insulin | 478 (16) | 254 (19) | 224 (13) | <.0001 | .7919 | |
| Clonidine | 115 (4) | 61 (5) | 54 (3) | .0454 | .6141 | |
| Type of surgery | Aorta | 232 (8) | 106 (8) | 126 (7) | <.0001 | .9899 |
| Carotid | 875 (29) | 510 (38) | 365 (21) | |||
| Amputation | 867 (28) | 274 (20) | 593 (35) | |||
| Bypass | 1088 (36) | 456 (34) | 632 (37) | |||
| RCRI | 0 | 1223 (40) | 389 (29) | 834 (49) | <.0001 | .9831 |
| 1 | 1005 (33) | 507 (38) | 498 (29) | |||
| 2 | 598 (20) | 318 (24) | 280 (16) | |||
| 3 | 200 (7) | 109 (8) | 91 (5) | |||
| 4 | 36 (1) | 23 (1) | 13 (0.76) | |||
| Year of surgery | 1998 | 544 (18) | 134 (10) | 410 (24) | <.0001 | 1 |
| 1999 | 463 (15) | 163 (12) | 300 (17) | |||
| 2000 | 420 (13) | 178 (13) | 242 (14) | |||
| 2001 | 407 (13) | 188 (14) | 219 (13) | |||
| 2002 | 374 (12) | 194 (14) | 180 (10) | |||
| 2003 | 371 (12) | 209 (16) | 162 (9) | |||
| 2004 | 407 (13) | 229 (17) | 178 (10) | |||
| 2005 | 76 (3) | 51 (4) | 25 (1.5) | |||
| Tobacco user | Yes | 971 (32) | 494 (37) | 477 (28) | <.0001 | .9809 |
| No | 649 (21) | 335 (25) | 314 (18) | |||
| Null | 1442 (47) | 517 (38) | 925 (54) | |||
| Ethnicity | White | 563 (18) | 263 (20) | 300 (17) | .1544 | .9475 |
| Other | 39 (1) | 13 (1) | 26 (1.5) | |||
| Unknown | 2460 (80) | 1070 (79) | 1390 (81) | |||
| Variable, N (%) | Level | Overall N = 3062 | BB users N = 1617 (53) | Non‐BB users N = 1445 (47) | Unadjusted P value | Propensity‐adjusted P value |
|---|---|---|---|---|---|---|
| ||||||
| Age in years, median (IQR) | 67 (5974) | 67 (5975) | 68 (6076) | .0526 | .7671 | |
| Sex | Female | 45 (1) | 12 (1) | 33 (2) | .0004 | .585 |
| Male | 3017 (99) | 1605 (99) | 1412 (98) | |||
| Preoperative medical conditions | HTN | 2415 (79) | 1398 (86) | 1017 (70) | <.0001 | .1837 |
| CVA/TIA | 589 (19) | 364 (23) | 225 (16) | <.0001 | .3206 | |
| CA | 679 (22) | 359 (22) | 320 (22) | .9701 | .4288 | |
| DM | 1474 (48) | 739 (46) | 735 (51) | .0043 | .6329 | |
| Lipid | 872 (28) | 555 (34) | 317 (22) | <.0001 | .7180 | |
| COPD | 913 (30) | 487 (30) | 426 (29) | .7007 | .8022 | |
| CAD | 1491 (49) | 975 (60) | 516 (36) | <.0001 | .3496 | |
| CHF | 747 (24) | 439 (27) | 308 (21) | .0002 | .6509 | |
| CKD | 443 (14) | 248 (15) | 195 (13) | .1480 | .8544 | |
| Blood chemistry | Creatinine > 2 | 229 (7) | 132 (8) | 97 (7) | .1277 | .5867 |
| Albumin 3.5 | 596 (23) | 252 (18) | 344 (30) | <.0001 | .5347 | |
| Medication use | Aspirin | 1789 (58) | 1046 (65) | 743 (51) | <.0001 | .4942 |
| Ace inhibitor | 1250 (41) | 760 (47) | 490 (34) | <.0001 | .4727 | |
| Statin | 1220 (40) | 932 (58) | 414 (29) | <.0001 | .3706 | |
| Insulin | 478 (16) | 255 (16) | 223 (15) | .7973 | .5991 | |
| Clonidine | 115 (4) | 77 (5) | 38 (3) | .0019 | .8241 | |
| Type of surgery | Aorta | 232 (8) | 176 (11) | 56 (4) | <.0001 | .5664 |
| Carotid | 875 (29) | 515 (32) | 360 (25) | |||
| Amputation | 867 (28) | 339 (21) | 528 (37) | |||
| Bypass | 1088 (36) | 587 (36) | 501 (35) | |||
| RCRI | 0 | 1223 (40) | 518 (32) | 705 (49) | <.0001 | .5489 |
| 1 | 1005 (33) | 583 (36) | 422 (29) | |||
| 2 | 598 (20) | 358 (22) | 240 (17) | |||
| 3 | 200 (7) | 130 (8) | 70 (5) | |||
| 4 | 36 (1) | 28 (2) | 8 (1) | |||
| Year of surgery | 1998 | 544 (18) | 200 (12) | 344 (24) | <.0001 | .3832 |
| 1999 | 463 (15) | 211 (13) | 252 (17) | |||
| 2000 | 420 (13) | 210 (13) | 210 (15) | |||
| 2001 | 407 (13) | 209 (13) | 198 (14) | |||
| 2002 | 374 (12) | 220 (14) | 154 (11) | |||
| 2003 | 371 (12) | 238 (15) | 133 (9) | |||
| 2004 | 407 (13) | 279 (17) | 128 (9) | |||
| 2005 | 76 (3) | 50 (3) | 26 (2) | |||
| Tobacco user | Yes | 971 (32) | 569 (35) | 402 (28) | <.0001 | .9025 |
| No | 649 (21) | 370 (23) | 279 (19) | |||
| Null | 1442 (47) | 678 (42) | 764 (53) | |||
| Ethnicity | White | 563 (18) | 309 (19) | 254 (18) | .4962 | .8762 |
| Other | 39 (1) | 19 (1) | 20 (1) | |||
| Unknown | 2460 (80) | 1289 (80) | 1171 (81) | |||
| N (%) Variable | Level | Overall N = 3062 | BB alone N = 685 (22) | Statin alone N = 414 (14) | Both drugs N = 932 (30) | Neither drug N = 1031 (34) | Unadjusted P value | Propensity‐adjusted P value |
|---|---|---|---|---|---|---|---|---|
| ||||||||
| Age in years, median (IQR) | 67 (5974) | 68 (6075) | 67 (6075) | 66 (5973) | 69 (6076) | .0029 | .9824 | |
| Sex | Female | 45 (1) | 7 (1) | 10 (2) | 5 (1) | 23 (2) | .0042 | .5815 |
| Male | 3017 (99) | 678 (99) | 404 (98) | 927 (99) | 1008 (98) | |||
| Preoperative medical conditions | HTN | 2415 (79) | 560 (82) | 338 (82) | 838 (90) | 679 (66) | <.0001 | .0251 |
| CVA/TIA | 589 (19) | 127 (19) | 91 (22) | 237 (25) | 134 (13) | <.0001 | .4543 | |
| CA | 679 (22) | 150 (22) | 98 (24) | 209 (22) | 222 (22) | .8379 | .9749 | |
| DM | 1474 (48) | 291 (43) | 218 (53) | 448 (48) | 517 (50) | .0031 | .3943 | |
| Lipid | 872 (28) | 125 (18) | 199 (48) | 430 (46) | 118 (11) | <.0001 | <.0001 | |
| COPD | 913 (30) | 199 (29) | 123 (30) | 288 (9) | 303 (29) | .8475. | .9769 | |
| CAD | 1491 (49) | 327 (48) | 189 (46) | 648 (70) | 327 (32) | <.0001 | <.0001 | |
| CHF | 747 (24) | 163 (24) | 94 (23) | 276 (30) | 214 (21) | <.0001 | .7031 | |
| CKD | 443 (14) | 92 (13) | 52 (13) | 156 (17) | 143 (14) | .1120 | .8364 | |
| Blood chemistry | Creatinine > 2 | 229 (7) | 52 (8) | 21 (5) | 80 (9) | 76 (7) | .1619 | .7184 |
| Albumin 3.5 | 596 (23) | 134 (20) | 73 (20) | 118 (14) | 271 (34) | <.0001 | .2846 | |
| Medication use | Aspirin | 1789 (58) | 398 (58) | 256 (62) | 648 (70) | 487 (47) | <.0001 | .2334 |
| Ace inhibitor | 1250 (41) | 264 (39) | 216 (52) | 496 (53) | 274 (27) | <.0001 | .0216 | |
| Insulin | 478 (16) | 93 (14) | 92 (22) | 162 (17) | 131 (13) | <.0001 | .2952 | |
| Clonidine | 115 (4) | 28 (4) | 12 (3) | 49 (5) | 26 (3) | .0107 | .8035 | |
| Type of surgery | Aorta | 232 (8) | 78 (11) | 8 (2) | 98 (11) | 48 (5) | <.0001 | .008 |
| Carotid | 875 (29) | 165 (24) | 160 (39) | 350 (38) | 200 (19) | |||
| Amputation | 867 (28) | 164 (24) | 99 (24) | 175 (19) | 429 (42) | |||
| Bypass | 1088 (36) | 278 (41) | 147 (36) | 309 (33) | 354 (34) | |||
| RCRI | 0 | 1223 (40) | 288 (42) | 159 (38) | 230 (25) | 546 (53) | <.0001 | .5392 |
| 1 | 1005 (33) | 219 (32) | 143 (35) | 364 (39) | 279 (27) | |||
| 2 | 598 (20) | 125 (18) | 85 (21) | 233 (25) | 155 (15) | |||
| 3 | 200 (7) | 46 (7) | 25 (6) | 84 (9) | 45 (4) | |||
| 4 | 36 (1) | 7 (1) | 2 (0) | 21 (2) | 6 (1) | |||
| Year of surgery | 1998 | 544 (18) | 126 (18) | 60 (14) | 74 (8) | 284 (28) | <.0001 | .3105 |
| 1999 | 463 (15) | 111 (16) | 63 (15) | 100 (11) | 189 (18) | |||
| 2000 | 420 (13) | 87 (13) | 55 (13) | 123 (13) | 155 (15) | |||
| 2001 | 407 (13) | 84 (12) | 63 (15) | 125 (13) | 135 (13) | |||
| 2002 | 374 (12) | 81 (12) | 55 (13) | 139 (15) | 99 (10 | |||
| 2003 | 371 (12) | 85 (13) | 56 (14) | 153 (16) | 77 (7) | |||
| 2004 | 407 (13) | 96 (14) | 46 (11) | 183 (20) | 82 (8) | |||
| 2005 | 76 (3) | 15 (2) | 16 (4) | 35 (4) | 10 (1) | |||
| Tobacco user | Yes | 971 (32) | 227 (33) | 152 (37) | 342 (37) | 250 (24) | <.0001 | .3914 |
| No | 649 (21) | 134 (20) | 99 (24) | 236 (25) | 180 (17) | |||
| Null | 1442 (47) | 324 (47) | 163 (39) | 354 (38) | 601 (58) | |||
| Ethnicity | White | 563 (18) | 115 (17) | 69 (17) | 194 (21) | 185 (18) | .2821 | .9771 |
| Other | 39 (1) | 10 (1) | 4 (1) | 9 (1) | 16 (2) | |||
| Unknown | 2460 (80) | 560 (82) | 341 (82) | 729 (78) | 830 (81) | |||
Univariate Survival Analysis
Univariate Cox regression analysis revealed a strong effect of the composite RCRI, which was predictive of mortality in a linear fashion over the course of the study compared with an RCRI of 0 (Table 1). Univariate analysis showed significant associations with decreased mortality for statins (hazard ratio [HR] = 0.66 [95% CI 0.580.75], P < .0001) and beta‐blockers (HR = 0.74 [95% CI 0.660.84], P = .0001); see Table 1. Of note, compared with that in 1998, mortality did not change for all the years for which data were complete. In addition, compared with taking neither study drug, taking a statin only, a beta‐blocker only, or both was associated with decreased mortality (P = .0002, P = .0079, and P < .0001, respectively; Fig. 1).
Propensity Score Analysis for Single Study Drug
There were significant differences in demographic and clinical characteristics between statin‐users versus statin nonusers, and between beta‐blocker users versus beta‐blocker nonusers. These differences became insignificant after the propensity score adjustment, with the exception of hyperlipidemia for statins, P = .02, which was added to the model as a confounder (Table 2). The distribution of the propensity scores was similar for study drug users and nonusers within each stratum. The association with decreased mortality remained significant after adjusting for propensity score (for statins, HR = 0.78 [95% CI 0.670.92, P = .0050], number needed to treat [NNT] = 22; for beta‐blockers HR = 0.84 [95% CI 0.730.96, P = .0103], NNT = 30; Fig. 2).
Combination Study Drugs and Revised Cardiac Risk Index: Univariate Analysis
We wanted our results to closely model those of combination use of the study drugs by patients in a clinical situation. Therefore, we first examined the effects of ambulatory statins alone, beta‐blockers alone, and a combination of statins and beta‐blockers by univariate analysis. Grouping patients by study drug use has not commonly been reported in the literature. We also examined the statistical interaction between the study drugs and the RCRI. The main‐effects model adequately explained all‐cause mortality, and the statistical interaction between the study drugs and the RCRI was not significant.
The final univariate Cox regression model, which compared use of a statin alone, a beta‐blocker alone, and a statin and beta‐blocker in combination with using neither study drug, demonstrated that the combination of statins and beta‐blockers had an HR over the whole study period of 0.43 (95% CI 0.360.51, P < .0001), statins alone had an HR of 0.59 (95% CI 0.480.72, P < .0001), and beta‐blockers alone had an HR of 0.71 (95% CI 0.610.83, P < .0001).
To clarify the effects of the study drugs on patients at different levels of risk, we stratified patients by the RCRI and evaluated the effects of the study drugs on mortality at 2 years, comparing the results to a referent of taking no study drugs. The use of both a statin and a beta‐blocker consistently produced a relative risk reduction (RRR) of approximately 50% with an NNT of 410, with highly statistically significant results for patients at all levels of risk (Table 5). As patient risk level increased, the NNT decreased, consistent with higher‐risk patients benefiting most from combination therapy with statins and beta‐blockers.
| RCRI | Drug | N (Deaths) | Mortality | NNT | RRR | P value |
|---|---|---|---|---|---|---|
| ||||||
| 0 | None | 546 (176) | 0.19 | |||
| BB | 288 (73) | 0.14 | 20 | 0.27 | .0023 | |
| Statin | 159 (30) | 0.12 | 14 | 0.39 | <.0001 | |
| Statin+BB | 230 (23) | 0.09 | 10 | 0.54 | <.0001 | |
| 1 | None | 279 (130) | 0.28 | |||
| BB | 219 (71) | 0.21 | 14 | 0.26 | .0028 | |
| Statin | 143 (41) | 0.17 | 10 | 0.37 | <.0001 | |
| Statin+BB | 364 (73) | 0.13 | 7 | 0.53 | <.0001 | |
| 2 | None | 155 (100) | 0.43 | |||
| BB | 125 (60) | 0.33 | 10 | 0.23 | .0045 | |
| Statin | 85 (42) | 0.28 | 7 | 0.35 | <.0001 | |
| Statin+BB | 233 (72) | 0.22 | 5 | 0.50 | <.0001 | |
| 3 | None | 51 (39) | 0.59 | |||
| BB | 53 (29) | 0.47 | 9 | 0.20 | .0296 | |
| Statin | 27 (14) | 0.41 | 6 | 0.31 | .0014 | |
| Statin+BB | 105 (52) | 0.32 | 4 | 0.46 | <.0001 | |
In addition, the range of outcomes can be clearly seen for both patient‐specific risk level and study drug use. For example, overall mortality at 2 years for all patients was 22%. For the study drugs, mortality ranged from 16% for patient who used both a statin and a beta‐blocker to 27% for those patients who used neither study drug. The use of the RCRI showed that the healthiest patients who were taking both a statin and a beta‐blocker did the best, with a 2‐year mortality of 9%, compared with the sickest patients who were taking neither study drug, whose 2‐year mortality was 59%. Use of both study drugs by the sickest patients was associated with a reduction in 2‐year mortality to 32% (P < .0001; Table 5).
Propensity Score Analysis of Use of Combination Study Drugs
Because there was very limited literature to guide us in the use of propensity score analysis of multiple treatment groups, we performed these analyses in an exploratory manner. There were significant differences between combination statin and beta‐blocker users and nonusers. These differences became insignificant after adjusting for propensity score, except for the 5 variables previously mentioned, which were added to the model as potential confounders (Table 4). The propensity‐adjusted Cox regression model comparing use of each study drug alone and in combination with taking neither over the whole study period still showed an association with decreased mortality. The combination of statins and beta‐blockers had an HR of 0.56 (95% CI 0.420.74), P < .0001; statins alone had an HR of 0.79 (95% CI 0.620.99), P = .0472; and beta‐blockers alone had an HR of 0.80 (95% CI 0.670.94), P = .0183.
Combination Study Drugs and Revised Cardiac Risk Index: Propensity Analysis
We performed the stratified Cox regression adjusted for the propensity scores for each level of RCRI and estimated 2‐year mortality. The use of both a statin and a beta‐blocker compared with using none was still consistently statistically significant, with an RRR of approximately 36% and an NNT of 820 for all levels of patient risk (Table 6). Possibly because of the reduced number of patients in each RCRI category, neither single‐agent study drug compared with none showed a statistically significant decrease in mortality at any level of patient‐specific risk (Table 6). Again, higher‐risk patients benefited most from combination therapy.
| RCRI | Drug | N (Deaths) | Mortality | NNT | RRR | P value |
|---|---|---|---|---|---|---|
| ||||||
| 0 | None | 546 (176) | 0.14 | |||
| BB | 288 (73) | 0.11 | 47 | 0.16 | .3778 | |
| Statin | 159 (30) | 0.11 | 40 | 0.19 | .2902 | |
| Statin+BB | 230 (23) | 0.08 | 20 | 0.38 | .0184 | |
| 1 | None | 279 (130) | 0.21 | |||
| BB | 219 (71) | 0.17 | 32 | 0.15 | .2837 | |
| Statin | 143 (41) | 0.17 | 27 | 0.18 | .1969 | |
| Statin+BB | 364 (73) | 0.13 | 14 | 0.37 | .0038 | |
| 2 | None | 155 (100) | 0.29 | |||
| BB | 125 (60) | 0.25 | 24 | 0.15 | .3295 | |
| Statin | 85 (42) | 0.24 | 20 | 0.17 | .2396 | |
| Statin+BB | 233 (72) | 0.18 | 10 | 0.36 | .0077 | |
| 3 | None | 51 (39) | 0.42 | |||
| BB | 53 (29) | 0.37 | 19 | 0.13 | .3553 | |
| Statin | 27 (14) | 0.36 | 16 | 0.15 | .2653 | |
| Statin+BB | 105 (52) | 0.28 | 8 | 0.33 | .0106 | |
Study Drug Timing: Subcohort Analysis
A subcohort analysis was performed to clarify the timing of the study drugs. Of the patients taking statins, 69 of 1346 (5.1%) took the drug before surgery only, 119 of 1346 (8.8%) took the drug after surgery only, and 1158 of 1346 (86%) took the drug both before and after surgery. Of the patients taking beta‐blockers, 54 of 1617 (3.3%) took the drug before surgery only, 397 of 1617 (24.6%) took the drug after surgery only, and 1166 of 1617 (72.1%) took the drug both before and after surgery. The use of statins and beta‐blockers had a correlation of 0.29 (contingency coefficient).
DISCUSSION
In this retrospective observational study we found that after vascular surgery the use of propensity‐adjusted statins compared with no use of statins reduced long‐term mortality over the study period by 22%, with a number needed to treat of 22, and the use of propensity‐adjusted beta‐blockers compared with no use also reduced long‐term mortality, by 16%, with a number needed to treat of 30. There were no statistically significant differences between outcomes of statin users and beta‐blocker users. In addition, using a propensity‐adjusted combination of statin and beta‐blockers compared with using neither decreased mortality overall by 44%, with a number needed to treat of 9. We focused on the use of outpatient drugs 30 days before or after surgery, as the timing of potentially beneficial medications has not been clearly established. Over time, more patients originally categorized as not taking a study drug began taking one, so that by 2 years after surgery, 58% of the patients were taking a statin, and 67% were taking a beta‐blocker, compared with 44% and 53%, respectively, of the study cohort initially. This would have made it more difficult to demonstrate a difference between these 2 groups. As more patients ended up taking the study drugs over time than the originally identified study drug users, and a mortality difference was still demonstrated, there may be an increased advantage in taking the study drugs around the time of surgery. As our focus was on long‐term postoperative mortality, which has not commonly been studied according to the literature, we preferred to also focus on long‐term, chronic ambulatory use of the study drugs. We did perform a subcohort analysis of the timing of study drug use. This confirmed that this cohort predominately comprised long‐term users of the study drugs who took the drug both before and after surgery. This study was not powered to comment on 30‐day mortality.
Perioperative beta‐blockers have been shown in retrospective cohort studies, case‐control studies, randomized clinical trials, meta‐analyses, and systematic reviews to decrease mortality and morbidity after noncardiac surgery. Although recent studies have not shown a benefit for more moderate‐ to low‐risk subjects,11, 12 perioperative beta‐blockers are still considered an indicator of health care quality in the United States.25 At present, perioperative beta‐blockers have an ACC/AHA class I indication (should be administered; Evidence level C) for patients undergoing vascular surgery with a positive stress test, and class IIa indication (reasonable to administer; Evidence level B) for vascular surgery patients with coronary heart disease or multiple clinical risk factors.26 A recent observational study in noncardiac surgery patients demonstrated perioperative beta‐blockers may be most helpful to prevent in‐hospital death after surgery of patients with an RCRI 2 and may be unhelpful or harmful for patients with an RCRI 1.27 Our univariate RCRI findings did not agree, as we found all patients whatever their level of risk benefited from perioperative use of beta‐blockers, alone or in combination. Our study population was older, had a higher RCRI, and underwent comparatively higher‐risk surgery, we were investigating longer‐term outcome, and we concentrated on ambulatory use of beta‐blockers, which may have contributed to the divergence in findings. Our propensity‐adjusted RCRI analysis did not show beta‐blockers associated with any change in mortality at any patient risk level. This may be, in part, because of the reduced number of patients in the RCRI strata. RCRI stratum‐specific analysis is limited by the number of patients and deaths in each RCRI stratum. For example, the power to detect a 2‐year difference of 10% (or 5%) between statin users and nonusers is approximately 99% (66%), 99% (59%), 92% (42%), and 61% (23%) for RCRI = 0, 1, 2, and 3, respectively.
Case‐control and retrospective cohort studies and one randomized clinical trial have shown perioperative statins to decrease either short‐term cardiovascular morbidity or mortality up to 30 days after surgery, and a limited number of retrospective cohort studies have shown reduced mortality for longer‐term follow‐up.1418, 28 There was one previous preliminary study of vascular surgery patients that demonstrated an additive benefit of using statins and beta‐blockers up to 30 days after surgery. This additive effect was only observed in patients with an RCRI 3.29 The results of our longer‐term follow‐up study of a larger cohort did not agree. Compared with patients who did not take a statin or a beta‐blocker, those patients who took both study drugs decreased their relative risk of mortality by approximately 36% in propensity‐ adjusted analysis and by about 50% in univariate analysis, regardless of patient‐specific risk level. For example, in the propensity‐adjusted analysis, the healthiest patients with an RCRI of 0 who took both study drugs had lower mortality than patients who took neither study drug, 8% versus 14%, a 38% relative reduction in mortality, with a number needed to treat of 20 (P = .0184).
In addition, the use of the RCRI for the first time highlighted the divergent long‐term mortality rates for patient‐specific risk levels and the striking long‐term associations of the perioperative use of ambulatory statins, beta‐blockers, and both drugs in combination with improved long‐term mortality. The long‐term use of the study drugs may indeed help all patients with atherosclerotic vascular disease, regardless of surgery. However, vascular surgery presents an opportunity for medical intervention, and our results are most applicable for these patients. In addition, the perioperative state has a unique physiology of acute and intense inflammation and thrombosis. Beta‐blockers and statins have antiadrenergic, anti‐inflammatory, and antithrombotic properties that may be beneficial during this high‐risk state.
Our findings should be viewed with some caution. The use of ICD‐9 codes and demographic data is dependent on the documentation and coding of comorbidities in the medical record and database. The use of statins and beta‐blockers was not random, and patients who took statins and beta‐blockers were different than those who did not. We used rigorous propensity and multivariate analysis, including controlling for clonidine, which has been shown to decrease death after vascular surgery.30 We also controlled for serum albumin level, which has been shown to be a leading predictor of postoperative death.31 We further separately stratified patients by RCRI, as this was a powerful predictor of death in the univariate analysis, but because of the retrospective nature of the study, unmeasured confounders may exist. Only 1% of the study patients were women, which is a limitation of the study. This administrative database is also limited by not having information on tobacco use for 47% of the patients and by not knowing ethnicity for 80% of the patients.
The use of perioperative statins and beta‐blockers used alone or in combination was associated with a reduction in long‐term mortality for vascular surgery patients, and combination use benefited patients at all levels of risk. Higher‐risk patients benefited most by taking both study drugs. These findings extend prior data, add to the natural history of long‐term postoperative outcomes, and also support clinical trials that would evaluate the prospective use of both these medications in vascular surgery patients with attention to patient‐specific risk level. Until the results of 2 randomized controlled trials become available, which may further clarify the use of perioperative statins and beta‐blockers in noncardiac, and noncardiac vascular surgery,13, 32 the use of statins and beta‐blockers should be considered for all patients undergoing vascular surgery. In addition, long‐term use of statins and beta‐blockers for all patients with atherosclerotic vascular disease should be considered.33
Acknowledgements
The authors thank LeAnn Snodgrass for assistance with data extraction and management. This work was funded by the Oregon Health & Science University Medical Research Foundation.
Vascular surgery has higher morbidity and mortality than other noncardiac surgeries. Despite the identification of vascular surgery as higher risk, 30‐day mortality for this surgery has remained at 3%10%. Few studies have examined longer‐term outcomes, but higher mortality rates have been reported, for example, 10%30% 6 months after surgery, 20%40% 1 year after surgery, and 30%50% 5 years after surgery.15 Postoperative adverse events have been found to be highly correlated with perioperative ischemia and infarction.68 Perioperative beta‐blockers have been widely studied and have been shown to benefit patients undergoing noncardiac surgery generally and vascular surgery specifically.9, 10 However, 2 recent trials of perioperative beta‐blockers in noncardiac and vascular surgery patients failed to show an association with 18‐month and 30‐day postoperative morbidity and mortality, respectively.11, 12 In addition, the authors of a recent meta‐analysis of perioperative beta‐blockers suggested more studies were needed.13 Furthermore, there have been promising new data on the use of perioperative statins.1418 Finally, as a recent clinical trial of revascularization before vascular surgery did not demonstrate an advantage over medical management, the identification of which perioperative medicines improve postoperative outcomes and in what combinations becomes even more important.19 We sought to ascertain if the ambulatory use of statins and/or beta‐blockers within 30 days of surgery was associated with a reduction in long‐term mortality.
METHODS
Setting and Subjects
We conducted a retrospective cohort study using a regional Department of Veterans Affairs (VA) administrative and relational database, the Consumer Health Information and Performance Sets (CHIPs), which automatically extracts data from electronic medical records of all facilities in the Veterans Integrated Services Network 20, which encompasses Alaska, Washington, Oregon, and Idaho. CHIPs contains information on both outpatient and inpatient environments, and a record is generated for every contact a patient makes with the VA health care system, which includes picking up prescription medications, laboratory values, demographic information, International Classification of Diseases, 9th Revision (ICD‐9), codes, and vital status. In addition, we used the Beneficiary Identification and Records Locator Subsystem database, which is the national VA death index and includes Social Security Administration data that has been shown to be 90%95% complete for assessing vital status.20
Data for all patients who had vascular surgery at 5 VA medical centers in the region from January 1998 to March 2005 was ascertained. If a patient had a second operation within 2 years of the first, the patient was censored at the date of the second operation. A patient was defined as taking a statin or beta‐blocker if a prescription for either of these medications had been picked up within 30 days before or after surgery. The IRB at the Portland VA Medical Center approved the study with a waiver of informed consent.
Data Elements
For every patient we noted the type of vascular surgery (carotid, aortic, lower extremity bypass, or lower extremity amputation), age, sex, comorbid conditions (hypertension, cerebrovascular disease, cancer, diabetes, hyperlipidemia, chronic obstructive pulmonary disease [COPD], chronic kidney disease [CKD], coronary artery disease [CAD], heart failure), tobacco use, ethnicity, nutritional status (serum albumin), and medication use, defined as filling a prescription within 30 days before surgery (insulin, aspirin, angiotensin‐converting enzyme [ACE] inhibitor, and clonidine). Each patient was assigned a revised cardiac risk index (RCRI) score.21 For each the risk factors: use of insulin, CAD, heart failure, cerebrovascular disease, CKD, and high‐risk surgery (intrathoracic, intraperitoneal, or suprainguinal vascular procedures) 1 point was assigned. These variables were defined according to ICD‐9 codes. CKD was defined as either an ICD‐9 code for CKD or a serum creatinine > 2 mg/dL. Patients were identified by the index vascular surgery using ICD‐9 codes in the CHIPs database, and both inpatient and outpatient data were extracted.
Statistical Analysis
All patients were censored at the point of last contact up to 5 years after surgery to focus on more clinically relevant long‐term outcomes possibly associated with vascular surgery. We conducted 3 separate analyses: (1) statin exposure regardless of beta‐blocker exposure; (2) beta‐blocker exposure regardless of statin exposure, and; (3) combined exposure to statins and beta‐blockers.
Propensity score methods were used to adjust for imbalance in the baseline characteristics between statin users and nonusers, beta‐blocker users and nonusers, and combination statin and beta‐blocker users and nonusers.22, 23 The range of the propensity score distribution was similar in drug users and nonusers in the individual analyses. There was sufficient overlap between the 2 groups in each stratum. To derive propensity scores for the individual drug analyses, statin use and beta‐blocker use were modeled independently with the demographic and clinical variables using stepwise logistic regression with a relaxed entry criterion of = 0.20. Only 1 variable (hyperlipidemia) remained significantly different between statin users and nonusers, and it was included in the subsequent analyses as a potential confounder. The variable albumin had 511 missing values. To keep this variable in the propensity scores, the missing values were replaced by the predicted values of albumin from the multiple linear regression model that included the other demographic variables. The propensity scores were grouped into quintiles and used as a stratification variable in the subsequent analyses. To confirm that the propensity score method reduced the imbalances, the demographic and clinical characteristics of statin and beta‐blocker users and nonusers and combination users and nonusers were compared using Cochran‐Mantel‐Haenzel tests with the respective propensity score as a stratification variable.
For the combined use of both study drugs, we performed univariate analysis with adjustment only for RCRI (as this was a powerful predictor of mortality in our dataset; Table 1) as well as a propensity score analysis in an exploratory manner. There have been limited applications of propensity score methods to multiple treatment groups. Similar to that in the study by Huang et al.,24 we developed a multinomial baseline response logit model to obtain 3 separate propensity scores (statin only vs. none, beta‐blocker only vs. none, and both vs. none). Because of the limited sample size, the data were stratified according to the median split of each propensity score. Each score had similar ranges for each treatment group. All but 5 variables (CAD, hypertension, hyperlipidemia, ACE inhibitor use, and type of surgery) were balanced after accounting for strata. These 5 variables were then included in the final stratified Cox regression model as potential confounders.
| Variable | Level | N (%) Overall N = 3062 | Hazard ratio (95% CI) | Chi‐square P value |
|---|---|---|---|---|
| ||||
| Age in years, median (IQR) | 67 (5974) | 1.04 (1.04, 1.05)a | <.0001 | |
| Sex | Female | 45 (1) | 0.89 (0.53, 1.51) | .6704 |
| Male | 3017 (99) | 1 | 1.0000 | |
| Preoperative medical conditions | HTN | 2415 (79) | 1.32 (1.13, 1.55) | .0006 |
| CVA/TIA | 589 (19) | 1.05 (0.90, 1.22) | .5753 | |
| CA | 679 (22) | 1.55 (1.36, 1.78) | <.0001 | |
| DM | 1474 (48) | 1.75 (1.54, 1.98) | <.0001 | |
| Lipid | 872 (28) | 0.84 (0.74, 0.97) | .0187 | |
| COPD | 913 (30) | 1.68 (1.48, 1.90) | <.0001 | |
| CAD | 1491 (49) | 1.46 (1.29, 1.66) | <.0001 | |
| CHF | 747 (24) | 2.44 (2.15, 2.77) | <.0001 | |
| CKD | 443 (14) | 2.32 (2.00, 2.69) | <.0001 | |
| Blood chemistry | Creatinine > 2 | 229 (7) | 2.73 (2.28, 3.28) | <.0001 |
| Albumin 3.5 | 596 (23) | 2.70 (2.35, 3.10) | <.0001 | |
| Medication use | Aspirin | 1789 (58) | 1.10 (0.97, 1.25) | .1389 |
| ACE inhibitor | 1250 (41) | 0.93 (0.82, 1.06) | .2894 | |
| Insulin | 478 (16) | 1.31 (1.12, 1.54) | .0007 | |
| Clonidine | 115 (4) | 1.68 (1.29, 2.20) | .0001 | |
| Perioperative medication | Statinb | 1346 (44) | 0.66 (0.58, 0.75) | <.0001 |
| Beta‐blockerc | 1617 (53) | 0.74 (0.66, 0.84) | <.0001 | |
| Statin only | 414 (14) | 0.69 (0.56, 0.84) | .0002 | |
| Beta‐blocker only | 685 (22) | 0.81 (0.69, 0.95) | .0079 | |
| Statin and beta‐blocker | 932 (30) | 0.57 (0.49, 0.67) | <.0001 | |
| Noned | 1031 (34) | 1 | 1.0000 | |
| Type of surgery | Aorta | 232 (8) | 1.34 (1.01, 1.77) | <.0001 |
| Carotid | 875 (29) | 1 | ||
| Amputation | 867 (28) | 2.80 (2.36, 3.32) | ||
| Bypass | 1088 (36) | 1.57 (1.32, 1.87) | ||
| RCRI | 0 | 1223 (40) | 1 | <.0001 |
| 1 | 1005 (33) | 1.33 (1.13, 1.55) | ||
| 2 | 598 (20) | 2.22 (1.88, 2.62) | ||
| 3 | 200 (7) | 3.16 (2.54, 3.93) | ||
| 4 | 36 (1) | 4.82 (3.15, 7.37) | ||
| Year surgery occurred | 1998 | 544 (18) | 1 | .6509 |
| 1999 | 463 (15) | 0.91 (0.75, 1.10) | ||
| 2000 | 420 (14) | 0.93 (0.77, 1.13) | ||
| 2001 | 407 (13) | 0.93 (0.75, 1.14) | ||
| 2002 | 374 (12) | 1.12 (0.90, 1.40) | ||
| 2003 | 371 (12) | 1.15 (0.90, 1.47) | ||
| 2004 | 407 (13) | 0.97 (0.72, 1.31) | ||
| 2005 | 76 (3) | 0.68 (0.28, 1.65) | ||
| Tobacco user | Yes | 971 (32) | 0.90 (0.76, 1.08) | .4762 |
| No | 649 (21) | 1 | ||
| Null | 1442 (47) | 0.96 (0.81, 1.13) | ||
| Ethnicity | White | 563 (18) | 1 | .0366 |
| Other | 39 (1) | 0.98 (0.55, 1.76) | ||
| Unknown | 2460 (80) | 1.24 (1.05, 1.46) | ||
To comment on patient‐specific risk by stratification with the RCRI, we used a fixed time point of the 2‐year mortality estimated from the Cox regression model to analyze use of study drugs singly or in combination compared with use of neither.
Chi‐square tests were used to categorize and compare demographic and clinical characteristics of statin users and nonusers, of beta‐blocker users and nonusers, and combination users and nonusers. Survival curves were estimated using the Kaplan‐Meier method and compared using the log‐rank test. Stratified or unstratified Cox regression was used to estimate the hazard ratios of statins and beta‐blockers, with or without adjustment for the propensity score. All analyses were performed using SAS (Statistical Analysis System) software, version 9.1.
RESULTS
Patient Characteristics
The study included 3062 patients whose median age was 67 (interquartile range, 5974; Table 1). Ninety‐nine percent of the study patients were men. Overall, ambulatory use of statins and beta‐blockers was found in 44% and 53% of patients, respectively, and combination use occurred in 30%. Sixty‐one percent of patients had an RCRI of 1 or greater; among them 71% were statin users (Table 2), 68% were beta‐blocker users (Table 3), and 75% were combination users (Table 4). Sixty‐four percent of surgeries were either lower extremity bypass or amputation, 29% were carotid, and 8% aortic. Median follow‐up for all patients was 2.7 years (interquartile range, 1.24.6). Of the whole study cohort, 53% and 62% filled a prescription for a statin or beta‐blocker within 1 year of surgery, respectively, and 58% and 67% filled a prescription within 2 years of surgery, respectively. Overall mortality at 30 days was 3%, at 1 year 14%, and at 2 years 22%.
| Variable, N (%) | Level | Overall (N = 3062) | Statin users (N = 1346 [44]) | Statin nonusers (N = 1716 [56]) | Unadjusted P value | Propensity‐adjusted P value |
|---|---|---|---|---|---|---|
| ||||||
| Age in years, median (IQR) | 67 (5974) | 66 (5973) | 68 (6075) | <.0001 | .9934 | |
| Sex | Female | 45 (1) | 15 (1) | 30 (2) | .1480 | .7822 |
| Male | 3017 (99) | 1331 (99) | 1686 (98) | |||
| Preoperative medical conditions | HTN | 2415 (79) | 1176 (87) | 1239 (72) | <.0001 | .2984 |
| CVA/TIA | 589 (19) | 328 (24) | 261 (15) | <.0001 | .3935 | |
| CA | 679 (22) | 307 (23) | 372 (22) | .4550 | .8404 | |
| DM | 1474 (48) | 666 (49) | 808 (47) | .1883 | .5504 | |
| Lipid | 872 (28) | 629 (47) | 243 (14) | <.0001 | .0246 | |
| COPD | 913 (30) | 411 (31) | 502 (29) | .4419 | .8435 | |
| CAD | 1491 (49) | 837 (62) | 654 (38) | <.0001 | .4720 | |
| CHF | 747 (24) | 370 (27) | 377 (22) | .0004 | .4839 | |
| CKD | 443 (14) | 208 (15) | 235 (14) | .1698 | .9990 | |
| Blood chemistry | Creatinine > 2 | 229 (7) | 101 (8) | 128 (7) | .9629 | .6911 |
| Albumin 3.5 | 596 (23) | 191 (16) | 405 (30) | <.0001 | .5917 | |
| Medication use | Aspirin | 1789 (58) | 904 (67) | 885 (52) | <.0001 | .6409 |
| Ace inhibitor | 1250 (41) | 712 (53) | 538 (31) | <.0001 | .6075 | |
| Beta‐blocker | 1220 (40) | 767 (57) | 453 (26) | <.0001 | .4058 | |
| Insulin | 478 (16) | 254 (19) | 224 (13) | <.0001 | .7919 | |
| Clonidine | 115 (4) | 61 (5) | 54 (3) | .0454 | .6141 | |
| Type of surgery | Aorta | 232 (8) | 106 (8) | 126 (7) | <.0001 | .9899 |
| Carotid | 875 (29) | 510 (38) | 365 (21) | |||
| Amputation | 867 (28) | 274 (20) | 593 (35) | |||
| Bypass | 1088 (36) | 456 (34) | 632 (37) | |||
| RCRI | 0 | 1223 (40) | 389 (29) | 834 (49) | <.0001 | .9831 |
| 1 | 1005 (33) | 507 (38) | 498 (29) | |||
| 2 | 598 (20) | 318 (24) | 280 (16) | |||
| 3 | 200 (7) | 109 (8) | 91 (5) | |||
| 4 | 36 (1) | 23 (1) | 13 (0.76) | |||
| Year of surgery | 1998 | 544 (18) | 134 (10) | 410 (24) | <.0001 | 1 |
| 1999 | 463 (15) | 163 (12) | 300 (17) | |||
| 2000 | 420 (13) | 178 (13) | 242 (14) | |||
| 2001 | 407 (13) | 188 (14) | 219 (13) | |||
| 2002 | 374 (12) | 194 (14) | 180 (10) | |||
| 2003 | 371 (12) | 209 (16) | 162 (9) | |||
| 2004 | 407 (13) | 229 (17) | 178 (10) | |||
| 2005 | 76 (3) | 51 (4) | 25 (1.5) | |||
| Tobacco user | Yes | 971 (32) | 494 (37) | 477 (28) | <.0001 | .9809 |
| No | 649 (21) | 335 (25) | 314 (18) | |||
| Null | 1442 (47) | 517 (38) | 925 (54) | |||
| Ethnicity | White | 563 (18) | 263 (20) | 300 (17) | .1544 | .9475 |
| Other | 39 (1) | 13 (1) | 26 (1.5) | |||
| Unknown | 2460 (80) | 1070 (79) | 1390 (81) | |||
| Variable, N (%) | Level | Overall N = 3062 | BB users N = 1617 (53) | Non‐BB users N = 1445 (47) | Unadjusted P value | Propensity‐adjusted P value |
|---|---|---|---|---|---|---|
| ||||||
| Age in years, median (IQR) | 67 (5974) | 67 (5975) | 68 (6076) | .0526 | .7671 | |
| Sex | Female | 45 (1) | 12 (1) | 33 (2) | .0004 | .585 |
| Male | 3017 (99) | 1605 (99) | 1412 (98) | |||
| Preoperative medical conditions | HTN | 2415 (79) | 1398 (86) | 1017 (70) | <.0001 | .1837 |
| CVA/TIA | 589 (19) | 364 (23) | 225 (16) | <.0001 | .3206 | |
| CA | 679 (22) | 359 (22) | 320 (22) | .9701 | .4288 | |
| DM | 1474 (48) | 739 (46) | 735 (51) | .0043 | .6329 | |
| Lipid | 872 (28) | 555 (34) | 317 (22) | <.0001 | .7180 | |
| COPD | 913 (30) | 487 (30) | 426 (29) | .7007 | .8022 | |
| CAD | 1491 (49) | 975 (60) | 516 (36) | <.0001 | .3496 | |
| CHF | 747 (24) | 439 (27) | 308 (21) | .0002 | .6509 | |
| CKD | 443 (14) | 248 (15) | 195 (13) | .1480 | .8544 | |
| Blood chemistry | Creatinine > 2 | 229 (7) | 132 (8) | 97 (7) | .1277 | .5867 |
| Albumin 3.5 | 596 (23) | 252 (18) | 344 (30) | <.0001 | .5347 | |
| Medication use | Aspirin | 1789 (58) | 1046 (65) | 743 (51) | <.0001 | .4942 |
| Ace inhibitor | 1250 (41) | 760 (47) | 490 (34) | <.0001 | .4727 | |
| Statin | 1220 (40) | 932 (58) | 414 (29) | <.0001 | .3706 | |
| Insulin | 478 (16) | 255 (16) | 223 (15) | .7973 | .5991 | |
| Clonidine | 115 (4) | 77 (5) | 38 (3) | .0019 | .8241 | |
| Type of surgery | Aorta | 232 (8) | 176 (11) | 56 (4) | <.0001 | .5664 |
| Carotid | 875 (29) | 515 (32) | 360 (25) | |||
| Amputation | 867 (28) | 339 (21) | 528 (37) | |||
| Bypass | 1088 (36) | 587 (36) | 501 (35) | |||
| RCRI | 0 | 1223 (40) | 518 (32) | 705 (49) | <.0001 | .5489 |
| 1 | 1005 (33) | 583 (36) | 422 (29) | |||
| 2 | 598 (20) | 358 (22) | 240 (17) | |||
| 3 | 200 (7) | 130 (8) | 70 (5) | |||
| 4 | 36 (1) | 28 (2) | 8 (1) | |||
| Year of surgery | 1998 | 544 (18) | 200 (12) | 344 (24) | <.0001 | .3832 |
| 1999 | 463 (15) | 211 (13) | 252 (17) | |||
| 2000 | 420 (13) | 210 (13) | 210 (15) | |||
| 2001 | 407 (13) | 209 (13) | 198 (14) | |||
| 2002 | 374 (12) | 220 (14) | 154 (11) | |||
| 2003 | 371 (12) | 238 (15) | 133 (9) | |||
| 2004 | 407 (13) | 279 (17) | 128 (9) | |||
| 2005 | 76 (3) | 50 (3) | 26 (2) | |||
| Tobacco user | Yes | 971 (32) | 569 (35) | 402 (28) | <.0001 | .9025 |
| No | 649 (21) | 370 (23) | 279 (19) | |||
| Null | 1442 (47) | 678 (42) | 764 (53) | |||
| Ethnicity | White | 563 (18) | 309 (19) | 254 (18) | .4962 | .8762 |
| Other | 39 (1) | 19 (1) | 20 (1) | |||
| Unknown | 2460 (80) | 1289 (80) | 1171 (81) | |||
| N (%) Variable | Level | Overall N = 3062 | BB alone N = 685 (22) | Statin alone N = 414 (14) | Both drugs N = 932 (30) | Neither drug N = 1031 (34) | Unadjusted P value | Propensity‐adjusted P value |
|---|---|---|---|---|---|---|---|---|
| ||||||||
| Age in years, median (IQR) | 67 (5974) | 68 (6075) | 67 (6075) | 66 (5973) | 69 (6076) | .0029 | .9824 | |
| Sex | Female | 45 (1) | 7 (1) | 10 (2) | 5 (1) | 23 (2) | .0042 | .5815 |
| Male | 3017 (99) | 678 (99) | 404 (98) | 927 (99) | 1008 (98) | |||
| Preoperative medical conditions | HTN | 2415 (79) | 560 (82) | 338 (82) | 838 (90) | 679 (66) | <.0001 | .0251 |
| CVA/TIA | 589 (19) | 127 (19) | 91 (22) | 237 (25) | 134 (13) | <.0001 | .4543 | |
| CA | 679 (22) | 150 (22) | 98 (24) | 209 (22) | 222 (22) | .8379 | .9749 | |
| DM | 1474 (48) | 291 (43) | 218 (53) | 448 (48) | 517 (50) | .0031 | .3943 | |
| Lipid | 872 (28) | 125 (18) | 199 (48) | 430 (46) | 118 (11) | <.0001 | <.0001 | |
| COPD | 913 (30) | 199 (29) | 123 (30) | 288 (9) | 303 (29) | .8475. | .9769 | |
| CAD | 1491 (49) | 327 (48) | 189 (46) | 648 (70) | 327 (32) | <.0001 | <.0001 | |
| CHF | 747 (24) | 163 (24) | 94 (23) | 276 (30) | 214 (21) | <.0001 | .7031 | |
| CKD | 443 (14) | 92 (13) | 52 (13) | 156 (17) | 143 (14) | .1120 | .8364 | |
| Blood chemistry | Creatinine > 2 | 229 (7) | 52 (8) | 21 (5) | 80 (9) | 76 (7) | .1619 | .7184 |
| Albumin 3.5 | 596 (23) | 134 (20) | 73 (20) | 118 (14) | 271 (34) | <.0001 | .2846 | |
| Medication use | Aspirin | 1789 (58) | 398 (58) | 256 (62) | 648 (70) | 487 (47) | <.0001 | .2334 |
| Ace inhibitor | 1250 (41) | 264 (39) | 216 (52) | 496 (53) | 274 (27) | <.0001 | .0216 | |
| Insulin | 478 (16) | 93 (14) | 92 (22) | 162 (17) | 131 (13) | <.0001 | .2952 | |
| Clonidine | 115 (4) | 28 (4) | 12 (3) | 49 (5) | 26 (3) | .0107 | .8035 | |
| Type of surgery | Aorta | 232 (8) | 78 (11) | 8 (2) | 98 (11) | 48 (5) | <.0001 | .008 |
| Carotid | 875 (29) | 165 (24) | 160 (39) | 350 (38) | 200 (19) | |||
| Amputation | 867 (28) | 164 (24) | 99 (24) | 175 (19) | 429 (42) | |||
| Bypass | 1088 (36) | 278 (41) | 147 (36) | 309 (33) | 354 (34) | |||
| RCRI | 0 | 1223 (40) | 288 (42) | 159 (38) | 230 (25) | 546 (53) | <.0001 | .5392 |
| 1 | 1005 (33) | 219 (32) | 143 (35) | 364 (39) | 279 (27) | |||
| 2 | 598 (20) | 125 (18) | 85 (21) | 233 (25) | 155 (15) | |||
| 3 | 200 (7) | 46 (7) | 25 (6) | 84 (9) | 45 (4) | |||
| 4 | 36 (1) | 7 (1) | 2 (0) | 21 (2) | 6 (1) | |||
| Year of surgery | 1998 | 544 (18) | 126 (18) | 60 (14) | 74 (8) | 284 (28) | <.0001 | .3105 |
| 1999 | 463 (15) | 111 (16) | 63 (15) | 100 (11) | 189 (18) | |||
| 2000 | 420 (13) | 87 (13) | 55 (13) | 123 (13) | 155 (15) | |||
| 2001 | 407 (13) | 84 (12) | 63 (15) | 125 (13) | 135 (13) | |||
| 2002 | 374 (12) | 81 (12) | 55 (13) | 139 (15) | 99 (10 | |||
| 2003 | 371 (12) | 85 (13) | 56 (14) | 153 (16) | 77 (7) | |||
| 2004 | 407 (13) | 96 (14) | 46 (11) | 183 (20) | 82 (8) | |||
| 2005 | 76 (3) | 15 (2) | 16 (4) | 35 (4) | 10 (1) | |||
| Tobacco user | Yes | 971 (32) | 227 (33) | 152 (37) | 342 (37) | 250 (24) | <.0001 | .3914 |
| No | 649 (21) | 134 (20) | 99 (24) | 236 (25) | 180 (17) | |||
| Null | 1442 (47) | 324 (47) | 163 (39) | 354 (38) | 601 (58) | |||
| Ethnicity | White | 563 (18) | 115 (17) | 69 (17) | 194 (21) | 185 (18) | .2821 | .9771 |
| Other | 39 (1) | 10 (1) | 4 (1) | 9 (1) | 16 (2) | |||
| Unknown | 2460 (80) | 560 (82) | 341 (82) | 729 (78) | 830 (81) | |||
Univariate Survival Analysis
Univariate Cox regression analysis revealed a strong effect of the composite RCRI, which was predictive of mortality in a linear fashion over the course of the study compared with an RCRI of 0 (Table 1). Univariate analysis showed significant associations with decreased mortality for statins (hazard ratio [HR] = 0.66 [95% CI 0.580.75], P < .0001) and beta‐blockers (HR = 0.74 [95% CI 0.660.84], P = .0001); see Table 1. Of note, compared with that in 1998, mortality did not change for all the years for which data were complete. In addition, compared with taking neither study drug, taking a statin only, a beta‐blocker only, or both was associated with decreased mortality (P = .0002, P = .0079, and P < .0001, respectively; Fig. 1).
Propensity Score Analysis for Single Study Drug
There were significant differences in demographic and clinical characteristics between statin‐users versus statin nonusers, and between beta‐blocker users versus beta‐blocker nonusers. These differences became insignificant after the propensity score adjustment, with the exception of hyperlipidemia for statins, P = .02, which was added to the model as a confounder (Table 2). The distribution of the propensity scores was similar for study drug users and nonusers within each stratum. The association with decreased mortality remained significant after adjusting for propensity score (for statins, HR = 0.78 [95% CI 0.670.92, P = .0050], number needed to treat [NNT] = 22; for beta‐blockers HR = 0.84 [95% CI 0.730.96, P = .0103], NNT = 30; Fig. 2).
Combination Study Drugs and Revised Cardiac Risk Index: Univariate Analysis
We wanted our results to closely model those of combination use of the study drugs by patients in a clinical situation. Therefore, we first examined the effects of ambulatory statins alone, beta‐blockers alone, and a combination of statins and beta‐blockers by univariate analysis. Grouping patients by study drug use has not commonly been reported in the literature. We also examined the statistical interaction between the study drugs and the RCRI. The main‐effects model adequately explained all‐cause mortality, and the statistical interaction between the study drugs and the RCRI was not significant.
The final univariate Cox regression model, which compared use of a statin alone, a beta‐blocker alone, and a statin and beta‐blocker in combination with using neither study drug, demonstrated that the combination of statins and beta‐blockers had an HR over the whole study period of 0.43 (95% CI 0.360.51, P < .0001), statins alone had an HR of 0.59 (95% CI 0.480.72, P < .0001), and beta‐blockers alone had an HR of 0.71 (95% CI 0.610.83, P < .0001).
To clarify the effects of the study drugs on patients at different levels of risk, we stratified patients by the RCRI and evaluated the effects of the study drugs on mortality at 2 years, comparing the results to a referent of taking no study drugs. The use of both a statin and a beta‐blocker consistently produced a relative risk reduction (RRR) of approximately 50% with an NNT of 410, with highly statistically significant results for patients at all levels of risk (Table 5). As patient risk level increased, the NNT decreased, consistent with higher‐risk patients benefiting most from combination therapy with statins and beta‐blockers.
| RCRI | Drug | N (Deaths) | Mortality | NNT | RRR | P value |
|---|---|---|---|---|---|---|
| ||||||
| 0 | None | 546 (176) | 0.19 | |||
| BB | 288 (73) | 0.14 | 20 | 0.27 | .0023 | |
| Statin | 159 (30) | 0.12 | 14 | 0.39 | <.0001 | |
| Statin+BB | 230 (23) | 0.09 | 10 | 0.54 | <.0001 | |
| 1 | None | 279 (130) | 0.28 | |||
| BB | 219 (71) | 0.21 | 14 | 0.26 | .0028 | |
| Statin | 143 (41) | 0.17 | 10 | 0.37 | <.0001 | |
| Statin+BB | 364 (73) | 0.13 | 7 | 0.53 | <.0001 | |
| 2 | None | 155 (100) | 0.43 | |||
| BB | 125 (60) | 0.33 | 10 | 0.23 | .0045 | |
| Statin | 85 (42) | 0.28 | 7 | 0.35 | <.0001 | |
| Statin+BB | 233 (72) | 0.22 | 5 | 0.50 | <.0001 | |
| 3 | None | 51 (39) | 0.59 | |||
| BB | 53 (29) | 0.47 | 9 | 0.20 | .0296 | |
| Statin | 27 (14) | 0.41 | 6 | 0.31 | .0014 | |
| Statin+BB | 105 (52) | 0.32 | 4 | 0.46 | <.0001 | |
In addition, the range of outcomes can be clearly seen for both patient‐specific risk level and study drug use. For example, overall mortality at 2 years for all patients was 22%. For the study drugs, mortality ranged from 16% for patient who used both a statin and a beta‐blocker to 27% for those patients who used neither study drug. The use of the RCRI showed that the healthiest patients who were taking both a statin and a beta‐blocker did the best, with a 2‐year mortality of 9%, compared with the sickest patients who were taking neither study drug, whose 2‐year mortality was 59%. Use of both study drugs by the sickest patients was associated with a reduction in 2‐year mortality to 32% (P < .0001; Table 5).
Propensity Score Analysis of Use of Combination Study Drugs
Because there was very limited literature to guide us in the use of propensity score analysis of multiple treatment groups, we performed these analyses in an exploratory manner. There were significant differences between combination statin and beta‐blocker users and nonusers. These differences became insignificant after adjusting for propensity score, except for the 5 variables previously mentioned, which were added to the model as potential confounders (Table 4). The propensity‐adjusted Cox regression model comparing use of each study drug alone and in combination with taking neither over the whole study period still showed an association with decreased mortality. The combination of statins and beta‐blockers had an HR of 0.56 (95% CI 0.420.74), P < .0001; statins alone had an HR of 0.79 (95% CI 0.620.99), P = .0472; and beta‐blockers alone had an HR of 0.80 (95% CI 0.670.94), P = .0183.
Combination Study Drugs and Revised Cardiac Risk Index: Propensity Analysis
We performed the stratified Cox regression adjusted for the propensity scores for each level of RCRI and estimated 2‐year mortality. The use of both a statin and a beta‐blocker compared with using none was still consistently statistically significant, with an RRR of approximately 36% and an NNT of 820 for all levels of patient risk (Table 6). Possibly because of the reduced number of patients in each RCRI category, neither single‐agent study drug compared with none showed a statistically significant decrease in mortality at any level of patient‐specific risk (Table 6). Again, higher‐risk patients benefited most from combination therapy.
| RCRI | Drug | N (Deaths) | Mortality | NNT | RRR | P value |
|---|---|---|---|---|---|---|
| ||||||
| 0 | None | 546 (176) | 0.14 | |||
| BB | 288 (73) | 0.11 | 47 | 0.16 | .3778 | |
| Statin | 159 (30) | 0.11 | 40 | 0.19 | .2902 | |
| Statin+BB | 230 (23) | 0.08 | 20 | 0.38 | .0184 | |
| 1 | None | 279 (130) | 0.21 | |||
| BB | 219 (71) | 0.17 | 32 | 0.15 | .2837 | |
| Statin | 143 (41) | 0.17 | 27 | 0.18 | .1969 | |
| Statin+BB | 364 (73) | 0.13 | 14 | 0.37 | .0038 | |
| 2 | None | 155 (100) | 0.29 | |||
| BB | 125 (60) | 0.25 | 24 | 0.15 | .3295 | |
| Statin | 85 (42) | 0.24 | 20 | 0.17 | .2396 | |
| Statin+BB | 233 (72) | 0.18 | 10 | 0.36 | .0077 | |
| 3 | None | 51 (39) | 0.42 | |||
| BB | 53 (29) | 0.37 | 19 | 0.13 | .3553 | |
| Statin | 27 (14) | 0.36 | 16 | 0.15 | .2653 | |
| Statin+BB | 105 (52) | 0.28 | 8 | 0.33 | .0106 | |
Study Drug Timing: Subcohort Analysis
A subcohort analysis was performed to clarify the timing of the study drugs. Of the patients taking statins, 69 of 1346 (5.1%) took the drug before surgery only, 119 of 1346 (8.8%) took the drug after surgery only, and 1158 of 1346 (86%) took the drug both before and after surgery. Of the patients taking beta‐blockers, 54 of 1617 (3.3%) took the drug before surgery only, 397 of 1617 (24.6%) took the drug after surgery only, and 1166 of 1617 (72.1%) took the drug both before and after surgery. The use of statins and beta‐blockers had a correlation of 0.29 (contingency coefficient).
DISCUSSION
In this retrospective observational study we found that after vascular surgery the use of propensity‐adjusted statins compared with no use of statins reduced long‐term mortality over the study period by 22%, with a number needed to treat of 22, and the use of propensity‐adjusted beta‐blockers compared with no use also reduced long‐term mortality, by 16%, with a number needed to treat of 30. There were no statistically significant differences between outcomes of statin users and beta‐blocker users. In addition, using a propensity‐adjusted combination of statin and beta‐blockers compared with using neither decreased mortality overall by 44%, with a number needed to treat of 9. We focused on the use of outpatient drugs 30 days before or after surgery, as the timing of potentially beneficial medications has not been clearly established. Over time, more patients originally categorized as not taking a study drug began taking one, so that by 2 years after surgery, 58% of the patients were taking a statin, and 67% were taking a beta‐blocker, compared with 44% and 53%, respectively, of the study cohort initially. This would have made it more difficult to demonstrate a difference between these 2 groups. As more patients ended up taking the study drugs over time than the originally identified study drug users, and a mortality difference was still demonstrated, there may be an increased advantage in taking the study drugs around the time of surgery. As our focus was on long‐term postoperative mortality, which has not commonly been studied according to the literature, we preferred to also focus on long‐term, chronic ambulatory use of the study drugs. We did perform a subcohort analysis of the timing of study drug use. This confirmed that this cohort predominately comprised long‐term users of the study drugs who took the drug both before and after surgery. This study was not powered to comment on 30‐day mortality.
Perioperative beta‐blockers have been shown in retrospective cohort studies, case‐control studies, randomized clinical trials, meta‐analyses, and systematic reviews to decrease mortality and morbidity after noncardiac surgery. Although recent studies have not shown a benefit for more moderate‐ to low‐risk subjects,11, 12 perioperative beta‐blockers are still considered an indicator of health care quality in the United States.25 At present, perioperative beta‐blockers have an ACC/AHA class I indication (should be administered; Evidence level C) for patients undergoing vascular surgery with a positive stress test, and class IIa indication (reasonable to administer; Evidence level B) for vascular surgery patients with coronary heart disease or multiple clinical risk factors.26 A recent observational study in noncardiac surgery patients demonstrated perioperative beta‐blockers may be most helpful to prevent in‐hospital death after surgery of patients with an RCRI 2 and may be unhelpful or harmful for patients with an RCRI 1.27 Our univariate RCRI findings did not agree, as we found all patients whatever their level of risk benefited from perioperative use of beta‐blockers, alone or in combination. Our study population was older, had a higher RCRI, and underwent comparatively higher‐risk surgery, we were investigating longer‐term outcome, and we concentrated on ambulatory use of beta‐blockers, which may have contributed to the divergence in findings. Our propensity‐adjusted RCRI analysis did not show beta‐blockers associated with any change in mortality at any patient risk level. This may be, in part, because of the reduced number of patients in the RCRI strata. RCRI stratum‐specific analysis is limited by the number of patients and deaths in each RCRI stratum. For example, the power to detect a 2‐year difference of 10% (or 5%) between statin users and nonusers is approximately 99% (66%), 99% (59%), 92% (42%), and 61% (23%) for RCRI = 0, 1, 2, and 3, respectively.
Case‐control and retrospective cohort studies and one randomized clinical trial have shown perioperative statins to decrease either short‐term cardiovascular morbidity or mortality up to 30 days after surgery, and a limited number of retrospective cohort studies have shown reduced mortality for longer‐term follow‐up.1418, 28 There was one previous preliminary study of vascular surgery patients that demonstrated an additive benefit of using statins and beta‐blockers up to 30 days after surgery. This additive effect was only observed in patients with an RCRI 3.29 The results of our longer‐term follow‐up study of a larger cohort did not agree. Compared with patients who did not take a statin or a beta‐blocker, those patients who took both study drugs decreased their relative risk of mortality by approximately 36% in propensity‐ adjusted analysis and by about 50% in univariate analysis, regardless of patient‐specific risk level. For example, in the propensity‐adjusted analysis, the healthiest patients with an RCRI of 0 who took both study drugs had lower mortality than patients who took neither study drug, 8% versus 14%, a 38% relative reduction in mortality, with a number needed to treat of 20 (P = .0184).
In addition, the use of the RCRI for the first time highlighted the divergent long‐term mortality rates for patient‐specific risk levels and the striking long‐term associations of the perioperative use of ambulatory statins, beta‐blockers, and both drugs in combination with improved long‐term mortality. The long‐term use of the study drugs may indeed help all patients with atherosclerotic vascular disease, regardless of surgery. However, vascular surgery presents an opportunity for medical intervention, and our results are most applicable for these patients. In addition, the perioperative state has a unique physiology of acute and intense inflammation and thrombosis. Beta‐blockers and statins have antiadrenergic, anti‐inflammatory, and antithrombotic properties that may be beneficial during this high‐risk state.
Our findings should be viewed with some caution. The use of ICD‐9 codes and demographic data is dependent on the documentation and coding of comorbidities in the medical record and database. The use of statins and beta‐blockers was not random, and patients who took statins and beta‐blockers were different than those who did not. We used rigorous propensity and multivariate analysis, including controlling for clonidine, which has been shown to decrease death after vascular surgery.30 We also controlled for serum albumin level, which has been shown to be a leading predictor of postoperative death.31 We further separately stratified patients by RCRI, as this was a powerful predictor of death in the univariate analysis, but because of the retrospective nature of the study, unmeasured confounders may exist. Only 1% of the study patients were women, which is a limitation of the study. This administrative database is also limited by not having information on tobacco use for 47% of the patients and by not knowing ethnicity for 80% of the patients.
The use of perioperative statins and beta‐blockers used alone or in combination was associated with a reduction in long‐term mortality for vascular surgery patients, and combination use benefited patients at all levels of risk. Higher‐risk patients benefited most by taking both study drugs. These findings extend prior data, add to the natural history of long‐term postoperative outcomes, and also support clinical trials that would evaluate the prospective use of both these medications in vascular surgery patients with attention to patient‐specific risk level. Until the results of 2 randomized controlled trials become available, which may further clarify the use of perioperative statins and beta‐blockers in noncardiac, and noncardiac vascular surgery,13, 32 the use of statins and beta‐blockers should be considered for all patients undergoing vascular surgery. In addition, long‐term use of statins and beta‐blockers for all patients with atherosclerotic vascular disease should be considered.33
Acknowledgements
The authors thank LeAnn Snodgrass for assistance with data extraction and management. This work was funded by the Oregon Health & Science University Medical Research Foundation.
- ,,,,,.The influence of perioperative myocardial infarction on long‐term prognosis following elective vascular surgery.Chest.1998;113:681–686.
- ,,, et al.Postoperative and amputation‐free survival outcomes after femorodistal bypass grafting surgery: findings from the Department of Veterans Affairs National Surgical Quality Improvement Program.J Vasc Surg.2001;34:283–290.
- ,,,.Perioperative‐ and long‐term mortality rates after major vascular surgery: the relationship to preoperative testing in the medicare population.Anesth Analg1999;89:849–855.
- ,.Very late survival after vascular surgery.J Surg Res.2002;105(2):109–114.
- ,,, et al.Women have increased risk of perioperative myocardial infarction and higher long‐term mortality rates after lower extremity arterial bypass grafting.J Vasc Surg.1999;29:807–812; discussion12–13.
- ,,,,,.Association of perioperative myocardial ischemia with cardiac morbidity and mortality in men undergoing noncardiac surgery.The Study of Perioperative Ischemia Research Group.N Engl J Med.1990;323:1781–1788.
- ,,,,.Perioperative myocardial ischemia in patients undergoing noncardiac surgery—II: Incidence and severity during the 1st week after surgery.The Study of Perioperative Ischemia (SPI) Research Group.J Am Coll Cardiol.1991;17:851–857.
- ,,, et al.Perioperative myocardial ischemia in patients undergoing noncardiac surgery—I: Incidence and severity during the 4 day perioperative period.The Study of Perioperative Ischemia (SPI) Research Group.J Am Coll Cardiol.1991;17:843–850.
- ,,,.Effect of atenolol on mortality and cardiovascular morbidity after noncardiac surgery.Multicenter Study of Perioperative Ischemia Research Group.N Engl J Med.1996;335:1713–1720.
- ,,, et al.The effect of bisoprolol on perioperative mortality and myocardial infarction in high‐risk patients undergoing vascular surgery.Dutch Echocardiographic Cardiac Risk Evaluation Applying Stress Echocardiography Study Group.N Engl J Med.1999;341:1789–1794.
- ,,,,.Perioperative beta‐blockade (POBBLE) for patients undergoing infrarenal vascular surgery: results of a randomized double‐blind controlled trial.J Vasc Surg.2005;41:602–609.
- ,,, et al.Effect of perioperative beta blockade in patients with diabetes undergoing major non‐cardiac surgery: randomised placebo controlled, blinded multicentre trial.BMJ.2006;332:1482.
- ,,, et al.How strong is the evidence for the use of perioperative beta blockers in non‐cardiac surgery? Systematic review and meta‐analysis of randomised controlled trials.BMJ.2005;331:313–321.
- ,,, et al.Statins are associated with a reduced incidence of perioperative mortality in patients undergoing major noncardiac vascular surgery.Circulation.2003;107:1848–1851.
- ,,,,.Lipid‐lowering therapy and in‐hospital mortality following major noncardiac surgery.JAMA2004;291:2092–2099.
- ,,, et al.Reduction in cardiovascular events after vascular surgery with atorvastatin: a randomized trial.J Vasc Surg.2004;39:967–975; discussion75–6.
- ,,, et al.Statins decrease perioperative cardiac complications in patients undergoing noncardiac vascular surgery: the Statins for Risk Reduction in Surgery (StaRRS) study.J Am Coll Cardiol.2005;45:336–342.
- ,,,,,.The effect of preoperative statin therapy on cardiovascular outcomes in patients undergoing infrainguinal vascular surgery.Int J Cardiol.2005;104:264–268.
- ,,, et al.Coronary‐artery revascularization before elective major vascular surgery.N Engl J Med.2004;351:2795–2804.
- ,,.Vital status ascertainment through the files of the Department of Veterans Affairs and the Social Security Administration.Ann Epidemiol.1996;6(2):102–109.
- ,,, et al.Derivation and prospective validation of a simple index for prediction of cardiac risk of major noncardiac surgery.Circulation.1999;100:1043–1049.
- .Propensity score methods for bias reduction in the comparison of a treatment to a non‐randomized control group.Stat Med.1998;17:2265–2281.
- ,.A comparison of propensity score methods: a case‐study estimating the effectiveness of post‐AMI statin use.Stat Med.2006;25:2084–2106.
- ,,,,.Application of a propensity score approach for risk adjustment in profiling multiple physician groups on asthma care.Health Serv Res2005;40(1):253–78.
- ,,.Making Health Care Safer: A Critical Analysis of Patient Safety Practices: Evidence Report/Technology Assessment.Rockville, Md:AHRQ;2001. Report No. 43.
- ,,, et al.ACC/AHA 2006 guideline update on perioperative cardiovascular evaluation for noncardiac surgery: focused update on perioperative beta‐blocker therapy: a report of the American College of Cardiology/American Heart Association Task Force on Practice Guidelines (Writing Committee to Update the 2002 Guidelines on Perioperative Cardiovascular Evaluation for Noncardiac Surgery): developed in collaboration with the American Society of Echocardiography, American Society of Nuclear Cardiology, Heart Rhythm Society, Society of Cardiovascular Anesthesiologists, Society for Cardiovascular Angiography and Interventions, and Society for Vascular Medicine and Biology.Circulation.2006;113:2662–2674.
- ,,,,,.Perioperative beta‐blocker therapy and mortality after major noncardiac surgery.N Engl J Med.2005;353:349–361.
- ,,, et al.Association between long‐term statin use and mortality after successful abdominal aortic aneurysm surgery.Am J Med.2004;116(2):96–103.
- ,,, et al.A combination of statins and beta‐blockers is independently associated with a reduction in the incidence of perioperative mortality and nonfatal myocardial infarction in patients undergoing abdominal aortic aneurysm surgery.Eur J Vasc Endovasc Surg.2004;28:343–352.
- ,,.Alpha‐2 adrenergic agonists to prevent perioperative cardiovascular complications: a meta‐analysis.Am J Med.2003;114:742–752.
- ,,,,,.Preoperative serum albumin level as a predictor of operative mortality and morbidity: results from the National VA Surgical Risk Study.Arch Surg.1999;134(1):36–42.
- ,,, et al.Fluvastatin and bisoprolol for the reduction of perioperative cardiac mortality and morbidity in high‐risk patients undergoing non‐cardiac surgery: rationale and design of the DECREASE‐IV study.Am Heart J.2004;148:1047–1052.
- ,,, et al.ACC/AHA 2005 Practice Guidelines for the management of patients with peripheral arterial disease (lower extremity, renal, mesenteric, and abdominal aortic): a collaborative report from the American Association for Vascular Surgery/Society for Vascular Surgery, Society for Cardiovascular Angiography and Interventions, Society for Vascular Medicine and Biology, Society of Interventional Radiology, and the ACC/AHA Task Force on Practice Guidelines (Writing Committee to Develop Guidelines for the Management of Patients With Peripheral Arterial Disease): endorsed by the American Association of Cardiovascular and Pulmonary Rehabilitation; National Heart, Lung, and Blood Institute; Society for Vascular Nursing; TransAtlantic Inter‐Society Consensus; and Vascular Disease Foundation.Circulation.2006;113:e463–e654.
- ,,,,,.The influence of perioperative myocardial infarction on long‐term prognosis following elective vascular surgery.Chest.1998;113:681–686.
- ,,, et al.Postoperative and amputation‐free survival outcomes after femorodistal bypass grafting surgery: findings from the Department of Veterans Affairs National Surgical Quality Improvement Program.J Vasc Surg.2001;34:283–290.
- ,,,.Perioperative‐ and long‐term mortality rates after major vascular surgery: the relationship to preoperative testing in the medicare population.Anesth Analg1999;89:849–855.
- ,.Very late survival after vascular surgery.J Surg Res.2002;105(2):109–114.
- ,,, et al.Women have increased risk of perioperative myocardial infarction and higher long‐term mortality rates after lower extremity arterial bypass grafting.J Vasc Surg.1999;29:807–812; discussion12–13.
- ,,,,,.Association of perioperative myocardial ischemia with cardiac morbidity and mortality in men undergoing noncardiac surgery.The Study of Perioperative Ischemia Research Group.N Engl J Med.1990;323:1781–1788.
- ,,,,.Perioperative myocardial ischemia in patients undergoing noncardiac surgery—II: Incidence and severity during the 1st week after surgery.The Study of Perioperative Ischemia (SPI) Research Group.J Am Coll Cardiol.1991;17:851–857.
- ,,, et al.Perioperative myocardial ischemia in patients undergoing noncardiac surgery—I: Incidence and severity during the 4 day perioperative period.The Study of Perioperative Ischemia (SPI) Research Group.J Am Coll Cardiol.1991;17:843–850.
- ,,,.Effect of atenolol on mortality and cardiovascular morbidity after noncardiac surgery.Multicenter Study of Perioperative Ischemia Research Group.N Engl J Med.1996;335:1713–1720.
- ,,, et al.The effect of bisoprolol on perioperative mortality and myocardial infarction in high‐risk patients undergoing vascular surgery.Dutch Echocardiographic Cardiac Risk Evaluation Applying Stress Echocardiography Study Group.N Engl J Med.1999;341:1789–1794.
- ,,,,.Perioperative beta‐blockade (POBBLE) for patients undergoing infrarenal vascular surgery: results of a randomized double‐blind controlled trial.J Vasc Surg.2005;41:602–609.
- ,,, et al.Effect of perioperative beta blockade in patients with diabetes undergoing major non‐cardiac surgery: randomised placebo controlled, blinded multicentre trial.BMJ.2006;332:1482.
- ,,, et al.How strong is the evidence for the use of perioperative beta blockers in non‐cardiac surgery? Systematic review and meta‐analysis of randomised controlled trials.BMJ.2005;331:313–321.
- ,,, et al.Statins are associated with a reduced incidence of perioperative mortality in patients undergoing major noncardiac vascular surgery.Circulation.2003;107:1848–1851.
- ,,,,.Lipid‐lowering therapy and in‐hospital mortality following major noncardiac surgery.JAMA2004;291:2092–2099.
- ,,, et al.Reduction in cardiovascular events after vascular surgery with atorvastatin: a randomized trial.J Vasc Surg.2004;39:967–975; discussion75–6.
- ,,, et al.Statins decrease perioperative cardiac complications in patients undergoing noncardiac vascular surgery: the Statins for Risk Reduction in Surgery (StaRRS) study.J Am Coll Cardiol.2005;45:336–342.
- ,,,,,.The effect of preoperative statin therapy on cardiovascular outcomes in patients undergoing infrainguinal vascular surgery.Int J Cardiol.2005;104:264–268.
- ,,, et al.Coronary‐artery revascularization before elective major vascular surgery.N Engl J Med.2004;351:2795–2804.
- ,,.Vital status ascertainment through the files of the Department of Veterans Affairs and the Social Security Administration.Ann Epidemiol.1996;6(2):102–109.
- ,,, et al.Derivation and prospective validation of a simple index for prediction of cardiac risk of major noncardiac surgery.Circulation.1999;100:1043–1049.
- .Propensity score methods for bias reduction in the comparison of a treatment to a non‐randomized control group.Stat Med.1998;17:2265–2281.
- ,.A comparison of propensity score methods: a case‐study estimating the effectiveness of post‐AMI statin use.Stat Med.2006;25:2084–2106.
- ,,,,.Application of a propensity score approach for risk adjustment in profiling multiple physician groups on asthma care.Health Serv Res2005;40(1):253–78.
- ,,.Making Health Care Safer: A Critical Analysis of Patient Safety Practices: Evidence Report/Technology Assessment.Rockville, Md:AHRQ;2001. Report No. 43.
- ,,, et al.ACC/AHA 2006 guideline update on perioperative cardiovascular evaluation for noncardiac surgery: focused update on perioperative beta‐blocker therapy: a report of the American College of Cardiology/American Heart Association Task Force on Practice Guidelines (Writing Committee to Update the 2002 Guidelines on Perioperative Cardiovascular Evaluation for Noncardiac Surgery): developed in collaboration with the American Society of Echocardiography, American Society of Nuclear Cardiology, Heart Rhythm Society, Society of Cardiovascular Anesthesiologists, Society for Cardiovascular Angiography and Interventions, and Society for Vascular Medicine and Biology.Circulation.2006;113:2662–2674.
- ,,,,,.Perioperative beta‐blocker therapy and mortality after major noncardiac surgery.N Engl J Med.2005;353:349–361.
- ,,, et al.Association between long‐term statin use and mortality after successful abdominal aortic aneurysm surgery.Am J Med.2004;116(2):96–103.
- ,,, et al.A combination of statins and beta‐blockers is independently associated with a reduction in the incidence of perioperative mortality and nonfatal myocardial infarction in patients undergoing abdominal aortic aneurysm surgery.Eur J Vasc Endovasc Surg.2004;28:343–352.
- ,,.Alpha‐2 adrenergic agonists to prevent perioperative cardiovascular complications: a meta‐analysis.Am J Med.2003;114:742–752.
- ,,,,,.Preoperative serum albumin level as a predictor of operative mortality and morbidity: results from the National VA Surgical Risk Study.Arch Surg.1999;134(1):36–42.
- ,,, et al.Fluvastatin and bisoprolol for the reduction of perioperative cardiac mortality and morbidity in high‐risk patients undergoing non‐cardiac surgery: rationale and design of the DECREASE‐IV study.Am Heart J.2004;148:1047–1052.
- ,,, et al.ACC/AHA 2005 Practice Guidelines for the management of patients with peripheral arterial disease (lower extremity, renal, mesenteric, and abdominal aortic): a collaborative report from the American Association for Vascular Surgery/Society for Vascular Surgery, Society for Cardiovascular Angiography and Interventions, Society for Vascular Medicine and Biology, Society of Interventional Radiology, and the ACC/AHA Task Force on Practice Guidelines (Writing Committee to Develop Guidelines for the Management of Patients With Peripheral Arterial Disease): endorsed by the American Association of Cardiovascular and Pulmonary Rehabilitation; National Heart, Lung, and Blood Institute; Society for Vascular Nursing; TransAtlantic Inter‐Society Consensus; and Vascular Disease Foundation.Circulation.2006;113:e463–e654.
Copyright © 2007 Society of Hospital Medicine
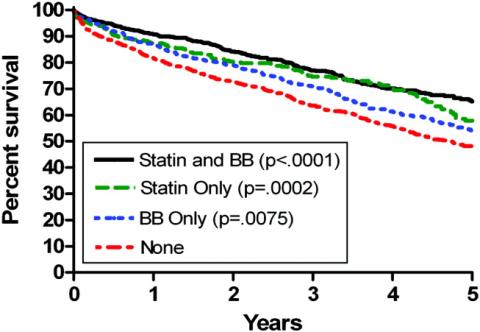
Hypoglycemia in Hospitalized Patients / Varghese et al.
Glycemic control in the inpatient setting has received increasing attention in recent years, with the demonstration that appropriate blood glucose (BG) control prevents adverse events in both intensive care unit (ICU) and non‐ICU settings.1 Recent recommendations set target blood glucose levels near euglycemia for most hospitalized patients.1 Unfortunately, the risk of hypoglycemia increases with tighter glycemic control,2 and hypoglycemia may result in catastrophic events.35 Although hyperglycemia is associated with postoperative infection,6 and effective management decreases wound infections,7 few reports have detailed the hypoglycemia rates among surgical patients.8 Hypoglycemia rates on medical services are as high as 28%,9, 10 and efforts to achieve more normal BG levels in hospitalized patients have been associated with more hypoglycemia.11
We undertook a study of hypoglycemia in all adult hospitalized patients receiving hypoglycemic therapy at our institution. The purpose of this study was to determine the incidence, natural history, associations, and consequences of hypoglycemia in this broad inpatient population in order to have a baseline prior to introducing any formal hospital strategies to achieve the newer targets for glycemic control.
Research Design and Methods
Thomas Jefferson University Hospital (TJUH) is a 675‐bed acute care teaching institution in center‐city Philadelphia with more than 30,000 patient admissions each year. We undertook a prospective, consecutive medical record review from August 16, 2004, to November 15, 2004, of hospitalized patients who had experienced at least 1 hypoglycemic episode, defined as at least one blood glucose (BG) 60 mg/dL within 48 hours of administration of an antihyperglycemic agent in the hospital. The definition of hypoglycemia was consistent with our hospital policies and a compromise between the BG 70 mg/dL proposed by the American Diabetes Association (ADA) hypoglycemia workgroup12 and the BG 40 mg/dL used by authors studying glycemic control in the ICU.13, 14
Hypoglycemic episodes were identified by a daily electronic search of the online medication administration record (MAR) where nurses document all point‐of‐care (POC) BG values. Two of the authors (P.V. and V.G.) reviewed the medical record for each episode and excluded pediatric (<18 years), emergency department, and maternity patients. Intensive care, step‐down, and medical/surgical unit patients were all included if the hypoglycemia had occurred within 48 hours of hospital administration of an antihyperglycemic agent. All medication orders at TJUH are placed through the computerized prescriber order entry (CPOE) system (Centricity Enterprise), which links all antihyperglycemic agents to a standardized hypoglycemia treatment protocol. The protocol includes instructions to administer glucose and/or glucagon and check the BG 15 minutes after a hypoglycemic episode. We established operational definitions prior to chart review (Appendix). A symptomatic hypoglycemia‐related adverse event was defined as any documented event occurring at the time of the hypoglycemic episode involving symptoms, change in care, temporary or permanent injury, or increased length of hospitalization. We did not include following our hypoglycemic protocol with the administration of 50% dextrose or glucagon as a change of care, as we considered this usual care, unless symptoms or signs also accompanied the hypoglycemic event.
We searched the University Health System Consortium Clinical Database (CDB) to quantify the number of patients at TJUH receiving any antihyperglycemic agent during the study period and to identify the specific agents received. The CDB receives all patient, physician, and pharmacy dose‐ specific information from the hospital clinical and billing information systems. We defined subgroups of patients taking insulin(s) only, taking oral agent(s) only, and taking a combination.
Differences between proportions were evaluated using the chi‐square statistic; differences between means were evaluated using the Student t test. Probabilities of the null hypothesis less than .05 were considered significant.
The project was approved by the Institutional Review Board for Human Subjects at Thomas Jefferson University.
RESULTS
Over the 2‐month study period 8140 patients were admitted, of whom 2174 (27%) received an antihyperglycemic agent. Five hundred and sixty‐eight hypoglycemic episodes (BG 60 mg/dL) occurred in 265 patients. We excluded 84 episodes among 59 patients who did not receive antihyperglycemic agents, resulting in 484 episodes of hypoglycemia occurring within 48 hours of hospital administration of an antihyperglycemic agent in 206 patients, an average of 5.26 episodes per day. Of the 2174 of patients receiving antihyperglycemic agents, 206 (9.5%) experienced 1 or more episodes of hypoglycemia.
Patient ages ranged from 20 to 93 years, with an average of 62 years. Fifty‐seven percent (118 of 206) of participants were female. About one‐fourth of all episodes (23.8%) occurred in the ICU setting. The distribution of patients by decade and their ICU status are presented in Figure 1. Of the 206 patients, 29% (59) had type 1 diabetes mellitus (DM), 49% (102) had type 2 DM, 1% (2) had new‐onset diabetes, and 21% (43) had no diagnosis of DM. Of the 484 hypoglycemic episodes, 37.8% occurred in patients with type 1 DM, 46.9% in patients with type 2 DM, and 0.6% in patients with new‐onset DM. The remaining 14.5% occurred in patients with no documented history of DM, although they were receiving antihyperglycemic agents. More than 1 episode was experienced by 44% of patients, and 12% experienced 5 or more episodes.

The BG was between 51 and 60 mg/dL in 282 of the episodes (58.2%), between 41 and 50 mg/dL in 149 episodes (30.8%) and 40 mg/dL or less in 53 episodes (11%). In 20 episodes (4.1% of episodes, representing fewer than 1% of all patients receiving an antihyperglycemic agent), a symptomatic hypoglycemia‐related adverse event was documented. All but 1 adverse event occurred outside the ICU. Ten of these events (2.1% of all hypoglycemic episodes) in 10 patients involved symptoms including headache, agitation, disorientation, and tremors. Of these patients 9 had type 1 DM, and 1 had type 2 DM. Six events (1.2% of hypoglycemic episodes) in 4 patients involved seizures. Two of these patients had type 1 DM, and 2 had type 2 DM. Four events (0.8% of hypoglycemic episodes) in 4 patients involved an unresponsive or unarousable state, including the sole ICU episode of symptomatic hypoglycemia. Three of these patients had type 1 DM, and 1 had type 2 DM. Patients with hypoglycemia‐related adverse events had a mean BG of 43.0 mg/dL, significantly lower (P = .01) than the mean BG of 50.9 mg/dL for hypoglycemic episodes without such events. However, 35% of these events occurred with a measured BG between 50 and 60 mg/dL. The distributions of BG values associated with symptomatic and asymptomatic events are shown in Figure 2. There is no useful threshold that separates symptomatic from asymptomatic hypoglycemia. No deaths or irreversible consequences were associated with hypoglycemia.
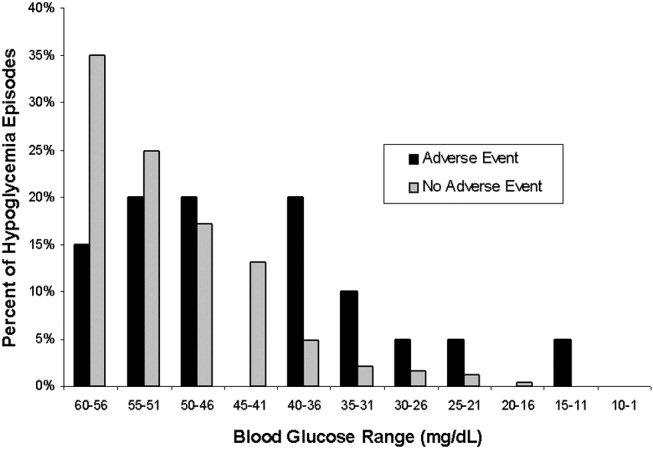
Approximately 40% (195 of 484) of the hypoglycemic episodes were related to decreased enteral intake (Table 1). In addition, 6.1% (30 of 484) of hypoglycemic episodes were related to insulin adjustment and 0.4% (2 of 484) to steroid withdrawal. In 43% (209 of 484) of the episodes the cause of the hypoglycemia was unclear. The remaining 10.4% of episodes were attributed to diverse causes.
| N (%) | |
|---|---|
| |
| NPO for unknown reason | 30 (6.2) |
| NPO for procedure/emntubated | 29 (6) |
| NPO for other documented reason (ie, fever/sepsis) | 10 (2.1) |
| Decreased PO intake (includes missed meal) | 126 (26) |
| No change in PO intake | 289 (59.7) |
One third of patients had a documented BG rechecked within 60 minutes, and fewer than half of the hypoglycemic patients had documented euglycemia within 2 hours of their low blood glucose measurement. The average time to documented resolution of a hypoglycemic episode was 4 hours, 3 minutes, with a median of 2 hours, 25 minutes.
Table 2 delineates the various combinations of antihyperglycemic agents that the 206 patients received in the 48 hours prior to a hypoglycemic episode. Of the 484 hypoglycemic episodes, 362 involved insulin. Of patients receiving insulin, 38 of 362 of episodes of hypoglycemia occurred in patients receiving sliding‐scale insulin (SSI) dosing as the only insulin order. In 163 hypoglycemic episodes, insulin was dosed with a combination of SSI and infusion or SSI with daily long‐acting insulin. The remaining 161 episodes involved administration of insulin to patients without an accompanying sliding‐scale order.
| |||||||
| Insulin Alone | 149 | ||||||
| Without insulin | With insulin | ||||||
| Single | Glimepiride | 1 | 4 | ||||
| Oral | Glipizide | 2 | 11 | ||||
| Agent | Glyburide | 2 | 7 | ||||
| Metformin | 5 | ||||||
| Repaglinide | 2 | ||||||
| Two | Glimepiride | AND | Metformin | 1 | |||
| Oral | Glimepiride | AND | Rosiglitazone | 1 | |||
| Agents | Glimepiride | AND | Pioglitazone | 1 | |||
| Glipizide | AND | Pioglitazone | 1 | ||||
| Glipizide | AND | Metformin | 4 | ||||
| Glyburide | AND | Metformin | 5 | ||||
| Metformin | AND | Rosiglitazone | 3 | 1 | |||
| Rosiglitazone | AND | Repaglinide | 1 | 1 | |||
| Three | Glipizide | AND | Metformin | AND | Rosiglitazone | 1 | |
| Oral | Glyburide | AND | Metformin | AND | Pioglitazone | 1 | |
| Agents | Pioglitazone | AND | Nateglinide | AND | Repaglinide | 1 | |
| TOTAL | 206 | ||||||
The prevalence of hypoglycemia did not significantly differ among patients treated with oral agents alone (9 of 85, 10.6%), patients treated with insulin alone (149 of 1497, 10%), and patients treated with both (47 of 592, 7.9%). However, there was a significant relationship between specific oral agent and probability of hypoglycemia. Glyburide was associated with a higher risk of hypoglycemia (19.1%, P < .01) than were other oral agents (Table 3).
| Oral agent | Patients with hypoglycemia | P value |
|---|---|---|
| ||
| Sulfonylureas | ||
| Glimepiride | 13.6% (8/59) | |
| Glipizide | 10.0% (19/190) | |
| Glyburide | 19.1% (18/94) | < .01 |
| Biguanide | 6.4% (22/344) | |
| Metformin | < .05 | |
| Thiazolidinediones | ||
| Pioglitazone | 5.1% (4/78) | |
| Rosiglitazone | 6.4% (6/94) | |
| Meglitinides | ||
| Nateglinide | 7.1% (1/14) | |
| Repaglinide | 7.0% (4/57) | |
DISCUSSION
Recently, many have called for substantive changes in the management of the hospitalized diabetic.15, 16 Most have recommended replacing sliding‐scale insulin with basal bolus insulin dosing and have challenged the historic tolerance of hyperglycemia during an acute hospital stay.17 However, as hospitals and physicians transform the management of inpatient hyperglycemia, they must assess the frequency of hypoglycemia and evaluate the risk/benefit ratio of strict glycemic control.18 Thus, one study found that eliminating sliding‐scale insulin markedly improved diabetes control but hypoglycemia (BG 60 mg/dL) was more frequent.10 The cost of euglycemia is hypoglycemia.2
We report a 9.5% rate of hypoglycemia among adult hospitalized patients being treated for hyperglycemia, including those in the ICU and those in non‐ICU settings. In widely publicized landmark trials, 5.2% of intensively treated surgical ICU patients14 and 18.7% of intensively treated medical ICU patients13 experienced hypoglycemia with no adverse events. Using those studies' definition of hypoglycemia (BG 40 mg/dL), only 2.4% (53 of 2174) of our patients experienced hypoglycemia. However, our survey included general medical and surgical patients as well as ICU patients treated at their physicians' discretion, reflecting the greater variability in care that exists outside a randomized, ICU trial.
We did not anticipate the duration to documented resolution of hypoglycemic episodes, nor did we anticipate the number of hypoglycemia‐related adverse events. We believe that hospitals will need to develop formal strategies to minimize the hypoglycemic risk from tight glycemic control. The frequency and duration of the time it took to recheck the glucose, coupled with the 4.1% symptomatic event rate, suggests that inpatient hypoglycemia deserves more attention. One potential focus is the interruption of nutrition, as medications may not be readjusted when patients' oral intake declines or when they travel for tests.19
More than 40% of our hypoglycemic patients experienced recurrent episodes. This may reflect a lack of adjustment of medications following hypoglycemia. However, recurrent hypoglycemia may also be explained by hypoglycemia‐associated autonomic failure and the desensitization to hypoglycemia that occurs once a patient has lower blood glucose.2 Thus, hypoglycemic patients are at high risk of repeat episodes and often require more frequent BG monitoring. Of note, patients with hypoglycemia unawareness may not have symptoms despite low BG, and thus unless they develop signs of hypoglycemia, they would not meet criteria for an adverse event in our study, despite a very low BG.
Medical error can precipitate hypoglycemia,4, 20 and the Institute for Safe Medication Practices21 and the Joint Commission on Accreditation of Healthcare Organizations22 consider insulin a high‐risk medication. We found no hypoglycemic episodes associated with a medication error. Our CPOE system eliminates ambiguity from poor penmanship, and hospital policy requires 2 nurses to check all administered insulin. However, despite the apparent lack of dispensing/administration medication errors, nearly 10% of patients receiving hypoglycemic therapy experienced iatrogenic hypoglycemia. Thus, strategies to reduce hypoglycemia must expand beyond the prevention of medication errors.
Contrary to our expectation, we found the prevalence of hypoglycemia was at least as high, if not higher, for patients taking only oral hypoglycemics than for patients taking either insulin alone or insulin in combination with oral antihyperglycemic agents. Glyburide appeared to carry the most risk both in our population and in previous studies,2325 perhaps because of a moderately active hepatic metabolite.26 The risk of hypoglycemia with different oral agents warrants further study.
The study stimulated several actions. First, we augmented the online nursing flow sheet to permit documentation of hypoglycemic episodes, including the administration of orange juice or food. Second, our CPOE system now prevents a physician from inadvertently deselecting the hypoglycemia protocol. Third, the CPOE system prompts the nurse to recheck the BG as specified in the hypoglycemia protocol. Finally, the CPOE system warns physicians to adjust antihyperglycemic agents when they institute nutritional changes. We propose that monitoring hypoglycemia rates must become a necessary component of inpatient diabetes care that is both effective and safe and plan to monitor these rates to determine the impact of interventions designed to reduce the frequency of hypoglycemia‐related adverse events.
Our study had several limitations. We only included episodes of hypoglycemia that were identified with a POC BG. This excluded patients treated for symptomatic hypoglycemia without a measured POC BG, potentially underestimating the event rate. Moreover, defining time to resolution of a hypoglycemic episode as that documented with a serum BG but not a POC BG may have resulted in overestimating the duration, and nurses may have documented POC BGs in the MAR after a substantial delay, also artificially lengthening the time to resolution. Capillary BG may underestimate the true degree of hypoglycemia,27 thus confounding the relationship between BG and adverse events. Our study was not designed to evaluate subtle suboptimal management of hyperglycemia as a cause of hypoglycemia, although expansion of the types and combinations of insulin has increased the possibility of prescribing errors. Nor were we able to assess the preventability of hypoglycemic episodes or the independent risk factors for hypoglycemia. Finally, this study originated from a single academic hospital and thus may reflect its unique idiosyncrasies.
We have reported a comprehensive survey of hypoglycemia in patients treated with antihyperglycemic agents at a single hospital. At the time the study took place, we had not instituted hospitalwide strategies to maintain BG near euglycemic targets, although such strategies have since begun. To detect untoward events that may follow from our efforts to better control hyperglycemia, we believe it is important to establish baseline measurements. Even without aiming for tighter glucose control, we identified the need to aim for and possible strategies to achieve, better prevention of hypoglycemia.
APPENDIX
SUMMARY OF DEFINITIONS FOR CHART REVIEW
New onset diabetes was defined as diabetes diagnosed during the current hospital admission when there was no previous history of diabetes.
No diabetes was defined as no history of diabetes and no diagnosis of diabetes during the index hospital stay.
Documentation was defined as any notation in the record by the physician or nurse acknowledging the hypoglycemic episode, other than the BG value itself.
Time to recheck BG was defined as the time in the MAR between a recorded BG 60 mg/dL and the next recorded BG.
Resolution was defined as the time in the MAR between a recorded BG 60 mg/dL and the first recorded BG 80 mg/dL (if, following a BG > 80 mg/dL, the next BG was 60 mg/dL, the 2 BG 60 mg/dL were defined as belonging to the same episode and that no resolution had yet occurred).
Decline in enteral intake was defined as any new NPO order on the day of the episode or missed meal within 3 hours of the episode.
Hypoglycemia‐related symptomatic adverse event was defined as any documented event at the time of the hypoglycemic episode involving symptoms, change in care, temporary or permanent injury, or increased hospitalization. Change of care did not include following the hypoglycemic protocol and administering 50% dextrose or glucagon, as we considered this usual care, unless symptoms or signs also accompanied the hypoglycemic event.
- ,,, et al.Management of diabetes and hyperglycemia in hospitals.Diabetes Care.2004;27:553–591.
- ,,.Hypoglycemia in diabetes.Diabetes Care.2003;26:1902–1912.
- ,,,.Drug‐induced hypoglycemic coma in 102 diabetic patients.Arch Intern Med.1999;159:281–284.
- .Unexpected hypoglycemia in a critically ill patient.Ann Intern Med.2002;137:110–116.
- ,.Hypoglycemia: causes, neurological manifestations and outcome.Ann Neurol.1985;17:421–430.
- ,,, et al.Early postoperative glucose control predicts nosocomial infection rate in diabetic patients.J Parenter Enteral Nutr.1998;22:77–81.
- ,,,.Continuous intravenous insulin infusion reduces the incidence of deep sternal wound infection in diabetic patients after cardiac surgical procedures.Ann Thor Surg.1999;67:352–362.
- ,,, et al.Inpatient management of diabetes: survey in a tertiary care center.Postgrad Med J.2003;79:585–587.
- ,.Incidence of hypoglycemia and nutritional intake in patients on a general medical unit.Nursingconnections.1989;2:33–40.
- .Seidler AJ, Brancati FL. Glycemic control and sliding scale insulin use in medical inpatients with diabetes mellitus.Arch Intern Med.1997;157:545–552.
- ,,,.Eliminating sliding‐scale insulin.Diabetes Care.2005;28:1008–1011.
- American Diabetes Association Workgroup on Hypoglycemia.Defining and reporting hypoglycemia in diabetes. A report from the American Diabetes Association workgroup on hypoglycemia.Diabetes Care.2005;28:245–1249.
- ,,, et al.Intensive insulin therapy in the medical ICU.N Engl J Med.2006;354:449–461
- ;,, et al.Intensive insulin therapy in critically ill patients.N Engl J Med.2001;345:1359–1367.
- ,,.Inpatient management of diabetes mellitus.Am J Med.2002;113:317–323.
- ,,, et al.American College of Endocrinology Position Statement on inpatient diabetes and metabolicControl Endo Pract.2004;10:77–82.
- ,,.Inpatient diabetology, the new frontier.J Gen Intern Med.2004;19:466–471.
- ,.Counterpoint: inpatient glucose management, a premature call to arms?Diabetes Care.2005;28:976–979.
- ,,,.Causes of hyperglycemia and hypoglycemia in adult inpatients.Am J Health Syst Pharm.2005;62:714–719.
- ,,.Hypoglycemia in hospitalized patients: causes and outcomes.N Engl J Med.1986;315:245–1250.
- Available at: http://www.ismp.org/Tools/highalertmedications.pdf. Accessed July 27,2006.
- Joint Commission on Accreditation of Healthcare Organizations. High alert medications and patient safety. Sentinel Event Alert Issue 11, November 19, 1999 Available at: http://www.jointcommission.org/SentinelEvents/SentinelEventAlert/sea_11.htm. Accessed July 27,2006.
- .Comparative tolerability of sulfonylureas in diabetes mellitus.Drug Saf.2000;22:313–320.
- ,,,.Individual sulfonylureas and serious hypoglycemia in older people.J Am Geriatr Soc.1996;44:751–755
- ,.Sulfonylureas. In:DeFronzo RA, ed.Current Management of Diabetes Mellitus.St. Louis, MO:Mosby;1998:96–101.
- ,,.Diabetes Mellitus in Pharmacotherapy: A Pathophysiologic Approach.6th ed.Dipiro JT, ed.New York:McGraw Hill;2005.
- ,,, et al.Reliability of point‐of‐care testing for glucose measurement in critically ill adults.Crit Care Med.2005;33:2778–2785.
Glycemic control in the inpatient setting has received increasing attention in recent years, with the demonstration that appropriate blood glucose (BG) control prevents adverse events in both intensive care unit (ICU) and non‐ICU settings.1 Recent recommendations set target blood glucose levels near euglycemia for most hospitalized patients.1 Unfortunately, the risk of hypoglycemia increases with tighter glycemic control,2 and hypoglycemia may result in catastrophic events.35 Although hyperglycemia is associated with postoperative infection,6 and effective management decreases wound infections,7 few reports have detailed the hypoglycemia rates among surgical patients.8 Hypoglycemia rates on medical services are as high as 28%,9, 10 and efforts to achieve more normal BG levels in hospitalized patients have been associated with more hypoglycemia.11
We undertook a study of hypoglycemia in all adult hospitalized patients receiving hypoglycemic therapy at our institution. The purpose of this study was to determine the incidence, natural history, associations, and consequences of hypoglycemia in this broad inpatient population in order to have a baseline prior to introducing any formal hospital strategies to achieve the newer targets for glycemic control.
Research Design and Methods
Thomas Jefferson University Hospital (TJUH) is a 675‐bed acute care teaching institution in center‐city Philadelphia with more than 30,000 patient admissions each year. We undertook a prospective, consecutive medical record review from August 16, 2004, to November 15, 2004, of hospitalized patients who had experienced at least 1 hypoglycemic episode, defined as at least one blood glucose (BG) 60 mg/dL within 48 hours of administration of an antihyperglycemic agent in the hospital. The definition of hypoglycemia was consistent with our hospital policies and a compromise between the BG 70 mg/dL proposed by the American Diabetes Association (ADA) hypoglycemia workgroup12 and the BG 40 mg/dL used by authors studying glycemic control in the ICU.13, 14
Hypoglycemic episodes were identified by a daily electronic search of the online medication administration record (MAR) where nurses document all point‐of‐care (POC) BG values. Two of the authors (P.V. and V.G.) reviewed the medical record for each episode and excluded pediatric (<18 years), emergency department, and maternity patients. Intensive care, step‐down, and medical/surgical unit patients were all included if the hypoglycemia had occurred within 48 hours of hospital administration of an antihyperglycemic agent. All medication orders at TJUH are placed through the computerized prescriber order entry (CPOE) system (Centricity Enterprise), which links all antihyperglycemic agents to a standardized hypoglycemia treatment protocol. The protocol includes instructions to administer glucose and/or glucagon and check the BG 15 minutes after a hypoglycemic episode. We established operational definitions prior to chart review (Appendix). A symptomatic hypoglycemia‐related adverse event was defined as any documented event occurring at the time of the hypoglycemic episode involving symptoms, change in care, temporary or permanent injury, or increased length of hospitalization. We did not include following our hypoglycemic protocol with the administration of 50% dextrose or glucagon as a change of care, as we considered this usual care, unless symptoms or signs also accompanied the hypoglycemic event.
We searched the University Health System Consortium Clinical Database (CDB) to quantify the number of patients at TJUH receiving any antihyperglycemic agent during the study period and to identify the specific agents received. The CDB receives all patient, physician, and pharmacy dose‐ specific information from the hospital clinical and billing information systems. We defined subgroups of patients taking insulin(s) only, taking oral agent(s) only, and taking a combination.
Differences between proportions were evaluated using the chi‐square statistic; differences between means were evaluated using the Student t test. Probabilities of the null hypothesis less than .05 were considered significant.
The project was approved by the Institutional Review Board for Human Subjects at Thomas Jefferson University.
RESULTS
Over the 2‐month study period 8140 patients were admitted, of whom 2174 (27%) received an antihyperglycemic agent. Five hundred and sixty‐eight hypoglycemic episodes (BG 60 mg/dL) occurred in 265 patients. We excluded 84 episodes among 59 patients who did not receive antihyperglycemic agents, resulting in 484 episodes of hypoglycemia occurring within 48 hours of hospital administration of an antihyperglycemic agent in 206 patients, an average of 5.26 episodes per day. Of the 2174 of patients receiving antihyperglycemic agents, 206 (9.5%) experienced 1 or more episodes of hypoglycemia.
Patient ages ranged from 20 to 93 years, with an average of 62 years. Fifty‐seven percent (118 of 206) of participants were female. About one‐fourth of all episodes (23.8%) occurred in the ICU setting. The distribution of patients by decade and their ICU status are presented in Figure 1. Of the 206 patients, 29% (59) had type 1 diabetes mellitus (DM), 49% (102) had type 2 DM, 1% (2) had new‐onset diabetes, and 21% (43) had no diagnosis of DM. Of the 484 hypoglycemic episodes, 37.8% occurred in patients with type 1 DM, 46.9% in patients with type 2 DM, and 0.6% in patients with new‐onset DM. The remaining 14.5% occurred in patients with no documented history of DM, although they were receiving antihyperglycemic agents. More than 1 episode was experienced by 44% of patients, and 12% experienced 5 or more episodes.
The BG was between 51 and 60 mg/dL in 282 of the episodes (58.2%), between 41 and 50 mg/dL in 149 episodes (30.8%) and 40 mg/dL or less in 53 episodes (11%). In 20 episodes (4.1% of episodes, representing fewer than 1% of all patients receiving an antihyperglycemic agent), a symptomatic hypoglycemia‐related adverse event was documented. All but 1 adverse event occurred outside the ICU. Ten of these events (2.1% of all hypoglycemic episodes) in 10 patients involved symptoms including headache, agitation, disorientation, and tremors. Of these patients 9 had type 1 DM, and 1 had type 2 DM. Six events (1.2% of hypoglycemic episodes) in 4 patients involved seizures. Two of these patients had type 1 DM, and 2 had type 2 DM. Four events (0.8% of hypoglycemic episodes) in 4 patients involved an unresponsive or unarousable state, including the sole ICU episode of symptomatic hypoglycemia. Three of these patients had type 1 DM, and 1 had type 2 DM. Patients with hypoglycemia‐related adverse events had a mean BG of 43.0 mg/dL, significantly lower (P = .01) than the mean BG of 50.9 mg/dL for hypoglycemic episodes without such events. However, 35% of these events occurred with a measured BG between 50 and 60 mg/dL. The distributions of BG values associated with symptomatic and asymptomatic events are shown in Figure 2. There is no useful threshold that separates symptomatic from asymptomatic hypoglycemia. No deaths or irreversible consequences were associated with hypoglycemia.
Approximately 40% (195 of 484) of the hypoglycemic episodes were related to decreased enteral intake (Table 1). In addition, 6.1% (30 of 484) of hypoglycemic episodes were related to insulin adjustment and 0.4% (2 of 484) to steroid withdrawal. In 43% (209 of 484) of the episodes the cause of the hypoglycemia was unclear. The remaining 10.4% of episodes were attributed to diverse causes.
| N (%) | |
|---|---|
| |
| NPO for unknown reason | 30 (6.2) |
| NPO for procedure/emntubated | 29 (6) |
| NPO for other documented reason (ie, fever/sepsis) | 10 (2.1) |
| Decreased PO intake (includes missed meal) | 126 (26) |
| No change in PO intake | 289 (59.7) |
One third of patients had a documented BG rechecked within 60 minutes, and fewer than half of the hypoglycemic patients had documented euglycemia within 2 hours of their low blood glucose measurement. The average time to documented resolution of a hypoglycemic episode was 4 hours, 3 minutes, with a median of 2 hours, 25 minutes.
Table 2 delineates the various combinations of antihyperglycemic agents that the 206 patients received in the 48 hours prior to a hypoglycemic episode. Of the 484 hypoglycemic episodes, 362 involved insulin. Of patients receiving insulin, 38 of 362 of episodes of hypoglycemia occurred in patients receiving sliding‐scale insulin (SSI) dosing as the only insulin order. In 163 hypoglycemic episodes, insulin was dosed with a combination of SSI and infusion or SSI with daily long‐acting insulin. The remaining 161 episodes involved administration of insulin to patients without an accompanying sliding‐scale order.
| |||||||
| Insulin Alone | 149 | ||||||
| Without insulin | With insulin | ||||||
| Single | Glimepiride | 1 | 4 | ||||
| Oral | Glipizide | 2 | 11 | ||||
| Agent | Glyburide | 2 | 7 | ||||
| Metformin | 5 | ||||||
| Repaglinide | 2 | ||||||
| Two | Glimepiride | AND | Metformin | 1 | |||
| Oral | Glimepiride | AND | Rosiglitazone | 1 | |||
| Agents | Glimepiride | AND | Pioglitazone | 1 | |||
| Glipizide | AND | Pioglitazone | 1 | ||||
| Glipizide | AND | Metformin | 4 | ||||
| Glyburide | AND | Metformin | 5 | ||||
| Metformin | AND | Rosiglitazone | 3 | 1 | |||
| Rosiglitazone | AND | Repaglinide | 1 | 1 | |||
| Three | Glipizide | AND | Metformin | AND | Rosiglitazone | 1 | |
| Oral | Glyburide | AND | Metformin | AND | Pioglitazone | 1 | |
| Agents | Pioglitazone | AND | Nateglinide | AND | Repaglinide | 1 | |
| TOTAL | 206 | ||||||
The prevalence of hypoglycemia did not significantly differ among patients treated with oral agents alone (9 of 85, 10.6%), patients treated with insulin alone (149 of 1497, 10%), and patients treated with both (47 of 592, 7.9%). However, there was a significant relationship between specific oral agent and probability of hypoglycemia. Glyburide was associated with a higher risk of hypoglycemia (19.1%, P < .01) than were other oral agents (Table 3).
| Oral agent | Patients with hypoglycemia | P value |
|---|---|---|
| ||
| Sulfonylureas | ||
| Glimepiride | 13.6% (8/59) | |
| Glipizide | 10.0% (19/190) | |
| Glyburide | 19.1% (18/94) | < .01 |
| Biguanide | 6.4% (22/344) | |
| Metformin | < .05 | |
| Thiazolidinediones | ||
| Pioglitazone | 5.1% (4/78) | |
| Rosiglitazone | 6.4% (6/94) | |
| Meglitinides | ||
| Nateglinide | 7.1% (1/14) | |
| Repaglinide | 7.0% (4/57) | |
DISCUSSION
Recently, many have called for substantive changes in the management of the hospitalized diabetic.15, 16 Most have recommended replacing sliding‐scale insulin with basal bolus insulin dosing and have challenged the historic tolerance of hyperglycemia during an acute hospital stay.17 However, as hospitals and physicians transform the management of inpatient hyperglycemia, they must assess the frequency of hypoglycemia and evaluate the risk/benefit ratio of strict glycemic control.18 Thus, one study found that eliminating sliding‐scale insulin markedly improved diabetes control but hypoglycemia (BG 60 mg/dL) was more frequent.10 The cost of euglycemia is hypoglycemia.2
We report a 9.5% rate of hypoglycemia among adult hospitalized patients being treated for hyperglycemia, including those in the ICU and those in non‐ICU settings. In widely publicized landmark trials, 5.2% of intensively treated surgical ICU patients14 and 18.7% of intensively treated medical ICU patients13 experienced hypoglycemia with no adverse events. Using those studies' definition of hypoglycemia (BG 40 mg/dL), only 2.4% (53 of 2174) of our patients experienced hypoglycemia. However, our survey included general medical and surgical patients as well as ICU patients treated at their physicians' discretion, reflecting the greater variability in care that exists outside a randomized, ICU trial.
We did not anticipate the duration to documented resolution of hypoglycemic episodes, nor did we anticipate the number of hypoglycemia‐related adverse events. We believe that hospitals will need to develop formal strategies to minimize the hypoglycemic risk from tight glycemic control. The frequency and duration of the time it took to recheck the glucose, coupled with the 4.1% symptomatic event rate, suggests that inpatient hypoglycemia deserves more attention. One potential focus is the interruption of nutrition, as medications may not be readjusted when patients' oral intake declines or when they travel for tests.19
More than 40% of our hypoglycemic patients experienced recurrent episodes. This may reflect a lack of adjustment of medications following hypoglycemia. However, recurrent hypoglycemia may also be explained by hypoglycemia‐associated autonomic failure and the desensitization to hypoglycemia that occurs once a patient has lower blood glucose.2 Thus, hypoglycemic patients are at high risk of repeat episodes and often require more frequent BG monitoring. Of note, patients with hypoglycemia unawareness may not have symptoms despite low BG, and thus unless they develop signs of hypoglycemia, they would not meet criteria for an adverse event in our study, despite a very low BG.
Medical error can precipitate hypoglycemia,4, 20 and the Institute for Safe Medication Practices21 and the Joint Commission on Accreditation of Healthcare Organizations22 consider insulin a high‐risk medication. We found no hypoglycemic episodes associated with a medication error. Our CPOE system eliminates ambiguity from poor penmanship, and hospital policy requires 2 nurses to check all administered insulin. However, despite the apparent lack of dispensing/administration medication errors, nearly 10% of patients receiving hypoglycemic therapy experienced iatrogenic hypoglycemia. Thus, strategies to reduce hypoglycemia must expand beyond the prevention of medication errors.
Contrary to our expectation, we found the prevalence of hypoglycemia was at least as high, if not higher, for patients taking only oral hypoglycemics than for patients taking either insulin alone or insulin in combination with oral antihyperglycemic agents. Glyburide appeared to carry the most risk both in our population and in previous studies,2325 perhaps because of a moderately active hepatic metabolite.26 The risk of hypoglycemia with different oral agents warrants further study.
The study stimulated several actions. First, we augmented the online nursing flow sheet to permit documentation of hypoglycemic episodes, including the administration of orange juice or food. Second, our CPOE system now prevents a physician from inadvertently deselecting the hypoglycemia protocol. Third, the CPOE system prompts the nurse to recheck the BG as specified in the hypoglycemia protocol. Finally, the CPOE system warns physicians to adjust antihyperglycemic agents when they institute nutritional changes. We propose that monitoring hypoglycemia rates must become a necessary component of inpatient diabetes care that is both effective and safe and plan to monitor these rates to determine the impact of interventions designed to reduce the frequency of hypoglycemia‐related adverse events.
Our study had several limitations. We only included episodes of hypoglycemia that were identified with a POC BG. This excluded patients treated for symptomatic hypoglycemia without a measured POC BG, potentially underestimating the event rate. Moreover, defining time to resolution of a hypoglycemic episode as that documented with a serum BG but not a POC BG may have resulted in overestimating the duration, and nurses may have documented POC BGs in the MAR after a substantial delay, also artificially lengthening the time to resolution. Capillary BG may underestimate the true degree of hypoglycemia,27 thus confounding the relationship between BG and adverse events. Our study was not designed to evaluate subtle suboptimal management of hyperglycemia as a cause of hypoglycemia, although expansion of the types and combinations of insulin has increased the possibility of prescribing errors. Nor were we able to assess the preventability of hypoglycemic episodes or the independent risk factors for hypoglycemia. Finally, this study originated from a single academic hospital and thus may reflect its unique idiosyncrasies.
We have reported a comprehensive survey of hypoglycemia in patients treated with antihyperglycemic agents at a single hospital. At the time the study took place, we had not instituted hospitalwide strategies to maintain BG near euglycemic targets, although such strategies have since begun. To detect untoward events that may follow from our efforts to better control hyperglycemia, we believe it is important to establish baseline measurements. Even without aiming for tighter glucose control, we identified the need to aim for and possible strategies to achieve, better prevention of hypoglycemia.
APPENDIX
SUMMARY OF DEFINITIONS FOR CHART REVIEW
New onset diabetes was defined as diabetes diagnosed during the current hospital admission when there was no previous history of diabetes.
No diabetes was defined as no history of diabetes and no diagnosis of diabetes during the index hospital stay.
Documentation was defined as any notation in the record by the physician or nurse acknowledging the hypoglycemic episode, other than the BG value itself.
Time to recheck BG was defined as the time in the MAR between a recorded BG 60 mg/dL and the next recorded BG.
Resolution was defined as the time in the MAR between a recorded BG 60 mg/dL and the first recorded BG 80 mg/dL (if, following a BG > 80 mg/dL, the next BG was 60 mg/dL, the 2 BG 60 mg/dL were defined as belonging to the same episode and that no resolution had yet occurred).
Decline in enteral intake was defined as any new NPO order on the day of the episode or missed meal within 3 hours of the episode.
Hypoglycemia‐related symptomatic adverse event was defined as any documented event at the time of the hypoglycemic episode involving symptoms, change in care, temporary or permanent injury, or increased hospitalization. Change of care did not include following the hypoglycemic protocol and administering 50% dextrose or glucagon, as we considered this usual care, unless symptoms or signs also accompanied the hypoglycemic event.
Glycemic control in the inpatient setting has received increasing attention in recent years, with the demonstration that appropriate blood glucose (BG) control prevents adverse events in both intensive care unit (ICU) and non‐ICU settings.1 Recent recommendations set target blood glucose levels near euglycemia for most hospitalized patients.1 Unfortunately, the risk of hypoglycemia increases with tighter glycemic control,2 and hypoglycemia may result in catastrophic events.35 Although hyperglycemia is associated with postoperative infection,6 and effective management decreases wound infections,7 few reports have detailed the hypoglycemia rates among surgical patients.8 Hypoglycemia rates on medical services are as high as 28%,9, 10 and efforts to achieve more normal BG levels in hospitalized patients have been associated with more hypoglycemia.11
We undertook a study of hypoglycemia in all adult hospitalized patients receiving hypoglycemic therapy at our institution. The purpose of this study was to determine the incidence, natural history, associations, and consequences of hypoglycemia in this broad inpatient population in order to have a baseline prior to introducing any formal hospital strategies to achieve the newer targets for glycemic control.
Research Design and Methods
Thomas Jefferson University Hospital (TJUH) is a 675‐bed acute care teaching institution in center‐city Philadelphia with more than 30,000 patient admissions each year. We undertook a prospective, consecutive medical record review from August 16, 2004, to November 15, 2004, of hospitalized patients who had experienced at least 1 hypoglycemic episode, defined as at least one blood glucose (BG) 60 mg/dL within 48 hours of administration of an antihyperglycemic agent in the hospital. The definition of hypoglycemia was consistent with our hospital policies and a compromise between the BG 70 mg/dL proposed by the American Diabetes Association (ADA) hypoglycemia workgroup12 and the BG 40 mg/dL used by authors studying glycemic control in the ICU.13, 14
Hypoglycemic episodes were identified by a daily electronic search of the online medication administration record (MAR) where nurses document all point‐of‐care (POC) BG values. Two of the authors (P.V. and V.G.) reviewed the medical record for each episode and excluded pediatric (<18 years), emergency department, and maternity patients. Intensive care, step‐down, and medical/surgical unit patients were all included if the hypoglycemia had occurred within 48 hours of hospital administration of an antihyperglycemic agent. All medication orders at TJUH are placed through the computerized prescriber order entry (CPOE) system (Centricity Enterprise), which links all antihyperglycemic agents to a standardized hypoglycemia treatment protocol. The protocol includes instructions to administer glucose and/or glucagon and check the BG 15 minutes after a hypoglycemic episode. We established operational definitions prior to chart review (Appendix). A symptomatic hypoglycemia‐related adverse event was defined as any documented event occurring at the time of the hypoglycemic episode involving symptoms, change in care, temporary or permanent injury, or increased length of hospitalization. We did not include following our hypoglycemic protocol with the administration of 50% dextrose or glucagon as a change of care, as we considered this usual care, unless symptoms or signs also accompanied the hypoglycemic event.
We searched the University Health System Consortium Clinical Database (CDB) to quantify the number of patients at TJUH receiving any antihyperglycemic agent during the study period and to identify the specific agents received. The CDB receives all patient, physician, and pharmacy dose‐ specific information from the hospital clinical and billing information systems. We defined subgroups of patients taking insulin(s) only, taking oral agent(s) only, and taking a combination.
Differences between proportions were evaluated using the chi‐square statistic; differences between means were evaluated using the Student t test. Probabilities of the null hypothesis less than .05 were considered significant.
The project was approved by the Institutional Review Board for Human Subjects at Thomas Jefferson University.
RESULTS
Over the 2‐month study period 8140 patients were admitted, of whom 2174 (27%) received an antihyperglycemic agent. Five hundred and sixty‐eight hypoglycemic episodes (BG 60 mg/dL) occurred in 265 patients. We excluded 84 episodes among 59 patients who did not receive antihyperglycemic agents, resulting in 484 episodes of hypoglycemia occurring within 48 hours of hospital administration of an antihyperglycemic agent in 206 patients, an average of 5.26 episodes per day. Of the 2174 of patients receiving antihyperglycemic agents, 206 (9.5%) experienced 1 or more episodes of hypoglycemia.
Patient ages ranged from 20 to 93 years, with an average of 62 years. Fifty‐seven percent (118 of 206) of participants were female. About one‐fourth of all episodes (23.8%) occurred in the ICU setting. The distribution of patients by decade and their ICU status are presented in Figure 1. Of the 206 patients, 29% (59) had type 1 diabetes mellitus (DM), 49% (102) had type 2 DM, 1% (2) had new‐onset diabetes, and 21% (43) had no diagnosis of DM. Of the 484 hypoglycemic episodes, 37.8% occurred in patients with type 1 DM, 46.9% in patients with type 2 DM, and 0.6% in patients with new‐onset DM. The remaining 14.5% occurred in patients with no documented history of DM, although they were receiving antihyperglycemic agents. More than 1 episode was experienced by 44% of patients, and 12% experienced 5 or more episodes.
The BG was between 51 and 60 mg/dL in 282 of the episodes (58.2%), between 41 and 50 mg/dL in 149 episodes (30.8%) and 40 mg/dL or less in 53 episodes (11%). In 20 episodes (4.1% of episodes, representing fewer than 1% of all patients receiving an antihyperglycemic agent), a symptomatic hypoglycemia‐related adverse event was documented. All but 1 adverse event occurred outside the ICU. Ten of these events (2.1% of all hypoglycemic episodes) in 10 patients involved symptoms including headache, agitation, disorientation, and tremors. Of these patients 9 had type 1 DM, and 1 had type 2 DM. Six events (1.2% of hypoglycemic episodes) in 4 patients involved seizures. Two of these patients had type 1 DM, and 2 had type 2 DM. Four events (0.8% of hypoglycemic episodes) in 4 patients involved an unresponsive or unarousable state, including the sole ICU episode of symptomatic hypoglycemia. Three of these patients had type 1 DM, and 1 had type 2 DM. Patients with hypoglycemia‐related adverse events had a mean BG of 43.0 mg/dL, significantly lower (P = .01) than the mean BG of 50.9 mg/dL for hypoglycemic episodes without such events. However, 35% of these events occurred with a measured BG between 50 and 60 mg/dL. The distributions of BG values associated with symptomatic and asymptomatic events are shown in Figure 2. There is no useful threshold that separates symptomatic from asymptomatic hypoglycemia. No deaths or irreversible consequences were associated with hypoglycemia.
Approximately 40% (195 of 484) of the hypoglycemic episodes were related to decreased enteral intake (Table 1). In addition, 6.1% (30 of 484) of hypoglycemic episodes were related to insulin adjustment and 0.4% (2 of 484) to steroid withdrawal. In 43% (209 of 484) of the episodes the cause of the hypoglycemia was unclear. The remaining 10.4% of episodes were attributed to diverse causes.
| N (%) | |
|---|---|
| |
| NPO for unknown reason | 30 (6.2) |
| NPO for procedure/emntubated | 29 (6) |
| NPO for other documented reason (ie, fever/sepsis) | 10 (2.1) |
| Decreased PO intake (includes missed meal) | 126 (26) |
| No change in PO intake | 289 (59.7) |
One third of patients had a documented BG rechecked within 60 minutes, and fewer than half of the hypoglycemic patients had documented euglycemia within 2 hours of their low blood glucose measurement. The average time to documented resolution of a hypoglycemic episode was 4 hours, 3 minutes, with a median of 2 hours, 25 minutes.
Table 2 delineates the various combinations of antihyperglycemic agents that the 206 patients received in the 48 hours prior to a hypoglycemic episode. Of the 484 hypoglycemic episodes, 362 involved insulin. Of patients receiving insulin, 38 of 362 of episodes of hypoglycemia occurred in patients receiving sliding‐scale insulin (SSI) dosing as the only insulin order. In 163 hypoglycemic episodes, insulin was dosed with a combination of SSI and infusion or SSI with daily long‐acting insulin. The remaining 161 episodes involved administration of insulin to patients without an accompanying sliding‐scale order.
| |||||||
| Insulin Alone | 149 | ||||||
| Without insulin | With insulin | ||||||
| Single | Glimepiride | 1 | 4 | ||||
| Oral | Glipizide | 2 | 11 | ||||
| Agent | Glyburide | 2 | 7 | ||||
| Metformin | 5 | ||||||
| Repaglinide | 2 | ||||||
| Two | Glimepiride | AND | Metformin | 1 | |||
| Oral | Glimepiride | AND | Rosiglitazone | 1 | |||
| Agents | Glimepiride | AND | Pioglitazone | 1 | |||
| Glipizide | AND | Pioglitazone | 1 | ||||
| Glipizide | AND | Metformin | 4 | ||||
| Glyburide | AND | Metformin | 5 | ||||
| Metformin | AND | Rosiglitazone | 3 | 1 | |||
| Rosiglitazone | AND | Repaglinide | 1 | 1 | |||
| Three | Glipizide | AND | Metformin | AND | Rosiglitazone | 1 | |
| Oral | Glyburide | AND | Metformin | AND | Pioglitazone | 1 | |
| Agents | Pioglitazone | AND | Nateglinide | AND | Repaglinide | 1 | |
| TOTAL | 206 | ||||||
The prevalence of hypoglycemia did not significantly differ among patients treated with oral agents alone (9 of 85, 10.6%), patients treated with insulin alone (149 of 1497, 10%), and patients treated with both (47 of 592, 7.9%). However, there was a significant relationship between specific oral agent and probability of hypoglycemia. Glyburide was associated with a higher risk of hypoglycemia (19.1%, P < .01) than were other oral agents (Table 3).
| Oral agent | Patients with hypoglycemia | P value |
|---|---|---|
| ||
| Sulfonylureas | ||
| Glimepiride | 13.6% (8/59) | |
| Glipizide | 10.0% (19/190) | |
| Glyburide | 19.1% (18/94) | < .01 |
| Biguanide | 6.4% (22/344) | |
| Metformin | < .05 | |
| Thiazolidinediones | ||
| Pioglitazone | 5.1% (4/78) | |
| Rosiglitazone | 6.4% (6/94) | |
| Meglitinides | ||
| Nateglinide | 7.1% (1/14) | |
| Repaglinide | 7.0% (4/57) | |
DISCUSSION
Recently, many have called for substantive changes in the management of the hospitalized diabetic.15, 16 Most have recommended replacing sliding‐scale insulin with basal bolus insulin dosing and have challenged the historic tolerance of hyperglycemia during an acute hospital stay.17 However, as hospitals and physicians transform the management of inpatient hyperglycemia, they must assess the frequency of hypoglycemia and evaluate the risk/benefit ratio of strict glycemic control.18 Thus, one study found that eliminating sliding‐scale insulin markedly improved diabetes control but hypoglycemia (BG 60 mg/dL) was more frequent.10 The cost of euglycemia is hypoglycemia.2
We report a 9.5% rate of hypoglycemia among adult hospitalized patients being treated for hyperglycemia, including those in the ICU and those in non‐ICU settings. In widely publicized landmark trials, 5.2% of intensively treated surgical ICU patients14 and 18.7% of intensively treated medical ICU patients13 experienced hypoglycemia with no adverse events. Using those studies' definition of hypoglycemia (BG 40 mg/dL), only 2.4% (53 of 2174) of our patients experienced hypoglycemia. However, our survey included general medical and surgical patients as well as ICU patients treated at their physicians' discretion, reflecting the greater variability in care that exists outside a randomized, ICU trial.
We did not anticipate the duration to documented resolution of hypoglycemic episodes, nor did we anticipate the number of hypoglycemia‐related adverse events. We believe that hospitals will need to develop formal strategies to minimize the hypoglycemic risk from tight glycemic control. The frequency and duration of the time it took to recheck the glucose, coupled with the 4.1% symptomatic event rate, suggests that inpatient hypoglycemia deserves more attention. One potential focus is the interruption of nutrition, as medications may not be readjusted when patients' oral intake declines or when they travel for tests.19
More than 40% of our hypoglycemic patients experienced recurrent episodes. This may reflect a lack of adjustment of medications following hypoglycemia. However, recurrent hypoglycemia may also be explained by hypoglycemia‐associated autonomic failure and the desensitization to hypoglycemia that occurs once a patient has lower blood glucose.2 Thus, hypoglycemic patients are at high risk of repeat episodes and often require more frequent BG monitoring. Of note, patients with hypoglycemia unawareness may not have symptoms despite low BG, and thus unless they develop signs of hypoglycemia, they would not meet criteria for an adverse event in our study, despite a very low BG.
Medical error can precipitate hypoglycemia,4, 20 and the Institute for Safe Medication Practices21 and the Joint Commission on Accreditation of Healthcare Organizations22 consider insulin a high‐risk medication. We found no hypoglycemic episodes associated with a medication error. Our CPOE system eliminates ambiguity from poor penmanship, and hospital policy requires 2 nurses to check all administered insulin. However, despite the apparent lack of dispensing/administration medication errors, nearly 10% of patients receiving hypoglycemic therapy experienced iatrogenic hypoglycemia. Thus, strategies to reduce hypoglycemia must expand beyond the prevention of medication errors.
Contrary to our expectation, we found the prevalence of hypoglycemia was at least as high, if not higher, for patients taking only oral hypoglycemics than for patients taking either insulin alone or insulin in combination with oral antihyperglycemic agents. Glyburide appeared to carry the most risk both in our population and in previous studies,2325 perhaps because of a moderately active hepatic metabolite.26 The risk of hypoglycemia with different oral agents warrants further study.
The study stimulated several actions. First, we augmented the online nursing flow sheet to permit documentation of hypoglycemic episodes, including the administration of orange juice or food. Second, our CPOE system now prevents a physician from inadvertently deselecting the hypoglycemia protocol. Third, the CPOE system prompts the nurse to recheck the BG as specified in the hypoglycemia protocol. Finally, the CPOE system warns physicians to adjust antihyperglycemic agents when they institute nutritional changes. We propose that monitoring hypoglycemia rates must become a necessary component of inpatient diabetes care that is both effective and safe and plan to monitor these rates to determine the impact of interventions designed to reduce the frequency of hypoglycemia‐related adverse events.
Our study had several limitations. We only included episodes of hypoglycemia that were identified with a POC BG. This excluded patients treated for symptomatic hypoglycemia without a measured POC BG, potentially underestimating the event rate. Moreover, defining time to resolution of a hypoglycemic episode as that documented with a serum BG but not a POC BG may have resulted in overestimating the duration, and nurses may have documented POC BGs in the MAR after a substantial delay, also artificially lengthening the time to resolution. Capillary BG may underestimate the true degree of hypoglycemia,27 thus confounding the relationship between BG and adverse events. Our study was not designed to evaluate subtle suboptimal management of hyperglycemia as a cause of hypoglycemia, although expansion of the types and combinations of insulin has increased the possibility of prescribing errors. Nor were we able to assess the preventability of hypoglycemic episodes or the independent risk factors for hypoglycemia. Finally, this study originated from a single academic hospital and thus may reflect its unique idiosyncrasies.
We have reported a comprehensive survey of hypoglycemia in patients treated with antihyperglycemic agents at a single hospital. At the time the study took place, we had not instituted hospitalwide strategies to maintain BG near euglycemic targets, although such strategies have since begun. To detect untoward events that may follow from our efforts to better control hyperglycemia, we believe it is important to establish baseline measurements. Even without aiming for tighter glucose control, we identified the need to aim for and possible strategies to achieve, better prevention of hypoglycemia.
APPENDIX
SUMMARY OF DEFINITIONS FOR CHART REVIEW
New onset diabetes was defined as diabetes diagnosed during the current hospital admission when there was no previous history of diabetes.
No diabetes was defined as no history of diabetes and no diagnosis of diabetes during the index hospital stay.
Documentation was defined as any notation in the record by the physician or nurse acknowledging the hypoglycemic episode, other than the BG value itself.
Time to recheck BG was defined as the time in the MAR between a recorded BG 60 mg/dL and the next recorded BG.
Resolution was defined as the time in the MAR between a recorded BG 60 mg/dL and the first recorded BG 80 mg/dL (if, following a BG > 80 mg/dL, the next BG was 60 mg/dL, the 2 BG 60 mg/dL were defined as belonging to the same episode and that no resolution had yet occurred).
Decline in enteral intake was defined as any new NPO order on the day of the episode or missed meal within 3 hours of the episode.
Hypoglycemia‐related symptomatic adverse event was defined as any documented event at the time of the hypoglycemic episode involving symptoms, change in care, temporary or permanent injury, or increased hospitalization. Change of care did not include following the hypoglycemic protocol and administering 50% dextrose or glucagon, as we considered this usual care, unless symptoms or signs also accompanied the hypoglycemic event.
- ,,, et al.Management of diabetes and hyperglycemia in hospitals.Diabetes Care.2004;27:553–591.
- ,,.Hypoglycemia in diabetes.Diabetes Care.2003;26:1902–1912.
- ,,,.Drug‐induced hypoglycemic coma in 102 diabetic patients.Arch Intern Med.1999;159:281–284.
- .Unexpected hypoglycemia in a critically ill patient.Ann Intern Med.2002;137:110–116.
- ,.Hypoglycemia: causes, neurological manifestations and outcome.Ann Neurol.1985;17:421–430.
- ,,, et al.Early postoperative glucose control predicts nosocomial infection rate in diabetic patients.J Parenter Enteral Nutr.1998;22:77–81.
- ,,,.Continuous intravenous insulin infusion reduces the incidence of deep sternal wound infection in diabetic patients after cardiac surgical procedures.Ann Thor Surg.1999;67:352–362.
- ,,, et al.Inpatient management of diabetes: survey in a tertiary care center.Postgrad Med J.2003;79:585–587.
- ,.Incidence of hypoglycemia and nutritional intake in patients on a general medical unit.Nursingconnections.1989;2:33–40.
- .Seidler AJ, Brancati FL. Glycemic control and sliding scale insulin use in medical inpatients with diabetes mellitus.Arch Intern Med.1997;157:545–552.
- ,,,.Eliminating sliding‐scale insulin.Diabetes Care.2005;28:1008–1011.
- American Diabetes Association Workgroup on Hypoglycemia.Defining and reporting hypoglycemia in diabetes. A report from the American Diabetes Association workgroup on hypoglycemia.Diabetes Care.2005;28:245–1249.
- ,,, et al.Intensive insulin therapy in the medical ICU.N Engl J Med.2006;354:449–461
- ;,, et al.Intensive insulin therapy in critically ill patients.N Engl J Med.2001;345:1359–1367.
- ,,.Inpatient management of diabetes mellitus.Am J Med.2002;113:317–323.
- ,,, et al.American College of Endocrinology Position Statement on inpatient diabetes and metabolicControl Endo Pract.2004;10:77–82.
- ,,.Inpatient diabetology, the new frontier.J Gen Intern Med.2004;19:466–471.
- ,.Counterpoint: inpatient glucose management, a premature call to arms?Diabetes Care.2005;28:976–979.
- ,,,.Causes of hyperglycemia and hypoglycemia in adult inpatients.Am J Health Syst Pharm.2005;62:714–719.
- ,,.Hypoglycemia in hospitalized patients: causes and outcomes.N Engl J Med.1986;315:245–1250.
- Available at: http://www.ismp.org/Tools/highalertmedications.pdf. Accessed July 27,2006.
- Joint Commission on Accreditation of Healthcare Organizations. High alert medications and patient safety. Sentinel Event Alert Issue 11, November 19, 1999 Available at: http://www.jointcommission.org/SentinelEvents/SentinelEventAlert/sea_11.htm. Accessed July 27,2006.
- .Comparative tolerability of sulfonylureas in diabetes mellitus.Drug Saf.2000;22:313–320.
- ,,,.Individual sulfonylureas and serious hypoglycemia in older people.J Am Geriatr Soc.1996;44:751–755
- ,.Sulfonylureas. In:DeFronzo RA, ed.Current Management of Diabetes Mellitus.St. Louis, MO:Mosby;1998:96–101.
- ,,.Diabetes Mellitus in Pharmacotherapy: A Pathophysiologic Approach.6th ed.Dipiro JT, ed.New York:McGraw Hill;2005.
- ,,, et al.Reliability of point‐of‐care testing for glucose measurement in critically ill adults.Crit Care Med.2005;33:2778–2785.
- ,,, et al.Management of diabetes and hyperglycemia in hospitals.Diabetes Care.2004;27:553–591.
- ,,.Hypoglycemia in diabetes.Diabetes Care.2003;26:1902–1912.
- ,,,.Drug‐induced hypoglycemic coma in 102 diabetic patients.Arch Intern Med.1999;159:281–284.
- .Unexpected hypoglycemia in a critically ill patient.Ann Intern Med.2002;137:110–116.
- ,.Hypoglycemia: causes, neurological manifestations and outcome.Ann Neurol.1985;17:421–430.
- ,,, et al.Early postoperative glucose control predicts nosocomial infection rate in diabetic patients.J Parenter Enteral Nutr.1998;22:77–81.
- ,,,.Continuous intravenous insulin infusion reduces the incidence of deep sternal wound infection in diabetic patients after cardiac surgical procedures.Ann Thor Surg.1999;67:352–362.
- ,,, et al.Inpatient management of diabetes: survey in a tertiary care center.Postgrad Med J.2003;79:585–587.
- ,.Incidence of hypoglycemia and nutritional intake in patients on a general medical unit.Nursingconnections.1989;2:33–40.
- .Seidler AJ, Brancati FL. Glycemic control and sliding scale insulin use in medical inpatients with diabetes mellitus.Arch Intern Med.1997;157:545–552.
- ,,,.Eliminating sliding‐scale insulin.Diabetes Care.2005;28:1008–1011.
- American Diabetes Association Workgroup on Hypoglycemia.Defining and reporting hypoglycemia in diabetes. A report from the American Diabetes Association workgroup on hypoglycemia.Diabetes Care.2005;28:245–1249.
- ,,, et al.Intensive insulin therapy in the medical ICU.N Engl J Med.2006;354:449–461
- ;,, et al.Intensive insulin therapy in critically ill patients.N Engl J Med.2001;345:1359–1367.
- ,,.Inpatient management of diabetes mellitus.Am J Med.2002;113:317–323.
- ,,, et al.American College of Endocrinology Position Statement on inpatient diabetes and metabolicControl Endo Pract.2004;10:77–82.
- ,,.Inpatient diabetology, the new frontier.J Gen Intern Med.2004;19:466–471.
- ,.Counterpoint: inpatient glucose management, a premature call to arms?Diabetes Care.2005;28:976–979.
- ,,,.Causes of hyperglycemia and hypoglycemia in adult inpatients.Am J Health Syst Pharm.2005;62:714–719.
- ,,.Hypoglycemia in hospitalized patients: causes and outcomes.N Engl J Med.1986;315:245–1250.
- Available at: http://www.ismp.org/Tools/highalertmedications.pdf. Accessed July 27,2006.
- Joint Commission on Accreditation of Healthcare Organizations. High alert medications and patient safety. Sentinel Event Alert Issue 11, November 19, 1999 Available at: http://www.jointcommission.org/SentinelEvents/SentinelEventAlert/sea_11.htm. Accessed July 27,2006.
- .Comparative tolerability of sulfonylureas in diabetes mellitus.Drug Saf.2000;22:313–320.
- ,,,.Individual sulfonylureas and serious hypoglycemia in older people.J Am Geriatr Soc.1996;44:751–755
- ,.Sulfonylureas. In:DeFronzo RA, ed.Current Management of Diabetes Mellitus.St. Louis, MO:Mosby;1998:96–101.
- ,,.Diabetes Mellitus in Pharmacotherapy: A Pathophysiologic Approach.6th ed.Dipiro JT, ed.New York:McGraw Hill;2005.
- ,,, et al.Reliability of point‐of‐care testing for glucose measurement in critically ill adults.Crit Care Med.2005;33:2778–2785.
Copyright © 2007 Society of Hospital Medicine
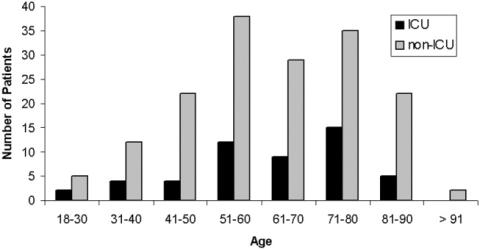
Adopting NQF Practices
In November 1999, the Institute of Medicine released its landmark report entitled To Err Is Human: Building A Safer Health System.1 The report claimed that more than 1 million people in the United States suffer from preventable medical injuries each year and that as many as 98,000 people die annually in hospitals from medical errors. Although evidence‐based methods are available to prevent adverse events, there is concern that the current lack of standardization among hospitals implementing such safe practices has the potential to both diffuse and dilute efforts to improve patient safety.
To address this issue, the National Quality Forum (NQF) in 2003 released an evidence‐based consensus report that presented 30 safe practices for better health care with a recommendation that all be universally adopted.2 The purpose of this study is to use information collected from a voluntary patient safety program in Georgia3 and an Agency for Healthcare Research and Quality (AHRQ) reporting demonstration study4 to (1) describe the current statewide adoption rates for NQF medication safe practices and safety culture (Table 1), and (2) examine if hospital adoption varies by hospital size, ownership, and rural or urban location.
| NQF Safe Practice No. | Key Word | Full Description of Safe Practice |
|---|---|---|
| ||
| 1 | Culture of safety | Create a health care culture of safety. |
| 5 | Consultant pharmacists | Pharmacists should actively participate in the medication‐use process, including, at a minimum, being available for consultation with prescribers and reviewing medication orders. |
| 6 | Verbal orders | Verbal orders should be recorded whenever possible and immediately read back to the prescriber. |
| 7 | Abbreviations | Use of standardized abbreviations and dosage designations. |
| 9 | Information transfer | Ensure that care information, especially changes in orders and new diagnostic information, is transmitted to all providers. |
| 12 | CPOE adoption | Implement a computerized prescriber order entry system |
| 27 | Clean workspaces | Keep workspaces where medications are prepared clean, orderly, well lighted, and free of clutter, distraction, and noise. |
| 28 | Labeling and storage | Standardize the methods for labeling, packaging, and storing medications. |
| 29 | High‐alert medications | Identify all high alert drugs. |
| 30 | Unit dosing | Dispense medications in unit‐dose or, when appropriate, unit‐of‐use form whenever possible. |
METHODS
Setting and Exclusions
The Partnership for Health and Accountability (PHA), a voluntary and peer‐review‐protected statewide hospital patient safety program, was established in Georgia in 2001 under the administration of the Georgia Hospital Association. All 148 nonfederal adult acute care hospitals in the state of Georgia participate in some aspect of the initiative. This represents a broad cross section of hospital types nationwide, with 55% of the hospitals having fewer than 100 beds, 25% having 100‐299 beds, and 20% having more than 300 beds. Hospitals are almost evenly divided between urban (54%) and rural (46%) locations.
Survey Instruments
One component of the PHA program focuses on safe medication use (SMU) with a goal of reducing the frequency of medication‐related errors in acute care hospitals. In 2004 all active acute care hospital members of GHA were eligible to participate in the SMU self‐assessment, and all but 1 hospital (147 of 148 hospitals, 97.3%) completed the self‐assessment survey.
The SMU self‐assessment is a 99‐item survey that addresses error reporting and event capture, the prescribing process, order processing and dispensing, medication administration and monitoring, patient involvement, policy and administration, and practitioner education and development. For each item, hospitals report on a 1‐5 scale the current status of adoption, ranging from no discussion to full implementation.
A second component of the PHA program identifies critical organizational tactics and strategies required for a culture of safety. Once every 2 years, top and midlevel managers complete a Strategies for Leadership self‐assessment. Results from this survey are disseminated to member hospitals to promote a culture of safety. Regular audioconferences are held to network and share successful intervention strategies aimed at establishing free and open communication, improving organizational learning, and promoting nonpunitive reporting of adverse events. A total of 147 hospitals (97.3%) completed the 2003 Strategies for Leadership survey.
The Strategies for Leadership self‐assessment is a 75‐item survey that addresses 7 broad categories: top leadership priorities, strategic planning, nonpunitive environment, patient and community focus, information analysis, human resources, and work environment. Hospital managers describe current status using a scale ranging from 1 (no discussion) to 5 (> 90% implementation).
Several steps were used to create the final study measures. First, the SMU and Leadership survey questions were reviewed to see if they addressed 1 of the 10 NQF indicators under study (Table 1). Quantitative analysis was then used to eliminate, collapse, and/or confirm the grouping arrangement. Given the broad and nonspecific nature of create a culture of safety, domains from the Hospital Survey on Patient Safety Culture5 were used to classify specific aspects of safety culture. For the purposes of this study, 5 of the 12 domains were used to categorize hospital responses. The domains used were (1) feedback and communication about error, (2) frequency of reporting, (3) promoting a nonpunitive environment, (4) encouraging organizational learning and continuous improvement, and (5) maintaining safe staffing.
Mapping Survey Questions to Safe Practices
A subset (n = 57) of the SMU survey questions directly related to safe medication processes (ie, prescribing, transcribing, dispensing, administration, and monitoring) were selected for inclusion in the study (Fig. 1). A nonoverlapping subset of Leadership (n = 35) and SMU (n = 10) survey questions related to safety culture were also identified. Clinical members of the project team independently reviewed and mapped medication process survey questions to 1 of 9 NQF indicators of safe medication practices. Assignment was based on face validity and best fit with the intent of the NQF indicator. Social science team members mapped culture‐related survey questions to the NQF indicator create a health care culture of safety using the 5 domains of safety culture.5
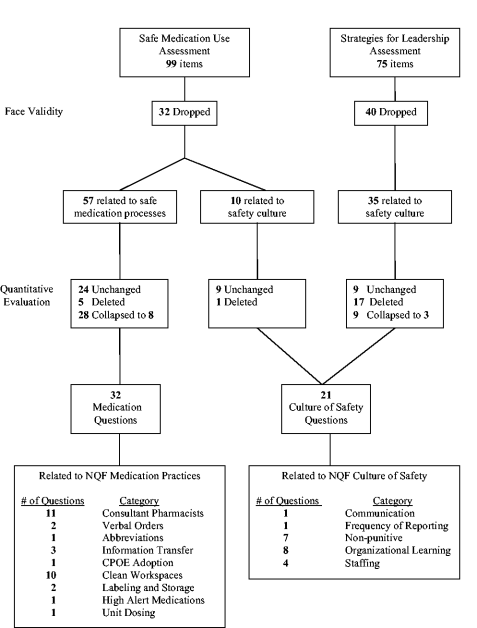
Grouping Similar Questions
A Pearson correlation matrix was used to confirm the factor analysis and determine if multiple questions related to a single safe practice could be reduced to 1 composite measure. If analysis supported the use of a composite score, responses to similar questions at the hospital level were averaged, and the hospital's final average was the measure used for analyses. Finally, the project team reviewed the a priori mapping along with the results of the correlation and factor analyses and reached consensus on the final number and mapping scheme of survey questions to NQF safe practices. Of the original 45 culture‐of‐safety questions, 21 were used for this analysis, and of the original 57 safe medication process questions, 32 were used.
Data Analysis
Bivariate analyses using SPSS software were conducted to examine the association between hospital structural characteristics (urban or rural location, network affiliation, academic affiliation, bed size) and adoption of each NQF safe practice.
RESULTS
Medication Safety
Table 2 shows the overall rate of adoption by all hospitals of the safe practices related to medication use. Full implementation was defined as implementation in greater than 90% of the organization. There has been almost universal adoption of 3 safe practices: processes to standardize labeling and storage of medications (133 of 147, 90.5%), identification of high‐alert medications (119 of 147, 81.0%), and use of unit doses when appropriate (119 of 147, 81.0%). CPOE systems, on the other hand, had been implemented in fewer than 3% (4 of 147) of the hospitals by early 2004. The remaining 5 medication practices showed intermediate adoption (between 48.3% and 69.7%): ensuring information transfer, minimizing verbal orders, providing clean workspaces with minimal distractions, availability of consultant pharmacists, and minimizing abbreviations.
| NQF Safe Practice | Proportion of Hospitals Reporting > 90% Implementation | Association with Hospital Structural Characteristics* |
|---|---|---|
| ||
| #5 Consultant pharmacists | 52.0% | More likely in mid‐size hospitals |
| #6 Verbal orders | 63.3% | None |
| #7 Abbreviations | 48.3% | None |
| #9 Information transfer | 69.7% | None |
| #12 CPOE adoption | 2.7% | None |
| #27 Clean workspaces | 53.7% | Less likely in large hospitals |
| #28 Labeling and storage | 90.5% | None |
| #29 High‐alert medications | 81.0% | None |
| #30 Unit dosing | 81.0% | More likely in for‐profit hospitals |
Variation in Adoption by Hospital Characteristics
There was only limited variation in adoption by hospital characteristics as summarized in Table 2 and discussed in more detail below. For‐profit hospitals were most likely to have a unit dose medication distribution system in place (93.1% vs. 78.2%, P = .037). For‐profit hospitals were also more likely (83.1% vs. 58.4%, P = .004) to have fully implemented a policy to read back verbal orders. The likelihood of adopting a policy to eliminate verbal orders did not vary significantly by hospital characteristics. The prevalence of distractions was also seen as a problem for writing orders and medication administration, with the largest hospitals more frequently reporting this challenge (59.2% vs. 29.6%, P = .005). Midsize hospitals (100299 beds) were more likely than larger or smaller hospitals to report that a pharmacist reviewed and approved all nonemergency orders prior to dispensing. (76.3% vs. 45.0%, P = .001).
Barriers to Adoption of Medication Safe Practices
Ensuring that new prescribers had access to all currently prescribed medications, including both dose and frequency was a challenge for many hospitals. More than 30% of hospitals (45 of 147) did not have this capability consistently throughout the institution, and that capability did not vary by hospital size or geographic location. Although most hospitals (93 of 147, 63.3%) had a read‐back policy for verbal orders, only 36.1% of hospitals (53 of 147) had fully implemented a policy to eliminate or minimize the use of verbal orders. Two aspects of the medication preparation environment also appeared to be problematic for the surveyed hospitals: appropriate space for medication preparation and a distraction‐free environment. Only half the hospitals (74 of 147) reported that medications were prepared in an environment that minimized distractions, and 53.7% (79 of 147) reported that pharmacists were provided with sufficient space. Although more than 90% of hospitals reported that pharmacists were available for consultation even when the pharmacy was closed, fewer than half the hospitals (71 of 147, 48.3%) reported that pharmacists were involved on patient care units as a resource for clinical decision support. There also were gaps in the patient information available when preparing medications, in particular, pregnancy status (82 of 147, 55.8%) and medications prescribed before hospitalization (85 of 147, 57.8%). Fewer than half the hospitals (67 of 147, 45.5%) had fully implemented a policy to minimize use of dangerous abbreviations. Most hospitals (91 of 147, 61.9%), however, did report that they had methods in place to proactively review processes for communicating medication orders and then redesign if appropriate.
Safety Culture
Table 3 shows the self‐reported adoption of safety culture as defined by the Hospital Patient Safety Culture Survey5 domains. Hospital safety culture was highest in several areas related to nonpunitive policies. For example, the vast majority of hospitals reported that no disciplinary actions were taken against employees for nonmalicious errors, that a formal hospital‐wide nonpunitive policy for staff and employees was in place, and that the hospital had a user‐friendly and confidential error‐reporting system in place. A smaller proportion of hospitals (75 of 147, 51.0%) provided specific resources to support employees involved in error or sponsor unit visits by senior management to promote blame‐free discussion and reporting of errors (64 of 147, 43.5%). For‐profit hospitals (63.3% vs. 38.5%, P = .014) and small hospitals (49.2% vs. 18.5%, P = .004) were more likely to have unit visits by senior management. An even smaller minority of hospitals reported having used dedicated observers to catch errors as they occur (32 of 147, 21.8%) or that they provided direct incentives to caregivers for reporting errors (31 of 147, 21.1%).
| Safety of Culture Category | Specific Attribute | Overall Adoption | Association with Hospital Structural Characteristics* |
|---|---|---|---|
| |||
| Communication | Safety alert process | 59.9% | None |
| Frequency of reporting | Confidential error reporting system | 70.1% | None |
| Non‐punitive environment | Nonpunitive policies | 76.2% | None |
| Employee resources | 51.0% | None | |
| Unit visits | 43.5% | Unit visits more likely in small hospitals and for‐profit hospitals | |
| Organizational learning | Annual safety plans | 76.7% | None |
| Teams analyze errors | 72.1% | None | |
| Data analysis guides QI | 69.4% | Using data analysis to guide QI initiatives less likely in large hospitals | |
| Proactive evaluations before implementation | 44.9% | None | |
| Piloting processes | 42.9% | None | |
| Staffing | Adequate staffing ratios | 72.8% | None |
| Limited work hours | 57.6% | Limiting staff work hours less likely in large hospitals | |
In regard to organizational policies, three‐fourths of hospitals did have a patient safety plan that was reviewed annually by senior leadership. Most hospitals (106 of 147, 72.1%) used multidisciplinary teams to regularly analyze errors after they occurred and to identify possible system changes with no significant differences in adoption rates across hospital types. Most hospitals (102 of 147, 69.4%) also used data analysis to drive patient safety quality improvement efforts. Surprisingly, this was least common in the largest hospitals (48.1% vs. 74.2%, P = .008). Overall, hospitals were much less likely to have adopted the use of proactive techniques such as failure modes and effects analysis (FMEA) before implementation of major system changes or the piloting of new processes prior to implementation. Adoption rates for these activities were below 50% for all hospital demographic groups.
In terms of strategies for maintaining safe staffing levels, most hospitals reported they maintained safe staffing through adequate staffing ratios (107 of 147, 72.8%), whereas a smaller number (84 of 147, 57.1%) reported maintaining safe staffing by limiting work hours. Large hospitals were the least likely to limit work hours (33.3% vs. 63.2%, P = .005).
DISCUSSION
This is the first study to use existing data sources to characterize the current progress and barriers to further adoption of NQF safe practices and safety culture related to medication use in a statewide sample of hospitals. Several findings are notable. First, most of the hospitals surveyed had adopted 7 of 9 medication‐related NQF safe practices by 2004. Similar to findings from the earlier ISMP Safety Self‐Assessment for Hospitals, hospitals scored most highly on practices related to drug storage, packaging, and labeling and lowest on CPOE implementation.12 Results from the 2003 Leapfrog Group Quality and Safety Survey also found that only 3.7% of participating hospitals had fully implemented a CPOE system.13 Medication safe practices that directly affect physicians, such as verbal orders, standardized abbreviations, and access to relevant clinical information when prescribing had only intermediate adoption rates.
Most hospitals have developed policies around nonpunitive safety cultures, but fewer have adopted proactive error reduction systems. Safety culture is more difficult to measure than safe medication processes. A previous survey of Iowa hospitals assessed only whether hospitals reported progress toward creating a culture of safety.14 In this study we attempted to break down the broad concept of safety culture into specific actionable components. Three widely recognized components of a safe hospital culture are creating a nonpunitive environment for staff, using data to identify and analyze errors and system causes, and safe staffing levels.8 Most but not all surveyed hospitals had adopted these safety culture strategies. Other more resource‐intensive practices, such as unit visits by senior management and FMEA, were less likely to have been adopted. The adoption rates reported here for 20032004 are in most cases higher than those found in the 2000 ISMP survey, which may be explained by the more recent survey reported here and variations in question wording as well as response scoring.
Variations in adoption rates of NQF‐recommended safe practices generally were not explained by hospital characteristics such as ownership, size, or geographic location. Instead, barriers appear to be related to resource constraints as well as the ability of hospitals to directly control the specific safe practice. The ISMP survey found that hospital demographic factors explained only 3% of the variation in adoption, which is similar to our finding of few differences in adoption of safe practices by hospital type. Cost and health care culture may explain why certain safe practices remain less than fully adopted.12 Resource constraints may explain the lower adoption rate of several practices: CPOE, pharmacist consultation, and physical environment improvements. Other safe practices with lower adoption rates require active physician participation, for example, minimizing verbal orders, standardizing abbreviations, and ensuring accurate information transfers. Hospital‐based physicians can play a key role in advocating for effective processes to promote these practices.
Another general factor that distinguished highly adopted practices from less adopted practices was the extent to which reactive as opposed to proactive actions were required. Hospitals were more likely to report reactive policies such as reading back verbal orders than proactive policies to minimize verbal orders. Pharmacists were generally available for telephone consultation but in only half the hospitals were they available on the hospital units for consultation. A similar pattern was seen for culture of safety practices; systems were generally in place for nonpunitive error reporting, but a minority of hospitals had senior leadership making unit rounds or multidisciplinary teams proactively testing new systems to identify potential errors before they occur. Again, there is a leadership role that hospital‐based physicians can play as effective team builders for safety culture and as clinical leaders for improvement of medication processes. Much research has demonstrated the impact that a culture of safety can have on error reduction.811 As physicians who spend most of their clinical time directly on patient care units, hospital‐based physicians are uniquely positioned to promote positive changes in culture. Research on the impact of hospitalists on hospital costs and patient outcomes should be broadened to include an assessment of their impact on safety culture and error reduction.
This study had several limitations, the first being that it was based on voluntarily provided self‐assessment data. The surveys used in this project have been refined and administered over 3 years in a nonpunitive process improvement program with a consistently high participation rate. The hospital‐reported survey results have not been independently verified for accuracy, similar to most of the prior research in this area. The surveys measure management's perception of safety culture and do not assess actual employee perceptions of the safety culture on their particular units. Thus, although management may believe they are implementing policies to create a nonpunitive environment, actual assessments of employees' views are needed to confirm this. Because the study was based on previously collected data, several steps were used to map the existing questions to NQF safe practices. Given the broad nature of the NQF topics, at least 1 relevant survey question was identified for each of the medication‐related safe practices. When more than 1 question was judged to be relevant, the responses were averaged. The survey was limited to adult acute care hospitals in Georgia, which may not be nationally representative, and federal and Veterans Administration hospitals were not included. However, Georgia has a relatively high proportion of smaller rural hospitals and offers interesting baseline data on similar rates of adoption of safe practices in rural and smaller hospitals compared with that in urban hospitals. Because we were using previously collected surveys, we could only look at the adoption of selected safe practices. Further work is needed to look at the adoption of other safe practices.
In summary, it is encouraging that the most studied NQF‐recommended safe practices have already been adopted by a wide range of hospitals, including rural and small hospitals. Resource constraints as well as health care culture and structure remain barriers to broader diffusion. Some barriers may be addressed by technology and improvements in physical environments, but others relate to culture and may be more challenging to address. Active physician participation in medication‐related patient safety initiatives will be key to promoting further adoption of safe practices.
- Kohn LT,Corrigan JM, andDonaldson MS, eds.To Err Is Human: Building a Safer Health System: A Report from the Committee on Quality of Healthcare in America.Institute of Medicine,National Academy of Sciences.Washington, DC:National Academy Press,1999.
- The National Quality Forum.Safe practices for better healthcare: a consensus report. NQF publication no. NQFCR‐05‐03;2003.
- Georgia Hospital Association. Available at: http://www.gha.org.
- ,,.Voluntary hospital coalitions to promote patient safety: why, how and can they work? In:Advances in Patient Safety: From Research to Implementation.Rockville, MD:AHRQ;2005.
- Agency for Healthcare Research and Quality (AHRQ).The Hospital Survey on Patient Safety Toolkit 2004. Sponsored by the Medical Errors Workgroup of the Quality Interagency Coordination Task Force (QuIC), developed by Westat.Rockville, MD:AHRQ;2004.
- Vaughan, Diane.1996.The Challenger launch decision: risky technology, culture, and deviance at NASA.Chicago:University of Chicago Press.
- ,,,,,.Overcoming barriers to adopting and implementing computerized physician order entry systems in U.S. hospitals.Health Aff.2004;23(4):184–190.
- ,.Safety culture assessment: a tool for improving patient safety in healthcare organizations.Qual Saf in Health Care.2003;12(suppl. 2):17–23.
- ,,.Error, stress, and teamwork in medicine and aviation: cross‐sectional surveys.Hum Perf Extrem Environ.2001;6:6–11.
- ,,,.Using a multihospital survey to examine the safety culture.Jt Comm J Qual Saf.2004;30:125–32.
- ,,,.A review of the literature examining linkages between organizational factors, medical errors, and patient safety.Med Care Res Rev.2004;61:3–37.
- ,,,,,.Findings from the ISMP medication safety self‐assessment for hospitals.Jt Comm J Qual Saf.2003;29:586–597.
- ,.Hospital implementation of computerized provider order entry systems: results from the 2003 Leapfrog Group Quality and Safety Survey.J Healthc Inf Manag.2005;19(4):55–65.
- ,,,,.National Quality Forum 30 safe practices: priority and progress in Iowa hospitals.Am J Med Qual.2006;21:101–108.
In November 1999, the Institute of Medicine released its landmark report entitled To Err Is Human: Building A Safer Health System.1 The report claimed that more than 1 million people in the United States suffer from preventable medical injuries each year and that as many as 98,000 people die annually in hospitals from medical errors. Although evidence‐based methods are available to prevent adverse events, there is concern that the current lack of standardization among hospitals implementing such safe practices has the potential to both diffuse and dilute efforts to improve patient safety.
To address this issue, the National Quality Forum (NQF) in 2003 released an evidence‐based consensus report that presented 30 safe practices for better health care with a recommendation that all be universally adopted.2 The purpose of this study is to use information collected from a voluntary patient safety program in Georgia3 and an Agency for Healthcare Research and Quality (AHRQ) reporting demonstration study4 to (1) describe the current statewide adoption rates for NQF medication safe practices and safety culture (Table 1), and (2) examine if hospital adoption varies by hospital size, ownership, and rural or urban location.
| NQF Safe Practice No. | Key Word | Full Description of Safe Practice |
|---|---|---|
| ||
| 1 | Culture of safety | Create a health care culture of safety. |
| 5 | Consultant pharmacists | Pharmacists should actively participate in the medication‐use process, including, at a minimum, being available for consultation with prescribers and reviewing medication orders. |
| 6 | Verbal orders | Verbal orders should be recorded whenever possible and immediately read back to the prescriber. |
| 7 | Abbreviations | Use of standardized abbreviations and dosage designations. |
| 9 | Information transfer | Ensure that care information, especially changes in orders and new diagnostic information, is transmitted to all providers. |
| 12 | CPOE adoption | Implement a computerized prescriber order entry system |
| 27 | Clean workspaces | Keep workspaces where medications are prepared clean, orderly, well lighted, and free of clutter, distraction, and noise. |
| 28 | Labeling and storage | Standardize the methods for labeling, packaging, and storing medications. |
| 29 | High‐alert medications | Identify all high alert drugs. |
| 30 | Unit dosing | Dispense medications in unit‐dose or, when appropriate, unit‐of‐use form whenever possible. |
METHODS
Setting and Exclusions
The Partnership for Health and Accountability (PHA), a voluntary and peer‐review‐protected statewide hospital patient safety program, was established in Georgia in 2001 under the administration of the Georgia Hospital Association. All 148 nonfederal adult acute care hospitals in the state of Georgia participate in some aspect of the initiative. This represents a broad cross section of hospital types nationwide, with 55% of the hospitals having fewer than 100 beds, 25% having 100‐299 beds, and 20% having more than 300 beds. Hospitals are almost evenly divided between urban (54%) and rural (46%) locations.
Survey Instruments
One component of the PHA program focuses on safe medication use (SMU) with a goal of reducing the frequency of medication‐related errors in acute care hospitals. In 2004 all active acute care hospital members of GHA were eligible to participate in the SMU self‐assessment, and all but 1 hospital (147 of 148 hospitals, 97.3%) completed the self‐assessment survey.
The SMU self‐assessment is a 99‐item survey that addresses error reporting and event capture, the prescribing process, order processing and dispensing, medication administration and monitoring, patient involvement, policy and administration, and practitioner education and development. For each item, hospitals report on a 1‐5 scale the current status of adoption, ranging from no discussion to full implementation.
A second component of the PHA program identifies critical organizational tactics and strategies required for a culture of safety. Once every 2 years, top and midlevel managers complete a Strategies for Leadership self‐assessment. Results from this survey are disseminated to member hospitals to promote a culture of safety. Regular audioconferences are held to network and share successful intervention strategies aimed at establishing free and open communication, improving organizational learning, and promoting nonpunitive reporting of adverse events. A total of 147 hospitals (97.3%) completed the 2003 Strategies for Leadership survey.
The Strategies for Leadership self‐assessment is a 75‐item survey that addresses 7 broad categories: top leadership priorities, strategic planning, nonpunitive environment, patient and community focus, information analysis, human resources, and work environment. Hospital managers describe current status using a scale ranging from 1 (no discussion) to 5 (> 90% implementation).
Several steps were used to create the final study measures. First, the SMU and Leadership survey questions were reviewed to see if they addressed 1 of the 10 NQF indicators under study (Table 1). Quantitative analysis was then used to eliminate, collapse, and/or confirm the grouping arrangement. Given the broad and nonspecific nature of create a culture of safety, domains from the Hospital Survey on Patient Safety Culture5 were used to classify specific aspects of safety culture. For the purposes of this study, 5 of the 12 domains were used to categorize hospital responses. The domains used were (1) feedback and communication about error, (2) frequency of reporting, (3) promoting a nonpunitive environment, (4) encouraging organizational learning and continuous improvement, and (5) maintaining safe staffing.
Mapping Survey Questions to Safe Practices
A subset (n = 57) of the SMU survey questions directly related to safe medication processes (ie, prescribing, transcribing, dispensing, administration, and monitoring) were selected for inclusion in the study (Fig. 1). A nonoverlapping subset of Leadership (n = 35) and SMU (n = 10) survey questions related to safety culture were also identified. Clinical members of the project team independently reviewed and mapped medication process survey questions to 1 of 9 NQF indicators of safe medication practices. Assignment was based on face validity and best fit with the intent of the NQF indicator. Social science team members mapped culture‐related survey questions to the NQF indicator create a health care culture of safety using the 5 domains of safety culture.5
Grouping Similar Questions
A Pearson correlation matrix was used to confirm the factor analysis and determine if multiple questions related to a single safe practice could be reduced to 1 composite measure. If analysis supported the use of a composite score, responses to similar questions at the hospital level were averaged, and the hospital's final average was the measure used for analyses. Finally, the project team reviewed the a priori mapping along with the results of the correlation and factor analyses and reached consensus on the final number and mapping scheme of survey questions to NQF safe practices. Of the original 45 culture‐of‐safety questions, 21 were used for this analysis, and of the original 57 safe medication process questions, 32 were used.
Data Analysis
Bivariate analyses using SPSS software were conducted to examine the association between hospital structural characteristics (urban or rural location, network affiliation, academic affiliation, bed size) and adoption of each NQF safe practice.
RESULTS
Medication Safety
Table 2 shows the overall rate of adoption by all hospitals of the safe practices related to medication use. Full implementation was defined as implementation in greater than 90% of the organization. There has been almost universal adoption of 3 safe practices: processes to standardize labeling and storage of medications (133 of 147, 90.5%), identification of high‐alert medications (119 of 147, 81.0%), and use of unit doses when appropriate (119 of 147, 81.0%). CPOE systems, on the other hand, had been implemented in fewer than 3% (4 of 147) of the hospitals by early 2004. The remaining 5 medication practices showed intermediate adoption (between 48.3% and 69.7%): ensuring information transfer, minimizing verbal orders, providing clean workspaces with minimal distractions, availability of consultant pharmacists, and minimizing abbreviations.
| NQF Safe Practice | Proportion of Hospitals Reporting > 90% Implementation | Association with Hospital Structural Characteristics* |
|---|---|---|
| ||
| #5 Consultant pharmacists | 52.0% | More likely in mid‐size hospitals |
| #6 Verbal orders | 63.3% | None |
| #7 Abbreviations | 48.3% | None |
| #9 Information transfer | 69.7% | None |
| #12 CPOE adoption | 2.7% | None |
| #27 Clean workspaces | 53.7% | Less likely in large hospitals |
| #28 Labeling and storage | 90.5% | None |
| #29 High‐alert medications | 81.0% | None |
| #30 Unit dosing | 81.0% | More likely in for‐profit hospitals |
Variation in Adoption by Hospital Characteristics
There was only limited variation in adoption by hospital characteristics as summarized in Table 2 and discussed in more detail below. For‐profit hospitals were most likely to have a unit dose medication distribution system in place (93.1% vs. 78.2%, P = .037). For‐profit hospitals were also more likely (83.1% vs. 58.4%, P = .004) to have fully implemented a policy to read back verbal orders. The likelihood of adopting a policy to eliminate verbal orders did not vary significantly by hospital characteristics. The prevalence of distractions was also seen as a problem for writing orders and medication administration, with the largest hospitals more frequently reporting this challenge (59.2% vs. 29.6%, P = .005). Midsize hospitals (100299 beds) were more likely than larger or smaller hospitals to report that a pharmacist reviewed and approved all nonemergency orders prior to dispensing. (76.3% vs. 45.0%, P = .001).
Barriers to Adoption of Medication Safe Practices
Ensuring that new prescribers had access to all currently prescribed medications, including both dose and frequency was a challenge for many hospitals. More than 30% of hospitals (45 of 147) did not have this capability consistently throughout the institution, and that capability did not vary by hospital size or geographic location. Although most hospitals (93 of 147, 63.3%) had a read‐back policy for verbal orders, only 36.1% of hospitals (53 of 147) had fully implemented a policy to eliminate or minimize the use of verbal orders. Two aspects of the medication preparation environment also appeared to be problematic for the surveyed hospitals: appropriate space for medication preparation and a distraction‐free environment. Only half the hospitals (74 of 147) reported that medications were prepared in an environment that minimized distractions, and 53.7% (79 of 147) reported that pharmacists were provided with sufficient space. Although more than 90% of hospitals reported that pharmacists were available for consultation even when the pharmacy was closed, fewer than half the hospitals (71 of 147, 48.3%) reported that pharmacists were involved on patient care units as a resource for clinical decision support. There also were gaps in the patient information available when preparing medications, in particular, pregnancy status (82 of 147, 55.8%) and medications prescribed before hospitalization (85 of 147, 57.8%). Fewer than half the hospitals (67 of 147, 45.5%) had fully implemented a policy to minimize use of dangerous abbreviations. Most hospitals (91 of 147, 61.9%), however, did report that they had methods in place to proactively review processes for communicating medication orders and then redesign if appropriate.
Safety Culture
Table 3 shows the self‐reported adoption of safety culture as defined by the Hospital Patient Safety Culture Survey5 domains. Hospital safety culture was highest in several areas related to nonpunitive policies. For example, the vast majority of hospitals reported that no disciplinary actions were taken against employees for nonmalicious errors, that a formal hospital‐wide nonpunitive policy for staff and employees was in place, and that the hospital had a user‐friendly and confidential error‐reporting system in place. A smaller proportion of hospitals (75 of 147, 51.0%) provided specific resources to support employees involved in error or sponsor unit visits by senior management to promote blame‐free discussion and reporting of errors (64 of 147, 43.5%). For‐profit hospitals (63.3% vs. 38.5%, P = .014) and small hospitals (49.2% vs. 18.5%, P = .004) were more likely to have unit visits by senior management. An even smaller minority of hospitals reported having used dedicated observers to catch errors as they occur (32 of 147, 21.8%) or that they provided direct incentives to caregivers for reporting errors (31 of 147, 21.1%).
| Safety of Culture Category | Specific Attribute | Overall Adoption | Association with Hospital Structural Characteristics* |
|---|---|---|---|
| |||
| Communication | Safety alert process | 59.9% | None |
| Frequency of reporting | Confidential error reporting system | 70.1% | None |
| Non‐punitive environment | Nonpunitive policies | 76.2% | None |
| Employee resources | 51.0% | None | |
| Unit visits | 43.5% | Unit visits more likely in small hospitals and for‐profit hospitals | |
| Organizational learning | Annual safety plans | 76.7% | None |
| Teams analyze errors | 72.1% | None | |
| Data analysis guides QI | 69.4% | Using data analysis to guide QI initiatives less likely in large hospitals | |
| Proactive evaluations before implementation | 44.9% | None | |
| Piloting processes | 42.9% | None | |
| Staffing | Adequate staffing ratios | 72.8% | None |
| Limited work hours | 57.6% | Limiting staff work hours less likely in large hospitals | |
In regard to organizational policies, three‐fourths of hospitals did have a patient safety plan that was reviewed annually by senior leadership. Most hospitals (106 of 147, 72.1%) used multidisciplinary teams to regularly analyze errors after they occurred and to identify possible system changes with no significant differences in adoption rates across hospital types. Most hospitals (102 of 147, 69.4%) also used data analysis to drive patient safety quality improvement efforts. Surprisingly, this was least common in the largest hospitals (48.1% vs. 74.2%, P = .008). Overall, hospitals were much less likely to have adopted the use of proactive techniques such as failure modes and effects analysis (FMEA) before implementation of major system changes or the piloting of new processes prior to implementation. Adoption rates for these activities were below 50% for all hospital demographic groups.
In terms of strategies for maintaining safe staffing levels, most hospitals reported they maintained safe staffing through adequate staffing ratios (107 of 147, 72.8%), whereas a smaller number (84 of 147, 57.1%) reported maintaining safe staffing by limiting work hours. Large hospitals were the least likely to limit work hours (33.3% vs. 63.2%, P = .005).
DISCUSSION
This is the first study to use existing data sources to characterize the current progress and barriers to further adoption of NQF safe practices and safety culture related to medication use in a statewide sample of hospitals. Several findings are notable. First, most of the hospitals surveyed had adopted 7 of 9 medication‐related NQF safe practices by 2004. Similar to findings from the earlier ISMP Safety Self‐Assessment for Hospitals, hospitals scored most highly on practices related to drug storage, packaging, and labeling and lowest on CPOE implementation.12 Results from the 2003 Leapfrog Group Quality and Safety Survey also found that only 3.7% of participating hospitals had fully implemented a CPOE system.13 Medication safe practices that directly affect physicians, such as verbal orders, standardized abbreviations, and access to relevant clinical information when prescribing had only intermediate adoption rates.
Most hospitals have developed policies around nonpunitive safety cultures, but fewer have adopted proactive error reduction systems. Safety culture is more difficult to measure than safe medication processes. A previous survey of Iowa hospitals assessed only whether hospitals reported progress toward creating a culture of safety.14 In this study we attempted to break down the broad concept of safety culture into specific actionable components. Three widely recognized components of a safe hospital culture are creating a nonpunitive environment for staff, using data to identify and analyze errors and system causes, and safe staffing levels.8 Most but not all surveyed hospitals had adopted these safety culture strategies. Other more resource‐intensive practices, such as unit visits by senior management and FMEA, were less likely to have been adopted. The adoption rates reported here for 20032004 are in most cases higher than those found in the 2000 ISMP survey, which may be explained by the more recent survey reported here and variations in question wording as well as response scoring.
Variations in adoption rates of NQF‐recommended safe practices generally were not explained by hospital characteristics such as ownership, size, or geographic location. Instead, barriers appear to be related to resource constraints as well as the ability of hospitals to directly control the specific safe practice. The ISMP survey found that hospital demographic factors explained only 3% of the variation in adoption, which is similar to our finding of few differences in adoption of safe practices by hospital type. Cost and health care culture may explain why certain safe practices remain less than fully adopted.12 Resource constraints may explain the lower adoption rate of several practices: CPOE, pharmacist consultation, and physical environment improvements. Other safe practices with lower adoption rates require active physician participation, for example, minimizing verbal orders, standardizing abbreviations, and ensuring accurate information transfers. Hospital‐based physicians can play a key role in advocating for effective processes to promote these practices.
Another general factor that distinguished highly adopted practices from less adopted practices was the extent to which reactive as opposed to proactive actions were required. Hospitals were more likely to report reactive policies such as reading back verbal orders than proactive policies to minimize verbal orders. Pharmacists were generally available for telephone consultation but in only half the hospitals were they available on the hospital units for consultation. A similar pattern was seen for culture of safety practices; systems were generally in place for nonpunitive error reporting, but a minority of hospitals had senior leadership making unit rounds or multidisciplinary teams proactively testing new systems to identify potential errors before they occur. Again, there is a leadership role that hospital‐based physicians can play as effective team builders for safety culture and as clinical leaders for improvement of medication processes. Much research has demonstrated the impact that a culture of safety can have on error reduction.811 As physicians who spend most of their clinical time directly on patient care units, hospital‐based physicians are uniquely positioned to promote positive changes in culture. Research on the impact of hospitalists on hospital costs and patient outcomes should be broadened to include an assessment of their impact on safety culture and error reduction.
This study had several limitations, the first being that it was based on voluntarily provided self‐assessment data. The surveys used in this project have been refined and administered over 3 years in a nonpunitive process improvement program with a consistently high participation rate. The hospital‐reported survey results have not been independently verified for accuracy, similar to most of the prior research in this area. The surveys measure management's perception of safety culture and do not assess actual employee perceptions of the safety culture on their particular units. Thus, although management may believe they are implementing policies to create a nonpunitive environment, actual assessments of employees' views are needed to confirm this. Because the study was based on previously collected data, several steps were used to map the existing questions to NQF safe practices. Given the broad nature of the NQF topics, at least 1 relevant survey question was identified for each of the medication‐related safe practices. When more than 1 question was judged to be relevant, the responses were averaged. The survey was limited to adult acute care hospitals in Georgia, which may not be nationally representative, and federal and Veterans Administration hospitals were not included. However, Georgia has a relatively high proportion of smaller rural hospitals and offers interesting baseline data on similar rates of adoption of safe practices in rural and smaller hospitals compared with that in urban hospitals. Because we were using previously collected surveys, we could only look at the adoption of selected safe practices. Further work is needed to look at the adoption of other safe practices.
In summary, it is encouraging that the most studied NQF‐recommended safe practices have already been adopted by a wide range of hospitals, including rural and small hospitals. Resource constraints as well as health care culture and structure remain barriers to broader diffusion. Some barriers may be addressed by technology and improvements in physical environments, but others relate to culture and may be more challenging to address. Active physician participation in medication‐related patient safety initiatives will be key to promoting further adoption of safe practices.
In November 1999, the Institute of Medicine released its landmark report entitled To Err Is Human: Building A Safer Health System.1 The report claimed that more than 1 million people in the United States suffer from preventable medical injuries each year and that as many as 98,000 people die annually in hospitals from medical errors. Although evidence‐based methods are available to prevent adverse events, there is concern that the current lack of standardization among hospitals implementing such safe practices has the potential to both diffuse and dilute efforts to improve patient safety.
To address this issue, the National Quality Forum (NQF) in 2003 released an evidence‐based consensus report that presented 30 safe practices for better health care with a recommendation that all be universally adopted.2 The purpose of this study is to use information collected from a voluntary patient safety program in Georgia3 and an Agency for Healthcare Research and Quality (AHRQ) reporting demonstration study4 to (1) describe the current statewide adoption rates for NQF medication safe practices and safety culture (Table 1), and (2) examine if hospital adoption varies by hospital size, ownership, and rural or urban location.
| NQF Safe Practice No. | Key Word | Full Description of Safe Practice |
|---|---|---|
| ||
| 1 | Culture of safety | Create a health care culture of safety. |
| 5 | Consultant pharmacists | Pharmacists should actively participate in the medication‐use process, including, at a minimum, being available for consultation with prescribers and reviewing medication orders. |
| 6 | Verbal orders | Verbal orders should be recorded whenever possible and immediately read back to the prescriber. |
| 7 | Abbreviations | Use of standardized abbreviations and dosage designations. |
| 9 | Information transfer | Ensure that care information, especially changes in orders and new diagnostic information, is transmitted to all providers. |
| 12 | CPOE adoption | Implement a computerized prescriber order entry system |
| 27 | Clean workspaces | Keep workspaces where medications are prepared clean, orderly, well lighted, and free of clutter, distraction, and noise. |
| 28 | Labeling and storage | Standardize the methods for labeling, packaging, and storing medications. |
| 29 | High‐alert medications | Identify all high alert drugs. |
| 30 | Unit dosing | Dispense medications in unit‐dose or, when appropriate, unit‐of‐use form whenever possible. |
METHODS
Setting and Exclusions
The Partnership for Health and Accountability (PHA), a voluntary and peer‐review‐protected statewide hospital patient safety program, was established in Georgia in 2001 under the administration of the Georgia Hospital Association. All 148 nonfederal adult acute care hospitals in the state of Georgia participate in some aspect of the initiative. This represents a broad cross section of hospital types nationwide, with 55% of the hospitals having fewer than 100 beds, 25% having 100‐299 beds, and 20% having more than 300 beds. Hospitals are almost evenly divided between urban (54%) and rural (46%) locations.
Survey Instruments
One component of the PHA program focuses on safe medication use (SMU) with a goal of reducing the frequency of medication‐related errors in acute care hospitals. In 2004 all active acute care hospital members of GHA were eligible to participate in the SMU self‐assessment, and all but 1 hospital (147 of 148 hospitals, 97.3%) completed the self‐assessment survey.
The SMU self‐assessment is a 99‐item survey that addresses error reporting and event capture, the prescribing process, order processing and dispensing, medication administration and monitoring, patient involvement, policy and administration, and practitioner education and development. For each item, hospitals report on a 1‐5 scale the current status of adoption, ranging from no discussion to full implementation.
A second component of the PHA program identifies critical organizational tactics and strategies required for a culture of safety. Once every 2 years, top and midlevel managers complete a Strategies for Leadership self‐assessment. Results from this survey are disseminated to member hospitals to promote a culture of safety. Regular audioconferences are held to network and share successful intervention strategies aimed at establishing free and open communication, improving organizational learning, and promoting nonpunitive reporting of adverse events. A total of 147 hospitals (97.3%) completed the 2003 Strategies for Leadership survey.
The Strategies for Leadership self‐assessment is a 75‐item survey that addresses 7 broad categories: top leadership priorities, strategic planning, nonpunitive environment, patient and community focus, information analysis, human resources, and work environment. Hospital managers describe current status using a scale ranging from 1 (no discussion) to 5 (> 90% implementation).
Several steps were used to create the final study measures. First, the SMU and Leadership survey questions were reviewed to see if they addressed 1 of the 10 NQF indicators under study (Table 1). Quantitative analysis was then used to eliminate, collapse, and/or confirm the grouping arrangement. Given the broad and nonspecific nature of create a culture of safety, domains from the Hospital Survey on Patient Safety Culture5 were used to classify specific aspects of safety culture. For the purposes of this study, 5 of the 12 domains were used to categorize hospital responses. The domains used were (1) feedback and communication about error, (2) frequency of reporting, (3) promoting a nonpunitive environment, (4) encouraging organizational learning and continuous improvement, and (5) maintaining safe staffing.
Mapping Survey Questions to Safe Practices
A subset (n = 57) of the SMU survey questions directly related to safe medication processes (ie, prescribing, transcribing, dispensing, administration, and monitoring) were selected for inclusion in the study (Fig. 1). A nonoverlapping subset of Leadership (n = 35) and SMU (n = 10) survey questions related to safety culture were also identified. Clinical members of the project team independently reviewed and mapped medication process survey questions to 1 of 9 NQF indicators of safe medication practices. Assignment was based on face validity and best fit with the intent of the NQF indicator. Social science team members mapped culture‐related survey questions to the NQF indicator create a health care culture of safety using the 5 domains of safety culture.5
Grouping Similar Questions
A Pearson correlation matrix was used to confirm the factor analysis and determine if multiple questions related to a single safe practice could be reduced to 1 composite measure. If analysis supported the use of a composite score, responses to similar questions at the hospital level were averaged, and the hospital's final average was the measure used for analyses. Finally, the project team reviewed the a priori mapping along with the results of the correlation and factor analyses and reached consensus on the final number and mapping scheme of survey questions to NQF safe practices. Of the original 45 culture‐of‐safety questions, 21 were used for this analysis, and of the original 57 safe medication process questions, 32 were used.
Data Analysis
Bivariate analyses using SPSS software were conducted to examine the association between hospital structural characteristics (urban or rural location, network affiliation, academic affiliation, bed size) and adoption of each NQF safe practice.
RESULTS
Medication Safety
Table 2 shows the overall rate of adoption by all hospitals of the safe practices related to medication use. Full implementation was defined as implementation in greater than 90% of the organization. There has been almost universal adoption of 3 safe practices: processes to standardize labeling and storage of medications (133 of 147, 90.5%), identification of high‐alert medications (119 of 147, 81.0%), and use of unit doses when appropriate (119 of 147, 81.0%). CPOE systems, on the other hand, had been implemented in fewer than 3% (4 of 147) of the hospitals by early 2004. The remaining 5 medication practices showed intermediate adoption (between 48.3% and 69.7%): ensuring information transfer, minimizing verbal orders, providing clean workspaces with minimal distractions, availability of consultant pharmacists, and minimizing abbreviations.
| NQF Safe Practice | Proportion of Hospitals Reporting > 90% Implementation | Association with Hospital Structural Characteristics* |
|---|---|---|
| ||
| #5 Consultant pharmacists | 52.0% | More likely in mid‐size hospitals |
| #6 Verbal orders | 63.3% | None |
| #7 Abbreviations | 48.3% | None |
| #9 Information transfer | 69.7% | None |
| #12 CPOE adoption | 2.7% | None |
| #27 Clean workspaces | 53.7% | Less likely in large hospitals |
| #28 Labeling and storage | 90.5% | None |
| #29 High‐alert medications | 81.0% | None |
| #30 Unit dosing | 81.0% | More likely in for‐profit hospitals |
Variation in Adoption by Hospital Characteristics
There was only limited variation in adoption by hospital characteristics as summarized in Table 2 and discussed in more detail below. For‐profit hospitals were most likely to have a unit dose medication distribution system in place (93.1% vs. 78.2%, P = .037). For‐profit hospitals were also more likely (83.1% vs. 58.4%, P = .004) to have fully implemented a policy to read back verbal orders. The likelihood of adopting a policy to eliminate verbal orders did not vary significantly by hospital characteristics. The prevalence of distractions was also seen as a problem for writing orders and medication administration, with the largest hospitals more frequently reporting this challenge (59.2% vs. 29.6%, P = .005). Midsize hospitals (100299 beds) were more likely than larger or smaller hospitals to report that a pharmacist reviewed and approved all nonemergency orders prior to dispensing. (76.3% vs. 45.0%, P = .001).
Barriers to Adoption of Medication Safe Practices
Ensuring that new prescribers had access to all currently prescribed medications, including both dose and frequency was a challenge for many hospitals. More than 30% of hospitals (45 of 147) did not have this capability consistently throughout the institution, and that capability did not vary by hospital size or geographic location. Although most hospitals (93 of 147, 63.3%) had a read‐back policy for verbal orders, only 36.1% of hospitals (53 of 147) had fully implemented a policy to eliminate or minimize the use of verbal orders. Two aspects of the medication preparation environment also appeared to be problematic for the surveyed hospitals: appropriate space for medication preparation and a distraction‐free environment. Only half the hospitals (74 of 147) reported that medications were prepared in an environment that minimized distractions, and 53.7% (79 of 147) reported that pharmacists were provided with sufficient space. Although more than 90% of hospitals reported that pharmacists were available for consultation even when the pharmacy was closed, fewer than half the hospitals (71 of 147, 48.3%) reported that pharmacists were involved on patient care units as a resource for clinical decision support. There also were gaps in the patient information available when preparing medications, in particular, pregnancy status (82 of 147, 55.8%) and medications prescribed before hospitalization (85 of 147, 57.8%). Fewer than half the hospitals (67 of 147, 45.5%) had fully implemented a policy to minimize use of dangerous abbreviations. Most hospitals (91 of 147, 61.9%), however, did report that they had methods in place to proactively review processes for communicating medication orders and then redesign if appropriate.
Safety Culture
Table 3 shows the self‐reported adoption of safety culture as defined by the Hospital Patient Safety Culture Survey5 domains. Hospital safety culture was highest in several areas related to nonpunitive policies. For example, the vast majority of hospitals reported that no disciplinary actions were taken against employees for nonmalicious errors, that a formal hospital‐wide nonpunitive policy for staff and employees was in place, and that the hospital had a user‐friendly and confidential error‐reporting system in place. A smaller proportion of hospitals (75 of 147, 51.0%) provided specific resources to support employees involved in error or sponsor unit visits by senior management to promote blame‐free discussion and reporting of errors (64 of 147, 43.5%). For‐profit hospitals (63.3% vs. 38.5%, P = .014) and small hospitals (49.2% vs. 18.5%, P = .004) were more likely to have unit visits by senior management. An even smaller minority of hospitals reported having used dedicated observers to catch errors as they occur (32 of 147, 21.8%) or that they provided direct incentives to caregivers for reporting errors (31 of 147, 21.1%).
| Safety of Culture Category | Specific Attribute | Overall Adoption | Association with Hospital Structural Characteristics* |
|---|---|---|---|
| |||
| Communication | Safety alert process | 59.9% | None |
| Frequency of reporting | Confidential error reporting system | 70.1% | None |
| Non‐punitive environment | Nonpunitive policies | 76.2% | None |
| Employee resources | 51.0% | None | |
| Unit visits | 43.5% | Unit visits more likely in small hospitals and for‐profit hospitals | |
| Organizational learning | Annual safety plans | 76.7% | None |
| Teams analyze errors | 72.1% | None | |
| Data analysis guides QI | 69.4% | Using data analysis to guide QI initiatives less likely in large hospitals | |
| Proactive evaluations before implementation | 44.9% | None | |
| Piloting processes | 42.9% | None | |
| Staffing | Adequate staffing ratios | 72.8% | None |
| Limited work hours | 57.6% | Limiting staff work hours less likely in large hospitals | |
In regard to organizational policies, three‐fourths of hospitals did have a patient safety plan that was reviewed annually by senior leadership. Most hospitals (106 of 147, 72.1%) used multidisciplinary teams to regularly analyze errors after they occurred and to identify possible system changes with no significant differences in adoption rates across hospital types. Most hospitals (102 of 147, 69.4%) also used data analysis to drive patient safety quality improvement efforts. Surprisingly, this was least common in the largest hospitals (48.1% vs. 74.2%, P = .008). Overall, hospitals were much less likely to have adopted the use of proactive techniques such as failure modes and effects analysis (FMEA) before implementation of major system changes or the piloting of new processes prior to implementation. Adoption rates for these activities were below 50% for all hospital demographic groups.
In terms of strategies for maintaining safe staffing levels, most hospitals reported they maintained safe staffing through adequate staffing ratios (107 of 147, 72.8%), whereas a smaller number (84 of 147, 57.1%) reported maintaining safe staffing by limiting work hours. Large hospitals were the least likely to limit work hours (33.3% vs. 63.2%, P = .005).
DISCUSSION
This is the first study to use existing data sources to characterize the current progress and barriers to further adoption of NQF safe practices and safety culture related to medication use in a statewide sample of hospitals. Several findings are notable. First, most of the hospitals surveyed had adopted 7 of 9 medication‐related NQF safe practices by 2004. Similar to findings from the earlier ISMP Safety Self‐Assessment for Hospitals, hospitals scored most highly on practices related to drug storage, packaging, and labeling and lowest on CPOE implementation.12 Results from the 2003 Leapfrog Group Quality and Safety Survey also found that only 3.7% of participating hospitals had fully implemented a CPOE system.13 Medication safe practices that directly affect physicians, such as verbal orders, standardized abbreviations, and access to relevant clinical information when prescribing had only intermediate adoption rates.
Most hospitals have developed policies around nonpunitive safety cultures, but fewer have adopted proactive error reduction systems. Safety culture is more difficult to measure than safe medication processes. A previous survey of Iowa hospitals assessed only whether hospitals reported progress toward creating a culture of safety.14 In this study we attempted to break down the broad concept of safety culture into specific actionable components. Three widely recognized components of a safe hospital culture are creating a nonpunitive environment for staff, using data to identify and analyze errors and system causes, and safe staffing levels.8 Most but not all surveyed hospitals had adopted these safety culture strategies. Other more resource‐intensive practices, such as unit visits by senior management and FMEA, were less likely to have been adopted. The adoption rates reported here for 20032004 are in most cases higher than those found in the 2000 ISMP survey, which may be explained by the more recent survey reported here and variations in question wording as well as response scoring.
Variations in adoption rates of NQF‐recommended safe practices generally were not explained by hospital characteristics such as ownership, size, or geographic location. Instead, barriers appear to be related to resource constraints as well as the ability of hospitals to directly control the specific safe practice. The ISMP survey found that hospital demographic factors explained only 3% of the variation in adoption, which is similar to our finding of few differences in adoption of safe practices by hospital type. Cost and health care culture may explain why certain safe practices remain less than fully adopted.12 Resource constraints may explain the lower adoption rate of several practices: CPOE, pharmacist consultation, and physical environment improvements. Other safe practices with lower adoption rates require active physician participation, for example, minimizing verbal orders, standardizing abbreviations, and ensuring accurate information transfers. Hospital‐based physicians can play a key role in advocating for effective processes to promote these practices.
Another general factor that distinguished highly adopted practices from less adopted practices was the extent to which reactive as opposed to proactive actions were required. Hospitals were more likely to report reactive policies such as reading back verbal orders than proactive policies to minimize verbal orders. Pharmacists were generally available for telephone consultation but in only half the hospitals were they available on the hospital units for consultation. A similar pattern was seen for culture of safety practices; systems were generally in place for nonpunitive error reporting, but a minority of hospitals had senior leadership making unit rounds or multidisciplinary teams proactively testing new systems to identify potential errors before they occur. Again, there is a leadership role that hospital‐based physicians can play as effective team builders for safety culture and as clinical leaders for improvement of medication processes. Much research has demonstrated the impact that a culture of safety can have on error reduction.811 As physicians who spend most of their clinical time directly on patient care units, hospital‐based physicians are uniquely positioned to promote positive changes in culture. Research on the impact of hospitalists on hospital costs and patient outcomes should be broadened to include an assessment of their impact on safety culture and error reduction.
This study had several limitations, the first being that it was based on voluntarily provided self‐assessment data. The surveys used in this project have been refined and administered over 3 years in a nonpunitive process improvement program with a consistently high participation rate. The hospital‐reported survey results have not been independently verified for accuracy, similar to most of the prior research in this area. The surveys measure management's perception of safety culture and do not assess actual employee perceptions of the safety culture on their particular units. Thus, although management may believe they are implementing policies to create a nonpunitive environment, actual assessments of employees' views are needed to confirm this. Because the study was based on previously collected data, several steps were used to map the existing questions to NQF safe practices. Given the broad nature of the NQF topics, at least 1 relevant survey question was identified for each of the medication‐related safe practices. When more than 1 question was judged to be relevant, the responses were averaged. The survey was limited to adult acute care hospitals in Georgia, which may not be nationally representative, and federal and Veterans Administration hospitals were not included. However, Georgia has a relatively high proportion of smaller rural hospitals and offers interesting baseline data on similar rates of adoption of safe practices in rural and smaller hospitals compared with that in urban hospitals. Because we were using previously collected surveys, we could only look at the adoption of selected safe practices. Further work is needed to look at the adoption of other safe practices.
In summary, it is encouraging that the most studied NQF‐recommended safe practices have already been adopted by a wide range of hospitals, including rural and small hospitals. Resource constraints as well as health care culture and structure remain barriers to broader diffusion. Some barriers may be addressed by technology and improvements in physical environments, but others relate to culture and may be more challenging to address. Active physician participation in medication‐related patient safety initiatives will be key to promoting further adoption of safe practices.
- Kohn LT,Corrigan JM, andDonaldson MS, eds.To Err Is Human: Building a Safer Health System: A Report from the Committee on Quality of Healthcare in America.Institute of Medicine,National Academy of Sciences.Washington, DC:National Academy Press,1999.
- The National Quality Forum.Safe practices for better healthcare: a consensus report. NQF publication no. NQFCR‐05‐03;2003.
- Georgia Hospital Association. Available at: http://www.gha.org.
- ,,.Voluntary hospital coalitions to promote patient safety: why, how and can they work? In:Advances in Patient Safety: From Research to Implementation.Rockville, MD:AHRQ;2005.
- Agency for Healthcare Research and Quality (AHRQ).The Hospital Survey on Patient Safety Toolkit 2004. Sponsored by the Medical Errors Workgroup of the Quality Interagency Coordination Task Force (QuIC), developed by Westat.Rockville, MD:AHRQ;2004.
- Vaughan, Diane.1996.The Challenger launch decision: risky technology, culture, and deviance at NASA.Chicago:University of Chicago Press.
- ,,,,,.Overcoming barriers to adopting and implementing computerized physician order entry systems in U.S. hospitals.Health Aff.2004;23(4):184–190.
- ,.Safety culture assessment: a tool for improving patient safety in healthcare organizations.Qual Saf in Health Care.2003;12(suppl. 2):17–23.
- ,,.Error, stress, and teamwork in medicine and aviation: cross‐sectional surveys.Hum Perf Extrem Environ.2001;6:6–11.
- ,,,.Using a multihospital survey to examine the safety culture.Jt Comm J Qual Saf.2004;30:125–32.
- ,,,.A review of the literature examining linkages between organizational factors, medical errors, and patient safety.Med Care Res Rev.2004;61:3–37.
- ,,,,,.Findings from the ISMP medication safety self‐assessment for hospitals.Jt Comm J Qual Saf.2003;29:586–597.
- ,.Hospital implementation of computerized provider order entry systems: results from the 2003 Leapfrog Group Quality and Safety Survey.J Healthc Inf Manag.2005;19(4):55–65.
- ,,,,.National Quality Forum 30 safe practices: priority and progress in Iowa hospitals.Am J Med Qual.2006;21:101–108.
- Kohn LT,Corrigan JM, andDonaldson MS, eds.To Err Is Human: Building a Safer Health System: A Report from the Committee on Quality of Healthcare in America.Institute of Medicine,National Academy of Sciences.Washington, DC:National Academy Press,1999.
- The National Quality Forum.Safe practices for better healthcare: a consensus report. NQF publication no. NQFCR‐05‐03;2003.
- Georgia Hospital Association. Available at: http://www.gha.org.
- ,,.Voluntary hospital coalitions to promote patient safety: why, how and can they work? In:Advances in Patient Safety: From Research to Implementation.Rockville, MD:AHRQ;2005.
- Agency for Healthcare Research and Quality (AHRQ).The Hospital Survey on Patient Safety Toolkit 2004. Sponsored by the Medical Errors Workgroup of the Quality Interagency Coordination Task Force (QuIC), developed by Westat.Rockville, MD:AHRQ;2004.
- Vaughan, Diane.1996.The Challenger launch decision: risky technology, culture, and deviance at NASA.Chicago:University of Chicago Press.
- ,,,,,.Overcoming barriers to adopting and implementing computerized physician order entry systems in U.S. hospitals.Health Aff.2004;23(4):184–190.
- ,.Safety culture assessment: a tool for improving patient safety in healthcare organizations.Qual Saf in Health Care.2003;12(suppl. 2):17–23.
- ,,.Error, stress, and teamwork in medicine and aviation: cross‐sectional surveys.Hum Perf Extrem Environ.2001;6:6–11.
- ,,,.Using a multihospital survey to examine the safety culture.Jt Comm J Qual Saf.2004;30:125–32.
- ,,,.A review of the literature examining linkages between organizational factors, medical errors, and patient safety.Med Care Res Rev.2004;61:3–37.
- ,,,,,.Findings from the ISMP medication safety self‐assessment for hospitals.Jt Comm J Qual Saf.2003;29:586–597.
- ,.Hospital implementation of computerized provider order entry systems: results from the 2003 Leapfrog Group Quality and Safety Survey.J Healthc Inf Manag.2005;19(4):55–65.
- ,,,,.National Quality Forum 30 safe practices: priority and progress in Iowa hospitals.Am J Med Qual.2006;21:101–108.
Copyright © 2007 Society of Hospital Medicine
Hospitalists and Hip Fractures
Because the incidence of hip fracture increases dramatically with age and the elderly are the fastest‐growing portion of the United States population, the number of hip fractures is expected to triple by 2040.1 With the associated increase in postoperative morbidity and mortality, the costs will likely exceed $16‐$20 billion annually.15 Already by 2002, the number of patients with hip fractures exceeded 340,000 in this country, resulting in $8.6 billion in health care expenditures from in‐hospital and posthospital costs.68 This makes hip fracture a serious public health concern and triggers a need to devise an efficient means of caring for these patients. We previously reported that a hospitalist service can decrease time to surgery and shorten length of stay without affecting the number of inpatient deaths or 30‐day readmissions of patients undergoing hip fracture surgery.9 However, one concern with reducing length of stay and time to surgery in the high‐risk hip fracture patient population is the effect on long‐term mortality because the death rate following hip fracture repair may be as high as 43% after 1 year.10 To evaluate this important issue, we assessed mortality over a 1‐year period in the same cohort of patients previously described.9 We also identified predictors associated with mortality. We hypothesized that the expedited surgical treatment and decreased length of stay of a hospitalist‐managed group would not have an adverse effect on 1‐year mortality.
METHODS
Patient Selection
Following approval by the Mayo Clinic Institutional Review Board, we used the Mayo Clinic Surgical Index to identify patients admitted between July 1, 2000, and June 30, 2002, who matched International Classification of Diseases (9th Edition) hip fracture codes.11 These patients were cross‐referenced with those having a primary surgical indication of hip fracture. Patients transferred to our facility more than 72 hours after fracture were excluded from our study. Study patients provided authorization to use their medical records for the purposes of research.
A cohort of 466 patients was identified. For purposes of comparison, patients admitted between July 1, 2000, and June 30, 2001, were deemed to belong to the standard care service, and patients admitted between July 1, 2001, and June 30, 2002, were deemed part of the hospitalist service.
Intervention
Prior to July 2001, Mayo Clinic patients aged 65 and older having surgical repair of a hip fracture were triaged directly to a surgical orthopedic or general medical teaching service. Patients with multiple medical diagnoses were managed initially on a medical teaching service prior to transfer to the operating room. The primary team (medical or surgical) was responsible for the postoperative care of the patient and any orders or consultations required.
After July 1, 2001, these patients were admitted by the orthopedic surgery service and medically comanaged by a hospitalist service, which consisted of a hospitalist physician and 2 allied‐health practitioners. Twelve hospitalists and 12 allied health care professionals cared for patients during the study period. All preoperative and postoperative evaluations, inpatient management decisions, and coordination of outpatient care were performed by the hospitalists. This model of care is similar to one previously studied and published elsewhere.12 A census cap of 20 patients limited the number of patients managed by the hospitalist service. Any overflow of hip fracture patients was triaged directly to a non‐hospitalist‐based primary medical or surgical service as before. Thus, 23 hip fracture patients (10%) admitted after July 1, 2001, were not managed by the hospitalists but are included in this group for an intent‐to‐treat analysis.
Data Collection
Study nurses abstracted all data including admitting diagnoses, demographic features, type and mechanism of hip fracture, admission date and time, American Society of Anesthesia (ASA) class, comorbid medical conditions, medications, all clinical data, and readmission rates. Date of last follow‐up was confirmed using the Mayo Clinic medical record, whereas date and cause of death were obtained from death certificates obtained from state and national sources. Length of stay was defined as the number of days between admission and discharge. Time to surgery was defined in hours as the time from hospital admission to the start of the surgery. Finally, time from surgery to dismissal was defined as the number of days from the initiation of the surgical procedure to the time of dismissal. Thirty‐day readmission was defined as readmission to our hospital within 30 days of discharge date.
Statistical Considerations
Power
The power analysis was based on the end point of survival following surgical repair of hip fracture and primary comparison of patients in the standard care group with those in the hospitalist group. With 236 patients in the standard care group, 230 in the hospitalist group, and 274 observed deaths during the follow‐up period, there was 80% power to detect a hazard ratio of 1.4 or greater as being statistically significant (alpha = 0.05, beta = 0.2).
Analysis
The analysis focused on the end point of survival following surgical repair of hip fracture. In addition to the hospitalist versus standard care service, demographic, baseline clinical, and in‐hospital data were evaluated as potential predictors of survival. Survival rates were estimated using the method of Kaplan and Meier, and relative differences in survival were evaluated using the Cox proportional hazards regression models.13, 14 Potential predictors were analyzed both univariately and in a multivariable model. For the multivariable model, initial variable selection was accomplished using stepwise selection, backward elimination, and recursive partitioning.15 Each method yielded similar results. Bootstrap resampling was then used to confirm the variables selected for each model.16, 17 The threshold of statistical significance was set at P = .05 for all tests. All analyses were conducted in SAS version 8.2 (SAS Institute Inc., Cary, NC) and Splus version 6.2.1 (Insightful Corporation, Seattle, WA).
RESULTS
There were 236 patients with hip fractures (50.6%) admitted to the standard care service, and 230 patients (49.4%) admitted to the hospitalist service. As shown in Table 1, the baseline characteristics of the patients admitted to the 2 services did not differ significantly except that a greater proportion of patients with hypoxia were admitted to the hospitalist service (11.3% vs. 5.5%; P = .02). However, time to surgery, postsurgery stay, and overall length of hospitalization of the hospitalist‐treated patients were all significantly shorter.
| Patient characteristic | Standard care n = 236 | Hospitalist care n = 230 | P value | ||
|---|---|---|---|---|---|
| |||||
| Age (years) | 82 | 83 | .34 | ||
| Female sex | 171 | 72.5% | 163 | 70.9% | .70 |
| Comorbidity | |||||
| Coronary artery disease | 69 | 29.2% | 77 | 33.5% | .32 |
| Congestive heart failure | 41 | 17.4% | 49 | 21.3% | .28 |
| Chronic obstructive pulmonary disease | 36 | 15.3% | 38 | 16.5% | .71 |
| Cerebral vascular accident or transient ischemic attack | 36 | 15.3% | 50 | 21.7% | .07 |
| Dementia | 54 | 22.9% | 62 | 27.0% | .31 |
| Diabetes | 45 | 19.1% | 46 | 20.0% | .80 |
| Renal insufficiency | 17 | 7.2% | 17 | 7.4% | .94 |
| Residence at time of admission | .07 | ||||
| Home | 149 | 63.1% | 138 | 60.0% | |
| Assisted living | 32 | 13.6% | 42 | 18.3% | |
| Nursing home | 55 | 23.3% | 50 | 21.7% | |
| Ambulatory status at time of admission | .14 | ||||
| Independent | 114 | 48.3% | 89 | 38.7% | |
| Assistive device | 99 | 41.9% | 115 | 50.0% | |
| Personal help | 9 | 3.8% | 16 | 7.0% | |
| Transfer to bed or chair | 9 | 3.8% | 7 | 3.0% | |
| Nonambulatory | 5 | 2.1% | 3 | 1.3% | |
| Signs at time of admission | |||||
| Hypotension | 4 | 1.7% | 3 | 1.3% | > .99 |
| Hypoxia | 13 | 5.5% | 26 | 11.3% | .02 |
| Pulmonary edema | 37 | 15.7% | 29 | 12.6% | .34 |
| Tachycardia | 19 | 8.1% | 25 | 10.9% | .3 |
| Fracture type | .78 | ||||
| Femoral neck | 118 | 50.0% | 118 | 51.3% | |
| Intertrochanteric | 118 | 50.0% | 112 | 48.7% | |
| Mechanism of fracture | .82 | ||||
| Fall | 219 | 92.8% | 212 | 92.2% | |
| Trauma | 1 | 0.4% | 3 | 1.3% | |
| Pathologic | 7 | 3.0% | 6 | 2.6% | |
| Unknown | 9 | 3.8% | 7 | 3.0% | |
| ASA* class | .38 | ||||
| I or II | 33 | 14.0% | 23 | 10.0% | |
| III | 166 | 70.3% | 166 | 72.2% | |
| IV | 37 | 15.7% | 41 | 17.8% | |
| Location discharged to | .07 | ||||
| Home or assisted living | 24 | 10.5% | 13 | 5.9% | |
| Nursing home | 196 | 86.0% | 192 | 87.3% | |
| Another hospital or hospice | 8 | 3.5% | 15 | 6.8% | |
| Time to surgery (hours) | 38 | 25 | .001 | ||
| Time from surgery to discharge (days) | 9 | 7 | .04 | ||
| Length of stay | 10.6 | 8.4 | < .00 | ||
| Readmission rate | 25 | 10.6% | 20 | 8.7% | .49 |
Patients were followed for a median of 4.0 years (range 5 days to 5.6 years), and 192 patients were still alive at the end of follow‐up (April 2006). As illustrated in Figure 1, survival did not differ between the 2 treatment groups (P = .36). Overall survival at 1 year was 70.6% (95% confidence interval [CI]: 66.5%, 74.9%). Survival at 1 year in the standard care group was 70.6% (95% CI: 64.9%, 76.8%), whereas in the hospitalist group, it was 70.5% (95% CI: 64.8%, 76.7%). As delineated in Table 2, cardiovascular causes accounted for 34 deaths (25.6%), with 14 of these in the standard care group and 20 in the hospitalist group; 29 deaths (21.8%) had respiratory causes, 20 in the standard care group and 9 in the hospitalist group; and 17 (12.8%) were due to cancer, with 7 and 10 in the standard care and hospitalist groups, respectively. Unknown causes accounted for 21 cases, or 15.8% of total deaths.
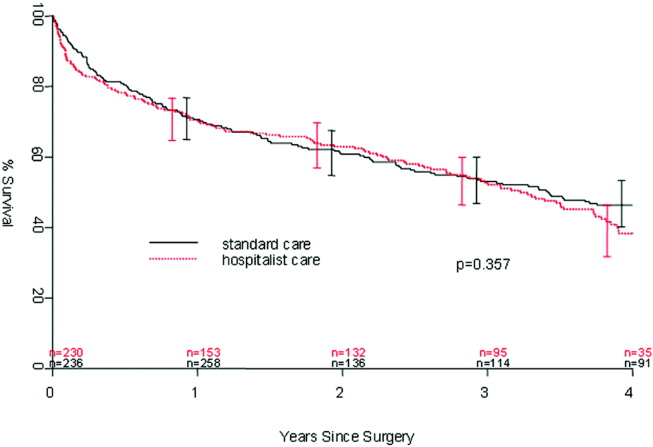
| Standard care | Hospitalist care | Total No. of deaths | % | |
|---|---|---|---|---|
| Cancer | 7 | 10 | 17 | 12.8% |
| Cardiovascular | 14 | 20 | 34 | 25.6% |
| Infectious | 5 | 4 | 9 | 6.8% |
| Neurological | 5 | 10 | 15 | 11.3% |
| Other | 0 | 2 | 2 | 1.5% |
| Renal | 4 | 2 | 6 | 4.5% |
| Respiratory | 20 | 9 | 29 | 21.8% |
| Unknown | 11 | 10 | 21 | 15.8% |
| Total | 66 | 67 | 133 | 100.0% |
In the univariate analysis, we found 29 variables that were significant predictors of survival (Table 3). A hospitalist model of care was not significantly associated with patient survival, despite the shorter length of stay (8.4 days vs. 10.6 days; P < .001) or expedited time to surgery (25 vs. 38 hours; P < .001), when compared with the standard care group, as previously reported by Phy et al.9 In the multivariable analysis (Table 4), however, the independent predictors of mortality were ASA class III or IV versus class II (hazard ratio [HR] 4.20; 95% CI: 2.21, 7.99), admission from a nursing home versus from home or assisted living (HR 2.24; 95% CI: 1.73, 2.90), and inpatient complications, which included patients requiring admission to the intensive care unit (ICU) and those who had a myocardial infarction or acute renal failure as an inpatient (HR 1.85; 95% CI: 1.45, 2.35). Even after adjusting for these factors, survival following hip fracture did not differ significantly between the hospitalist care patients and the standard care patients (HR 1.16; 95% CI: 0.91, 1.48).
| Variable | Hazard ratio (95% CI) | P value |
|---|---|---|
| ||
| Age on admission per 10 years | 1.41 (1.20, 1.65) | < .001 |
| ASA* II | 1.0 (referent) | |
| ASA* III | 5.27 (2.79, 9.96) | < .001 |
| ASA* IV | 11.7 (5.97, 22.9) | < .001 |
| History of chronic obstructive pulmonary disease | 1.82 (1.35, 2.43) | < .001 |
| History of renal insufficiency | 2.40 (1.62,3.55) | < .001 |
| History of stroke/transient ischemic attack | 1.46 (1.10, 1.95) | .01 |
| History of diabetes | 1.70 (1.29,2.25) | < .001 |
| History of congestive heart failure | 2.26 (1.73, 2.96) | < .001 |
| History of coronary artery disease | 1.53 (1.20, 1.97) | < .001 |
| History of dementia | 2.02 (1.57, 2.59) | < .001 |
| Admission from home | 1.0 (referent) | |
| Admission from assisted living | 1.47 (1.06, 2.04) | .02 |
| Admission from nursing home | 3.04 (2.33, 3.98) | < .001 |
| Independent | 1.0 (referent) | |
| Use of assistive device | 1.81 (1.39, 2.36) | < .001 |
| Personal help | 3.49 (2.16, 5.64) | < .001 |
| Nonambulatory | 3.96 (2.47, 6.35) | < .001 |
| Crackles on admission | 2.03 (1.50, 2.74) | < .001 |
| Hypoxia on admission | 1.56 (1.04, 2.32) | .03 |
| Hypotension on admission | 6.21 (2.72, 14.2) | < .001 |
| Tachycardia on admission | 1.66 (1.15, 2.41) | .007 |
| Coumadin on admission | 1.57 (1.13, 2.18) | .007 |
| Confusion/unconsciousness on admission | 2.23 (1.74, 2.87) | < .001 |
| Fever on admission | 1.98 (1.16, 3.40) | .01 |
| Tachypnea on admission | 1.95 (1.39, 2.72) | < .001 |
| Inpatient myocardial Infarction | 3.59 (2.35, 5.48) | < .001 |
| Inpatient atrial fibrillation | 2.00 (1.37, 2.92) | < .001 |
| Inpatient congestive heart failure | 2.62 (1.79, 3.84) | < .0001 |
| Inpatient delirium | 1.46 (1.13, 1.90) | < .005 |
| Inpatient lung infection | 2.52 (1.85, 3.42) | < .001 |
| Inpatient respiratory failure | 2.76 (1.64, 4.66) | < .001 |
| Inpatient mechanical ventilation | 2.56 (1.43, 4.57) | .002 |
| Inpatient renal failure | 3.60 (1.97, 6.61) | < .001 |
| Days from admission to surgery | 1.06 (1.005, 1.12) | .03 |
| Intensive care unit stay | 1.93 (1.51, 2.47) | < .001 |
| Variable | Hazard ratio (95% CI) | P value |
|---|---|---|
| ||
| Age on admission per 10 years | 1.17 (0.99, 1.38) | .07 |
| ASA* class III or IV | 4.20 (2.21, 7.99) | < .001 |
| ASA* class II | 1.0 (referent) | |
| Admission from nursing home | 2.24 (1.73, 2.90) | < .001 |
| Admission from home or assisted living | 1.0 (referent) | |
| Inpatient myocardial infarction, inpatient acute renal failure, or intensive care unit stay | 1.85 (1.45, 2.35) | < .001 |
| No inpatient myocardial infarction, no inpatient acute renal failure, and no intensive care unit stay | 1.0 (referent) | |
DISCUSSION
In our previous study, length of stay and time to surgery were significantly lower in a hospitalist care model.9 The present study shows that neither the reduced length of stay nor the shortened time to surgery of patients managed by the hospitalist group was associated with a difference in mortality compared with a standard care group, despite significantly improved efficiency and processes of care. Thus, our results refute initial concerns of increased mortality in a hospitalist model of care.
Delivery of perioperative medical care to hip fracture patients by hospitalists is associated with significant decreases in time to surgery and length of stay compared with standard care, with no differences in short‐term mortality.9, 18 Although there have been conflicting reports on the impact of length of stay and time to surgery on long‐term outcomes, our findings support previous results that decreased time to surgery was not associated with an observable effect on mortality.1923 A recent study by Orosz et al. that evaluated 1178 patients showed that earlier hip fracture surgery (performed less than 24 hours after admission) was not associated with reduced mortality, although it was associated with shorter length of stay.19 Our study also corroborates the results of an examination of 8383 hip fracture patients by Grimes et al., who found that time to surgery between 24 and 48 hours after admission had no effect on either 30‐day or long‐term mortality compared with that of those who underwent surgery between 48 and 72 hours, between 72 and 96 hours, or more than 96 hours after admission.20 However, both these results and our own are contrary to those of Gdalevich, whose study of 651 patients found that 1‐year mortality was 1.6‐fold higher for those whose hip fracture repair was postponed more than 48 hours.21 However, time to surgery in both the standard care and hospitalist model in our study was well below the 48‐hour cutoff, suggesting that operating anywhere within the normally accepted 48‐hour time frame may not influence long‐term mortality.
Because of the small number of events in both groups, we were unable to specifically compare whether a hospitalist model of care has any specific impact on long‐term cause of death. Although causes of death of patients with hip fracture were consistent with those of previous studies,10, 24 our death rate at 1 year, 29.4%, was higher than that seen among similar population groups at tertiary referral centers.19, 20, 2429 This is most likely a result of the cohort having a high proportion of nursing home patients (22%)19, 24, 26 transferred for evaluation to St. Mary's Hospital, which serves most of Olmsted County, Minnesota. This hospital also has some characteristics of a community‐based hospital, as it is where greater than 95% of all county patients receive care for surgical repair of hip fracture. Mortality rates are often higher at these types of hospitals.30 Previous studies using patients from Olmsted County indicate results can also be extrapolated to a large part of the U.S. population.31 In Pitto et al.'s study, the risk of death was 31% lower in those admitted from home than for those admitted from a nursing home.32 The latter patients normally have a higher number of comorbid conditions and tend to be less ambulatory than those in a community home‐dwelling setting. Our study also demonstrated that admission from a nursing home was a strong predictor of mortality for up to 1 year in the geriatric population. This may reflect the inherent decreased survival in this patient group, which is in agreement with the findings of other studies that showed inactivity and decreased ambulation prior to fracture were associated with increased mortality.3335
Multiple comorbidities, commonly seen in a geriatric population, translate into a higher ASA class and an increased risk of significant in‐hospital complications. Our study confirmed the findings of previous studies that a higher ASA class is a strong predictor of mortality,21, 26, 30, 3537 independent of decreased time to surgery.38 We also noted that significant in‐hospital complications, including renal failure, respiratory failure, and myocardial infarction, are documented predictors of mortality after hip fracture.27 Although mortality may vary depending on fracture type (femoral neck vs. intertrochanteric),3941 these differences were not observed in our study, in line with the results of previous published studies.37, 42 Controlling for age and comorbidities may be why an association was not found between fracture type and mortality. Finally, in a model containing comorbidity, ASA class, and nursing home residence prior to fracture, age was not a significant predictor of mortality.
Our study had a number of limitations. First, this was a retrospective cohort study based on chart review, so some data may have been subject to recording bias, and this might have differed between the serial models. Because of the retrospective nature of the study and referral of some of the patients from outside the community, our 1‐year follow‐up was not complete, but approached a respectable 93%. Other studies have described the benefits derived by a hospitalist practice only following the first year of its implementation, likely because of the hospitalist learning curve.43, 44 This may be why there was no difference in mortality between the standard care and hospitalist groups, as the latter was only in its first year of existence. Additional longitudinal study is required to find out if mortality differences emerge between the treatment groups. Furthermore, although in‐hospital care may influence short‐term outcomes, its effect on long‐term mortality has been unclear. Our data demonstrate that even though a hospitalist service can shorten length of stay and time to surgery, there were no appreciable intermediate differences in mortality at 1 year. Further prospective studies are needed to determine whether this medical‐surgical partnership in caring for these patients provides more favorable outcomes of reducing mortality and intercurrent complications.
Acknowledgements
We thank Donna K. Lawson for her assistance in data collection and management.
- ,,.The future of hip fractures in the United States. Numbers, costs, and potential effects of postmenopausal estrogen.Clin Orthop Relat Res1990 (252):163–166.
- ,,.Hip fractures in the elderly: a world‐wide projection.Osteoporos Int.1992;2:285–289.
- ,,,.The economic cost of hip fractures among elderly women. A one‐year, prospective, observational cohort study with matched‐pair analysis.Belgian Hip Fracture Study Group.J Bone Joint Surg Am.2001;83‐A:493–500.
- ,,.Estimating hip fracture morbidity, mortality and costs.J Am Geriatr Soc.2003;51:364–370.
- ,.The aging of America. Impact on health care costs.JAMA.1990;263:2335–2340.
- ,,,.Medical expenditures for the treatment of osteoporotic fractures in the United States in 1995: report from the National Osteoporosis Foundation.J Bone Miner Res.1997;12(1):24–35.
- US Department of Health and Human Services.Surveillance for selected public health indicators affecting older adults —United States.MMWR Morb Mortal Wkly Rep1999;48:33–34.
- ,.Epidemiology and outcomes of osteoporotic fractures.Lancet.2002;359:1761–1767.
- ,,, et al.Effects of a hospitalist model on elderly patients with hip fracture.Arch Intern Med.2005;165:796–801.
- ,,.Hip fractures in Finland and Great Britain—a comparison of patient characteristics and outcomes.Int Orthop.2001;25:349–354.
- WHO.International Classification of Disease, Ninth Revision (ICD‐9).Geneva, Switzerland:World Health Organization;1977.
- ,,, et al.Medical and surgical comanagement after elective hip and knee arthroplasty: a randomized, controlled trial.Ann Intern Med.2004;141(1):28–38.
- .Regression models and life‐tables (with discussion).J R Stat Soc Ser B.1972;34:187–220.
- ,.Nonparametric estimation from incomplete observations.J Am Statistical Assoc.1958;53:457–481.
- ,.An Introduction to Recursive Partitioning using the RPART Routines: Section of Biostatistics, Mayo Clinic;1997.
- .Computer Intensive Statistical Methods, Validation, Model Selection, and Bootstrap.London:Chapman and Hall;1994.
- ,.A bootstrap resampling procedure for model building: application to the Cox regression model.Stat Med.1992;11:2093–2109.
- ,,.Associations between the hospitalist model of care and quality‐of‐care‐related outcomes in patients undergoing hip fracture surgery.Mayo Clin Proc.2006;81(1):28–31.
- ,,, et al.Association of timing of surgery for hip fracture and patient outcomes.JAMA.2004;291:1738–1743.
- ,,,,.The effects of time‐to‐surgery on mortality and morbidity in patients following hip fracture.Am J Med.2002;112:702–709.
- ,,,.Morbidity and mortality after hip fracture: the impact of operative delay.Arch Orthop Trauma Surg.2004;124:334–340.
- ,,.Delay to surgery prolongs hospital stay in patients with fractures of the proximal femur.J Bone Joint Surg Br.2005;87:1123–1126.
- ,.The timing of surgery for proximal femoral fractures.J Bone Joint Surg Br.1992;74(2):203–205.
- ,,, et al.Hospital readmissions after hospital discharge for hip fracture: surgical and nonsurgical causes and effect on outcomes.J Am Geriatr Soc.2003;51:399–403.
- ,.Mortality after hip fractures.Acta Orthop Scand1979;50(2):161–167.
- ,,,,.Medical complications and outcomes after hip fracture repair.Arch Intern Med.2002;162:2053–2057.
- ,,, et al.Development and initial validation of a risk score for predicting in‐hospital and 1‐year mortality in patients with hip fractures.J Bone Miner Res.2005;20:494–500.
- ,,,,.Outcome after hip fracture in individuals ninety years of age and older.J Orthop Trauma.2001;15(1):34–39.
- ,,,.Hip fractures in the elderly: predictors of one year mortality.J Orthop Trauma.1997;11(3):162–165.
- ,,,.The effect of hospital type and surgical delay on mortality after surgery for hip fracture.J Bone Joint Surg Br.2005;87:361–366.
- .History of the Rochester Epidemiology Project.Mayo Clin Proc.1996;71:266–274.
- .The mortality and social prognosis of hip fractures. A prospective multifactorial study.Int Orthop.1994;18(2):109–113.
- ,.Functional outcome after hip fracture. A 1‐year prospective outcome study of 275 patients.Injury.2003;34:529–532.
- ,,.Rate of mortality for elderly patients after fracture of the hip in the 1980's.J Bone Joint Surg Am.1987;69:1335–1340.
- ,,,.Hip fractures in the elderly. Mortality, functional results and social readaptation.Int Surg.1989;74(3):191–194.
- ,,.Blood transfusion requirements in femoral neck fracture.Injury.2000;31(1):7–10.
- ,,.Mortality and causes of death after hip fractures in The Netherlands.Neth J Med.1992;41(1–2):4–10.
- ,,.Influence of preoperative medical status and delay to surgery on death following a hip fracture.ANZ J Surg.2002;72:405–407.
- ,,,Predictors of mortality and institutionalization after hip fracture: the New Haven EPESE cohort. Established Populations for Epidemiologic Studies of the Elderly.Am J Public Health.1994;84:1807–1812.
- ,,,.Mortality risk after hip fracture.J Orthop Trauma.2003;17(1):53–56.
- ,,.Thirty‐day mortality following hip arthroplasty for acute fracture.J Bone Joint Surg Am.2004;86‐A:1983–1988.
- ,,,,.Functional outcomes and mortality vary among different types of hip fractures: a function of patient characteristics.Clin Orthop Relat Res.2004:64–71.
- ,,,,,.Implementation of a voluntary hospitalist service at a community teaching hospital: improved clinical efficiency and patient outcomes.Ann Intern Med.2002;137:859–865.
- ,,, et al.Effects of physician experience on costs and outcomes on an academic general medicine service: results of a trial of hospitalists.Ann Intern Med.2002;137:866–874.
Because the incidence of hip fracture increases dramatically with age and the elderly are the fastest‐growing portion of the United States population, the number of hip fractures is expected to triple by 2040.1 With the associated increase in postoperative morbidity and mortality, the costs will likely exceed $16‐$20 billion annually.15 Already by 2002, the number of patients with hip fractures exceeded 340,000 in this country, resulting in $8.6 billion in health care expenditures from in‐hospital and posthospital costs.68 This makes hip fracture a serious public health concern and triggers a need to devise an efficient means of caring for these patients. We previously reported that a hospitalist service can decrease time to surgery and shorten length of stay without affecting the number of inpatient deaths or 30‐day readmissions of patients undergoing hip fracture surgery.9 However, one concern with reducing length of stay and time to surgery in the high‐risk hip fracture patient population is the effect on long‐term mortality because the death rate following hip fracture repair may be as high as 43% after 1 year.10 To evaluate this important issue, we assessed mortality over a 1‐year period in the same cohort of patients previously described.9 We also identified predictors associated with mortality. We hypothesized that the expedited surgical treatment and decreased length of stay of a hospitalist‐managed group would not have an adverse effect on 1‐year mortality.
METHODS
Patient Selection
Following approval by the Mayo Clinic Institutional Review Board, we used the Mayo Clinic Surgical Index to identify patients admitted between July 1, 2000, and June 30, 2002, who matched International Classification of Diseases (9th Edition) hip fracture codes.11 These patients were cross‐referenced with those having a primary surgical indication of hip fracture. Patients transferred to our facility more than 72 hours after fracture were excluded from our study. Study patients provided authorization to use their medical records for the purposes of research.
A cohort of 466 patients was identified. For purposes of comparison, patients admitted between July 1, 2000, and June 30, 2001, were deemed to belong to the standard care service, and patients admitted between July 1, 2001, and June 30, 2002, were deemed part of the hospitalist service.
Intervention
Prior to July 2001, Mayo Clinic patients aged 65 and older having surgical repair of a hip fracture were triaged directly to a surgical orthopedic or general medical teaching service. Patients with multiple medical diagnoses were managed initially on a medical teaching service prior to transfer to the operating room. The primary team (medical or surgical) was responsible for the postoperative care of the patient and any orders or consultations required.
After July 1, 2001, these patients were admitted by the orthopedic surgery service and medically comanaged by a hospitalist service, which consisted of a hospitalist physician and 2 allied‐health practitioners. Twelve hospitalists and 12 allied health care professionals cared for patients during the study period. All preoperative and postoperative evaluations, inpatient management decisions, and coordination of outpatient care were performed by the hospitalists. This model of care is similar to one previously studied and published elsewhere.12 A census cap of 20 patients limited the number of patients managed by the hospitalist service. Any overflow of hip fracture patients was triaged directly to a non‐hospitalist‐based primary medical or surgical service as before. Thus, 23 hip fracture patients (10%) admitted after July 1, 2001, were not managed by the hospitalists but are included in this group for an intent‐to‐treat analysis.
Data Collection
Study nurses abstracted all data including admitting diagnoses, demographic features, type and mechanism of hip fracture, admission date and time, American Society of Anesthesia (ASA) class, comorbid medical conditions, medications, all clinical data, and readmission rates. Date of last follow‐up was confirmed using the Mayo Clinic medical record, whereas date and cause of death were obtained from death certificates obtained from state and national sources. Length of stay was defined as the number of days between admission and discharge. Time to surgery was defined in hours as the time from hospital admission to the start of the surgery. Finally, time from surgery to dismissal was defined as the number of days from the initiation of the surgical procedure to the time of dismissal. Thirty‐day readmission was defined as readmission to our hospital within 30 days of discharge date.
Statistical Considerations
Power
The power analysis was based on the end point of survival following surgical repair of hip fracture and primary comparison of patients in the standard care group with those in the hospitalist group. With 236 patients in the standard care group, 230 in the hospitalist group, and 274 observed deaths during the follow‐up period, there was 80% power to detect a hazard ratio of 1.4 or greater as being statistically significant (alpha = 0.05, beta = 0.2).
Analysis
The analysis focused on the end point of survival following surgical repair of hip fracture. In addition to the hospitalist versus standard care service, demographic, baseline clinical, and in‐hospital data were evaluated as potential predictors of survival. Survival rates were estimated using the method of Kaplan and Meier, and relative differences in survival were evaluated using the Cox proportional hazards regression models.13, 14 Potential predictors were analyzed both univariately and in a multivariable model. For the multivariable model, initial variable selection was accomplished using stepwise selection, backward elimination, and recursive partitioning.15 Each method yielded similar results. Bootstrap resampling was then used to confirm the variables selected for each model.16, 17 The threshold of statistical significance was set at P = .05 for all tests. All analyses were conducted in SAS version 8.2 (SAS Institute Inc., Cary, NC) and Splus version 6.2.1 (Insightful Corporation, Seattle, WA).
RESULTS
There were 236 patients with hip fractures (50.6%) admitted to the standard care service, and 230 patients (49.4%) admitted to the hospitalist service. As shown in Table 1, the baseline characteristics of the patients admitted to the 2 services did not differ significantly except that a greater proportion of patients with hypoxia were admitted to the hospitalist service (11.3% vs. 5.5%; P = .02). However, time to surgery, postsurgery stay, and overall length of hospitalization of the hospitalist‐treated patients were all significantly shorter.
| Patient characteristic | Standard care n = 236 | Hospitalist care n = 230 | P value | ||
|---|---|---|---|---|---|
| |||||
| Age (years) | 82 | 83 | .34 | ||
| Female sex | 171 | 72.5% | 163 | 70.9% | .70 |
| Comorbidity | |||||
| Coronary artery disease | 69 | 29.2% | 77 | 33.5% | .32 |
| Congestive heart failure | 41 | 17.4% | 49 | 21.3% | .28 |
| Chronic obstructive pulmonary disease | 36 | 15.3% | 38 | 16.5% | .71 |
| Cerebral vascular accident or transient ischemic attack | 36 | 15.3% | 50 | 21.7% | .07 |
| Dementia | 54 | 22.9% | 62 | 27.0% | .31 |
| Diabetes | 45 | 19.1% | 46 | 20.0% | .80 |
| Renal insufficiency | 17 | 7.2% | 17 | 7.4% | .94 |
| Residence at time of admission | .07 | ||||
| Home | 149 | 63.1% | 138 | 60.0% | |
| Assisted living | 32 | 13.6% | 42 | 18.3% | |
| Nursing home | 55 | 23.3% | 50 | 21.7% | |
| Ambulatory status at time of admission | .14 | ||||
| Independent | 114 | 48.3% | 89 | 38.7% | |
| Assistive device | 99 | 41.9% | 115 | 50.0% | |
| Personal help | 9 | 3.8% | 16 | 7.0% | |
| Transfer to bed or chair | 9 | 3.8% | 7 | 3.0% | |
| Nonambulatory | 5 | 2.1% | 3 | 1.3% | |
| Signs at time of admission | |||||
| Hypotension | 4 | 1.7% | 3 | 1.3% | > .99 |
| Hypoxia | 13 | 5.5% | 26 | 11.3% | .02 |
| Pulmonary edema | 37 | 15.7% | 29 | 12.6% | .34 |
| Tachycardia | 19 | 8.1% | 25 | 10.9% | .3 |
| Fracture type | .78 | ||||
| Femoral neck | 118 | 50.0% | 118 | 51.3% | |
| Intertrochanteric | 118 | 50.0% | 112 | 48.7% | |
| Mechanism of fracture | .82 | ||||
| Fall | 219 | 92.8% | 212 | 92.2% | |
| Trauma | 1 | 0.4% | 3 | 1.3% | |
| Pathologic | 7 | 3.0% | 6 | 2.6% | |
| Unknown | 9 | 3.8% | 7 | 3.0% | |
| ASA* class | .38 | ||||
| I or II | 33 | 14.0% | 23 | 10.0% | |
| III | 166 | 70.3% | 166 | 72.2% | |
| IV | 37 | 15.7% | 41 | 17.8% | |
| Location discharged to | .07 | ||||
| Home or assisted living | 24 | 10.5% | 13 | 5.9% | |
| Nursing home | 196 | 86.0% | 192 | 87.3% | |
| Another hospital or hospice | 8 | 3.5% | 15 | 6.8% | |
| Time to surgery (hours) | 38 | 25 | .001 | ||
| Time from surgery to discharge (days) | 9 | 7 | .04 | ||
| Length of stay | 10.6 | 8.4 | < .00 | ||
| Readmission rate | 25 | 10.6% | 20 | 8.7% | .49 |
Patients were followed for a median of 4.0 years (range 5 days to 5.6 years), and 192 patients were still alive at the end of follow‐up (April 2006). As illustrated in Figure 1, survival did not differ between the 2 treatment groups (P = .36). Overall survival at 1 year was 70.6% (95% confidence interval [CI]: 66.5%, 74.9%). Survival at 1 year in the standard care group was 70.6% (95% CI: 64.9%, 76.8%), whereas in the hospitalist group, it was 70.5% (95% CI: 64.8%, 76.7%). As delineated in Table 2, cardiovascular causes accounted for 34 deaths (25.6%), with 14 of these in the standard care group and 20 in the hospitalist group; 29 deaths (21.8%) had respiratory causes, 20 in the standard care group and 9 in the hospitalist group; and 17 (12.8%) were due to cancer, with 7 and 10 in the standard care and hospitalist groups, respectively. Unknown causes accounted for 21 cases, or 15.8% of total deaths.
| Standard care | Hospitalist care | Total No. of deaths | % | |
|---|---|---|---|---|
| Cancer | 7 | 10 | 17 | 12.8% |
| Cardiovascular | 14 | 20 | 34 | 25.6% |
| Infectious | 5 | 4 | 9 | 6.8% |
| Neurological | 5 | 10 | 15 | 11.3% |
| Other | 0 | 2 | 2 | 1.5% |
| Renal | 4 | 2 | 6 | 4.5% |
| Respiratory | 20 | 9 | 29 | 21.8% |
| Unknown | 11 | 10 | 21 | 15.8% |
| Total | 66 | 67 | 133 | 100.0% |
In the univariate analysis, we found 29 variables that were significant predictors of survival (Table 3). A hospitalist model of care was not significantly associated with patient survival, despite the shorter length of stay (8.4 days vs. 10.6 days; P < .001) or expedited time to surgery (25 vs. 38 hours; P < .001), when compared with the standard care group, as previously reported by Phy et al.9 In the multivariable analysis (Table 4), however, the independent predictors of mortality were ASA class III or IV versus class II (hazard ratio [HR] 4.20; 95% CI: 2.21, 7.99), admission from a nursing home versus from home or assisted living (HR 2.24; 95% CI: 1.73, 2.90), and inpatient complications, which included patients requiring admission to the intensive care unit (ICU) and those who had a myocardial infarction or acute renal failure as an inpatient (HR 1.85; 95% CI: 1.45, 2.35). Even after adjusting for these factors, survival following hip fracture did not differ significantly between the hospitalist care patients and the standard care patients (HR 1.16; 95% CI: 0.91, 1.48).
| Variable | Hazard ratio (95% CI) | P value |
|---|---|---|
| ||
| Age on admission per 10 years | 1.41 (1.20, 1.65) | < .001 |
| ASA* II | 1.0 (referent) | |
| ASA* III | 5.27 (2.79, 9.96) | < .001 |
| ASA* IV | 11.7 (5.97, 22.9) | < .001 |
| History of chronic obstructive pulmonary disease | 1.82 (1.35, 2.43) | < .001 |
| History of renal insufficiency | 2.40 (1.62,3.55) | < .001 |
| History of stroke/transient ischemic attack | 1.46 (1.10, 1.95) | .01 |
| History of diabetes | 1.70 (1.29,2.25) | < .001 |
| History of congestive heart failure | 2.26 (1.73, 2.96) | < .001 |
| History of coronary artery disease | 1.53 (1.20, 1.97) | < .001 |
| History of dementia | 2.02 (1.57, 2.59) | < .001 |
| Admission from home | 1.0 (referent) | |
| Admission from assisted living | 1.47 (1.06, 2.04) | .02 |
| Admission from nursing home | 3.04 (2.33, 3.98) | < .001 |
| Independent | 1.0 (referent) | |
| Use of assistive device | 1.81 (1.39, 2.36) | < .001 |
| Personal help | 3.49 (2.16, 5.64) | < .001 |
| Nonambulatory | 3.96 (2.47, 6.35) | < .001 |
| Crackles on admission | 2.03 (1.50, 2.74) | < .001 |
| Hypoxia on admission | 1.56 (1.04, 2.32) | .03 |
| Hypotension on admission | 6.21 (2.72, 14.2) | < .001 |
| Tachycardia on admission | 1.66 (1.15, 2.41) | .007 |
| Coumadin on admission | 1.57 (1.13, 2.18) | .007 |
| Confusion/unconsciousness on admission | 2.23 (1.74, 2.87) | < .001 |
| Fever on admission | 1.98 (1.16, 3.40) | .01 |
| Tachypnea on admission | 1.95 (1.39, 2.72) | < .001 |
| Inpatient myocardial Infarction | 3.59 (2.35, 5.48) | < .001 |
| Inpatient atrial fibrillation | 2.00 (1.37, 2.92) | < .001 |
| Inpatient congestive heart failure | 2.62 (1.79, 3.84) | < .0001 |
| Inpatient delirium | 1.46 (1.13, 1.90) | < .005 |
| Inpatient lung infection | 2.52 (1.85, 3.42) | < .001 |
| Inpatient respiratory failure | 2.76 (1.64, 4.66) | < .001 |
| Inpatient mechanical ventilation | 2.56 (1.43, 4.57) | .002 |
| Inpatient renal failure | 3.60 (1.97, 6.61) | < .001 |
| Days from admission to surgery | 1.06 (1.005, 1.12) | .03 |
| Intensive care unit stay | 1.93 (1.51, 2.47) | < .001 |
| Variable | Hazard ratio (95% CI) | P value |
|---|---|---|
| ||
| Age on admission per 10 years | 1.17 (0.99, 1.38) | .07 |
| ASA* class III or IV | 4.20 (2.21, 7.99) | < .001 |
| ASA* class II | 1.0 (referent) | |
| Admission from nursing home | 2.24 (1.73, 2.90) | < .001 |
| Admission from home or assisted living | 1.0 (referent) | |
| Inpatient myocardial infarction, inpatient acute renal failure, or intensive care unit stay | 1.85 (1.45, 2.35) | < .001 |
| No inpatient myocardial infarction, no inpatient acute renal failure, and no intensive care unit stay | 1.0 (referent) | |
DISCUSSION
In our previous study, length of stay and time to surgery were significantly lower in a hospitalist care model.9 The present study shows that neither the reduced length of stay nor the shortened time to surgery of patients managed by the hospitalist group was associated with a difference in mortality compared with a standard care group, despite significantly improved efficiency and processes of care. Thus, our results refute initial concerns of increased mortality in a hospitalist model of care.
Delivery of perioperative medical care to hip fracture patients by hospitalists is associated with significant decreases in time to surgery and length of stay compared with standard care, with no differences in short‐term mortality.9, 18 Although there have been conflicting reports on the impact of length of stay and time to surgery on long‐term outcomes, our findings support previous results that decreased time to surgery was not associated with an observable effect on mortality.1923 A recent study by Orosz et al. that evaluated 1178 patients showed that earlier hip fracture surgery (performed less than 24 hours after admission) was not associated with reduced mortality, although it was associated with shorter length of stay.19 Our study also corroborates the results of an examination of 8383 hip fracture patients by Grimes et al., who found that time to surgery between 24 and 48 hours after admission had no effect on either 30‐day or long‐term mortality compared with that of those who underwent surgery between 48 and 72 hours, between 72 and 96 hours, or more than 96 hours after admission.20 However, both these results and our own are contrary to those of Gdalevich, whose study of 651 patients found that 1‐year mortality was 1.6‐fold higher for those whose hip fracture repair was postponed more than 48 hours.21 However, time to surgery in both the standard care and hospitalist model in our study was well below the 48‐hour cutoff, suggesting that operating anywhere within the normally accepted 48‐hour time frame may not influence long‐term mortality.
Because of the small number of events in both groups, we were unable to specifically compare whether a hospitalist model of care has any specific impact on long‐term cause of death. Although causes of death of patients with hip fracture were consistent with those of previous studies,10, 24 our death rate at 1 year, 29.4%, was higher than that seen among similar population groups at tertiary referral centers.19, 20, 2429 This is most likely a result of the cohort having a high proportion of nursing home patients (22%)19, 24, 26 transferred for evaluation to St. Mary's Hospital, which serves most of Olmsted County, Minnesota. This hospital also has some characteristics of a community‐based hospital, as it is where greater than 95% of all county patients receive care for surgical repair of hip fracture. Mortality rates are often higher at these types of hospitals.30 Previous studies using patients from Olmsted County indicate results can also be extrapolated to a large part of the U.S. population.31 In Pitto et al.'s study, the risk of death was 31% lower in those admitted from home than for those admitted from a nursing home.32 The latter patients normally have a higher number of comorbid conditions and tend to be less ambulatory than those in a community home‐dwelling setting. Our study also demonstrated that admission from a nursing home was a strong predictor of mortality for up to 1 year in the geriatric population. This may reflect the inherent decreased survival in this patient group, which is in agreement with the findings of other studies that showed inactivity and decreased ambulation prior to fracture were associated with increased mortality.3335
Multiple comorbidities, commonly seen in a geriatric population, translate into a higher ASA class and an increased risk of significant in‐hospital complications. Our study confirmed the findings of previous studies that a higher ASA class is a strong predictor of mortality,21, 26, 30, 3537 independent of decreased time to surgery.38 We also noted that significant in‐hospital complications, including renal failure, respiratory failure, and myocardial infarction, are documented predictors of mortality after hip fracture.27 Although mortality may vary depending on fracture type (femoral neck vs. intertrochanteric),3941 these differences were not observed in our study, in line with the results of previous published studies.37, 42 Controlling for age and comorbidities may be why an association was not found between fracture type and mortality. Finally, in a model containing comorbidity, ASA class, and nursing home residence prior to fracture, age was not a significant predictor of mortality.
Our study had a number of limitations. First, this was a retrospective cohort study based on chart review, so some data may have been subject to recording bias, and this might have differed between the serial models. Because of the retrospective nature of the study and referral of some of the patients from outside the community, our 1‐year follow‐up was not complete, but approached a respectable 93%. Other studies have described the benefits derived by a hospitalist practice only following the first year of its implementation, likely because of the hospitalist learning curve.43, 44 This may be why there was no difference in mortality between the standard care and hospitalist groups, as the latter was only in its first year of existence. Additional longitudinal study is required to find out if mortality differences emerge between the treatment groups. Furthermore, although in‐hospital care may influence short‐term outcomes, its effect on long‐term mortality has been unclear. Our data demonstrate that even though a hospitalist service can shorten length of stay and time to surgery, there were no appreciable intermediate differences in mortality at 1 year. Further prospective studies are needed to determine whether this medical‐surgical partnership in caring for these patients provides more favorable outcomes of reducing mortality and intercurrent complications.
Acknowledgements
We thank Donna K. Lawson for her assistance in data collection and management.
Because the incidence of hip fracture increases dramatically with age and the elderly are the fastest‐growing portion of the United States population, the number of hip fractures is expected to triple by 2040.1 With the associated increase in postoperative morbidity and mortality, the costs will likely exceed $16‐$20 billion annually.15 Already by 2002, the number of patients with hip fractures exceeded 340,000 in this country, resulting in $8.6 billion in health care expenditures from in‐hospital and posthospital costs.68 This makes hip fracture a serious public health concern and triggers a need to devise an efficient means of caring for these patients. We previously reported that a hospitalist service can decrease time to surgery and shorten length of stay without affecting the number of inpatient deaths or 30‐day readmissions of patients undergoing hip fracture surgery.9 However, one concern with reducing length of stay and time to surgery in the high‐risk hip fracture patient population is the effect on long‐term mortality because the death rate following hip fracture repair may be as high as 43% after 1 year.10 To evaluate this important issue, we assessed mortality over a 1‐year period in the same cohort of patients previously described.9 We also identified predictors associated with mortality. We hypothesized that the expedited surgical treatment and decreased length of stay of a hospitalist‐managed group would not have an adverse effect on 1‐year mortality.
METHODS
Patient Selection
Following approval by the Mayo Clinic Institutional Review Board, we used the Mayo Clinic Surgical Index to identify patients admitted between July 1, 2000, and June 30, 2002, who matched International Classification of Diseases (9th Edition) hip fracture codes.11 These patients were cross‐referenced with those having a primary surgical indication of hip fracture. Patients transferred to our facility more than 72 hours after fracture were excluded from our study. Study patients provided authorization to use their medical records for the purposes of research.
A cohort of 466 patients was identified. For purposes of comparison, patients admitted between July 1, 2000, and June 30, 2001, were deemed to belong to the standard care service, and patients admitted between July 1, 2001, and June 30, 2002, were deemed part of the hospitalist service.
Intervention
Prior to July 2001, Mayo Clinic patients aged 65 and older having surgical repair of a hip fracture were triaged directly to a surgical orthopedic or general medical teaching service. Patients with multiple medical diagnoses were managed initially on a medical teaching service prior to transfer to the operating room. The primary team (medical or surgical) was responsible for the postoperative care of the patient and any orders or consultations required.
After July 1, 2001, these patients were admitted by the orthopedic surgery service and medically comanaged by a hospitalist service, which consisted of a hospitalist physician and 2 allied‐health practitioners. Twelve hospitalists and 12 allied health care professionals cared for patients during the study period. All preoperative and postoperative evaluations, inpatient management decisions, and coordination of outpatient care were performed by the hospitalists. This model of care is similar to one previously studied and published elsewhere.12 A census cap of 20 patients limited the number of patients managed by the hospitalist service. Any overflow of hip fracture patients was triaged directly to a non‐hospitalist‐based primary medical or surgical service as before. Thus, 23 hip fracture patients (10%) admitted after July 1, 2001, were not managed by the hospitalists but are included in this group for an intent‐to‐treat analysis.
Data Collection
Study nurses abstracted all data including admitting diagnoses, demographic features, type and mechanism of hip fracture, admission date and time, American Society of Anesthesia (ASA) class, comorbid medical conditions, medications, all clinical data, and readmission rates. Date of last follow‐up was confirmed using the Mayo Clinic medical record, whereas date and cause of death were obtained from death certificates obtained from state and national sources. Length of stay was defined as the number of days between admission and discharge. Time to surgery was defined in hours as the time from hospital admission to the start of the surgery. Finally, time from surgery to dismissal was defined as the number of days from the initiation of the surgical procedure to the time of dismissal. Thirty‐day readmission was defined as readmission to our hospital within 30 days of discharge date.
Statistical Considerations
Power
The power analysis was based on the end point of survival following surgical repair of hip fracture and primary comparison of patients in the standard care group with those in the hospitalist group. With 236 patients in the standard care group, 230 in the hospitalist group, and 274 observed deaths during the follow‐up period, there was 80% power to detect a hazard ratio of 1.4 or greater as being statistically significant (alpha = 0.05, beta = 0.2).
Analysis
The analysis focused on the end point of survival following surgical repair of hip fracture. In addition to the hospitalist versus standard care service, demographic, baseline clinical, and in‐hospital data were evaluated as potential predictors of survival. Survival rates were estimated using the method of Kaplan and Meier, and relative differences in survival were evaluated using the Cox proportional hazards regression models.13, 14 Potential predictors were analyzed both univariately and in a multivariable model. For the multivariable model, initial variable selection was accomplished using stepwise selection, backward elimination, and recursive partitioning.15 Each method yielded similar results. Bootstrap resampling was then used to confirm the variables selected for each model.16, 17 The threshold of statistical significance was set at P = .05 for all tests. All analyses were conducted in SAS version 8.2 (SAS Institute Inc., Cary, NC) and Splus version 6.2.1 (Insightful Corporation, Seattle, WA).
RESULTS
There were 236 patients with hip fractures (50.6%) admitted to the standard care service, and 230 patients (49.4%) admitted to the hospitalist service. As shown in Table 1, the baseline characteristics of the patients admitted to the 2 services did not differ significantly except that a greater proportion of patients with hypoxia were admitted to the hospitalist service (11.3% vs. 5.5%; P = .02). However, time to surgery, postsurgery stay, and overall length of hospitalization of the hospitalist‐treated patients were all significantly shorter.
| Patient characteristic | Standard care n = 236 | Hospitalist care n = 230 | P value | ||
|---|---|---|---|---|---|
| |||||
| Age (years) | 82 | 83 | .34 | ||
| Female sex | 171 | 72.5% | 163 | 70.9% | .70 |
| Comorbidity | |||||
| Coronary artery disease | 69 | 29.2% | 77 | 33.5% | .32 |
| Congestive heart failure | 41 | 17.4% | 49 | 21.3% | .28 |
| Chronic obstructive pulmonary disease | 36 | 15.3% | 38 | 16.5% | .71 |
| Cerebral vascular accident or transient ischemic attack | 36 | 15.3% | 50 | 21.7% | .07 |
| Dementia | 54 | 22.9% | 62 | 27.0% | .31 |
| Diabetes | 45 | 19.1% | 46 | 20.0% | .80 |
| Renal insufficiency | 17 | 7.2% | 17 | 7.4% | .94 |
| Residence at time of admission | .07 | ||||
| Home | 149 | 63.1% | 138 | 60.0% | |
| Assisted living | 32 | 13.6% | 42 | 18.3% | |
| Nursing home | 55 | 23.3% | 50 | 21.7% | |
| Ambulatory status at time of admission | .14 | ||||
| Independent | 114 | 48.3% | 89 | 38.7% | |
| Assistive device | 99 | 41.9% | 115 | 50.0% | |
| Personal help | 9 | 3.8% | 16 | 7.0% | |
| Transfer to bed or chair | 9 | 3.8% | 7 | 3.0% | |
| Nonambulatory | 5 | 2.1% | 3 | 1.3% | |
| Signs at time of admission | |||||
| Hypotension | 4 | 1.7% | 3 | 1.3% | > .99 |
| Hypoxia | 13 | 5.5% | 26 | 11.3% | .02 |
| Pulmonary edema | 37 | 15.7% | 29 | 12.6% | .34 |
| Tachycardia | 19 | 8.1% | 25 | 10.9% | .3 |
| Fracture type | .78 | ||||
| Femoral neck | 118 | 50.0% | 118 | 51.3% | |
| Intertrochanteric | 118 | 50.0% | 112 | 48.7% | |
| Mechanism of fracture | .82 | ||||
| Fall | 219 | 92.8% | 212 | 92.2% | |
| Trauma | 1 | 0.4% | 3 | 1.3% | |
| Pathologic | 7 | 3.0% | 6 | 2.6% | |
| Unknown | 9 | 3.8% | 7 | 3.0% | |
| ASA* class | .38 | ||||
| I or II | 33 | 14.0% | 23 | 10.0% | |
| III | 166 | 70.3% | 166 | 72.2% | |
| IV | 37 | 15.7% | 41 | 17.8% | |
| Location discharged to | .07 | ||||
| Home or assisted living | 24 | 10.5% | 13 | 5.9% | |
| Nursing home | 196 | 86.0% | 192 | 87.3% | |
| Another hospital or hospice | 8 | 3.5% | 15 | 6.8% | |
| Time to surgery (hours) | 38 | 25 | .001 | ||
| Time from surgery to discharge (days) | 9 | 7 | .04 | ||
| Length of stay | 10.6 | 8.4 | < .00 | ||
| Readmission rate | 25 | 10.6% | 20 | 8.7% | .49 |
Patients were followed for a median of 4.0 years (range 5 days to 5.6 years), and 192 patients were still alive at the end of follow‐up (April 2006). As illustrated in Figure 1, survival did not differ between the 2 treatment groups (P = .36). Overall survival at 1 year was 70.6% (95% confidence interval [CI]: 66.5%, 74.9%). Survival at 1 year in the standard care group was 70.6% (95% CI: 64.9%, 76.8%), whereas in the hospitalist group, it was 70.5% (95% CI: 64.8%, 76.7%). As delineated in Table 2, cardiovascular causes accounted for 34 deaths (25.6%), with 14 of these in the standard care group and 20 in the hospitalist group; 29 deaths (21.8%) had respiratory causes, 20 in the standard care group and 9 in the hospitalist group; and 17 (12.8%) were due to cancer, with 7 and 10 in the standard care and hospitalist groups, respectively. Unknown causes accounted for 21 cases, or 15.8% of total deaths.
| Standard care | Hospitalist care | Total No. of deaths | % | |
|---|---|---|---|---|
| Cancer | 7 | 10 | 17 | 12.8% |
| Cardiovascular | 14 | 20 | 34 | 25.6% |
| Infectious | 5 | 4 | 9 | 6.8% |
| Neurological | 5 | 10 | 15 | 11.3% |
| Other | 0 | 2 | 2 | 1.5% |
| Renal | 4 | 2 | 6 | 4.5% |
| Respiratory | 20 | 9 | 29 | 21.8% |
| Unknown | 11 | 10 | 21 | 15.8% |
| Total | 66 | 67 | 133 | 100.0% |
In the univariate analysis, we found 29 variables that were significant predictors of survival (Table 3). A hospitalist model of care was not significantly associated with patient survival, despite the shorter length of stay (8.4 days vs. 10.6 days; P < .001) or expedited time to surgery (25 vs. 38 hours; P < .001), when compared with the standard care group, as previously reported by Phy et al.9 In the multivariable analysis (Table 4), however, the independent predictors of mortality were ASA class III or IV versus class II (hazard ratio [HR] 4.20; 95% CI: 2.21, 7.99), admission from a nursing home versus from home or assisted living (HR 2.24; 95% CI: 1.73, 2.90), and inpatient complications, which included patients requiring admission to the intensive care unit (ICU) and those who had a myocardial infarction or acute renal failure as an inpatient (HR 1.85; 95% CI: 1.45, 2.35). Even after adjusting for these factors, survival following hip fracture did not differ significantly between the hospitalist care patients and the standard care patients (HR 1.16; 95% CI: 0.91, 1.48).
| Variable | Hazard ratio (95% CI) | P value |
|---|---|---|
| ||
| Age on admission per 10 years | 1.41 (1.20, 1.65) | < .001 |
| ASA* II | 1.0 (referent) | |
| ASA* III | 5.27 (2.79, 9.96) | < .001 |
| ASA* IV | 11.7 (5.97, 22.9) | < .001 |
| History of chronic obstructive pulmonary disease | 1.82 (1.35, 2.43) | < .001 |
| History of renal insufficiency | 2.40 (1.62,3.55) | < .001 |
| History of stroke/transient ischemic attack | 1.46 (1.10, 1.95) | .01 |
| History of diabetes | 1.70 (1.29,2.25) | < .001 |
| History of congestive heart failure | 2.26 (1.73, 2.96) | < .001 |
| History of coronary artery disease | 1.53 (1.20, 1.97) | < .001 |
| History of dementia | 2.02 (1.57, 2.59) | < .001 |
| Admission from home | 1.0 (referent) | |
| Admission from assisted living | 1.47 (1.06, 2.04) | .02 |
| Admission from nursing home | 3.04 (2.33, 3.98) | < .001 |
| Independent | 1.0 (referent) | |
| Use of assistive device | 1.81 (1.39, 2.36) | < .001 |
| Personal help | 3.49 (2.16, 5.64) | < .001 |
| Nonambulatory | 3.96 (2.47, 6.35) | < .001 |
| Crackles on admission | 2.03 (1.50, 2.74) | < .001 |
| Hypoxia on admission | 1.56 (1.04, 2.32) | .03 |
| Hypotension on admission | 6.21 (2.72, 14.2) | < .001 |
| Tachycardia on admission | 1.66 (1.15, 2.41) | .007 |
| Coumadin on admission | 1.57 (1.13, 2.18) | .007 |
| Confusion/unconsciousness on admission | 2.23 (1.74, 2.87) | < .001 |
| Fever on admission | 1.98 (1.16, 3.40) | .01 |
| Tachypnea on admission | 1.95 (1.39, 2.72) | < .001 |
| Inpatient myocardial Infarction | 3.59 (2.35, 5.48) | < .001 |
| Inpatient atrial fibrillation | 2.00 (1.37, 2.92) | < .001 |
| Inpatient congestive heart failure | 2.62 (1.79, 3.84) | < .0001 |
| Inpatient delirium | 1.46 (1.13, 1.90) | < .005 |
| Inpatient lung infection | 2.52 (1.85, 3.42) | < .001 |
| Inpatient respiratory failure | 2.76 (1.64, 4.66) | < .001 |
| Inpatient mechanical ventilation | 2.56 (1.43, 4.57) | .002 |
| Inpatient renal failure | 3.60 (1.97, 6.61) | < .001 |
| Days from admission to surgery | 1.06 (1.005, 1.12) | .03 |
| Intensive care unit stay | 1.93 (1.51, 2.47) | < .001 |
| Variable | Hazard ratio (95% CI) | P value |
|---|---|---|
| ||
| Age on admission per 10 years | 1.17 (0.99, 1.38) | .07 |
| ASA* class III or IV | 4.20 (2.21, 7.99) | < .001 |
| ASA* class II | 1.0 (referent) | |
| Admission from nursing home | 2.24 (1.73, 2.90) | < .001 |
| Admission from home or assisted living | 1.0 (referent) | |
| Inpatient myocardial infarction, inpatient acute renal failure, or intensive care unit stay | 1.85 (1.45, 2.35) | < .001 |
| No inpatient myocardial infarction, no inpatient acute renal failure, and no intensive care unit stay | 1.0 (referent) | |
DISCUSSION
In our previous study, length of stay and time to surgery were significantly lower in a hospitalist care model.9 The present study shows that neither the reduced length of stay nor the shortened time to surgery of patients managed by the hospitalist group was associated with a difference in mortality compared with a standard care group, despite significantly improved efficiency and processes of care. Thus, our results refute initial concerns of increased mortality in a hospitalist model of care.
Delivery of perioperative medical care to hip fracture patients by hospitalists is associated with significant decreases in time to surgery and length of stay compared with standard care, with no differences in short‐term mortality.9, 18 Although there have been conflicting reports on the impact of length of stay and time to surgery on long‐term outcomes, our findings support previous results that decreased time to surgery was not associated with an observable effect on mortality.1923 A recent study by Orosz et al. that evaluated 1178 patients showed that earlier hip fracture surgery (performed less than 24 hours after admission) was not associated with reduced mortality, although it was associated with shorter length of stay.19 Our study also corroborates the results of an examination of 8383 hip fracture patients by Grimes et al., who found that time to surgery between 24 and 48 hours after admission had no effect on either 30‐day or long‐term mortality compared with that of those who underwent surgery between 48 and 72 hours, between 72 and 96 hours, or more than 96 hours after admission.20 However, both these results and our own are contrary to those of Gdalevich, whose study of 651 patients found that 1‐year mortality was 1.6‐fold higher for those whose hip fracture repair was postponed more than 48 hours.21 However, time to surgery in both the standard care and hospitalist model in our study was well below the 48‐hour cutoff, suggesting that operating anywhere within the normally accepted 48‐hour time frame may not influence long‐term mortality.
Because of the small number of events in both groups, we were unable to specifically compare whether a hospitalist model of care has any specific impact on long‐term cause of death. Although causes of death of patients with hip fracture were consistent with those of previous studies,10, 24 our death rate at 1 year, 29.4%, was higher than that seen among similar population groups at tertiary referral centers.19, 20, 2429 This is most likely a result of the cohort having a high proportion of nursing home patients (22%)19, 24, 26 transferred for evaluation to St. Mary's Hospital, which serves most of Olmsted County, Minnesota. This hospital also has some characteristics of a community‐based hospital, as it is where greater than 95% of all county patients receive care for surgical repair of hip fracture. Mortality rates are often higher at these types of hospitals.30 Previous studies using patients from Olmsted County indicate results can also be extrapolated to a large part of the U.S. population.31 In Pitto et al.'s study, the risk of death was 31% lower in those admitted from home than for those admitted from a nursing home.32 The latter patients normally have a higher number of comorbid conditions and tend to be less ambulatory than those in a community home‐dwelling setting. Our study also demonstrated that admission from a nursing home was a strong predictor of mortality for up to 1 year in the geriatric population. This may reflect the inherent decreased survival in this patient group, which is in agreement with the findings of other studies that showed inactivity and decreased ambulation prior to fracture were associated with increased mortality.3335
Multiple comorbidities, commonly seen in a geriatric population, translate into a higher ASA class and an increased risk of significant in‐hospital complications. Our study confirmed the findings of previous studies that a higher ASA class is a strong predictor of mortality,21, 26, 30, 3537 independent of decreased time to surgery.38 We also noted that significant in‐hospital complications, including renal failure, respiratory failure, and myocardial infarction, are documented predictors of mortality after hip fracture.27 Although mortality may vary depending on fracture type (femoral neck vs. intertrochanteric),3941 these differences were not observed in our study, in line with the results of previous published studies.37, 42 Controlling for age and comorbidities may be why an association was not found between fracture type and mortality. Finally, in a model containing comorbidity, ASA class, and nursing home residence prior to fracture, age was not a significant predictor of mortality.
Our study had a number of limitations. First, this was a retrospective cohort study based on chart review, so some data may have been subject to recording bias, and this might have differed between the serial models. Because of the retrospective nature of the study and referral of some of the patients from outside the community, our 1‐year follow‐up was not complete, but approached a respectable 93%. Other studies have described the benefits derived by a hospitalist practice only following the first year of its implementation, likely because of the hospitalist learning curve.43, 44 This may be why there was no difference in mortality between the standard care and hospitalist groups, as the latter was only in its first year of existence. Additional longitudinal study is required to find out if mortality differences emerge between the treatment groups. Furthermore, although in‐hospital care may influence short‐term outcomes, its effect on long‐term mortality has been unclear. Our data demonstrate that even though a hospitalist service can shorten length of stay and time to surgery, there were no appreciable intermediate differences in mortality at 1 year. Further prospective studies are needed to determine whether this medical‐surgical partnership in caring for these patients provides more favorable outcomes of reducing mortality and intercurrent complications.
Acknowledgements
We thank Donna K. Lawson for her assistance in data collection and management.
- ,,.The future of hip fractures in the United States. Numbers, costs, and potential effects of postmenopausal estrogen.Clin Orthop Relat Res1990 (252):163–166.
- ,,.Hip fractures in the elderly: a world‐wide projection.Osteoporos Int.1992;2:285–289.
- ,,,.The economic cost of hip fractures among elderly women. A one‐year, prospective, observational cohort study with matched‐pair analysis.Belgian Hip Fracture Study Group.J Bone Joint Surg Am.2001;83‐A:493–500.
- ,,.Estimating hip fracture morbidity, mortality and costs.J Am Geriatr Soc.2003;51:364–370.
- ,.The aging of America. Impact on health care costs.JAMA.1990;263:2335–2340.
- ,,,.Medical expenditures for the treatment of osteoporotic fractures in the United States in 1995: report from the National Osteoporosis Foundation.J Bone Miner Res.1997;12(1):24–35.
- US Department of Health and Human Services.Surveillance for selected public health indicators affecting older adults —United States.MMWR Morb Mortal Wkly Rep1999;48:33–34.
- ,.Epidemiology and outcomes of osteoporotic fractures.Lancet.2002;359:1761–1767.
- ,,, et al.Effects of a hospitalist model on elderly patients with hip fracture.Arch Intern Med.2005;165:796–801.
- ,,.Hip fractures in Finland and Great Britain—a comparison of patient characteristics and outcomes.Int Orthop.2001;25:349–354.
- WHO.International Classification of Disease, Ninth Revision (ICD‐9).Geneva, Switzerland:World Health Organization;1977.
- ,,, et al.Medical and surgical comanagement after elective hip and knee arthroplasty: a randomized, controlled trial.Ann Intern Med.2004;141(1):28–38.
- .Regression models and life‐tables (with discussion).J R Stat Soc Ser B.1972;34:187–220.
- ,.Nonparametric estimation from incomplete observations.J Am Statistical Assoc.1958;53:457–481.
- ,.An Introduction to Recursive Partitioning using the RPART Routines: Section of Biostatistics, Mayo Clinic;1997.
- .Computer Intensive Statistical Methods, Validation, Model Selection, and Bootstrap.London:Chapman and Hall;1994.
- ,.A bootstrap resampling procedure for model building: application to the Cox regression model.Stat Med.1992;11:2093–2109.
- ,,.Associations between the hospitalist model of care and quality‐of‐care‐related outcomes in patients undergoing hip fracture surgery.Mayo Clin Proc.2006;81(1):28–31.
- ,,, et al.Association of timing of surgery for hip fracture and patient outcomes.JAMA.2004;291:1738–1743.
- ,,,,.The effects of time‐to‐surgery on mortality and morbidity in patients following hip fracture.Am J Med.2002;112:702–709.
- ,,,.Morbidity and mortality after hip fracture: the impact of operative delay.Arch Orthop Trauma Surg.2004;124:334–340.
- ,,.Delay to surgery prolongs hospital stay in patients with fractures of the proximal femur.J Bone Joint Surg Br.2005;87:1123–1126.
- ,.The timing of surgery for proximal femoral fractures.J Bone Joint Surg Br.1992;74(2):203–205.
- ,,, et al.Hospital readmissions after hospital discharge for hip fracture: surgical and nonsurgical causes and effect on outcomes.J Am Geriatr Soc.2003;51:399–403.
- ,.Mortality after hip fractures.Acta Orthop Scand1979;50(2):161–167.
- ,,,,.Medical complications and outcomes after hip fracture repair.Arch Intern Med.2002;162:2053–2057.
- ,,, et al.Development and initial validation of a risk score for predicting in‐hospital and 1‐year mortality in patients with hip fractures.J Bone Miner Res.2005;20:494–500.
- ,,,,.Outcome after hip fracture in individuals ninety years of age and older.J Orthop Trauma.2001;15(1):34–39.
- ,,,.Hip fractures in the elderly: predictors of one year mortality.J Orthop Trauma.1997;11(3):162–165.
- ,,,.The effect of hospital type and surgical delay on mortality after surgery for hip fracture.J Bone Joint Surg Br.2005;87:361–366.
- .History of the Rochester Epidemiology Project.Mayo Clin Proc.1996;71:266–274.
- .The mortality and social prognosis of hip fractures. A prospective multifactorial study.Int Orthop.1994;18(2):109–113.
- ,.Functional outcome after hip fracture. A 1‐year prospective outcome study of 275 patients.Injury.2003;34:529–532.
- ,,.Rate of mortality for elderly patients after fracture of the hip in the 1980's.J Bone Joint Surg Am.1987;69:1335–1340.
- ,,,.Hip fractures in the elderly. Mortality, functional results and social readaptation.Int Surg.1989;74(3):191–194.
- ,,.Blood transfusion requirements in femoral neck fracture.Injury.2000;31(1):7–10.
- ,,.Mortality and causes of death after hip fractures in The Netherlands.Neth J Med.1992;41(1–2):4–10.
- ,,.Influence of preoperative medical status and delay to surgery on death following a hip fracture.ANZ J Surg.2002;72:405–407.
- ,,,Predictors of mortality and institutionalization after hip fracture: the New Haven EPESE cohort. Established Populations for Epidemiologic Studies of the Elderly.Am J Public Health.1994;84:1807–1812.
- ,,,.Mortality risk after hip fracture.J Orthop Trauma.2003;17(1):53–56.
- ,,.Thirty‐day mortality following hip arthroplasty for acute fracture.J Bone Joint Surg Am.2004;86‐A:1983–1988.
- ,,,,.Functional outcomes and mortality vary among different types of hip fractures: a function of patient characteristics.Clin Orthop Relat Res.2004:64–71.
- ,,,,,.Implementation of a voluntary hospitalist service at a community teaching hospital: improved clinical efficiency and patient outcomes.Ann Intern Med.2002;137:859–865.
- ,,, et al.Effects of physician experience on costs and outcomes on an academic general medicine service: results of a trial of hospitalists.Ann Intern Med.2002;137:866–874.
- ,,.The future of hip fractures in the United States. Numbers, costs, and potential effects of postmenopausal estrogen.Clin Orthop Relat Res1990 (252):163–166.
- ,,.Hip fractures in the elderly: a world‐wide projection.Osteoporos Int.1992;2:285–289.
- ,,,.The economic cost of hip fractures among elderly women. A one‐year, prospective, observational cohort study with matched‐pair analysis.Belgian Hip Fracture Study Group.J Bone Joint Surg Am.2001;83‐A:493–500.
- ,,.Estimating hip fracture morbidity, mortality and costs.J Am Geriatr Soc.2003;51:364–370.
- ,.The aging of America. Impact on health care costs.JAMA.1990;263:2335–2340.
- ,,,.Medical expenditures for the treatment of osteoporotic fractures in the United States in 1995: report from the National Osteoporosis Foundation.J Bone Miner Res.1997;12(1):24–35.
- US Department of Health and Human Services.Surveillance for selected public health indicators affecting older adults —United States.MMWR Morb Mortal Wkly Rep1999;48:33–34.
- ,.Epidemiology and outcomes of osteoporotic fractures.Lancet.2002;359:1761–1767.
- ,,, et al.Effects of a hospitalist model on elderly patients with hip fracture.Arch Intern Med.2005;165:796–801.
- ,,.Hip fractures in Finland and Great Britain—a comparison of patient characteristics and outcomes.Int Orthop.2001;25:349–354.
- WHO.International Classification of Disease, Ninth Revision (ICD‐9).Geneva, Switzerland:World Health Organization;1977.
- ,,, et al.Medical and surgical comanagement after elective hip and knee arthroplasty: a randomized, controlled trial.Ann Intern Med.2004;141(1):28–38.
- .Regression models and life‐tables (with discussion).J R Stat Soc Ser B.1972;34:187–220.
- ,.Nonparametric estimation from incomplete observations.J Am Statistical Assoc.1958;53:457–481.
- ,.An Introduction to Recursive Partitioning using the RPART Routines: Section of Biostatistics, Mayo Clinic;1997.
- .Computer Intensive Statistical Methods, Validation, Model Selection, and Bootstrap.London:Chapman and Hall;1994.
- ,.A bootstrap resampling procedure for model building: application to the Cox regression model.Stat Med.1992;11:2093–2109.
- ,,.Associations between the hospitalist model of care and quality‐of‐care‐related outcomes in patients undergoing hip fracture surgery.Mayo Clin Proc.2006;81(1):28–31.
- ,,, et al.Association of timing of surgery for hip fracture and patient outcomes.JAMA.2004;291:1738–1743.
- ,,,,.The effects of time‐to‐surgery on mortality and morbidity in patients following hip fracture.Am J Med.2002;112:702–709.
- ,,,.Morbidity and mortality after hip fracture: the impact of operative delay.Arch Orthop Trauma Surg.2004;124:334–340.
- ,,.Delay to surgery prolongs hospital stay in patients with fractures of the proximal femur.J Bone Joint Surg Br.2005;87:1123–1126.
- ,.The timing of surgery for proximal femoral fractures.J Bone Joint Surg Br.1992;74(2):203–205.
- ,,, et al.Hospital readmissions after hospital discharge for hip fracture: surgical and nonsurgical causes and effect on outcomes.J Am Geriatr Soc.2003;51:399–403.
- ,.Mortality after hip fractures.Acta Orthop Scand1979;50(2):161–167.
- ,,,,.Medical complications and outcomes after hip fracture repair.Arch Intern Med.2002;162:2053–2057.
- ,,, et al.Development and initial validation of a risk score for predicting in‐hospital and 1‐year mortality in patients with hip fractures.J Bone Miner Res.2005;20:494–500.
- ,,,,.Outcome after hip fracture in individuals ninety years of age and older.J Orthop Trauma.2001;15(1):34–39.
- ,,,.Hip fractures in the elderly: predictors of one year mortality.J Orthop Trauma.1997;11(3):162–165.
- ,,,.The effect of hospital type and surgical delay on mortality after surgery for hip fracture.J Bone Joint Surg Br.2005;87:361–366.
- .History of the Rochester Epidemiology Project.Mayo Clin Proc.1996;71:266–274.
- .The mortality and social prognosis of hip fractures. A prospective multifactorial study.Int Orthop.1994;18(2):109–113.
- ,.Functional outcome after hip fracture. A 1‐year prospective outcome study of 275 patients.Injury.2003;34:529–532.
- ,,.Rate of mortality for elderly patients after fracture of the hip in the 1980's.J Bone Joint Surg Am.1987;69:1335–1340.
- ,,,.Hip fractures in the elderly. Mortality, functional results and social readaptation.Int Surg.1989;74(3):191–194.
- ,,.Blood transfusion requirements in femoral neck fracture.Injury.2000;31(1):7–10.
- ,,.Mortality and causes of death after hip fractures in The Netherlands.Neth J Med.1992;41(1–2):4–10.
- ,,.Influence of preoperative medical status and delay to surgery on death following a hip fracture.ANZ J Surg.2002;72:405–407.
- ,,,Predictors of mortality and institutionalization after hip fracture: the New Haven EPESE cohort. Established Populations for Epidemiologic Studies of the Elderly.Am J Public Health.1994;84:1807–1812.
- ,,,.Mortality risk after hip fracture.J Orthop Trauma.2003;17(1):53–56.
- ,,.Thirty‐day mortality following hip arthroplasty for acute fracture.J Bone Joint Surg Am.2004;86‐A:1983–1988.
- ,,,,.Functional outcomes and mortality vary among different types of hip fractures: a function of patient characteristics.Clin Orthop Relat Res.2004:64–71.
- ,,,,,.Implementation of a voluntary hospitalist service at a community teaching hospital: improved clinical efficiency and patient outcomes.Ann Intern Med.2002;137:859–865.
- ,,, et al.Effects of physician experience on costs and outcomes on an academic general medicine service: results of a trial of hospitalists.Ann Intern Med.2002;137:866–874.
Copyright © 2007 Society of Hospital Medicine
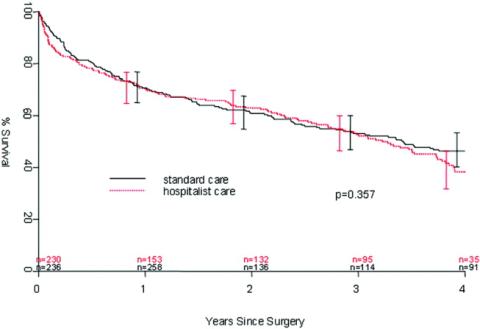
Clear writing, clear thinking and the disappearing art of the problem list
My hospital's electronic medical record helpfully informs me after 1 week on service that there are 524 data available for my attention, a statistic that would be paralyzing without a cognitive framework for organizing and interpreting them in a manner that can be shared among my colleagues. Accurate information flow among clinicians was identified early on as an imperative of hospital medicine. Much attention has been focused on communication during transitions of care, such as that between inpatient and outpatient services and between inpatient teams, taking the form of the discharge summary and the sign‐out, respectively. But communication among physicians, consultants, and allied therapists must and inevitably does occur continuously day by day during even the most uneventful hospital stay. On academic services the need to keep multiple and ever‐rotating team members on the same page, so to speak, is particularly pressing.
The succinct and accurate problem list, formulated at the end of the history and physical examination and propagated through daily progress notes, is a powerful tool for promoting clear diagnostic and therapeutic planning and is ideally suited to meeting the need for continuous information flow among clinicians. Sadly, this inexpensive and potentially elegant device has fallen into disuse and disrepair and is in need of restoration.
In the 1960s, Dr. Lawrence Weed, the inventor of the SOAP note and a pioneer of medical informatics, wrote of the power of the problem list to impose order on the chaos of clinical information and to aid clear diagnostic thinking, in contrast with the simply chronological record popular in earlier years:
It is this multiplicity of problems with which the physician must deal in his daily work.[T]he multiplicity is inevitable but a random approach to the difficulties it creates is not. The instruction of physicians should be based on a system that helps them to define and follow clinical problems one by one and then systematically to relate and resolve them.[T]the basic criterion of the physician is how well he can identify the patient's problems and organize them for solution.1
Weed proposed that the product of our diagnostic thinking and investigations should be a concise list of diagnoses, as precisely as we are able to identify them, or, in their absence, a clear understanding of the specific problems awaiting resolution and a clear appreciation of the interrelationships among these entities:
The list shouldstate the problems at a level of refinement consistent with the physician's understanding, running the gamut from the precise diagnosis to the isolated, unexplained finding. Each item should be classified as one of the following: (1) a diagnosis, e.g., ASHD, followed by the principal manifestation that requires management; (2) a physiological finding, e.g., heart failure, followed by either the phrase etiology unknown or secondary to a diagnosis; (3) a symptom or physical finding, e.g., shortness of breath; or (4) an abnormal laboratory finding, e.g., an abnormal EKG. If a given diagnosis has several major manifestations, each of which requires individual management and separate, carefully delineated progress notes, then the second manifestation is presented as a second problem and designated as secondary to the major diagnosis.1
These principles were widely praised and adopted. An editorial in the New England Journal of Medicine proclaimed that his system is the essence of education itself,3 and it reigned throughout my own formal medical education.
In the decade that has seen our specialty flourish, with the attendant imperatives of clear thinking and communication, in teaching hospitals the problem list seems to have become an endangered species. The general pattern of its decline is that it is often supplanted by a list of organs, or worse, medical subspecialties, each followed by some assessment of its condition, whether diseased or not. The format resembles that used in critical care units for patients with multiple vital functions in jeopardy, on which survival depends from minute to minute, sometimes regardless of the original etiology of their failure. It is not clear how these notes began to spread from the ICU to the medical floor, where puzzles are solved and progress has goals more varied than mere survival. None of the residents I have queried over the years seem to know. The prevalence of this habit is also unknown, but it is widespread at both institutions at which I have been recently affiliated, and from the generation of notes in this format by trainees freshly graduated from medical schools across the land, I infer that it is no mere regional phenomenon. There may be an unspoken assumption that if this format is used for the sickest patients, it must be the superior format to use for all patients. Perhaps it reflects subspecialists teaching inpatient medicine, equipping trainees with vast technical knowledge of specific diseases and placing less emphasis on formulating coherent assessments. I believe its effects are pernicious and far‐reaching, affecting not only the quality of information flow among clinicians, but also the quality and rigor of diagnostic thinking of those in our training programs.
The history and physical examination properly culminate in the formulation of a problem list that establishes the framework for subsequent investigations and therapy. For each problem a narrative thread is initiated that can be followed in progress notes to resolution and succinctly reviewed in the discharge summary. It is now common to see diagnostic formulations arranged not by problem but by organ or subspecialty, for example, Endocrine: DKA. As everyone understands DKA to be an endocrine problem, the organ system preface adds nothing useful and only serves to bury the diagnosis in text. More tortured prose follows attempts to cram into the header all organs or specialties touched by the problem; hence pneumonia is often preceded by pulmonary/ID. A more egregious recent example was an esophageal variceal hemorrhage designated GI/Heme. And efforts to force an undifferentiated problem into an organ group can reach absurdity: Heme: Asymmetric leg swelling raised concern for DVT, but ultrasound was negative.
The organ preface at best merely adds clutter; the difficulty is compounded when the actual diagnosis or problem is omitted entirely in favor of mention of the organs, for example, for pneumonia: Pulm/ID: begin antibiotics. The reader may be left to guess exactly what is being treated, as with CV: begin heparin and beta‐blocker. The assessment and subsequent notes become even more unwieldy when the unifying diagnosis is approached circuitously on paper by way of its component elements, as with a recent patient with typical lobar pneumonia who was assessed by the house officer as having (1) ID: fever probably due to pneumonia; (2) Pulm: Hypoxia, sputum production and infiltrate on CXR consistent with pneumonia; and (3) Heme: leukocytosis likely due to pneumonia as well. Synthesis, the holy grail of the H&P, is thus replaced by analysis. Each tree is closely inspected, but we are lost in the forest. Weed wrote of such notes:
Failure to integrate findings into a valid single entity can almost always be traced to incomplete understanding.If a beginner puts cardiomegaly, edema, hepatomegaly and shortness of breath as four separate problems, it is his way of clearly admitting that he does not recognize cardiac failure when he sees it.2
Often, however, as in the example above, the physician fully understands the unifying diagnosis but nonetheless insists on addressing involved systems separately. Each feature is then apt to be separately followed in isolation through the progress notes, sometimes without any further mention of pneumonia as such. Many progress notes thus omit stating what is actually thought to be wrong with the patient.
The failure to commit to a diagnosis on paper, even when having done so in practice, ultimately can make its way to the discharge summary, propagating confusion to the outpatient department and ricocheting it into future admissions. It also robs us of the satisfaction of declaring a puzzle solved. I was compelled to write this piece in part by the recent case of a young woman who presented with fever and dyspnea. Through an elegant series of imaging studies and serologic tests, a diagnosis of lupus pericarditis was established, and steroid therapy produced dramatic remission of her symptomsa diagnostic triumph by any measure. How disheartening then to read the resident's final diagnosis for posterity in the discharge summary: fever and dyspnea.
The disembodied organ list thus sows confusion and redundant, convoluted prose throughout the medical record. Perhaps even more destructive is its effect on diagnostic thinking when applied to undifferentiated symptoms or problems, the general internist's pice de rsistance. Language shapes thought, and premature assignment of symptoms to a single organ or subspecialty constrains the imagination needed to puzzle things out. Examples are everywhere. Fever of unknown origin may be peremptorily designated ID, by implication excluding inflammatory, neoplastic, and iatrogenic causes from consideration. The asymmetrically swollen legs cited earlier are not hematologic, but they are still swollen. Undiagnosed problems should be labeled as such, with comment as to the differential diagnosis as it stands at the time and the status of the investigation. When a diagnosis is established, it should replace the undifferentiated symptom or abnormal finding in the list, with cardinal manifestations addressed as such when necessary. Thus, for example, fever in an intravenous drug user becomes endocarditis, and anasarca becomes nephrotic syndrome becomes glomerulonephritis as the diagnosis is established and refined. Weed saw the promise of the well‐groomed, problem‐based record in teaching diagnostic thinking:
The education of a physicianshould be based on his clinical experience and should be reflected in the records he maintains on his patients.The educationbecomes defective not when he is given too much or too little training in basic sciencebut rather when he is allowed to ignore or slight the elementary definition and the progressive adjustment of the problems that comprise his clinical experience. The teacher who ultimately benefits students the most is the one who is willing to establish parameters of discipline in the not unsophisticated but often unappreciated task of preventing this imprecision and disorganization.1
Hospitalists as generalist clinician‐educators have an opportunity to teach fundamental principles of medicine that span subspecialties. These principles must include clear organization and prioritization of complex medical information to enable coherent diagnostic and therapeutic planning and smooth continuity of care. The sign‐out and the all‐important discharge summary can be only as clear and as logical as the diagnoses that inform them. To these ends, let us maintain and reinvigorate the art of the problem list. As an exercise at morning report and attending rounds, we should emphasize the development of an accurate, comprehensive list of active problems before moving on to detailed discussion of any single issue, as Weed suggested nearly 40 years ago:
A serious mistake in teaching medicine is to expose the student, the house officer, or the physician to an analytical discussion of the diagnosis and management of one problem before establishing whether or not he is capable of identifying and defining all of the patient's problems at the outset1
We should expect this list to be formulated at the end of the admission history and physical examination. We must ensure that trainees can correctly identify the level of resolution achieved for each item. They must learn to distinguish among undifferentiated symptoms, for example, passed out; undifferentiated problems, expressed by medical terms with precise meaning, such as syncope; and precise etiologic diagnoses, such as ventricular tachycardia. Daily progress notes and sign‐out documents must reflect the progressive refinement in classification of each item and give the current status of the diagnostic evaluation. When therapy has been established, daily notes must reflect its precise status relative to its end points; examples include place in the timeline for antibiotics or, for a bleeding patient, a tally of blood products and their impact. In the end, we must ensure that the discharge summary reflects the highest level of diagnostic resolution achieved for each problem we have identified. In so doing, we will help to ensure coherent and efficient care for our patients, save time and spare confusion for our colleagues, and teach our trainees to think and communicate clearly about our collective efforts.
- .Medical Records, Medical Education and Patient Care.Cleveland, OH:Press of Case Western Reserve University;1971.
- .Medical records that guide and teach (concluded).N Engl J Med.1968;278:593–600.
- .Ten reasons why Lawrence Weed is right.N Engl J Med.1971;284:51–52.
My hospital's electronic medical record helpfully informs me after 1 week on service that there are 524 data available for my attention, a statistic that would be paralyzing without a cognitive framework for organizing and interpreting them in a manner that can be shared among my colleagues. Accurate information flow among clinicians was identified early on as an imperative of hospital medicine. Much attention has been focused on communication during transitions of care, such as that between inpatient and outpatient services and between inpatient teams, taking the form of the discharge summary and the sign‐out, respectively. But communication among physicians, consultants, and allied therapists must and inevitably does occur continuously day by day during even the most uneventful hospital stay. On academic services the need to keep multiple and ever‐rotating team members on the same page, so to speak, is particularly pressing.
The succinct and accurate problem list, formulated at the end of the history and physical examination and propagated through daily progress notes, is a powerful tool for promoting clear diagnostic and therapeutic planning and is ideally suited to meeting the need for continuous information flow among clinicians. Sadly, this inexpensive and potentially elegant device has fallen into disuse and disrepair and is in need of restoration.
In the 1960s, Dr. Lawrence Weed, the inventor of the SOAP note and a pioneer of medical informatics, wrote of the power of the problem list to impose order on the chaos of clinical information and to aid clear diagnostic thinking, in contrast with the simply chronological record popular in earlier years:
It is this multiplicity of problems with which the physician must deal in his daily work.[T]he multiplicity is inevitable but a random approach to the difficulties it creates is not. The instruction of physicians should be based on a system that helps them to define and follow clinical problems one by one and then systematically to relate and resolve them.[T]the basic criterion of the physician is how well he can identify the patient's problems and organize them for solution.1
Weed proposed that the product of our diagnostic thinking and investigations should be a concise list of diagnoses, as precisely as we are able to identify them, or, in their absence, a clear understanding of the specific problems awaiting resolution and a clear appreciation of the interrelationships among these entities:
The list shouldstate the problems at a level of refinement consistent with the physician's understanding, running the gamut from the precise diagnosis to the isolated, unexplained finding. Each item should be classified as one of the following: (1) a diagnosis, e.g., ASHD, followed by the principal manifestation that requires management; (2) a physiological finding, e.g., heart failure, followed by either the phrase etiology unknown or secondary to a diagnosis; (3) a symptom or physical finding, e.g., shortness of breath; or (4) an abnormal laboratory finding, e.g., an abnormal EKG. If a given diagnosis has several major manifestations, each of which requires individual management and separate, carefully delineated progress notes, then the second manifestation is presented as a second problem and designated as secondary to the major diagnosis.1
These principles were widely praised and adopted. An editorial in the New England Journal of Medicine proclaimed that his system is the essence of education itself,3 and it reigned throughout my own formal medical education.
In the decade that has seen our specialty flourish, with the attendant imperatives of clear thinking and communication, in teaching hospitals the problem list seems to have become an endangered species. The general pattern of its decline is that it is often supplanted by a list of organs, or worse, medical subspecialties, each followed by some assessment of its condition, whether diseased or not. The format resembles that used in critical care units for patients with multiple vital functions in jeopardy, on which survival depends from minute to minute, sometimes regardless of the original etiology of their failure. It is not clear how these notes began to spread from the ICU to the medical floor, where puzzles are solved and progress has goals more varied than mere survival. None of the residents I have queried over the years seem to know. The prevalence of this habit is also unknown, but it is widespread at both institutions at which I have been recently affiliated, and from the generation of notes in this format by trainees freshly graduated from medical schools across the land, I infer that it is no mere regional phenomenon. There may be an unspoken assumption that if this format is used for the sickest patients, it must be the superior format to use for all patients. Perhaps it reflects subspecialists teaching inpatient medicine, equipping trainees with vast technical knowledge of specific diseases and placing less emphasis on formulating coherent assessments. I believe its effects are pernicious and far‐reaching, affecting not only the quality of information flow among clinicians, but also the quality and rigor of diagnostic thinking of those in our training programs.
The history and physical examination properly culminate in the formulation of a problem list that establishes the framework for subsequent investigations and therapy. For each problem a narrative thread is initiated that can be followed in progress notes to resolution and succinctly reviewed in the discharge summary. It is now common to see diagnostic formulations arranged not by problem but by organ or subspecialty, for example, Endocrine: DKA. As everyone understands DKA to be an endocrine problem, the organ system preface adds nothing useful and only serves to bury the diagnosis in text. More tortured prose follows attempts to cram into the header all organs or specialties touched by the problem; hence pneumonia is often preceded by pulmonary/ID. A more egregious recent example was an esophageal variceal hemorrhage designated GI/Heme. And efforts to force an undifferentiated problem into an organ group can reach absurdity: Heme: Asymmetric leg swelling raised concern for DVT, but ultrasound was negative.
The organ preface at best merely adds clutter; the difficulty is compounded when the actual diagnosis or problem is omitted entirely in favor of mention of the organs, for example, for pneumonia: Pulm/ID: begin antibiotics. The reader may be left to guess exactly what is being treated, as with CV: begin heparin and beta‐blocker. The assessment and subsequent notes become even more unwieldy when the unifying diagnosis is approached circuitously on paper by way of its component elements, as with a recent patient with typical lobar pneumonia who was assessed by the house officer as having (1) ID: fever probably due to pneumonia; (2) Pulm: Hypoxia, sputum production and infiltrate on CXR consistent with pneumonia; and (3) Heme: leukocytosis likely due to pneumonia as well. Synthesis, the holy grail of the H&P, is thus replaced by analysis. Each tree is closely inspected, but we are lost in the forest. Weed wrote of such notes:
Failure to integrate findings into a valid single entity can almost always be traced to incomplete understanding.If a beginner puts cardiomegaly, edema, hepatomegaly and shortness of breath as four separate problems, it is his way of clearly admitting that he does not recognize cardiac failure when he sees it.2
Often, however, as in the example above, the physician fully understands the unifying diagnosis but nonetheless insists on addressing involved systems separately. Each feature is then apt to be separately followed in isolation through the progress notes, sometimes without any further mention of pneumonia as such. Many progress notes thus omit stating what is actually thought to be wrong with the patient.
The failure to commit to a diagnosis on paper, even when having done so in practice, ultimately can make its way to the discharge summary, propagating confusion to the outpatient department and ricocheting it into future admissions. It also robs us of the satisfaction of declaring a puzzle solved. I was compelled to write this piece in part by the recent case of a young woman who presented with fever and dyspnea. Through an elegant series of imaging studies and serologic tests, a diagnosis of lupus pericarditis was established, and steroid therapy produced dramatic remission of her symptomsa diagnostic triumph by any measure. How disheartening then to read the resident's final diagnosis for posterity in the discharge summary: fever and dyspnea.
The disembodied organ list thus sows confusion and redundant, convoluted prose throughout the medical record. Perhaps even more destructive is its effect on diagnostic thinking when applied to undifferentiated symptoms or problems, the general internist's pice de rsistance. Language shapes thought, and premature assignment of symptoms to a single organ or subspecialty constrains the imagination needed to puzzle things out. Examples are everywhere. Fever of unknown origin may be peremptorily designated ID, by implication excluding inflammatory, neoplastic, and iatrogenic causes from consideration. The asymmetrically swollen legs cited earlier are not hematologic, but they are still swollen. Undiagnosed problems should be labeled as such, with comment as to the differential diagnosis as it stands at the time and the status of the investigation. When a diagnosis is established, it should replace the undifferentiated symptom or abnormal finding in the list, with cardinal manifestations addressed as such when necessary. Thus, for example, fever in an intravenous drug user becomes endocarditis, and anasarca becomes nephrotic syndrome becomes glomerulonephritis as the diagnosis is established and refined. Weed saw the promise of the well‐groomed, problem‐based record in teaching diagnostic thinking:
The education of a physicianshould be based on his clinical experience and should be reflected in the records he maintains on his patients.The educationbecomes defective not when he is given too much or too little training in basic sciencebut rather when he is allowed to ignore or slight the elementary definition and the progressive adjustment of the problems that comprise his clinical experience. The teacher who ultimately benefits students the most is the one who is willing to establish parameters of discipline in the not unsophisticated but often unappreciated task of preventing this imprecision and disorganization.1
Hospitalists as generalist clinician‐educators have an opportunity to teach fundamental principles of medicine that span subspecialties. These principles must include clear organization and prioritization of complex medical information to enable coherent diagnostic and therapeutic planning and smooth continuity of care. The sign‐out and the all‐important discharge summary can be only as clear and as logical as the diagnoses that inform them. To these ends, let us maintain and reinvigorate the art of the problem list. As an exercise at morning report and attending rounds, we should emphasize the development of an accurate, comprehensive list of active problems before moving on to detailed discussion of any single issue, as Weed suggested nearly 40 years ago:
A serious mistake in teaching medicine is to expose the student, the house officer, or the physician to an analytical discussion of the diagnosis and management of one problem before establishing whether or not he is capable of identifying and defining all of the patient's problems at the outset1
We should expect this list to be formulated at the end of the admission history and physical examination. We must ensure that trainees can correctly identify the level of resolution achieved for each item. They must learn to distinguish among undifferentiated symptoms, for example, passed out; undifferentiated problems, expressed by medical terms with precise meaning, such as syncope; and precise etiologic diagnoses, such as ventricular tachycardia. Daily progress notes and sign‐out documents must reflect the progressive refinement in classification of each item and give the current status of the diagnostic evaluation. When therapy has been established, daily notes must reflect its precise status relative to its end points; examples include place in the timeline for antibiotics or, for a bleeding patient, a tally of blood products and their impact. In the end, we must ensure that the discharge summary reflects the highest level of diagnostic resolution achieved for each problem we have identified. In so doing, we will help to ensure coherent and efficient care for our patients, save time and spare confusion for our colleagues, and teach our trainees to think and communicate clearly about our collective efforts.
My hospital's electronic medical record helpfully informs me after 1 week on service that there are 524 data available for my attention, a statistic that would be paralyzing without a cognitive framework for organizing and interpreting them in a manner that can be shared among my colleagues. Accurate information flow among clinicians was identified early on as an imperative of hospital medicine. Much attention has been focused on communication during transitions of care, such as that between inpatient and outpatient services and between inpatient teams, taking the form of the discharge summary and the sign‐out, respectively. But communication among physicians, consultants, and allied therapists must and inevitably does occur continuously day by day during even the most uneventful hospital stay. On academic services the need to keep multiple and ever‐rotating team members on the same page, so to speak, is particularly pressing.
The succinct and accurate problem list, formulated at the end of the history and physical examination and propagated through daily progress notes, is a powerful tool for promoting clear diagnostic and therapeutic planning and is ideally suited to meeting the need for continuous information flow among clinicians. Sadly, this inexpensive and potentially elegant device has fallen into disuse and disrepair and is in need of restoration.
In the 1960s, Dr. Lawrence Weed, the inventor of the SOAP note and a pioneer of medical informatics, wrote of the power of the problem list to impose order on the chaos of clinical information and to aid clear diagnostic thinking, in contrast with the simply chronological record popular in earlier years:
It is this multiplicity of problems with which the physician must deal in his daily work.[T]he multiplicity is inevitable but a random approach to the difficulties it creates is not. The instruction of physicians should be based on a system that helps them to define and follow clinical problems one by one and then systematically to relate and resolve them.[T]the basic criterion of the physician is how well he can identify the patient's problems and organize them for solution.1
Weed proposed that the product of our diagnostic thinking and investigations should be a concise list of diagnoses, as precisely as we are able to identify them, or, in their absence, a clear understanding of the specific problems awaiting resolution and a clear appreciation of the interrelationships among these entities:
The list shouldstate the problems at a level of refinement consistent with the physician's understanding, running the gamut from the precise diagnosis to the isolated, unexplained finding. Each item should be classified as one of the following: (1) a diagnosis, e.g., ASHD, followed by the principal manifestation that requires management; (2) a physiological finding, e.g., heart failure, followed by either the phrase etiology unknown or secondary to a diagnosis; (3) a symptom or physical finding, e.g., shortness of breath; or (4) an abnormal laboratory finding, e.g., an abnormal EKG. If a given diagnosis has several major manifestations, each of which requires individual management and separate, carefully delineated progress notes, then the second manifestation is presented as a second problem and designated as secondary to the major diagnosis.1
These principles were widely praised and adopted. An editorial in the New England Journal of Medicine proclaimed that his system is the essence of education itself,3 and it reigned throughout my own formal medical education.
In the decade that has seen our specialty flourish, with the attendant imperatives of clear thinking and communication, in teaching hospitals the problem list seems to have become an endangered species. The general pattern of its decline is that it is often supplanted by a list of organs, or worse, medical subspecialties, each followed by some assessment of its condition, whether diseased or not. The format resembles that used in critical care units for patients with multiple vital functions in jeopardy, on which survival depends from minute to minute, sometimes regardless of the original etiology of their failure. It is not clear how these notes began to spread from the ICU to the medical floor, where puzzles are solved and progress has goals more varied than mere survival. None of the residents I have queried over the years seem to know. The prevalence of this habit is also unknown, but it is widespread at both institutions at which I have been recently affiliated, and from the generation of notes in this format by trainees freshly graduated from medical schools across the land, I infer that it is no mere regional phenomenon. There may be an unspoken assumption that if this format is used for the sickest patients, it must be the superior format to use for all patients. Perhaps it reflects subspecialists teaching inpatient medicine, equipping trainees with vast technical knowledge of specific diseases and placing less emphasis on formulating coherent assessments. I believe its effects are pernicious and far‐reaching, affecting not only the quality of information flow among clinicians, but also the quality and rigor of diagnostic thinking of those in our training programs.
The history and physical examination properly culminate in the formulation of a problem list that establishes the framework for subsequent investigations and therapy. For each problem a narrative thread is initiated that can be followed in progress notes to resolution and succinctly reviewed in the discharge summary. It is now common to see diagnostic formulations arranged not by problem but by organ or subspecialty, for example, Endocrine: DKA. As everyone understands DKA to be an endocrine problem, the organ system preface adds nothing useful and only serves to bury the diagnosis in text. More tortured prose follows attempts to cram into the header all organs or specialties touched by the problem; hence pneumonia is often preceded by pulmonary/ID. A more egregious recent example was an esophageal variceal hemorrhage designated GI/Heme. And efforts to force an undifferentiated problem into an organ group can reach absurdity: Heme: Asymmetric leg swelling raised concern for DVT, but ultrasound was negative.
The organ preface at best merely adds clutter; the difficulty is compounded when the actual diagnosis or problem is omitted entirely in favor of mention of the organs, for example, for pneumonia: Pulm/ID: begin antibiotics. The reader may be left to guess exactly what is being treated, as with CV: begin heparin and beta‐blocker. The assessment and subsequent notes become even more unwieldy when the unifying diagnosis is approached circuitously on paper by way of its component elements, as with a recent patient with typical lobar pneumonia who was assessed by the house officer as having (1) ID: fever probably due to pneumonia; (2) Pulm: Hypoxia, sputum production and infiltrate on CXR consistent with pneumonia; and (3) Heme: leukocytosis likely due to pneumonia as well. Synthesis, the holy grail of the H&P, is thus replaced by analysis. Each tree is closely inspected, but we are lost in the forest. Weed wrote of such notes:
Failure to integrate findings into a valid single entity can almost always be traced to incomplete understanding.If a beginner puts cardiomegaly, edema, hepatomegaly and shortness of breath as four separate problems, it is his way of clearly admitting that he does not recognize cardiac failure when he sees it.2
Often, however, as in the example above, the physician fully understands the unifying diagnosis but nonetheless insists on addressing involved systems separately. Each feature is then apt to be separately followed in isolation through the progress notes, sometimes without any further mention of pneumonia as such. Many progress notes thus omit stating what is actually thought to be wrong with the patient.
The failure to commit to a diagnosis on paper, even when having done so in practice, ultimately can make its way to the discharge summary, propagating confusion to the outpatient department and ricocheting it into future admissions. It also robs us of the satisfaction of declaring a puzzle solved. I was compelled to write this piece in part by the recent case of a young woman who presented with fever and dyspnea. Through an elegant series of imaging studies and serologic tests, a diagnosis of lupus pericarditis was established, and steroid therapy produced dramatic remission of her symptomsa diagnostic triumph by any measure. How disheartening then to read the resident's final diagnosis for posterity in the discharge summary: fever and dyspnea.
The disembodied organ list thus sows confusion and redundant, convoluted prose throughout the medical record. Perhaps even more destructive is its effect on diagnostic thinking when applied to undifferentiated symptoms or problems, the general internist's pice de rsistance. Language shapes thought, and premature assignment of symptoms to a single organ or subspecialty constrains the imagination needed to puzzle things out. Examples are everywhere. Fever of unknown origin may be peremptorily designated ID, by implication excluding inflammatory, neoplastic, and iatrogenic causes from consideration. The asymmetrically swollen legs cited earlier are not hematologic, but they are still swollen. Undiagnosed problems should be labeled as such, with comment as to the differential diagnosis as it stands at the time and the status of the investigation. When a diagnosis is established, it should replace the undifferentiated symptom or abnormal finding in the list, with cardinal manifestations addressed as such when necessary. Thus, for example, fever in an intravenous drug user becomes endocarditis, and anasarca becomes nephrotic syndrome becomes glomerulonephritis as the diagnosis is established and refined. Weed saw the promise of the well‐groomed, problem‐based record in teaching diagnostic thinking:
The education of a physicianshould be based on his clinical experience and should be reflected in the records he maintains on his patients.The educationbecomes defective not when he is given too much or too little training in basic sciencebut rather when he is allowed to ignore or slight the elementary definition and the progressive adjustment of the problems that comprise his clinical experience. The teacher who ultimately benefits students the most is the one who is willing to establish parameters of discipline in the not unsophisticated but often unappreciated task of preventing this imprecision and disorganization.1
Hospitalists as generalist clinician‐educators have an opportunity to teach fundamental principles of medicine that span subspecialties. These principles must include clear organization and prioritization of complex medical information to enable coherent diagnostic and therapeutic planning and smooth continuity of care. The sign‐out and the all‐important discharge summary can be only as clear and as logical as the diagnoses that inform them. To these ends, let us maintain and reinvigorate the art of the problem list. As an exercise at morning report and attending rounds, we should emphasize the development of an accurate, comprehensive list of active problems before moving on to detailed discussion of any single issue, as Weed suggested nearly 40 years ago:
A serious mistake in teaching medicine is to expose the student, the house officer, or the physician to an analytical discussion of the diagnosis and management of one problem before establishing whether or not he is capable of identifying and defining all of the patient's problems at the outset1
We should expect this list to be formulated at the end of the admission history and physical examination. We must ensure that trainees can correctly identify the level of resolution achieved for each item. They must learn to distinguish among undifferentiated symptoms, for example, passed out; undifferentiated problems, expressed by medical terms with precise meaning, such as syncope; and precise etiologic diagnoses, such as ventricular tachycardia. Daily progress notes and sign‐out documents must reflect the progressive refinement in classification of each item and give the current status of the diagnostic evaluation. When therapy has been established, daily notes must reflect its precise status relative to its end points; examples include place in the timeline for antibiotics or, for a bleeding patient, a tally of blood products and their impact. In the end, we must ensure that the discharge summary reflects the highest level of diagnostic resolution achieved for each problem we have identified. In so doing, we will help to ensure coherent and efficient care for our patients, save time and spare confusion for our colleagues, and teach our trainees to think and communicate clearly about our collective efforts.
- .Medical Records, Medical Education and Patient Care.Cleveland, OH:Press of Case Western Reserve University;1971.
- .Medical records that guide and teach (concluded).N Engl J Med.1968;278:593–600.
- .Ten reasons why Lawrence Weed is right.N Engl J Med.1971;284:51–52.
- .Medical Records, Medical Education and Patient Care.Cleveland, OH:Press of Case Western Reserve University;1971.
- .Medical records that guide and teach (concluded).N Engl J Med.1968;278:593–600.
- .Ten reasons why Lawrence Weed is right.N Engl J Med.1971;284:51–52.
Anonymous System to Report Pediatric Medical Errors / Taylor et al.
The problem of medical errors in the United States has been well documented.1 There is evidence that pediatric patients may be at higher risk than are adult patients for certain types of errors.2 Ultimately, the only way to accurately assess whether pediatric patient safety is improved is by developing methodologies that will enable systematic counting of all medical errors. It is only through this technique that the effectiveness of interventions to improve safety can be adequately assessed. However, as a first step, it is crucial that data on at least a representative sample of medical errors occurring during the care of hospitalized children be collected so that the most common types and causes of these errors can be determined.
Many techniques have been used to collect data on medical errors including chart review, administrative data analysis, and malpractice claims analysis.35 Although each of these methodologies has advantages, each also has inherent biases in the types of errors that are detected. Direct observation of medical care is a powerful technique but has a number of limitations including cost.3 Voluntary or semivoluntary reporting systems have the potential to capture complete and representative information on errors, particularly near‐miss events. Voluntary reporting systems have been a highly successful method for understanding safety issues in other industries.6 In medicine, incident reports traditionally have been used as the main system for collecting data on a number of types of adverse events including medical errors.7 However, incident reports have been of limited use in understanding patient safety issues; only a small fraction of the errors made are reported, and certain types of errors are much more likely to be reported than others.4, 810 Medical professionals underreporting their own errors or those of their colleagues in incident reports may reflect fears that discovery of these errors will lead to embarrassment, job sanctions, or malpractice claims.1012
Cognizant of the tendency of professionals to underreport their errors, the aviation industry implemented a confidential reporting system for near‐miss events, the Aviation Safety Reporting System, in 1976.1 With this system, airline pilots file reports of near‐misses to a third party rather than to their employer, and the contents of the reports are kept confidential. Databases of the reports are anonymous. The implementation of the Aviation Safety Reporting System led to a substantial increase in reporting; analysis of the reports of near‐miss events has helped to significantly improve aviation safety in the past quarter century.1, 6 Based on the aviation experience, anonymous medical error reporting systems using either paper or Web‐based data entry have been implemented in adult intensive care units, neonatal intensive care units, and academic medical centers and for reporting specific types of errors.1318 There are limited data on whether these systems improve reporting of medical errors compared with use of the more traditional incident reporting systems already in place in virtually all hospitals.
We developed an online confidential and anonymous system for reporting medical errors in pediatric patients. For a 3‐month period this system replaced incident reports as the method by which medical errors were reported on 2 units in a large urban children's hospital. Data collected via the anonymous reporting system were compared with data in incident reports filed in the same 2 units during analogous 3‐month periods in the preceding 4 years. Prior to the study we postulated that substantially more medical errors would be reported through the anonymous system than through the incident reports and that information would be collected on a wider range of problems. It was hypothesized that reporting of near‐miss events would be particularly increased with the anonymous system.
METHODS
This study was conducted at Children's Hospital and Regional Medical Center (CHRMC), Seattle, Washington. CHRMC is both a community hospital serving pediatric patients and a tertiary‐care regional referral center. Two inpatient units, the infant intensive care unit (IICU) and the medical unit, participated in the project. The IICU provides care to critically ill neonates and infants up to 6 months of age; most patients admitted to the unit are premature newborns or newborns with congenital abnormalities. The medical unit is the major service for inpatient pediatric patients with nonsurgical problems. There 2 units were selected for the study because of a wide range of clinical problems, varying intensities of care and because of the clinical leadership's interest in patient safety issues.
Traditionally, medical errors at CHRMC have been documented through the use of a standard incident report system. However, during the 3‐month study period, from mid‐February through mid‐May 2003, physicians and nurses in the 2 study units were asked to report all medical errors using an electronic, anonymous reporting system that was installed on virtually all the computer workstations in the 2 units. Although all physicians and nurses were asked to use the anonymous system instead of completing incident reports, a physician or nurse who did not wish to participate in the research study could complete a standard incident report form as was consistent with hospital policy. Thus, medical errors were only reported once, either through the anonymous system for study participants or on incident reports for those who did not wish to participate in the project.
Before and during the data collection period, a member of the research team met with physicians on duty in the study units, including residents, fellows, and attending physicians, to explain the study procedures. Clinical nurse specialists in the study units provided the nursing staff with ongoing training based on a curriculum prepared specifically for the project. Topics covered in the training of both nurses and physicians included accessing the system, examples of medical errors, the importance of reporting errors, including near‐misses, and types of feedback provided. The anonymous nature of the reports was stressed, and the review procedures were explained.
During the study, nurses and physicians accessed the report form by clicking on an icon on a workstation desktop. The reporter was asked to provide the date and time when and the unit on which the event occurred. After filling in this information, the 2 dialog boxes on the form had to be completed. On the first, the reporter was asked to describe the event and on the second to report the outcome, if known, of the patient involved. All information on the form was completed using free text; there were no pull‐down menus or radio buttons. This was done to encourage more complete narratives and to be as inclusive as possible when asking nurses and physicians to report. Prior to the study, it was believed that asking potential reporters to classify whether events were errors or to classify them by type or other characterizations might keep nurses and physicians from reporting events that did not fit into a particular category and that a forced entry format would tend to reinforce current biases about errors rather than maximize the amount of new information gathered. Finally, to preserve anonymity, reporters were not asked to give any information about themselves, including profession (nurse or physician). However, they could provide their own names if they wanted feedback on the event, with the obvious loss of anonymity. Once the form was completed, the physician or nurse clicked the submit button to transmit the report to the research team.
A member of the research team reviewed every anonymous report within 48 hours of submission. If the event described was considered a medical error with the potential for serious patient injury, the investigator contacted a member of the clinical leadership of the unit (consisting of a medical director, one or more head nurses, and clinical nurse specialists) about the report. Every month members of the clinical leadership also received batched copies of all reports from their unit. Otherwise, neither the clinical nor the administrative leadership had access to the reports.
Each of the study's 3 pediatrician investigators (J.T., D.B., and E.K.) independently reviewed every report. First, the reviewer determined whether the event described constituted a medical error based on the definition provided by the Institute of Medicine.1 Events were further categorized by severity, occurrence to patient, and type. A medical error was considered serious if it resulted in or had the potential to result in permanent patient injury or death, moderately serious if it resulted in or had the potential to result in temporary physical or emotional injury, or trivial if it was unlikely to result in injury or change in treatment plan. Each error was further classified by whether it actually occurredeither as having actually happened to a patient or as being a near‐miss, an error detected before reaching the patient.
Because there is, to our knowledge, no standardized taxonomy for categorizing types of medical errors that occur in inpatient pediatric patients, a classification system was developed by the University of Washington Developmental Center for Evaluation and Research in Pediatric Patient Safety. (The developmental center and its organizational structure have been previously described).10 A preliminary classification system was patterned after the schema proposed by Leape et al. and adapted for use in pediatrics.19 After reviewing a series of incident reports for another project, the developers of this classification system for types of errors further refined it. The final taxonomy had 8 main types of medical errors, most with subtypes. The schema used for classifying types of errors in this study is shown in Table 1. Although the reviewers found frequent overlap, they determined the primary type of error for events described in each report based on this classification system. Final categorization of the errors, including severity, occurrence to patient, and type, was based on agreement by at least 2 of the 3 reviewers. In instances in which there was not sufficient agreement for categorization, the 3 reviewers reached a consensus after discussion.
| Type of error | Description |
|---|---|
| Communication | Error resulting from misunderstood verbal communication between health care providers or illegible or confusing orders |
| Patient identification | Patient with incorrect or missing identification, wrong patient receiving treatment, mislabeled laboratory slips, mislabeled or incorrect medical record |
| Equipment failure | Nonfunctioning or improperly functioning equipment such as monitors and intravenous pumps |
| Medication | Error in ordering, dispensing, or administering a drug |
| Treatment | Error in administering treatments other than medication such as procedures and intravenous fluids |
| Protocol deviation | Failure to follow established hospital procedures for providing care to patients |
| Medical judgment | Failure of a physician or nurse to properly evaluate or respond to a patient's condition, failure to respond to abnormal tests, provision of care that was clearly inappropriate |
| Other | Types of errors not otherwise listed |
For comparison, an identical review was conducted of incident reports completed in the 2 study units during the same months (mid‐February through mid‐May) in the years 1999‐2002. By including data from several previous years for comparison, the potential problem of selecting a period that was an outlier (in which one or more unusual factors led to increased or decreased reporting) was avoided. We selected the years 1999‐2002 because this was a period of increasing interest in better understanding medical errors at CHRMC. During this period, physicians and staff were encouraged to report medical errors, including near‐miss events, on incident reports. As with the anonymous electronic submissions, each investigator independently reviewed all the selected incident reports, with final classification based on the same schema used for the anonymous reports.
Comparison of the 2 reporting systems was complicated by the hospitalwide quality improvement program to increase the accuracy of labeling laboratory specimens that was ongoing during 1999‐2002. As part of this program, the hospital staff was encouraged to use the incident report system to document unlabeled or mismatched laboratory specimens and patients without proper identification from whom a laboratory specimen was to be obtained (eg, missing a hospital identification bracelet). Laboratory personnel completed most of these incident reports. In a previous review of incident report data from CHRMC, we found that 35% of medical errors reported were related to improper labeling of laboratory specimens (unpublished data). Although reporting these events may have been helpful for monitoring progress in quality improvement, many of the events described were extremely trivial in nature. Inclusion of this one specific type of event so skewed the overall number of medical errors reported that meaningful analysis of the types, relative frequencies, and reporting of errors was difficult. Based on this experience, we considered excluding this type of event from the analysis in the current study if it constituted a significant proportion of the medical errors conveyed in incident reports. Descriptions of mislabeled lab specimens or patients without identification bracelets constituted 33.8% of all incident reports from the 2 study units; no such events were described in submissions through the anonymous reporting system.
To compare the electronic anonymous and incident‐report error reporting systems, first the number of errors reported with each system was divided by the total number of patient‐days during which data were collected in the 2 units. Rates are expressed as the number of errors per 100 patient‐days. Rate ratios (RRs) with 95% confidence intervals (95% CIs) were calculated to compare the error reporting rates of the 2 reporting systems. Poisson regression was used to assess significance; a rate ratio whose 95% CI did not include 1.0 was considered statistically significant. Initial comparisons included all reports made through both systems. For subsequent comparisons, reports pertaining to mislabeled lab specimens were excluded. Error reporting rates were compared between the 2 reporting systems overall and by unit (medical unit and IICU), type, severity, and near‐miss status. In addition, to evaluate the possibility that secular trends in reporting medical errors were responsible for any observed overall differences, error reporting rates determined with the anonymous system were compared separately with incident report error rates in 1999, 2000, 2001, and 2002. Differences in the relative frequency of reporting different types of errors with the 2 systems were assessed with chi‐square tests. Kappa statistics were computed to assess the interobserver reliability of the 3 reviewers in classifying the events in the incident and anonymous reports as medical errors.
The study was approved by the Institutional Review Board of Children's Hospital and Regional Medical Center.
RESULTS
During the 3‐month study period, 146 reports were completed using the anonymous reporting system, 131 of which were classified as medical errors (89.7%). Ninety‐five errors were reported from the medical unit, and 36 were reported from the IICU. The kappa statistic for interobserver agreement in categorizing the anonymous reports as medical errors was .526. There were a total of 5420 patient‐days in the 2 units (medical service and IICU); thus, the rate of reporting medical errors via the anonymous system was 2.41/100 patient‐days (95% CI 2.02, 2.86). As shown in Table 2, the rate of errors reported in the IICU was higher than that in the medical unit. In addition to the errors reported via the anonymous system during the study period, 25 errors were reported using incident reports. Thus, the rate of reporting errors using both systems was 2.87.
| Reporting system | Medical unit* | IICU | Total | RR (95% CI) |
|---|---|---|---|---|
| ||||
| Anonymous reporting | 2.26 (1.83, 2.75) | 2.97 (2.09, 4.09) | 2.41 (2.02, 2.86) | |
| Incident reports | ||||
| All years | 1.35 (1.12, 1.53) | 2.23 (1.85, 2.66) | 1.56 (1.40, 1.73) | 1.54 (1.26, 1.90) |
| 1999 | 1.16 (0.86, 1.52) | 2.21 (1.50, 3.15) | 1.41 (1.12, 1.75) | 1.72 (1.29, 2.29) |
| 2000 | 1.55 (1.20, 1.97) | 2.90 (2.09, 3.91) | 1.92 (1.57, 2.31) | 1.26 (.97, 1.67) |
| 2001 | 1.26 (0.94, 1.65) | 2.63 (1.81, 3.70) | 1.52 (1.21, 1.87) | 1.59 (1.20, 2.12) |
| 2002 | 1.41 (1.08, 1.82) | 1.34 (1.10, 1.74) | 1.40 (1.10, 1.74) | 1.73 (1.30, 2.32) |
A total of 633 incident reports were completed in the 2 study units during the analogous 3‐month periods in 1999‐2002, 538 of which were categorized as medical errors (85.0%). When all reports were considered, the rate of medical errors reported via the incident report system was 2.40/100 patient‐days (95% CI 2.21, 2.61). However, 17.3% of all errors reported in 1999, 37.2% of those reported in 2000, 40.2% of those in 2001, and 39.8% of those in 2002 pertained to mislabeled laboratory specimens. After excluding these reports, the overall rate of medical error reporting during 1999‐2002, calculated using incident report data, was 1.56/100‐patient days (95% CI 1.40, 1.73). The kappa statistic for interobserver agreement in classifying incident reports as medical errors was .615. Rates of error reporting in the medical unit and IICU are shown in Table 2.
After excluding reports dealing with mislabeled laboratory specimens, the error reporting rate was significantly higher using the anonymous system than using incident reports (RR 1.54, 95% CI 1.26, 1.90). The rate of reporting errors with the anonymous system was higher than those for reporting via incident reports in 1999, 2001, and 2002; there was no significant difference in reporting rates when the data collected with the anonymous system were compared with the data on errors reported via incident reports in 2000 (RR 1.26, 95% CI 0.97, 1.67; Table 2).
Much of the increased rate of reporting via the anonymous system came from the medical unit. The medical unit had an overall RR for anonymous reporting compared with incidence report submission of 1.77 (95% CI 1.31, 2.14); the rate of reporting via the anonymous system was significantly higher than via incident reports for each of the years 1999‐2002. Conversely, the rate of reporting observed in the IICU was not significantly increased (RR 1.33, 95% CI 0.89, 1.95, P = .07).
The types of errors reported with the 2 systems are summarized in Table 3. Although the overall distribution was only marginally different between the 2 systems (P = .054), a higher proportion of the errors reported via the anonymous system were medication errors (P = .019), whereas a higher percentage of errors reported with incident reports dealt with equipment failures (P = .033). The rate of reporting medication errors with the anonymous system (1.57 reports/100 patient‐days) was significantly higher than that via incident reports (0.83 reports/100 patient days, RR 1.90, 95% CI 1.44, 2.47). When compared with the individual years for which incident report data were available, the reporting rate for medication errors was significantly higher via the anonymous system than with incident reports for each of the years 1999‐2002.
| Type of medical error | Anonymous system n (%) | Incident reports 1999‐2002 n (%)* |
|---|---|---|
| ||
| Communication | 12 (9.2) | 43 (12.4) |
| Patient identification | 2 (1.5) | 18 (5.2) |
| Equipment failure | 3 (2.3) | 26 (7.5) |
| Medication | 85 (64.9) | 185 (53.2) |
| Treatment | 11 (8.4) | 36 (10.3) |
| Protocol violation | 15 (11.5) | 37 (10.6) |
| Medical judgment | 3 (2.3) | 3 (0.9) |
The severity of medical errors reported with the 2 systems is shown in Table 4. As can be seen, errors reported via the anonymous system and in incident reports had a similar distribution of severity, with almost 80% of medical errors classified as moderately serious. The rate of reporting serious medical errors was 0.37/100 patient‐days with the anonymous system and 0.23/100 patient‐days via incident reports (RR 1.61, 95% CI 0.91, 2.76).
| Severity of reported errors | Anonymous system n (%) | Incident reports 1999‐2001 n (%)* |
|---|---|---|
| ||
| Trivial | 10 (7.6) | 23 (6.6) |
| Moderately serious | 101 (77.1) | 272 (78.6) |
| Serious | 20 (15.3) | 51 (14.7) |
With the anonymous system, 25.2% of reported medical errors were near‐misses compared with 12.6% of the errors reported with the incident report system (P = .001). The rate of reporting near‐miss medical errors was 3‐fold higher with the anonymous system relative to reporting via incident reports (RR 3.10, 95% CI 1.91, 4.98) and was significantly higher than in each of the years data on incident reports were collected and in each of the 2 units. The reporting of errors that reached the patient was also significantly more frequent with the anonymous system than via incident reports; however, this increase was less pronounced (RR 1.32, 95% CI 1.05, 1.67). Among the 33 near‐miss events reported via the anonymous system were 10 medical errors categorized as serious. Six of these were related to medications, including two 10‐fold overdoses of morphine. Overall, the rate of reporting near‐miss medication errors was significantly higher with the anonymous system than with incident reports (RR 3.10, 95% CI 1.81, 5.24).
DISCUSSION
The results of this study suggest that implementation of an anonymous system was associated with a modest increase in the reporting of medical errors during the care of hospitalized children compared with reporting via a traditional incident report system. After excluding reports of mislabeled laboratory specimens, reported as part of a specific quality improvement project, the rate of errors reported with the anonymous system was approximately 54% higher than that using incident reports. The most striking upsurge in reporting observed with the anonymous system was the 3‐fold increase in reporting of near‐miss medical errors.
Because of different types of patients, lack of denominator data, different durations of observation, and, presumably, different inherent rates of errors, it is difficult to compare different anonymous reporting systems for medical errors. In one of the few studies dealing with pediatric patients, Suresh et al, evaluated a Web‐based anonymous reporting system in 54 neonatal intensive care units (NICUs).16 Over a 27‐month period, 1230 reports were completed via the system, for an average of slightly less than 1 report per NICU per month. This is substantially lower than the 12 errors per month reported from the IICU in our study using the anonymous system. In a study of a Web‐based anonymous system used by 18 ICUs in 11 hospitals, 854 reports were filed during a 12‐month period. The average rate of reporting ranged from 4.3 to 7.5 reports per ICU per month, with an overall mean of 6.5 reports per hospital per month.1415 However, unlike in our study, in which the anonymous system temporarily supplanted incident reports, only 2 of the 11 hospitals discontinued incident reporting.14 A national Web‐based system has been established for reporting medication errors. During a 2‐year period beginning in 1999, 154,816 medication errors were reported from 403 hospitals, for an average of 16 reports per hospital per month.18 This is less than the 28 medication errors reported per month with our anonymous system.
Anonymous systems based at a single institution have been associated with higher rates of reporting. In one study, approximately 68 events were reported per month during the first 16 weeks after full implementation of a hospitalwide anonymous system, compared with the average of 44 errors reported monthly in our project.17 In the study perhaps most comparable to ours, Osmon et al. reported on the use of an anonymously completed paper form used to report medical errors in an adult ICU.13 Patient safety advocates extensively described and promoted the reporting system prior to its use and while it was implemented. During the 6‐month study period, 8.93 medical events/100 patient‐days were reported with the system. This rate of reporting was 10‐fold higher than that reported via the standard reporting system used at that hospital.
In addition to rate of reporting medical errors, our study was designed to compare some aspects of the content of anonymous and incident reports. No statistically significant difference was found in the severity of the events reported; the rate of reporting serious medical errors was comparable between the 2 systems. This might suggest serious errors are the most likely to be reported regardless of the system used. However, given the modest number of serious events reported with either the anonymous or the incident report system (20 and 51, respectively), the power to detect a significant difference in rates was limited. Conversely, implementation of the anonymous system was associated with increased reporting of near‐miss events of all types and was a particularly useful mechanism for reporting near‐miss medication errors. Because near‐miss events may not be detected by other methods for identifying medication errors such as chart review or search for specific triggers, the use of an anonymous system may be an important tool in a multifaceted effort to improve medication safety. Perhaps the best use of an online anonymous system would be to provide a mechanism for rapid reporting of near‐miss errors, whereas other systems, such as incident reports, could be used to report errors that reach the patient.
We were surprised that although the reporting of medical errors was increased on the medical unit with the implementation of the anonymous system, there was no significant change in overall reporting in the IICU. This was possibly because reporting via incident reports was already more complete in the IICU, so that a small increase with the anonymous system was less likely to be detected However, it is equally plausible that because of the severity of illness of the patients in the IICU, physicians and staff in this unit had a perception that they did not have enough free time to report all errors. Finally, it is possible that the staff and/or clinical leadership in the medical unit was more enthusiastic about the anonymous system. Regardless, this result suggests that despite training on reporting, provision of an easy‐to‐use system, and the guarantee of anonymity, significant barriers to reporting medical errors remain.
The Kappa statistic of .526 for level of agreement between reviewers in categorizing events described with the anonymous system as medical errors indicates only a good level of agreement.20 This lack of agreement may be in part a result of the limited amount of information provided in some of the narrative reports of events. Because anonymous reports did not include names of patients or providers, it was impossible to review medical records or other information to gain additional information about the events described. However, as pointed out by others, determination of when a medical error has occurred, although seemingly simple, is frequently much less clear when reviewing actual events.21
The findings in our study should be interpreted cautiously. Because of the need for a unified system to record events across the entire hospital, anonymous reports supplanted incident reports in the 2 study units for only a 3‐month period; it is impossible to predict the long‐term trends in reporting with this system. We selected the winterspring period for the study because it is a busy time of year for children's hospitals. Rates of reporting and medical errors may change dramatically during other times of the year, particularly in a teaching hospital. An underlying assumption of our comparisons between the 2 reporting systems was that the actual rate of medical errors was unchanged throughout the period and that the differences observed were a result of more complete reporting with the anonymous system. The increased rate of reporting of medical errors found with the anonymous reporting system might have been influenced by the training given the medical personnel. It is also possible that the increased reporting rates with the anonymous system occurred because of increased publicity, both in the press and in the hospital, about medical errors and patient safety, in general. However, because there was no definite secular trend in reporting observed during the years 1999‐2002, it is unlikely that this explains our findings. Finally, it is impossible to measure the relative impact of the increased ease of reporting with the online system versus the anonymity provided.
Although the anonymous system was associated with a 54% increase in rate of reporting, it is clear that the vast majority of medical errors were not reported. If the estimates that incident reports capture 1%‐10% of errors are accurate,8, 9 the increase in reporting that we observed with the anonymous system would indicate that 1.5%15% of errors were reported. The impressive 10‐fold increase in reporting observed by Osmon et al. in their study of an anonymous system was partly a result of the very low rate of reporting with their traditional system (approximately .67 reports of medical errors/100 adult ICU patient‐days).13 A common feature of studies of anonymous systems with higher rates of reporting medical errors is the continuing presence of on‐site patient safety investigators and advocates.13, 17 Rather than the particulars of the reporting system used, this on‐site presence and advocacy may be the most important element in increasing voluntary reporting of medical errors. In our study it is likely that some of the increase in reporting observed with the anonymous system was related to publicity about the system and ongoing promotion of the importance of reporting errors by the research team.
Since completion of the study, CHRMC has been using incident reports as the main tool for collecting data on medical errors in all units. However, based on our experiences, a new reporting tool, called e‐feedback, has been instituted. The goal of this system is to allow physicians and staff members to quickly report events that may be indicative of systems problems in the delivery of care. The reports are reviewed by designated multidisciplinary teams in various units throughout the hospital so that changes can be implemented, if needed.
CONCLUSIONS
Although there was a modest increase in the number of reports, the results of this study indicate that the implementation of an anonymous online reporting system (with training on the use of the system) was not a panacea for the problem of underreporting of medical error. Use of a system such as we have described may be an effective tool for increasing the reporting of near‐miss events., However, our results suggest that methodologies in addition to voluntary or semivoluntary reporting systems are needed to more fully collect information on medical errors.
- Kohn LT,Donaldson MS, eds.To Err is Human: Building a Safer Health System.Washington, DC:National Academy Press;2000.
- American Academy of Pediatrics,Committee on Drugs and Committee on Hospital Care.Prevention of medication errors in the pediatric inpatient setting.Pediatrics.2003;112:431–436.
- ,.Measuring errors and adverse events in health care.J Gen Intern Med.2003;18:61–67.
- ,,,.Detecting adverse events for patient safety research: a review of current methodologies.J Biomed Inform.2003;36:131–143.
- ,,,.Retrospective data collection and analytical techniques for patient safety studies.J Biomed Inform.2003;36:106–119.
- ,.Reporting and preventing medical mishaps: lessons from non‐medical near miss reporting systems.BMJ.2000;320:759–763.
- .Systems for risk identification. In:Carroll R, ed.Risk Management Handbook for Health Care Organizations.3rd ed.San Francisco, CA:Josey‐Bass Inc.;2001:171–189.
- ,,,,,.The incident reporting system does not detect adverse drug event: a problem for quality improvement.Jt Comm J Qual Improv.1995;21:541–548.
- ,,,,.Comparison of methods for detecting medication errors in 36 hospitals and skilled‐nursing facilities.Am J Health Syst Pharm.2002;59:436–446.
- ,,, et al.Use of incident reports by physicians and nurses to document medical errors in pediatric patients.Pediatrics.2004;114:729–735.
- ,,,.Perceived barriers in reporting medication administration errors.Best Pract Benchmarking Healthc.1996;1:191–197.
- ,,.Reasons for not reporting adverse events: an empirical study.J Eval Clin Pract.1999;5:13–21.
- ,,,,,.Reporting of medical errors: an intensive care unit experience.Crit Care Med.2004;32:727–733.
- ,, et al.Creating the web‐based intensive care unit safety reporting system.J A med Inform Assoc.2005;12:130–139.
- ,,, et al.Development of the ICU safety reporting system.J Patient Saf.2005;1:23–32.
- ,,, et al.Voluntary anonymous reporting of medical errors for neonatal intensive care.Pediatrics.2004;113:1609–1618.
- ,,,.Development of a web‐based event reporting system in an academic environment.J Am Med Inform Assoc.2004;11:11–18.
- ,,,.Medication errors: experience of the United States Pharmacopeia (USP) MEDMARX reporting system.J Clin Pharmacol.2003;43:760–767.
- ,,, et al.Preventing medical injury.Qual Rev Bull.1993;19:144–149.
- .Hypothesis testing: categorical data. In:Fundamentals of Biostatistics.4th ed.Belmont, CA:Wadsworth Publishing Company;1995:345–443.
- ,.What is an error?Eff Clin Pract.2000;6:261–269.
The problem of medical errors in the United States has been well documented.1 There is evidence that pediatric patients may be at higher risk than are adult patients for certain types of errors.2 Ultimately, the only way to accurately assess whether pediatric patient safety is improved is by developing methodologies that will enable systematic counting of all medical errors. It is only through this technique that the effectiveness of interventions to improve safety can be adequately assessed. However, as a first step, it is crucial that data on at least a representative sample of medical errors occurring during the care of hospitalized children be collected so that the most common types and causes of these errors can be determined.
Many techniques have been used to collect data on medical errors including chart review, administrative data analysis, and malpractice claims analysis.35 Although each of these methodologies has advantages, each also has inherent biases in the types of errors that are detected. Direct observation of medical care is a powerful technique but has a number of limitations including cost.3 Voluntary or semivoluntary reporting systems have the potential to capture complete and representative information on errors, particularly near‐miss events. Voluntary reporting systems have been a highly successful method for understanding safety issues in other industries.6 In medicine, incident reports traditionally have been used as the main system for collecting data on a number of types of adverse events including medical errors.7 However, incident reports have been of limited use in understanding patient safety issues; only a small fraction of the errors made are reported, and certain types of errors are much more likely to be reported than others.4, 810 Medical professionals underreporting their own errors or those of their colleagues in incident reports may reflect fears that discovery of these errors will lead to embarrassment, job sanctions, or malpractice claims.1012
Cognizant of the tendency of professionals to underreport their errors, the aviation industry implemented a confidential reporting system for near‐miss events, the Aviation Safety Reporting System, in 1976.1 With this system, airline pilots file reports of near‐misses to a third party rather than to their employer, and the contents of the reports are kept confidential. Databases of the reports are anonymous. The implementation of the Aviation Safety Reporting System led to a substantial increase in reporting; analysis of the reports of near‐miss events has helped to significantly improve aviation safety in the past quarter century.1, 6 Based on the aviation experience, anonymous medical error reporting systems using either paper or Web‐based data entry have been implemented in adult intensive care units, neonatal intensive care units, and academic medical centers and for reporting specific types of errors.1318 There are limited data on whether these systems improve reporting of medical errors compared with use of the more traditional incident reporting systems already in place in virtually all hospitals.
We developed an online confidential and anonymous system for reporting medical errors in pediatric patients. For a 3‐month period this system replaced incident reports as the method by which medical errors were reported on 2 units in a large urban children's hospital. Data collected via the anonymous reporting system were compared with data in incident reports filed in the same 2 units during analogous 3‐month periods in the preceding 4 years. Prior to the study we postulated that substantially more medical errors would be reported through the anonymous system than through the incident reports and that information would be collected on a wider range of problems. It was hypothesized that reporting of near‐miss events would be particularly increased with the anonymous system.
METHODS
This study was conducted at Children's Hospital and Regional Medical Center (CHRMC), Seattle, Washington. CHRMC is both a community hospital serving pediatric patients and a tertiary‐care regional referral center. Two inpatient units, the infant intensive care unit (IICU) and the medical unit, participated in the project. The IICU provides care to critically ill neonates and infants up to 6 months of age; most patients admitted to the unit are premature newborns or newborns with congenital abnormalities. The medical unit is the major service for inpatient pediatric patients with nonsurgical problems. There 2 units were selected for the study because of a wide range of clinical problems, varying intensities of care and because of the clinical leadership's interest in patient safety issues.
Traditionally, medical errors at CHRMC have been documented through the use of a standard incident report system. However, during the 3‐month study period, from mid‐February through mid‐May 2003, physicians and nurses in the 2 study units were asked to report all medical errors using an electronic, anonymous reporting system that was installed on virtually all the computer workstations in the 2 units. Although all physicians and nurses were asked to use the anonymous system instead of completing incident reports, a physician or nurse who did not wish to participate in the research study could complete a standard incident report form as was consistent with hospital policy. Thus, medical errors were only reported once, either through the anonymous system for study participants or on incident reports for those who did not wish to participate in the project.
Before and during the data collection period, a member of the research team met with physicians on duty in the study units, including residents, fellows, and attending physicians, to explain the study procedures. Clinical nurse specialists in the study units provided the nursing staff with ongoing training based on a curriculum prepared specifically for the project. Topics covered in the training of both nurses and physicians included accessing the system, examples of medical errors, the importance of reporting errors, including near‐misses, and types of feedback provided. The anonymous nature of the reports was stressed, and the review procedures were explained.
During the study, nurses and physicians accessed the report form by clicking on an icon on a workstation desktop. The reporter was asked to provide the date and time when and the unit on which the event occurred. After filling in this information, the 2 dialog boxes on the form had to be completed. On the first, the reporter was asked to describe the event and on the second to report the outcome, if known, of the patient involved. All information on the form was completed using free text; there were no pull‐down menus or radio buttons. This was done to encourage more complete narratives and to be as inclusive as possible when asking nurses and physicians to report. Prior to the study, it was believed that asking potential reporters to classify whether events were errors or to classify them by type or other characterizations might keep nurses and physicians from reporting events that did not fit into a particular category and that a forced entry format would tend to reinforce current biases about errors rather than maximize the amount of new information gathered. Finally, to preserve anonymity, reporters were not asked to give any information about themselves, including profession (nurse or physician). However, they could provide their own names if they wanted feedback on the event, with the obvious loss of anonymity. Once the form was completed, the physician or nurse clicked the submit button to transmit the report to the research team.
A member of the research team reviewed every anonymous report within 48 hours of submission. If the event described was considered a medical error with the potential for serious patient injury, the investigator contacted a member of the clinical leadership of the unit (consisting of a medical director, one or more head nurses, and clinical nurse specialists) about the report. Every month members of the clinical leadership also received batched copies of all reports from their unit. Otherwise, neither the clinical nor the administrative leadership had access to the reports.
Each of the study's 3 pediatrician investigators (J.T., D.B., and E.K.) independently reviewed every report. First, the reviewer determined whether the event described constituted a medical error based on the definition provided by the Institute of Medicine.1 Events were further categorized by severity, occurrence to patient, and type. A medical error was considered serious if it resulted in or had the potential to result in permanent patient injury or death, moderately serious if it resulted in or had the potential to result in temporary physical or emotional injury, or trivial if it was unlikely to result in injury or change in treatment plan. Each error was further classified by whether it actually occurredeither as having actually happened to a patient or as being a near‐miss, an error detected before reaching the patient.
Because there is, to our knowledge, no standardized taxonomy for categorizing types of medical errors that occur in inpatient pediatric patients, a classification system was developed by the University of Washington Developmental Center for Evaluation and Research in Pediatric Patient Safety. (The developmental center and its organizational structure have been previously described).10 A preliminary classification system was patterned after the schema proposed by Leape et al. and adapted for use in pediatrics.19 After reviewing a series of incident reports for another project, the developers of this classification system for types of errors further refined it. The final taxonomy had 8 main types of medical errors, most with subtypes. The schema used for classifying types of errors in this study is shown in Table 1. Although the reviewers found frequent overlap, they determined the primary type of error for events described in each report based on this classification system. Final categorization of the errors, including severity, occurrence to patient, and type, was based on agreement by at least 2 of the 3 reviewers. In instances in which there was not sufficient agreement for categorization, the 3 reviewers reached a consensus after discussion.
| Type of error | Description |
|---|---|
| Communication | Error resulting from misunderstood verbal communication between health care providers or illegible or confusing orders |
| Patient identification | Patient with incorrect or missing identification, wrong patient receiving treatment, mislabeled laboratory slips, mislabeled or incorrect medical record |
| Equipment failure | Nonfunctioning or improperly functioning equipment such as monitors and intravenous pumps |
| Medication | Error in ordering, dispensing, or administering a drug |
| Treatment | Error in administering treatments other than medication such as procedures and intravenous fluids |
| Protocol deviation | Failure to follow established hospital procedures for providing care to patients |
| Medical judgment | Failure of a physician or nurse to properly evaluate or respond to a patient's condition, failure to respond to abnormal tests, provision of care that was clearly inappropriate |
| Other | Types of errors not otherwise listed |
For comparison, an identical review was conducted of incident reports completed in the 2 study units during the same months (mid‐February through mid‐May) in the years 1999‐2002. By including data from several previous years for comparison, the potential problem of selecting a period that was an outlier (in which one or more unusual factors led to increased or decreased reporting) was avoided. We selected the years 1999‐2002 because this was a period of increasing interest in better understanding medical errors at CHRMC. During this period, physicians and staff were encouraged to report medical errors, including near‐miss events, on incident reports. As with the anonymous electronic submissions, each investigator independently reviewed all the selected incident reports, with final classification based on the same schema used for the anonymous reports.
Comparison of the 2 reporting systems was complicated by the hospitalwide quality improvement program to increase the accuracy of labeling laboratory specimens that was ongoing during 1999‐2002. As part of this program, the hospital staff was encouraged to use the incident report system to document unlabeled or mismatched laboratory specimens and patients without proper identification from whom a laboratory specimen was to be obtained (eg, missing a hospital identification bracelet). Laboratory personnel completed most of these incident reports. In a previous review of incident report data from CHRMC, we found that 35% of medical errors reported were related to improper labeling of laboratory specimens (unpublished data). Although reporting these events may have been helpful for monitoring progress in quality improvement, many of the events described were extremely trivial in nature. Inclusion of this one specific type of event so skewed the overall number of medical errors reported that meaningful analysis of the types, relative frequencies, and reporting of errors was difficult. Based on this experience, we considered excluding this type of event from the analysis in the current study if it constituted a significant proportion of the medical errors conveyed in incident reports. Descriptions of mislabeled lab specimens or patients without identification bracelets constituted 33.8% of all incident reports from the 2 study units; no such events were described in submissions through the anonymous reporting system.
To compare the electronic anonymous and incident‐report error reporting systems, first the number of errors reported with each system was divided by the total number of patient‐days during which data were collected in the 2 units. Rates are expressed as the number of errors per 100 patient‐days. Rate ratios (RRs) with 95% confidence intervals (95% CIs) were calculated to compare the error reporting rates of the 2 reporting systems. Poisson regression was used to assess significance; a rate ratio whose 95% CI did not include 1.0 was considered statistically significant. Initial comparisons included all reports made through both systems. For subsequent comparisons, reports pertaining to mislabeled lab specimens were excluded. Error reporting rates were compared between the 2 reporting systems overall and by unit (medical unit and IICU), type, severity, and near‐miss status. In addition, to evaluate the possibility that secular trends in reporting medical errors were responsible for any observed overall differences, error reporting rates determined with the anonymous system were compared separately with incident report error rates in 1999, 2000, 2001, and 2002. Differences in the relative frequency of reporting different types of errors with the 2 systems were assessed with chi‐square tests. Kappa statistics were computed to assess the interobserver reliability of the 3 reviewers in classifying the events in the incident and anonymous reports as medical errors.
The study was approved by the Institutional Review Board of Children's Hospital and Regional Medical Center.
RESULTS
During the 3‐month study period, 146 reports were completed using the anonymous reporting system, 131 of which were classified as medical errors (89.7%). Ninety‐five errors were reported from the medical unit, and 36 were reported from the IICU. The kappa statistic for interobserver agreement in categorizing the anonymous reports as medical errors was .526. There were a total of 5420 patient‐days in the 2 units (medical service and IICU); thus, the rate of reporting medical errors via the anonymous system was 2.41/100 patient‐days (95% CI 2.02, 2.86). As shown in Table 2, the rate of errors reported in the IICU was higher than that in the medical unit. In addition to the errors reported via the anonymous system during the study period, 25 errors were reported using incident reports. Thus, the rate of reporting errors using both systems was 2.87.
| Reporting system | Medical unit* | IICU | Total | RR (95% CI) |
|---|---|---|---|---|
| ||||
| Anonymous reporting | 2.26 (1.83, 2.75) | 2.97 (2.09, 4.09) | 2.41 (2.02, 2.86) | |
| Incident reports | ||||
| All years | 1.35 (1.12, 1.53) | 2.23 (1.85, 2.66) | 1.56 (1.40, 1.73) | 1.54 (1.26, 1.90) |
| 1999 | 1.16 (0.86, 1.52) | 2.21 (1.50, 3.15) | 1.41 (1.12, 1.75) | 1.72 (1.29, 2.29) |
| 2000 | 1.55 (1.20, 1.97) | 2.90 (2.09, 3.91) | 1.92 (1.57, 2.31) | 1.26 (.97, 1.67) |
| 2001 | 1.26 (0.94, 1.65) | 2.63 (1.81, 3.70) | 1.52 (1.21, 1.87) | 1.59 (1.20, 2.12) |
| 2002 | 1.41 (1.08, 1.82) | 1.34 (1.10, 1.74) | 1.40 (1.10, 1.74) | 1.73 (1.30, 2.32) |
A total of 633 incident reports were completed in the 2 study units during the analogous 3‐month periods in 1999‐2002, 538 of which were categorized as medical errors (85.0%). When all reports were considered, the rate of medical errors reported via the incident report system was 2.40/100 patient‐days (95% CI 2.21, 2.61). However, 17.3% of all errors reported in 1999, 37.2% of those reported in 2000, 40.2% of those in 2001, and 39.8% of those in 2002 pertained to mislabeled laboratory specimens. After excluding these reports, the overall rate of medical error reporting during 1999‐2002, calculated using incident report data, was 1.56/100‐patient days (95% CI 1.40, 1.73). The kappa statistic for interobserver agreement in classifying incident reports as medical errors was .615. Rates of error reporting in the medical unit and IICU are shown in Table 2.
After excluding reports dealing with mislabeled laboratory specimens, the error reporting rate was significantly higher using the anonymous system than using incident reports (RR 1.54, 95% CI 1.26, 1.90). The rate of reporting errors with the anonymous system was higher than those for reporting via incident reports in 1999, 2001, and 2002; there was no significant difference in reporting rates when the data collected with the anonymous system were compared with the data on errors reported via incident reports in 2000 (RR 1.26, 95% CI 0.97, 1.67; Table 2).
Much of the increased rate of reporting via the anonymous system came from the medical unit. The medical unit had an overall RR for anonymous reporting compared with incidence report submission of 1.77 (95% CI 1.31, 2.14); the rate of reporting via the anonymous system was significantly higher than via incident reports for each of the years 1999‐2002. Conversely, the rate of reporting observed in the IICU was not significantly increased (RR 1.33, 95% CI 0.89, 1.95, P = .07).
The types of errors reported with the 2 systems are summarized in Table 3. Although the overall distribution was only marginally different between the 2 systems (P = .054), a higher proportion of the errors reported via the anonymous system were medication errors (P = .019), whereas a higher percentage of errors reported with incident reports dealt with equipment failures (P = .033). The rate of reporting medication errors with the anonymous system (1.57 reports/100 patient‐days) was significantly higher than that via incident reports (0.83 reports/100 patient days, RR 1.90, 95% CI 1.44, 2.47). When compared with the individual years for which incident report data were available, the reporting rate for medication errors was significantly higher via the anonymous system than with incident reports for each of the years 1999‐2002.
| Type of medical error | Anonymous system n (%) | Incident reports 1999‐2002 n (%)* |
|---|---|---|
| ||
| Communication | 12 (9.2) | 43 (12.4) |
| Patient identification | 2 (1.5) | 18 (5.2) |
| Equipment failure | 3 (2.3) | 26 (7.5) |
| Medication | 85 (64.9) | 185 (53.2) |
| Treatment | 11 (8.4) | 36 (10.3) |
| Protocol violation | 15 (11.5) | 37 (10.6) |
| Medical judgment | 3 (2.3) | 3 (0.9) |
The severity of medical errors reported with the 2 systems is shown in Table 4. As can be seen, errors reported via the anonymous system and in incident reports had a similar distribution of severity, with almost 80% of medical errors classified as moderately serious. The rate of reporting serious medical errors was 0.37/100 patient‐days with the anonymous system and 0.23/100 patient‐days via incident reports (RR 1.61, 95% CI 0.91, 2.76).
| Severity of reported errors | Anonymous system n (%) | Incident reports 1999‐2001 n (%)* |
|---|---|---|
| ||
| Trivial | 10 (7.6) | 23 (6.6) |
| Moderately serious | 101 (77.1) | 272 (78.6) |
| Serious | 20 (15.3) | 51 (14.7) |
With the anonymous system, 25.2% of reported medical errors were near‐misses compared with 12.6% of the errors reported with the incident report system (P = .001). The rate of reporting near‐miss medical errors was 3‐fold higher with the anonymous system relative to reporting via incident reports (RR 3.10, 95% CI 1.91, 4.98) and was significantly higher than in each of the years data on incident reports were collected and in each of the 2 units. The reporting of errors that reached the patient was also significantly more frequent with the anonymous system than via incident reports; however, this increase was less pronounced (RR 1.32, 95% CI 1.05, 1.67). Among the 33 near‐miss events reported via the anonymous system were 10 medical errors categorized as serious. Six of these were related to medications, including two 10‐fold overdoses of morphine. Overall, the rate of reporting near‐miss medication errors was significantly higher with the anonymous system than with incident reports (RR 3.10, 95% CI 1.81, 5.24).
DISCUSSION
The results of this study suggest that implementation of an anonymous system was associated with a modest increase in the reporting of medical errors during the care of hospitalized children compared with reporting via a traditional incident report system. After excluding reports of mislabeled laboratory specimens, reported as part of a specific quality improvement project, the rate of errors reported with the anonymous system was approximately 54% higher than that using incident reports. The most striking upsurge in reporting observed with the anonymous system was the 3‐fold increase in reporting of near‐miss medical errors.
Because of different types of patients, lack of denominator data, different durations of observation, and, presumably, different inherent rates of errors, it is difficult to compare different anonymous reporting systems for medical errors. In one of the few studies dealing with pediatric patients, Suresh et al, evaluated a Web‐based anonymous reporting system in 54 neonatal intensive care units (NICUs).16 Over a 27‐month period, 1230 reports were completed via the system, for an average of slightly less than 1 report per NICU per month. This is substantially lower than the 12 errors per month reported from the IICU in our study using the anonymous system. In a study of a Web‐based anonymous system used by 18 ICUs in 11 hospitals, 854 reports were filed during a 12‐month period. The average rate of reporting ranged from 4.3 to 7.5 reports per ICU per month, with an overall mean of 6.5 reports per hospital per month.1415 However, unlike in our study, in which the anonymous system temporarily supplanted incident reports, only 2 of the 11 hospitals discontinued incident reporting.14 A national Web‐based system has been established for reporting medication errors. During a 2‐year period beginning in 1999, 154,816 medication errors were reported from 403 hospitals, for an average of 16 reports per hospital per month.18 This is less than the 28 medication errors reported per month with our anonymous system.
Anonymous systems based at a single institution have been associated with higher rates of reporting. In one study, approximately 68 events were reported per month during the first 16 weeks after full implementation of a hospitalwide anonymous system, compared with the average of 44 errors reported monthly in our project.17 In the study perhaps most comparable to ours, Osmon et al. reported on the use of an anonymously completed paper form used to report medical errors in an adult ICU.13 Patient safety advocates extensively described and promoted the reporting system prior to its use and while it was implemented. During the 6‐month study period, 8.93 medical events/100 patient‐days were reported with the system. This rate of reporting was 10‐fold higher than that reported via the standard reporting system used at that hospital.
In addition to rate of reporting medical errors, our study was designed to compare some aspects of the content of anonymous and incident reports. No statistically significant difference was found in the severity of the events reported; the rate of reporting serious medical errors was comparable between the 2 systems. This might suggest serious errors are the most likely to be reported regardless of the system used. However, given the modest number of serious events reported with either the anonymous or the incident report system (20 and 51, respectively), the power to detect a significant difference in rates was limited. Conversely, implementation of the anonymous system was associated with increased reporting of near‐miss events of all types and was a particularly useful mechanism for reporting near‐miss medication errors. Because near‐miss events may not be detected by other methods for identifying medication errors such as chart review or search for specific triggers, the use of an anonymous system may be an important tool in a multifaceted effort to improve medication safety. Perhaps the best use of an online anonymous system would be to provide a mechanism for rapid reporting of near‐miss errors, whereas other systems, such as incident reports, could be used to report errors that reach the patient.
We were surprised that although the reporting of medical errors was increased on the medical unit with the implementation of the anonymous system, there was no significant change in overall reporting in the IICU. This was possibly because reporting via incident reports was already more complete in the IICU, so that a small increase with the anonymous system was less likely to be detected However, it is equally plausible that because of the severity of illness of the patients in the IICU, physicians and staff in this unit had a perception that they did not have enough free time to report all errors. Finally, it is possible that the staff and/or clinical leadership in the medical unit was more enthusiastic about the anonymous system. Regardless, this result suggests that despite training on reporting, provision of an easy‐to‐use system, and the guarantee of anonymity, significant barriers to reporting medical errors remain.
The Kappa statistic of .526 for level of agreement between reviewers in categorizing events described with the anonymous system as medical errors indicates only a good level of agreement.20 This lack of agreement may be in part a result of the limited amount of information provided in some of the narrative reports of events. Because anonymous reports did not include names of patients or providers, it was impossible to review medical records or other information to gain additional information about the events described. However, as pointed out by others, determination of when a medical error has occurred, although seemingly simple, is frequently much less clear when reviewing actual events.21
The findings in our study should be interpreted cautiously. Because of the need for a unified system to record events across the entire hospital, anonymous reports supplanted incident reports in the 2 study units for only a 3‐month period; it is impossible to predict the long‐term trends in reporting with this system. We selected the winterspring period for the study because it is a busy time of year for children's hospitals. Rates of reporting and medical errors may change dramatically during other times of the year, particularly in a teaching hospital. An underlying assumption of our comparisons between the 2 reporting systems was that the actual rate of medical errors was unchanged throughout the period and that the differences observed were a result of more complete reporting with the anonymous system. The increased rate of reporting of medical errors found with the anonymous reporting system might have been influenced by the training given the medical personnel. It is also possible that the increased reporting rates with the anonymous system occurred because of increased publicity, both in the press and in the hospital, about medical errors and patient safety, in general. However, because there was no definite secular trend in reporting observed during the years 1999‐2002, it is unlikely that this explains our findings. Finally, it is impossible to measure the relative impact of the increased ease of reporting with the online system versus the anonymity provided.
Although the anonymous system was associated with a 54% increase in rate of reporting, it is clear that the vast majority of medical errors were not reported. If the estimates that incident reports capture 1%‐10% of errors are accurate,8, 9 the increase in reporting that we observed with the anonymous system would indicate that 1.5%15% of errors were reported. The impressive 10‐fold increase in reporting observed by Osmon et al. in their study of an anonymous system was partly a result of the very low rate of reporting with their traditional system (approximately .67 reports of medical errors/100 adult ICU patient‐days).13 A common feature of studies of anonymous systems with higher rates of reporting medical errors is the continuing presence of on‐site patient safety investigators and advocates.13, 17 Rather than the particulars of the reporting system used, this on‐site presence and advocacy may be the most important element in increasing voluntary reporting of medical errors. In our study it is likely that some of the increase in reporting observed with the anonymous system was related to publicity about the system and ongoing promotion of the importance of reporting errors by the research team.
Since completion of the study, CHRMC has been using incident reports as the main tool for collecting data on medical errors in all units. However, based on our experiences, a new reporting tool, called e‐feedback, has been instituted. The goal of this system is to allow physicians and staff members to quickly report events that may be indicative of systems problems in the delivery of care. The reports are reviewed by designated multidisciplinary teams in various units throughout the hospital so that changes can be implemented, if needed.
CONCLUSIONS
Although there was a modest increase in the number of reports, the results of this study indicate that the implementation of an anonymous online reporting system (with training on the use of the system) was not a panacea for the problem of underreporting of medical error. Use of a system such as we have described may be an effective tool for increasing the reporting of near‐miss events., However, our results suggest that methodologies in addition to voluntary or semivoluntary reporting systems are needed to more fully collect information on medical errors.
The problem of medical errors in the United States has been well documented.1 There is evidence that pediatric patients may be at higher risk than are adult patients for certain types of errors.2 Ultimately, the only way to accurately assess whether pediatric patient safety is improved is by developing methodologies that will enable systematic counting of all medical errors. It is only through this technique that the effectiveness of interventions to improve safety can be adequately assessed. However, as a first step, it is crucial that data on at least a representative sample of medical errors occurring during the care of hospitalized children be collected so that the most common types and causes of these errors can be determined.
Many techniques have been used to collect data on medical errors including chart review, administrative data analysis, and malpractice claims analysis.35 Although each of these methodologies has advantages, each also has inherent biases in the types of errors that are detected. Direct observation of medical care is a powerful technique but has a number of limitations including cost.3 Voluntary or semivoluntary reporting systems have the potential to capture complete and representative information on errors, particularly near‐miss events. Voluntary reporting systems have been a highly successful method for understanding safety issues in other industries.6 In medicine, incident reports traditionally have been used as the main system for collecting data on a number of types of adverse events including medical errors.7 However, incident reports have been of limited use in understanding patient safety issues; only a small fraction of the errors made are reported, and certain types of errors are much more likely to be reported than others.4, 810 Medical professionals underreporting their own errors or those of their colleagues in incident reports may reflect fears that discovery of these errors will lead to embarrassment, job sanctions, or malpractice claims.1012
Cognizant of the tendency of professionals to underreport their errors, the aviation industry implemented a confidential reporting system for near‐miss events, the Aviation Safety Reporting System, in 1976.1 With this system, airline pilots file reports of near‐misses to a third party rather than to their employer, and the contents of the reports are kept confidential. Databases of the reports are anonymous. The implementation of the Aviation Safety Reporting System led to a substantial increase in reporting; analysis of the reports of near‐miss events has helped to significantly improve aviation safety in the past quarter century.1, 6 Based on the aviation experience, anonymous medical error reporting systems using either paper or Web‐based data entry have been implemented in adult intensive care units, neonatal intensive care units, and academic medical centers and for reporting specific types of errors.1318 There are limited data on whether these systems improve reporting of medical errors compared with use of the more traditional incident reporting systems already in place in virtually all hospitals.
We developed an online confidential and anonymous system for reporting medical errors in pediatric patients. For a 3‐month period this system replaced incident reports as the method by which medical errors were reported on 2 units in a large urban children's hospital. Data collected via the anonymous reporting system were compared with data in incident reports filed in the same 2 units during analogous 3‐month periods in the preceding 4 years. Prior to the study we postulated that substantially more medical errors would be reported through the anonymous system than through the incident reports and that information would be collected on a wider range of problems. It was hypothesized that reporting of near‐miss events would be particularly increased with the anonymous system.
METHODS
This study was conducted at Children's Hospital and Regional Medical Center (CHRMC), Seattle, Washington. CHRMC is both a community hospital serving pediatric patients and a tertiary‐care regional referral center. Two inpatient units, the infant intensive care unit (IICU) and the medical unit, participated in the project. The IICU provides care to critically ill neonates and infants up to 6 months of age; most patients admitted to the unit are premature newborns or newborns with congenital abnormalities. The medical unit is the major service for inpatient pediatric patients with nonsurgical problems. There 2 units were selected for the study because of a wide range of clinical problems, varying intensities of care and because of the clinical leadership's interest in patient safety issues.
Traditionally, medical errors at CHRMC have been documented through the use of a standard incident report system. However, during the 3‐month study period, from mid‐February through mid‐May 2003, physicians and nurses in the 2 study units were asked to report all medical errors using an electronic, anonymous reporting system that was installed on virtually all the computer workstations in the 2 units. Although all physicians and nurses were asked to use the anonymous system instead of completing incident reports, a physician or nurse who did not wish to participate in the research study could complete a standard incident report form as was consistent with hospital policy. Thus, medical errors were only reported once, either through the anonymous system for study participants or on incident reports for those who did not wish to participate in the project.
Before and during the data collection period, a member of the research team met with physicians on duty in the study units, including residents, fellows, and attending physicians, to explain the study procedures. Clinical nurse specialists in the study units provided the nursing staff with ongoing training based on a curriculum prepared specifically for the project. Topics covered in the training of both nurses and physicians included accessing the system, examples of medical errors, the importance of reporting errors, including near‐misses, and types of feedback provided. The anonymous nature of the reports was stressed, and the review procedures were explained.
During the study, nurses and physicians accessed the report form by clicking on an icon on a workstation desktop. The reporter was asked to provide the date and time when and the unit on which the event occurred. After filling in this information, the 2 dialog boxes on the form had to be completed. On the first, the reporter was asked to describe the event and on the second to report the outcome, if known, of the patient involved. All information on the form was completed using free text; there were no pull‐down menus or radio buttons. This was done to encourage more complete narratives and to be as inclusive as possible when asking nurses and physicians to report. Prior to the study, it was believed that asking potential reporters to classify whether events were errors or to classify them by type or other characterizations might keep nurses and physicians from reporting events that did not fit into a particular category and that a forced entry format would tend to reinforce current biases about errors rather than maximize the amount of new information gathered. Finally, to preserve anonymity, reporters were not asked to give any information about themselves, including profession (nurse or physician). However, they could provide their own names if they wanted feedback on the event, with the obvious loss of anonymity. Once the form was completed, the physician or nurse clicked the submit button to transmit the report to the research team.
A member of the research team reviewed every anonymous report within 48 hours of submission. If the event described was considered a medical error with the potential for serious patient injury, the investigator contacted a member of the clinical leadership of the unit (consisting of a medical director, one or more head nurses, and clinical nurse specialists) about the report. Every month members of the clinical leadership also received batched copies of all reports from their unit. Otherwise, neither the clinical nor the administrative leadership had access to the reports.
Each of the study's 3 pediatrician investigators (J.T., D.B., and E.K.) independently reviewed every report. First, the reviewer determined whether the event described constituted a medical error based on the definition provided by the Institute of Medicine.1 Events were further categorized by severity, occurrence to patient, and type. A medical error was considered serious if it resulted in or had the potential to result in permanent patient injury or death, moderately serious if it resulted in or had the potential to result in temporary physical or emotional injury, or trivial if it was unlikely to result in injury or change in treatment plan. Each error was further classified by whether it actually occurredeither as having actually happened to a patient or as being a near‐miss, an error detected before reaching the patient.
Because there is, to our knowledge, no standardized taxonomy for categorizing types of medical errors that occur in inpatient pediatric patients, a classification system was developed by the University of Washington Developmental Center for Evaluation and Research in Pediatric Patient Safety. (The developmental center and its organizational structure have been previously described).10 A preliminary classification system was patterned after the schema proposed by Leape et al. and adapted for use in pediatrics.19 After reviewing a series of incident reports for another project, the developers of this classification system for types of errors further refined it. The final taxonomy had 8 main types of medical errors, most with subtypes. The schema used for classifying types of errors in this study is shown in Table 1. Although the reviewers found frequent overlap, they determined the primary type of error for events described in each report based on this classification system. Final categorization of the errors, including severity, occurrence to patient, and type, was based on agreement by at least 2 of the 3 reviewers. In instances in which there was not sufficient agreement for categorization, the 3 reviewers reached a consensus after discussion.
| Type of error | Description |
|---|---|
| Communication | Error resulting from misunderstood verbal communication between health care providers or illegible or confusing orders |
| Patient identification | Patient with incorrect or missing identification, wrong patient receiving treatment, mislabeled laboratory slips, mislabeled or incorrect medical record |
| Equipment failure | Nonfunctioning or improperly functioning equipment such as monitors and intravenous pumps |
| Medication | Error in ordering, dispensing, or administering a drug |
| Treatment | Error in administering treatments other than medication such as procedures and intravenous fluids |
| Protocol deviation | Failure to follow established hospital procedures for providing care to patients |
| Medical judgment | Failure of a physician or nurse to properly evaluate or respond to a patient's condition, failure to respond to abnormal tests, provision of care that was clearly inappropriate |
| Other | Types of errors not otherwise listed |
For comparison, an identical review was conducted of incident reports completed in the 2 study units during the same months (mid‐February through mid‐May) in the years 1999‐2002. By including data from several previous years for comparison, the potential problem of selecting a period that was an outlier (in which one or more unusual factors led to increased or decreased reporting) was avoided. We selected the years 1999‐2002 because this was a period of increasing interest in better understanding medical errors at CHRMC. During this period, physicians and staff were encouraged to report medical errors, including near‐miss events, on incident reports. As with the anonymous electronic submissions, each investigator independently reviewed all the selected incident reports, with final classification based on the same schema used for the anonymous reports.
Comparison of the 2 reporting systems was complicated by the hospitalwide quality improvement program to increase the accuracy of labeling laboratory specimens that was ongoing during 1999‐2002. As part of this program, the hospital staff was encouraged to use the incident report system to document unlabeled or mismatched laboratory specimens and patients without proper identification from whom a laboratory specimen was to be obtained (eg, missing a hospital identification bracelet). Laboratory personnel completed most of these incident reports. In a previous review of incident report data from CHRMC, we found that 35% of medical errors reported were related to improper labeling of laboratory specimens (unpublished data). Although reporting these events may have been helpful for monitoring progress in quality improvement, many of the events described were extremely trivial in nature. Inclusion of this one specific type of event so skewed the overall number of medical errors reported that meaningful analysis of the types, relative frequencies, and reporting of errors was difficult. Based on this experience, we considered excluding this type of event from the analysis in the current study if it constituted a significant proportion of the medical errors conveyed in incident reports. Descriptions of mislabeled lab specimens or patients without identification bracelets constituted 33.8% of all incident reports from the 2 study units; no such events were described in submissions through the anonymous reporting system.
To compare the electronic anonymous and incident‐report error reporting systems, first the number of errors reported with each system was divided by the total number of patient‐days during which data were collected in the 2 units. Rates are expressed as the number of errors per 100 patient‐days. Rate ratios (RRs) with 95% confidence intervals (95% CIs) were calculated to compare the error reporting rates of the 2 reporting systems. Poisson regression was used to assess significance; a rate ratio whose 95% CI did not include 1.0 was considered statistically significant. Initial comparisons included all reports made through both systems. For subsequent comparisons, reports pertaining to mislabeled lab specimens were excluded. Error reporting rates were compared between the 2 reporting systems overall and by unit (medical unit and IICU), type, severity, and near‐miss status. In addition, to evaluate the possibility that secular trends in reporting medical errors were responsible for any observed overall differences, error reporting rates determined with the anonymous system were compared separately with incident report error rates in 1999, 2000, 2001, and 2002. Differences in the relative frequency of reporting different types of errors with the 2 systems were assessed with chi‐square tests. Kappa statistics were computed to assess the interobserver reliability of the 3 reviewers in classifying the events in the incident and anonymous reports as medical errors.
The study was approved by the Institutional Review Board of Children's Hospital and Regional Medical Center.
RESULTS
During the 3‐month study period, 146 reports were completed using the anonymous reporting system, 131 of which were classified as medical errors (89.7%). Ninety‐five errors were reported from the medical unit, and 36 were reported from the IICU. The kappa statistic for interobserver agreement in categorizing the anonymous reports as medical errors was .526. There were a total of 5420 patient‐days in the 2 units (medical service and IICU); thus, the rate of reporting medical errors via the anonymous system was 2.41/100 patient‐days (95% CI 2.02, 2.86). As shown in Table 2, the rate of errors reported in the IICU was higher than that in the medical unit. In addition to the errors reported via the anonymous system during the study period, 25 errors were reported using incident reports. Thus, the rate of reporting errors using both systems was 2.87.
| Reporting system | Medical unit* | IICU | Total | RR (95% CI) |
|---|---|---|---|---|
| ||||
| Anonymous reporting | 2.26 (1.83, 2.75) | 2.97 (2.09, 4.09) | 2.41 (2.02, 2.86) | |
| Incident reports | ||||
| All years | 1.35 (1.12, 1.53) | 2.23 (1.85, 2.66) | 1.56 (1.40, 1.73) | 1.54 (1.26, 1.90) |
| 1999 | 1.16 (0.86, 1.52) | 2.21 (1.50, 3.15) | 1.41 (1.12, 1.75) | 1.72 (1.29, 2.29) |
| 2000 | 1.55 (1.20, 1.97) | 2.90 (2.09, 3.91) | 1.92 (1.57, 2.31) | 1.26 (.97, 1.67) |
| 2001 | 1.26 (0.94, 1.65) | 2.63 (1.81, 3.70) | 1.52 (1.21, 1.87) | 1.59 (1.20, 2.12) |
| 2002 | 1.41 (1.08, 1.82) | 1.34 (1.10, 1.74) | 1.40 (1.10, 1.74) | 1.73 (1.30, 2.32) |
A total of 633 incident reports were completed in the 2 study units during the analogous 3‐month periods in 1999‐2002, 538 of which were categorized as medical errors (85.0%). When all reports were considered, the rate of medical errors reported via the incident report system was 2.40/100 patient‐days (95% CI 2.21, 2.61). However, 17.3% of all errors reported in 1999, 37.2% of those reported in 2000, 40.2% of those in 2001, and 39.8% of those in 2002 pertained to mislabeled laboratory specimens. After excluding these reports, the overall rate of medical error reporting during 1999‐2002, calculated using incident report data, was 1.56/100‐patient days (95% CI 1.40, 1.73). The kappa statistic for interobserver agreement in classifying incident reports as medical errors was .615. Rates of error reporting in the medical unit and IICU are shown in Table 2.
After excluding reports dealing with mislabeled laboratory specimens, the error reporting rate was significantly higher using the anonymous system than using incident reports (RR 1.54, 95% CI 1.26, 1.90). The rate of reporting errors with the anonymous system was higher than those for reporting via incident reports in 1999, 2001, and 2002; there was no significant difference in reporting rates when the data collected with the anonymous system were compared with the data on errors reported via incident reports in 2000 (RR 1.26, 95% CI 0.97, 1.67; Table 2).
Much of the increased rate of reporting via the anonymous system came from the medical unit. The medical unit had an overall RR for anonymous reporting compared with incidence report submission of 1.77 (95% CI 1.31, 2.14); the rate of reporting via the anonymous system was significantly higher than via incident reports for each of the years 1999‐2002. Conversely, the rate of reporting observed in the IICU was not significantly increased (RR 1.33, 95% CI 0.89, 1.95, P = .07).
The types of errors reported with the 2 systems are summarized in Table 3. Although the overall distribution was only marginally different between the 2 systems (P = .054), a higher proportion of the errors reported via the anonymous system were medication errors (P = .019), whereas a higher percentage of errors reported with incident reports dealt with equipment failures (P = .033). The rate of reporting medication errors with the anonymous system (1.57 reports/100 patient‐days) was significantly higher than that via incident reports (0.83 reports/100 patient days, RR 1.90, 95% CI 1.44, 2.47). When compared with the individual years for which incident report data were available, the reporting rate for medication errors was significantly higher via the anonymous system than with incident reports for each of the years 1999‐2002.
| Type of medical error | Anonymous system n (%) | Incident reports 1999‐2002 n (%)* |
|---|---|---|
| ||
| Communication | 12 (9.2) | 43 (12.4) |
| Patient identification | 2 (1.5) | 18 (5.2) |
| Equipment failure | 3 (2.3) | 26 (7.5) |
| Medication | 85 (64.9) | 185 (53.2) |
| Treatment | 11 (8.4) | 36 (10.3) |
| Protocol violation | 15 (11.5) | 37 (10.6) |
| Medical judgment | 3 (2.3) | 3 (0.9) |
The severity of medical errors reported with the 2 systems is shown in Table 4. As can be seen, errors reported via the anonymous system and in incident reports had a similar distribution of severity, with almost 80% of medical errors classified as moderately serious. The rate of reporting serious medical errors was 0.37/100 patient‐days with the anonymous system and 0.23/100 patient‐days via incident reports (RR 1.61, 95% CI 0.91, 2.76).
| Severity of reported errors | Anonymous system n (%) | Incident reports 1999‐2001 n (%)* |
|---|---|---|
| ||
| Trivial | 10 (7.6) | 23 (6.6) |
| Moderately serious | 101 (77.1) | 272 (78.6) |
| Serious | 20 (15.3) | 51 (14.7) |
With the anonymous system, 25.2% of reported medical errors were near‐misses compared with 12.6% of the errors reported with the incident report system (P = .001). The rate of reporting near‐miss medical errors was 3‐fold higher with the anonymous system relative to reporting via incident reports (RR 3.10, 95% CI 1.91, 4.98) and was significantly higher than in each of the years data on incident reports were collected and in each of the 2 units. The reporting of errors that reached the patient was also significantly more frequent with the anonymous system than via incident reports; however, this increase was less pronounced (RR 1.32, 95% CI 1.05, 1.67). Among the 33 near‐miss events reported via the anonymous system were 10 medical errors categorized as serious. Six of these were related to medications, including two 10‐fold overdoses of morphine. Overall, the rate of reporting near‐miss medication errors was significantly higher with the anonymous system than with incident reports (RR 3.10, 95% CI 1.81, 5.24).
DISCUSSION
The results of this study suggest that implementation of an anonymous system was associated with a modest increase in the reporting of medical errors during the care of hospitalized children compared with reporting via a traditional incident report system. After excluding reports of mislabeled laboratory specimens, reported as part of a specific quality improvement project, the rate of errors reported with the anonymous system was approximately 54% higher than that using incident reports. The most striking upsurge in reporting observed with the anonymous system was the 3‐fold increase in reporting of near‐miss medical errors.
Because of different types of patients, lack of denominator data, different durations of observation, and, presumably, different inherent rates of errors, it is difficult to compare different anonymous reporting systems for medical errors. In one of the few studies dealing with pediatric patients, Suresh et al, evaluated a Web‐based anonymous reporting system in 54 neonatal intensive care units (NICUs).16 Over a 27‐month period, 1230 reports were completed via the system, for an average of slightly less than 1 report per NICU per month. This is substantially lower than the 12 errors per month reported from the IICU in our study using the anonymous system. In a study of a Web‐based anonymous system used by 18 ICUs in 11 hospitals, 854 reports were filed during a 12‐month period. The average rate of reporting ranged from 4.3 to 7.5 reports per ICU per month, with an overall mean of 6.5 reports per hospital per month.1415 However, unlike in our study, in which the anonymous system temporarily supplanted incident reports, only 2 of the 11 hospitals discontinued incident reporting.14 A national Web‐based system has been established for reporting medication errors. During a 2‐year period beginning in 1999, 154,816 medication errors were reported from 403 hospitals, for an average of 16 reports per hospital per month.18 This is less than the 28 medication errors reported per month with our anonymous system.
Anonymous systems based at a single institution have been associated with higher rates of reporting. In one study, approximately 68 events were reported per month during the first 16 weeks after full implementation of a hospitalwide anonymous system, compared with the average of 44 errors reported monthly in our project.17 In the study perhaps most comparable to ours, Osmon et al. reported on the use of an anonymously completed paper form used to report medical errors in an adult ICU.13 Patient safety advocates extensively described and promoted the reporting system prior to its use and while it was implemented. During the 6‐month study period, 8.93 medical events/100 patient‐days were reported with the system. This rate of reporting was 10‐fold higher than that reported via the standard reporting system used at that hospital.
In addition to rate of reporting medical errors, our study was designed to compare some aspects of the content of anonymous and incident reports. No statistically significant difference was found in the severity of the events reported; the rate of reporting serious medical errors was comparable between the 2 systems. This might suggest serious errors are the most likely to be reported regardless of the system used. However, given the modest number of serious events reported with either the anonymous or the incident report system (20 and 51, respectively), the power to detect a significant difference in rates was limited. Conversely, implementation of the anonymous system was associated with increased reporting of near‐miss events of all types and was a particularly useful mechanism for reporting near‐miss medication errors. Because near‐miss events may not be detected by other methods for identifying medication errors such as chart review or search for specific triggers, the use of an anonymous system may be an important tool in a multifaceted effort to improve medication safety. Perhaps the best use of an online anonymous system would be to provide a mechanism for rapid reporting of near‐miss errors, whereas other systems, such as incident reports, could be used to report errors that reach the patient.
We were surprised that although the reporting of medical errors was increased on the medical unit with the implementation of the anonymous system, there was no significant change in overall reporting in the IICU. This was possibly because reporting via incident reports was already more complete in the IICU, so that a small increase with the anonymous system was less likely to be detected However, it is equally plausible that because of the severity of illness of the patients in the IICU, physicians and staff in this unit had a perception that they did not have enough free time to report all errors. Finally, it is possible that the staff and/or clinical leadership in the medical unit was more enthusiastic about the anonymous system. Regardless, this result suggests that despite training on reporting, provision of an easy‐to‐use system, and the guarantee of anonymity, significant barriers to reporting medical errors remain.
The Kappa statistic of .526 for level of agreement between reviewers in categorizing events described with the anonymous system as medical errors indicates only a good level of agreement.20 This lack of agreement may be in part a result of the limited amount of information provided in some of the narrative reports of events. Because anonymous reports did not include names of patients or providers, it was impossible to review medical records or other information to gain additional information about the events described. However, as pointed out by others, determination of when a medical error has occurred, although seemingly simple, is frequently much less clear when reviewing actual events.21
The findings in our study should be interpreted cautiously. Because of the need for a unified system to record events across the entire hospital, anonymous reports supplanted incident reports in the 2 study units for only a 3‐month period; it is impossible to predict the long‐term trends in reporting with this system. We selected the winterspring period for the study because it is a busy time of year for children's hospitals. Rates of reporting and medical errors may change dramatically during other times of the year, particularly in a teaching hospital. An underlying assumption of our comparisons between the 2 reporting systems was that the actual rate of medical errors was unchanged throughout the period and that the differences observed were a result of more complete reporting with the anonymous system. The increased rate of reporting of medical errors found with the anonymous reporting system might have been influenced by the training given the medical personnel. It is also possible that the increased reporting rates with the anonymous system occurred because of increased publicity, both in the press and in the hospital, about medical errors and patient safety, in general. However, because there was no definite secular trend in reporting observed during the years 1999‐2002, it is unlikely that this explains our findings. Finally, it is impossible to measure the relative impact of the increased ease of reporting with the online system versus the anonymity provided.
Although the anonymous system was associated with a 54% increase in rate of reporting, it is clear that the vast majority of medical errors were not reported. If the estimates that incident reports capture 1%‐10% of errors are accurate,8, 9 the increase in reporting that we observed with the anonymous system would indicate that 1.5%15% of errors were reported. The impressive 10‐fold increase in reporting observed by Osmon et al. in their study of an anonymous system was partly a result of the very low rate of reporting with their traditional system (approximately .67 reports of medical errors/100 adult ICU patient‐days).13 A common feature of studies of anonymous systems with higher rates of reporting medical errors is the continuing presence of on‐site patient safety investigators and advocates.13, 17 Rather than the particulars of the reporting system used, this on‐site presence and advocacy may be the most important element in increasing voluntary reporting of medical errors. In our study it is likely that some of the increase in reporting observed with the anonymous system was related to publicity about the system and ongoing promotion of the importance of reporting errors by the research team.
Since completion of the study, CHRMC has been using incident reports as the main tool for collecting data on medical errors in all units. However, based on our experiences, a new reporting tool, called e‐feedback, has been instituted. The goal of this system is to allow physicians and staff members to quickly report events that may be indicative of systems problems in the delivery of care. The reports are reviewed by designated multidisciplinary teams in various units throughout the hospital so that changes can be implemented, if needed.
CONCLUSIONS
Although there was a modest increase in the number of reports, the results of this study indicate that the implementation of an anonymous online reporting system (with training on the use of the system) was not a panacea for the problem of underreporting of medical error. Use of a system such as we have described may be an effective tool for increasing the reporting of near‐miss events., However, our results suggest that methodologies in addition to voluntary or semivoluntary reporting systems are needed to more fully collect information on medical errors.
- Kohn LT,Donaldson MS, eds.To Err is Human: Building a Safer Health System.Washington, DC:National Academy Press;2000.
- American Academy of Pediatrics,Committee on Drugs and Committee on Hospital Care.Prevention of medication errors in the pediatric inpatient setting.Pediatrics.2003;112:431–436.
- ,.Measuring errors and adverse events in health care.J Gen Intern Med.2003;18:61–67.
- ,,,.Detecting adverse events for patient safety research: a review of current methodologies.J Biomed Inform.2003;36:131–143.
- ,,,.Retrospective data collection and analytical techniques for patient safety studies.J Biomed Inform.2003;36:106–119.
- ,.Reporting and preventing medical mishaps: lessons from non‐medical near miss reporting systems.BMJ.2000;320:759–763.
- .Systems for risk identification. In:Carroll R, ed.Risk Management Handbook for Health Care Organizations.3rd ed.San Francisco, CA:Josey‐Bass Inc.;2001:171–189.
- ,,,,,.The incident reporting system does not detect adverse drug event: a problem for quality improvement.Jt Comm J Qual Improv.1995;21:541–548.
- ,,,,.Comparison of methods for detecting medication errors in 36 hospitals and skilled‐nursing facilities.Am J Health Syst Pharm.2002;59:436–446.
- ,,, et al.Use of incident reports by physicians and nurses to document medical errors in pediatric patients.Pediatrics.2004;114:729–735.
- ,,,.Perceived barriers in reporting medication administration errors.Best Pract Benchmarking Healthc.1996;1:191–197.
- ,,.Reasons for not reporting adverse events: an empirical study.J Eval Clin Pract.1999;5:13–21.
- ,,,,,.Reporting of medical errors: an intensive care unit experience.Crit Care Med.2004;32:727–733.
- ,, et al.Creating the web‐based intensive care unit safety reporting system.J A med Inform Assoc.2005;12:130–139.
- ,,, et al.Development of the ICU safety reporting system.J Patient Saf.2005;1:23–32.
- ,,, et al.Voluntary anonymous reporting of medical errors for neonatal intensive care.Pediatrics.2004;113:1609–1618.
- ,,,.Development of a web‐based event reporting system in an academic environment.J Am Med Inform Assoc.2004;11:11–18.
- ,,,.Medication errors: experience of the United States Pharmacopeia (USP) MEDMARX reporting system.J Clin Pharmacol.2003;43:760–767.
- ,,, et al.Preventing medical injury.Qual Rev Bull.1993;19:144–149.
- .Hypothesis testing: categorical data. In:Fundamentals of Biostatistics.4th ed.Belmont, CA:Wadsworth Publishing Company;1995:345–443.
- ,.What is an error?Eff Clin Pract.2000;6:261–269.
- Kohn LT,Donaldson MS, eds.To Err is Human: Building a Safer Health System.Washington, DC:National Academy Press;2000.
- American Academy of Pediatrics,Committee on Drugs and Committee on Hospital Care.Prevention of medication errors in the pediatric inpatient setting.Pediatrics.2003;112:431–436.
- ,.Measuring errors and adverse events in health care.J Gen Intern Med.2003;18:61–67.
- ,,,.Detecting adverse events for patient safety research: a review of current methodologies.J Biomed Inform.2003;36:131–143.
- ,,,.Retrospective data collection and analytical techniques for patient safety studies.J Biomed Inform.2003;36:106–119.
- ,.Reporting and preventing medical mishaps: lessons from non‐medical near miss reporting systems.BMJ.2000;320:759–763.
- .Systems for risk identification. In:Carroll R, ed.Risk Management Handbook for Health Care Organizations.3rd ed.San Francisco, CA:Josey‐Bass Inc.;2001:171–189.
- ,,,,,.The incident reporting system does not detect adverse drug event: a problem for quality improvement.Jt Comm J Qual Improv.1995;21:541–548.
- ,,,,.Comparison of methods for detecting medication errors in 36 hospitals and skilled‐nursing facilities.Am J Health Syst Pharm.2002;59:436–446.
- ,,, et al.Use of incident reports by physicians and nurses to document medical errors in pediatric patients.Pediatrics.2004;114:729–735.
- ,,,.Perceived barriers in reporting medication administration errors.Best Pract Benchmarking Healthc.1996;1:191–197.
- ,,.Reasons for not reporting adverse events: an empirical study.J Eval Clin Pract.1999;5:13–21.
- ,,,,,.Reporting of medical errors: an intensive care unit experience.Crit Care Med.2004;32:727–733.
- ,, et al.Creating the web‐based intensive care unit safety reporting system.J A med Inform Assoc.2005;12:130–139.
- ,,, et al.Development of the ICU safety reporting system.J Patient Saf.2005;1:23–32.
- ,,, et al.Voluntary anonymous reporting of medical errors for neonatal intensive care.Pediatrics.2004;113:1609–1618.
- ,,,.Development of a web‐based event reporting system in an academic environment.J Am Med Inform Assoc.2004;11:11–18.
- ,,,.Medication errors: experience of the United States Pharmacopeia (USP) MEDMARX reporting system.J Clin Pharmacol.2003;43:760–767.
- ,,, et al.Preventing medical injury.Qual Rev Bull.1993;19:144–149.
- .Hypothesis testing: categorical data. In:Fundamentals of Biostatistics.4th ed.Belmont, CA:Wadsworth Publishing Company;1995:345–443.
- ,.What is an error?Eff Clin Pract.2000;6:261–269.
Copyright © 2007 Society of Hospital Medicine
Inpatient Diabetes Care
Diabetes confers a substantial burden on the hospital system. Diabetes is the fourth‐leading comorbid condition associated with any hospital discharge in the United States1. During 2001, for more than 500,000 patients discharged from U.S. hospitals diabetes was listed as the principal diagnosis and for more than 4 million it was listed as a codiagnosis.2, 3 Nearly one‐third of diabetes patients require at least 2 hospitalizations annually,4 and inpatient stays account for the largest proportion of direct medical expenses incurred by persons with the disease.5
Numerous studies have demonstrated that hyperglycemia is associated with adverse outcomes of hospitalized patients.68 However, studies have also confirmed that attention to lowering glucose levels in the hospital improves patient outcomes.7, 8 Although inpatients with known diabetes will likely constitute the largest and most visible percentage of those who will require treatment for high glucose, the recommendation to control glucose applies to all inpatients regardless of whether they have been diagnosed with diabetes prior to hospitalization or have manifested hyperglycemia only during the hospital stay.79
Now that the relationship between hyperglycemia and hospital outcomes is well established, the task of organizations that deliver care and set policy is to translate current recommendations of good glucose control into real‐world hospital settings. Quality improvement organizations are currently working toward developing and disseminating performance measures for control of inpatient hyperglycemia.10, 11 Although management of hospital hyperglycemia is often perceived as suboptimal,12 actual data are limited and are based on review of small numbers of charts,1315 and information is even sparser on the pharmacologic strategies being used to treat inpatient hyperglycemia. Before educational programs and policies can be developed, individual hospital systems need to gain more insight into how hyperglycemia is being managed in the hospital.
We reported previously the results of a review of a small number of charts (n = 90) of patients hospitalized with diabetes. The findings from this review suggested there was clinical inertia in glycemia management in the hospital.15 Clinical inertia was originally described in relationship to diabetes care in the outpatient setting and was defined as a failure to perform a needed service or make a change in treatment when indicated.16, 17 Since the original description, additional reports have documented the problem of clinical inertia, but these have all been based on experiences in the outpatient setting.1822 To our knowledge, our previous report was the first to question whether clinical inertia occurred in the hospital environment. In addition, we described the negative therapeutic momentuma deintensification of treatment despite ongoing hyperglycemia15. However, our prior study examined only a small number of cases and did not include detailed data on pharmacologic treatment for hyperglycemia. Therefore, we expanded our analysis using an information systems rather than a chart reviewbased methodology to assess the status of hyperglycemia management in our hospital.
METHODS
Setting
Our tertiary‐care academic teaching hospital is a 200‐bed facility in metropolitan Phoenix, Arizona. All adult general medical and surgical specialties are represented, including transplantation services; the hospital also has a level 2 trauma center and an inpatient rehabilitation unit. Care is provided by various types of practitioners, including postgraduate trainees, faculty, physician assistants, and nurse‐practitioners. An electronic medical record links outpatient and inpatient records with laboratory results and pharmacy orders. The core electronic health record system is the Centricity/LastWord platform, provided by GE/IDX. The ancillary core systems, including laboratory and pharmacy, are interfaced with the Centricity system and maintained by on‐site Mayo Clinic information technology professionals.
Case Selection
Patients discharged with an International Classification of Diseases, 9th Revision, Clinical Modification (ICD‐9‐CM) diagnosis code for diabetes (ICD‐9‐CM code 250.xx) or hyperglycemia (ICD‐9‐CM code 790.6) were identified in a search of the hospital's electronic billing records.24 Our facility does not provide obstetric or pediatric services; therefore, corresponding ICD‐9‐CM codes for those populations were not included. Both primary and nonprimary diagnostic fields were searched. Discharges were extracted for the period between January 1, 2001, and December 31, 2004. Data retrieved included patient age, ethnicity/race, length of stay (LOS), and type of hospital service with primary responsibility for the patient's care. For confidentiality reasons, individual patients were not identified, and the unit of analysis was the discharge.
Our analyses focused principally on the noncritically ill, defined as those patients who did not require a stay in our intensive or intermediate care units; critically ill patients were identified based on room location in the data set and excluded. The reasons this study assessed hyperglycemia management in the noncritically ill were 2‐fold. First, the critically ill may migrate in and out of intensive care depending on their health status and thus experience different intensities of glucose management. Second, in our facility the therapeutic approach to hyperglycemia management is different for the critically ill than for the noncritically ill; the critically ill may receive intravenous and/or subcutaneous insulin, whereas subcutaneous insulin therapy only is given to the noncritically ill. Thus, the noncritically ill represent a more clearly defined patient population whose therapies would be easier to evaluate. We also restricted the final analysis to patients who had a LOS of 3 days or less, so that differences in glucose control and insulin therapy between the first and last 24 hours of hospital stay could be assessed.
Data on 30 randomly chosen patients from different years was extracted from electronic records. A spreadsheet of the data was compared against data in our online electronic medical records. The online data were printed, and packets were made of the data for each patient selected for review. The patient demographic information was validated against our registration screen. Inpatient stay was validated to verify a patient was in intensive or intermediate care. The result of each glucose test performed while the patient was in the hospital was printed and the calculations validated. The insulin given while the patient was hospitalized was also printed and reviewed to verify the type of insulin and calculations for the amounts of insulin given.
Assessment of Glycemic Control
After extraction of hospital cases, data were linked via patient identifiers to our electronic laboratory database to retrieve information on glucose values. Glucose data included both blood and bedside measurements. In our institution, bedside glucose monitoring is performed with an instrument that scans and records patient identification, followed by direct downloading to our laboratory database. Commercial software (Medical Automation Systems, Charlottesville, VA) facilitates the interfacing of glucometer data with the electronic laboratory file.
Nearly all hospitalized patients had either bedside glucose (84%) or blood glucose (86%) data available for analysis. However, the mean number of bedside glucose measurements was 3.4 per day, whereas the average number of blood glucose measurements was only 1.0 per day. Because of the greater number of bedside measurements and because practitioners typically make therapeutic decisions about hyperglycemia management on the basis of daily bedside glucose results, these values were used to assess glycemic control of patients in the hospital discharge data.15
To assess glycemic control, we used methods similar to those previously published by ourselves and others.15, 23 We averaged each patient's available bedside glucose measurements to determine the composite average (BedGlucavg). We also computed the average of bedside glucose measurements obtained during the first 24 hours after admission (F24BedGlucavg) and during the last 24 hours before discharge (L24BedGlucavg), then examined the distributions of BedGlucavg, F24BedGlucavg, and L24BedGlucavg. The first 24‐hour period was calculated forward from the recorded time of admission, and the last 24‐hour period was calculated backward from the time of discharge. We calculated the frequency that each patient's bedside measurements showed hypoglycemia (bedside glucose < 70, < 60, < 50, or < 40 mg/dL) and showed hyperglycemia (bedside glucose >2 00, > 250, > 300, > 350, or > 400 mg/dL). Results were recorded as the number of values per 100 measurements per person; this method allowed adjustment for variation in the individual number of measurements and captured information on multiple episodes of hypo‐ or hyperglycemia of individual patients.15, 23
Hyperglycemia Therapy
Links to our inpatient pharmacy database enabled determination of types of pharmacotherapy actually administered to patients to treat hyperglycemia. Our electronic pharmacy records are designed so that intravenous medications (eg, intravenous insulin), scheduled oral and subcutaneous medications (eg, subcutaneous insulin), and medications administered on a one‐time or as‐needed basis (eg, sliding‐scale insulin) are documented electronically as separate categories. In our facility, intravenous insulin is administered only in the intensive care setting or as a component of total parenteral nutrition, and we excluded intravenous insulin use from this data. Thus, our analysis of insulin therapy focused only on elucidating patterns of subcutaneous treatment.
We classified hyperglycemia treatment as no therapy, oral agents only, oral agents plus insulin, and insulin only. Patients were regarded as having received an oral agent or insulin if they were administered the medication at any time during their inpatient stay. For management of hyperglycemia in noncritically ill patients, the use of a programmed basal‐bolus insulin program is advocated rather than the use of only a short‐acting bolus or sliding‐scale regimen.7, 8 Therefore, we further examined the insulin treatment strategies by classifying the type of regimen as basal only (if only an extended‐release preparation was used), as basal bolus (if the therapy consisted of a long‐acting plus a short‐acting formulation), or as bolus only (if the only insulin administered was a short‐acting preparation).
In addition to characterizing the general therapeutic approaches to hyperglycemia, we determined changes in the amount of insulin administered according to the severity of the hyperglycemia. Among patients who received insulin, we compared the average total units of insulin used during the last 24 hours before discharge with the amount administered during the first 24 hours of hospitalization. If more units were used during the last 24 hours than in the first 24 hours, the amount of insulin administered was categorized as having increased; if fewer units were provided during the last 24 hours, then the insulin amount was classified as having decreased; otherwise, no change was considered to have occurred. The BedGlucavg values were divided into 3 intervals using tertile cut points, and the differences in the proportion of patients by each type of insulin treatment regimen and the categories of insulin change were compared across tertiles; differences in proportions were determined using the 2 statistic.
RESULTS
Patient Characteristics
Between January 1, 2001, and December 31, 2004, a total of 7361 patients were discharged from our facility with either a diabetes or a hyperglycemia diagnosis (16% of all discharges); the percentage of discharges associated with these diagnoses increased from 14.9% in 2001 to 16.4% in 2004. Most patients with diabetes or hyperglycemia (5198 or 71%) received care outside the intensive‐ or intermediate‐care setting.
Among the noncritically ill patients whose LOS was at least 3 days (N = 2916), average age was 69 years, and average LOS was 5.7 days. Most of the discharged patients were men (57%), and 90% were white. Most patients were discharged from primary care (45%; general internal medicine or family medicine) or surgical services (34%), with the rest discharged from other specialties (eg, cardiology, transplant medicine). Compared to the noncritically ill, who had an LOS of at least 3 days, those noncritically patients whose LOS was less than 3 days (n = 2282) were slightly younger (mean age 68 versus 69 years, P < .001 by Mann‐Whitney testing) but were comparable in sex and race distribution (P > .07 for both by chi‐square testing).
Glycemic Control
The median duration between admission and time of first bedside glucose measurement was 3.0 hours. Patients had an average of 19 bedside glucose measurements; the overall mean number of bedside measurements was 3.4 per day, 3.7 during the first 24‐hour period, and 3.4 during the last 24 hours of hospitalization. Nearly 25% of patients were hyperglycemic (bedside glucose > 200 mg/dL) during the first 24 hours of hospitalization (Fig. 1A), 20% had persistent hyperglycemia throughout the entire hospitalization (Fig. 1B), and 21% were hyperglycemic during the 24 hours before discharge (Fig. 1C), with some patients discharged with an average bedside glucose of at least 300 mg/dL during the 24 hours before discharge.
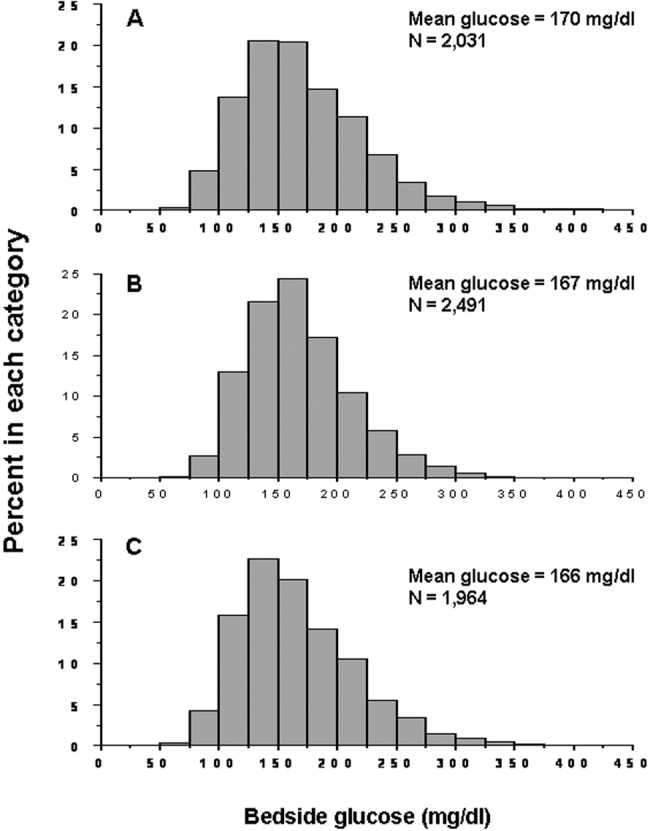
The incidence of hypoglycemic episodes was lower than that of hyperglycemic episodes: 21% of patients had at least 1 bedside glucose value less than 70 mg/dL, but 68% had at least 1 value greater than 200 mg/dL. The frequency of hypoglycemic measurements was low (Fig. 2A) compared with the frequency of hyperglycemic episodes (Fig. 2B).
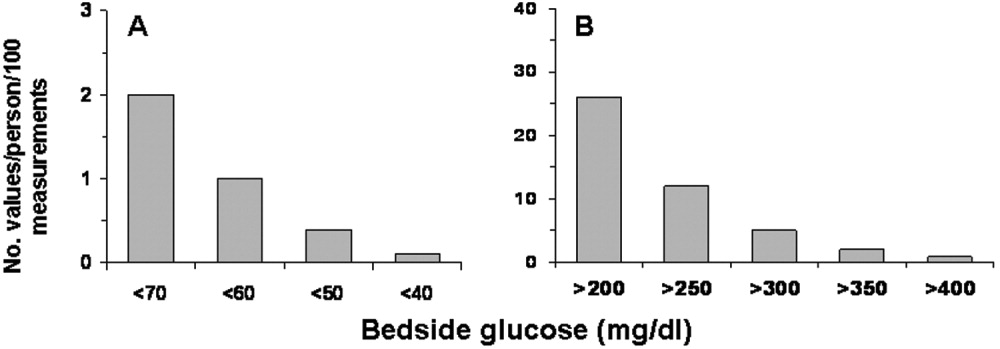
Hyperglycemia Therapy
Most patients (72%) received subcutaneous insulin at some point during their hospital stay; 19% had no therapy, 9% had oral agents only, 26% had oral agents plus insulin, and 46% had insulin only. The proportion receiving no therapy decreased from 32% among patients whose BedGlucavg was in the first tertile to 2% in the third tertile; the percentage of patients taking oral agents only decreased from 18% to 1%; the proportion taking oral agents plus insulin was 17% in the first tertile and 30% in the third; and the proportion of those taking insulin only was 32% in the first tertile and 66% in the third (Fig. 3). Thus, nearly all patients whose BedGlucavg value was in the third tertile received insulin, either as monotherapy or in combination with oral agents.
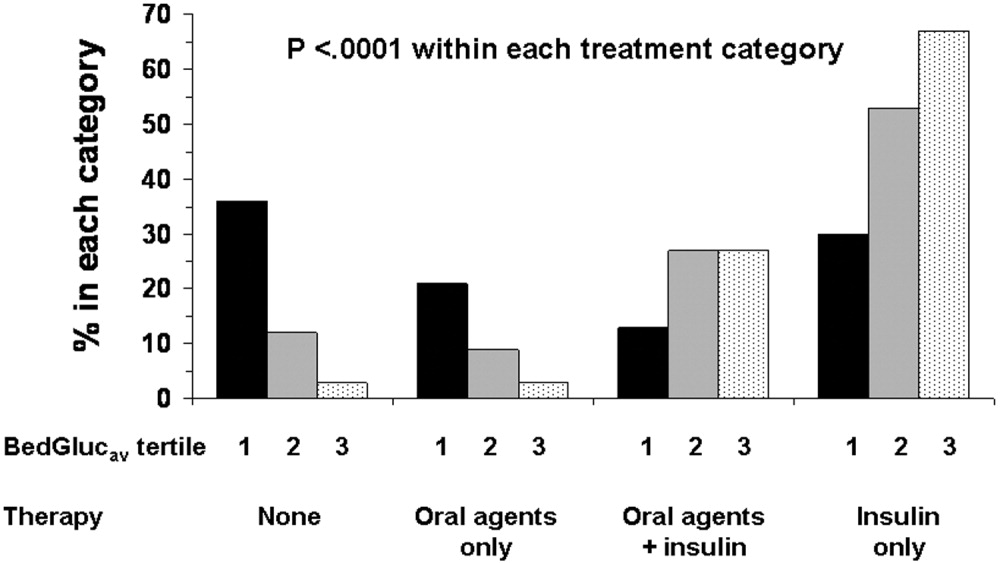
Among insulin users, 58% received bolus‐only, 42% received basal‐bolus, and 1% received basal‐only injections. Because of the small proportion of basal‐only patients, we conducted analyses only of patients whose insulin treatment fell into 1 of the first 2 categories. The use of a basal‐bolus insulin program increased from 34% in patients whose BedGlucavg was in the first tertile to 54% for those who had BedGlucavg in the third tertile (P < .001; Fig. 4, left). Thus, although there was a greater transition to a more intensive insulin regimen with worsening hyperglycemia, a substantial number of patients (46%) whose BedGlucavg was in the third tertile still did not have their insulin regimen intensified to a basal‐bolus program.
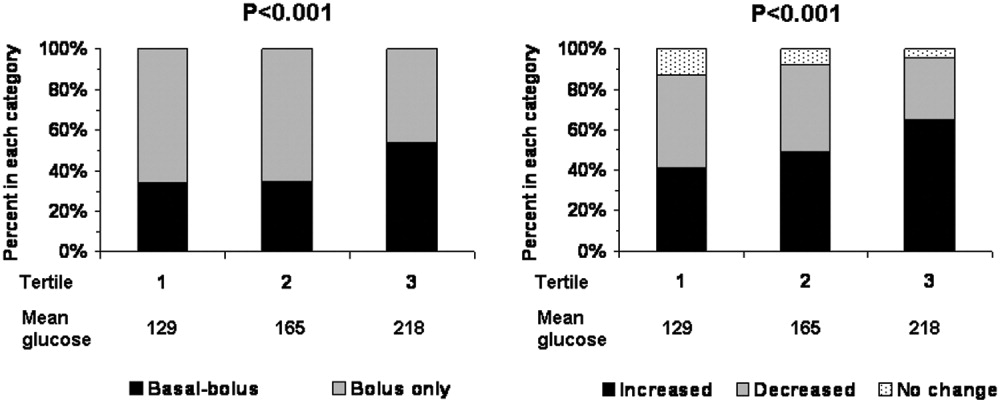
Fifty‐four percent of subcutaneous insulin users (N = 1680) had an increase in the amount of insulin administered between the first and last 24 hours of hospitalization (average increase, 17 U), 39% had a decrease (average decrease, 12 U), and 7% had no change. With rising hyperglycemia, more patients had their insulin increased by the time of discharge; 41% of persons who had BedGlucavg values in the first tertile were on more insulin by the time of discharge, whereas 65% of those who had average glucose values in the third tertile had insulin increased (Fig. 4, right). However, the pattern of changes in the amount of administered insulin was heterogeneous, with increases, decreases, and no change occurring in all tertiles of BedGlucavg (Fig. 3, right). Nearly 31% of patients whose BedGlucavg values were in the third tertile actually had a decrease in insulin. This decrease occurred despite evidence of a low frequency of hypoglycemia (only 1.2 values < 70 mg/dL per 100 measurements per person) and a high frequency of hyperglycemia (55.4 values > 200 mg/dL per person per 100 measurements).
DISCUSSION
The number of diabetes‐associated hospital discharges has been climbing2, 3; our own data indicate an increase in the number of patients with diabetes as a proportion of the total number of discharged patients. A recent consensus advocates good glucose control in the hospital to optimize outcomes,79 and institutions need to begin the process of assessing their quality of inpatient hyperglycemia management as a first step to enhancing care.
There are no guidelines about which method of glucose measurement (ie, blood glucose or bedside glucose) should be used as the quality measure to evaluate glycemic control in hospital patients. Both blood and bedside glucose measurements have been used in outcomes studies.23, 24 We analyzed capillary bedside values measured by a method subjected to ongoing quality control oversight and stored in the electronic laboratory database. Bedside glucose measurements are typically obtained with far greater frequency than blood glucose measurements and therefore provide better insight into daily changes in glycemic control; in practice, clinicians rely on bedside values when assessing hyperglycemia and making therapeutic decisions.
There is also no consensus about what glucose metric should be used to assess the status of glycemic control in the hospital. Some studies have used single glucose values to examine the relationship between hyperglycemia and outcomes,25, 26 whereas others have used values averaged over various lengths of time.24, 27 To evaluate glucose control, we averaged capillary measurements in the first 24 hours of hospitalization (F24BedGlucavg), the last 24 hours of hospitalization (L24BedGlucavg), and for the entire LOS (BedGlucavg), and we calculated the number of documented hyper‐ and hypoglycemic events. The measures we used to examine hyperglycemia would serve as useful benchmarks for following the progress of future institutional interventions directed at glucose control in hospitalized patients at our hospital.
A substantial number of our patients selected for analysis (ie, noncritically ill with LOS 3 days) were found to have sustained hyperglycemia at the beginning, during, and at the end of their hospital stay. We found very few instances of severe hypoglycemia (values < 50 or < 40 mg/dL), and the low frequency of hypoglycemia compared to that of hyperglycemia could encourage practitioners to be more aggressive in treating hyperglycemia. The high frequency of recorded bedside glucose compared with blood glucose measurements ( 3 per day), the ongoing patient surveillance by medical, nursing, and other staff members, and our institution's written hypoglycemia policy most likely minimize the number of unobserved, undocumented, or untreated hypoglycemic episodes. There are no data or recommendations about what would be an acceptable number of hypoglycemic episodes in the hospital.
Very little is known about the therapeutic strategies being applied to hyperglycemia in the hospital. Our data show that subcutaneous insulin (either alone or in combination with oral agents) was used at some point during hospitalization for nearly three‐fourths of noncritically patients who were in the hospital for 3 days or longer. Moreover, as hyperglycemia worsened, use of oral hypoglycemic agents declined, there was a shift toward greater use of a scheduled basal‐bolus insulin program, and a greater proportion of patients had more insulin administered.
Although these latter findings are encouraging and suggest that practitioners are responding to the severity of hyperglycemia, further examination of the data suggests that a substantial number of patients in the highest glucose tertile did not have insulin therapy intensified. Nearly half our patients whose glucose values were in the highest tertile were treated with short‐acting insulin aloneprobably an ineffective regimen23, 28or did not have more insulin administered. The higher doses administered were not likely solely a result of using more sliding‐scale insulin, as previous investigators actually found no correlation between intensity of the sliding scale and total daily insulin dose.14 Although evidence here is circumstantial (we did not examine changes in provider orders in response to glucose levels), these findings, together with those in our previous study15 and in another study,14 provide indirect evidence of clinical inertia in the hospital.
Beyond clinical inertia, however, there was evidence of negative therapeutic momentum: nearly one‐third of patients whose glucose was in the highest tertile had insulin decreased rather than increased, despite the low frequency of hypoglycemia and the high frequency of hyperglycemia. It is likely that even a single episode of hypoglycemia concerned practitioners, but the clinical response in these situations should be to investigate and correct the circumstances leading to the hypoglycemia, rather than to necessarily deintensify therapy in the face of continued hyperglycemia. The analysis of this larger data set corroborated our observations of clinical inertia and negative therapeutic momentum from an earlier study of chart reviews of a smaller patient sample.15
The variable application of insulin therapy to the treatment of hyperglycemia may be an indication of the level of comfort practitioners have about using this pharmacologic agent. A recently completed survey of resident physicians at our institution indicated that understanding how to use insulin was the most common barrier to successful management of inpatient hyperglycemia.29 These observations reinforce the need for institutions to develop standardized insulin order sets and develop programs to educate the staff on the use of insulin.
This study differs from our original analysis based on chart review in 4 ways. First, the sample size in our first study (n = 90) was small and derived from discharges from a single year (2003), whereas the sample in the present study spanned several years and included several thousand cases. Second, in our prior study we did not have detailed pharmacologic data on glucose management and how treatment approaches varied relative to severity of hyperglycemia. In general, there is very limited data on what therapeutic strategies are being applied to inpatient hyperglycemia, and this analysis of a large sample of cases provides more insight into how practitioners are managing glucose.
Third, we wanted to corroborate observations made in our previous report using a different methodologyin this instance, adapting existing information systems to assessment of inpatient diabetes care. For example, our last study was based on a limited number of glucose observations but suggested that the prevalence of hypoglycemia in our hospital was low compared with that of hyperglycemia; the present analysis of a very large number of glucose values confirmed these initial findings. In addition, use of information systems versus a chart review approach to assessing inpatient diabetes care corroborates our earlier suspicions about the presence of clinical inertia and negative therapeutic momentum in glucose management.
Fourth and finally, this study gave us experience with use of electronic records as a means to assess the status of inpatient diabetes care. Electronic data sources will likely be common tools to monitor quality of inpatient diabetes care and will likely figure prominently in future accreditation processes.10, 11 Unlike chart abstraction, which would require extensive man‐hours to extract data on few patients, use of electronic records allows examination of large numbers of hospital cases. Queries of information systems could be automated, and report cards potentially generated and feedback given to providers on the status of inpatient glycemic control. The industry is actively pursuing software development to assist hospitals in assessing the quality of inpatient glycemic control (eg, RALS‐TGCM, available at
However, there are also limitations to using electronic records as the sole method of assessing inpatient diabetes care. For instance, retrospective review of electronic records does not allow assessment of reasons underlying decision‐making behavior of clinicians (eg, why they did or did not change therapy). Diabetes and hyperglycemia associated hospitalizations must be identified by discharge diagnosis codes, so some cases of diabetes and hyperglycemia were likely missed.30, 31 Recent guidelines propose preprandial targets for glucose in the hospital.8 It is not easy to determine from an electronic data source which is a preprandial bedside glucose and which is a postprandial bedside glucose. Pre‐ and postpyramidal glucose categories would be difficult to define even during prospective studies, given the varying nature of nutritional support (ie, enteral, parenteral) used in the hospital and the administration of continuous dextrose infusions. Some type of quality control, such as conducting reviews of small samples of randomly selected charts to see how they compare with the electronic data, will need to be conducted.
From electronic discharge data, we cannot establish who had preexisting diabetes, who was admitted with new‐onset diabetes, and who developed hyperglycemia as a result of the hospital stay. Our previous random chart review15 indicated it is likely that most (more than 90%) had an established diagnosis of diabetes before admission. However, the recommendation to treat hyperglycemia should apply to all patients regardless of whether they had diagnosed diabetes prior to hospitalization or manifested hyperglycemia only during the hospital stay.79
As hospitals move toward making efforts to improve performance related to treating inpatient hyperglycemia, they must be cognizant of the heterogeneity of the inpatient population and the challenges to managing hospital hyperglycemia before drawing conclusions about their management. Inpatients with hyperglycemia are a diverse group, comprising patients with preexisting diabetes, with previously undiagnosed diabetes, and stress‐caused hyperglycemia. The unpredictable timing of procedures, various and changing forms of nutritional support, and different levels of staff expertise all contribute to the challenges of managing inpatient hyperglycemia. Inpatient practitioners may be forced to attempt glycemic control catch‐up for hospitalized persons who had poor outpatient glucose control. Patients who have required a stay in the intensive care unit may have very different glycemic outcomes than those who have not. Patients whose LOS was short (< 3days) may have different glycemic outcomes than persons whose LOS was longer ( 3 days as defined here) because of the length of time practitioners have to work to control their hyperglycemia. These and other variables may have to be taken into account when developing and assessing the impact of interventions.
Despite these limitations, our analysis was helpful in providing direction for enhancing the care of hospitalized patients with hyperglycemia in our facility. For instance, our generalists and surgeons are the principal caretakers of noncritically ill patients with diabetes, and these practitioners could be targeted for the first continuing educational programs about inpatient care of hyperglycemia. In addition, institutional guidelines on when and how to initiate and change therapyparticularly insulincan be designed so that hyperglycemia in noncritically ill hospital patients can be managed more effectively. These and other ongoing educational initiatives are necessary to ensure delivery of the highest quality of inpatient glucose care.
- ,,,.Hospitalization in the United States,1997.Rockville, MD:Agency for Healthcare Research and Quality;2000. Report No.: HCUP Fact Book No. 1; AHRQ Publication No. 00‐0031.
- Hospitalization for Diabetes as First‐Listed Diagnosis. Available at: http://www.cdc.gov/diabetes/statistics/dmfirst/index.htm. Accessed November 29,2006.
- Hospitalizations for Diabetes as Any‐Listed Diagnosis. Available at: http://www.cdc.gov/diabetes/statistics/dmany/index.htm. Accessed November 29,2006,
- ,,,.Multiple hospitalizations for patients with diabetes.Diabetes Care.2003;26:1421–1426.
- ,,.Economic costs of diabetes in the US in 2002.Diabetes Care.2003;26:917–932.
- ,,.Inpatient diabetology. The new frontier.J Gen Intern Med.2004;19:466–471.
- ,,, et al.American Diabetes Association Diabetes in Hospitals Writing Committee: Management of diabetes and hyperglycemia in hospitals.Diabetes Care.2004;27:553–591.
- ACE Task Force on Inpatient Diabetes and Metabolic Control.American College of Endocrinology position statement on inpatient diabetes and metabolic control.Endocr Pract,2004;10:77–82.
- ACE/ADA Task Force on Inpatient Diabetes.American College of Endocrinology and American Diabetes Association consensus statement on inpatient diabetes and glycemic control.Endocr Pract.2006;12:459–468.
- Getting started kit: prevent surgical site infections.2006 Available at: www.ihi.org/NR/rdonlyres/00EBAF1F‐A29F‐4822‐ABCE‐829573255AB8/0/SSIHowtoGuideFINAL.pdf. Accessed November 29,year="2006"2006.
- Joint Commission on Accreditation of Healthcare Organizations. American Diabetes Association and Joint Commission Collaborate on Joint Commission Inpatient Diabetes Care Certification.2006. Available at: http://www.jointcommission.org/NewsRoom/NewsReleases/jc_nr_072006.htm. Accessed November 29,year="2006"2006,
- ,.Glycemic chaos (not glycemic control) still the rule for inpatient care: How do we stop the insanity?J Hosp Med.2006;1:141–144.
- ,,,,.Unrecognized diabetes among hospitalized patients.Diabetes Care.1998;21(2):246–249.
- ,,,,.Inpatient management of diabetes and hyperglycemia among general medicine patients at a large teaching hospital.J Hosp Med.2006;1(3):145–150.
- ,,, et al.Diabetes care in the non‐ICU setting: is there clinical inertia in the hospital?J Hosp Med,2006;1(3):151–160.
- ,,, et al.Diabetes in urban African‐Americans. XVI. Overcoming clinical inertia improves glycemic control in patients with type 2 diabetes.Diabetes Care.1999;22:1494–500.
- ,,, et al.Clinical Inertia.Ann Intern Med.2001;135:825–834.
- ,,,Team UHCUDBP.Quality of diabetes care in U.S. academic medical centers: low rates of medical regimen change.Diabetes Care.2005;28:337–442.
- ,,, et al.Clinical inertia in the management of type 2 diabetes metabolic risk factors.Diabet Med,2004;21:150–155.
- ,.Clinical inertia: errors of omission in drug therapy.Am J Health Syst Pharm.2004;61:401–404.
- .Overcome clinical inertia to control systolic blood pressure.Arch Intern Med,2003;163:2677–2678.
- ,,,,.Clinical inertia in response to inadequate glycemic control: do specialists differ from primary care physicians?Diabetes Care.2005;28:600–606.
- ,,.Glycemic Control and Sliding Scale Insulin Use in Medical Inpatients With Diabetes Mellitus.Arch Intern Med.1997;157:545–552.
- ,,.Effect of hyperglycemia and continuous intraveneous insulin infusions on outcomes of cardiac surgical procedures: the Portland Diabetic Project.Endocr Pract.2004;10(2):21–33.
- ,,, et al.Plasma glucose at hospital admission and previous metabolic control determine myocardial infarct size and survival in patients with and without type 2 diabetes: the Langendreer Myocardial Infarction and Blood Glucose in Diabetic Patients Assessment (LAMBDA).Diabetes Care.2005;28:2551–2553.
- ,,.Admission hyperglycemia as a prognostic indicator in trauma.J Trauma Inj Infect Crit Care.2003;55(1):33–38.
- ,,, et al.Intraoperative hyperglycemia and perioperative outcomes in cardiac surgery patients.Mayo Clin Proc.2005;80:862–866.
- ,,,,.Efficacy of sliding‐scale insulin therapy: a comparison with prospective regimens.Fam Pract Res J.1994;14:313–22.
- ,,, et al.Management of inpatient hyperglycemia: assessing perceptions and barriers to care among resident physicians.Endocr Pract., to appear.
- ,,,,.Diabetes‐related hospitalization and hospital utilization. In:Diabetes in America.Bethesda, MD:National Institutes of Diabetes and Digestive Diseases;1995:553–563.
- ,,, et al.Hospital discharge records under‐report the prevalence of diabetes in inpatients.Diabetes Res Clin Pract.2003;59(2):145–151.
Diabetes confers a substantial burden on the hospital system. Diabetes is the fourth‐leading comorbid condition associated with any hospital discharge in the United States1. During 2001, for more than 500,000 patients discharged from U.S. hospitals diabetes was listed as the principal diagnosis and for more than 4 million it was listed as a codiagnosis.2, 3 Nearly one‐third of diabetes patients require at least 2 hospitalizations annually,4 and inpatient stays account for the largest proportion of direct medical expenses incurred by persons with the disease.5
Numerous studies have demonstrated that hyperglycemia is associated with adverse outcomes of hospitalized patients.68 However, studies have also confirmed that attention to lowering glucose levels in the hospital improves patient outcomes.7, 8 Although inpatients with known diabetes will likely constitute the largest and most visible percentage of those who will require treatment for high glucose, the recommendation to control glucose applies to all inpatients regardless of whether they have been diagnosed with diabetes prior to hospitalization or have manifested hyperglycemia only during the hospital stay.79
Now that the relationship between hyperglycemia and hospital outcomes is well established, the task of organizations that deliver care and set policy is to translate current recommendations of good glucose control into real‐world hospital settings. Quality improvement organizations are currently working toward developing and disseminating performance measures for control of inpatient hyperglycemia.10, 11 Although management of hospital hyperglycemia is often perceived as suboptimal,12 actual data are limited and are based on review of small numbers of charts,1315 and information is even sparser on the pharmacologic strategies being used to treat inpatient hyperglycemia. Before educational programs and policies can be developed, individual hospital systems need to gain more insight into how hyperglycemia is being managed in the hospital.
We reported previously the results of a review of a small number of charts (n = 90) of patients hospitalized with diabetes. The findings from this review suggested there was clinical inertia in glycemia management in the hospital.15 Clinical inertia was originally described in relationship to diabetes care in the outpatient setting and was defined as a failure to perform a needed service or make a change in treatment when indicated.16, 17 Since the original description, additional reports have documented the problem of clinical inertia, but these have all been based on experiences in the outpatient setting.1822 To our knowledge, our previous report was the first to question whether clinical inertia occurred in the hospital environment. In addition, we described the negative therapeutic momentuma deintensification of treatment despite ongoing hyperglycemia15. However, our prior study examined only a small number of cases and did not include detailed data on pharmacologic treatment for hyperglycemia. Therefore, we expanded our analysis using an information systems rather than a chart reviewbased methodology to assess the status of hyperglycemia management in our hospital.
METHODS
Setting
Our tertiary‐care academic teaching hospital is a 200‐bed facility in metropolitan Phoenix, Arizona. All adult general medical and surgical specialties are represented, including transplantation services; the hospital also has a level 2 trauma center and an inpatient rehabilitation unit. Care is provided by various types of practitioners, including postgraduate trainees, faculty, physician assistants, and nurse‐practitioners. An electronic medical record links outpatient and inpatient records with laboratory results and pharmacy orders. The core electronic health record system is the Centricity/LastWord platform, provided by GE/IDX. The ancillary core systems, including laboratory and pharmacy, are interfaced with the Centricity system and maintained by on‐site Mayo Clinic information technology professionals.
Case Selection
Patients discharged with an International Classification of Diseases, 9th Revision, Clinical Modification (ICD‐9‐CM) diagnosis code for diabetes (ICD‐9‐CM code 250.xx) or hyperglycemia (ICD‐9‐CM code 790.6) were identified in a search of the hospital's electronic billing records.24 Our facility does not provide obstetric or pediatric services; therefore, corresponding ICD‐9‐CM codes for those populations were not included. Both primary and nonprimary diagnostic fields were searched. Discharges were extracted for the period between January 1, 2001, and December 31, 2004. Data retrieved included patient age, ethnicity/race, length of stay (LOS), and type of hospital service with primary responsibility for the patient's care. For confidentiality reasons, individual patients were not identified, and the unit of analysis was the discharge.
Our analyses focused principally on the noncritically ill, defined as those patients who did not require a stay in our intensive or intermediate care units; critically ill patients were identified based on room location in the data set and excluded. The reasons this study assessed hyperglycemia management in the noncritically ill were 2‐fold. First, the critically ill may migrate in and out of intensive care depending on their health status and thus experience different intensities of glucose management. Second, in our facility the therapeutic approach to hyperglycemia management is different for the critically ill than for the noncritically ill; the critically ill may receive intravenous and/or subcutaneous insulin, whereas subcutaneous insulin therapy only is given to the noncritically ill. Thus, the noncritically ill represent a more clearly defined patient population whose therapies would be easier to evaluate. We also restricted the final analysis to patients who had a LOS of 3 days or less, so that differences in glucose control and insulin therapy between the first and last 24 hours of hospital stay could be assessed.
Data on 30 randomly chosen patients from different years was extracted from electronic records. A spreadsheet of the data was compared against data in our online electronic medical records. The online data were printed, and packets were made of the data for each patient selected for review. The patient demographic information was validated against our registration screen. Inpatient stay was validated to verify a patient was in intensive or intermediate care. The result of each glucose test performed while the patient was in the hospital was printed and the calculations validated. The insulin given while the patient was hospitalized was also printed and reviewed to verify the type of insulin and calculations for the amounts of insulin given.
Assessment of Glycemic Control
After extraction of hospital cases, data were linked via patient identifiers to our electronic laboratory database to retrieve information on glucose values. Glucose data included both blood and bedside measurements. In our institution, bedside glucose monitoring is performed with an instrument that scans and records patient identification, followed by direct downloading to our laboratory database. Commercial software (Medical Automation Systems, Charlottesville, VA) facilitates the interfacing of glucometer data with the electronic laboratory file.
Nearly all hospitalized patients had either bedside glucose (84%) or blood glucose (86%) data available for analysis. However, the mean number of bedside glucose measurements was 3.4 per day, whereas the average number of blood glucose measurements was only 1.0 per day. Because of the greater number of bedside measurements and because practitioners typically make therapeutic decisions about hyperglycemia management on the basis of daily bedside glucose results, these values were used to assess glycemic control of patients in the hospital discharge data.15
To assess glycemic control, we used methods similar to those previously published by ourselves and others.15, 23 We averaged each patient's available bedside glucose measurements to determine the composite average (BedGlucavg). We also computed the average of bedside glucose measurements obtained during the first 24 hours after admission (F24BedGlucavg) and during the last 24 hours before discharge (L24BedGlucavg), then examined the distributions of BedGlucavg, F24BedGlucavg, and L24BedGlucavg. The first 24‐hour period was calculated forward from the recorded time of admission, and the last 24‐hour period was calculated backward from the time of discharge. We calculated the frequency that each patient's bedside measurements showed hypoglycemia (bedside glucose < 70, < 60, < 50, or < 40 mg/dL) and showed hyperglycemia (bedside glucose >2 00, > 250, > 300, > 350, or > 400 mg/dL). Results were recorded as the number of values per 100 measurements per person; this method allowed adjustment for variation in the individual number of measurements and captured information on multiple episodes of hypo‐ or hyperglycemia of individual patients.15, 23
Hyperglycemia Therapy
Links to our inpatient pharmacy database enabled determination of types of pharmacotherapy actually administered to patients to treat hyperglycemia. Our electronic pharmacy records are designed so that intravenous medications (eg, intravenous insulin), scheduled oral and subcutaneous medications (eg, subcutaneous insulin), and medications administered on a one‐time or as‐needed basis (eg, sliding‐scale insulin) are documented electronically as separate categories. In our facility, intravenous insulin is administered only in the intensive care setting or as a component of total parenteral nutrition, and we excluded intravenous insulin use from this data. Thus, our analysis of insulin therapy focused only on elucidating patterns of subcutaneous treatment.
We classified hyperglycemia treatment as no therapy, oral agents only, oral agents plus insulin, and insulin only. Patients were regarded as having received an oral agent or insulin if they were administered the medication at any time during their inpatient stay. For management of hyperglycemia in noncritically ill patients, the use of a programmed basal‐bolus insulin program is advocated rather than the use of only a short‐acting bolus or sliding‐scale regimen.7, 8 Therefore, we further examined the insulin treatment strategies by classifying the type of regimen as basal only (if only an extended‐release preparation was used), as basal bolus (if the therapy consisted of a long‐acting plus a short‐acting formulation), or as bolus only (if the only insulin administered was a short‐acting preparation).
In addition to characterizing the general therapeutic approaches to hyperglycemia, we determined changes in the amount of insulin administered according to the severity of the hyperglycemia. Among patients who received insulin, we compared the average total units of insulin used during the last 24 hours before discharge with the amount administered during the first 24 hours of hospitalization. If more units were used during the last 24 hours than in the first 24 hours, the amount of insulin administered was categorized as having increased; if fewer units were provided during the last 24 hours, then the insulin amount was classified as having decreased; otherwise, no change was considered to have occurred. The BedGlucavg values were divided into 3 intervals using tertile cut points, and the differences in the proportion of patients by each type of insulin treatment regimen and the categories of insulin change were compared across tertiles; differences in proportions were determined using the 2 statistic.
RESULTS
Patient Characteristics
Between January 1, 2001, and December 31, 2004, a total of 7361 patients were discharged from our facility with either a diabetes or a hyperglycemia diagnosis (16% of all discharges); the percentage of discharges associated with these diagnoses increased from 14.9% in 2001 to 16.4% in 2004. Most patients with diabetes or hyperglycemia (5198 or 71%) received care outside the intensive‐ or intermediate‐care setting.
Among the noncritically ill patients whose LOS was at least 3 days (N = 2916), average age was 69 years, and average LOS was 5.7 days. Most of the discharged patients were men (57%), and 90% were white. Most patients were discharged from primary care (45%; general internal medicine or family medicine) or surgical services (34%), with the rest discharged from other specialties (eg, cardiology, transplant medicine). Compared to the noncritically ill, who had an LOS of at least 3 days, those noncritically patients whose LOS was less than 3 days (n = 2282) were slightly younger (mean age 68 versus 69 years, P < .001 by Mann‐Whitney testing) but were comparable in sex and race distribution (P > .07 for both by chi‐square testing).
Glycemic Control
The median duration between admission and time of first bedside glucose measurement was 3.0 hours. Patients had an average of 19 bedside glucose measurements; the overall mean number of bedside measurements was 3.4 per day, 3.7 during the first 24‐hour period, and 3.4 during the last 24 hours of hospitalization. Nearly 25% of patients were hyperglycemic (bedside glucose > 200 mg/dL) during the first 24 hours of hospitalization (Fig. 1A), 20% had persistent hyperglycemia throughout the entire hospitalization (Fig. 1B), and 21% were hyperglycemic during the 24 hours before discharge (Fig. 1C), with some patients discharged with an average bedside glucose of at least 300 mg/dL during the 24 hours before discharge.
The incidence of hypoglycemic episodes was lower than that of hyperglycemic episodes: 21% of patients had at least 1 bedside glucose value less than 70 mg/dL, but 68% had at least 1 value greater than 200 mg/dL. The frequency of hypoglycemic measurements was low (Fig. 2A) compared with the frequency of hyperglycemic episodes (Fig. 2B).
Hyperglycemia Therapy
Most patients (72%) received subcutaneous insulin at some point during their hospital stay; 19% had no therapy, 9% had oral agents only, 26% had oral agents plus insulin, and 46% had insulin only. The proportion receiving no therapy decreased from 32% among patients whose BedGlucavg was in the first tertile to 2% in the third tertile; the percentage of patients taking oral agents only decreased from 18% to 1%; the proportion taking oral agents plus insulin was 17% in the first tertile and 30% in the third; and the proportion of those taking insulin only was 32% in the first tertile and 66% in the third (Fig. 3). Thus, nearly all patients whose BedGlucavg value was in the third tertile received insulin, either as monotherapy or in combination with oral agents.
Among insulin users, 58% received bolus‐only, 42% received basal‐bolus, and 1% received basal‐only injections. Because of the small proportion of basal‐only patients, we conducted analyses only of patients whose insulin treatment fell into 1 of the first 2 categories. The use of a basal‐bolus insulin program increased from 34% in patients whose BedGlucavg was in the first tertile to 54% for those who had BedGlucavg in the third tertile (P < .001; Fig. 4, left). Thus, although there was a greater transition to a more intensive insulin regimen with worsening hyperglycemia, a substantial number of patients (46%) whose BedGlucavg was in the third tertile still did not have their insulin regimen intensified to a basal‐bolus program.
Fifty‐four percent of subcutaneous insulin users (N = 1680) had an increase in the amount of insulin administered between the first and last 24 hours of hospitalization (average increase, 17 U), 39% had a decrease (average decrease, 12 U), and 7% had no change. With rising hyperglycemia, more patients had their insulin increased by the time of discharge; 41% of persons who had BedGlucavg values in the first tertile were on more insulin by the time of discharge, whereas 65% of those who had average glucose values in the third tertile had insulin increased (Fig. 4, right). However, the pattern of changes in the amount of administered insulin was heterogeneous, with increases, decreases, and no change occurring in all tertiles of BedGlucavg (Fig. 3, right). Nearly 31% of patients whose BedGlucavg values were in the third tertile actually had a decrease in insulin. This decrease occurred despite evidence of a low frequency of hypoglycemia (only 1.2 values < 70 mg/dL per 100 measurements per person) and a high frequency of hyperglycemia (55.4 values > 200 mg/dL per person per 100 measurements).
DISCUSSION
The number of diabetes‐associated hospital discharges has been climbing2, 3; our own data indicate an increase in the number of patients with diabetes as a proportion of the total number of discharged patients. A recent consensus advocates good glucose control in the hospital to optimize outcomes,79 and institutions need to begin the process of assessing their quality of inpatient hyperglycemia management as a first step to enhancing care.
There are no guidelines about which method of glucose measurement (ie, blood glucose or bedside glucose) should be used as the quality measure to evaluate glycemic control in hospital patients. Both blood and bedside glucose measurements have been used in outcomes studies.23, 24 We analyzed capillary bedside values measured by a method subjected to ongoing quality control oversight and stored in the electronic laboratory database. Bedside glucose measurements are typically obtained with far greater frequency than blood glucose measurements and therefore provide better insight into daily changes in glycemic control; in practice, clinicians rely on bedside values when assessing hyperglycemia and making therapeutic decisions.
There is also no consensus about what glucose metric should be used to assess the status of glycemic control in the hospital. Some studies have used single glucose values to examine the relationship between hyperglycemia and outcomes,25, 26 whereas others have used values averaged over various lengths of time.24, 27 To evaluate glucose control, we averaged capillary measurements in the first 24 hours of hospitalization (F24BedGlucavg), the last 24 hours of hospitalization (L24BedGlucavg), and for the entire LOS (BedGlucavg), and we calculated the number of documented hyper‐ and hypoglycemic events. The measures we used to examine hyperglycemia would serve as useful benchmarks for following the progress of future institutional interventions directed at glucose control in hospitalized patients at our hospital.
A substantial number of our patients selected for analysis (ie, noncritically ill with LOS 3 days) were found to have sustained hyperglycemia at the beginning, during, and at the end of their hospital stay. We found very few instances of severe hypoglycemia (values < 50 or < 40 mg/dL), and the low frequency of hypoglycemia compared to that of hyperglycemia could encourage practitioners to be more aggressive in treating hyperglycemia. The high frequency of recorded bedside glucose compared with blood glucose measurements ( 3 per day), the ongoing patient surveillance by medical, nursing, and other staff members, and our institution's written hypoglycemia policy most likely minimize the number of unobserved, undocumented, or untreated hypoglycemic episodes. There are no data or recommendations about what would be an acceptable number of hypoglycemic episodes in the hospital.
Very little is known about the therapeutic strategies being applied to hyperglycemia in the hospital. Our data show that subcutaneous insulin (either alone or in combination with oral agents) was used at some point during hospitalization for nearly three‐fourths of noncritically patients who were in the hospital for 3 days or longer. Moreover, as hyperglycemia worsened, use of oral hypoglycemic agents declined, there was a shift toward greater use of a scheduled basal‐bolus insulin program, and a greater proportion of patients had more insulin administered.
Although these latter findings are encouraging and suggest that practitioners are responding to the severity of hyperglycemia, further examination of the data suggests that a substantial number of patients in the highest glucose tertile did not have insulin therapy intensified. Nearly half our patients whose glucose values were in the highest tertile were treated with short‐acting insulin aloneprobably an ineffective regimen23, 28or did not have more insulin administered. The higher doses administered were not likely solely a result of using more sliding‐scale insulin, as previous investigators actually found no correlation between intensity of the sliding scale and total daily insulin dose.14 Although evidence here is circumstantial (we did not examine changes in provider orders in response to glucose levels), these findings, together with those in our previous study15 and in another study,14 provide indirect evidence of clinical inertia in the hospital.
Beyond clinical inertia, however, there was evidence of negative therapeutic momentum: nearly one‐third of patients whose glucose was in the highest tertile had insulin decreased rather than increased, despite the low frequency of hypoglycemia and the high frequency of hyperglycemia. It is likely that even a single episode of hypoglycemia concerned practitioners, but the clinical response in these situations should be to investigate and correct the circumstances leading to the hypoglycemia, rather than to necessarily deintensify therapy in the face of continued hyperglycemia. The analysis of this larger data set corroborated our observations of clinical inertia and negative therapeutic momentum from an earlier study of chart reviews of a smaller patient sample.15
The variable application of insulin therapy to the treatment of hyperglycemia may be an indication of the level of comfort practitioners have about using this pharmacologic agent. A recently completed survey of resident physicians at our institution indicated that understanding how to use insulin was the most common barrier to successful management of inpatient hyperglycemia.29 These observations reinforce the need for institutions to develop standardized insulin order sets and develop programs to educate the staff on the use of insulin.
This study differs from our original analysis based on chart review in 4 ways. First, the sample size in our first study (n = 90) was small and derived from discharges from a single year (2003), whereas the sample in the present study spanned several years and included several thousand cases. Second, in our prior study we did not have detailed pharmacologic data on glucose management and how treatment approaches varied relative to severity of hyperglycemia. In general, there is very limited data on what therapeutic strategies are being applied to inpatient hyperglycemia, and this analysis of a large sample of cases provides more insight into how practitioners are managing glucose.
Third, we wanted to corroborate observations made in our previous report using a different methodologyin this instance, adapting existing information systems to assessment of inpatient diabetes care. For example, our last study was based on a limited number of glucose observations but suggested that the prevalence of hypoglycemia in our hospital was low compared with that of hyperglycemia; the present analysis of a very large number of glucose values confirmed these initial findings. In addition, use of information systems versus a chart review approach to assessing inpatient diabetes care corroborates our earlier suspicions about the presence of clinical inertia and negative therapeutic momentum in glucose management.
Fourth and finally, this study gave us experience with use of electronic records as a means to assess the status of inpatient diabetes care. Electronic data sources will likely be common tools to monitor quality of inpatient diabetes care and will likely figure prominently in future accreditation processes.10, 11 Unlike chart abstraction, which would require extensive man‐hours to extract data on few patients, use of electronic records allows examination of large numbers of hospital cases. Queries of information systems could be automated, and report cards potentially generated and feedback given to providers on the status of inpatient glycemic control. The industry is actively pursuing software development to assist hospitals in assessing the quality of inpatient glycemic control (eg, RALS‐TGCM, available at
However, there are also limitations to using electronic records as the sole method of assessing inpatient diabetes care. For instance, retrospective review of electronic records does not allow assessment of reasons underlying decision‐making behavior of clinicians (eg, why they did or did not change therapy). Diabetes and hyperglycemia associated hospitalizations must be identified by discharge diagnosis codes, so some cases of diabetes and hyperglycemia were likely missed.30, 31 Recent guidelines propose preprandial targets for glucose in the hospital.8 It is not easy to determine from an electronic data source which is a preprandial bedside glucose and which is a postprandial bedside glucose. Pre‐ and postpyramidal glucose categories would be difficult to define even during prospective studies, given the varying nature of nutritional support (ie, enteral, parenteral) used in the hospital and the administration of continuous dextrose infusions. Some type of quality control, such as conducting reviews of small samples of randomly selected charts to see how they compare with the electronic data, will need to be conducted.
From electronic discharge data, we cannot establish who had preexisting diabetes, who was admitted with new‐onset diabetes, and who developed hyperglycemia as a result of the hospital stay. Our previous random chart review15 indicated it is likely that most (more than 90%) had an established diagnosis of diabetes before admission. However, the recommendation to treat hyperglycemia should apply to all patients regardless of whether they had diagnosed diabetes prior to hospitalization or manifested hyperglycemia only during the hospital stay.79
As hospitals move toward making efforts to improve performance related to treating inpatient hyperglycemia, they must be cognizant of the heterogeneity of the inpatient population and the challenges to managing hospital hyperglycemia before drawing conclusions about their management. Inpatients with hyperglycemia are a diverse group, comprising patients with preexisting diabetes, with previously undiagnosed diabetes, and stress‐caused hyperglycemia. The unpredictable timing of procedures, various and changing forms of nutritional support, and different levels of staff expertise all contribute to the challenges of managing inpatient hyperglycemia. Inpatient practitioners may be forced to attempt glycemic control catch‐up for hospitalized persons who had poor outpatient glucose control. Patients who have required a stay in the intensive care unit may have very different glycemic outcomes than those who have not. Patients whose LOS was short (< 3days) may have different glycemic outcomes than persons whose LOS was longer ( 3 days as defined here) because of the length of time practitioners have to work to control their hyperglycemia. These and other variables may have to be taken into account when developing and assessing the impact of interventions.
Despite these limitations, our analysis was helpful in providing direction for enhancing the care of hospitalized patients with hyperglycemia in our facility. For instance, our generalists and surgeons are the principal caretakers of noncritically ill patients with diabetes, and these practitioners could be targeted for the first continuing educational programs about inpatient care of hyperglycemia. In addition, institutional guidelines on when and how to initiate and change therapyparticularly insulincan be designed so that hyperglycemia in noncritically ill hospital patients can be managed more effectively. These and other ongoing educational initiatives are necessary to ensure delivery of the highest quality of inpatient glucose care.
Diabetes confers a substantial burden on the hospital system. Diabetes is the fourth‐leading comorbid condition associated with any hospital discharge in the United States1. During 2001, for more than 500,000 patients discharged from U.S. hospitals diabetes was listed as the principal diagnosis and for more than 4 million it was listed as a codiagnosis.2, 3 Nearly one‐third of diabetes patients require at least 2 hospitalizations annually,4 and inpatient stays account for the largest proportion of direct medical expenses incurred by persons with the disease.5
Numerous studies have demonstrated that hyperglycemia is associated with adverse outcomes of hospitalized patients.68 However, studies have also confirmed that attention to lowering glucose levels in the hospital improves patient outcomes.7, 8 Although inpatients with known diabetes will likely constitute the largest and most visible percentage of those who will require treatment for high glucose, the recommendation to control glucose applies to all inpatients regardless of whether they have been diagnosed with diabetes prior to hospitalization or have manifested hyperglycemia only during the hospital stay.79
Now that the relationship between hyperglycemia and hospital outcomes is well established, the task of organizations that deliver care and set policy is to translate current recommendations of good glucose control into real‐world hospital settings. Quality improvement organizations are currently working toward developing and disseminating performance measures for control of inpatient hyperglycemia.10, 11 Although management of hospital hyperglycemia is often perceived as suboptimal,12 actual data are limited and are based on review of small numbers of charts,1315 and information is even sparser on the pharmacologic strategies being used to treat inpatient hyperglycemia. Before educational programs and policies can be developed, individual hospital systems need to gain more insight into how hyperglycemia is being managed in the hospital.
We reported previously the results of a review of a small number of charts (n = 90) of patients hospitalized with diabetes. The findings from this review suggested there was clinical inertia in glycemia management in the hospital.15 Clinical inertia was originally described in relationship to diabetes care in the outpatient setting and was defined as a failure to perform a needed service or make a change in treatment when indicated.16, 17 Since the original description, additional reports have documented the problem of clinical inertia, but these have all been based on experiences in the outpatient setting.1822 To our knowledge, our previous report was the first to question whether clinical inertia occurred in the hospital environment. In addition, we described the negative therapeutic momentuma deintensification of treatment despite ongoing hyperglycemia15. However, our prior study examined only a small number of cases and did not include detailed data on pharmacologic treatment for hyperglycemia. Therefore, we expanded our analysis using an information systems rather than a chart reviewbased methodology to assess the status of hyperglycemia management in our hospital.
METHODS
Setting
Our tertiary‐care academic teaching hospital is a 200‐bed facility in metropolitan Phoenix, Arizona. All adult general medical and surgical specialties are represented, including transplantation services; the hospital also has a level 2 trauma center and an inpatient rehabilitation unit. Care is provided by various types of practitioners, including postgraduate trainees, faculty, physician assistants, and nurse‐practitioners. An electronic medical record links outpatient and inpatient records with laboratory results and pharmacy orders. The core electronic health record system is the Centricity/LastWord platform, provided by GE/IDX. The ancillary core systems, including laboratory and pharmacy, are interfaced with the Centricity system and maintained by on‐site Mayo Clinic information technology professionals.
Case Selection
Patients discharged with an International Classification of Diseases, 9th Revision, Clinical Modification (ICD‐9‐CM) diagnosis code for diabetes (ICD‐9‐CM code 250.xx) or hyperglycemia (ICD‐9‐CM code 790.6) were identified in a search of the hospital's electronic billing records.24 Our facility does not provide obstetric or pediatric services; therefore, corresponding ICD‐9‐CM codes for those populations were not included. Both primary and nonprimary diagnostic fields were searched. Discharges were extracted for the period between January 1, 2001, and December 31, 2004. Data retrieved included patient age, ethnicity/race, length of stay (LOS), and type of hospital service with primary responsibility for the patient's care. For confidentiality reasons, individual patients were not identified, and the unit of analysis was the discharge.
Our analyses focused principally on the noncritically ill, defined as those patients who did not require a stay in our intensive or intermediate care units; critically ill patients were identified based on room location in the data set and excluded. The reasons this study assessed hyperglycemia management in the noncritically ill were 2‐fold. First, the critically ill may migrate in and out of intensive care depending on their health status and thus experience different intensities of glucose management. Second, in our facility the therapeutic approach to hyperglycemia management is different for the critically ill than for the noncritically ill; the critically ill may receive intravenous and/or subcutaneous insulin, whereas subcutaneous insulin therapy only is given to the noncritically ill. Thus, the noncritically ill represent a more clearly defined patient population whose therapies would be easier to evaluate. We also restricted the final analysis to patients who had a LOS of 3 days or less, so that differences in glucose control and insulin therapy between the first and last 24 hours of hospital stay could be assessed.
Data on 30 randomly chosen patients from different years was extracted from electronic records. A spreadsheet of the data was compared against data in our online electronic medical records. The online data were printed, and packets were made of the data for each patient selected for review. The patient demographic information was validated against our registration screen. Inpatient stay was validated to verify a patient was in intensive or intermediate care. The result of each glucose test performed while the patient was in the hospital was printed and the calculations validated. The insulin given while the patient was hospitalized was also printed and reviewed to verify the type of insulin and calculations for the amounts of insulin given.
Assessment of Glycemic Control
After extraction of hospital cases, data were linked via patient identifiers to our electronic laboratory database to retrieve information on glucose values. Glucose data included both blood and bedside measurements. In our institution, bedside glucose monitoring is performed with an instrument that scans and records patient identification, followed by direct downloading to our laboratory database. Commercial software (Medical Automation Systems, Charlottesville, VA) facilitates the interfacing of glucometer data with the electronic laboratory file.
Nearly all hospitalized patients had either bedside glucose (84%) or blood glucose (86%) data available for analysis. However, the mean number of bedside glucose measurements was 3.4 per day, whereas the average number of blood glucose measurements was only 1.0 per day. Because of the greater number of bedside measurements and because practitioners typically make therapeutic decisions about hyperglycemia management on the basis of daily bedside glucose results, these values were used to assess glycemic control of patients in the hospital discharge data.15
To assess glycemic control, we used methods similar to those previously published by ourselves and others.15, 23 We averaged each patient's available bedside glucose measurements to determine the composite average (BedGlucavg). We also computed the average of bedside glucose measurements obtained during the first 24 hours after admission (F24BedGlucavg) and during the last 24 hours before discharge (L24BedGlucavg), then examined the distributions of BedGlucavg, F24BedGlucavg, and L24BedGlucavg. The first 24‐hour period was calculated forward from the recorded time of admission, and the last 24‐hour period was calculated backward from the time of discharge. We calculated the frequency that each patient's bedside measurements showed hypoglycemia (bedside glucose < 70, < 60, < 50, or < 40 mg/dL) and showed hyperglycemia (bedside glucose >2 00, > 250, > 300, > 350, or > 400 mg/dL). Results were recorded as the number of values per 100 measurements per person; this method allowed adjustment for variation in the individual number of measurements and captured information on multiple episodes of hypo‐ or hyperglycemia of individual patients.15, 23
Hyperglycemia Therapy
Links to our inpatient pharmacy database enabled determination of types of pharmacotherapy actually administered to patients to treat hyperglycemia. Our electronic pharmacy records are designed so that intravenous medications (eg, intravenous insulin), scheduled oral and subcutaneous medications (eg, subcutaneous insulin), and medications administered on a one‐time or as‐needed basis (eg, sliding‐scale insulin) are documented electronically as separate categories. In our facility, intravenous insulin is administered only in the intensive care setting or as a component of total parenteral nutrition, and we excluded intravenous insulin use from this data. Thus, our analysis of insulin therapy focused only on elucidating patterns of subcutaneous treatment.
We classified hyperglycemia treatment as no therapy, oral agents only, oral agents plus insulin, and insulin only. Patients were regarded as having received an oral agent or insulin if they were administered the medication at any time during their inpatient stay. For management of hyperglycemia in noncritically ill patients, the use of a programmed basal‐bolus insulin program is advocated rather than the use of only a short‐acting bolus or sliding‐scale regimen.7, 8 Therefore, we further examined the insulin treatment strategies by classifying the type of regimen as basal only (if only an extended‐release preparation was used), as basal bolus (if the therapy consisted of a long‐acting plus a short‐acting formulation), or as bolus only (if the only insulin administered was a short‐acting preparation).
In addition to characterizing the general therapeutic approaches to hyperglycemia, we determined changes in the amount of insulin administered according to the severity of the hyperglycemia. Among patients who received insulin, we compared the average total units of insulin used during the last 24 hours before discharge with the amount administered during the first 24 hours of hospitalization. If more units were used during the last 24 hours than in the first 24 hours, the amount of insulin administered was categorized as having increased; if fewer units were provided during the last 24 hours, then the insulin amount was classified as having decreased; otherwise, no change was considered to have occurred. The BedGlucavg values were divided into 3 intervals using tertile cut points, and the differences in the proportion of patients by each type of insulin treatment regimen and the categories of insulin change were compared across tertiles; differences in proportions were determined using the 2 statistic.
RESULTS
Patient Characteristics
Between January 1, 2001, and December 31, 2004, a total of 7361 patients were discharged from our facility with either a diabetes or a hyperglycemia diagnosis (16% of all discharges); the percentage of discharges associated with these diagnoses increased from 14.9% in 2001 to 16.4% in 2004. Most patients with diabetes or hyperglycemia (5198 or 71%) received care outside the intensive‐ or intermediate‐care setting.
Among the noncritically ill patients whose LOS was at least 3 days (N = 2916), average age was 69 years, and average LOS was 5.7 days. Most of the discharged patients were men (57%), and 90% were white. Most patients were discharged from primary care (45%; general internal medicine or family medicine) or surgical services (34%), with the rest discharged from other specialties (eg, cardiology, transplant medicine). Compared to the noncritically ill, who had an LOS of at least 3 days, those noncritically patients whose LOS was less than 3 days (n = 2282) were slightly younger (mean age 68 versus 69 years, P < .001 by Mann‐Whitney testing) but were comparable in sex and race distribution (P > .07 for both by chi‐square testing).
Glycemic Control
The median duration between admission and time of first bedside glucose measurement was 3.0 hours. Patients had an average of 19 bedside glucose measurements; the overall mean number of bedside measurements was 3.4 per day, 3.7 during the first 24‐hour period, and 3.4 during the last 24 hours of hospitalization. Nearly 25% of patients were hyperglycemic (bedside glucose > 200 mg/dL) during the first 24 hours of hospitalization (Fig. 1A), 20% had persistent hyperglycemia throughout the entire hospitalization (Fig. 1B), and 21% were hyperglycemic during the 24 hours before discharge (Fig. 1C), with some patients discharged with an average bedside glucose of at least 300 mg/dL during the 24 hours before discharge.
The incidence of hypoglycemic episodes was lower than that of hyperglycemic episodes: 21% of patients had at least 1 bedside glucose value less than 70 mg/dL, but 68% had at least 1 value greater than 200 mg/dL. The frequency of hypoglycemic measurements was low (Fig. 2A) compared with the frequency of hyperglycemic episodes (Fig. 2B).
Hyperglycemia Therapy
Most patients (72%) received subcutaneous insulin at some point during their hospital stay; 19% had no therapy, 9% had oral agents only, 26% had oral agents plus insulin, and 46% had insulin only. The proportion receiving no therapy decreased from 32% among patients whose BedGlucavg was in the first tertile to 2% in the third tertile; the percentage of patients taking oral agents only decreased from 18% to 1%; the proportion taking oral agents plus insulin was 17% in the first tertile and 30% in the third; and the proportion of those taking insulin only was 32% in the first tertile and 66% in the third (Fig. 3). Thus, nearly all patients whose BedGlucavg value was in the third tertile received insulin, either as monotherapy or in combination with oral agents.
Among insulin users, 58% received bolus‐only, 42% received basal‐bolus, and 1% received basal‐only injections. Because of the small proportion of basal‐only patients, we conducted analyses only of patients whose insulin treatment fell into 1 of the first 2 categories. The use of a basal‐bolus insulin program increased from 34% in patients whose BedGlucavg was in the first tertile to 54% for those who had BedGlucavg in the third tertile (P < .001; Fig. 4, left). Thus, although there was a greater transition to a more intensive insulin regimen with worsening hyperglycemia, a substantial number of patients (46%) whose BedGlucavg was in the third tertile still did not have their insulin regimen intensified to a basal‐bolus program.
Fifty‐four percent of subcutaneous insulin users (N = 1680) had an increase in the amount of insulin administered between the first and last 24 hours of hospitalization (average increase, 17 U), 39% had a decrease (average decrease, 12 U), and 7% had no change. With rising hyperglycemia, more patients had their insulin increased by the time of discharge; 41% of persons who had BedGlucavg values in the first tertile were on more insulin by the time of discharge, whereas 65% of those who had average glucose values in the third tertile had insulin increased (Fig. 4, right). However, the pattern of changes in the amount of administered insulin was heterogeneous, with increases, decreases, and no change occurring in all tertiles of BedGlucavg (Fig. 3, right). Nearly 31% of patients whose BedGlucavg values were in the third tertile actually had a decrease in insulin. This decrease occurred despite evidence of a low frequency of hypoglycemia (only 1.2 values < 70 mg/dL per 100 measurements per person) and a high frequency of hyperglycemia (55.4 values > 200 mg/dL per person per 100 measurements).
DISCUSSION
The number of diabetes‐associated hospital discharges has been climbing2, 3; our own data indicate an increase in the number of patients with diabetes as a proportion of the total number of discharged patients. A recent consensus advocates good glucose control in the hospital to optimize outcomes,79 and institutions need to begin the process of assessing their quality of inpatient hyperglycemia management as a first step to enhancing care.
There are no guidelines about which method of glucose measurement (ie, blood glucose or bedside glucose) should be used as the quality measure to evaluate glycemic control in hospital patients. Both blood and bedside glucose measurements have been used in outcomes studies.23, 24 We analyzed capillary bedside values measured by a method subjected to ongoing quality control oversight and stored in the electronic laboratory database. Bedside glucose measurements are typically obtained with far greater frequency than blood glucose measurements and therefore provide better insight into daily changes in glycemic control; in practice, clinicians rely on bedside values when assessing hyperglycemia and making therapeutic decisions.
There is also no consensus about what glucose metric should be used to assess the status of glycemic control in the hospital. Some studies have used single glucose values to examine the relationship between hyperglycemia and outcomes,25, 26 whereas others have used values averaged over various lengths of time.24, 27 To evaluate glucose control, we averaged capillary measurements in the first 24 hours of hospitalization (F24BedGlucavg), the last 24 hours of hospitalization (L24BedGlucavg), and for the entire LOS (BedGlucavg), and we calculated the number of documented hyper‐ and hypoglycemic events. The measures we used to examine hyperglycemia would serve as useful benchmarks for following the progress of future institutional interventions directed at glucose control in hospitalized patients at our hospital.
A substantial number of our patients selected for analysis (ie, noncritically ill with LOS 3 days) were found to have sustained hyperglycemia at the beginning, during, and at the end of their hospital stay. We found very few instances of severe hypoglycemia (values < 50 or < 40 mg/dL), and the low frequency of hypoglycemia compared to that of hyperglycemia could encourage practitioners to be more aggressive in treating hyperglycemia. The high frequency of recorded bedside glucose compared with blood glucose measurements ( 3 per day), the ongoing patient surveillance by medical, nursing, and other staff members, and our institution's written hypoglycemia policy most likely minimize the number of unobserved, undocumented, or untreated hypoglycemic episodes. There are no data or recommendations about what would be an acceptable number of hypoglycemic episodes in the hospital.
Very little is known about the therapeutic strategies being applied to hyperglycemia in the hospital. Our data show that subcutaneous insulin (either alone or in combination with oral agents) was used at some point during hospitalization for nearly three‐fourths of noncritically patients who were in the hospital for 3 days or longer. Moreover, as hyperglycemia worsened, use of oral hypoglycemic agents declined, there was a shift toward greater use of a scheduled basal‐bolus insulin program, and a greater proportion of patients had more insulin administered.
Although these latter findings are encouraging and suggest that practitioners are responding to the severity of hyperglycemia, further examination of the data suggests that a substantial number of patients in the highest glucose tertile did not have insulin therapy intensified. Nearly half our patients whose glucose values were in the highest tertile were treated with short‐acting insulin aloneprobably an ineffective regimen23, 28or did not have more insulin administered. The higher doses administered were not likely solely a result of using more sliding‐scale insulin, as previous investigators actually found no correlation between intensity of the sliding scale and total daily insulin dose.14 Although evidence here is circumstantial (we did not examine changes in provider orders in response to glucose levels), these findings, together with those in our previous study15 and in another study,14 provide indirect evidence of clinical inertia in the hospital.
Beyond clinical inertia, however, there was evidence of negative therapeutic momentum: nearly one‐third of patients whose glucose was in the highest tertile had insulin decreased rather than increased, despite the low frequency of hypoglycemia and the high frequency of hyperglycemia. It is likely that even a single episode of hypoglycemia concerned practitioners, but the clinical response in these situations should be to investigate and correct the circumstances leading to the hypoglycemia, rather than to necessarily deintensify therapy in the face of continued hyperglycemia. The analysis of this larger data set corroborated our observations of clinical inertia and negative therapeutic momentum from an earlier study of chart reviews of a smaller patient sample.15
The variable application of insulin therapy to the treatment of hyperglycemia may be an indication of the level of comfort practitioners have about using this pharmacologic agent. A recently completed survey of resident physicians at our institution indicated that understanding how to use insulin was the most common barrier to successful management of inpatient hyperglycemia.29 These observations reinforce the need for institutions to develop standardized insulin order sets and develop programs to educate the staff on the use of insulin.
This study differs from our original analysis based on chart review in 4 ways. First, the sample size in our first study (n = 90) was small and derived from discharges from a single year (2003), whereas the sample in the present study spanned several years and included several thousand cases. Second, in our prior study we did not have detailed pharmacologic data on glucose management and how treatment approaches varied relative to severity of hyperglycemia. In general, there is very limited data on what therapeutic strategies are being applied to inpatient hyperglycemia, and this analysis of a large sample of cases provides more insight into how practitioners are managing glucose.
Third, we wanted to corroborate observations made in our previous report using a different methodologyin this instance, adapting existing information systems to assessment of inpatient diabetes care. For example, our last study was based on a limited number of glucose observations but suggested that the prevalence of hypoglycemia in our hospital was low compared with that of hyperglycemia; the present analysis of a very large number of glucose values confirmed these initial findings. In addition, use of information systems versus a chart review approach to assessing inpatient diabetes care corroborates our earlier suspicions about the presence of clinical inertia and negative therapeutic momentum in glucose management.
Fourth and finally, this study gave us experience with use of electronic records as a means to assess the status of inpatient diabetes care. Electronic data sources will likely be common tools to monitor quality of inpatient diabetes care and will likely figure prominently in future accreditation processes.10, 11 Unlike chart abstraction, which would require extensive man‐hours to extract data on few patients, use of electronic records allows examination of large numbers of hospital cases. Queries of information systems could be automated, and report cards potentially generated and feedback given to providers on the status of inpatient glycemic control. The industry is actively pursuing software development to assist hospitals in assessing the quality of inpatient glycemic control (eg, RALS‐TGCM, available at
However, there are also limitations to using electronic records as the sole method of assessing inpatient diabetes care. For instance, retrospective review of electronic records does not allow assessment of reasons underlying decision‐making behavior of clinicians (eg, why they did or did not change therapy). Diabetes and hyperglycemia associated hospitalizations must be identified by discharge diagnosis codes, so some cases of diabetes and hyperglycemia were likely missed.30, 31 Recent guidelines propose preprandial targets for glucose in the hospital.8 It is not easy to determine from an electronic data source which is a preprandial bedside glucose and which is a postprandial bedside glucose. Pre‐ and postpyramidal glucose categories would be difficult to define even during prospective studies, given the varying nature of nutritional support (ie, enteral, parenteral) used in the hospital and the administration of continuous dextrose infusions. Some type of quality control, such as conducting reviews of small samples of randomly selected charts to see how they compare with the electronic data, will need to be conducted.
From electronic discharge data, we cannot establish who had preexisting diabetes, who was admitted with new‐onset diabetes, and who developed hyperglycemia as a result of the hospital stay. Our previous random chart review15 indicated it is likely that most (more than 90%) had an established diagnosis of diabetes before admission. However, the recommendation to treat hyperglycemia should apply to all patients regardless of whether they had diagnosed diabetes prior to hospitalization or manifested hyperglycemia only during the hospital stay.79
As hospitals move toward making efforts to improve performance related to treating inpatient hyperglycemia, they must be cognizant of the heterogeneity of the inpatient population and the challenges to managing hospital hyperglycemia before drawing conclusions about their management. Inpatients with hyperglycemia are a diverse group, comprising patients with preexisting diabetes, with previously undiagnosed diabetes, and stress‐caused hyperglycemia. The unpredictable timing of procedures, various and changing forms of nutritional support, and different levels of staff expertise all contribute to the challenges of managing inpatient hyperglycemia. Inpatient practitioners may be forced to attempt glycemic control catch‐up for hospitalized persons who had poor outpatient glucose control. Patients who have required a stay in the intensive care unit may have very different glycemic outcomes than those who have not. Patients whose LOS was short (< 3days) may have different glycemic outcomes than persons whose LOS was longer ( 3 days as defined here) because of the length of time practitioners have to work to control their hyperglycemia. These and other variables may have to be taken into account when developing and assessing the impact of interventions.
Despite these limitations, our analysis was helpful in providing direction for enhancing the care of hospitalized patients with hyperglycemia in our facility. For instance, our generalists and surgeons are the principal caretakers of noncritically ill patients with diabetes, and these practitioners could be targeted for the first continuing educational programs about inpatient care of hyperglycemia. In addition, institutional guidelines on when and how to initiate and change therapyparticularly insulincan be designed so that hyperglycemia in noncritically ill hospital patients can be managed more effectively. These and other ongoing educational initiatives are necessary to ensure delivery of the highest quality of inpatient glucose care.
- ,,,.Hospitalization in the United States,1997.Rockville, MD:Agency for Healthcare Research and Quality;2000. Report No.: HCUP Fact Book No. 1; AHRQ Publication No. 00‐0031.
- Hospitalization for Diabetes as First‐Listed Diagnosis. Available at: http://www.cdc.gov/diabetes/statistics/dmfirst/index.htm. Accessed November 29,2006.
- Hospitalizations for Diabetes as Any‐Listed Diagnosis. Available at: http://www.cdc.gov/diabetes/statistics/dmany/index.htm. Accessed November 29,2006,
- ,,,.Multiple hospitalizations for patients with diabetes.Diabetes Care.2003;26:1421–1426.
- ,,.Economic costs of diabetes in the US in 2002.Diabetes Care.2003;26:917–932.
- ,,.Inpatient diabetology. The new frontier.J Gen Intern Med.2004;19:466–471.
- ,,, et al.American Diabetes Association Diabetes in Hospitals Writing Committee: Management of diabetes and hyperglycemia in hospitals.Diabetes Care.2004;27:553–591.
- ACE Task Force on Inpatient Diabetes and Metabolic Control.American College of Endocrinology position statement on inpatient diabetes and metabolic control.Endocr Pract,2004;10:77–82.
- ACE/ADA Task Force on Inpatient Diabetes.American College of Endocrinology and American Diabetes Association consensus statement on inpatient diabetes and glycemic control.Endocr Pract.2006;12:459–468.
- Getting started kit: prevent surgical site infections.2006 Available at: www.ihi.org/NR/rdonlyres/00EBAF1F‐A29F‐4822‐ABCE‐829573255AB8/0/SSIHowtoGuideFINAL.pdf. Accessed November 29,year="2006"2006.
- Joint Commission on Accreditation of Healthcare Organizations. American Diabetes Association and Joint Commission Collaborate on Joint Commission Inpatient Diabetes Care Certification.2006. Available at: http://www.jointcommission.org/NewsRoom/NewsReleases/jc_nr_072006.htm. Accessed November 29,year="2006"2006,
- ,.Glycemic chaos (not glycemic control) still the rule for inpatient care: How do we stop the insanity?J Hosp Med.2006;1:141–144.
- ,,,,.Unrecognized diabetes among hospitalized patients.Diabetes Care.1998;21(2):246–249.
- ,,,,.Inpatient management of diabetes and hyperglycemia among general medicine patients at a large teaching hospital.J Hosp Med.2006;1(3):145–150.
- ,,, et al.Diabetes care in the non‐ICU setting: is there clinical inertia in the hospital?J Hosp Med,2006;1(3):151–160.
- ,,, et al.Diabetes in urban African‐Americans. XVI. Overcoming clinical inertia improves glycemic control in patients with type 2 diabetes.Diabetes Care.1999;22:1494–500.
- ,,, et al.Clinical Inertia.Ann Intern Med.2001;135:825–834.
- ,,,Team UHCUDBP.Quality of diabetes care in U.S. academic medical centers: low rates of medical regimen change.Diabetes Care.2005;28:337–442.
- ,,, et al.Clinical inertia in the management of type 2 diabetes metabolic risk factors.Diabet Med,2004;21:150–155.
- ,.Clinical inertia: errors of omission in drug therapy.Am J Health Syst Pharm.2004;61:401–404.
- .Overcome clinical inertia to control systolic blood pressure.Arch Intern Med,2003;163:2677–2678.
- ,,,,.Clinical inertia in response to inadequate glycemic control: do specialists differ from primary care physicians?Diabetes Care.2005;28:600–606.
- ,,.Glycemic Control and Sliding Scale Insulin Use in Medical Inpatients With Diabetes Mellitus.Arch Intern Med.1997;157:545–552.
- ,,.Effect of hyperglycemia and continuous intraveneous insulin infusions on outcomes of cardiac surgical procedures: the Portland Diabetic Project.Endocr Pract.2004;10(2):21–33.
- ,,, et al.Plasma glucose at hospital admission and previous metabolic control determine myocardial infarct size and survival in patients with and without type 2 diabetes: the Langendreer Myocardial Infarction and Blood Glucose in Diabetic Patients Assessment (LAMBDA).Diabetes Care.2005;28:2551–2553.
- ,,.Admission hyperglycemia as a prognostic indicator in trauma.J Trauma Inj Infect Crit Care.2003;55(1):33–38.
- ,,, et al.Intraoperative hyperglycemia and perioperative outcomes in cardiac surgery patients.Mayo Clin Proc.2005;80:862–866.
- ,,,,.Efficacy of sliding‐scale insulin therapy: a comparison with prospective regimens.Fam Pract Res J.1994;14:313–22.
- ,,, et al.Management of inpatient hyperglycemia: assessing perceptions and barriers to care among resident physicians.Endocr Pract., to appear.
- ,,,,.Diabetes‐related hospitalization and hospital utilization. In:Diabetes in America.Bethesda, MD:National Institutes of Diabetes and Digestive Diseases;1995:553–563.
- ,,, et al.Hospital discharge records under‐report the prevalence of diabetes in inpatients.Diabetes Res Clin Pract.2003;59(2):145–151.
- ,,,.Hospitalization in the United States,1997.Rockville, MD:Agency for Healthcare Research and Quality;2000. Report No.: HCUP Fact Book No. 1; AHRQ Publication No. 00‐0031.
- Hospitalization for Diabetes as First‐Listed Diagnosis. Available at: http://www.cdc.gov/diabetes/statistics/dmfirst/index.htm. Accessed November 29,2006.
- Hospitalizations for Diabetes as Any‐Listed Diagnosis. Available at: http://www.cdc.gov/diabetes/statistics/dmany/index.htm. Accessed November 29,2006,
- ,,,.Multiple hospitalizations for patients with diabetes.Diabetes Care.2003;26:1421–1426.
- ,,.Economic costs of diabetes in the US in 2002.Diabetes Care.2003;26:917–932.
- ,,.Inpatient diabetology. The new frontier.J Gen Intern Med.2004;19:466–471.
- ,,, et al.American Diabetes Association Diabetes in Hospitals Writing Committee: Management of diabetes and hyperglycemia in hospitals.Diabetes Care.2004;27:553–591.
- ACE Task Force on Inpatient Diabetes and Metabolic Control.American College of Endocrinology position statement on inpatient diabetes and metabolic control.Endocr Pract,2004;10:77–82.
- ACE/ADA Task Force on Inpatient Diabetes.American College of Endocrinology and American Diabetes Association consensus statement on inpatient diabetes and glycemic control.Endocr Pract.2006;12:459–468.
- Getting started kit: prevent surgical site infections.2006 Available at: www.ihi.org/NR/rdonlyres/00EBAF1F‐A29F‐4822‐ABCE‐829573255AB8/0/SSIHowtoGuideFINAL.pdf. Accessed November 29,year="2006"2006.
- Joint Commission on Accreditation of Healthcare Organizations. American Diabetes Association and Joint Commission Collaborate on Joint Commission Inpatient Diabetes Care Certification.2006. Available at: http://www.jointcommission.org/NewsRoom/NewsReleases/jc_nr_072006.htm. Accessed November 29,year="2006"2006,
- ,.Glycemic chaos (not glycemic control) still the rule for inpatient care: How do we stop the insanity?J Hosp Med.2006;1:141–144.
- ,,,,.Unrecognized diabetes among hospitalized patients.Diabetes Care.1998;21(2):246–249.
- ,,,,.Inpatient management of diabetes and hyperglycemia among general medicine patients at a large teaching hospital.J Hosp Med.2006;1(3):145–150.
- ,,, et al.Diabetes care in the non‐ICU setting: is there clinical inertia in the hospital?J Hosp Med,2006;1(3):151–160.
- ,,, et al.Diabetes in urban African‐Americans. XVI. Overcoming clinical inertia improves glycemic control in patients with type 2 diabetes.Diabetes Care.1999;22:1494–500.
- ,,, et al.Clinical Inertia.Ann Intern Med.2001;135:825–834.
- ,,,Team UHCUDBP.Quality of diabetes care in U.S. academic medical centers: low rates of medical regimen change.Diabetes Care.2005;28:337–442.
- ,,, et al.Clinical inertia in the management of type 2 diabetes metabolic risk factors.Diabet Med,2004;21:150–155.
- ,.Clinical inertia: errors of omission in drug therapy.Am J Health Syst Pharm.2004;61:401–404.
- .Overcome clinical inertia to control systolic blood pressure.Arch Intern Med,2003;163:2677–2678.
- ,,,,.Clinical inertia in response to inadequate glycemic control: do specialists differ from primary care physicians?Diabetes Care.2005;28:600–606.
- ,,.Glycemic Control and Sliding Scale Insulin Use in Medical Inpatients With Diabetes Mellitus.Arch Intern Med.1997;157:545–552.
- ,,.Effect of hyperglycemia and continuous intraveneous insulin infusions on outcomes of cardiac surgical procedures: the Portland Diabetic Project.Endocr Pract.2004;10(2):21–33.
- ,,, et al.Plasma glucose at hospital admission and previous metabolic control determine myocardial infarct size and survival in patients with and without type 2 diabetes: the Langendreer Myocardial Infarction and Blood Glucose in Diabetic Patients Assessment (LAMBDA).Diabetes Care.2005;28:2551–2553.
- ,,.Admission hyperglycemia as a prognostic indicator in trauma.J Trauma Inj Infect Crit Care.2003;55(1):33–38.
- ,,, et al.Intraoperative hyperglycemia and perioperative outcomes in cardiac surgery patients.Mayo Clin Proc.2005;80:862–866.
- ,,,,.Efficacy of sliding‐scale insulin therapy: a comparison with prospective regimens.Fam Pract Res J.1994;14:313–22.
- ,,, et al.Management of inpatient hyperglycemia: assessing perceptions and barriers to care among resident physicians.Endocr Pract., to appear.
- ,,,,.Diabetes‐related hospitalization and hospital utilization. In:Diabetes in America.Bethesda, MD:National Institutes of Diabetes and Digestive Diseases;1995:553–563.
- ,,, et al.Hospital discharge records under‐report the prevalence of diabetes in inpatients.Diabetes Res Clin Pract.2003;59(2):145–151.
Copyright © 2007 Society of Hospital Medicine
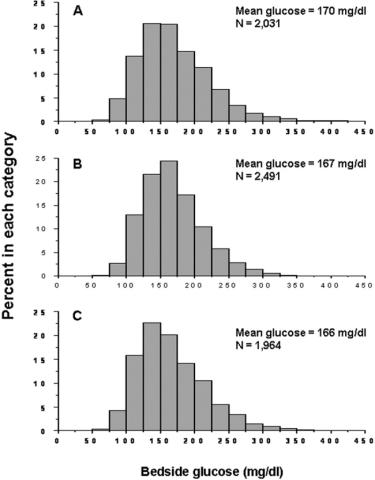
A Lame Doc

This is my last issue as physician editor of The Hospitalist. It has certainly been an interesting and rewarding two years. It has been an exceptional experience working with Lisa Dionne, Wiley, and SHM.
I look forward to the changes my worthy successor Jeff Glasheen, MD, will put into place. As I approach the end of my tenure, I can glimpse the light at the end of the tunnel.
I have a sense of déjà vu. I have a sense of déjà vu. I know the feeling well. I’ve noted it on the last day on a rotation, the last hour on a shift; I even remember it from the last month of residency. All of these were periods of transition, variations on the well known theme of “senior-itis.” A colleague, a one-year hospitalist named Jeremy Cetnar who is off to greener oncologic pastures, suggested his final few weeks on service were like being a lame duck president; a combination of temporizing and survival.
What is a lame duck beside the punch line for a corny joke? The term may have originated in the London stock exchange in the mid-18th century. When settlement day came, and a member was unable to meet his debt, he “waddled” out of Exchange Alley. From an avian standpoint one could also be a rook (a type of crow), which was a swindler. That was better then being a dove, which was the rook’s prey (hence the saying “They got rooked”).
Perhaps better to be a mammal like a bull or a bear, than a lame duck. Lame ducks are also seen in entertainment. There is a Finnish rock band and a Norwegian ska punk band by that name. The lame duck is also a well-known tango position, but my orthopedist has forbidden me from demonstrating.
The 20th Amendment (the big XX) is called the lame duck amendment. It comes right after XIX, also known as the “No shoes, no shirt, no service” amendment. (Actually XIX is “The right of the citizens of the U.S. to vote shall not be denied or abridged on account of sex”—a biggie for sure).
Amendment XX was established in 1933 to reduce the time between the election of the president and Congress and the beginning of their terms. Having a delayed inauguration could lead to problems, as in the case of Abraham Lincoln: The Confederate States seceded before he could be sworn into office.
It is never easy to sit in office as a lame duck, whether a senator, congressman, or president. As a president, the current two-term limit creates the lame duck situation more frequently. Prior to the inception of this limit, there was always the possibility of running for a third term to add spice to those last years in office. The first Roosevelt to run for a third term was Teddy, running as a “Bull Moose.” He lost his bid to Woodrow Wilson in 1912. After FDR, there would be no more two-term-plus presidents.
There have been five lame ducks since the amendment was passed: Eisenhower, Nixon, Reagan, Clinton, and our current lame president, Bush. The last two years of the second term can be hard. For Eisenhower and Reagan their prestige and public admiration carried them through. Nixon and Clinton were significantly less lucky in this regard. How the current resident of 1600 Pennsylvania Ave. finishes his term will be of great interest to historians—and to those of us who live through it.
“How does this have anything to do with hospital medicine?” you may ask yourself, as the readers of this column frequently query.
As a resident, the last few months were never ending. The predominant sensation was being ready to move on. If it’s the last day on service after a long run, and a patient gets admitted, I still sometimes have to fight that feeling. There are unanswered questions, tests to be ordered, labs pending, but still you know that when those results come back, it won’t be you who interprets them. It creates a disconnect that is hard to avoid.
For a one-year hospitalist, spending a year on service as filler between residency and fellowship, this is a huge issue. As the transitional hospitalist nears the end, how can he or she stay involved in decision-making and maintain interest in the workings and improvement of the group? Transitional hospitalists are an important resource in many academic centers, and making their entire year a success is of paramount importance to the patients they serve.
The best recommendation I can make is to make sure one-year hospitalists are not on service their last two weeks. Let them save their vacation time and non-service time until the end, when they really need it for the transition to the next phase in their lives. This also helps avoid the creation of a malcontent and the potential for substandard care by a disengaged provider.
As physician editor—aka Grand Kahuna—of The Hospitalist, I have felt that sensation of being ready to hand over the reins. I am ready for my senescence. Nonetheless, it has been a great two years. We have covered stories from all over the world—Iraq, Afghanistan, Holland, and Brazil. We have explored medical history from ancient Greece to colonial America. We have even looked at maggot debridement. Oh, and also some hospitalist stuff.
I can’t wait to see what The Hospitalist will look like in the years to come. As the great poet-physician Oliver Wendell Holmes Sr. observed, “The great thing in the world is not so much where we stand, as in what direction we are moving.” TH
Dr. Newman served as physician editor of The Hospitalist since 2005. He’s also consultant, Hospital Internal Medicine, and assistant professor of internal medicine and medical history, Mayo Clinic College of Medicine, Rochester, Minn.
This is my last issue as physician editor of The Hospitalist. It has certainly been an interesting and rewarding two years. It has been an exceptional experience working with Lisa Dionne, Wiley, and SHM.
I look forward to the changes my worthy successor Jeff Glasheen, MD, will put into place. As I approach the end of my tenure, I can glimpse the light at the end of the tunnel.
I have a sense of déjà vu. I have a sense of déjà vu. I know the feeling well. I’ve noted it on the last day on a rotation, the last hour on a shift; I even remember it from the last month of residency. All of these were periods of transition, variations on the well known theme of “senior-itis.” A colleague, a one-year hospitalist named Jeremy Cetnar who is off to greener oncologic pastures, suggested his final few weeks on service were like being a lame duck president; a combination of temporizing and survival.
What is a lame duck beside the punch line for a corny joke? The term may have originated in the London stock exchange in the mid-18th century. When settlement day came, and a member was unable to meet his debt, he “waddled” out of Exchange Alley. From an avian standpoint one could also be a rook (a type of crow), which was a swindler. That was better then being a dove, which was the rook’s prey (hence the saying “They got rooked”).
Perhaps better to be a mammal like a bull or a bear, than a lame duck. Lame ducks are also seen in entertainment. There is a Finnish rock band and a Norwegian ska punk band by that name. The lame duck is also a well-known tango position, but my orthopedist has forbidden me from demonstrating.
The 20th Amendment (the big XX) is called the lame duck amendment. It comes right after XIX, also known as the “No shoes, no shirt, no service” amendment. (Actually XIX is “The right of the citizens of the U.S. to vote shall not be denied or abridged on account of sex”—a biggie for sure).
Amendment XX was established in 1933 to reduce the time between the election of the president and Congress and the beginning of their terms. Having a delayed inauguration could lead to problems, as in the case of Abraham Lincoln: The Confederate States seceded before he could be sworn into office.
It is never easy to sit in office as a lame duck, whether a senator, congressman, or president. As a president, the current two-term limit creates the lame duck situation more frequently. Prior to the inception of this limit, there was always the possibility of running for a third term to add spice to those last years in office. The first Roosevelt to run for a third term was Teddy, running as a “Bull Moose.” He lost his bid to Woodrow Wilson in 1912. After FDR, there would be no more two-term-plus presidents.
There have been five lame ducks since the amendment was passed: Eisenhower, Nixon, Reagan, Clinton, and our current lame president, Bush. The last two years of the second term can be hard. For Eisenhower and Reagan their prestige and public admiration carried them through. Nixon and Clinton were significantly less lucky in this regard. How the current resident of 1600 Pennsylvania Ave. finishes his term will be of great interest to historians—and to those of us who live through it.
“How does this have anything to do with hospital medicine?” you may ask yourself, as the readers of this column frequently query.
As a resident, the last few months were never ending. The predominant sensation was being ready to move on. If it’s the last day on service after a long run, and a patient gets admitted, I still sometimes have to fight that feeling. There are unanswered questions, tests to be ordered, labs pending, but still you know that when those results come back, it won’t be you who interprets them. It creates a disconnect that is hard to avoid.
For a one-year hospitalist, spending a year on service as filler between residency and fellowship, this is a huge issue. As the transitional hospitalist nears the end, how can he or she stay involved in decision-making and maintain interest in the workings and improvement of the group? Transitional hospitalists are an important resource in many academic centers, and making their entire year a success is of paramount importance to the patients they serve.
The best recommendation I can make is to make sure one-year hospitalists are not on service their last two weeks. Let them save their vacation time and non-service time until the end, when they really need it for the transition to the next phase in their lives. This also helps avoid the creation of a malcontent and the potential for substandard care by a disengaged provider.
As physician editor—aka Grand Kahuna—of The Hospitalist, I have felt that sensation of being ready to hand over the reins. I am ready for my senescence. Nonetheless, it has been a great two years. We have covered stories from all over the world—Iraq, Afghanistan, Holland, and Brazil. We have explored medical history from ancient Greece to colonial America. We have even looked at maggot debridement. Oh, and also some hospitalist stuff.
I can’t wait to see what The Hospitalist will look like in the years to come. As the great poet-physician Oliver Wendell Holmes Sr. observed, “The great thing in the world is not so much where we stand, as in what direction we are moving.” TH
Dr. Newman served as physician editor of The Hospitalist since 2005. He’s also consultant, Hospital Internal Medicine, and assistant professor of internal medicine and medical history, Mayo Clinic College of Medicine, Rochester, Minn.
This is my last issue as physician editor of The Hospitalist. It has certainly been an interesting and rewarding two years. It has been an exceptional experience working with Lisa Dionne, Wiley, and SHM.
I look forward to the changes my worthy successor Jeff Glasheen, MD, will put into place. As I approach the end of my tenure, I can glimpse the light at the end of the tunnel.
I have a sense of déjà vu. I have a sense of déjà vu. I know the feeling well. I’ve noted it on the last day on a rotation, the last hour on a shift; I even remember it from the last month of residency. All of these were periods of transition, variations on the well known theme of “senior-itis.” A colleague, a one-year hospitalist named Jeremy Cetnar who is off to greener oncologic pastures, suggested his final few weeks on service were like being a lame duck president; a combination of temporizing and survival.
What is a lame duck beside the punch line for a corny joke? The term may have originated in the London stock exchange in the mid-18th century. When settlement day came, and a member was unable to meet his debt, he “waddled” out of Exchange Alley. From an avian standpoint one could also be a rook (a type of crow), which was a swindler. That was better then being a dove, which was the rook’s prey (hence the saying “They got rooked”).
Perhaps better to be a mammal like a bull or a bear, than a lame duck. Lame ducks are also seen in entertainment. There is a Finnish rock band and a Norwegian ska punk band by that name. The lame duck is also a well-known tango position, but my orthopedist has forbidden me from demonstrating.
The 20th Amendment (the big XX) is called the lame duck amendment. It comes right after XIX, also known as the “No shoes, no shirt, no service” amendment. (Actually XIX is “The right of the citizens of the U.S. to vote shall not be denied or abridged on account of sex”—a biggie for sure).
Amendment XX was established in 1933 to reduce the time between the election of the president and Congress and the beginning of their terms. Having a delayed inauguration could lead to problems, as in the case of Abraham Lincoln: The Confederate States seceded before he could be sworn into office.
It is never easy to sit in office as a lame duck, whether a senator, congressman, or president. As a president, the current two-term limit creates the lame duck situation more frequently. Prior to the inception of this limit, there was always the possibility of running for a third term to add spice to those last years in office. The first Roosevelt to run for a third term was Teddy, running as a “Bull Moose.” He lost his bid to Woodrow Wilson in 1912. After FDR, there would be no more two-term-plus presidents.
There have been five lame ducks since the amendment was passed: Eisenhower, Nixon, Reagan, Clinton, and our current lame president, Bush. The last two years of the second term can be hard. For Eisenhower and Reagan their prestige and public admiration carried them through. Nixon and Clinton were significantly less lucky in this regard. How the current resident of 1600 Pennsylvania Ave. finishes his term will be of great interest to historians—and to those of us who live through it.
“How does this have anything to do with hospital medicine?” you may ask yourself, as the readers of this column frequently query.
As a resident, the last few months were never ending. The predominant sensation was being ready to move on. If it’s the last day on service after a long run, and a patient gets admitted, I still sometimes have to fight that feeling. There are unanswered questions, tests to be ordered, labs pending, but still you know that when those results come back, it won’t be you who interprets them. It creates a disconnect that is hard to avoid.
For a one-year hospitalist, spending a year on service as filler between residency and fellowship, this is a huge issue. As the transitional hospitalist nears the end, how can he or she stay involved in decision-making and maintain interest in the workings and improvement of the group? Transitional hospitalists are an important resource in many academic centers, and making their entire year a success is of paramount importance to the patients they serve.
The best recommendation I can make is to make sure one-year hospitalists are not on service their last two weeks. Let them save their vacation time and non-service time until the end, when they really need it for the transition to the next phase in their lives. This also helps avoid the creation of a malcontent and the potential for substandard care by a disengaged provider.
As physician editor—aka Grand Kahuna—of The Hospitalist, I have felt that sensation of being ready to hand over the reins. I am ready for my senescence. Nonetheless, it has been a great two years. We have covered stories from all over the world—Iraq, Afghanistan, Holland, and Brazil. We have explored medical history from ancient Greece to colonial America. We have even looked at maggot debridement. Oh, and also some hospitalist stuff.
I can’t wait to see what The Hospitalist will look like in the years to come. As the great poet-physician Oliver Wendell Holmes Sr. observed, “The great thing in the world is not so much where we stand, as in what direction we are moving.” TH
Dr. Newman served as physician editor of The Hospitalist since 2005. He’s also consultant, Hospital Internal Medicine, and assistant professor of internal medicine and medical history, Mayo Clinic College of Medicine, Rochester, Minn.