User login
Advice and Preparedness to Quit Smoking
Hospitalization may offer a natural opportunity to screen and advise patients on the advantages of quitting smoking due to a variety of reasons, such as the smoke‐free environment, availability of medical personnel, suitability of tailoring information, and the potential to catch a teachable moment.1, 2 Additionally, a recent meta‐analysis suggested that hospital‐based cessation programs and referrals to cardiac rehabilitation result in significantly higher rates of cessation among discharged smokers.3 In 2008, the U.S. Public Health Service Task Force on Clinical Practice Guidelines for Treating Tobacco Use and Dependence in hospitalized smokers recommended listing smoking status on problem lists, evaluating a smoker's preparedness to quit, providing counseling and medications to treat in‐hospital withdrawal symptoms, and arranging discharge follow‐up to help smokers remain abstinent.4 To promote these practices, the Center for Medicaid and Medicare Services (CMS) has made smoking cessation counseling a quality of care indicator for patients hospitalized with congestive heart failure (CHF), acute myocardial infarction (AMI), or pneumonia. This indicator is a critical step in recognizing the importance of smoking cessation counseling in improving mortality and morbidity for these patients.
Despite the importance of promoting smoking cessation among hospitalized patients, few studies have looked at whether or not hospitalized patients are prepared to quit smoking. Ascertaining patients' preparedness to quit smoking is an important first step in understanding a patient's readiness to change their health behaviors because smoking cessation is the culmination of a lengthy process of behavior change.5 Studies of healthy factory workers suggest that smokers who were more prepared to quit smoking had a higher number of previous quit attempts and perceived coworker encouragement.6
Understanding patient preparedness to quit smoking is especially important among African American smokers, who face a disproportionate health burden due to smoking‐related illness. Studies show that African Americans are less likely than other racial groups to engage in formal tobacco cessation interventions and have lower long‐term quit rates, despite a higher desire to quit smoking.5, 79 Understanding preparedness to quit among this particular group of hospitalized patients may be an important first step in identifying those most likely to quit and benefit from tailored, intensive interventions, such as using medications to assist in combination with postdischarge tobacco cessation counseling.
The aim of this study was to characterize the preparedness to quit smoking and to assess quit attempts made, methods used for quitting, and the success of such quit attempts at 1‐month follow‐up in a group comprised of a high proportion of underserved African American hospitalized smokers. In addition, the relationship of hospitalized patients' preparedness to quit and the effect of inpatient advice on the likelihood of subsequent tobacco cessation were examined.
Patients and Methods
The data used for this study were collected for the Cardiology Quality of Care Study, an ongoing prospective study of patients hospitalized on the inpatient cardiology service at the University of Chicago Medical Center. Newly admitted patients were approached by research assistants and consented to the study using a previously described protocol for enrolling hospitalized patients.10 Patients that lacked decisional capacity (score of <17 on the telephone version of the Mini‐Mental Status Exam)11 were excluded. Patients did not receive any scripted intervention during this admission to assist with cessation. The study left cessation counseling and advice to quit up to the discretion of the individual physician caring for the patient in the hospital. The Institutional Review Board at the University of Chicago approved this study.
Inpatient Interview
The inpatient interview is a 60‐item questionnaire taking approximately 15 minutes to administer by trained research assistants. The questionnaire is designed to assess demographic characteristics (race, socioeconomic status, education, sex, and age), smoking habits, and preparedness to quit. Demographics were collected on all consented patients. Seven items focused on cigarette smoking, consistent with questions in the National Health Information Survey.12 Patients were classified as lifetime smokers if they smoked at least 100 cigarettes in their lifetime. To identify current smokers on admission, patients were asked if they now smoke cigarettes some days or everyday. Additionally, smokers were asked if they had made any quit attempts in the past 12 months.
Patients rated their level of preparedness using a modified version of the Biener Abrams Contemplation Ladder. The Contemplation Ladder is an easily‐administered tool represented by a ladder image of rungs with anchor statements developed as an alternative method to the Prochaska and DiClemente Stages of Change.13 The 10‐point scale ranges from 1 (I enjoy smoking and have decided not to quit smoking for my lifetime; I have no interest in quitting) to 10 (I have quit smoking and will never smoke again.) Tobacco users may rank their current level of motivation to quit. A level of 6 (I definitely plan to quit smoking in the next 6 months) or higher is consistent with preparedness to quit. The Contemplation Ladder was validated by Biener and Abrams6 in a work site study which demonstrated that subjects with higher Ladder scores (score 6) were more likely than those with lower Ladder scores (scores < 6) to participate in awareness activities (eg, educational session) and make a quit attempt in 6 months. This instrument is easier to administer than the more well known Transtheoretical Model of Change, given that it is an ordinal scale with clear steps that may be more user‐friendly for both clinicians and patients.6 In a prior study of emergency room patients, an individual's Ladder score was shown to be significantly associated with a patient's reported intention to quit, number of previous quit attempts, perceived coworker encouragement, and socioeconomic status.14
Admission Diagnoses
Chart audit was performed by trained research assistants at the time of the inpatient interview (within 24 hours of admission) to assess whether patients were admitted with the potential diagnoses of AMI, CHF, neither, or both. All were based on the chart documentation of the patients' clinical presentation. This information was used to assess which CMS Quality Indicators applied to cardiology patients, given that smoking cessation is now a quality indicator for patients with AMI or CHF.
Thirty‐day Follow‐up Telephone Survey
Trained research assistants interviewed patients by telephone at approximately 1 month postdischarge. The follow‐up telephone survey included routine questions concerning follow‐up appointments, readmissions, emergency room visits, and patient satisfaction.15, 10 An additional 5 questions related to smoking cessation were added for this study. Questions were developed using the CMS quality indicators16 or were taken from the National Health Information Survey.12 Patients were asked to self‐report quit attempts made postdischarge, whether or not these quit attempts were associated with success (self‐reported abstinence at the time of follow‐up), and what methods were used to quit (ie, nicotine replacement therapy [NRT], other pharmacotherapy, quit line, pamphlet, counseling group, or cold turkey.) Patients were also asked if they recalled receiving advice to quit during their hospitalization from either a nurse or physician.
Data Analysis
Descriptive statistics were used to summarize Contemplation Ladder scores and types of quit methods used. Chi square tests were used to assess the effect of preparedness (Ladder score 6) on quit behaviors. The main quit behavior was any self‐reported quit attempt made within 1 month after discharge. Additionally, the relationship between preparedness and making a successful quit attempt (defined as a self‐report of not smoking as a result of this quit attempt in the last month) was examined. Multivariate logistic regression, controlling for demographic characteristics, was performed to test the effect of preparedness on quit behaviors (any quit attempt after discharge, or successful quit attempt). While not a primary aim of this study, the association between recall of in‐hospital advice and quit behaviors after discharge was also examined using chi square tests and multivariate logistic regression models, controlling for the demographic characteristics as above. Models also tested the effect of preparedness and recall of in‐hospital advice as independent predictors on quit behaviors and whether or not an interaction between preparedness and advice existed. A linear test of trend was also performed on preparedness and advice. All statistical tests were performed using Intercooled Stata 9.0 (Stata Corporation, College Station, TX), with statistical significance defined as P < 0.05.
Results
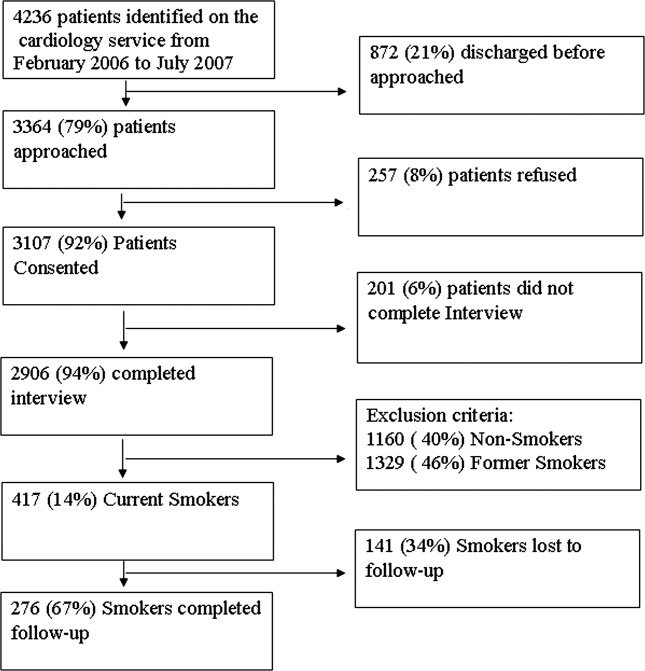
From February 2006 through July 2007, 86% (2906/3364) of all cardiology inpatients approached were interviewed. Fifteen percent (436/2906) of patients enrolled in the study indicated that they were current smokers. Contemplation Ladder scores were obtained on 95% (415/436) of the current smokers, and 1‐month postdischarge follow‐up telephone surveys were completed in 67% (276/415) of the current smokers. Three attempts were made to contact patients who were lost to follow‐up (Figure 1). The major reasons for inability to contact patients included wrong telephone numbers, disconnected phone lines, or no method to leave a message for the patient (ie, no answering machine). Given that we were only able to complete follow‐up interviews on 276 patients, we conducted our analyses on only this group of patients.
The average age of current smokers in the sample was 55 years (95% confidence interval [CI], 54‐58). Most current smokers were of the African American race (83%; 224/276). More than 65% of smokers had completed high school or higher, and nearly one‐half (46%) had an average household income of $25,000 or less before taxes. The most common admitting diagnoses per chart audit among current inpatient smokers were AMI (31%) and CHF (27%). The vast majority (95%) of hospitalized smokers in this sample were first‐time admissions to the University of Chicago. Table 1 shows the demographic data for current smokers compared to former smokers (those who have quit smoking prior to admission). Current smokers were more likely to be African American, had lower income levels, and were less likely to have completed high school. Additionally, current smokers were more likely to carry a potential diagnosis of AMI or CHF and to be a first‐time admission (Table 1).
| Demographic Variables | Current Smokers (n = 276)* | Nonsmoker (n = 1329)* | P Value |
|---|---|---|---|
| |||
| Male sex | 156 (57) | 705 (53) | 0.22 |
| African American race | 224 (83) | 886 (67) | <0.001 |
| Age (years) | 55.3 | 64.0 | <0.001 |
| Highest completed level of education | 0.02 | ||
| Junior high school or less | 15 (6) | 98 (7) | |
| Some high school | 67 (25) | 230 (17) | |
| High school graduate | 81 (30) | 403 (31) | |
| Some college education | 68 (25) | 313 (24) | |
| College graduate | 19 (7) | 135 (10) | |
| Graduate level education | 11 (4) | 96 (7) | |
| Household income before taxes | 0.001 | ||
| <$2500 | 33 (12) | 79 (6) | |
| $2501‐$15,000 | 66 (24) | 334 (26) | |
| $15,001‐$50,000 | 51 (19) | 311 (24) | |
| 50,001‐$100,000 | 22 (8) | 126 (9) | |
| >$100,001 | 11 (4) | 50 (4) | |
| Did not answer | 88 (33) | 422 (32) | |
| Diagnosis on admission | 0.02 | ||
| AMI | 66 (31) | 269 (24) | |
| CHF | 58 (27) | 287 (25) | |
| Both | 49 (23) | 273 (24) | |
| Neither | 42 (19) | 305 (27) | |
| Admission status | |||
| New admission | 258 (95) | 1,154 (87) | 0.051 |
| Readmission | 14 (5) | 175 (13) | |
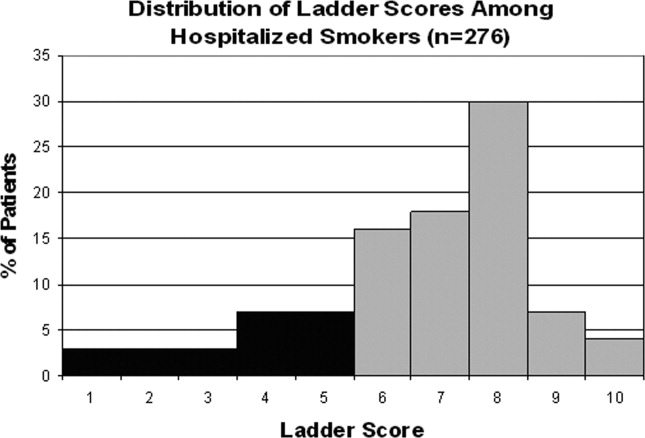
Approximately three‐quarters (76%; 210/276) of current smokers were identified as prepared to quit, with a Ladder score 6. There was a wide distribution of Ladder scores, with one‐third (31%; 86/276) of smokers reporting a Ladder score of 8, indicating that they still smoke, but are ready to set a quit date and another 34% (95/276 patients) with Ladder scores of either 6 or 7 also indicating they were planning to quit smoking (Figure 2). A significant portion of smokers (71%; 195/276) reported making a quit attempt after discharge, and 38% of smokers (106/276) self‐reported that their quit attempt was successful (ie, no longer smoking at 1 month post discharge). Note that the quit rate is reduced to 26% (106/415) at 1 month if one conservatively assumes that those who did not take part in follow‐up were relapsers. Among those who did participate in follow‐up, as shown in Figure 3, the most frequently reported (53%; 145/276) method used to quit smoking was cold turkey. Thirteen percent (37/276) of patients reported making a quit attempt using pharmacological therapy (ie, NRT or bupropion) and only 4% (12/276) of patients reported making a quit attempt using the help of a smoking cessation program (Figure 3).

Preparedness was an important predictor of making a quit attempt. Prepared patients (ie, Ladder score 6) were significantly more likely than patients who were less prepared to report making a quit attempt after discharge (163/212 [77%] vs. 32/64 [50%], respectively; P < 0.001). This result remained significant after adjusting for sociodemographic characteristics with a similar effect size (adjusted estimates 76% [95% CI, 75.7‐76.7] prepared vs. 49% [95% CI, 48.5‐49.8]; P < 0.001). These results also remained significant with a similar effect size in analyses using multivariate logistic regression (Table 2). Of those patients who made quit attempts, prepared patients were slightly more likely to report a successful quit attempt (90/163; 55%) than were less‐prepared patients (16/32; 50%), though this was not significant (P = 0.205).
| Statistical test | Quit Behavior | Prepared % (95% CI) | Unprepared % (95% CI) | P Value |
|---|---|---|---|---|
| ||||
| Chi square tests | Any quit attempt made after discharge | 76.9 (71.2‐82.6) | 50.0 (37.8‐62.2) | <0.001 |
| Successful quit attempt at time of follow‐up | 55.0 (45.9‐60.2) | 50.0 (25.4‐58.2) | 0.20 | |
| Multivariate logistic regression* | Any quit attempt made after discharge | 76.2 (75.7‐76.7) | 49.2 (48.5‐49.9) | <0.001 |
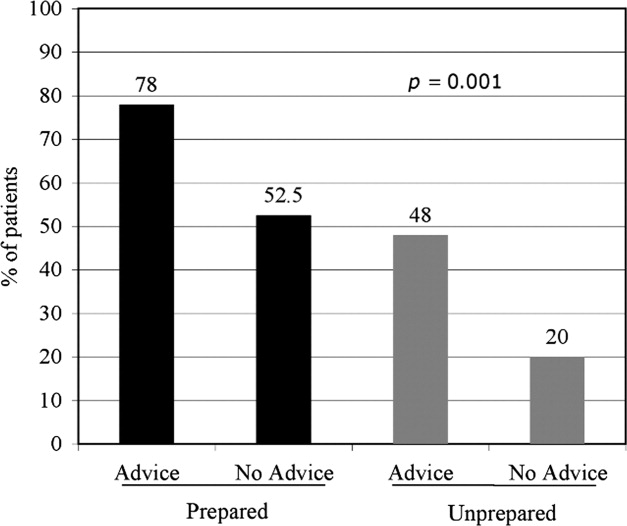
In the follow‐up sample, 17% could not remember if they received advice to quit smoking. Among those who were able to recall receiving advice, the majority (78%; 180/230) reported that they received advice from a nurse or physician during hospitalization, compared to 22% who did not recall ever being advised to quit by any healthcare provider during the admission. Patients who reported receiving advice to quit were more likely to report making a quit attempt postdischarge as compared to those that did not recall receiving advice (70% vs. 46%, respectively; P = 0.002). In a multivariate logistic regression, controlling for demographic factors and admitting diagnosis, both preparedness and receipt of in‐hospital advice were independent predictors of making a future quit attempt (odds ratio [OR] = 4.05; 95% CI, 1.91‐8.60; P < 0.001 for preparedness; OR = 3.96; 95% CI, 1.84‐8.54; P < 0.001 for advice). Additionally, there was no significant interaction or synergistic effect between being prepared to quit smoking and receiving in‐hospital advice to quit (OR = 1.24; 95% CI, 0.17‐9.21; P = 0.836) (Figure 4). When analyzing the effects of preparedness and advice on quit attempts, only preparedness to quit remained a significant predictor of a successful quit attempt (OR = 2.93; 95% CI, 1.13‐7.60; P = 0.027 for preparedness; OR = 2.16; 95% CI, 0.85‐5.49; P = 0.10 for advice to quit). As demonstrated in Table 2, a higher percentage of prepared patients made a quit attempt after discharge (76.9% vs. 50%) and had a successful quit attempt and short‐term abstinence (55% prepared patients vs. 50% less prepared patients).
Discussion
This study demonstrated that in a group of hospitalized underserved, and predominantly African American smokers, the majority of patients reported being prepared to quit smoking at the time of hospitalization. Prepared patients were more likely to report making a quit attempt after discharge and more likely to report being successful in their quit attempt than patients who reported being less prepared to quit during their hospitalization. Nevertheless, approximately one‐half of unprepared patients did make a quit attempt 1 month after discharge, demonstrating a desire to quit smoking after hospitalization among this population. However, short‐term success rates in this group were lower than in patients prepared to quit. In addition, preparedness to quit and receipt of in‐hospital advice to quit smoking were both found to be independent predictors of making a quit attempt, with nearly identical ORs; however, only preparedness remained significant after controlling for advice to quit. Last, although the majority of hospitalized cardiac patients were making quit attempts after discharge, most patients reported using the least effective quit methods (ie, cold turkey) rather than more effective and intensive interventions such as counseling in combination with pharmacotherapy.
These findings have important implications for current quality initiatives targeted at promoting smoking cessation among cardiac patients. First, these results highlight the need for evidence‐based methods to be made available to hospitalized smokers who are prepared to quit. Our results are consistent with other studies reporting rare use (5.2%) of NRT in the hospital setting, despite the proven benefit in treating nicotine withdrawal symptoms.17 This is also consistent with data reporting that among nonhospitalized smokers, quitting cold turkey was the most commonly used and least effective cessation method.18 Second, the rate of recall of in‐hospital advice among patients (78%) was generally consistent with those reported to CMS (most recent quarter 95% for AMI and 88% for CHF).19
In addition to receiving advice, preparedness to quit was associated with higher quit attempts, therefore highlighting the importance of assessing level of preparedness in addition to giving advice. The fact that most quit attempts were made using cold turkey and resulted in low short‐term success rates underscores the need to reevaluate the current CMS quality indicator of advice alone for hospitalized smokers. Furthermore, the recently updated 2008 U.S. Public Health guidelines recently recommend, in addition to advice, that all hospitalized smokers be assessed for readiness to change, be assisted in quitting with pharmacotherapy, and be arranged follow‐up for tobacco cessation postdischarge, highlighting the inadequacy of advice alone.4 While it is important to continue to advise all hospitalized smokers to quit, the study findings demonstrate that assessing preparedness may result in targeting more prepared patients with more intensive interventions. Further policy implications include that less prepared patients may need motivational techniques to increase their level of preparedness to quit during hospitalization.
Several limitations are worth mentioning. First, the study included a relatively small sample size drawn from a single urban medical center. The prevalence of current smokers in our sample was 15%, which is lower than many studies looking at cardiology inpatient smokers.3, 20 This limitation of our study may be attributed to the advanced age of the majority of our patients, as compared with other studies, as well as the possibility of socially desirable response bias that many low‐income African American smokers may experience, leaving them less likely to admit to smoking at the time of hospitalization. Second, there was a low follow‐up rate, with 66% of patients undergoing follow‐up postdischarge. While this may raise the concerns of differences between ladder scores in those patients that participated in follow‐up and those that did not, analyses show no significant difference between level of preparedness in these 2 groups (68% prepared in patients who received follow‐up vs. 63% prepared patients in those who did not participate in follow‐up; P = 0.36). Third, follow‐up of quit attempts and receipt of advice were all assessed using self‐report, and, therefore, were limited by lack of verification and lack of assessment for potential recall bias. Fourth, in this pilot study, the follow‐up period was relatively short at 1 month postdischarge. It is likely that rates of successful quit attempts would be lower with longer‐term follow‐up periods, given previous literature demonstrating the difficulty with long‐term abstinence.21 Last, the study was not able to account for potential effects that hospitalization itself may have on preparedness, as patients may be more likely to report being prepared to quit when in the face of a health shock,22 as well as the fact that some patients may demonstrate a socially desirable response bias influenced by hospitalization.
In conclusion, the majority of underserved smokers with cardiac disease reported being prepared to quit smoking and were more likely to self‐report making a quit attempt after discharge. However, the majority of these quit attempts were made via cold turkey, without the support of available evidence‐based methods to quit. It is possible that by directly providing education, access to pharmacotherapy, and counseling options, the utilization rates for more efficacious treatments would increase in cardiac patients who are prepared to quit. While recall of in‐hospital advice was associated with future quit attempts, prepared patients who recalled receiving advice were more likely to make a quit attempt than prepared patients who did not recall receiving advice, as well as unprepared patients. Together, these findings highlight the need to consider a patient's level of preparedness to quit in understanding the success of in‐hospital advice and the importance of making evidence‐based cessation methods available to hospitalized smokers who are prepared to quit. Additionally, identifying patients not prepared to quit may help in providing them with appropriate motivational therapy, to move them along the stages of change, as well as educational information on how to quit once they have decided to do so.
- ,,.Helping hospitalized smokers quit: new directions for treatment and research.J Consult Clin Psychol.1993;61:778–789.
- ,.Smokers who are hospitalized: a window of opportunity for cessation interventions.Prev Med.1992;21:262–269.
- ,,, et al.Predictors of smoking cessation after a myocardial infarction: the role of institutional smoking cessation programs in improving success.Arch Intern Med.2008;168(18):1961–1967.
- Guideline Panel.Clinical Practice Guidelines: Treating Tobacco Use and Dependence.Washington, DC:Public Health Service, U.S. Department of Health and Human Services;2008.
- ,.Stages and processes of self‐change in smoking: toward an integrative model of change.J Consult Clin Psychol.1983;51:390–395.
- ,.The Contemplation Ladder: validation of a measure of readiness to consider smoking cessation.Health Psychol.1991;10(5):360–365.
- ,,,,.Smoking cessation factors among African Americans and Whites.Am J Public Health.1993;83(2):220–226.
- U.S. Department of Health and Human Services.The Health Benefits of Smoking Cessation.Rockville, MD:Office on Smoking and Health, Centers for Chronic Disease Prevention and Health Promotion, Public Health Service,U.S. Department of Health and Human Services,Washington, DC;2000.
- ,,,,.Trends in cigarette smoking in the United States. the changing influence of gender and race.JAMA.1989;261(1):49–55.
- ,,, et al.Effects of physician experience on costs and outcomes on an academic general medicine service: results of a trial of hospitalists.Ann Intern Med.2002;137(11):866–874.
- ,,,.Validation of a telephone version of the Mini‐Mental State Examination.J Am Geriatr Soc.1992;40(7):697–702.
- National Health Information Survey Questionnaire, Sample Adult,Adult Health Behaviors;2004.
- ,,, et al.The Marijuana Ladder: measuring motivation to change marijuana use in incarcerated adolescents.Drug Alcohol Depend.2006;83:42–48.
- ,,,,.Motivation for stopping tobacco use among emergency department patients.Acad Emerg Med.2005;12:568–571.
- Picker‐Commonwealth Survey of Patient‐Centered Care.Health Aff.1991.
- Hospital Quality Initiatives. Centers for Medicare and Medicaid Services (CMS). Available at: http://www.cms.hhs.gov/HospitalQualtiyInits. Accessed April2009.
- ,,, et al.The use of nicotine replacement therapy by hospitalized smokers.Am J Prev Med.1999;17(4):255–259.
- ,,,,.Methods used to quit smoking in the United States: do cessation programs help?JAMA.1990;263(20):2795–2796.
- U.S. Department of Health and Human Services.Hospital Compare.2006 Data Graphs. Available at: http://www.hospitalcompare.hhs.gov. Accessed April2009.
- ,,, et al.Office on Smoking and Health, National Center for Chronic Disease Prevention and Health Promotion, CDC. Cigarette smoking among adults—United States, 2006.MMWR Morb Mortal Wkly Rep.2007;56:1157–1161.
- ,,.Smoking cessation interventions for hospitalized smokers.Arch Intern Med.2008;168(18):1950–1960.
- ,.Health beliefs and smoking patterns in heart patients and their wives: a longitudinal study.Am J Public Health.1977;67:921–930.
Hospitalization may offer a natural opportunity to screen and advise patients on the advantages of quitting smoking due to a variety of reasons, such as the smoke‐free environment, availability of medical personnel, suitability of tailoring information, and the potential to catch a teachable moment.1, 2 Additionally, a recent meta‐analysis suggested that hospital‐based cessation programs and referrals to cardiac rehabilitation result in significantly higher rates of cessation among discharged smokers.3 In 2008, the U.S. Public Health Service Task Force on Clinical Practice Guidelines for Treating Tobacco Use and Dependence in hospitalized smokers recommended listing smoking status on problem lists, evaluating a smoker's preparedness to quit, providing counseling and medications to treat in‐hospital withdrawal symptoms, and arranging discharge follow‐up to help smokers remain abstinent.4 To promote these practices, the Center for Medicaid and Medicare Services (CMS) has made smoking cessation counseling a quality of care indicator for patients hospitalized with congestive heart failure (CHF), acute myocardial infarction (AMI), or pneumonia. This indicator is a critical step in recognizing the importance of smoking cessation counseling in improving mortality and morbidity for these patients.
Despite the importance of promoting smoking cessation among hospitalized patients, few studies have looked at whether or not hospitalized patients are prepared to quit smoking. Ascertaining patients' preparedness to quit smoking is an important first step in understanding a patient's readiness to change their health behaviors because smoking cessation is the culmination of a lengthy process of behavior change.5 Studies of healthy factory workers suggest that smokers who were more prepared to quit smoking had a higher number of previous quit attempts and perceived coworker encouragement.6
Understanding patient preparedness to quit smoking is especially important among African American smokers, who face a disproportionate health burden due to smoking‐related illness. Studies show that African Americans are less likely than other racial groups to engage in formal tobacco cessation interventions and have lower long‐term quit rates, despite a higher desire to quit smoking.5, 79 Understanding preparedness to quit among this particular group of hospitalized patients may be an important first step in identifying those most likely to quit and benefit from tailored, intensive interventions, such as using medications to assist in combination with postdischarge tobacco cessation counseling.
The aim of this study was to characterize the preparedness to quit smoking and to assess quit attempts made, methods used for quitting, and the success of such quit attempts at 1‐month follow‐up in a group comprised of a high proportion of underserved African American hospitalized smokers. In addition, the relationship of hospitalized patients' preparedness to quit and the effect of inpatient advice on the likelihood of subsequent tobacco cessation were examined.
Patients and Methods
The data used for this study were collected for the Cardiology Quality of Care Study, an ongoing prospective study of patients hospitalized on the inpatient cardiology service at the University of Chicago Medical Center. Newly admitted patients were approached by research assistants and consented to the study using a previously described protocol for enrolling hospitalized patients.10 Patients that lacked decisional capacity (score of <17 on the telephone version of the Mini‐Mental Status Exam)11 were excluded. Patients did not receive any scripted intervention during this admission to assist with cessation. The study left cessation counseling and advice to quit up to the discretion of the individual physician caring for the patient in the hospital. The Institutional Review Board at the University of Chicago approved this study.
Inpatient Interview
The inpatient interview is a 60‐item questionnaire taking approximately 15 minutes to administer by trained research assistants. The questionnaire is designed to assess demographic characteristics (race, socioeconomic status, education, sex, and age), smoking habits, and preparedness to quit. Demographics were collected on all consented patients. Seven items focused on cigarette smoking, consistent with questions in the National Health Information Survey.12 Patients were classified as lifetime smokers if they smoked at least 100 cigarettes in their lifetime. To identify current smokers on admission, patients were asked if they now smoke cigarettes some days or everyday. Additionally, smokers were asked if they had made any quit attempts in the past 12 months.
Patients rated their level of preparedness using a modified version of the Biener Abrams Contemplation Ladder. The Contemplation Ladder is an easily‐administered tool represented by a ladder image of rungs with anchor statements developed as an alternative method to the Prochaska and DiClemente Stages of Change.13 The 10‐point scale ranges from 1 (I enjoy smoking and have decided not to quit smoking for my lifetime; I have no interest in quitting) to 10 (I have quit smoking and will never smoke again.) Tobacco users may rank their current level of motivation to quit. A level of 6 (I definitely plan to quit smoking in the next 6 months) or higher is consistent with preparedness to quit. The Contemplation Ladder was validated by Biener and Abrams6 in a work site study which demonstrated that subjects with higher Ladder scores (score 6) were more likely than those with lower Ladder scores (scores < 6) to participate in awareness activities (eg, educational session) and make a quit attempt in 6 months. This instrument is easier to administer than the more well known Transtheoretical Model of Change, given that it is an ordinal scale with clear steps that may be more user‐friendly for both clinicians and patients.6 In a prior study of emergency room patients, an individual's Ladder score was shown to be significantly associated with a patient's reported intention to quit, number of previous quit attempts, perceived coworker encouragement, and socioeconomic status.14
Admission Diagnoses
Chart audit was performed by trained research assistants at the time of the inpatient interview (within 24 hours of admission) to assess whether patients were admitted with the potential diagnoses of AMI, CHF, neither, or both. All were based on the chart documentation of the patients' clinical presentation. This information was used to assess which CMS Quality Indicators applied to cardiology patients, given that smoking cessation is now a quality indicator for patients with AMI or CHF.
Thirty‐day Follow‐up Telephone Survey
Trained research assistants interviewed patients by telephone at approximately 1 month postdischarge. The follow‐up telephone survey included routine questions concerning follow‐up appointments, readmissions, emergency room visits, and patient satisfaction.15, 10 An additional 5 questions related to smoking cessation were added for this study. Questions were developed using the CMS quality indicators16 or were taken from the National Health Information Survey.12 Patients were asked to self‐report quit attempts made postdischarge, whether or not these quit attempts were associated with success (self‐reported abstinence at the time of follow‐up), and what methods were used to quit (ie, nicotine replacement therapy [NRT], other pharmacotherapy, quit line, pamphlet, counseling group, or cold turkey.) Patients were also asked if they recalled receiving advice to quit during their hospitalization from either a nurse or physician.
Data Analysis
Descriptive statistics were used to summarize Contemplation Ladder scores and types of quit methods used. Chi square tests were used to assess the effect of preparedness (Ladder score 6) on quit behaviors. The main quit behavior was any self‐reported quit attempt made within 1 month after discharge. Additionally, the relationship between preparedness and making a successful quit attempt (defined as a self‐report of not smoking as a result of this quit attempt in the last month) was examined. Multivariate logistic regression, controlling for demographic characteristics, was performed to test the effect of preparedness on quit behaviors (any quit attempt after discharge, or successful quit attempt). While not a primary aim of this study, the association between recall of in‐hospital advice and quit behaviors after discharge was also examined using chi square tests and multivariate logistic regression models, controlling for the demographic characteristics as above. Models also tested the effect of preparedness and recall of in‐hospital advice as independent predictors on quit behaviors and whether or not an interaction between preparedness and advice existed. A linear test of trend was also performed on preparedness and advice. All statistical tests were performed using Intercooled Stata 9.0 (Stata Corporation, College Station, TX), with statistical significance defined as P < 0.05.
Results
From February 2006 through July 2007, 86% (2906/3364) of all cardiology inpatients approached were interviewed. Fifteen percent (436/2906) of patients enrolled in the study indicated that they were current smokers. Contemplation Ladder scores were obtained on 95% (415/436) of the current smokers, and 1‐month postdischarge follow‐up telephone surveys were completed in 67% (276/415) of the current smokers. Three attempts were made to contact patients who were lost to follow‐up (Figure 1). The major reasons for inability to contact patients included wrong telephone numbers, disconnected phone lines, or no method to leave a message for the patient (ie, no answering machine). Given that we were only able to complete follow‐up interviews on 276 patients, we conducted our analyses on only this group of patients.
The average age of current smokers in the sample was 55 years (95% confidence interval [CI], 54‐58). Most current smokers were of the African American race (83%; 224/276). More than 65% of smokers had completed high school or higher, and nearly one‐half (46%) had an average household income of $25,000 or less before taxes. The most common admitting diagnoses per chart audit among current inpatient smokers were AMI (31%) and CHF (27%). The vast majority (95%) of hospitalized smokers in this sample were first‐time admissions to the University of Chicago. Table 1 shows the demographic data for current smokers compared to former smokers (those who have quit smoking prior to admission). Current smokers were more likely to be African American, had lower income levels, and were less likely to have completed high school. Additionally, current smokers were more likely to carry a potential diagnosis of AMI or CHF and to be a first‐time admission (Table 1).
| Demographic Variables | Current Smokers (n = 276)* | Nonsmoker (n = 1329)* | P Value |
|---|---|---|---|
| |||
| Male sex | 156 (57) | 705 (53) | 0.22 |
| African American race | 224 (83) | 886 (67) | <0.001 |
| Age (years) | 55.3 | 64.0 | <0.001 |
| Highest completed level of education | 0.02 | ||
| Junior high school or less | 15 (6) | 98 (7) | |
| Some high school | 67 (25) | 230 (17) | |
| High school graduate | 81 (30) | 403 (31) | |
| Some college education | 68 (25) | 313 (24) | |
| College graduate | 19 (7) | 135 (10) | |
| Graduate level education | 11 (4) | 96 (7) | |
| Household income before taxes | 0.001 | ||
| <$2500 | 33 (12) | 79 (6) | |
| $2501‐$15,000 | 66 (24) | 334 (26) | |
| $15,001‐$50,000 | 51 (19) | 311 (24) | |
| 50,001‐$100,000 | 22 (8) | 126 (9) | |
| >$100,001 | 11 (4) | 50 (4) | |
| Did not answer | 88 (33) | 422 (32) | |
| Diagnosis on admission | 0.02 | ||
| AMI | 66 (31) | 269 (24) | |
| CHF | 58 (27) | 287 (25) | |
| Both | 49 (23) | 273 (24) | |
| Neither | 42 (19) | 305 (27) | |
| Admission status | |||
| New admission | 258 (95) | 1,154 (87) | 0.051 |
| Readmission | 14 (5) | 175 (13) | |
Approximately three‐quarters (76%; 210/276) of current smokers were identified as prepared to quit, with a Ladder score 6. There was a wide distribution of Ladder scores, with one‐third (31%; 86/276) of smokers reporting a Ladder score of 8, indicating that they still smoke, but are ready to set a quit date and another 34% (95/276 patients) with Ladder scores of either 6 or 7 also indicating they were planning to quit smoking (Figure 2). A significant portion of smokers (71%; 195/276) reported making a quit attempt after discharge, and 38% of smokers (106/276) self‐reported that their quit attempt was successful (ie, no longer smoking at 1 month post discharge). Note that the quit rate is reduced to 26% (106/415) at 1 month if one conservatively assumes that those who did not take part in follow‐up were relapsers. Among those who did participate in follow‐up, as shown in Figure 3, the most frequently reported (53%; 145/276) method used to quit smoking was cold turkey. Thirteen percent (37/276) of patients reported making a quit attempt using pharmacological therapy (ie, NRT or bupropion) and only 4% (12/276) of patients reported making a quit attempt using the help of a smoking cessation program (Figure 3).
Preparedness was an important predictor of making a quit attempt. Prepared patients (ie, Ladder score 6) were significantly more likely than patients who were less prepared to report making a quit attempt after discharge (163/212 [77%] vs. 32/64 [50%], respectively; P < 0.001). This result remained significant after adjusting for sociodemographic characteristics with a similar effect size (adjusted estimates 76% [95% CI, 75.7‐76.7] prepared vs. 49% [95% CI, 48.5‐49.8]; P < 0.001). These results also remained significant with a similar effect size in analyses using multivariate logistic regression (Table 2). Of those patients who made quit attempts, prepared patients were slightly more likely to report a successful quit attempt (90/163; 55%) than were less‐prepared patients (16/32; 50%), though this was not significant (P = 0.205).
| Statistical test | Quit Behavior | Prepared % (95% CI) | Unprepared % (95% CI) | P Value |
|---|---|---|---|---|
| ||||
| Chi square tests | Any quit attempt made after discharge | 76.9 (71.2‐82.6) | 50.0 (37.8‐62.2) | <0.001 |
| Successful quit attempt at time of follow‐up | 55.0 (45.9‐60.2) | 50.0 (25.4‐58.2) | 0.20 | |
| Multivariate logistic regression* | Any quit attempt made after discharge | 76.2 (75.7‐76.7) | 49.2 (48.5‐49.9) | <0.001 |
In the follow‐up sample, 17% could not remember if they received advice to quit smoking. Among those who were able to recall receiving advice, the majority (78%; 180/230) reported that they received advice from a nurse or physician during hospitalization, compared to 22% who did not recall ever being advised to quit by any healthcare provider during the admission. Patients who reported receiving advice to quit were more likely to report making a quit attempt postdischarge as compared to those that did not recall receiving advice (70% vs. 46%, respectively; P = 0.002). In a multivariate logistic regression, controlling for demographic factors and admitting diagnosis, both preparedness and receipt of in‐hospital advice were independent predictors of making a future quit attempt (odds ratio [OR] = 4.05; 95% CI, 1.91‐8.60; P < 0.001 for preparedness; OR = 3.96; 95% CI, 1.84‐8.54; P < 0.001 for advice). Additionally, there was no significant interaction or synergistic effect between being prepared to quit smoking and receiving in‐hospital advice to quit (OR = 1.24; 95% CI, 0.17‐9.21; P = 0.836) (Figure 4). When analyzing the effects of preparedness and advice on quit attempts, only preparedness to quit remained a significant predictor of a successful quit attempt (OR = 2.93; 95% CI, 1.13‐7.60; P = 0.027 for preparedness; OR = 2.16; 95% CI, 0.85‐5.49; P = 0.10 for advice to quit). As demonstrated in Table 2, a higher percentage of prepared patients made a quit attempt after discharge (76.9% vs. 50%) and had a successful quit attempt and short‐term abstinence (55% prepared patients vs. 50% less prepared patients).
Discussion
This study demonstrated that in a group of hospitalized underserved, and predominantly African American smokers, the majority of patients reported being prepared to quit smoking at the time of hospitalization. Prepared patients were more likely to report making a quit attempt after discharge and more likely to report being successful in their quit attempt than patients who reported being less prepared to quit during their hospitalization. Nevertheless, approximately one‐half of unprepared patients did make a quit attempt 1 month after discharge, demonstrating a desire to quit smoking after hospitalization among this population. However, short‐term success rates in this group were lower than in patients prepared to quit. In addition, preparedness to quit and receipt of in‐hospital advice to quit smoking were both found to be independent predictors of making a quit attempt, with nearly identical ORs; however, only preparedness remained significant after controlling for advice to quit. Last, although the majority of hospitalized cardiac patients were making quit attempts after discharge, most patients reported using the least effective quit methods (ie, cold turkey) rather than more effective and intensive interventions such as counseling in combination with pharmacotherapy.
These findings have important implications for current quality initiatives targeted at promoting smoking cessation among cardiac patients. First, these results highlight the need for evidence‐based methods to be made available to hospitalized smokers who are prepared to quit. Our results are consistent with other studies reporting rare use (5.2%) of NRT in the hospital setting, despite the proven benefit in treating nicotine withdrawal symptoms.17 This is also consistent with data reporting that among nonhospitalized smokers, quitting cold turkey was the most commonly used and least effective cessation method.18 Second, the rate of recall of in‐hospital advice among patients (78%) was generally consistent with those reported to CMS (most recent quarter 95% for AMI and 88% for CHF).19
In addition to receiving advice, preparedness to quit was associated with higher quit attempts, therefore highlighting the importance of assessing level of preparedness in addition to giving advice. The fact that most quit attempts were made using cold turkey and resulted in low short‐term success rates underscores the need to reevaluate the current CMS quality indicator of advice alone for hospitalized smokers. Furthermore, the recently updated 2008 U.S. Public Health guidelines recently recommend, in addition to advice, that all hospitalized smokers be assessed for readiness to change, be assisted in quitting with pharmacotherapy, and be arranged follow‐up for tobacco cessation postdischarge, highlighting the inadequacy of advice alone.4 While it is important to continue to advise all hospitalized smokers to quit, the study findings demonstrate that assessing preparedness may result in targeting more prepared patients with more intensive interventions. Further policy implications include that less prepared patients may need motivational techniques to increase their level of preparedness to quit during hospitalization.
Several limitations are worth mentioning. First, the study included a relatively small sample size drawn from a single urban medical center. The prevalence of current smokers in our sample was 15%, which is lower than many studies looking at cardiology inpatient smokers.3, 20 This limitation of our study may be attributed to the advanced age of the majority of our patients, as compared with other studies, as well as the possibility of socially desirable response bias that many low‐income African American smokers may experience, leaving them less likely to admit to smoking at the time of hospitalization. Second, there was a low follow‐up rate, with 66% of patients undergoing follow‐up postdischarge. While this may raise the concerns of differences between ladder scores in those patients that participated in follow‐up and those that did not, analyses show no significant difference between level of preparedness in these 2 groups (68% prepared in patients who received follow‐up vs. 63% prepared patients in those who did not participate in follow‐up; P = 0.36). Third, follow‐up of quit attempts and receipt of advice were all assessed using self‐report, and, therefore, were limited by lack of verification and lack of assessment for potential recall bias. Fourth, in this pilot study, the follow‐up period was relatively short at 1 month postdischarge. It is likely that rates of successful quit attempts would be lower with longer‐term follow‐up periods, given previous literature demonstrating the difficulty with long‐term abstinence.21 Last, the study was not able to account for potential effects that hospitalization itself may have on preparedness, as patients may be more likely to report being prepared to quit when in the face of a health shock,22 as well as the fact that some patients may demonstrate a socially desirable response bias influenced by hospitalization.
In conclusion, the majority of underserved smokers with cardiac disease reported being prepared to quit smoking and were more likely to self‐report making a quit attempt after discharge. However, the majority of these quit attempts were made via cold turkey, without the support of available evidence‐based methods to quit. It is possible that by directly providing education, access to pharmacotherapy, and counseling options, the utilization rates for more efficacious treatments would increase in cardiac patients who are prepared to quit. While recall of in‐hospital advice was associated with future quit attempts, prepared patients who recalled receiving advice were more likely to make a quit attempt than prepared patients who did not recall receiving advice, as well as unprepared patients. Together, these findings highlight the need to consider a patient's level of preparedness to quit in understanding the success of in‐hospital advice and the importance of making evidence‐based cessation methods available to hospitalized smokers who are prepared to quit. Additionally, identifying patients not prepared to quit may help in providing them with appropriate motivational therapy, to move them along the stages of change, as well as educational information on how to quit once they have decided to do so.
- ,,.Helping hospitalized smokers quit: new directions for treatment and research.J Consult Clin Psychol.1993;61:778–789.
- ,.Smokers who are hospitalized: a window of opportunity for cessation interventions.Prev Med.1992;21:262–269.
- ,,, et al.Predictors of smoking cessation after a myocardial infarction: the role of institutional smoking cessation programs in improving success.Arch Intern Med.2008;168(18):1961–1967.
- Guideline Panel.Clinical Practice Guidelines: Treating Tobacco Use and Dependence.Washington, DC:Public Health Service, U.S. Department of Health and Human Services;2008.
- ,.Stages and processes of self‐change in smoking: toward an integrative model of change.J Consult Clin Psychol.1983;51:390–395.
- ,.The Contemplation Ladder: validation of a measure of readiness to consider smoking cessation.Health Psychol.1991;10(5):360–365.
- ,,,,.Smoking cessation factors among African Americans and Whites.Am J Public Health.1993;83(2):220–226.
- U.S. Department of Health and Human Services.The Health Benefits of Smoking Cessation.Rockville, MD:Office on Smoking and Health, Centers for Chronic Disease Prevention and Health Promotion, Public Health Service,U.S. Department of Health and Human Services,Washington, DC;2000.
- ,,,,.Trends in cigarette smoking in the United States. the changing influence of gender and race.JAMA.1989;261(1):49–55.
- ,,, et al.Effects of physician experience on costs and outcomes on an academic general medicine service: results of a trial of hospitalists.Ann Intern Med.2002;137(11):866–874.
- ,,,.Validation of a telephone version of the Mini‐Mental State Examination.J Am Geriatr Soc.1992;40(7):697–702.
- National Health Information Survey Questionnaire, Sample Adult,Adult Health Behaviors;2004.
- ,,, et al.The Marijuana Ladder: measuring motivation to change marijuana use in incarcerated adolescents.Drug Alcohol Depend.2006;83:42–48.
- ,,,,.Motivation for stopping tobacco use among emergency department patients.Acad Emerg Med.2005;12:568–571.
- Picker‐Commonwealth Survey of Patient‐Centered Care.Health Aff.1991.
- Hospital Quality Initiatives. Centers for Medicare and Medicaid Services (CMS). Available at: http://www.cms.hhs.gov/HospitalQualtiyInits. Accessed April2009.
- ,,, et al.The use of nicotine replacement therapy by hospitalized smokers.Am J Prev Med.1999;17(4):255–259.
- ,,,,.Methods used to quit smoking in the United States: do cessation programs help?JAMA.1990;263(20):2795–2796.
- U.S. Department of Health and Human Services.Hospital Compare.2006 Data Graphs. Available at: http://www.hospitalcompare.hhs.gov. Accessed April2009.
- ,,, et al.Office on Smoking and Health, National Center for Chronic Disease Prevention and Health Promotion, CDC. Cigarette smoking among adults—United States, 2006.MMWR Morb Mortal Wkly Rep.2007;56:1157–1161.
- ,,.Smoking cessation interventions for hospitalized smokers.Arch Intern Med.2008;168(18):1950–1960.
- ,.Health beliefs and smoking patterns in heart patients and their wives: a longitudinal study.Am J Public Health.1977;67:921–930.
Copyright © 2010 Society of Hospital Medicine

Performance of MEWS Max
Matching the severity of illness to the appropriate intensity of care is important for the effective delivery of medical care. Overtriage to critical care units results in unnecessary resource consumption. Undertriage to the wards may result in worsening of physiologic parameters1, 2 that often go unnoticed or unaddressed for more than 24 hours.3 Therefore, it is important for emergency department (ED) admission decisions to be accurate with respect to the level of care. Because of the importance of this decision, objective criteria to aid in this decision process, if accurate, would improve medical care delivery.
Physiologic measurements and procedural interventions appear to predict the need for a higher level of care among inpatients.2, 4, 5 This knowledge has led to the development of tools meant to identify inpatients on general wards who are at risk for deterioration. Such tools for identification of inpatients at risk generally use single threshold models triggered by a single abnormal physiologic value, or models that combine multiple parameters into a summative score.6, 7 The performance of previously described risk stratification tools has generally been to exhibit high sensitivity at the sacrifice of low specificity and discriminatory value.8
The value of these models as they apply in the emergency department is less well characterized. Because derangements in physiologic parameters are common among ED patients, one might expect that single‐threshold systems would exhibit high sensitivity at the expense of specificity when applied to this population. In contrast, a summative risk score may be better suited for the complexities of illness in undifferentiated ED patients and offer better discriminatory value in this population. Summative scoring systems have been shown to retain a higher specificity as the score increases compared to single‐threshold systems.8
The Modified Early Warning Score (MEWS)9 is a predictive tool for higher level of care that has been tested in the ED setting. This tool produces a summative score using temperature, respiratory rate, heart rate, level of consciousness, and systolic blood pressure. In a single‐site study from the United Kingdom, MEWS, when calculated at the time of ED presentation, did not improve decision making over a commonly used triage system, exhibiting inadequate sensitivity in identifying patients who would be admitted to the intensive care unit (ICU).10 However, as a result of the care delivered in the ED, patients' conditions can change significantly throughout their stay. Therefore we postulate that the MEWS calculated at a single time in the ED (eg, at the time of admission) is not the most accurate predictor of care intensity requirements.
The primary objective of this research was to add to the literature provided by Subbe et al.10 by describing the performance characteristics and discriminatory ability of the most abnormal MEWS (MEWS Max) score during the entire ED stay in predicting the need for higher levels of care among ED patients presenting to a tertiary care facility in North America.
Patients and Methods
Study Design
To determine the performance characteristics of the MEWS in ED patients, we used a structured explicit retrospective chart review on a random sample of ED patients being admitted to the hospital.
Study Setting
The study was conducted at 1 tertiary care academic medical center in the United States, consisting of 830 beds, approximately 125 of which provide a higher level of care, defined as intensive care, intermediate care, or acute care. The ED volume in 2005 was 75,000 with an admission rate of 20%. In the ED, patients are primarily seen by residents who are supervised by board‐certified or board‐eligible emergency medicine attendings.
Study Population
All patients presenting to the ED of Wake Forest University Baptist Medical Center in 2005 were considered for inclusion. From these patients, a listing was created of all hospital admissions through the ED in 2005. Because trauma and cardiology patients have disease‐specific risk stratification tools that are used to guide admission,11, 12 they were then removed from this list and excluded. Additionally, pediatric patients were excluded from this listing as the MEWS score relies on vital sign abnormalities, which have varying ranges of normal in children. From this list, 500 charts were randomly selected for further review. Additional criteria were applied at the time the charts were reviewed to exclude those: without an ED record matching the date of admission, without 1 complete set of ED vitals, receiving mechanical ventilation at the time of presentation, or patients currently receiving hospice or comfort care. Charts from the list of 500 were reviewed sequentially until the goal number of charts had been completed. The number of charts reviewed was selected to allow relatively precise 95% confidence intervals [CIs] around sensitivity (10%) based on the assumptions of 80% sensitivity and a 20% incidence of the primary outcome. Based on this, the intent was to abstract information from 300 patient charts.
Study Protocol
A standardized data abstraction template was created. Data abstractors included 2 physicians and 2 nurses. Group training for the abstractors was provided by the primary investigator and included performance review and feedback until competence was demonstrated. Data abstractors used the paper copy of the ED nursing notes (and physician notes if clarification required) to abstract data from the medical record. Abstractors were not aware of the patient's outcome at the time of data abstraction as this information was contained in a separate database. During the chart review, and blinded to the abstractors, 25 charts were selected for abstraction by all data abstractors to allow calculation of interobserver agreement.
Clinical outcomes were determined by referencing hospital databases and the medical record if clarification was needed. The admission bed location and changes in patient location throughout the hospital stay were used to track the need for a higher level of care. The outcome of death was determined by cross‐referencing study participants with hospital mortality data, and the medical record, if needed.
Predictor Score Calculation
Abstracted data were used to calculate the MEWS score according to the criteria specified in Table 1 at the initial ED presentation (MEWS Initial), the maximum during the ED stay (MEWS Max), and prior to admission (MEWS Admit). Parameters not repeated after arrival were carried forward from the most recent recording. An adaptation of the MEWS score was required by replacing the alert/verbal/painful/unresponsive (AVPU) scale to determine the level of consciousness with the Glascow Coma Scale (GCS), a conversion that has been previously described.13, 14
| 3 Points | 2 Points | 1 Point | 0 Points | 1 Point | 2 Points | 3 Points | |
|---|---|---|---|---|---|---|---|
| |||||||
| Systolic blood pressure | <70 | 71‐80 | 81‐100 | 101‐199 | 200 | ||
| Heart rate | <40 | 41‐50 | 51‐100 | 101‐110 | 111‐129 | 130 | |
| Respiratory rate | <9 | 9‐14 | 15‐20 | 21‐29 | 30 | ||
| Temperature | <95 | 95‐101.1 | 101.2 | ||||
| GCS | 15 | 11‐14 | 7‐10 | 6 | |||
Clinical Endpoint Definitions and Outcomes
Need for higher level of care was defined as initial admission from the ED or transfer within 24 hours to a nonfloor bed (acute care, intermediate care unit, or critical care unit). Acute care beds at the study hospital have a lower bed‐to‐nurse ratio and more intensive monitoring (beside vs. radiotelemetry, vitals signs every 2 hours compared to every 4 hours) than floor beds. Intermediate care beds fulfill a gap between these and critical care, with dedicated respiratory therapists, the ability for invasive monitoring, and ventilator management. In addition, the hospital's burn, bone marrow transplant (BMT), and cardiac care units (CCU) are intensive carelevel units, and were included when measuring the need for higher level of care. Mortality was defined as death during the index hospitalization. The primary outcome was the composite need for a higher level of care or mortality within 24 hours of ED presentation.
Data Analysis
Calculation of interobserver agreement for data obtained from the chart abstraction was performed using Kappa coefficients. Descriptive statistics were used to summarize the patient characteristics separately for those who did and did not need higher levels of care. Fisher exact tests and Wilcoxon rank‐sum tests were used to assess group differences in the categorical and continuous patient characteristics, respectively. A frequency table was used to display the cross‐tabulation of MEWS Max scores with the need for higher levels of care, and the sensitivity and specificity were calculated for each cutpoint of the predictor scores. These measurements were plotted against one another in receiver‐operating characteristic (ROC) curves and the optimal cutpoint chosen as the one that gave the greatest sum of sensitivity and specificity. The area under the ROC curves and approximate 95% CIs were calculated. The Cochran‐Armitage trend test1517 was used to assess the association between risk score and outcome. Logistic regression was used to model the log odds of needing higher levels of care as a function of the MEWS Max score. Calibration of the model was assessed by analyzing the performance of the MEWS Max score among patient subgroups and comparing observed and expected events. Performance was also assessed among sextiles of risk using the Hosmer and Lemshow18 goodness‐of‐fit test.
As a secondary objective, additional covariates were added to the logistic model including MEWS to see if model performance could be improved. First, a simple logistic regression was used to determine the most significant MEWS score measurements among the 3 that were measured (MEWS Initial, MEWS Max, and MEWS Admit). Only 1 MEWS measurement was considered for the final model to avoid colinearity. The selected MEWS measurement was then entered into a multivariable logistic model along with age 60 years, gender, race/ethnicity (white, black, Hispanic, other), method of arrival (ambulatory or by ambulance), ED length of stay (recorded to the nearest minute, then converted to hours at the second significant digit), intravenous (IV) antibiotics in the ED, and antibiotics prior to ED arrival. Candidate variables were chosen considering both the plausibility to be associated with the outcome and the reliability of the data elements considering our retrospective methods. Forward selection, stepwise selection, and backward elimination with a significance level of 0.20 to enter and/or stay in the model were used to obtain a predictive model.
In order to assess the risk stratification potential for the MEWS Max model and the exploratory model (MEWS Plus), the ability to classify subjects by their probability of experiencing the outcome was assessed. Because an established consensus does not exist in the literature for these cutoffs, it was hypothesized that 4 risk categories (0‐10%, >10‐40%, >40‐70%, and >70%) would be clinically useful to clinicians allowing categorization into low‐, intermediate‐, high‐, and very‐high‐risk‐groups for requiring a higher level of care.
Results
Complete chart abstraction was performed for 299 patient encounters. After abstraction, 19 charts were excluded from final analysis due to missing outcome data (n = 6) or implausible and/or missing crucial data values (n = 13). Pairwise kappa values for abstraction of the MEWS Max score demonstrated agreement ranging from good to very good (0.67‐0.88). Of the 280 analyzed encounters, 76 (27%) met the primary composite outcome of death (n = 1) or need for higher care (n = 76). Of these 76 patients, 69 were admitted from the ED to a high level of care, and 7 were initially admitted to a lower level of care and required transfer to a higher level of care within 24 hours. Thirty‐seven patients requiring a higher level of care were admitted to an ICU (ICU = 31; BMT, CCU, and burn unit with 2 patients each), 9 to intermediate care, and 30 to an acute care bed.
Demographics and presenting characteristics from the study participants can be seen in Table 2. The mean age of participants was 56 years and was similar for the 2 groups. Approximately one‐half of the study participants were female (49%) and there was no statistical association between experiencing the composite outcome and gender (P = 0.28). The majority (64%) of participants were Caucasian, followed by African American (33%) and Hispanic or other (2%). Similar distributions were seen when stratified by outcome. Vital signs of the participants in total and stratified by outcome fell within normal parameters. ED length of stay was similar among those meeting and not meeting the composite outcome (5.5 hours vs. 5.8 hours, P = 0.15). Patients who met the composite outcome were more likely to have arrived by ambulance (63% vs. 43%, P = 0.004).
| Patient Characteristics | Composite Endpoint Not Met (n = 204)* | Composite Endpoint Met (n = 76)* | P Value |
|---|---|---|---|
| |||
| Demographics | |||
| Age (years) | 56 (42, 73) | 55 (41, 71) | 0.66 |
| Female sex (%) | 51 | 43 | 0.28 |
| White race (%) | 65 | 63 | 0.91 |
| Arrival via ambulance (%) | 43 | 63 | 0.004 |
| Length of stay (hours) | 5.8 (4.6, 7.2) | 5.5 (4.3, 6.9) | 0.15 |
| Presenting characteristics | |||
| Systolic BP (mmHg) | 132 (117, 148) | 135 (118, 159) | 0.26 |
| Heart rate (beats/minute) | 87 (74, 100) | 96 (82, 111) | 0.003 |
| Respiratory rate (breaths/minute) | 20 (18, 22) | 20 (18, 24) | 0.26 |
| Temperature (degrees F) | 97.9 (97.1, 98.8) | 97.8 (96.8, 99.6) | 0.78 |
| Glasgow coma scale | 15 (15, 15) | 15 (14, 15) | <0.001 |
| Antibiotic therapy | |||
| On antibiotics at arrival (%) | 9 | 9 | 1.00 |
| IV antibiotics in the ED (%) | 31 | 34 | 0.67 |
The distribution of scores and the proportion of participants with each score that met the composite outcome are shown in Figure 1. The MEWS Max was significantly associated with the primary composite outcome (P < 0.001, Cochran‐Armitage trend test). The scoring system demonstrates an increase in the proportion of participants meeting the composite endpoint as the score increases, and all participants with a MEWS Max score 9 met the composite outcome.
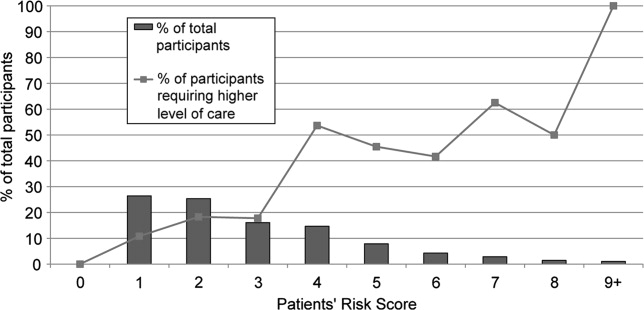
ROC are shown in Figure 2. The optimum threshold for MEWS Max based on the sum of sensitivity and specificity is 4, associated with a sensitivity of 62% and a specificity of 79% (Table 3) The predictive ability of the MEWS Max was moderate (C statistic MEWS Max 0.73; 95% CI, 0.66‐0.79), with each 1‐point increase in the MEWS Max score associated with a 60% increase in the odds of meeting the composite endpoint (odds ratio [OR], 1.6; 95% CI, 1.3‐1.8).

| MEWS Max Cutoff | Number at or Above the Cutoff Needing a Higher Level of Care | Sensitivity % (95% CI) | Specificity % (95% CI) | Positive Predictive Value (%) | Negative Predictive Value (%) |
|---|---|---|---|---|---|
| |||||
| 1 | 76 | 100 (95‐100) | 0 (0‐2) | 27 | NA |
| 2 | 68 | 89 (80‐95) | 32 (26‐39) | 33 | 89 |
| 3 | 55 | 72 (61‐82) | 61 (54‐68) | 41 | 86 |
| 4 | 47 | 62 (50‐73) | 79 (73‐84) | 52 | 85 |
| 5 | 25 | 33 (23‐45) | 88 (83‐92) | 51 | 78 |
| 6 | 15 | 20 (11‐30) | 94 (90‐97) | 56 | 76 |
| 7 | 10 | 13 (6‐23) | 98 (94‐99) | 67 | 75 |
| 8 | 5 | 7 (2‐15) | 99 (97‐100) | 71 | 74 |
| 9 | 3 | 4 (1‐11) | 100 (98‐100) | 100 | 74 |
Table 4 shows calibration of the model using different subgroups of the patient population. Grouping patients by age or gender did not reveal a higher event rate in any particular group. Using the Hosmer and Lemeshow18 goodness‐of‐fit test to stratify by risk category, no evidence for lack of fit was found (P = 0.06).
| Characteristic | Total Participants | Observed Events | Expected Events | Observed/ Expected |
|---|---|---|---|---|
| ||||
| Age | ||||
| >45 years | 87 | 24 | 23.8 | 1.01 |
| 45‐70 years | 118 | 33 | 32.8 | 1.01 |
| >70 years | 75 | 19 | 19.4 | 0.98 |
| Sex* | ||||
| Male | 142 | 43 | 37.4 | 1.15 |
| Female | 137 | 33 | 38.5 | 0.86 |
| Sextile of risk with MEWS Max | ||||
| First | 27 | 15 | 17.8 | 0.84 |
| Second | 22 | 10 | 10.1 | 0.99 |
| Third | 41 | 22 | 14.4 | 1.53 |
| Fourth | 45 | 8 | 11.6 | 0.69 |
| Fifth | 71 | 13 | 12.9 | 1.01 |
| Sixth | 74 | 8 | 9.2 | 0.87 |
In the exploratory analysis, 267 subjects had complete data for all candidate variables. Simple logistic regression revealed that the most predictive MEWS measurement was the MEWS Max (C statistic MEWS Max 0.725, MEWS Initial 0.668, MEWS Admit 0.653). Stepwise selection, forward selection, and backward elimination produced the same model containing method of arrival (P = 0.03), MEWS Max (P < 0.001), IV antibiotics in the ED (P = 0.17), length of stay (P = 0.05), and gender (P = 0.12). In the subset of subjects with these complete data elements (n = 268), the inclusion of the additional measures increased the C statistic to 0.76 (95% CI, 0.69‐0.82), a 0.04 increase over the model that only included MEWS Max in the same subset of subjects.
MEWS Max resulted in no patients being classified as low‐risk, with the majority (81.7%) classified as intermediate‐risk, 15.7% classified as high‐risk, and 2.6% classified as very high risk (Table 5). In all categories the actual event rate fell within the predicted event rate interval. The addition of variables included in MEWS Plus resulted in 14.6% of patients being classified as low‐risk, 64.0% as intermediate risk, 17.2% with high‐risk, and 4.1% as very‐high‐risk. In 58 cases (21.7%), using MEWS Plus would have placed patients in a more appropriate risk category than that assigned by MEWS Max; ie, a lower risk category for those who did not have events, and a higher risk category for those experiencing events. The majority of this correct reclassification was seen in the intermediate risk group by MEWS Max, where 17.6% were appropriately reclassified. Alternatively, 5.6% of cases would have resulted in inappropriate reclassification. Again, the actual event rate fell within the boundaries of predicted risk in all cases.
| MEWS Plus* | Events | ||||||
|---|---|---|---|---|---|---|---|
| MEWS Max | 0‐10 | >10‐40 | >40‐70 | >70 | Row Totals (%) | Correctly Reclassified (%) | Incorrectly Reclassified (%) |
| |||||||
| Total (%) | 39 (14.6) | 171 (64.0) | 46 (17.2) | 11 (4.1) | 267 | 58 (21.7) | 15 (5.6) |
| Events (% of total) | 2 (5.1) | 39 (22.8) | 24 (52.2) | 8 (72.7) | 73 (27.3) | ||
| Nonevents (% of total) | 37 (94.9) | 132 (77.2) | 22 (47.8) | 3 (27.3) | 194 (72.7) | ||
| 0‐10 | 0 | 0 | 0 | 0 | 0 | 0 | 0 |
| Events | 0 | 0 | 0 | 0 | 0 | ||
| Nonevents | 0 | 0 | 0 | 0 | 0 | ||
| >10‐40 | 39 | 162 | 17 | 0 | 218 (81.7) | 47 (17.6) | 9 (3.4) |
| Events | 2 | 36 | 10 | 0 | 48 (22.0) | ||
| Nonevents | 37 | 126 | 7 | 0 | 170 (78.0) | ||
| >40‐70 | 0 | 9 | 27 | 6 | 42 (15.7) | 10 (3.7) | 5 (1.9) |
| Events | 0 | 3 | 13 | 4 | 20 (47.6) | ||
| Nonevents | 0 | 6 | 14 | 2 | 22 (52.4) | ||
| >70 | 0 | 0 | 2 | 5 | 7 (2.6) | 1 (0.4) | 1 (0.4) |
| Events | 0 | 0 | 1 | 4 | 5 (71.4) | ||
| Nonevents | 0 | 0 | 1 | 1 | 2 (28.6) | ||
Discussion
Matching the initial level of care to the patient's severity of illness can be expected to improve the efficiency of health care delivery. The MEWS is a simple prediction instrument that can be calculated at the bedside and would be ideal for this purpose. The MEWS has good predictive ability among patients on the wards or awaiting admission,9, 10 and in this investigation a variation of MEWS appears to have potential to discriminate among high‐risk and low‐risk ED patients.
Examination of the ROC curve for the MEWS Max score demonstrates a fair performance (C statistic = 0.73). In this analysis, we created low‐risk, intermediate‐risk, high‐risk, and very‐high‐risk groups. The strength of the MEWS Max rests in its ability to classify patients as high‐risk or very‐high‐risk. Approximately 16% of patients are classified by MEWS Max as high‐risk, and 3% as very‐high‐risk, making the practitioner more confident in the decision to admit to a high level of care. However, MEWS Max classifies no patients as low risk and approximately 80% of patients are classified as intermediate‐risk. The majority of patients being classified into this gray zone and the inability to classify patients as low‐risk significantly limits the utility of MEWS Max.
In exploratory analysis, these data propose a model using additional readily available parameters that when added to the MEWS Max can improve patient classification. Of particular interest is the ability of the MEWS Plus model to more accurately identify patients at low risk of requiring a higher level of care. When compared to MEWS Max, approximately 22% of patients were correctly reclassified by MEWS Plus, with only 5% incorrectly reclassified. Importantly, MEWS Plus is able to reduce the size of the intermediate‐risk group, predominantly by reclassifying patients as low risk. Forty‐seven (17.6%) of the patients previously categorized as intermediate risk with MEWS Max were reclassified, with 39 of them becoming low risk, 2 (5.1%) of whom had events. However, the major limitation of the MEWS Plus is that it is currently not able to be calculated at the bedside as many of the included variables are time dependent. More analysis is needed to validate precisely which variables are most important, determine how they add to the calculation, and understand when or how often during the ED visit risk should be calculated. Further exploration and validation of this model is necessary.
The results of this investigation add in important ways to a previous study of the MEWS in ED patient triage.10 Subbe et al.10 examined the ability of the MEWS to improve admission decisions beyond those recommended by the Manchester Triage System. Their investigation was conducted among 153 ED patients who belonged to 1 of 3 cohorts being admitted from the ED in the United Kingdom. They concluded that the MEWS was unable to significantly improve admission level of care decisions over the Manchester Triage System. Our investigation differs from that reported by Subbe et al.10 in several important ways. Methodologically, we chose to include a broad population of ED patients rather than selecting 3 cohorts for comparison, and excluded trauma and cardiology patients due to suspected differences in admission patterns in these patients. Further, we conducted our analysis using the maximum MEWS score obtained during a patient's encounter. We felt that using the maximum MEWS score takes full of advantage of all clinical data obtained during the patient's ED visit rather than relying on their severity of illness when the patient first arrives. Additionally, we selected an outcome measure that was determined at 24 hours because we feel events occurring within 24 hours of admission are more likely to reflect a progression of a disease process present at the time of the ED evaluation. Subbe et al.10 analyzed ICU admissions after any duration of hospitalization on the wards. However, ICU admission after several days of ward care may neither be avoidable, nor predictable, while the patient is in the ED.
Subbe et al.10 concluded that the MEWS score did not significantly add to triage decisions aided by the Manchester Triage System. However, in their results, a MEWS score >2 would have classified 7 additional patients as high risk out of 50 who required a transfer to a higher level of care when compared to the Manchester Triage System. Our findings explore the discriminatory value of the maximum MEWS score for a patient throughout the ED visit. This approach, combined with our methodologic differences, have led to more encouraging findings about the utility of the MEWS Max score, especially when combined with a few simple and reliably abstracted variables, to predict the required level of care within 24 hours.
Limitations to our results mainly relate to the study design. We chose a nonconcurrent cohort design using an explicit chart review. Chart reviews have inherent limitations that can include inaccuracy of abstracted data elements, missing data, systematic bias imposed by the abstraction process, and unmeasured confounding. To minimize avoidable biases and maintain accuracy while conducting this chart review, we followed well‐described methods.19 However, because we were relying on retrospective data, some data elements were incomplete. For instance, not all participants had multiple sets of vital signs recorded, which could have affected the predictive accuracy of the risk scores. Anticipating this difficulty, we had algorithms established to handle missing data, which we feel minimized this effect. However, despite this effort, 13 patients had to be excluded due to incomplete data. During review, it was noted that some patients admitted due to a traumatic mechanism were included in the final data analysis despite our intent to exclude them. We expect that this was a very small number, and should have had a minimal effect on risk score calculation. In addition, we modified the original MEWS model in that the GCS was used in substitution for the AVPU score. The conversion of the AVPU score to the GCS is well‐described and is unlikely to have affected the accuracy of the MEWS. We did not adjust for ED length of stay in our primary MEWS model. It is possible that more severely ill patients were in the ED longer and therefore had more opportunity to have abnormal vital signs recorded. ED length of stay was incorporated into the MEWS Plus model. Another limitation relates to our reference standard. We chose a composite of the need for a higher level of care or death within 24 hours. The need for higher care is a subjective endpoint. However, we felt this reflection of actual decision making is more informing than comparisons to other objective, unvalidated scoring systems. As more robust scoring systems are developed, researchers will need to consider developing a reference standard employing blinded adjudicators. Pediatric, cardiology, and trauma patients were excluded from this analysis and therefore our results cannot be extrapolated to these populations. MEWS model calibration was performed using the same data set as that on which the model was tested. This may have resulted in overfit of the model to the data, possibly leading to an overstatement of the model's predictive ability. Additionally, the MEWS Plus model requires validation in another study population. A final limitation is that in performing the study at 1 institution, the results may not be generalizable to other settings.
Building on previous work in defining and testing risk scores to predict poor outcomes, we have shown that the MEWS Max is a potentially useful tool to categorize patients as high‐risk or very‐high‐risk for requiring a higher level of care. MEWS Max suffers from the creation of a large intermediate risk group and the inability to classify patients as low‐risk. Adding further variables to MEWS Max creates a model with improved performance (MEWS Plus). This model may allow for 15% of admissions to be classified as low‐risk and shows promise as a tool to be used in ED triage of patients who are being admitted. Further work should attempt to further refine and validate the MEWS Plus model and examine the effect of implementation of these models on admission decision making and clinical outcomes.
Acknowledgements
Special gratitude is extended to Ronald H. Small, M.B.A., Vice President of the Division of Healthcare Research and Quality, for his assistance.
- ,,,.The longer patients are in hospital before intensive care admission the higher their mortality.Intensive Care Med.2004;30(10):1908–1913.
- ,,.Physiological values and procedures in the 24 h before ICU admission from the ward.Anaesthesia.1999;54(6):529–534.
- ,.Can some in‐hospital cardio‐respiratory arrests be prevented?A prospective survey. Resuscitation.1998;37(3):133–137.
- ,.Physiological abnormalities in early warning scores are related to mortality in adult inpatients.Br J Anaesth.2004;92(6):882–884.
- ,,,,,.Recognising clinical instability in hospital patients before cardiac arrest or unplanned admission to intensive care. A pilot study in a tertiary‐care hospital.Med J Aust.1999;171(1):22–25.
- ,,,,,.Improving the utilization of medical crisis teams (Condition C) at an urban tertiary care hospital.J Crit Care.2003;18(2):87–94.
- ,,,.The medical emergency team.Anaesth Intensive Care.1995;23(2):183–186.
- ,,, et al.Systematic review and evaluation of physiological track and trigger warning systems for identifying at‐risk patients on the ward.Intensive Care Med.2007;33(4):667–679.
- ,,,.Validation of a modified early warning score in medical admissions.QJM.2001;94(10):521–526.
- ,,,.Validation of physiological scoring systems in the accident and emergency department.Emerg Med J.2006;23(11):841–845.
- ,,, et al.The TIMI risk score for unstable angina/non‐ST elevation MI: a method for prognostication and therapeutic decision making.JAMA.2000;284(7):835–842.
- ,.Trauma scoring systems: a review.J Am Coll Surg.1999;189(5):491–503.
- ,,.Comparison of consciousness level assessment in the poisoned patient using the alert/verbal/painful/unresponsive scale and the Glasgow Coma Scale.Ann Emerg Med.2004;44(2):108–113.
- ,.Simple bedside assessment of level of consciousness: comparison of two simple assessment scales with the Glasgow Coma scale.Anaesthesia.2004;59(1):34–37.
- ,,.Exact inference for contingency tables with ordered categories.J Am Stat Assoc.1990(85):453–458.
- .Tests for trends in proportions. In: Klotz S, Johnson NH, eds. Encyclopedia of Statistical Sciences. Vol 9.New York:John Wiley and Sons, Inc.;1988:334–336.
- SAS Institute I. Cochran Armitage Test for Trend.SAS OnlineDoc 9.1.3.Cary, NC:SAS Institute, Inc.;2007.
- ,.Applied Logistic Regression.2nd ed.New York:John Wiley and Sons;2000.
- ,,,,.Chart reviews in emergency medicine research: Where are the methods?Ann Emerg Med.1996;27(3):305–308.
Matching the severity of illness to the appropriate intensity of care is important for the effective delivery of medical care. Overtriage to critical care units results in unnecessary resource consumption. Undertriage to the wards may result in worsening of physiologic parameters1, 2 that often go unnoticed or unaddressed for more than 24 hours.3 Therefore, it is important for emergency department (ED) admission decisions to be accurate with respect to the level of care. Because of the importance of this decision, objective criteria to aid in this decision process, if accurate, would improve medical care delivery.
Physiologic measurements and procedural interventions appear to predict the need for a higher level of care among inpatients.2, 4, 5 This knowledge has led to the development of tools meant to identify inpatients on general wards who are at risk for deterioration. Such tools for identification of inpatients at risk generally use single threshold models triggered by a single abnormal physiologic value, or models that combine multiple parameters into a summative score.6, 7 The performance of previously described risk stratification tools has generally been to exhibit high sensitivity at the sacrifice of low specificity and discriminatory value.8
The value of these models as they apply in the emergency department is less well characterized. Because derangements in physiologic parameters are common among ED patients, one might expect that single‐threshold systems would exhibit high sensitivity at the expense of specificity when applied to this population. In contrast, a summative risk score may be better suited for the complexities of illness in undifferentiated ED patients and offer better discriminatory value in this population. Summative scoring systems have been shown to retain a higher specificity as the score increases compared to single‐threshold systems.8
The Modified Early Warning Score (MEWS)9 is a predictive tool for higher level of care that has been tested in the ED setting. This tool produces a summative score using temperature, respiratory rate, heart rate, level of consciousness, and systolic blood pressure. In a single‐site study from the United Kingdom, MEWS, when calculated at the time of ED presentation, did not improve decision making over a commonly used triage system, exhibiting inadequate sensitivity in identifying patients who would be admitted to the intensive care unit (ICU).10 However, as a result of the care delivered in the ED, patients' conditions can change significantly throughout their stay. Therefore we postulate that the MEWS calculated at a single time in the ED (eg, at the time of admission) is not the most accurate predictor of care intensity requirements.
The primary objective of this research was to add to the literature provided by Subbe et al.10 by describing the performance characteristics and discriminatory ability of the most abnormal MEWS (MEWS Max) score during the entire ED stay in predicting the need for higher levels of care among ED patients presenting to a tertiary care facility in North America.
Patients and Methods
Study Design
To determine the performance characteristics of the MEWS in ED patients, we used a structured explicit retrospective chart review on a random sample of ED patients being admitted to the hospital.
Study Setting
The study was conducted at 1 tertiary care academic medical center in the United States, consisting of 830 beds, approximately 125 of which provide a higher level of care, defined as intensive care, intermediate care, or acute care. The ED volume in 2005 was 75,000 with an admission rate of 20%. In the ED, patients are primarily seen by residents who are supervised by board‐certified or board‐eligible emergency medicine attendings.
Study Population
All patients presenting to the ED of Wake Forest University Baptist Medical Center in 2005 were considered for inclusion. From these patients, a listing was created of all hospital admissions through the ED in 2005. Because trauma and cardiology patients have disease‐specific risk stratification tools that are used to guide admission,11, 12 they were then removed from this list and excluded. Additionally, pediatric patients were excluded from this listing as the MEWS score relies on vital sign abnormalities, which have varying ranges of normal in children. From this list, 500 charts were randomly selected for further review. Additional criteria were applied at the time the charts were reviewed to exclude those: without an ED record matching the date of admission, without 1 complete set of ED vitals, receiving mechanical ventilation at the time of presentation, or patients currently receiving hospice or comfort care. Charts from the list of 500 were reviewed sequentially until the goal number of charts had been completed. The number of charts reviewed was selected to allow relatively precise 95% confidence intervals [CIs] around sensitivity (10%) based on the assumptions of 80% sensitivity and a 20% incidence of the primary outcome. Based on this, the intent was to abstract information from 300 patient charts.
Study Protocol
A standardized data abstraction template was created. Data abstractors included 2 physicians and 2 nurses. Group training for the abstractors was provided by the primary investigator and included performance review and feedback until competence was demonstrated. Data abstractors used the paper copy of the ED nursing notes (and physician notes if clarification required) to abstract data from the medical record. Abstractors were not aware of the patient's outcome at the time of data abstraction as this information was contained in a separate database. During the chart review, and blinded to the abstractors, 25 charts were selected for abstraction by all data abstractors to allow calculation of interobserver agreement.
Clinical outcomes were determined by referencing hospital databases and the medical record if clarification was needed. The admission bed location and changes in patient location throughout the hospital stay were used to track the need for a higher level of care. The outcome of death was determined by cross‐referencing study participants with hospital mortality data, and the medical record, if needed.
Predictor Score Calculation
Abstracted data were used to calculate the MEWS score according to the criteria specified in Table 1 at the initial ED presentation (MEWS Initial), the maximum during the ED stay (MEWS Max), and prior to admission (MEWS Admit). Parameters not repeated after arrival were carried forward from the most recent recording. An adaptation of the MEWS score was required by replacing the alert/verbal/painful/unresponsive (AVPU) scale to determine the level of consciousness with the Glascow Coma Scale (GCS), a conversion that has been previously described.13, 14
| 3 Points | 2 Points | 1 Point | 0 Points | 1 Point | 2 Points | 3 Points | |
|---|---|---|---|---|---|---|---|
| |||||||
| Systolic blood pressure | <70 | 71‐80 | 81‐100 | 101‐199 | 200 | ||
| Heart rate | <40 | 41‐50 | 51‐100 | 101‐110 | 111‐129 | 130 | |
| Respiratory rate | <9 | 9‐14 | 15‐20 | 21‐29 | 30 | ||
| Temperature | <95 | 95‐101.1 | 101.2 | ||||
| GCS | 15 | 11‐14 | 7‐10 | 6 | |||
Clinical Endpoint Definitions and Outcomes
Need for higher level of care was defined as initial admission from the ED or transfer within 24 hours to a nonfloor bed (acute care, intermediate care unit, or critical care unit). Acute care beds at the study hospital have a lower bed‐to‐nurse ratio and more intensive monitoring (beside vs. radiotelemetry, vitals signs every 2 hours compared to every 4 hours) than floor beds. Intermediate care beds fulfill a gap between these and critical care, with dedicated respiratory therapists, the ability for invasive monitoring, and ventilator management. In addition, the hospital's burn, bone marrow transplant (BMT), and cardiac care units (CCU) are intensive carelevel units, and were included when measuring the need for higher level of care. Mortality was defined as death during the index hospitalization. The primary outcome was the composite need for a higher level of care or mortality within 24 hours of ED presentation.
Data Analysis
Calculation of interobserver agreement for data obtained from the chart abstraction was performed using Kappa coefficients. Descriptive statistics were used to summarize the patient characteristics separately for those who did and did not need higher levels of care. Fisher exact tests and Wilcoxon rank‐sum tests were used to assess group differences in the categorical and continuous patient characteristics, respectively. A frequency table was used to display the cross‐tabulation of MEWS Max scores with the need for higher levels of care, and the sensitivity and specificity were calculated for each cutpoint of the predictor scores. These measurements were plotted against one another in receiver‐operating characteristic (ROC) curves and the optimal cutpoint chosen as the one that gave the greatest sum of sensitivity and specificity. The area under the ROC curves and approximate 95% CIs were calculated. The Cochran‐Armitage trend test1517 was used to assess the association between risk score and outcome. Logistic regression was used to model the log odds of needing higher levels of care as a function of the MEWS Max score. Calibration of the model was assessed by analyzing the performance of the MEWS Max score among patient subgroups and comparing observed and expected events. Performance was also assessed among sextiles of risk using the Hosmer and Lemshow18 goodness‐of‐fit test.
As a secondary objective, additional covariates were added to the logistic model including MEWS to see if model performance could be improved. First, a simple logistic regression was used to determine the most significant MEWS score measurements among the 3 that were measured (MEWS Initial, MEWS Max, and MEWS Admit). Only 1 MEWS measurement was considered for the final model to avoid colinearity. The selected MEWS measurement was then entered into a multivariable logistic model along with age 60 years, gender, race/ethnicity (white, black, Hispanic, other), method of arrival (ambulatory or by ambulance), ED length of stay (recorded to the nearest minute, then converted to hours at the second significant digit), intravenous (IV) antibiotics in the ED, and antibiotics prior to ED arrival. Candidate variables were chosen considering both the plausibility to be associated with the outcome and the reliability of the data elements considering our retrospective methods. Forward selection, stepwise selection, and backward elimination with a significance level of 0.20 to enter and/or stay in the model were used to obtain a predictive model.
In order to assess the risk stratification potential for the MEWS Max model and the exploratory model (MEWS Plus), the ability to classify subjects by their probability of experiencing the outcome was assessed. Because an established consensus does not exist in the literature for these cutoffs, it was hypothesized that 4 risk categories (0‐10%, >10‐40%, >40‐70%, and >70%) would be clinically useful to clinicians allowing categorization into low‐, intermediate‐, high‐, and very‐high‐risk‐groups for requiring a higher level of care.
Results
Complete chart abstraction was performed for 299 patient encounters. After abstraction, 19 charts were excluded from final analysis due to missing outcome data (n = 6) or implausible and/or missing crucial data values (n = 13). Pairwise kappa values for abstraction of the MEWS Max score demonstrated agreement ranging from good to very good (0.67‐0.88). Of the 280 analyzed encounters, 76 (27%) met the primary composite outcome of death (n = 1) or need for higher care (n = 76). Of these 76 patients, 69 were admitted from the ED to a high level of care, and 7 were initially admitted to a lower level of care and required transfer to a higher level of care within 24 hours. Thirty‐seven patients requiring a higher level of care were admitted to an ICU (ICU = 31; BMT, CCU, and burn unit with 2 patients each), 9 to intermediate care, and 30 to an acute care bed.
Demographics and presenting characteristics from the study participants can be seen in Table 2. The mean age of participants was 56 years and was similar for the 2 groups. Approximately one‐half of the study participants were female (49%) and there was no statistical association between experiencing the composite outcome and gender (P = 0.28). The majority (64%) of participants were Caucasian, followed by African American (33%) and Hispanic or other (2%). Similar distributions were seen when stratified by outcome. Vital signs of the participants in total and stratified by outcome fell within normal parameters. ED length of stay was similar among those meeting and not meeting the composite outcome (5.5 hours vs. 5.8 hours, P = 0.15). Patients who met the composite outcome were more likely to have arrived by ambulance (63% vs. 43%, P = 0.004).
| Patient Characteristics | Composite Endpoint Not Met (n = 204)* | Composite Endpoint Met (n = 76)* | P Value |
|---|---|---|---|
| |||
| Demographics | |||
| Age (years) | 56 (42, 73) | 55 (41, 71) | 0.66 |
| Female sex (%) | 51 | 43 | 0.28 |
| White race (%) | 65 | 63 | 0.91 |
| Arrival via ambulance (%) | 43 | 63 | 0.004 |
| Length of stay (hours) | 5.8 (4.6, 7.2) | 5.5 (4.3, 6.9) | 0.15 |
| Presenting characteristics | |||
| Systolic BP (mmHg) | 132 (117, 148) | 135 (118, 159) | 0.26 |
| Heart rate (beats/minute) | 87 (74, 100) | 96 (82, 111) | 0.003 |
| Respiratory rate (breaths/minute) | 20 (18, 22) | 20 (18, 24) | 0.26 |
| Temperature (degrees F) | 97.9 (97.1, 98.8) | 97.8 (96.8, 99.6) | 0.78 |
| Glasgow coma scale | 15 (15, 15) | 15 (14, 15) | <0.001 |
| Antibiotic therapy | |||
| On antibiotics at arrival (%) | 9 | 9 | 1.00 |
| IV antibiotics in the ED (%) | 31 | 34 | 0.67 |
The distribution of scores and the proportion of participants with each score that met the composite outcome are shown in Figure 1. The MEWS Max was significantly associated with the primary composite outcome (P < 0.001, Cochran‐Armitage trend test). The scoring system demonstrates an increase in the proportion of participants meeting the composite endpoint as the score increases, and all participants with a MEWS Max score 9 met the composite outcome.
ROC are shown in Figure 2. The optimum threshold for MEWS Max based on the sum of sensitivity and specificity is 4, associated with a sensitivity of 62% and a specificity of 79% (Table 3) The predictive ability of the MEWS Max was moderate (C statistic MEWS Max 0.73; 95% CI, 0.66‐0.79), with each 1‐point increase in the MEWS Max score associated with a 60% increase in the odds of meeting the composite endpoint (odds ratio [OR], 1.6; 95% CI, 1.3‐1.8).
| MEWS Max Cutoff | Number at or Above the Cutoff Needing a Higher Level of Care | Sensitivity % (95% CI) | Specificity % (95% CI) | Positive Predictive Value (%) | Negative Predictive Value (%) |
|---|---|---|---|---|---|
| |||||
| 1 | 76 | 100 (95‐100) | 0 (0‐2) | 27 | NA |
| 2 | 68 | 89 (80‐95) | 32 (26‐39) | 33 | 89 |
| 3 | 55 | 72 (61‐82) | 61 (54‐68) | 41 | 86 |
| 4 | 47 | 62 (50‐73) | 79 (73‐84) | 52 | 85 |
| 5 | 25 | 33 (23‐45) | 88 (83‐92) | 51 | 78 |
| 6 | 15 | 20 (11‐30) | 94 (90‐97) | 56 | 76 |
| 7 | 10 | 13 (6‐23) | 98 (94‐99) | 67 | 75 |
| 8 | 5 | 7 (2‐15) | 99 (97‐100) | 71 | 74 |
| 9 | 3 | 4 (1‐11) | 100 (98‐100) | 100 | 74 |
Table 4 shows calibration of the model using different subgroups of the patient population. Grouping patients by age or gender did not reveal a higher event rate in any particular group. Using the Hosmer and Lemeshow18 goodness‐of‐fit test to stratify by risk category, no evidence for lack of fit was found (P = 0.06).
| Characteristic | Total Participants | Observed Events | Expected Events | Observed/ Expected |
|---|---|---|---|---|
| ||||
| Age | ||||
| >45 years | 87 | 24 | 23.8 | 1.01 |
| 45‐70 years | 118 | 33 | 32.8 | 1.01 |
| >70 years | 75 | 19 | 19.4 | 0.98 |
| Sex* | ||||
| Male | 142 | 43 | 37.4 | 1.15 |
| Female | 137 | 33 | 38.5 | 0.86 |
| Sextile of risk with MEWS Max | ||||
| First | 27 | 15 | 17.8 | 0.84 |
| Second | 22 | 10 | 10.1 | 0.99 |
| Third | 41 | 22 | 14.4 | 1.53 |
| Fourth | 45 | 8 | 11.6 | 0.69 |
| Fifth | 71 | 13 | 12.9 | 1.01 |
| Sixth | 74 | 8 | 9.2 | 0.87 |
In the exploratory analysis, 267 subjects had complete data for all candidate variables. Simple logistic regression revealed that the most predictive MEWS measurement was the MEWS Max (C statistic MEWS Max 0.725, MEWS Initial 0.668, MEWS Admit 0.653). Stepwise selection, forward selection, and backward elimination produced the same model containing method of arrival (P = 0.03), MEWS Max (P < 0.001), IV antibiotics in the ED (P = 0.17), length of stay (P = 0.05), and gender (P = 0.12). In the subset of subjects with these complete data elements (n = 268), the inclusion of the additional measures increased the C statistic to 0.76 (95% CI, 0.69‐0.82), a 0.04 increase over the model that only included MEWS Max in the same subset of subjects.
MEWS Max resulted in no patients being classified as low‐risk, with the majority (81.7%) classified as intermediate‐risk, 15.7% classified as high‐risk, and 2.6% classified as very high risk (Table 5). In all categories the actual event rate fell within the predicted event rate interval. The addition of variables included in MEWS Plus resulted in 14.6% of patients being classified as low‐risk, 64.0% as intermediate risk, 17.2% with high‐risk, and 4.1% as very‐high‐risk. In 58 cases (21.7%), using MEWS Plus would have placed patients in a more appropriate risk category than that assigned by MEWS Max; ie, a lower risk category for those who did not have events, and a higher risk category for those experiencing events. The majority of this correct reclassification was seen in the intermediate risk group by MEWS Max, where 17.6% were appropriately reclassified. Alternatively, 5.6% of cases would have resulted in inappropriate reclassification. Again, the actual event rate fell within the boundaries of predicted risk in all cases.
| MEWS Plus* | Events | ||||||
|---|---|---|---|---|---|---|---|
| MEWS Max | 0‐10 | >10‐40 | >40‐70 | >70 | Row Totals (%) | Correctly Reclassified (%) | Incorrectly Reclassified (%) |
| |||||||
| Total (%) | 39 (14.6) | 171 (64.0) | 46 (17.2) | 11 (4.1) | 267 | 58 (21.7) | 15 (5.6) |
| Events (% of total) | 2 (5.1) | 39 (22.8) | 24 (52.2) | 8 (72.7) | 73 (27.3) | ||
| Nonevents (% of total) | 37 (94.9) | 132 (77.2) | 22 (47.8) | 3 (27.3) | 194 (72.7) | ||
| 0‐10 | 0 | 0 | 0 | 0 | 0 | 0 | 0 |
| Events | 0 | 0 | 0 | 0 | 0 | ||
| Nonevents | 0 | 0 | 0 | 0 | 0 | ||
| >10‐40 | 39 | 162 | 17 | 0 | 218 (81.7) | 47 (17.6) | 9 (3.4) |
| Events | 2 | 36 | 10 | 0 | 48 (22.0) | ||
| Nonevents | 37 | 126 | 7 | 0 | 170 (78.0) | ||
| >40‐70 | 0 | 9 | 27 | 6 | 42 (15.7) | 10 (3.7) | 5 (1.9) |
| Events | 0 | 3 | 13 | 4 | 20 (47.6) | ||
| Nonevents | 0 | 6 | 14 | 2 | 22 (52.4) | ||
| >70 | 0 | 0 | 2 | 5 | 7 (2.6) | 1 (0.4) | 1 (0.4) |
| Events | 0 | 0 | 1 | 4 | 5 (71.4) | ||
| Nonevents | 0 | 0 | 1 | 1 | 2 (28.6) | ||
Discussion
Matching the initial level of care to the patient's severity of illness can be expected to improve the efficiency of health care delivery. The MEWS is a simple prediction instrument that can be calculated at the bedside and would be ideal for this purpose. The MEWS has good predictive ability among patients on the wards or awaiting admission,9, 10 and in this investigation a variation of MEWS appears to have potential to discriminate among high‐risk and low‐risk ED patients.
Examination of the ROC curve for the MEWS Max score demonstrates a fair performance (C statistic = 0.73). In this analysis, we created low‐risk, intermediate‐risk, high‐risk, and very‐high‐risk groups. The strength of the MEWS Max rests in its ability to classify patients as high‐risk or very‐high‐risk. Approximately 16% of patients are classified by MEWS Max as high‐risk, and 3% as very‐high‐risk, making the practitioner more confident in the decision to admit to a high level of care. However, MEWS Max classifies no patients as low risk and approximately 80% of patients are classified as intermediate‐risk. The majority of patients being classified into this gray zone and the inability to classify patients as low‐risk significantly limits the utility of MEWS Max.
In exploratory analysis, these data propose a model using additional readily available parameters that when added to the MEWS Max can improve patient classification. Of particular interest is the ability of the MEWS Plus model to more accurately identify patients at low risk of requiring a higher level of care. When compared to MEWS Max, approximately 22% of patients were correctly reclassified by MEWS Plus, with only 5% incorrectly reclassified. Importantly, MEWS Plus is able to reduce the size of the intermediate‐risk group, predominantly by reclassifying patients as low risk. Forty‐seven (17.6%) of the patients previously categorized as intermediate risk with MEWS Max were reclassified, with 39 of them becoming low risk, 2 (5.1%) of whom had events. However, the major limitation of the MEWS Plus is that it is currently not able to be calculated at the bedside as many of the included variables are time dependent. More analysis is needed to validate precisely which variables are most important, determine how they add to the calculation, and understand when or how often during the ED visit risk should be calculated. Further exploration and validation of this model is necessary.
The results of this investigation add in important ways to a previous study of the MEWS in ED patient triage.10 Subbe et al.10 examined the ability of the MEWS to improve admission decisions beyond those recommended by the Manchester Triage System. Their investigation was conducted among 153 ED patients who belonged to 1 of 3 cohorts being admitted from the ED in the United Kingdom. They concluded that the MEWS was unable to significantly improve admission level of care decisions over the Manchester Triage System. Our investigation differs from that reported by Subbe et al.10 in several important ways. Methodologically, we chose to include a broad population of ED patients rather than selecting 3 cohorts for comparison, and excluded trauma and cardiology patients due to suspected differences in admission patterns in these patients. Further, we conducted our analysis using the maximum MEWS score obtained during a patient's encounter. We felt that using the maximum MEWS score takes full of advantage of all clinical data obtained during the patient's ED visit rather than relying on their severity of illness when the patient first arrives. Additionally, we selected an outcome measure that was determined at 24 hours because we feel events occurring within 24 hours of admission are more likely to reflect a progression of a disease process present at the time of the ED evaluation. Subbe et al.10 analyzed ICU admissions after any duration of hospitalization on the wards. However, ICU admission after several days of ward care may neither be avoidable, nor predictable, while the patient is in the ED.
Subbe et al.10 concluded that the MEWS score did not significantly add to triage decisions aided by the Manchester Triage System. However, in their results, a MEWS score >2 would have classified 7 additional patients as high risk out of 50 who required a transfer to a higher level of care when compared to the Manchester Triage System. Our findings explore the discriminatory value of the maximum MEWS score for a patient throughout the ED visit. This approach, combined with our methodologic differences, have led to more encouraging findings about the utility of the MEWS Max score, especially when combined with a few simple and reliably abstracted variables, to predict the required level of care within 24 hours.
Limitations to our results mainly relate to the study design. We chose a nonconcurrent cohort design using an explicit chart review. Chart reviews have inherent limitations that can include inaccuracy of abstracted data elements, missing data, systematic bias imposed by the abstraction process, and unmeasured confounding. To minimize avoidable biases and maintain accuracy while conducting this chart review, we followed well‐described methods.19 However, because we were relying on retrospective data, some data elements were incomplete. For instance, not all participants had multiple sets of vital signs recorded, which could have affected the predictive accuracy of the risk scores. Anticipating this difficulty, we had algorithms established to handle missing data, which we feel minimized this effect. However, despite this effort, 13 patients had to be excluded due to incomplete data. During review, it was noted that some patients admitted due to a traumatic mechanism were included in the final data analysis despite our intent to exclude them. We expect that this was a very small number, and should have had a minimal effect on risk score calculation. In addition, we modified the original MEWS model in that the GCS was used in substitution for the AVPU score. The conversion of the AVPU score to the GCS is well‐described and is unlikely to have affected the accuracy of the MEWS. We did not adjust for ED length of stay in our primary MEWS model. It is possible that more severely ill patients were in the ED longer and therefore had more opportunity to have abnormal vital signs recorded. ED length of stay was incorporated into the MEWS Plus model. Another limitation relates to our reference standard. We chose a composite of the need for a higher level of care or death within 24 hours. The need for higher care is a subjective endpoint. However, we felt this reflection of actual decision making is more informing than comparisons to other objective, unvalidated scoring systems. As more robust scoring systems are developed, researchers will need to consider developing a reference standard employing blinded adjudicators. Pediatric, cardiology, and trauma patients were excluded from this analysis and therefore our results cannot be extrapolated to these populations. MEWS model calibration was performed using the same data set as that on which the model was tested. This may have resulted in overfit of the model to the data, possibly leading to an overstatement of the model's predictive ability. Additionally, the MEWS Plus model requires validation in another study population. A final limitation is that in performing the study at 1 institution, the results may not be generalizable to other settings.
Building on previous work in defining and testing risk scores to predict poor outcomes, we have shown that the MEWS Max is a potentially useful tool to categorize patients as high‐risk or very‐high‐risk for requiring a higher level of care. MEWS Max suffers from the creation of a large intermediate risk group and the inability to classify patients as low‐risk. Adding further variables to MEWS Max creates a model with improved performance (MEWS Plus). This model may allow for 15% of admissions to be classified as low‐risk and shows promise as a tool to be used in ED triage of patients who are being admitted. Further work should attempt to further refine and validate the MEWS Plus model and examine the effect of implementation of these models on admission decision making and clinical outcomes.
Acknowledgements
Special gratitude is extended to Ronald H. Small, M.B.A., Vice President of the Division of Healthcare Research and Quality, for his assistance.
- ,,,.The longer patients are in hospital before intensive care admission the higher their mortality.Intensive Care Med.2004;30(10):1908–1913.
- ,,.Physiological values and procedures in the 24 h before ICU admission from the ward.Anaesthesia.1999;54(6):529–534.
- ,.Can some in‐hospital cardio‐respiratory arrests be prevented?A prospective survey. Resuscitation.1998;37(3):133–137.
- ,.Physiological abnormalities in early warning scores are related to mortality in adult inpatients.Br J Anaesth.2004;92(6):882–884.
- ,,,,,.Recognising clinical instability in hospital patients before cardiac arrest or unplanned admission to intensive care. A pilot study in a tertiary‐care hospital.Med J Aust.1999;171(1):22–25.
- ,,,,,.Improving the utilization of medical crisis teams (Condition C) at an urban tertiary care hospital.J Crit Care.2003;18(2):87–94.
- ,,,.The medical emergency team.Anaesth Intensive Care.1995;23(2):183–186.
- ,,, et al.Systematic review and evaluation of physiological track and trigger warning systems for identifying at‐risk patients on the ward.Intensive Care Med.2007;33(4):667–679.
- ,,,.Validation of a modified early warning score in medical admissions.QJM.2001;94(10):521–526.
- ,,,.Validation of physiological scoring systems in the accident and emergency department.Emerg Med J.2006;23(11):841–845.
- ,,, et al.The TIMI risk score for unstable angina/non‐ST elevation MI: a method for prognostication and therapeutic decision making.JAMA.2000;284(7):835–842.
- ,.Trauma scoring systems: a review.J Am Coll Surg.1999;189(5):491–503.
- ,,.Comparison of consciousness level assessment in the poisoned patient using the alert/verbal/painful/unresponsive scale and the Glasgow Coma Scale.Ann Emerg Med.2004;44(2):108–113.
- ,.Simple bedside assessment of level of consciousness: comparison of two simple assessment scales with the Glasgow Coma scale.Anaesthesia.2004;59(1):34–37.
- ,,.Exact inference for contingency tables with ordered categories.J Am Stat Assoc.1990(85):453–458.
- .Tests for trends in proportions. In: Klotz S, Johnson NH, eds. Encyclopedia of Statistical Sciences. Vol 9.New York:John Wiley and Sons, Inc.;1988:334–336.
- SAS Institute I. Cochran Armitage Test for Trend.SAS OnlineDoc 9.1.3.Cary, NC:SAS Institute, Inc.;2007.
- ,.Applied Logistic Regression.2nd ed.New York:John Wiley and Sons;2000.
- ,,,,.Chart reviews in emergency medicine research: Where are the methods?Ann Emerg Med.1996;27(3):305–308.
Copyright © 2010 Society of Hospital Medicine

Implementing a Smoke‐Free Medical Campus
Even though imposition of smoke‐free policies and workplaces comprise one of the most effective antismoking strategies,1 hospital administrators hesitate to implement a smoke‐free medical campus policy.2 They fear losing patients who smoke because these patients will opt for other facilities that permit smoking.
Apart from studies evaluating Joint Commission on Accreditation of Healthcare Organizations (JCAHO)‐required indoor smoking bans in hospitals in 1992,3, 4 there are few published studies or formal evaluations of the impact of medical campuses going smoke‐free. One study of the implementation of a smoke‐free medical campus policy at a university hospital in Little Rock, AR, showed that the policy had no impact on employee retention, bed occupancy, or mean daily census; however, inpatient smoking status was not ascertained.5 Most (83%) employees were supportive of the policy. More importantly, employees at 2 university medical centers reported reduced cigarette consumption and increased attempts to quit after implementation of a smoke‐free medical campus policy.6, 7
Our hospital is 180‐bed, acute care inpatient teaching facility in upstate New York. Prior to the implementation of the smoke‐free medical campus policy, it was common to see employees, visitors, and patients lined up outdoors around the main hospital entrances and smoking just beyond the no smoking signage. Inpatients could look out their windows at the main entrance or into the courtyard and see hospital staff, other patients, and visitors smoking.
This study prospectively evaluates the impact of implementing the smoke‐free medical campus policy and starting an inpatient smoking cessation service. It addresses the following questions that have also been raised by the Task Force for Community Preventive Services.8 Does the institution of hospital smoking bans reduce the percentage of inpatients who smoke or increase the percentage who sign out against medical advice? What are the extended effects (beyond 1 year after implementation) of medical campus smoking bans on employee smoking rates?
Materials and Methods
Policy Implementation
As prior studies have shown that institution of a smoke‐free medical campus policy involves much more than just posting signage,9, 10 a detailed multidisciplinary work plan was implemented starting 1.5 years prior to the date our policy went into effect on July 1, 2006. The Implementing a Smoke‐Free Environment plan, produced by the University of Michigan,11 which includes a 15‐step checklist, was used to guide this policy change.12 As part of that plan, employees were offered on‐site smoking cessation services, including nicotine replacement therapy (NRT), and 150 employees participated in this program prior to July 1, 2006. Staff, community, and patient education was also completed. A new campus map delineating the smoke‐free border was disseminated. Signage was posted in areas used in the past for smoking. In addition to implementing this plan, an inpatient smoking cessation service was started 3 months prior to July 1, 2006. In addition to supporting the enforcement of the smoke‐free medical campus, our inpatient smoking cessation program was designed to help inpatients with nicotine withdrawal as well as smoking cessation, if they were ready to quit.
Data Collection and Analysis
The inpatient electronic medical record (EMR) was used to monitor the smoking status of patients admitted to hospital on a monthly basis. On admission to the hospital, the admitting nurse screened patients for current smoking status. This information was entered into the EMR starting in April 2006; therefore, pre‐ban screening data were limited to 2 months prior to the ban. Inpatients too sick to complete this screening process, women admitted for labor and delivery, and inpatients boarded in the emergency department were not screened. No identifiers were used in compiling these monthly data.
Nursing reports of inpatients signing out against medical advice (AMA) were compiled in order to compare incidence of AMA pre‐ban to post‐ban. AMA documentation in our hospital takes the form of a structured incident report that is reliably documented by nursing staff and signed by the attending physician of service.
Computerized inpatient doctors' orders to pharmacy for NRT, dispensed as gum or patch, were monitored 2 years preinitiation and postinitiation of the inpatient smoking cessation service on April 1, 2006. As varenicline was nonformulary and bupropion was used for other indications than smoking cessation, these medications were not included in this review. The Chow test was used to measure and test for significant breaks in a time series analysis of the NRT orders.
New York State law requires an annual occupational health review to be completed by every hospital employee. At our hospital, this review included a question on tobacco use Do you smoke or chew tobacco? Although there has been a smoker/nonsmoker differential in the rates offered for supplemental life insurance since 1992, there were no wellness credits or other incentives for medical insurance offered in employee benefits that may predispose employees to underreport tobacco use. Using this question, employees were categorized as self‐reported current smokers or chew users. Employee smoking rates were estimated using different denominators to validate the direction of the trend. First, self‐reported smoking rates were compared pre‐ban and post‐ban among a stable cohort of hospital employees (n = 489), defined as hospital‐based employees with anniversary dates from March to June who reported in both 2005 and 2007. The McNemar test was used to test the statistical significance of the 2 smoking rates of paired replicates in this stable cohort of employees reporting pre‐ban and post‐ban. Second, all employees in the database reporting smoking status pre‐ban, March to June 2005, and then post‐ban, March to June 2006 and 2007, were compared in order to monitor trends in employee smoking overall. A t‐test was used to compare the statistical significance of the difference in the overall rates of smoking among all employees pre‐ban and post‐ban.
Internal review boards of our hospital and the New York State Department of Health reviewed and approved this study.
Results
Inpatient Outcomes
An average of 959 patients were admitted per month in the 18‐month period pre‐ban (January 2005 to June 2006) vs. 988 per month in the 23‐month period post‐ban (July 2006 to September 2008). A monthly average of 89% of inpatients were screened for tobacco use when admitted. The monthly average for the percentage of inpatients who currently smoke has been approximately 21.6% following the implementation of the smoke‐free hospital plan. There has been little variation (Figure 1) in the percentage of inpatients who smoke pre‐ban and post‐ban except for the startup period in 2006 and the onset of the 2007 respiratory illness season.
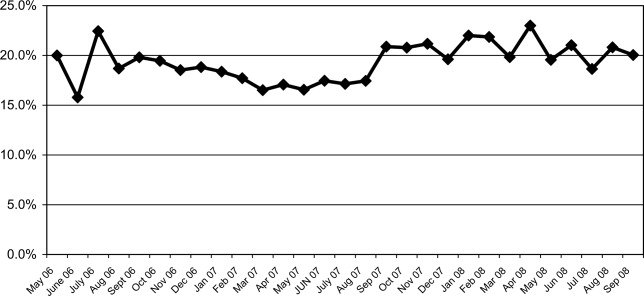
Among all inpatients who currently smoke, 69.8% received a brief nursing intervention at the time of admission and 25% received an inpatient visit from our part‐time smoking cessation specialist.
The percentage of inpatients who signed out against medical advice (AMA) with the reason of having to smoke was 13.8% (4/29) 6 months pre‐ban, and 13.6% (3/22) 6 months post‐ban. In 2007, there were no inpatients who signed out AMA stating that they needed to smoke. Because the reason for signing out AMA may be underreported, we also examined the rate of smoking among all inpatients who sign out AMA. Six months pre‐ban, this percentage was 48.3% (14/29), but increased 6 months post‐ban to 59% (13/22). In 2007, the percentage of smokers among inpatients who sign out AMA leveled off at 50.8% (29/57).
Review of computerized inpatient prescription orders shows that orders for NRT nearly tripled after the inpatient smoking cessation service started April 1, 2006 (3 months prior to the ban) (Figure 2). Inpatient orders for these medications increased from 832 in a 2‐year period before the ban (April 1, 2004 to March 31, 2006) to 2475 in the 2 years following the initiation of the inpatient smoking service (April 1, 2006 to March 31, 2008). The Chow test is highly significant for a break point in June 2006 (P = 0.008), 1 month prior to the ban.

Employee Smoking Rates
Among a cohort of 489 hospital‐based employees reporting in both 2005 and 2007, 12% reported smoking in 2005 and 7.5% in 2007 (McNemar was significant at P 0.001). Two employees reported using chewing tobacco in 2005 and only 1 in 2007.
Including all hospital employees reporting any 1 year during their anniversary dates, the self‐reported smoking rates were 14.3% (n = 624) in March to June 2005, 14.8% (n = 661) in March to June 2006, and 9.4% (n = 1,112) in March to June 2007 (P 0.0002). Because promotions change the anniversary date, and the database was expanded in 2007 to include new hires and managerial staff, these estimates represent the point prevalence among employees whose anniversary dates fall between March and June.
Discussion
Following implementation of a smoke‐free medical campus, no adverse effects were observed on inpatient volume at our hospital. The percentage of inpatients who smoke and the percentage of inpatients signing out AMA have remained stable after the smoke‐free policy went into effect. In addition, self‐reported employee smoking rates decreased significantly. Fears about losing inpatients (who smoke) following the implementation of a smoke‐free hospital plan were unfounded.
This study employs the electronic medical record to not only monitor trends in the proportion of inpatients who smoke pre‐ban and post‐ban, but also to notify our inpatient smoking cessation specialist, on the day of admission, to consult on patients who currently smoke. Unfortunately, our cessation specialist, who is part‐time, was unable to see all inpatients who smoke on account of the inpatient's acuity, pain, hospice status, weekend or night admission, or not being available due to testing, surgery, or other procedures. Nevertheless, use of NRT increased sharply following the initiation of this program. As shown in Figure 2, a linear rise in NRT orders was already underway starting April 2005, probably in anticipation of the ban and coinciding with the start of the inpatient smoking cessation program. However, the Chow test is highly significant for a breakpoint in June 2006 (P = 0.008), 1 month prior to the ban, meaning that the slope was climbing even more steeply after that point.
As hospitalized smokers may be more motivated to stop smoking, the updated 2008 clinical practice guidelines for Treating Tobacco Use and Dependence now recommend that all patients in the hospital be given medications, advised, counseled, and receive follow‐up after discharge.13 Although our inpatient cessation program was started before these clinical practice guidelines were available, we are currently evaluating the efficacy of our inpatient program by assessing self‐reported quit rates 6‐months posthospitalization (data collection in process). Provision of inpatient smoking cessation has been shown to be an effective smoking cessation intervention if combined with outpatient follow‐up.14 Our current program will be expanded to include outpatient follow‐up, if the inpatient's primary care provider is unable to provide it or if the inpatient refuses faxed referral to the New York State quit line program.
This study evaluates the impact of simultaneously introduced interventions such as medical campus smoking ban, inpatient smoking cessation program, hospital staff education, and other elements of the University of Michigan Smoke‐Free Hospital Implementation Plan. The role of individual components of the plan cannot be evaluated in this study as they were intentionally implemented simultaneously in order to achieve a synergistic effect.
Another limitation of this study is that smoking status is self‐reported and not validated biochemically. Although validated smoking status measures such as salivary cotinine testing would be more scientifically valid, it was not feasible to validate the smoking status of inpatients, nor that of employees. Thus smoking status, as ascertained in this study, is subject to underreporting. Social desirability bias has been recognized as potential limitation of self‐reported smoking status in other evaluations of smoke‐free policies.3, 4, 15
In the 1990s, the employee benefits of instituting indoor smoking bans in hospitals were theorized to include reduced employee sick time, break time, and tobacco use, as well as increased motivation for smoking cessation and reduced legitimacy of tobacco use.16, 17 Peer pressure, workplace socialization, and being forced to stay away from cigarettes for the length of entire workdays have been credited with helping hospital workers to quit.4, 7 In our study, extending the ban to the outdoor areas of our medical campus as well as provision of employee smoking cessation services may augment these mechanisms. This study extends findings of older studies that showed hospital smoking bans (primarily indoor) decreased hospital employee smoking rates. Currently, our reduced employee smoking rate approaches the Healthy People 2010 goal of 12%.18
In conclusion, implementing a smoke‐free medical campus does not adversely affect inpatient volume (even among smokers), does not increase inpatient signing out AMA and can significantly increase inpatient NRT use, which in turn can increase the success of a quit attempt.19 In addition, implementing an outdoor smoking ban further reduces hospital employee smoking rates.
Acknowledgements
The authors are grateful to the many Mary Imogene Bassett Hospital staff in administration, employee health, facilities management, human resources, inpatient pharmacy, medical education, patient care service, respiratory care, and security who provided policy support and/or data needed to evaluate policy implementation.
- Institute of Medicine.Ending the Tobacco Problem: A Blueprint for the Nation.Washington, DC:National Academies Press;2007.
- ,.Smoke‐Free Hospital Campus Policies.Washington, DC,Advisory Board Original Inquiry Brief. 2/1/2005. Available at: http://www.roswellpark.org/files/1_2_1/prevention/3%20‐%20‐Advisory% 20Board%20smoke%20free%20policies.pdf. Accessed March 2009.
- ,,,,.Effects of the implementation of a smoke‐free policy in a medical center.Chest.1992;102:1531–1536.
- ,,, et al.Hospital smoking bans and employee smoking behavior: results of a national survey.JAMA.1996;275(16):1252–1257.
- ,,, et al.Impact of a smoke‐free hospital campus policy on employee and consumer behavior.Public Health Rep.2007;122(6):744–752.
- ,,,.Employee attitudes and smoking behavior at the City of Hope National Medical Center smoke–free campus.J Natl Compr Canc Netw.2006;4(6):535–542.
- ,.Effect of a total work‐site ban on employee smoking and attitudes.J Occup Med.1991;33(8):884–890.
- ,,, et al.Reviews of evidence regarding interventions to reduce tobacco use and exposure to environmental tobacco smoke.Am J Prev Med.2001;20(2S):16–66.
- ,,.Smoking on hospital grounds and the impact of outdoor smoke‐free zones.Tob Control.1996;5:199–204.
- ,,,,.The making of a smoke free hospital may not be as easy as you think.Am J Prev Med.1991;7(4):214–218.
- University of Michigan Health System. Tobacco Consultation Service. Available at: http://www.med.umich.edu/mfit/tobacco/freeenvironment. htm. Accessed March2009.
- Michigan Health and Hospital Association. It's a matter of life and health: MHA campaign for smoke‐free hospitals. Available at: http://www. mhasmokefreecampus.org. Accessed March2009.
- Department of Health and Human Services (DHHS). Treating Tobacco Use and Dependence: 2008 Update. Chapter 7: Specific Populations and Other Topics. Available at: http://www.ncbi.nlm.nih.gov/books/bv.fcgi? rid=hstat2.section.28504. Accessed March2009.
- ,,.Interventions for smoking cessation in hospitalized patients.Cochrane Database Syst Rev.2007;(3):CD001837.
- ,,, et al.Ending smoking at the Johns Hopkins Medical Institutions: an evaluation of smoking prevalence and indoor air pollution.JAMA.1990;264:1565–1569.
- .Toward smoke‐free medical facilities.Chest.1990;97:1027–1028.
- .The benefits of smoke‐free health care campuses.Am Fam Physician.1994;49(1):28–33.
- U.S. Department of Health and Human Services.Healthy People 2010. Vol 12nd ed.Washington, DC:U.S. Department of Health and Human Services;2000.
- ,,,.Effectiveness of smoking cessation therapies: a systematic review and meta‐analysis.BMC Public Health.2006;6:300.
Even though imposition of smoke‐free policies and workplaces comprise one of the most effective antismoking strategies,1 hospital administrators hesitate to implement a smoke‐free medical campus policy.2 They fear losing patients who smoke because these patients will opt for other facilities that permit smoking.
Apart from studies evaluating Joint Commission on Accreditation of Healthcare Organizations (JCAHO)‐required indoor smoking bans in hospitals in 1992,3, 4 there are few published studies or formal evaluations of the impact of medical campuses going smoke‐free. One study of the implementation of a smoke‐free medical campus policy at a university hospital in Little Rock, AR, showed that the policy had no impact on employee retention, bed occupancy, or mean daily census; however, inpatient smoking status was not ascertained.5 Most (83%) employees were supportive of the policy. More importantly, employees at 2 university medical centers reported reduced cigarette consumption and increased attempts to quit after implementation of a smoke‐free medical campus policy.6, 7
Our hospital is 180‐bed, acute care inpatient teaching facility in upstate New York. Prior to the implementation of the smoke‐free medical campus policy, it was common to see employees, visitors, and patients lined up outdoors around the main hospital entrances and smoking just beyond the no smoking signage. Inpatients could look out their windows at the main entrance or into the courtyard and see hospital staff, other patients, and visitors smoking.
This study prospectively evaluates the impact of implementing the smoke‐free medical campus policy and starting an inpatient smoking cessation service. It addresses the following questions that have also been raised by the Task Force for Community Preventive Services.8 Does the institution of hospital smoking bans reduce the percentage of inpatients who smoke or increase the percentage who sign out against medical advice? What are the extended effects (beyond 1 year after implementation) of medical campus smoking bans on employee smoking rates?
Materials and Methods
Policy Implementation
As prior studies have shown that institution of a smoke‐free medical campus policy involves much more than just posting signage,9, 10 a detailed multidisciplinary work plan was implemented starting 1.5 years prior to the date our policy went into effect on July 1, 2006. The Implementing a Smoke‐Free Environment plan, produced by the University of Michigan,11 which includes a 15‐step checklist, was used to guide this policy change.12 As part of that plan, employees were offered on‐site smoking cessation services, including nicotine replacement therapy (NRT), and 150 employees participated in this program prior to July 1, 2006. Staff, community, and patient education was also completed. A new campus map delineating the smoke‐free border was disseminated. Signage was posted in areas used in the past for smoking. In addition to implementing this plan, an inpatient smoking cessation service was started 3 months prior to July 1, 2006. In addition to supporting the enforcement of the smoke‐free medical campus, our inpatient smoking cessation program was designed to help inpatients with nicotine withdrawal as well as smoking cessation, if they were ready to quit.
Data Collection and Analysis
The inpatient electronic medical record (EMR) was used to monitor the smoking status of patients admitted to hospital on a monthly basis. On admission to the hospital, the admitting nurse screened patients for current smoking status. This information was entered into the EMR starting in April 2006; therefore, pre‐ban screening data were limited to 2 months prior to the ban. Inpatients too sick to complete this screening process, women admitted for labor and delivery, and inpatients boarded in the emergency department were not screened. No identifiers were used in compiling these monthly data.
Nursing reports of inpatients signing out against medical advice (AMA) were compiled in order to compare incidence of AMA pre‐ban to post‐ban. AMA documentation in our hospital takes the form of a structured incident report that is reliably documented by nursing staff and signed by the attending physician of service.
Computerized inpatient doctors' orders to pharmacy for NRT, dispensed as gum or patch, were monitored 2 years preinitiation and postinitiation of the inpatient smoking cessation service on April 1, 2006. As varenicline was nonformulary and bupropion was used for other indications than smoking cessation, these medications were not included in this review. The Chow test was used to measure and test for significant breaks in a time series analysis of the NRT orders.
New York State law requires an annual occupational health review to be completed by every hospital employee. At our hospital, this review included a question on tobacco use Do you smoke or chew tobacco? Although there has been a smoker/nonsmoker differential in the rates offered for supplemental life insurance since 1992, there were no wellness credits or other incentives for medical insurance offered in employee benefits that may predispose employees to underreport tobacco use. Using this question, employees were categorized as self‐reported current smokers or chew users. Employee smoking rates were estimated using different denominators to validate the direction of the trend. First, self‐reported smoking rates were compared pre‐ban and post‐ban among a stable cohort of hospital employees (n = 489), defined as hospital‐based employees with anniversary dates from March to June who reported in both 2005 and 2007. The McNemar test was used to test the statistical significance of the 2 smoking rates of paired replicates in this stable cohort of employees reporting pre‐ban and post‐ban. Second, all employees in the database reporting smoking status pre‐ban, March to June 2005, and then post‐ban, March to June 2006 and 2007, were compared in order to monitor trends in employee smoking overall. A t‐test was used to compare the statistical significance of the difference in the overall rates of smoking among all employees pre‐ban and post‐ban.
Internal review boards of our hospital and the New York State Department of Health reviewed and approved this study.
Results
Inpatient Outcomes
An average of 959 patients were admitted per month in the 18‐month period pre‐ban (January 2005 to June 2006) vs. 988 per month in the 23‐month period post‐ban (July 2006 to September 2008). A monthly average of 89% of inpatients were screened for tobacco use when admitted. The monthly average for the percentage of inpatients who currently smoke has been approximately 21.6% following the implementation of the smoke‐free hospital plan. There has been little variation (Figure 1) in the percentage of inpatients who smoke pre‐ban and post‐ban except for the startup period in 2006 and the onset of the 2007 respiratory illness season.
Among all inpatients who currently smoke, 69.8% received a brief nursing intervention at the time of admission and 25% received an inpatient visit from our part‐time smoking cessation specialist.
The percentage of inpatients who signed out against medical advice (AMA) with the reason of having to smoke was 13.8% (4/29) 6 months pre‐ban, and 13.6% (3/22) 6 months post‐ban. In 2007, there were no inpatients who signed out AMA stating that they needed to smoke. Because the reason for signing out AMA may be underreported, we also examined the rate of smoking among all inpatients who sign out AMA. Six months pre‐ban, this percentage was 48.3% (14/29), but increased 6 months post‐ban to 59% (13/22). In 2007, the percentage of smokers among inpatients who sign out AMA leveled off at 50.8% (29/57).
Review of computerized inpatient prescription orders shows that orders for NRT nearly tripled after the inpatient smoking cessation service started April 1, 2006 (3 months prior to the ban) (Figure 2). Inpatient orders for these medications increased from 832 in a 2‐year period before the ban (April 1, 2004 to March 31, 2006) to 2475 in the 2 years following the initiation of the inpatient smoking service (April 1, 2006 to March 31, 2008). The Chow test is highly significant for a break point in June 2006 (P = 0.008), 1 month prior to the ban.
Employee Smoking Rates
Among a cohort of 489 hospital‐based employees reporting in both 2005 and 2007, 12% reported smoking in 2005 and 7.5% in 2007 (McNemar was significant at P 0.001). Two employees reported using chewing tobacco in 2005 and only 1 in 2007.
Including all hospital employees reporting any 1 year during their anniversary dates, the self‐reported smoking rates were 14.3% (n = 624) in March to June 2005, 14.8% (n = 661) in March to June 2006, and 9.4% (n = 1,112) in March to June 2007 (P 0.0002). Because promotions change the anniversary date, and the database was expanded in 2007 to include new hires and managerial staff, these estimates represent the point prevalence among employees whose anniversary dates fall between March and June.
Discussion
Following implementation of a smoke‐free medical campus, no adverse effects were observed on inpatient volume at our hospital. The percentage of inpatients who smoke and the percentage of inpatients signing out AMA have remained stable after the smoke‐free policy went into effect. In addition, self‐reported employee smoking rates decreased significantly. Fears about losing inpatients (who smoke) following the implementation of a smoke‐free hospital plan were unfounded.
This study employs the electronic medical record to not only monitor trends in the proportion of inpatients who smoke pre‐ban and post‐ban, but also to notify our inpatient smoking cessation specialist, on the day of admission, to consult on patients who currently smoke. Unfortunately, our cessation specialist, who is part‐time, was unable to see all inpatients who smoke on account of the inpatient's acuity, pain, hospice status, weekend or night admission, or not being available due to testing, surgery, or other procedures. Nevertheless, use of NRT increased sharply following the initiation of this program. As shown in Figure 2, a linear rise in NRT orders was already underway starting April 2005, probably in anticipation of the ban and coinciding with the start of the inpatient smoking cessation program. However, the Chow test is highly significant for a breakpoint in June 2006 (P = 0.008), 1 month prior to the ban, meaning that the slope was climbing even more steeply after that point.
As hospitalized smokers may be more motivated to stop smoking, the updated 2008 clinical practice guidelines for Treating Tobacco Use and Dependence now recommend that all patients in the hospital be given medications, advised, counseled, and receive follow‐up after discharge.13 Although our inpatient cessation program was started before these clinical practice guidelines were available, we are currently evaluating the efficacy of our inpatient program by assessing self‐reported quit rates 6‐months posthospitalization (data collection in process). Provision of inpatient smoking cessation has been shown to be an effective smoking cessation intervention if combined with outpatient follow‐up.14 Our current program will be expanded to include outpatient follow‐up, if the inpatient's primary care provider is unable to provide it or if the inpatient refuses faxed referral to the New York State quit line program.
This study evaluates the impact of simultaneously introduced interventions such as medical campus smoking ban, inpatient smoking cessation program, hospital staff education, and other elements of the University of Michigan Smoke‐Free Hospital Implementation Plan. The role of individual components of the plan cannot be evaluated in this study as they were intentionally implemented simultaneously in order to achieve a synergistic effect.
Another limitation of this study is that smoking status is self‐reported and not validated biochemically. Although validated smoking status measures such as salivary cotinine testing would be more scientifically valid, it was not feasible to validate the smoking status of inpatients, nor that of employees. Thus smoking status, as ascertained in this study, is subject to underreporting. Social desirability bias has been recognized as potential limitation of self‐reported smoking status in other evaluations of smoke‐free policies.3, 4, 15
In the 1990s, the employee benefits of instituting indoor smoking bans in hospitals were theorized to include reduced employee sick time, break time, and tobacco use, as well as increased motivation for smoking cessation and reduced legitimacy of tobacco use.16, 17 Peer pressure, workplace socialization, and being forced to stay away from cigarettes for the length of entire workdays have been credited with helping hospital workers to quit.4, 7 In our study, extending the ban to the outdoor areas of our medical campus as well as provision of employee smoking cessation services may augment these mechanisms. This study extends findings of older studies that showed hospital smoking bans (primarily indoor) decreased hospital employee smoking rates. Currently, our reduced employee smoking rate approaches the Healthy People 2010 goal of 12%.18
In conclusion, implementing a smoke‐free medical campus does not adversely affect inpatient volume (even among smokers), does not increase inpatient signing out AMA and can significantly increase inpatient NRT use, which in turn can increase the success of a quit attempt.19 In addition, implementing an outdoor smoking ban further reduces hospital employee smoking rates.
Acknowledgements
The authors are grateful to the many Mary Imogene Bassett Hospital staff in administration, employee health, facilities management, human resources, inpatient pharmacy, medical education, patient care service, respiratory care, and security who provided policy support and/or data needed to evaluate policy implementation.
- Institute of Medicine.Ending the Tobacco Problem: A Blueprint for the Nation.Washington, DC:National Academies Press;2007.
- ,.Smoke‐Free Hospital Campus Policies.Washington, DC,Advisory Board Original Inquiry Brief. 2/1/2005. Available at: http://www.roswellpark.org/files/1_2_1/prevention/3%20‐%20‐Advisory% 20Board%20smoke%20free%20policies.pdf. Accessed March 2009.
- ,,,,.Effects of the implementation of a smoke‐free policy in a medical center.Chest.1992;102:1531–1536.
- ,,, et al.Hospital smoking bans and employee smoking behavior: results of a national survey.JAMA.1996;275(16):1252–1257.
- ,,, et al.Impact of a smoke‐free hospital campus policy on employee and consumer behavior.Public Health Rep.2007;122(6):744–752.
- ,,,.Employee attitudes and smoking behavior at the City of Hope National Medical Center smoke–free campus.J Natl Compr Canc Netw.2006;4(6):535–542.
- ,.Effect of a total work‐site ban on employee smoking and attitudes.J Occup Med.1991;33(8):884–890.
- ,,, et al.Reviews of evidence regarding interventions to reduce tobacco use and exposure to environmental tobacco smoke.Am J Prev Med.2001;20(2S):16–66.
- ,,.Smoking on hospital grounds and the impact of outdoor smoke‐free zones.Tob Control.1996;5:199–204.
- ,,,,.The making of a smoke free hospital may not be as easy as you think.Am J Prev Med.1991;7(4):214–218.
- University of Michigan Health System. Tobacco Consultation Service. Available at: http://www.med.umich.edu/mfit/tobacco/freeenvironment. htm. Accessed March2009.
- Michigan Health and Hospital Association. It's a matter of life and health: MHA campaign for smoke‐free hospitals. Available at: http://www. mhasmokefreecampus.org. Accessed March2009.
- Department of Health and Human Services (DHHS). Treating Tobacco Use and Dependence: 2008 Update. Chapter 7: Specific Populations and Other Topics. Available at: http://www.ncbi.nlm.nih.gov/books/bv.fcgi? rid=hstat2.section.28504. Accessed March2009.
- ,,.Interventions for smoking cessation in hospitalized patients.Cochrane Database Syst Rev.2007;(3):CD001837.
- ,,, et al.Ending smoking at the Johns Hopkins Medical Institutions: an evaluation of smoking prevalence and indoor air pollution.JAMA.1990;264:1565–1569.
- .Toward smoke‐free medical facilities.Chest.1990;97:1027–1028.
- .The benefits of smoke‐free health care campuses.Am Fam Physician.1994;49(1):28–33.
- U.S. Department of Health and Human Services.Healthy People 2010. Vol 12nd ed.Washington, DC:U.S. Department of Health and Human Services;2000.
- ,,,.Effectiveness of smoking cessation therapies: a systematic review and meta‐analysis.BMC Public Health.2006;6:300.

Consultative Pediatrics
In an ideal situation, a child could be cared for by 1 physician from childhood through adolescence. This physician could care for the child from the first days in the nursery, through multiple well‐child and sick visits, and during any hospitalizations. In 1992, the American Academy of Pediatrics (AAP) introduced the concept of the medical home to provide accessible, continuous, comprehensive, family‐centered, coordinated, and compassionate care for children.1 These ideals were reaffirmed in a 2002 AAP policy statement.2 The demands for outpatient care have become more intense and patient safety issues have become a public focus. Combined with the necessity for increased efficiency, the ideal medical home has become difficult to achieve simultaneously in both an outpatient and inpatient setting. This has led to the growth of the hospital specialist or hospitalist, a term first coined by Drs. Wachter and Goldman in August 1996.3 A hospitalist has been defined as a physician whose primary professional focus is the general medical care of hospitalized patients . . . teaching, research, and leadership related to hospital care.4 Despite early concerns voiced after the publication of this landmark article, there has been tremendous growth in the number of hospitalists nationwide.5 Initially, this growth was seen in adult medicine, but pediatric hospitalists have become increasingly more common. There are an estimated 10,000 to 20,000 hospitalists in the profession, with more than 30,000 expected by the end of the decade, with just over 10% being pediatric hospitalists.4 Several studies have shown the benefits of pediatric hospitalist programs with decreased length of stay, hospital charges, and utilization of unnecessary tests and therapies, and increased satisfaction among the physicians, students, and patients.611
History of the Diagnostic Referral Service
Despite the coining of the term hospitalist in 1996, specialization in inpatient care existed in various forms long before then.12 The Diagnostic Referral Service (DRS) at Children's Hospital of Pittsburgh (CHP) initially began under the guidance of Dr. Edmund R. McCluskey, chairman of the Department of Pediatrics at CHP, and Dr. Paul C. Gaffney, a beloved and revered clinician and educator. In 1951, Dr. Gaffney joined the full‐time CHP faculty after residency, chief residency, and a year of fellowship, providing his expertise in hematology and oncology. Over time, Dr. Gaffney's role expanded to that of a master physician, and pediatricians and family practitioners in the community began sending their most diagnostically challenging patients to be seen in his clinic. His activities further extended to providing inpatient care and consultations for complex patients.
With these growing responsibilities, Dr. Gaffney formed the DRS as a separate division within the Department of Pediatrics in the mid‐1970s and began developing the division. The group, then and now, is comprised of general pediatricians who provide multidisciplinary care for hospitalized children as well as for ambulatory consultations. The DRS was initially described in the literature 20 years ago; the roles of the 5 full‐time physicians at that time included a variety of clinical, teaching, and scholarly activities, as both inpatient and outpatient consultative physicians.13 Though much growth has occurred within the division since then, Dr. Gaffney's initial goals of providing excellent patient care and education in an academic setting still remain at the heart of each group member.
Growth of the Division
In March 2002, there were 4 full‐time physicians within the DRS. A remarkable increase in the group size has occurred since then, and currently there are 16 physicians. Each member of the division is assigned a specific activity, either outpatient or inpatient, for at least a 5‐day block. This allows the division to provide continuity in the care of complex patients in both settings and help maintain a medical home for these challenging patients. The primary care physician (PCP) remains responsible for primary care of the patient while the DRS can help manage the patient's complexities in the outpatient and inpatient setting. In essence, there is joint patient ownership between the DRS and the PCP, with relegation of different skill sets to provide a complete medical home for the patient.
The current activities of the group are summarized as follows.
Inpatient Activities
Inpatient Care
Corresponding to the growing pediatric hospitalist movement in the past decade, several area PCPs began requesting that their office patients be followed by the DRS when admitted to CHP. In 2003, the DRS physician referral list had 150 physicians, and it currently has over 325 physicians who refer the inpatient care of their patients to the DRS. These practices are located in a variety of locations in Western Pennsylvania, Ohio, and West Virginia. There are only 7 private practices that continue to maintain their admitting privileges to CHP, and these practices account for 0.5% of general pediatric admissions. The remaining admissions (those PCPs not on the DRS referral list or with admitting privileges) are covered by a rotating attending physician; 85% of the time this is a DRS physician. Therefore, while 0.5% of general pediatric admissions are cared for by private pediatricians, >95% of all general pediatric admissions are cared for by DRS, with the remaining patients cared for by a small number of pediatric subspecialists who occasionally serve as rotating attendings.
Associated with the increase in referrals has been a marked increase in inpatient activity (Figures 0, 0, 0, 13). Nearly 1 of every 4 CHP discharges and 1 of every 3 observation patients are cared for by the DRS.
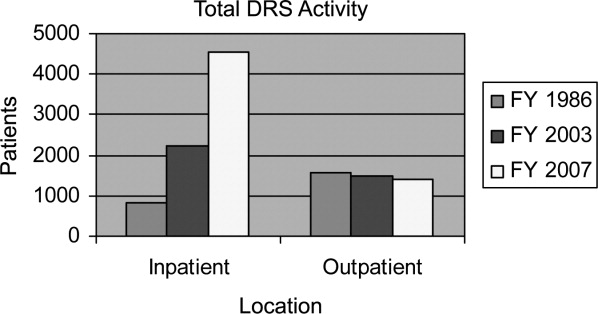
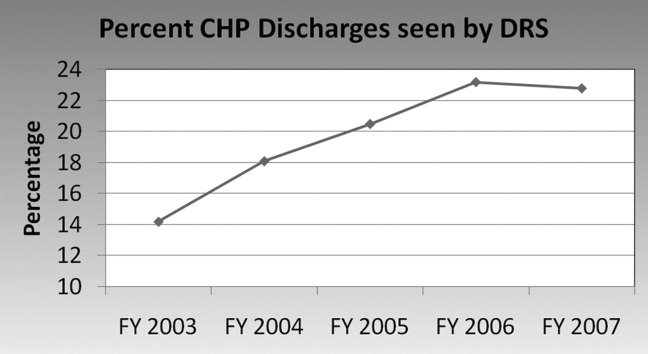
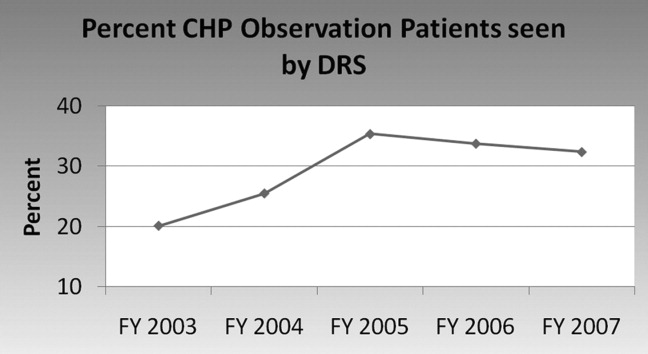
The DRS division has seen an increase in complex inpatient admissions as well as a much larger number of routine pediatric admissions from the community PCP referrals, as described above. Statistically, this has resulted in an overall stable to slightly increased inpatient complexity for the DRS group. During this same time period, there was a steep decrease in DRS inpatient length of stay followed by maintenance at the shorter length of stay thereafter. Inpatient complexity has increased throughout CHP, yet the same decreases in length of stay have not been seen universally in all the divisions (Figure 4). The advantage that a hospitalist group can bring in decreasing length of stay (and, thereby, hospital costs) has been seen in hospitalist programs around the country.6, 7
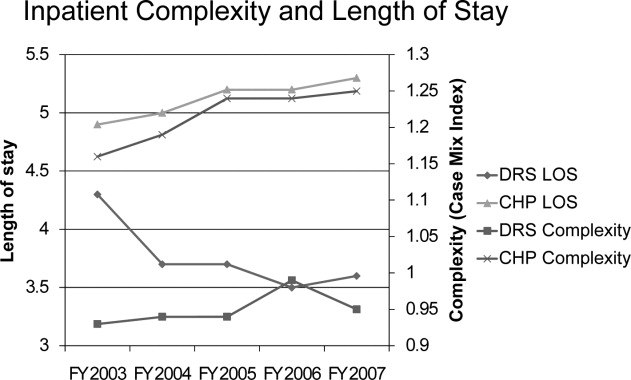
Each member of the group attends on the general pediatric ward for 9 to 10 months per year as compared to 2 months per year in 1986. In order to prevent job‐related fatigue, 6 to 8 members of the group typically attend on the ward at the same time so that individual patient volume is more manageable. On average, each individual physician is responsible for about 6 to 8 patients per day. This census allows for daily education of residents and medical students as well as faculty participation in a variety of administrative activities. Despite emphasis on careful documentation and billing for both inpatient and ambulatory activities, the division, like most other pediatric hospitalist divisions, depends upon financial support from CHP and the Department of Pediatrics.
There is a wide variety of diagnoses that are seen in the inpatient setting, with notable similarities and differences when compared to 2 decades ago (Table 1). For example, asthma, gastroenteritis, and bronchiolitis continue to be frequent diagnoses, with bronchiolitis admissions becoming more frequent, following national trends.14
| FY 1986 | FY 2007 | ||
|---|---|---|---|
| Rank | Diagnosis | Rank | Diagnosis |
| |||
| 1. | Asthma | 1. | Bronchiolitis |
| 2. | Gastroenteritis | 2. | Asthma |
| 3. | Failure to thrive | 3. | Pneumonia |
| 4. | Seizures | 4. | Dehydration |
| 5. | Bronchiolitis | 5. | Viral enteritis |
| 6. | Pneumonia | 6. | Viral infection, NOS |
| 7. | Suspected sepsis | 7. | Esophageal reflux |
| 8. | Apneic episodes | 8. | Fever |
| 9. | Meningitis | 9. | Cellulitis |
| 10. | Otitis media | 10. | Convulsions |
In general, a DRS faculty member becomes the primary resource for families with medically complex children. The same faculty member tends to follow the patient in the consultative ambulatory clinic, be available for phone calls, and, if possible, follow them as the attending physician when the patient is admitted. This provides a degree of continuity generally not seen in many other hospitalist programs and has the potential to increase patient and physician satisfaction as well as patient safety.
Limited Stay Unit
In addition to general inpatient care, the DRS developed and maintains the Limited Stay Unit (LSU). This unit was specifically created in 2001 to serve patients with uncomplicated diagnoses who are expected to be discharged within 48 hours. Up to 10 short‐stay/observation patients are admitted to this unit each day, with nurses and staff specially prepared to handle rapid patient turnover. A child's eligibility for the unit is determined by the Emergency Department physicians or by phone consultation between the referring physician and the attending LSU physician. The design of the LSU allows for efficient admission and discharges of patients admitted with uncomplicated diagnoses. Each morning, the LSU attending physician, nurse practitioner, and residents discuss each patient with the nursing team and assess discharge readiness. Prescriptions and other discharge paperwork are prepared before morning rounds in order to avoid delays when the child has met criteria for safe discharge. Initial internal data evaluating the efficiency of the LSU demonstrated shorter length of stay for similar diagnoses admitted to the general ward. This difference was not observed in a subsequent study, likely due to CHP initiatives to improve the efficiency of discharge processes throughout the hospital.
Inpatient Consultations
The DRS serves as the inpatient pediatric consultant for the medical and surgical subspecialties. In 2007, the division saw 292 inpatient consultations. Many of the consultations originate from the surgical subspecialties (eg, a consult from neurosurgery for vomiting in a child with a functioning ventriculoperitoneal shunt). Other consultations come from pediatric subspecialties (eg, a patient with a congenital heart defect managed by the pediatric cardiology service with recurrent aspiration pneumonia of unclear etiology). The consultation process begins with the primary service discussing the patient with a senior resident who performs the initial history and physical, formulates an assessment and recommendations, and discusses the case with the DRS physician. Any necessary changes to the recommendations are made and relayed to the primary service. In addition, the DRS consults on known chronically ill patients in the intensive care unit (ICU), providing support to the family, nuances of chronic care to the ICU team, and continuity of care when the patient is transferred to the general ward.
Evening Hospitalist Program
In September 2005, the DRS began to provide extended in‐house attending coverage until midnight on weekdays and 10 PM on weekends. The evening hospitalist (EH) not only sees the new DRS admissions during the evening but also is available for formal consultations from subspecialty services and informal consultations from house staff. The EH is responsible for resident and medical student education (including direct observation of history taking and physical exam skills), facilitation of early discharges for the following morning, and enhancement of patient safety. The EH is also a part of the Condition Help team,15 a novel patient safety initiative discussed below.
The EH program benefits patients and DRS members alike. Other members of the group are able to assume care of patients in the morning for whom the diagnostic evaluation has already been initiated by the EH. Therefore, definitive plans are in place earlier, and many laboratory tests, radiographs, and other tests have returned by the time the daytime attending sees the patient.
The EH program was structured to enhance patient care and resident supervision while avoiding scheduling that could adversely affect job sustainability and retention. As currently structured, the EH program offers numerous advantages over 24‐hour, 7‐days‐per‐week coverage. First, resident autonomy is crucial during their training.16 One significant early concern was that extending the hours of attending physician coverage could diminish this autonomy. To prevent this from occurring, the EH allows the senior residents to take ownership of patient care and provide the initial teaching and instructions to interns, students, and families before the EH becomes involved. This structure of the EH program enhances the development of resident autonomy, yet provides support for the residents either by the EH or on‐call attending through all hours of the night. Second, the senior residents meet with members of DRS each morning to discuss their decision‐making process for overnight admissions that arrive after the EH shift has ended. This allows analysis of house staff thought processes and discussion of considered alternatives. Third, with the recent resident work‐hour restrictions, several residency programs have moved to either daytime or nighttime shift‐based work for the residents. Therefore, having the same EH working each day for the week allows for more accurate assessment of the nighttime residents than scattered 24‐hour attending shifts. Fourth, evening coverage allows for simpler scheduling and a less disruptive sleep cycle for the EH than 24‐hour coverage could allow. Finally, the EH is able to transition to typical daytime hours following a week of evening shifts, which helps to enhance EH retention by providing opportunities for academic endeavors and peer interactions.
The Children's Home
Since August 2007, the DRS has provided inpatient care for children admitted to The Children's Home of Pittsburgh and Lemieux Family Center (TCH). This independent facility is administratively and geographically separate from CHP. The DRS manages a 6‐bed unit that specializes in transitional pediatric care and serves technology‐dependent infants and children in a family‐centered, home‐like environment. In general, patients who require these services are seen at CHP initially, medically stabilized, and then transferred to TCH to continue their care. There is 1 DRS physician assigned each week to providing care for these patients. Examples of patient problems cared for at this facility include feeding issues, long term intravenous (IV) antibiotic treatment (eg, neonates recovering from sepsis, meningitis, osteomyelitis), and family education for technology‐dependent children (eg, new tracheostomy or ostomy). The average length of stay is 10.2 days, which decreases CHP length of stay and promotes CHP savings during periods of high census.
Outpatient Activities
Outpatient Care
Many physicians in community clinics have large daily patient volumes, seeing upward of 30 to 40 patients per day. These added outpatient responsibilities can lead to decreased time available for a PCP to round on inpatients (hence, the nationwide growth of hospitalists).17 Additionally, this increased practice intensity may lead to less time to manage individual patients in the primary care setting.18
The pediatric patient has become significantly more complex, likely due to increased survival of patients with chronic medical problems.19 This is also evidenced at CHP by steadily increasing patient acuity scores (Figure 4). With this growing complexity, effective outpatient care in a standard 15‐minute to 20‐minute patient visit20 is difficult, especially given the AAP recommendations of providing an effective medical home for every patient.2 Since its inception, the DRS has provided ambulatory consultative services for the community. Sixty percent of the 1400 to 1900 patients seen each year are new patient referrals. The outpatient clinic activity has been essentially stable over the past several years (Figure 1), likely due to increased access to CHP subspecialty clinics and overall increased manpower in the Department of Pediatrics. A wide variety of diagnoses are made in the outpatient clinic (Table 2).
| Rank | Diagnosis |
|---|---|
| |
| 1. | Failure to thrive, poor weight gain, weight loss |
| 2. | Abdominal pain |
| 3. | Fever |
| 4. | Chronic fatigue |
| 5. | Syncope |
| 6. | Gastroesophageal reflux |
| 7. | Chest pain |
| 8. | Developmental delay |
| 9. | Headache |
| 10. | Coordination of care |
The DRS provides long‐term, multidisciplinary continuity of care for medically complex children. The child is seen by the same DRS physician during each clinic visit. If the patient is admitted to the hospital, every effort is made for the patient to be seen by the DRS physician who saw the patient in the clinic setting. This process allows for medically complex children to have the coordinated care that can be difficult to achieve if a different hospitalist physician is responsible for their care during each admission.
The DRS works closely with the PCP to augment continuity of care while the PCP continues to provide primary care services. This provides the PCP with assurance that the patient will remain in their practice while the patient's multiple medical needs are addressed by the DRS. In this manner, a complete medical home can be provided. Insurance companies have recognized members of the DRS to be specialists in general pediatric care and permit DRS faculty to bill as specialists.
Education
Teaching is a major role for the DRS, and the division is closely involved in leadership in medical education. Two members are directors of the pediatric physical exam course for first‐year and second‐year medical students, 2 members are the third‐year medical school Pediatric clerkship directors, 1 member is co‐director for the fourth‐year acting internship, 1 member is co‐director of the advanced pediatric interviewing program, 1 member is director of the pediatric medical education program, and 1 member is associate residency program director.
The entire group is involved with teaching at all of these levels. The majority of the group is involved with formal mentoring and advising of residents and medical students. The only general pediatric aspect of student and resident medical education in which the DRS is no longer involved is ambulatory pediatric medicine. The full‐time ambulatory faculty is responsible for the primary ambulatory care experience. However, many residents choose to complete an elective in DRS, including the outpatient clinic, to become exposed to the different diagnostic dilemmas and coordination of care visits that they may not see in their primary care continuity clinics.
The division always welcomes new teaching challenges and incorporates new methods of teaching as opportunities arise. For example, the recent family‐centered rounds initiative allowed for new teaching methods that were not previously possible. The team, comprised of a senior resident, 2 interns, 2 students, and an attending physician rounds at the bedside with permission from the parent. The patient's nurse, when available, and a pharmacist are often a part of the team. The case is presented by the student or intern (directed to the parent), and the case is discussed and clarified for the family. A plan for the day is presented and discussed with the family for approval. Through family‐centered rounds, the DRS attending provides patient specific teaching and role modeling during rounds that would not otherwise have been possible with classical didactic teaching. This method of daily rounding also allows for the patients, families, nurses, nursing students, medical students, and residents to be taught by the attending physician simultaneously. Additionally, it affords the nurses the opportunity to participate in medical decision‐making, and the house staff have perceived fewer pages by the nurses to clarify clinical issues.
The EH program also provided new teaching opportunities. Through the EH, the house staff and students are exposed to direct attending teaching in the evenings that otherwise would not occur, such as direct observation of student and resident histories and physical examinations. Based on resident evaluations and comments to the residency program directors, this teaching experience is deemed to be valuable and effective. In fact, since the EH program's inception 3 years ago, 2 EHs have been selected by the residents as Teacher of the Year.
Patient Safety
Patient safety and reduction of medical errors is a major focus of the entire group. One DRS member serves within the hospital administration as Medical Director for Clinical Excellence and Service to enhance patient safety hospital‐wide. One DRS member orchestrates a monthly house staff meeting entitled To Err is Human which provides a nonthreatening environment for residents to discuss medical errors or difficult situations that they have encountered. Two DRS members are part of the Physician Advisory Committee, which serves as a bridge between the information technology group and clinicians. This committee has aided in achieving a smooth transition to a completely electronic medical record (EMR) and works together to use the tools of an EMR to enhance patient safety. This successful EMR implementation was recognized by the Health Information Management Systems Society in October 2008. Additionally, stemming from several successful patient safety initiatives, CHP was 1 of only 7 children's hospitals recognized for patient safety in 2008 by Leapfrog, the nation's premier patient safety evaluation group.
Condition HELP
In February 2001, the death of 18‐month‐old Josie King at a leading children's hospital brought medical errors to the national forefront.21 In response to this tragedy, several hospitals in the University of Pittsburgh system began to implement a program called Condition HELP.22 Condition HELP gives parents the ability to have their child evaluated by a special medical team if they feel their child's immediate health is in danger or their concerns are not being addressed. In 2005, CHP was one of the first hospitals in the country to implement this type of system. The Condition HELP team consists of a physician, a nursing supervisor, and a patient advocate. During the evening hours, the DRS EH also participates in the calls. The team discusses the family's concern and, with the patient's attending physician, generates a plan of action to help remedy the issue. Usually within 5 days, each call is intensively reviewed for events leading up to the Condition HELP as part of the CHP's patient safety initiative. From September 2005 through August 2007, the CHP Condition HELP team responded to 42 calls from patients and parents, with the most issues found to be related to communication breakdown between caregivers and families. The involvement of this team helped to identify the root cause of the parent or patient's concern and implement measures to help to rectify the issue and increase patient safety.15
Scholarly Activity
Previously, the DRS was responsible for the general medical care of liver transplant recipients, and many prior publications from the division focused on these patients.13 The division no longer provides that service, and the current focus of scholarly activity is publication of case reports, book chapters, and review articles. There were 13 publications from the division members in the past 3 years. The group also serves as a major resource within the department by referring patients that fulfill the clinical criteria for ongoing clinical studies in other divisions.
One member of the group continues to serve as senior editor of the Atlas of Pediatric Physical Diagnosis, which is currently in its fifth edition. Several members of the group contribute chapters to this well‐known text. One member is an editor and another is a specialty reviewer for
At the University of Pittsburgh, both tenured and nontenured faculty promotions carry the same title without a prefix. Academic promotions for clinician‐educators center around clinical excellence and innovation in education. The 3 senior members of the group have been promoted to professor (1 tenured, 2 nontenured), and 2 other members are currently in consideration for promotion to associate professor. Two members of the group have been elected to the School of Medicine Academy of Master Educators, which recognizes and rewards excellence in education.
Future Goals
Future goals include expansion and refinement of the division's current inpatient and ambulatory activities. The group increased in size to 16 physicians in July 2008 due to the increased inpatient volume and growing demand for outpatient referrals. The family‐centered rounds initiative will continue to be refined to provide the best possible service to the patients and their families. The members of the group will have increased activity and involvement at the regional and national level with the growing pediatric hospitalist movement.
A pediatric hospitalist fellowship program certainly would be feasible in the current environment. At this writing, there are only 8 pediatric hospitalist fellowship programs nationwide. The outpatient/emnpatient environment that the DRS provides the community would certainly provide a unique training environment for a hospitalist fellowship. The diversity in hospitalist divisions nationwide and the standardization of fellowship training is an important task for the future.23
Discussion
Pediatrics has undergone major changes since the original description of the DRS 20 years ago.7 These changes have revolutionized the practice of pediatrics in both the ambulatory and inpatient settings. The DRS role has changed significantly along with the national trends in pediatric hospitalist growth over the past decade. Currently, 90% of the division's clinical activity is inpatient care. In essence, this is an extension of the original consultant role, but the model has been extended to provide inpatient multidisciplinary care for pediatric patients.
Despite the remarkable growth in inpatient activity, 1 unique advantage to the DRS model is maintenance of an active outpatient consultation clinic focused on providing a multidisciplinary medical home for chronically ill patients. DRS faculty are able to coordinate the care of these complex patients while not usurping the primary care responsibility of the community physician. The same faculty are able to extend the continuity of care to the inpatient setting should the patient require admission.
There have been several innovations that the DRS has implemented over the past decade. The LSU was designed to provide effective and efficient care. The EH program extends attending in‐house coverage without the disadvantages of 24‐hour, 7‐day‐per‐week coverage. Expanding services to include The Children's Home allows for easier transition to home for technology‐dependent patients and families. At the same time, DRS continues to strive for innovative clinical leadership as well as creative and effective student and resident education.
Conclusion
Despite the remarkable growth and increased clinical activity of the DRS since its inception, Dr. Gaffney's ideals continue to serve as the lifeline for the division. The DRS still maintains the consultative pediatric role that he originated, but the inpatient activity has grown with the pediatric hospitalist movement at the same time. The division also maintains an active outpatient clinic. This dual function allows the DRS to continue to serve the community in a unique manner.
- American Academy of Pediatrics.Ad hoc task force on definition of the medical home, the medical home.Pediatrics.1992;90:774.
- American Academy of Pediatrics.Medical Home Initiatives for Children with Special Needs Project Advisory Committee, The Medical Home.Pediatrics.2002;110:184–186.
- ,.The emerging role of “hospitalists” in the American health care system.N Engl J Med.1996;335:514–517.
- Society of Hospital Medicine. Home. Available at http://www.hospitalmedicine.org. Accessed June 2009.
- ,,, et al.The role of “hospitalists” in the health care system.N Engl J Med.1997;336:444–446.
- ,,,,,.Restructuring an academic pediatric inpatient service using concepts developed by hospitalists.Clin Pediatr.2001;40:653–660.
- ,,,.Evaluation of a staff‐only hospitalist system in a tertiary care, academic children's hospital.Pediatrics.2004;114:1545–1549.
- ,,, et al.Impact of a hospitalist system on length of stay and cost for children with common conditions.Pediatrics.2007;120:267–274.
- ,,,.Pediatric hospitalists: a systematic review of the literature.Pediatrics.2006;117:1736–1744.
- ,.Evaluation of a pediatric hospitalist service: impact on length of stay and hospital charges.Pediatrics.2000;105:478–484.
- ,,,,,.Variations in management of common inpatient pediatric illnesses: hospitalists and community pediatricians.Pediatrics.2006;118:441–447.
- American Academy of Pediatrics.Section on Hospital Medicine. Guiding principles for pediatric hospitalist programs.Pediatrics.2005;115:1101–1102.
- ,,,,.Consultative pediatrics: a role for the generalist in an academic setting.J Pediatr.1988;112:1035–1038.
- ,,,,,.Bronchiolitis‐associated hospitalizations among U.S. children, 1980–1996.JAMA.1999:282:1440–1446.
- ,,,,,.Condition HELP: a pediatric rapid response team triggered by patients and parents.J Healthc Qual.2008;30:28–31.
- ,,,,,.Effect of a pediatric hospitalist system on housestaff education and experience.Arch Pediatr Adolesc Med.2002;156:877–883.
- .Clinical and behavioral adaptation to managed care: stepwise suggestions for survival.Pediatrics.1995;96:821–824.
- ,,,,,.Gatekeeping and referral of children and adolescents to specialty care.Pediatrics.1999;104:28–34.
- (Chair, AAP Council on Children with Disabilities). Written Statement on Behalf of the American Academy of Pediatrics: Presented to the Institute of Medicine Committee on Disability in America. January 9,2006. Available at: http://www.aap.org/advocacy/washing/Testimonies‐Statements‐Petitions/IOM_testimony.pdf. Accessed June 2009.
- ,,, et al.The duration of ambulatory visits to physicians.J Fam Pract.1999;48:264–271.
- .Systemic errors continue to plague many hospitals.Pittsburgh Post‐Gazette.2004 Dec 5: Sect. Living.
- Josie King Foundation: Creating a Culture of Patient Safety, Together. Available at http://www.josieking.org. Accessed June 2009.
- .Hospitalist fellowships: pro and con.Section on Hospital Medicine News.2006;1:7,9. Available at: https://www.aap.org/sections/hospcare/SOHMwinter06news.pdf. Accessed June 2009.
In an ideal situation, a child could be cared for by 1 physician from childhood through adolescence. This physician could care for the child from the first days in the nursery, through multiple well‐child and sick visits, and during any hospitalizations. In 1992, the American Academy of Pediatrics (AAP) introduced the concept of the medical home to provide accessible, continuous, comprehensive, family‐centered, coordinated, and compassionate care for children.1 These ideals were reaffirmed in a 2002 AAP policy statement.2 The demands for outpatient care have become more intense and patient safety issues have become a public focus. Combined with the necessity for increased efficiency, the ideal medical home has become difficult to achieve simultaneously in both an outpatient and inpatient setting. This has led to the growth of the hospital specialist or hospitalist, a term first coined by Drs. Wachter and Goldman in August 1996.3 A hospitalist has been defined as a physician whose primary professional focus is the general medical care of hospitalized patients . . . teaching, research, and leadership related to hospital care.4 Despite early concerns voiced after the publication of this landmark article, there has been tremendous growth in the number of hospitalists nationwide.5 Initially, this growth was seen in adult medicine, but pediatric hospitalists have become increasingly more common. There are an estimated 10,000 to 20,000 hospitalists in the profession, with more than 30,000 expected by the end of the decade, with just over 10% being pediatric hospitalists.4 Several studies have shown the benefits of pediatric hospitalist programs with decreased length of stay, hospital charges, and utilization of unnecessary tests and therapies, and increased satisfaction among the physicians, students, and patients.611
History of the Diagnostic Referral Service
Despite the coining of the term hospitalist in 1996, specialization in inpatient care existed in various forms long before then.12 The Diagnostic Referral Service (DRS) at Children's Hospital of Pittsburgh (CHP) initially began under the guidance of Dr. Edmund R. McCluskey, chairman of the Department of Pediatrics at CHP, and Dr. Paul C. Gaffney, a beloved and revered clinician and educator. In 1951, Dr. Gaffney joined the full‐time CHP faculty after residency, chief residency, and a year of fellowship, providing his expertise in hematology and oncology. Over time, Dr. Gaffney's role expanded to that of a master physician, and pediatricians and family practitioners in the community began sending their most diagnostically challenging patients to be seen in his clinic. His activities further extended to providing inpatient care and consultations for complex patients.
With these growing responsibilities, Dr. Gaffney formed the DRS as a separate division within the Department of Pediatrics in the mid‐1970s and began developing the division. The group, then and now, is comprised of general pediatricians who provide multidisciplinary care for hospitalized children as well as for ambulatory consultations. The DRS was initially described in the literature 20 years ago; the roles of the 5 full‐time physicians at that time included a variety of clinical, teaching, and scholarly activities, as both inpatient and outpatient consultative physicians.13 Though much growth has occurred within the division since then, Dr. Gaffney's initial goals of providing excellent patient care and education in an academic setting still remain at the heart of each group member.
Growth of the Division
In March 2002, there were 4 full‐time physicians within the DRS. A remarkable increase in the group size has occurred since then, and currently there are 16 physicians. Each member of the division is assigned a specific activity, either outpatient or inpatient, for at least a 5‐day block. This allows the division to provide continuity in the care of complex patients in both settings and help maintain a medical home for these challenging patients. The primary care physician (PCP) remains responsible for primary care of the patient while the DRS can help manage the patient's complexities in the outpatient and inpatient setting. In essence, there is joint patient ownership between the DRS and the PCP, with relegation of different skill sets to provide a complete medical home for the patient.
The current activities of the group are summarized as follows.
Inpatient Activities
Inpatient Care
Corresponding to the growing pediatric hospitalist movement in the past decade, several area PCPs began requesting that their office patients be followed by the DRS when admitted to CHP. In 2003, the DRS physician referral list had 150 physicians, and it currently has over 325 physicians who refer the inpatient care of their patients to the DRS. These practices are located in a variety of locations in Western Pennsylvania, Ohio, and West Virginia. There are only 7 private practices that continue to maintain their admitting privileges to CHP, and these practices account for 0.5% of general pediatric admissions. The remaining admissions (those PCPs not on the DRS referral list or with admitting privileges) are covered by a rotating attending physician; 85% of the time this is a DRS physician. Therefore, while 0.5% of general pediatric admissions are cared for by private pediatricians, >95% of all general pediatric admissions are cared for by DRS, with the remaining patients cared for by a small number of pediatric subspecialists who occasionally serve as rotating attendings.
Associated with the increase in referrals has been a marked increase in inpatient activity (Figures 0, 0, 0, 13). Nearly 1 of every 4 CHP discharges and 1 of every 3 observation patients are cared for by the DRS.
The DRS division has seen an increase in complex inpatient admissions as well as a much larger number of routine pediatric admissions from the community PCP referrals, as described above. Statistically, this has resulted in an overall stable to slightly increased inpatient complexity for the DRS group. During this same time period, there was a steep decrease in DRS inpatient length of stay followed by maintenance at the shorter length of stay thereafter. Inpatient complexity has increased throughout CHP, yet the same decreases in length of stay have not been seen universally in all the divisions (Figure 4). The advantage that a hospitalist group can bring in decreasing length of stay (and, thereby, hospital costs) has been seen in hospitalist programs around the country.6, 7
Each member of the group attends on the general pediatric ward for 9 to 10 months per year as compared to 2 months per year in 1986. In order to prevent job‐related fatigue, 6 to 8 members of the group typically attend on the ward at the same time so that individual patient volume is more manageable. On average, each individual physician is responsible for about 6 to 8 patients per day. This census allows for daily education of residents and medical students as well as faculty participation in a variety of administrative activities. Despite emphasis on careful documentation and billing for both inpatient and ambulatory activities, the division, like most other pediatric hospitalist divisions, depends upon financial support from CHP and the Department of Pediatrics.
There is a wide variety of diagnoses that are seen in the inpatient setting, with notable similarities and differences when compared to 2 decades ago (Table 1). For example, asthma, gastroenteritis, and bronchiolitis continue to be frequent diagnoses, with bronchiolitis admissions becoming more frequent, following national trends.14
| FY 1986 | FY 2007 | ||
|---|---|---|---|
| Rank | Diagnosis | Rank | Diagnosis |
| |||
| 1. | Asthma | 1. | Bronchiolitis |
| 2. | Gastroenteritis | 2. | Asthma |
| 3. | Failure to thrive | 3. | Pneumonia |
| 4. | Seizures | 4. | Dehydration |
| 5. | Bronchiolitis | 5. | Viral enteritis |
| 6. | Pneumonia | 6. | Viral infection, NOS |
| 7. | Suspected sepsis | 7. | Esophageal reflux |
| 8. | Apneic episodes | 8. | Fever |
| 9. | Meningitis | 9. | Cellulitis |
| 10. | Otitis media | 10. | Convulsions |
In general, a DRS faculty member becomes the primary resource for families with medically complex children. The same faculty member tends to follow the patient in the consultative ambulatory clinic, be available for phone calls, and, if possible, follow them as the attending physician when the patient is admitted. This provides a degree of continuity generally not seen in many other hospitalist programs and has the potential to increase patient and physician satisfaction as well as patient safety.
Limited Stay Unit
In addition to general inpatient care, the DRS developed and maintains the Limited Stay Unit (LSU). This unit was specifically created in 2001 to serve patients with uncomplicated diagnoses who are expected to be discharged within 48 hours. Up to 10 short‐stay/observation patients are admitted to this unit each day, with nurses and staff specially prepared to handle rapid patient turnover. A child's eligibility for the unit is determined by the Emergency Department physicians or by phone consultation between the referring physician and the attending LSU physician. The design of the LSU allows for efficient admission and discharges of patients admitted with uncomplicated diagnoses. Each morning, the LSU attending physician, nurse practitioner, and residents discuss each patient with the nursing team and assess discharge readiness. Prescriptions and other discharge paperwork are prepared before morning rounds in order to avoid delays when the child has met criteria for safe discharge. Initial internal data evaluating the efficiency of the LSU demonstrated shorter length of stay for similar diagnoses admitted to the general ward. This difference was not observed in a subsequent study, likely due to CHP initiatives to improve the efficiency of discharge processes throughout the hospital.
Inpatient Consultations
The DRS serves as the inpatient pediatric consultant for the medical and surgical subspecialties. In 2007, the division saw 292 inpatient consultations. Many of the consultations originate from the surgical subspecialties (eg, a consult from neurosurgery for vomiting in a child with a functioning ventriculoperitoneal shunt). Other consultations come from pediatric subspecialties (eg, a patient with a congenital heart defect managed by the pediatric cardiology service with recurrent aspiration pneumonia of unclear etiology). The consultation process begins with the primary service discussing the patient with a senior resident who performs the initial history and physical, formulates an assessment and recommendations, and discusses the case with the DRS physician. Any necessary changes to the recommendations are made and relayed to the primary service. In addition, the DRS consults on known chronically ill patients in the intensive care unit (ICU), providing support to the family, nuances of chronic care to the ICU team, and continuity of care when the patient is transferred to the general ward.
Evening Hospitalist Program
In September 2005, the DRS began to provide extended in‐house attending coverage until midnight on weekdays and 10 PM on weekends. The evening hospitalist (EH) not only sees the new DRS admissions during the evening but also is available for formal consultations from subspecialty services and informal consultations from house staff. The EH is responsible for resident and medical student education (including direct observation of history taking and physical exam skills), facilitation of early discharges for the following morning, and enhancement of patient safety. The EH is also a part of the Condition Help team,15 a novel patient safety initiative discussed below.
The EH program benefits patients and DRS members alike. Other members of the group are able to assume care of patients in the morning for whom the diagnostic evaluation has already been initiated by the EH. Therefore, definitive plans are in place earlier, and many laboratory tests, radiographs, and other tests have returned by the time the daytime attending sees the patient.
The EH program was structured to enhance patient care and resident supervision while avoiding scheduling that could adversely affect job sustainability and retention. As currently structured, the EH program offers numerous advantages over 24‐hour, 7‐days‐per‐week coverage. First, resident autonomy is crucial during their training.16 One significant early concern was that extending the hours of attending physician coverage could diminish this autonomy. To prevent this from occurring, the EH allows the senior residents to take ownership of patient care and provide the initial teaching and instructions to interns, students, and families before the EH becomes involved. This structure of the EH program enhances the development of resident autonomy, yet provides support for the residents either by the EH or on‐call attending through all hours of the night. Second, the senior residents meet with members of DRS each morning to discuss their decision‐making process for overnight admissions that arrive after the EH shift has ended. This allows analysis of house staff thought processes and discussion of considered alternatives. Third, with the recent resident work‐hour restrictions, several residency programs have moved to either daytime or nighttime shift‐based work for the residents. Therefore, having the same EH working each day for the week allows for more accurate assessment of the nighttime residents than scattered 24‐hour attending shifts. Fourth, evening coverage allows for simpler scheduling and a less disruptive sleep cycle for the EH than 24‐hour coverage could allow. Finally, the EH is able to transition to typical daytime hours following a week of evening shifts, which helps to enhance EH retention by providing opportunities for academic endeavors and peer interactions.
The Children's Home
Since August 2007, the DRS has provided inpatient care for children admitted to The Children's Home of Pittsburgh and Lemieux Family Center (TCH). This independent facility is administratively and geographically separate from CHP. The DRS manages a 6‐bed unit that specializes in transitional pediatric care and serves technology‐dependent infants and children in a family‐centered, home‐like environment. In general, patients who require these services are seen at CHP initially, medically stabilized, and then transferred to TCH to continue their care. There is 1 DRS physician assigned each week to providing care for these patients. Examples of patient problems cared for at this facility include feeding issues, long term intravenous (IV) antibiotic treatment (eg, neonates recovering from sepsis, meningitis, osteomyelitis), and family education for technology‐dependent children (eg, new tracheostomy or ostomy). The average length of stay is 10.2 days, which decreases CHP length of stay and promotes CHP savings during periods of high census.
Outpatient Activities
Outpatient Care
Many physicians in community clinics have large daily patient volumes, seeing upward of 30 to 40 patients per day. These added outpatient responsibilities can lead to decreased time available for a PCP to round on inpatients (hence, the nationwide growth of hospitalists).17 Additionally, this increased practice intensity may lead to less time to manage individual patients in the primary care setting.18
The pediatric patient has become significantly more complex, likely due to increased survival of patients with chronic medical problems.19 This is also evidenced at CHP by steadily increasing patient acuity scores (Figure 4). With this growing complexity, effective outpatient care in a standard 15‐minute to 20‐minute patient visit20 is difficult, especially given the AAP recommendations of providing an effective medical home for every patient.2 Since its inception, the DRS has provided ambulatory consultative services for the community. Sixty percent of the 1400 to 1900 patients seen each year are new patient referrals. The outpatient clinic activity has been essentially stable over the past several years (Figure 1), likely due to increased access to CHP subspecialty clinics and overall increased manpower in the Department of Pediatrics. A wide variety of diagnoses are made in the outpatient clinic (Table 2).
| Rank | Diagnosis |
|---|---|
| |
| 1. | Failure to thrive, poor weight gain, weight loss |
| 2. | Abdominal pain |
| 3. | Fever |
| 4. | Chronic fatigue |
| 5. | Syncope |
| 6. | Gastroesophageal reflux |
| 7. | Chest pain |
| 8. | Developmental delay |
| 9. | Headache |
| 10. | Coordination of care |
The DRS provides long‐term, multidisciplinary continuity of care for medically complex children. The child is seen by the same DRS physician during each clinic visit. If the patient is admitted to the hospital, every effort is made for the patient to be seen by the DRS physician who saw the patient in the clinic setting. This process allows for medically complex children to have the coordinated care that can be difficult to achieve if a different hospitalist physician is responsible for their care during each admission.
The DRS works closely with the PCP to augment continuity of care while the PCP continues to provide primary care services. This provides the PCP with assurance that the patient will remain in their practice while the patient's multiple medical needs are addressed by the DRS. In this manner, a complete medical home can be provided. Insurance companies have recognized members of the DRS to be specialists in general pediatric care and permit DRS faculty to bill as specialists.
Education
Teaching is a major role for the DRS, and the division is closely involved in leadership in medical education. Two members are directors of the pediatric physical exam course for first‐year and second‐year medical students, 2 members are the third‐year medical school Pediatric clerkship directors, 1 member is co‐director for the fourth‐year acting internship, 1 member is co‐director of the advanced pediatric interviewing program, 1 member is director of the pediatric medical education program, and 1 member is associate residency program director.
The entire group is involved with teaching at all of these levels. The majority of the group is involved with formal mentoring and advising of residents and medical students. The only general pediatric aspect of student and resident medical education in which the DRS is no longer involved is ambulatory pediatric medicine. The full‐time ambulatory faculty is responsible for the primary ambulatory care experience. However, many residents choose to complete an elective in DRS, including the outpatient clinic, to become exposed to the different diagnostic dilemmas and coordination of care visits that they may not see in their primary care continuity clinics.
The division always welcomes new teaching challenges and incorporates new methods of teaching as opportunities arise. For example, the recent family‐centered rounds initiative allowed for new teaching methods that were not previously possible. The team, comprised of a senior resident, 2 interns, 2 students, and an attending physician rounds at the bedside with permission from the parent. The patient's nurse, when available, and a pharmacist are often a part of the team. The case is presented by the student or intern (directed to the parent), and the case is discussed and clarified for the family. A plan for the day is presented and discussed with the family for approval. Through family‐centered rounds, the DRS attending provides patient specific teaching and role modeling during rounds that would not otherwise have been possible with classical didactic teaching. This method of daily rounding also allows for the patients, families, nurses, nursing students, medical students, and residents to be taught by the attending physician simultaneously. Additionally, it affords the nurses the opportunity to participate in medical decision‐making, and the house staff have perceived fewer pages by the nurses to clarify clinical issues.
The EH program also provided new teaching opportunities. Through the EH, the house staff and students are exposed to direct attending teaching in the evenings that otherwise would not occur, such as direct observation of student and resident histories and physical examinations. Based on resident evaluations and comments to the residency program directors, this teaching experience is deemed to be valuable and effective. In fact, since the EH program's inception 3 years ago, 2 EHs have been selected by the residents as Teacher of the Year.
Patient Safety
Patient safety and reduction of medical errors is a major focus of the entire group. One DRS member serves within the hospital administration as Medical Director for Clinical Excellence and Service to enhance patient safety hospital‐wide. One DRS member orchestrates a monthly house staff meeting entitled To Err is Human which provides a nonthreatening environment for residents to discuss medical errors or difficult situations that they have encountered. Two DRS members are part of the Physician Advisory Committee, which serves as a bridge between the information technology group and clinicians. This committee has aided in achieving a smooth transition to a completely electronic medical record (EMR) and works together to use the tools of an EMR to enhance patient safety. This successful EMR implementation was recognized by the Health Information Management Systems Society in October 2008. Additionally, stemming from several successful patient safety initiatives, CHP was 1 of only 7 children's hospitals recognized for patient safety in 2008 by Leapfrog, the nation's premier patient safety evaluation group.
Condition HELP
In February 2001, the death of 18‐month‐old Josie King at a leading children's hospital brought medical errors to the national forefront.21 In response to this tragedy, several hospitals in the University of Pittsburgh system began to implement a program called Condition HELP.22 Condition HELP gives parents the ability to have their child evaluated by a special medical team if they feel their child's immediate health is in danger or their concerns are not being addressed. In 2005, CHP was one of the first hospitals in the country to implement this type of system. The Condition HELP team consists of a physician, a nursing supervisor, and a patient advocate. During the evening hours, the DRS EH also participates in the calls. The team discusses the family's concern and, with the patient's attending physician, generates a plan of action to help remedy the issue. Usually within 5 days, each call is intensively reviewed for events leading up to the Condition HELP as part of the CHP's patient safety initiative. From September 2005 through August 2007, the CHP Condition HELP team responded to 42 calls from patients and parents, with the most issues found to be related to communication breakdown between caregivers and families. The involvement of this team helped to identify the root cause of the parent or patient's concern and implement measures to help to rectify the issue and increase patient safety.15
Scholarly Activity
Previously, the DRS was responsible for the general medical care of liver transplant recipients, and many prior publications from the division focused on these patients.13 The division no longer provides that service, and the current focus of scholarly activity is publication of case reports, book chapters, and review articles. There were 13 publications from the division members in the past 3 years. The group also serves as a major resource within the department by referring patients that fulfill the clinical criteria for ongoing clinical studies in other divisions.
One member of the group continues to serve as senior editor of the Atlas of Pediatric Physical Diagnosis, which is currently in its fifth edition. Several members of the group contribute chapters to this well‐known text. One member is an editor and another is a specialty reviewer for
At the University of Pittsburgh, both tenured and nontenured faculty promotions carry the same title without a prefix. Academic promotions for clinician‐educators center around clinical excellence and innovation in education. The 3 senior members of the group have been promoted to professor (1 tenured, 2 nontenured), and 2 other members are currently in consideration for promotion to associate professor. Two members of the group have been elected to the School of Medicine Academy of Master Educators, which recognizes and rewards excellence in education.
Future Goals
Future goals include expansion and refinement of the division's current inpatient and ambulatory activities. The group increased in size to 16 physicians in July 2008 due to the increased inpatient volume and growing demand for outpatient referrals. The family‐centered rounds initiative will continue to be refined to provide the best possible service to the patients and their families. The members of the group will have increased activity and involvement at the regional and national level with the growing pediatric hospitalist movement.
A pediatric hospitalist fellowship program certainly would be feasible in the current environment. At this writing, there are only 8 pediatric hospitalist fellowship programs nationwide. The outpatient/emnpatient environment that the DRS provides the community would certainly provide a unique training environment for a hospitalist fellowship. The diversity in hospitalist divisions nationwide and the standardization of fellowship training is an important task for the future.23
Discussion
Pediatrics has undergone major changes since the original description of the DRS 20 years ago.7 These changes have revolutionized the practice of pediatrics in both the ambulatory and inpatient settings. The DRS role has changed significantly along with the national trends in pediatric hospitalist growth over the past decade. Currently, 90% of the division's clinical activity is inpatient care. In essence, this is an extension of the original consultant role, but the model has been extended to provide inpatient multidisciplinary care for pediatric patients.
Despite the remarkable growth in inpatient activity, 1 unique advantage to the DRS model is maintenance of an active outpatient consultation clinic focused on providing a multidisciplinary medical home for chronically ill patients. DRS faculty are able to coordinate the care of these complex patients while not usurping the primary care responsibility of the community physician. The same faculty are able to extend the continuity of care to the inpatient setting should the patient require admission.
There have been several innovations that the DRS has implemented over the past decade. The LSU was designed to provide effective and efficient care. The EH program extends attending in‐house coverage without the disadvantages of 24‐hour, 7‐day‐per‐week coverage. Expanding services to include The Children's Home allows for easier transition to home for technology‐dependent patients and families. At the same time, DRS continues to strive for innovative clinical leadership as well as creative and effective student and resident education.
Conclusion
Despite the remarkable growth and increased clinical activity of the DRS since its inception, Dr. Gaffney's ideals continue to serve as the lifeline for the division. The DRS still maintains the consultative pediatric role that he originated, but the inpatient activity has grown with the pediatric hospitalist movement at the same time. The division also maintains an active outpatient clinic. This dual function allows the DRS to continue to serve the community in a unique manner.
- American Academy of Pediatrics.Ad hoc task force on definition of the medical home, the medical home.Pediatrics.1992;90:774.
- American Academy of Pediatrics.Medical Home Initiatives for Children with Special Needs Project Advisory Committee, The Medical Home.Pediatrics.2002;110:184–186.
- ,.The emerging role of “hospitalists” in the American health care system.N Engl J Med.1996;335:514–517.
- Society of Hospital Medicine. Home. Available at http://www.hospitalmedicine.org. Accessed June 2009.
- ,,, et al.The role of “hospitalists” in the health care system.N Engl J Med.1997;336:444–446.
- ,,,,,.Restructuring an academic pediatric inpatient service using concepts developed by hospitalists.Clin Pediatr.2001;40:653–660.
- ,,,.Evaluation of a staff‐only hospitalist system in a tertiary care, academic children's hospital.Pediatrics.2004;114:1545–1549.
- ,,, et al.Impact of a hospitalist system on length of stay and cost for children with common conditions.Pediatrics.2007;120:267–274.
- ,,,.Pediatric hospitalists: a systematic review of the literature.Pediatrics.2006;117:1736–1744.
- ,.Evaluation of a pediatric hospitalist service: impact on length of stay and hospital charges.Pediatrics.2000;105:478–484.
- ,,,,,.Variations in management of common inpatient pediatric illnesses: hospitalists and community pediatricians.Pediatrics.2006;118:441–447.
- American Academy of Pediatrics.Section on Hospital Medicine. Guiding principles for pediatric hospitalist programs.Pediatrics.2005;115:1101–1102.
- ,,,,.Consultative pediatrics: a role for the generalist in an academic setting.J Pediatr.1988;112:1035–1038.
- ,,,,,.Bronchiolitis‐associated hospitalizations among U.S. children, 1980–1996.JAMA.1999:282:1440–1446.
- ,,,,,.Condition HELP: a pediatric rapid response team triggered by patients and parents.J Healthc Qual.2008;30:28–31.
- ,,,,,.Effect of a pediatric hospitalist system on housestaff education and experience.Arch Pediatr Adolesc Med.2002;156:877–883.
- .Clinical and behavioral adaptation to managed care: stepwise suggestions for survival.Pediatrics.1995;96:821–824.
- ,,,,,.Gatekeeping and referral of children and adolescents to specialty care.Pediatrics.1999;104:28–34.
- (Chair, AAP Council on Children with Disabilities). Written Statement on Behalf of the American Academy of Pediatrics: Presented to the Institute of Medicine Committee on Disability in America. January 9,2006. Available at: http://www.aap.org/advocacy/washing/Testimonies‐Statements‐Petitions/IOM_testimony.pdf. Accessed June 2009.
- ,,, et al.The duration of ambulatory visits to physicians.J Fam Pract.1999;48:264–271.
- .Systemic errors continue to plague many hospitals.Pittsburgh Post‐Gazette.2004 Dec 5: Sect. Living.
- Josie King Foundation: Creating a Culture of Patient Safety, Together. Available at http://www.josieking.org. Accessed June 2009.
- .Hospitalist fellowships: pro and con.Section on Hospital Medicine News.2006;1:7,9. Available at: https://www.aap.org/sections/hospcare/SOHMwinter06news.pdf. Accessed June 2009.

VTE Prevention in VA Hospitals
Pulmonary embolism (PE) is the most common preventable cause of death in hospitals,1 accounting for approximately 10% of hospital deaths. Most cases of PE result from dislodged lower extremity thrombi, so that deep vein thrombosis (DVT) and PE are manifestations of the same disorder, venous thromboembolism (VTE). Even though the majority of hospitalized patients are at increased risk for VTE and proven preventive measures have long been available, most patients do not receive appropriate care.2
Recent surgery is a well‐recognized risk factor for VTE, and surgeons have prescribed prophylactic therapies more consistently than other specialists.3 At the same time, prevention of VTE among hospitalized medical patients has been neglected.4 The American College of Chest Physicians recommends pharmacologic VTE prevention for most acutely ill medical patients, and advises prevention using mechanical devices when pharmacologic intervention is contraindicated.1
In Department of Veterans Affairs (VA) hospitals, compliance with preventive guidelines in surgical patients has been high. During October through December 2007, according to the Office of Quality and Performance, Veterans Health Administration, the national average for administration of VTE prophylaxis within 24 hours of surgery in VA hospitals was 92%. No comparable systemwide performance measure has been applied for medical patients, but an assessment involving intensive care unit patients has been completed and plans are underway for an evaluation of anticoagulant use among all inpatients considered to be at increased risk.
We sought to determine the extent to which hospitalized VA medical patients receive VTE preventive care in accordance with evidence‐based recommendations. Because quality of care may vary in hospitals based on teaching status,5 a secondary goal was to ascertain whether teaching and nonteaching facilities differ with respect to the delivery of care for VTE prevention.
Patient Populations Methods
We examined compliance with accepted VTE clinical practice guidelines in 2 patient populations. First, the care of patients at risk for developing VTE was evaluated for evidence of appropriate preventive measures. Second, the care of patients who developed PE while hospitalized was evaluated for evidence of preventive therapy prior to the event.
We identified patients discharged from VA acute care hospitals during the period April 1, 2006 to March 31, 2007, excluding patients hospitalized for less than 48 hours. We also excluded hospitalizations of VA patients at military and private hospitals because oversight of the quality of care provided at those facilities is beyond the purview of the Inspector General.
We then defined 2 distinct populations:
Medical patients at increased risk for VTE. These patients were identified by: (1) age 75 years at the time of admission; and (2) hospitalization with a principal discharge diagnosis of heart failure (International Classification of Diseases, 9th edition [ICD‐9] code 428). Elderly heart failure patients were chosen because advanced age and heart failure are recognized VTE risk factors, medical inpatients have been identified as being neglected in hospital VTE prevention efforts, and the VA was conducting no systemwide assessment of this aspect of care.
Patients with established PE. These patients had any discharge diagnosis pulmonary embolism and infarction (ICD‐9 codes 415.1 or 415.19), but those with the diagnostic code personal history of venous thrombosis and embolism (V12.51) were excluded.
Within each population, the discharge date defined an index hospitalization for evaluation. For patients discharged more than once with a qualifying diagnosis during the study period, we analyzed only the most recent hospitalization.
Characterization of Facilities
Hospitals were considered teaching hospitals if they were members of the Association of American Medical Colleges' Council of Teaching Hospitals and Health Systems (COTH).6 When COTH membership was through a Veterans Integrated Service Network, hospitals were judged to be teaching hospitals if they had 1 or more close university affiliations and/or management of medical inpatients by house staff.
Patient Selection and Medical Record Review
In order to ensure optimal representation of teaching and nonteaching hospitals, we stratified patients with increased VTE risk and those with diagnosed PE according to hospital teaching status, thereby creating 4 groups:
Patients at increased risk for VTEteaching hospitals;
Patients at increased risk for VTEnonteaching hospitals;
PE patientsteaching hospitals;
PE patientsnonteaching hospitals.
Within each group we assigned a random number to each patient, ordered the patients by random number, and selected patients sequentially until 50 patients were identified or no further eligible patients were available. For the heart failure patients, we assumed that all were at risk for VTE and required prophylaxis. For the group of patients with established PE, we excluded patients if the diagnosis was made prior to admission or in the first 2 hospital days, if there were no acute signs and symptoms and the diagnosis was chronic PE, or if there were no imaging studies or postmortem findings in support of the diagnosis.
In both groups, we assessed patients' records for VTE risk factors, evidence of preventive care, and contraindications.7 We considered pertinent VTE risk factors to be those included with published guidelines.1 In the care of patients with established PE, designation of adequate prophylactic therapy required at least 24 hours of treatment prior to diagnosis.
Appropriate VTE prophylaxis was defined as anticoagulant medications or, in the case of contraindications to anticoagulation, mechanical compression devices applied to the lower extremities with or without antiembolism stockings. Any administration of warfarin, lowmolecular‐weight heparin, or heparin by infusion, was considered adequate. Prophylaxis with subcutaneous unfractionated heparin was considered adequate only if at least 5000 units was administered 3 times daily.8 Aspirin and other antiplatelet agents were not considered to be anticoagulants.
We characterized hospitalizations of at‐risk individuals as missed opportunities for prevention if there were no contraindications to treatment and no evidence that adequate prophylactic therapy was provided.
Data Analysis
To determine sample size for each of the 2 study populations, we assumed the baseline rate of compliance with recommendations for VTE prophylaxis among medical inpatients to be 0.4 to 0.5.4 We further assumed that an observed compliance rate of 0.7 would be indicative of an important difference compared with published results (rate difference, 0.2‐0.3). With a Type 1 (alpha) error of 0.025 (1‐tailed), approximately 90 patients are required for a 0.9 probability of detecting a difference of at least 0.25.9
Comparisons between teaching and nonteaching hospitals were analyzed using chi‐square tests. Confidence intervals for estimates of overall compliance were calculated using a normal approximation to the binomial distribution.10
Results
Medical Patients at Increased Risk for VTE
We identified 4963 patients age 75 and older discharged after at least 2 days of acute hospitalization for heart failure: 3437 from 73 teaching hospitals and 1526 from 58 nonteaching hospitals. The 100 patients randomly selected for review ranged in age from 75 to 94 (median, 82) and had hospitalizations of 3 to 41 days (median, 6). Ninety‐eight were male. In this group of patients, we found 63 with evidence of adequate pharmacologic VTE prevention and 37 for which opportunities for prevention were not realized. At teaching hospitals, anticoagulation was effected with warfarin (13 cases), heparin (11), and enoxaparin (10). At nonteaching hospitals anticoagulants included warfarin (16), enoxaparin (11), and heparin (2). Twenty‐nine of the 63 patients who received anticoagulation (46%) were admitted while taking warfarin for chronic conditions. Teaching and nonteaching hospitals did not differ with respect to missed opportunities for prevention of VTE (37% in each group; Table 1).
| Hospital Type | |||
|---|---|---|---|
| Total | Teaching | Nonteaching | |
| |||
| Number of patients | 4963 | 3437 | 1526 |
| Randomly selected patients at risk | 100 | 54 | 46 |
| Received prophylactic anticoagulation | 63 | 34 | 29 |
| Missed opportunities for prevention | 37 | 20 | 17 |
| Percent (95% confidence interval) | 37 (27‐47) | 37 (23‐51) | 37 (22‐52) |
Patients With Established PE
We identified 1448 acute hospitalizations of at least 2 days duration for patients with PE, 1118 from 72 teaching hospitals and 330 from 51 nonteaching hospitals. We reviewed 779 medical records, 449 (40.2%) teaching cases and all 330 nonteaching cases. Chart review was completed after all nonteaching cases had been reviewed. In only 8.2% (64) of reviewed cases was the diagnosis of acute PE made after the first 2 hospital days and with accompanying objective evidence of VTE. Most cases (698; 89.6%) were excluded because there was only a remote history of PE or the diagnosis was made prior to admission. Additional cases (17; 2.2%) were excluded because the diagnosis was made during the first 2 hospital days; there were no acute signs and symptoms and the diagnosis was chronic PE; or there was no confirmation by computed tomography or ventilation‐perfusion scans, lower extremity ultrasonography in the setting of consistent clinical findings, or autopsy.
The 64 patients with confirmed in‐hospital PE ranged in age from 44 to 85 years (median, 65) and had hospitalizations of 4 to 53 days (median, 16). Sixty‐three were male. One of these patients had no definite risk factors for VTE and was ambulatory when acute symptoms occurred. Among the 63 patients who had unequivocal VTE risk factors, 34 (54%) received appropriate prophylactic treatment, and 29 (46%) received inadequate or no preventive therapy (Table 2). There was no significant difference between teaching and nonteaching hospitals with respect to missed opportunities for prevention (49% vs. 35%; P 0.3).
| Hospital Type | |||
|---|---|---|---|
| Total | Teaching | Nonteaching | |
| |||
| Number of patients | 1448 | 1118 | 330 |
| Randomly selected patients | 779 | 449 | 330 |
| Documented in‐hospital pulmonary embolism | 64 | 47 | 17 |
| No definite VTE risk factors | 1 | 0 | 1 |
| Received prophylactic anticoagulation | 30 | 20 | 10 |
| Anticoagulation contraindicated, received mechanical prophylaxis | 4 | 4 | 0 |
| Missed opportunities for prevention | 29 | 23 | 6 |
| Percent (95% confidence interval) | 45 (32‐58) | 49 (30‐68) | 35 (12‐58) |
Anticoagulants used at teaching hospitals included heparin (15 cases), enoxaparin (4), and warfarin (1), while at nonteaching hospitals enoxaparin (7) and heparin (3) were used.
Each of the 10 patients who received no anticoagulation had the VTE risk factor of recent immobility prior to PE. Nine of the 10 had active malignancies, and 4 of these had undergone recent surgery. None had evidence of hypercoagulable states (factor V Leiden, lupus anticoagulant, or anticardiolipin antibodies). Five of the 10 patients died in the year following pulmonary embolism, 3 prior to discharge or within 2 weeks of discharge.
Missed Opportunities for Prevention
Among the 66 patients whose hospitalizations were characterized as missed opportunities for prevention, 30 received no pharmacologic VTE prevention despite having no contraindications. Seven patients had contraindications to pharmacologic prophylaxis, but none of these patients had contraindications to mechanical prophylaxis. An additional 18 patients received mechanical prophylaxis only despite having no contraindications to anticoagulation. Eleven patients received inadequate heparin regimens with or without mechanical prophylaxis (Table 3).
| Hospital Type | |||
|---|---|---|---|
| Total | Teaching | Nonteaching | |
| Number of patients | 66 | 43 | 23 |
| No contraindications, no prophylaxis | 30 | 18 | 12 |
| Anticoagulation contraindicated, no mechanical prophylaxis | 7 | 3 | 4 |
| No contraindication to anticoagulation, mechanical prophylaxis only | 18 | 13 | 5 |
| Inadequate heparin regimen, no mechanical prophylaxis | 9 | 7 | 2 |
| Inadequate heparin regimen, mechanical prophylaxis | 2 | 2 | 0 |
Discussion
Based on a random sample of 4963 elderly heart failure patients admitted to VA hospitals during a 1‐year period, we estimated that 63% received recommended interventions aimed at preventing VTE. Although differences in methodology limit comparisons with published reports, this rate is similar to those observed at individual hospitals,1113 in large multicenter registries of patients with DVT or at risk for VTE,14, 15 and in a recent multinational cross‐sectional study.16 Notably, chronic outpatient anticoagulation that was continued during hospitalization accounted for nearly one‐half of patients receiving preventive care. Compliance did not differ between teaching and nonteaching hospitals.
In a complementary approach to examining the extent of preventive care, we identified 1448 patients discharged with a diagnosis of PE. Most of these patients were excluded because they did not have a new event while hospitalized. Eleven (17%) of the 64 patients with confirmed in‐hospital PE received no preventive care before the event. An additional 18 (28%) received suboptimal heparin regimens or mechanical prophylaxis in the absence of contraindications to anticoagulation. As with the patients at risk for VTE, patients with established PE at teaching and nonteaching hospitals received similar rates of preventive care. Contrary to our expectation, the observed difference in rates between types of hospitals favored nonteaching hospitals. However, the sample size for this comparison was small and the difference did not reach statistical significance.
This study's population‐based approach permits conclusions about the performance of the VA's entire system of acute care hospitals. The results indicate that proven preventive therapies are often neglected at VA hospitals, but overall performance is probably comparable to other settings. VA employs an extensively implemented electronic medical record (EMR) and superior performance might have been expected. However, these results suggest limitations in the EMR as it is currently deployed. Successful efforts probably require a multifaceted approach incorporating decision support and institutional standardization.17
Several additional findings warrant comment. Patients with malignancies accounted for 9 of 10 patients who had PE after receiving no prior anticoagulation. Recent surgery was also a contributing factor for 4 of these cancer patients. Although both cancer and surgery are well‐known risk VTE factors, clinicians may not appreciate the extremely high risk associated with the combination.18 Particular effort may be warranted to ensure prophylaxis in this group, and more intensive measures may be necessary.
These results reveal several barriers to the accurate retrospective measurement of preventable inpatient PE. First, the use of discharge diagnoses to monitor the occurrence of inpatient PE is fraught with hazard. In this study, even after excluding patients with a discharge diagnostic code indicating a past history of PE, very few identified patients in fact had an acute or recent event. In addition, many patients were clearly admitted after having the onset of symptoms as outpatients. Further, reliance on discharge diagnoses alone can lead to the inclusion of patients with a presumptive diagnosis made without the advantage of imaging studies or postmortem examination. Although we overcame these barriers through careful record review and strict diagnostic criteria, our results suggest that efficient performance improvement efforts may require ongoing concurrent review.
There are several limitations of this study. First, we excluded PE patients whose diagnoses were made before the third hospital day. Some of these patients may have had events attributable to recent prior hospitalizations and should have received VTE prophylaxis. Second, we considered preventive measures applied at least 24 hours prior to PE to be acceptable evidence of prevention, potentially neglecting prior periods without treatment that might confer increased risk. Bias due to either of these limitations could exaggerate the compliance rates we report. Finally, the retrospective design of this study did not allow for consistent assessments of whether patients had the risk factor of immobility. Nevertheless, immobility was obvious for the 10 patients with PE who had no prior anticoagulation, all of whom had 2 or more risk factors.
Despite an acknowledged need for improvements in clinical practice, past efforts have had mixed results. For instance, in 1 study at a hospital with a well‐established EMR, computer alerts led to substantial improvement in the use of preventive measures and in VTE outcomes, but overall compliance remained low.19 On the other hand, a multidisciplinary approach can achieve marked reductions in preventable VTE events.20 Key elements of such an approach are a simplified risk assessment tool and concurrent monitoring of patient treatments and outcomes. The Agency for Healthcare Research and Quality has recently published a guide that outlines strategies for achieving breakthrough levels of improvement in the prevention of VTE.21
In conclusion, this population‐based study of hospitalized veterans with PE or at risk for VTE found compliance comparable to rates in published reports. Missed opportunities for prevention included inappropriate and inadequate interventions. Using discharge diagnoses to monitor the occurrence of inpatient PE is of limited value, and efficient performance improvement efforts may require ongoing concurrent review.
Acknowledgements
The authors thank Greg Maynard, MD, MS for advice on study design, and Deborah Howard, RN, for assistance with medical record review.
- ,,.Prevention of venous thromboembolism. The Seventh ACCP Conference on Antithrombotic and Thrombolytic Therapy.Chest.2004;126:338S–400S.
- ,,,.Thromboprophylaxis rates in US medical centers: success or failure?J Thromb Haemost.2007;5:1610–1616.
- .Preventing venous thromboembolism in surgical patients.Cleve Clin J Med.2006;73:S88–S94.
- ,.Prevention of venous thromboembolism among hospitalized medical patients.Circulation.2005;111:e1–e3.
- ,,.Quality of care for the treatment of acute medical conditions in US hospitals.Arch Intern Med.2006;166:2511–2517.
- Association of American Medical Colleges (AAMC). Council of Teaching Hospitals and Health Systems (COTH). Available at: http://www.aamc. org/members/coth. Accessed August2009.
- Contraindications are those described in the Institute for Clinical Systems Improvement Health Care Guideline: Venous Thromboembolism Prophylaxis. 4th ed. June 2007, pp 13–14. Available at: http://www. icsi.org/guidelines_and_more/gl_os_prot/cardiovascular/venous_thromboem bolism_prophylaxis/venous_thromboembolism_prophylaxis_5.html. Accessed August2009.
- ,,, et al.Prevention and treatment of venous thromboembolism. International Consensus Statement.Int Angiol.2006;25:101–161.
- ,.Designing Clinical Research.Baltimore, MD:Williams 1988.
- ,,. Statistical Methods for Rates and Proportions.3rd ed.Hoboken, NJ:Wiley‐Interscience;2003;28,54.
- ,,.New onset of venous thromboembolism among hospitalized patients at Brigham and Women's Hospital is caused more often by prophylaxis failure than by withholding treatment.Chest.2000;118;1680–1684.
- ,,.Prophylaxis against venous thromboembolism in acutely ill medical patients: an observational study.Pharmacotherapy.2006;26:1086–1090.
- ,,.Hospital‐acquired venous thromboembolism and prophylaxis in an integrated hospital delivery system.J Clin Pharm Ther.2006;31:455–459.
- ,;DVT FREE Steering Committee.A prospective study of 5,451 patients with ultrasound‐confirmed deep vein thrombosis.Am J Cardiol.2004;15:259–262.
- ,,, et al.Venous thromboembolism prophylaxis in acutely ill hospitalized medical patients: findings from the International Medical Prevention Registry on Venous Thromboembolism.Chest.2007;132:936–945.
- ,,, et al.Venous thromboembolism risk and prophylaxis in the acute hospital care setting.Lancet.2008;371:387–394.
- .Medical admission order sets to improve deep vein thrombosis prevention: a model for others or a prescription for mediocrity?J Hosp Med.2009;4:77–80.
- ,,,,,.Prevention of venous thromboembolism in the cancer surgery patient.Cleve Clin J Med.2008;75(suppl 3):S17–S26.
- ,,, et al.Electronic alerts for hospitalized high‐VTE risk patients not receiving prophylaxis: a cohort study.J Thromb Thrombolysis.2008;25:146–150.
- ,,, et al. Prevention of hospital‐acquired venous thromboembolism: prospective validation of a VTE risk assessment model and protocol. Society of Hospital Medicine 2008 National Meeting. Electronic citation abstract #52, page 29. Available at: http://www.hospital medicine.org/Paperless2008/PDFs/Additional_Info/SHM08_Abstracts.pdf. Accessed August2009
- ,.Preventing Hospital‐Acquired Venous Thromboembolism: A Guide for Effective Quality Improvement. AHRQ Publication No. 08–0075.Rockville, MD:Agency for Healthcare Research and Quality;2008.
Pulmonary embolism (PE) is the most common preventable cause of death in hospitals,1 accounting for approximately 10% of hospital deaths. Most cases of PE result from dislodged lower extremity thrombi, so that deep vein thrombosis (DVT) and PE are manifestations of the same disorder, venous thromboembolism (VTE). Even though the majority of hospitalized patients are at increased risk for VTE and proven preventive measures have long been available, most patients do not receive appropriate care.2
Recent surgery is a well‐recognized risk factor for VTE, and surgeons have prescribed prophylactic therapies more consistently than other specialists.3 At the same time, prevention of VTE among hospitalized medical patients has been neglected.4 The American College of Chest Physicians recommends pharmacologic VTE prevention for most acutely ill medical patients, and advises prevention using mechanical devices when pharmacologic intervention is contraindicated.1
In Department of Veterans Affairs (VA) hospitals, compliance with preventive guidelines in surgical patients has been high. During October through December 2007, according to the Office of Quality and Performance, Veterans Health Administration, the national average for administration of VTE prophylaxis within 24 hours of surgery in VA hospitals was 92%. No comparable systemwide performance measure has been applied for medical patients, but an assessment involving intensive care unit patients has been completed and plans are underway for an evaluation of anticoagulant use among all inpatients considered to be at increased risk.
We sought to determine the extent to which hospitalized VA medical patients receive VTE preventive care in accordance with evidence‐based recommendations. Because quality of care may vary in hospitals based on teaching status,5 a secondary goal was to ascertain whether teaching and nonteaching facilities differ with respect to the delivery of care for VTE prevention.
Patient Populations Methods
We examined compliance with accepted VTE clinical practice guidelines in 2 patient populations. First, the care of patients at risk for developing VTE was evaluated for evidence of appropriate preventive measures. Second, the care of patients who developed PE while hospitalized was evaluated for evidence of preventive therapy prior to the event.
We identified patients discharged from VA acute care hospitals during the period April 1, 2006 to March 31, 2007, excluding patients hospitalized for less than 48 hours. We also excluded hospitalizations of VA patients at military and private hospitals because oversight of the quality of care provided at those facilities is beyond the purview of the Inspector General.
We then defined 2 distinct populations:
Medical patients at increased risk for VTE. These patients were identified by: (1) age 75 years at the time of admission; and (2) hospitalization with a principal discharge diagnosis of heart failure (International Classification of Diseases, 9th edition [ICD‐9] code 428). Elderly heart failure patients were chosen because advanced age and heart failure are recognized VTE risk factors, medical inpatients have been identified as being neglected in hospital VTE prevention efforts, and the VA was conducting no systemwide assessment of this aspect of care.
Patients with established PE. These patients had any discharge diagnosis pulmonary embolism and infarction (ICD‐9 codes 415.1 or 415.19), but those with the diagnostic code personal history of venous thrombosis and embolism (V12.51) were excluded.
Within each population, the discharge date defined an index hospitalization for evaluation. For patients discharged more than once with a qualifying diagnosis during the study period, we analyzed only the most recent hospitalization.
Characterization of Facilities
Hospitals were considered teaching hospitals if they were members of the Association of American Medical Colleges' Council of Teaching Hospitals and Health Systems (COTH).6 When COTH membership was through a Veterans Integrated Service Network, hospitals were judged to be teaching hospitals if they had 1 or more close university affiliations and/or management of medical inpatients by house staff.
Patient Selection and Medical Record Review
In order to ensure optimal representation of teaching and nonteaching hospitals, we stratified patients with increased VTE risk and those with diagnosed PE according to hospital teaching status, thereby creating 4 groups:
Patients at increased risk for VTEteaching hospitals;
Patients at increased risk for VTEnonteaching hospitals;
PE patientsteaching hospitals;
PE patientsnonteaching hospitals.
Within each group we assigned a random number to each patient, ordered the patients by random number, and selected patients sequentially until 50 patients were identified or no further eligible patients were available. For the heart failure patients, we assumed that all were at risk for VTE and required prophylaxis. For the group of patients with established PE, we excluded patients if the diagnosis was made prior to admission or in the first 2 hospital days, if there were no acute signs and symptoms and the diagnosis was chronic PE, or if there were no imaging studies or postmortem findings in support of the diagnosis.
In both groups, we assessed patients' records for VTE risk factors, evidence of preventive care, and contraindications.7 We considered pertinent VTE risk factors to be those included with published guidelines.1 In the care of patients with established PE, designation of adequate prophylactic therapy required at least 24 hours of treatment prior to diagnosis.
Appropriate VTE prophylaxis was defined as anticoagulant medications or, in the case of contraindications to anticoagulation, mechanical compression devices applied to the lower extremities with or without antiembolism stockings. Any administration of warfarin, lowmolecular‐weight heparin, or heparin by infusion, was considered adequate. Prophylaxis with subcutaneous unfractionated heparin was considered adequate only if at least 5000 units was administered 3 times daily.8 Aspirin and other antiplatelet agents were not considered to be anticoagulants.
We characterized hospitalizations of at‐risk individuals as missed opportunities for prevention if there were no contraindications to treatment and no evidence that adequate prophylactic therapy was provided.
Data Analysis
To determine sample size for each of the 2 study populations, we assumed the baseline rate of compliance with recommendations for VTE prophylaxis among medical inpatients to be 0.4 to 0.5.4 We further assumed that an observed compliance rate of 0.7 would be indicative of an important difference compared with published results (rate difference, 0.2‐0.3). With a Type 1 (alpha) error of 0.025 (1‐tailed), approximately 90 patients are required for a 0.9 probability of detecting a difference of at least 0.25.9
Comparisons between teaching and nonteaching hospitals were analyzed using chi‐square tests. Confidence intervals for estimates of overall compliance were calculated using a normal approximation to the binomial distribution.10
Results
Medical Patients at Increased Risk for VTE
We identified 4963 patients age 75 and older discharged after at least 2 days of acute hospitalization for heart failure: 3437 from 73 teaching hospitals and 1526 from 58 nonteaching hospitals. The 100 patients randomly selected for review ranged in age from 75 to 94 (median, 82) and had hospitalizations of 3 to 41 days (median, 6). Ninety‐eight were male. In this group of patients, we found 63 with evidence of adequate pharmacologic VTE prevention and 37 for which opportunities for prevention were not realized. At teaching hospitals, anticoagulation was effected with warfarin (13 cases), heparin (11), and enoxaparin (10). At nonteaching hospitals anticoagulants included warfarin (16), enoxaparin (11), and heparin (2). Twenty‐nine of the 63 patients who received anticoagulation (46%) were admitted while taking warfarin for chronic conditions. Teaching and nonteaching hospitals did not differ with respect to missed opportunities for prevention of VTE (37% in each group; Table 1).
| Hospital Type | |||
|---|---|---|---|
| Total | Teaching | Nonteaching | |
| |||
| Number of patients | 4963 | 3437 | 1526 |
| Randomly selected patients at risk | 100 | 54 | 46 |
| Received prophylactic anticoagulation | 63 | 34 | 29 |
| Missed opportunities for prevention | 37 | 20 | 17 |
| Percent (95% confidence interval) | 37 (27‐47) | 37 (23‐51) | 37 (22‐52) |
Patients With Established PE
We identified 1448 acute hospitalizations of at least 2 days duration for patients with PE, 1118 from 72 teaching hospitals and 330 from 51 nonteaching hospitals. We reviewed 779 medical records, 449 (40.2%) teaching cases and all 330 nonteaching cases. Chart review was completed after all nonteaching cases had been reviewed. In only 8.2% (64) of reviewed cases was the diagnosis of acute PE made after the first 2 hospital days and with accompanying objective evidence of VTE. Most cases (698; 89.6%) were excluded because there was only a remote history of PE or the diagnosis was made prior to admission. Additional cases (17; 2.2%) were excluded because the diagnosis was made during the first 2 hospital days; there were no acute signs and symptoms and the diagnosis was chronic PE; or there was no confirmation by computed tomography or ventilation‐perfusion scans, lower extremity ultrasonography in the setting of consistent clinical findings, or autopsy.
The 64 patients with confirmed in‐hospital PE ranged in age from 44 to 85 years (median, 65) and had hospitalizations of 4 to 53 days (median, 16). Sixty‐three were male. One of these patients had no definite risk factors for VTE and was ambulatory when acute symptoms occurred. Among the 63 patients who had unequivocal VTE risk factors, 34 (54%) received appropriate prophylactic treatment, and 29 (46%) received inadequate or no preventive therapy (Table 2). There was no significant difference between teaching and nonteaching hospitals with respect to missed opportunities for prevention (49% vs. 35%; P 0.3).
| Hospital Type | |||
|---|---|---|---|
| Total | Teaching | Nonteaching | |
| |||
| Number of patients | 1448 | 1118 | 330 |
| Randomly selected patients | 779 | 449 | 330 |
| Documented in‐hospital pulmonary embolism | 64 | 47 | 17 |
| No definite VTE risk factors | 1 | 0 | 1 |
| Received prophylactic anticoagulation | 30 | 20 | 10 |
| Anticoagulation contraindicated, received mechanical prophylaxis | 4 | 4 | 0 |
| Missed opportunities for prevention | 29 | 23 | 6 |
| Percent (95% confidence interval) | 45 (32‐58) | 49 (30‐68) | 35 (12‐58) |
Anticoagulants used at teaching hospitals included heparin (15 cases), enoxaparin (4), and warfarin (1), while at nonteaching hospitals enoxaparin (7) and heparin (3) were used.
Each of the 10 patients who received no anticoagulation had the VTE risk factor of recent immobility prior to PE. Nine of the 10 had active malignancies, and 4 of these had undergone recent surgery. None had evidence of hypercoagulable states (factor V Leiden, lupus anticoagulant, or anticardiolipin antibodies). Five of the 10 patients died in the year following pulmonary embolism, 3 prior to discharge or within 2 weeks of discharge.
Missed Opportunities for Prevention
Among the 66 patients whose hospitalizations were characterized as missed opportunities for prevention, 30 received no pharmacologic VTE prevention despite having no contraindications. Seven patients had contraindications to pharmacologic prophylaxis, but none of these patients had contraindications to mechanical prophylaxis. An additional 18 patients received mechanical prophylaxis only despite having no contraindications to anticoagulation. Eleven patients received inadequate heparin regimens with or without mechanical prophylaxis (Table 3).
| Hospital Type | |||
|---|---|---|---|
| Total | Teaching | Nonteaching | |
| Number of patients | 66 | 43 | 23 |
| No contraindications, no prophylaxis | 30 | 18 | 12 |
| Anticoagulation contraindicated, no mechanical prophylaxis | 7 | 3 | 4 |
| No contraindication to anticoagulation, mechanical prophylaxis only | 18 | 13 | 5 |
| Inadequate heparin regimen, no mechanical prophylaxis | 9 | 7 | 2 |
| Inadequate heparin regimen, mechanical prophylaxis | 2 | 2 | 0 |
Discussion
Based on a random sample of 4963 elderly heart failure patients admitted to VA hospitals during a 1‐year period, we estimated that 63% received recommended interventions aimed at preventing VTE. Although differences in methodology limit comparisons with published reports, this rate is similar to those observed at individual hospitals,1113 in large multicenter registries of patients with DVT or at risk for VTE,14, 15 and in a recent multinational cross‐sectional study.16 Notably, chronic outpatient anticoagulation that was continued during hospitalization accounted for nearly one‐half of patients receiving preventive care. Compliance did not differ between teaching and nonteaching hospitals.
In a complementary approach to examining the extent of preventive care, we identified 1448 patients discharged with a diagnosis of PE. Most of these patients were excluded because they did not have a new event while hospitalized. Eleven (17%) of the 64 patients with confirmed in‐hospital PE received no preventive care before the event. An additional 18 (28%) received suboptimal heparin regimens or mechanical prophylaxis in the absence of contraindications to anticoagulation. As with the patients at risk for VTE, patients with established PE at teaching and nonteaching hospitals received similar rates of preventive care. Contrary to our expectation, the observed difference in rates between types of hospitals favored nonteaching hospitals. However, the sample size for this comparison was small and the difference did not reach statistical significance.
This study's population‐based approach permits conclusions about the performance of the VA's entire system of acute care hospitals. The results indicate that proven preventive therapies are often neglected at VA hospitals, but overall performance is probably comparable to other settings. VA employs an extensively implemented electronic medical record (EMR) and superior performance might have been expected. However, these results suggest limitations in the EMR as it is currently deployed. Successful efforts probably require a multifaceted approach incorporating decision support and institutional standardization.17
Several additional findings warrant comment. Patients with malignancies accounted for 9 of 10 patients who had PE after receiving no prior anticoagulation. Recent surgery was also a contributing factor for 4 of these cancer patients. Although both cancer and surgery are well‐known risk VTE factors, clinicians may not appreciate the extremely high risk associated with the combination.18 Particular effort may be warranted to ensure prophylaxis in this group, and more intensive measures may be necessary.
These results reveal several barriers to the accurate retrospective measurement of preventable inpatient PE. First, the use of discharge diagnoses to monitor the occurrence of inpatient PE is fraught with hazard. In this study, even after excluding patients with a discharge diagnostic code indicating a past history of PE, very few identified patients in fact had an acute or recent event. In addition, many patients were clearly admitted after having the onset of symptoms as outpatients. Further, reliance on discharge diagnoses alone can lead to the inclusion of patients with a presumptive diagnosis made without the advantage of imaging studies or postmortem examination. Although we overcame these barriers through careful record review and strict diagnostic criteria, our results suggest that efficient performance improvement efforts may require ongoing concurrent review.
There are several limitations of this study. First, we excluded PE patients whose diagnoses were made before the third hospital day. Some of these patients may have had events attributable to recent prior hospitalizations and should have received VTE prophylaxis. Second, we considered preventive measures applied at least 24 hours prior to PE to be acceptable evidence of prevention, potentially neglecting prior periods without treatment that might confer increased risk. Bias due to either of these limitations could exaggerate the compliance rates we report. Finally, the retrospective design of this study did not allow for consistent assessments of whether patients had the risk factor of immobility. Nevertheless, immobility was obvious for the 10 patients with PE who had no prior anticoagulation, all of whom had 2 or more risk factors.
Despite an acknowledged need for improvements in clinical practice, past efforts have had mixed results. For instance, in 1 study at a hospital with a well‐established EMR, computer alerts led to substantial improvement in the use of preventive measures and in VTE outcomes, but overall compliance remained low.19 On the other hand, a multidisciplinary approach can achieve marked reductions in preventable VTE events.20 Key elements of such an approach are a simplified risk assessment tool and concurrent monitoring of patient treatments and outcomes. The Agency for Healthcare Research and Quality has recently published a guide that outlines strategies for achieving breakthrough levels of improvement in the prevention of VTE.21
In conclusion, this population‐based study of hospitalized veterans with PE or at risk for VTE found compliance comparable to rates in published reports. Missed opportunities for prevention included inappropriate and inadequate interventions. Using discharge diagnoses to monitor the occurrence of inpatient PE is of limited value, and efficient performance improvement efforts may require ongoing concurrent review.
Acknowledgements
The authors thank Greg Maynard, MD, MS for advice on study design, and Deborah Howard, RN, for assistance with medical record review.
- ,,.Prevention of venous thromboembolism. The Seventh ACCP Conference on Antithrombotic and Thrombolytic Therapy.Chest.2004;126:338S–400S.
- ,,,.Thromboprophylaxis rates in US medical centers: success or failure?J Thromb Haemost.2007;5:1610–1616.
- .Preventing venous thromboembolism in surgical patients.Cleve Clin J Med.2006;73:S88–S94.
- ,.Prevention of venous thromboembolism among hospitalized medical patients.Circulation.2005;111:e1–e3.
- ,,.Quality of care for the treatment of acute medical conditions in US hospitals.Arch Intern Med.2006;166:2511–2517.
- Association of American Medical Colleges (AAMC). Council of Teaching Hospitals and Health Systems (COTH). Available at: http://www.aamc. org/members/coth. Accessed August2009.
- Contraindications are those described in the Institute for Clinical Systems Improvement Health Care Guideline: Venous Thromboembolism Prophylaxis. 4th ed. June 2007, pp 13–14. Available at: http://www. icsi.org/guidelines_and_more/gl_os_prot/cardiovascular/venous_thromboem bolism_prophylaxis/venous_thromboembolism_prophylaxis_5.html. Accessed August2009.
- ,,, et al.Prevention and treatment of venous thromboembolism. International Consensus Statement.Int Angiol.2006;25:101–161.
- ,.Designing Clinical Research.Baltimore, MD:Williams 1988.
- ,,. Statistical Methods for Rates and Proportions.3rd ed.Hoboken, NJ:Wiley‐Interscience;2003;28,54.
- ,,.New onset of venous thromboembolism among hospitalized patients at Brigham and Women's Hospital is caused more often by prophylaxis failure than by withholding treatment.Chest.2000;118;1680–1684.
- ,,.Prophylaxis against venous thromboembolism in acutely ill medical patients: an observational study.Pharmacotherapy.2006;26:1086–1090.
- ,,.Hospital‐acquired venous thromboembolism and prophylaxis in an integrated hospital delivery system.J Clin Pharm Ther.2006;31:455–459.
- ,;DVT FREE Steering Committee.A prospective study of 5,451 patients with ultrasound‐confirmed deep vein thrombosis.Am J Cardiol.2004;15:259–262.
- ,,, et al.Venous thromboembolism prophylaxis in acutely ill hospitalized medical patients: findings from the International Medical Prevention Registry on Venous Thromboembolism.Chest.2007;132:936–945.
- ,,, et al.Venous thromboembolism risk and prophylaxis in the acute hospital care setting.Lancet.2008;371:387–394.
- .Medical admission order sets to improve deep vein thrombosis prevention: a model for others or a prescription for mediocrity?J Hosp Med.2009;4:77–80.
- ,,,,,.Prevention of venous thromboembolism in the cancer surgery patient.Cleve Clin J Med.2008;75(suppl 3):S17–S26.
- ,,, et al.Electronic alerts for hospitalized high‐VTE risk patients not receiving prophylaxis: a cohort study.J Thromb Thrombolysis.2008;25:146–150.
- ,,, et al. Prevention of hospital‐acquired venous thromboembolism: prospective validation of a VTE risk assessment model and protocol. Society of Hospital Medicine 2008 National Meeting. Electronic citation abstract #52, page 29. Available at: http://www.hospital medicine.org/Paperless2008/PDFs/Additional_Info/SHM08_Abstracts.pdf. Accessed August2009
- ,.Preventing Hospital‐Acquired Venous Thromboembolism: A Guide for Effective Quality Improvement. AHRQ Publication No. 08–0075.Rockville, MD:Agency for Healthcare Research and Quality;2008.
Copyright © 2010 Society of Hospital Medicine
ONLINE EXCLUSIVE: Audio interview with Janet Corrigan, PhD, MBA
Dr. Corrigan notes there are abundant examples of guideline adherence boosting quality outcomes, length of stay, and time to clinical stability.
Click here to listen to the audio file
Dr. Corrigan notes there are abundant examples of guideline adherence boosting quality outcomes, length of stay, and time to clinical stability.
Click here to listen to the audio file
Dr. Corrigan notes there are abundant examples of guideline adherence boosting quality outcomes, length of stay, and time to clinical stability.
Click here to listen to the audio file
Practical Neuroscience for Primary Care Physicians: Spring Issue
A supplement to Internal Medicine News.

TOPIC HIGHLIGHTS/FACULTY
Welcome Letter:
From the Publisher
Special Populations in Depression: Recognizing and Managing Depression in Women
Larry Culpepper, MD, MPH, Guest Editor
Chief of Family Medicine
Boston Medical Center
Professor and Chairman of Family Medicine
Boston University School of Medicine
Boston, Mass.
Dr Culpepper has disclosed that he is a consultant to Eli Lilly and Company, Forest Laboratories, Inc, Pfizer Inc, and Wyeth.
Case Files on Depression/Insomnia and Chronic Pain/Anxiety/Insomnia
Joseph A. Lieberman III, MD, MPH
Associate Professor of Medicine
Associate Editor, Delaware Medical Journal
Professor of Family Medicine
Jefferson Medical College of Philadelphia
Hockessin, Del.
Management of Disabling Migraine Episodes
Carolyn Bernstein, MD
Assistant Professor of Neurology
Cambridge Hospital
Harvard Medical School
Boston, Mass.
Dr Bernstein has nothing to disclose.
Resources in the Spotlight
Point of View: Challenges in Primary Care Persist Over Time
William Clay Jackson, MD, DipTh
Family Medicine and Palliative Medicine
Memphis, Tenn.
Dr Jackson has received funding for clinical grants from Eli Lilly and Company. He is a consultant to AstraZeneca and Eli Lilly.
Practical Bits: Diagnostic Tools
A supplement to Internal Medicine News.
TOPIC HIGHLIGHTS/FACULTY
Welcome Letter:
From the Publisher
Special Populations in Depression: Recognizing and Managing Depression in Women
Larry Culpepper, MD, MPH, Guest Editor
Chief of Family Medicine
Boston Medical Center
Professor and Chairman of Family Medicine
Boston University School of Medicine
Boston, Mass.
Dr Culpepper has disclosed that he is a consultant to Eli Lilly and Company, Forest Laboratories, Inc, Pfizer Inc, and Wyeth.
Case Files on Depression/Insomnia and Chronic Pain/Anxiety/Insomnia
Joseph A. Lieberman III, MD, MPH
Associate Professor of Medicine
Associate Editor, Delaware Medical Journal
Professor of Family Medicine
Jefferson Medical College of Philadelphia
Hockessin, Del.
Management of Disabling Migraine Episodes
Carolyn Bernstein, MD
Assistant Professor of Neurology
Cambridge Hospital
Harvard Medical School
Boston, Mass.
Dr Bernstein has nothing to disclose.
Resources in the Spotlight
Point of View: Challenges in Primary Care Persist Over Time
William Clay Jackson, MD, DipTh
Family Medicine and Palliative Medicine
Memphis, Tenn.
Dr Jackson has received funding for clinical grants from Eli Lilly and Company. He is a consultant to AstraZeneca and Eli Lilly.
Practical Bits: Diagnostic Tools
ONLINE EXCLUSIVE: Audio interview with Roberta Fruth, PhD, RN, FAAN, JCR/JCI
Dr. Fruth suggests implementing standardized patient discharge education checklists, and says hospitalists "have been leading many workflow improvement projects."
Dr. Fruth suggests implementing standardized patient discharge education checklists, and says hospitalists "have been leading many workflow improvement projects."
Dr. Fruth suggests implementing standardized patient discharge education checklists, and says hospitalists "have been leading many workflow improvement projects."
ONLINE EXCLUSIVE: Evidence-Based Medicine Curveball
Even simple practice guidelines can be controversial. Guidelines are not created or implemented in a vacuum; they must be interpreted within a complex—and sometimes conflicting—milieu of medical, social, economic, and political forces.
This past November the U.S. Preventive Services Task Force, a federally funded, scientific advisory panel, released a 2009 update to its 2002 recommendations on breast cancer screening. The updated guideline said women in their 40s with an average risk for breast cancer do not need annual mammograms to screen for the disease, and older women at average risk of developing breast cancer need screening only once every two years.
The new guideline sparked disagreement among physicians, and a heated political debate as to whether the recommendation amounted to government-mandated, guideline-based, economically motivated healthcare rationing.
Some groups, including the American Cancer Society, said that mammograms have been proven to save lives by spotting tumors early on when they are most easily treated, and said they would stick by their current guideline to start annual mammogram screening at age 40. The Radiological Society of North America cited studies showing mammography of women in their 40s saves lives, and said about 20% of all breast cancer deaths in our country occur in women in their 40s.
The timing of the task force's recommendation was unfortunate (some lawmakers said it was calculated), as it was announced in the midst of the heated congressional healthcare reform debate. Although the new guideline would save a portion of the more than $5 billion spent on mammography in the U.S. each year, the task force said politics played no part in its recommendation, and that cost savings were never considered in its discussions. The task force acknowledged potential benefits of earlier testing, but attempted to balance those benefits with the potential harms of unnecessary radiation exposure, biopsies, overdiagnosis and overtreatment, and anxiety to women who get false positive results, which the panel said occurs in 10 percent of mammograms.
Flu Season, Part Deux
The public, physician, and media fascination with the H1N1 pandemic can serve as a healthy reminder this winter for hospitalists not to overlook seasonal influenza.
The attention focused on H1N1 influenza prompted the early release by the Journal of the American Medicine Association (JAMA. 2010;303[1]:doi10.1010/JAMA.2009.1911) of a study on the effectiveness of the virus’ vaccine. The attention also has prompted many hospitals to create processes for hospitalists and other staff to communicate with primary-care physicians (PCPs), community clinicians, and local health departments, according to Rick Hilger, MD, FHM, director of resident education of hospital medicine, and medical director of care management at Regions Hospital in Saint Paul, Minn. In particular, the attention on H1N1 has helped develop “open lines of communication” with infectious-disease doctors who often are the initial stop for influenza cases, Dr. Hilger says.
“When H1N1 was peaking this fall, we were getting probably biweekly e-mail updates as to what they were seeing in the community and them making recommendations,” says Dr. Hilger, who is also an assistant professor of medicine at the University of Minnesota. “I think we were spoiled in that respect. I would highly recommend that all hospitalists try to speak with … their local infectious-disease doctors to see what’s out there this winter.”
Dr. Hilger suggests hospitalists use the focus on influenza this winter to redouble efforts to vaccinate at-risk populations and work with infectious-disease specialists when patients are admitted with clinical signs of infection. He adds that hospitalists, as front-line staffers at small and community hospitals, should be used to dealing with seasonal influenza.
“I don’t think that seasonal influenza will be a sleeper problem, in general,” Dr. Hilger says. “We all have a lot of experience with it. If anything, H1N1 will increase our awareness of it because we can’t go a day without influenza activity being talked about, whether it’s within our hospitalist group or whether it’s in administration.”