User login
The need for mentors in the odyssey of the academic hospitalist
This issue of the Journal of Hospital Medicine features an important contribution concerning the current state of academic hospital medicine. The survey of 57 hospitalists revealed what many of us already suspected: the state of mentorship in academic hospitalist groups is unsatisfactory.1
While the conclusion is alarming, it is also not surprising. Over the past decade academic medical centers enthusiastically hired hospitalists to improve efficiency for inpatient services and to lessen the effect of Accreditation Council for Graduate Medical Education (ACGME) regulations on duty hours and patient caps. Few departments of internal medicine, however, hired academic hospitalists with the intent of creating academic divisions. Thus many institutions appear to view hospitalists primarily as hospital employees ignoring their potential academic contributions, and as a result it should not be a surprise that many hospitalist groups lack the mentorship infrastructure of other divisions within a typical Department of Medicine. Compounding the hospital employee problem, the new field of academic hospital medicine has emerged only in the last decade, a time frame that has resulted in very few hospitalists qualified to serve as senior mentors.
We cannot easily remove these limitations: the past is the past, and over time, hospital medicine will mature and develop more senior mentors. But what should we do until that maturation occurs? We believe that the academic work of hospitalists, both in education and research (Quality and Patient Safety) are important endeavors too valuable to be left to chance. With 30,000 hospitalists delivering care, it is critical that research in the optimal delivery of this care be performed, targeting systems improvements to enact anticipated outcomes in quality and patient safety. The physicians who are regularly and intimately involved in this system of inpatient care delivery, the hospitalists, are best suited for identifying the unique features of the inpatient care system needing improvement. Mentorship is essential in ensuring the advancement of both areas, and the sustainability of hospital medicine in medical academe. The article by Harrison et al.1 both establishes the depth of these issues and provides important insights into potential solutions for closing this mentorship gap while the field matures.
Utilizing Other Mentors
No measure of systems change will make young hospitalists immediately experienced, such that they have the sophistication to be senior mentors for younger hospitalists. But we can compensate for this temporary gap in mentorship experience. First, in the next 5 to 10 years, young academic hospitalists need explicit direction from those within Departments of Medicine who do have this mentorship experience, even if these mentors do not work in hospital medicine. Mentors within General Internal Medicine or the subspecialties can still provide the guidance and support to ensure that academic hospitalists are engaging in the appropriate endeavors toward promotion and intellectual growth. Second, academic hospitalists have to seek out mentorship from afar through their participation in the organizations primarily devoted to the academic welfare of hospitalists: The Society of Hospital Medicine (SHM) and the Society of General Internal Medicine (SGIM). Both organizations sponsor mentorship programs, and regular attendance at regional and/or national meetings (followed by email correspondence) can greatly improve an academic hospitalist's career trajectory. Finally, midlevel and senior‐level hospitalists have to learn mentorship skills; mere experience in the field does not ensure acquisition of the necessary mentorship skills, anymore than experience in medicine ensures teaching skills. Mentorship is its own skill set, and receiving appropriate training via the SHM or SGIM national meetings or the Academic Hospitalist Academy (referenced below) is critical.
Defining Academic Expectations for Hospitalists
Harrison et al.1 note that academic hospitalists felt there was a lack of respect for the scholarly work that hospitalists do as part of their job, raising the proposition that the mentorship dearth for academic hospitalists might result from currently available mentors not knowing what to say. Even if mentors were plentiful today, we still must ask the question, What would the mentor advise the young hospitalist to do? The academic hospitalist offers extraordinary value to the Department, but in a way that is different from the standard R0RO‐1 Grant paradigm. Even if hospitalists acquire extramural funding, it will likely come from sources different from the National Institutes of Health (NIH): Agency for Healthcare Research and Quality (AHRQ), foundations (eg, The Robert Wood Johnson Foundation or The John A. Hartford Foundation), intramural hospital‐originating funding, etc. And while extramural funding may be a measure of a hospitalist's contribution to the Department, it should not be the only measure of the hospitalist's career development. There are 2 ways to get rich: acquire more money, or spend less money. Academic hospitalists, unlike other specialties in Medicine, are likely to fall into the latter category, by offering decreased hospital costs (ie, decreased length of stay, decreased never events, etc.). Further, hospitalists may save in opportunity costs: the hospitalist staffing a ward service is less costly than a subspecialist who could be performing procedures, or a basic science researcher who could be acquiring grants. The problem today is that there is no way to quantify this decreased loss, and having this sort of metric will greatly enable mentors to provide hospitalists with ways of showing value to the department outside of the standard NIH grant paradigm. The Quality Portfolio developed by the SGIM and the forthcoming Benchmarks for Academic Hospitalists Promotion white paper (as developed by the SHM's Academic Practice and Promotion Committee) will greatly improve the substance of mentorship for academic hospitalists.2 Leaders of academic hospital medicine must learn to educate chairs of medicine and medical school deans as to the value‐added services intrinsic in the integration of hospitalists into the academic environment.
Having an Academic Plan
Mentorship is a 2‐way relationship: the mentor has responsibilities, but so too, does the mentee. As we wait for the hospitalist field to further develop, new academic hospitalists must become proactive in seeking guidance in career development. The Academic Hospitalist Academy, cosponsored by SHM, SGIM, and ACLGIM, is an example of this type of training.3 As a part of this course, participants learn of the rules and the opportunities for success in academic hospital medicine. Success for academic hospitalist groups will likely follow from understanding what success looks like. The Academy provides an excellent program for distributing that knowledge.
Research Training in Hospital Medicine
Many traditionalists would insist that Hospital Medicine could evoke the same training paradigm as other subspecialties in medicine (ie, fellowships). Unfortunately there are not a sufficient number of GME‐funded positions to handle the number of hospitalists required to advance the mission of academic hospital medicine. Moreover, fellowship training for every academic hospitalist would be unlikely to produce the desired results of improving the delivery of inpatient care. The academic agenda for the hospitalist depends on understanding the hospital system, and then executing improvements that lead to safer, more efficient and effective care. In this way, the academic hospitalist academic training is much more akin to a Master of Business Administration (MBA) than it is to a Bachelor of Science (BS) degree: namely, via job immersion, the hospitalist develops a greater systems understanding that should inform his or her academic career. Thus, a fellowship right out of residency may not have the same urgency for the hospitalist as it does for the subspecialist. Nevertheless, those hospitalists seeking an academic scholarly career will experience major benefits from fellowship training. Academic hospitalists need not focus only on the few existing hospitalist fellowships; they can obtain the necessary training in research skills via a general medicine fellowship, of which there are many. For this cohort of hospitalists, we strongly encourage training in a general medicine, health services, or outcomes research fellowship, with an emphasis on research techniques as they apply to the measurement of quality, patient safety, and/or clinical education.
With respect to academic hospitalists, it is likely that nothing is as important as the question of mentorship. Even the hardest working hospitalist can lose their way without guidance and a roadmap; the mentor is central to both. But the lost opportunity is not borne by the individual physician alone; the academic department loses too. Because the hospitalist's value depends on sufficient familiarity with a specific system prior to leveraging improvements, the department accrues maximal benefits in efficiency and effectiveness only if it can maintain retention for at least 2 years.4 The turnover carries major costs; recruitment costs money, and every new hospitalist engenders major start‐up costs. Faculty members who become completely integrated into the department have higher retention rates than those who consider themselves outside the main stream. Mentorship will greatly increase the probability that hospitalists will progress and feel the importance to the department.
Academic hospital medicine must strive over the next 5 to 10 years to become totally integrated in the academic culture of every institution. This task will take great leadership both at the local level and at a national level. We agree with the authors that the SHM and the SGIM can both provide important assistance to young hospital medicine groups. We applaud the authors of this article for making explicit this next major challenge for the field.
- ,,,.Survey of US academic hospitalist leaders about mentorship and academic activities in hospitalist groups.J Hosp Med.2011;6:5–9.
- ,,,.Quality portfolio introduction – academic hospitalist taskforce quality portfolio rationale and development. Society of General Internal Medicine Website,2010. Available at:http://www.sgim.org/index.cfm?pageId=846. Accessed September 2010.
- The Academic Hospitalist Academy Website,2010. Available at:http://www.academichospitalist.org. Accessed September 2010.
- ,,, et al.Effects of physician experience on costs and outcomes on an academic general medicine service.Ann Intern Med.2002;137:866–874.
This issue of the Journal of Hospital Medicine features an important contribution concerning the current state of academic hospital medicine. The survey of 57 hospitalists revealed what many of us already suspected: the state of mentorship in academic hospitalist groups is unsatisfactory.1
While the conclusion is alarming, it is also not surprising. Over the past decade academic medical centers enthusiastically hired hospitalists to improve efficiency for inpatient services and to lessen the effect of Accreditation Council for Graduate Medical Education (ACGME) regulations on duty hours and patient caps. Few departments of internal medicine, however, hired academic hospitalists with the intent of creating academic divisions. Thus many institutions appear to view hospitalists primarily as hospital employees ignoring their potential academic contributions, and as a result it should not be a surprise that many hospitalist groups lack the mentorship infrastructure of other divisions within a typical Department of Medicine. Compounding the hospital employee problem, the new field of academic hospital medicine has emerged only in the last decade, a time frame that has resulted in very few hospitalists qualified to serve as senior mentors.
We cannot easily remove these limitations: the past is the past, and over time, hospital medicine will mature and develop more senior mentors. But what should we do until that maturation occurs? We believe that the academic work of hospitalists, both in education and research (Quality and Patient Safety) are important endeavors too valuable to be left to chance. With 30,000 hospitalists delivering care, it is critical that research in the optimal delivery of this care be performed, targeting systems improvements to enact anticipated outcomes in quality and patient safety. The physicians who are regularly and intimately involved in this system of inpatient care delivery, the hospitalists, are best suited for identifying the unique features of the inpatient care system needing improvement. Mentorship is essential in ensuring the advancement of both areas, and the sustainability of hospital medicine in medical academe. The article by Harrison et al.1 both establishes the depth of these issues and provides important insights into potential solutions for closing this mentorship gap while the field matures.
Utilizing Other Mentors
No measure of systems change will make young hospitalists immediately experienced, such that they have the sophistication to be senior mentors for younger hospitalists. But we can compensate for this temporary gap in mentorship experience. First, in the next 5 to 10 years, young academic hospitalists need explicit direction from those within Departments of Medicine who do have this mentorship experience, even if these mentors do not work in hospital medicine. Mentors within General Internal Medicine or the subspecialties can still provide the guidance and support to ensure that academic hospitalists are engaging in the appropriate endeavors toward promotion and intellectual growth. Second, academic hospitalists have to seek out mentorship from afar through their participation in the organizations primarily devoted to the academic welfare of hospitalists: The Society of Hospital Medicine (SHM) and the Society of General Internal Medicine (SGIM). Both organizations sponsor mentorship programs, and regular attendance at regional and/or national meetings (followed by email correspondence) can greatly improve an academic hospitalist's career trajectory. Finally, midlevel and senior‐level hospitalists have to learn mentorship skills; mere experience in the field does not ensure acquisition of the necessary mentorship skills, anymore than experience in medicine ensures teaching skills. Mentorship is its own skill set, and receiving appropriate training via the SHM or SGIM national meetings or the Academic Hospitalist Academy (referenced below) is critical.
Defining Academic Expectations for Hospitalists
Harrison et al.1 note that academic hospitalists felt there was a lack of respect for the scholarly work that hospitalists do as part of their job, raising the proposition that the mentorship dearth for academic hospitalists might result from currently available mentors not knowing what to say. Even if mentors were plentiful today, we still must ask the question, What would the mentor advise the young hospitalist to do? The academic hospitalist offers extraordinary value to the Department, but in a way that is different from the standard R0RO‐1 Grant paradigm. Even if hospitalists acquire extramural funding, it will likely come from sources different from the National Institutes of Health (NIH): Agency for Healthcare Research and Quality (AHRQ), foundations (eg, The Robert Wood Johnson Foundation or The John A. Hartford Foundation), intramural hospital‐originating funding, etc. And while extramural funding may be a measure of a hospitalist's contribution to the Department, it should not be the only measure of the hospitalist's career development. There are 2 ways to get rich: acquire more money, or spend less money. Academic hospitalists, unlike other specialties in Medicine, are likely to fall into the latter category, by offering decreased hospital costs (ie, decreased length of stay, decreased never events, etc.). Further, hospitalists may save in opportunity costs: the hospitalist staffing a ward service is less costly than a subspecialist who could be performing procedures, or a basic science researcher who could be acquiring grants. The problem today is that there is no way to quantify this decreased loss, and having this sort of metric will greatly enable mentors to provide hospitalists with ways of showing value to the department outside of the standard NIH grant paradigm. The Quality Portfolio developed by the SGIM and the forthcoming Benchmarks for Academic Hospitalists Promotion white paper (as developed by the SHM's Academic Practice and Promotion Committee) will greatly improve the substance of mentorship for academic hospitalists.2 Leaders of academic hospital medicine must learn to educate chairs of medicine and medical school deans as to the value‐added services intrinsic in the integration of hospitalists into the academic environment.
Having an Academic Plan
Mentorship is a 2‐way relationship: the mentor has responsibilities, but so too, does the mentee. As we wait for the hospitalist field to further develop, new academic hospitalists must become proactive in seeking guidance in career development. The Academic Hospitalist Academy, cosponsored by SHM, SGIM, and ACLGIM, is an example of this type of training.3 As a part of this course, participants learn of the rules and the opportunities for success in academic hospital medicine. Success for academic hospitalist groups will likely follow from understanding what success looks like. The Academy provides an excellent program for distributing that knowledge.
Research Training in Hospital Medicine
Many traditionalists would insist that Hospital Medicine could evoke the same training paradigm as other subspecialties in medicine (ie, fellowships). Unfortunately there are not a sufficient number of GME‐funded positions to handle the number of hospitalists required to advance the mission of academic hospital medicine. Moreover, fellowship training for every academic hospitalist would be unlikely to produce the desired results of improving the delivery of inpatient care. The academic agenda for the hospitalist depends on understanding the hospital system, and then executing improvements that lead to safer, more efficient and effective care. In this way, the academic hospitalist academic training is much more akin to a Master of Business Administration (MBA) than it is to a Bachelor of Science (BS) degree: namely, via job immersion, the hospitalist develops a greater systems understanding that should inform his or her academic career. Thus, a fellowship right out of residency may not have the same urgency for the hospitalist as it does for the subspecialist. Nevertheless, those hospitalists seeking an academic scholarly career will experience major benefits from fellowship training. Academic hospitalists need not focus only on the few existing hospitalist fellowships; they can obtain the necessary training in research skills via a general medicine fellowship, of which there are many. For this cohort of hospitalists, we strongly encourage training in a general medicine, health services, or outcomes research fellowship, with an emphasis on research techniques as they apply to the measurement of quality, patient safety, and/or clinical education.
With respect to academic hospitalists, it is likely that nothing is as important as the question of mentorship. Even the hardest working hospitalist can lose their way without guidance and a roadmap; the mentor is central to both. But the lost opportunity is not borne by the individual physician alone; the academic department loses too. Because the hospitalist's value depends on sufficient familiarity with a specific system prior to leveraging improvements, the department accrues maximal benefits in efficiency and effectiveness only if it can maintain retention for at least 2 years.4 The turnover carries major costs; recruitment costs money, and every new hospitalist engenders major start‐up costs. Faculty members who become completely integrated into the department have higher retention rates than those who consider themselves outside the main stream. Mentorship will greatly increase the probability that hospitalists will progress and feel the importance to the department.
Academic hospital medicine must strive over the next 5 to 10 years to become totally integrated in the academic culture of every institution. This task will take great leadership both at the local level and at a national level. We agree with the authors that the SHM and the SGIM can both provide important assistance to young hospital medicine groups. We applaud the authors of this article for making explicit this next major challenge for the field.
- ,,,.Survey of US academic hospitalist leaders about mentorship and academic activities in hospitalist groups.J Hosp Med.2011;6:5–9.
- ,,,.Quality portfolio introduction – academic hospitalist taskforce quality portfolio rationale and development. Society of General Internal Medicine Website,2010. Available at:http://www.sgim.org/index.cfm?pageId=846. Accessed September 2010.
- The Academic Hospitalist Academy Website,2010. Available at:http://www.academichospitalist.org. Accessed September 2010.
- ,,, et al.Effects of physician experience on costs and outcomes on an academic general medicine service.Ann Intern Med.2002;137:866–874.
Rude Awakening
A hospitalist-turned-sleep specialist at Beth Israel Deaconess Medical Center (BIDMC) in Boston wants hospitalists to be aware of a recent report that showed 80.5% of hospitalized patients were at high risk for obstructive sleep apnea (OSA)—but she doesn't want you to lose any sleep over it.
Suzie Bertisch, MD, MPH, a physician in the Division of Pulmonary, Critical Care, and Sleep Medicine at BIDMC, says hospitalists should stay current with OSA research because of its growing prevalence. However, because there is little evidence-based data on just how much of a complicating factor the condition is, she doesn't suggest hospitalists be too concerned.
"It's the reality that we've all seen a patient who has sleep apnea," says Dr. Bertisch, an instructor at Harvard Medical School who helped lead a session on OSA at HM10. "It's important to keep an eye on it because it could become a bigger deal. We're not sure now what it is."
The study, the results of which were announced in November by Loyola University Health System in Maywood, Ill., was based on a one-day survey of 195 patients who were given an eight-question OSA screening questionnaire known as STOP-BANG. Patients who answered “yes” to three of the questions were considered high-risk.
Dr. Bertisch notes that since the general prevalence of OSA usually is cited at about 2% to 4% of the population (about 12 million Americans, according to the National Institutes of Health), the low threshold for determining risk via the STOP-BANG test likely contributed to the outsized percentage of those considered high-risk.
The researchers suggested the results could prod hospitals, and by extension hospitalists, to administer the STOP-BANG test to gauge risk.
Dr. Bertisch, who gave up hospitalist duties in recent months to focus on sleep research, says she expects more research to be conducted in order to help answer questions about how sleep apnea affects other health conditions. “It’s an emerging field,” she says.
Dr. Dermatologist, Meet the Hospitalist
Dermatology is about sleuthing and putting things together that don't go together, says Lindy Fox, MD, founder of the interdisciplinary dermatology hospitalist consultation service at the University of California at San Francisco (UCSF). She recommends hospitalists learn basic descriptions of dermatological conditions, categories, and terminology. That way, when they make a phone presentation of symptoms to a consulting dermatologist, the specialist can determine whether the patient needs an in-person consultation.
Differential diagnosis of a dermatological condition considers history, duration, timing, waxing, and waning, Dr. Fox told participants in the hands-on Hospitalist Mini-College at UCSF last October.
"We worry about pain much more than about itching. We worry about medications and drug eruptions. A family history is important, and a social history, especially for patients who travel. But the most important thing is morphology," she says. "What is the primary lesion? Learn to recognize the primary lesion and the differential diagnosis will follow."
It is a concern that fewer dermatologists have any presence in the hospital, and the resulting demands on hospitalists will only increase, Dr. Fox says. At UCSF, she and two colleagues consult on patients who have skin diseases that are severe enough to require hospitalization, or who develop a cutaneous manifestation of the disease for which they were admitted or as a consequence of treatment of that disease. They closely collaborate with UCSF's hospitist service, as well as teach residents and, at the bedside, internists. This approach, however, is rare, mainly limited to academic medical centers, she says.
"There are young dermatologists out there who want to stay in the hospital and work with internists but the structure often isn't there," Dr. Fox says. "What hospitalists can do is help to facilitate these relationships for dermatologists who want to work in the hospital."
Antimicrobial Stewardship
Nosocomial, or hospital‐acquired, infections (HAIs) are a major cause of patient morbidity and mortality in the United States and other countries.15 In 2002, approximately 1.7 million HAIs occurred in US hospitals and were associated with an estimated 98,987 deaths.1 Of particular note, increasing percentages of HAIs are now caused by antimicrobial‐resistant pathogens, which have been linked with increases in morbidity, mortality, length of hospital stay, and healthcare costs.6
The 2004 data summary from the United States National Nosocomial Infections Surveillance (NNIS) System Report highlighted substantial increases for year 2003 versus 1998 through 2002 in vancomycin‐resistant enterococci (VRE); methicillin‐resistant Staphylococcus aureus; Klebsiella pneumoniae resistant to third‐generation cephalosporins; and Pseudomonas aeruginosa resistant to imipenem, quinolones, or third‐generation cephalosporins.7 Other gram‐negative bacteria of concern include Escherichia coli and Acinetobacter baumannii, as well as Enterobacter cloacae and E. aerogenes.8, 9
The increasing number of multidrug‐resistant (MDR) gram‐negative bacteria within the healthcare setting is particularly concerning.1013 Too frequently, clinicians in the United States now encounter gram‐negative bacteria species that are resistant to many, and occasionally all, currently available antibiotics. For many of these MDR gram‐negative pathogens the antimicrobials that potentially remain active (eg, aminoglycosides and polymyxins) are often more toxic and less efficacious for some infections.14 Particularly problematic is that the pharmaceutical industry's developmental pipeline for new antibiotics, with novel mechanisms of action that might be used against MDR gram‐negative pathogens, has virtually come to a standstill.15, 16 Even if an investigational drug was in phase 2 or 3 trials right now or entered the US Food and Drug Administration (FDA) Fast Track Development Program, it would be at least 10 or 15 years before that drug would be available on the US market.
What this means is that the clinician's current antibiotic armamentarium is all they can expect in the foreseeable future. It also means that special care needs to be taken to optimally use currently available agents to ensure continued activity against the pathogens encountered in the hospital (and community) setting, now and in the future. Maximizing clinical outcomes, while minimizing the emergence and spread of antimicrobial resistance (and other adverse effects associated with suboptimal antimicrobial drug use), falls under the purview of antimicrobial stewardship, the focus of this paper.
Antimicrobial StewardshipWhy Is It Needed, What Is It, and What Are Its Goals?
Inappropriate Antimicrobial Use
Early in the onset of many infections, the data needed to make a rational, informed decision about specific antibiotic therapy are usually unavailable. For many infections, therapy cannot be delayed waiting for microbiology or other findings, and broad‐spectrum empiric therapy is begun on the basis of educated guesses made from the patient's presentation and characteristics, and local or hospital antibiograms. In addition, for many serious infections, delay in antimicrobial therapy will increase patient morbidity and mortality. Generally, what occurs is the decision to treat empirically with one or more broad‐spectrum antibiotic agents, which are then continued for the entire course of therapy. Opportunities are often missed to tailor therapy later in the course of infection when microbiologic or other data are available. There is also a tendency for spiraling empiricism to occur when a patient is not doing well with initial therapy; additional agents with broad antimicrobial activity, including antifungals and antivirals, are added to the therapeutic regimen, often in a haphazard way.17
Besides the perceived need to prescribe broad‐spectrum and/or multiple antibiotics to cover possible or perceived resistant or uncommon pathogens, a number of other factors contribute to inappropriate antibiotic or antimicrobial use. Many times antimicrobials are initiated when no infection exists, such as for asymptomatic bacteruria, noninfectious pulmonary conditions, or endotracheal tube or Foley catheter colonization. Another example of inappropriate use is treating for longer than needed to eradicate infection. All of these events intensify the exposure of bacteria colonizing or infecting the patient to multiple anti‐infective drugs and increase the chances for selection of an MDR pathogen.
Examining antibiotic usage at the hospital level, approximately 60% of adult patients admitted to US hospitals receive at least 1 dose of an antibiotic agent during their stay (range: 44%74% for individual hospitals).18, 19 Similarly, at Wake Forest University Baptist Medical Center (WFUBMC), approximately 75% of inpatients receive antimicrobials at some point during their hospitalization (Ohl, unpublished data, 2007). One recent example by Hecker and colleagues conducted in a 650‐bed, university‐affiliated US hospital reported 30% of the total days of antibiotic therapy received by adult non‐ICU inpatients was unnecessary.20 The most common reasons for unnecessary use were administration for longer than recommended durations, administration for a noninfectious or nonbacterial syndrome, and treatment of colonizing or contaminating microorganisms.
Consequences of antibiotic misuse
Unwanted consequences of antimicrobial therapy include increased morbidity and mortality, adverse drug reactions, increased length of hospital stay and hospitalization costs, predisposition to secondary infections, and emergence and selection of drug‐resistant organisms.21, 22 Selection or induction of antimicrobial resistance and promotion of secondary infection with Clostridium difficileparticularly with new, more toxigenic strains23are of particular concern in the current hospital environment.22 These untoward consequences can be seen as a calculated risk of antibiotic therapy for any single‐treated patient, or as an undesired outcome measure for excessive use at the level of the healthcare institution. For example, a 7‐day course of a third‐generation cephalosporin in a particular patient increases the risk of subsequent infection from an extended‐spectrum beta‐lactamase (ESBL)‐producing gram‐negative rod. For the institution as a whole, excessive use of this antimicrobial will increase the overall prevalence and number of infections due to this troublesome resistance factor.
Definition and Goals of Antimicrobial Stewardship
The above studies show a clear need for improved, more careful and prudent use of antimicrobials, which is key to antimicrobial stewardship. Building on the definition given by the Infectious Diseases Society of America and Society for Healthcare Epidemiology of America (IDSA/SHEA),24 antimicrobial stewardship is essentially a system of personnel, informatics, data collection, and policy/procedures that promotes the optimal selection, dosing, and duration of therapy for antimicrobial agents throughout the course of their use. An effective antimicrobial stewardship program will limit inappropriate and excessive antimicrobial use, but more importantly improve and optimize therapy for the individual infected patient.
The goals of antimicrobial stewardship are listed in Table 1.24, 25 It is important to recognize that the primary goals of antimicrobial stewardship are not the reduction of healthcare costsand certainly not the reduction of drug acquisition or usage costs. As the 2007 IDSA/SHEA guidelines for institutional development of an antimicrobial stewardship program make clear, the primary goal is to focus on patient care; that is, to optimize clinical outcomes, while minimizing unintended consequences of antimicrobial use (emergence of resistance, selection of pathogenic organisms, and adverse drug reactions).24
| Prevent or slow the emergence of antimicrobial resistance |
| Optimize selection, dose and duration of therapy |
| Reduce adverse drug events, including secondary infection (eg, C. difficile antibiotic‐associated diarrhea) |
| Reduce morbidity and mortality |
| Reduce length of stay |
| Reduce healthcare expenditures |
Reduced healthcare costs without an adverse effect on quality of patient care is, however, a legitimate secondary goal of antimicrobial stewardship, and will result from optimized clinical outcomes and decreased potential collateral damage associated with pharmacotherapy. Unfortunately, it is much more difficult to measure the impact of an antimicrobial stewardship program on emergence of resistance than on drug acquisition or usage costs. As a consequence, reduction in drug acquisition/usage costs has too often been viewed as the primary (and sometimes only) justification for implementing an antimicrobial stewardship program.26
Finally, the role of effective infection control cannot be overemphasized. Infection control is clearly necessary and often sufficient to reduce HAIs. However, a comprehensive infection control program, combined with an effective antimicrobial stewardship agenda, synergistically limit the emergence and spread of antimicrobial‐resistant bacteria, reduce HAIs, control resistance, and improve overall inpatient care.24, 27 Hence, when instituting an antimicrobial stewardship program, it is essential to ensure the hospital or other healthcare institution already has a robust hospital epidemiology and infection control program in placeor to simultaneously institute one.
Constructing an Antimicrobial Stewardship Program
Infectious Diseases Society of America and Society for Healthcare Epidemiology of America Guidelines
Whereas the value of antimicrobial stewardship is widely appreciated, actually taking the steps to set up a healthcare facility program can be daunting. The guidelines established by the IDSA/SHEA for developing an institutional program represent a valuable resource and suggest that the best programs are comprehensivetaking into account local antimicrobial use and resistance patterns, as well as available resources.24 The size and nature of the institution can make a big difference in determining what program to set up and what elements it should entail; what works at one institution might not work as well at another. The program components and effectiveness of each will differ for community versus academic medical centers. A comprehensive program includes active monitoring, fostering of appropriate antimicrobial use, and collaboration with an effective infection control program as well as other hospital entities. The role of a multidisciplinary team, with administrative support, is particularly underscored in the guidelines. According to the guidelines, core members of the multidisciplinary team should include an infectious diseases physician and a clinical pharmacist with infectious diseases training. It should also ideally include a clinical microbiologist, information system specialist, infection control professional, and hospital epidemiologist.24 It is important that all members of the team are passionate about the program, oversee its implementation and daily functions, and have some sense of ownership of it. Compensation for its primary participants is crucial. Compensation not only ensures that adequate time is available for executing the daily activities of the program, but it also helps impart a greater sense of program ownership. Process and outcome measures of the program (discussed below) should be included in the performance evaluations of the compensated key participants.
Although the guidelines indicate that an infectious diseases physician should act as the program leader, this might not always be feasible or necessary. Many of the hospitals most in need of improved antimicrobial stewardship simply do not have an infectious diseases physician available to them. In addition, a lot of community hospitals share their infectious diseases physician on a consultative basis with other medical centers and facilities, and that particular specialist may not have a lot of time to invest in the program. Where having an infectious diseases physician as a core member and leader of the team is beneficial, it is not absolutely necessary. A similar argument can be made concerning the inclusion of a clinical pharmacist with infectious diseases training as a core member. Not all hospitals have or can find a clinical pharmacist with formal infectious diseases training through a didactic pharmacy residency program.
If an infectious diseases physician or clinical pharmacist with formal infectious diseases training is not available at a given institution, the team will need to include others ready to assume a greater leadership role. Although not mentioned in the guidelines, hospital medicine specialists and hospitalists are well‐suited to take on this role and can be integral to leadership of the multidisciplinary team. Hospitalists have knowledge of the hospital where they support a wide range of services and, at least in some cases, may have fewer time constraints than a subspecialty. In addition, hospital leadership and administration more often reach out to hospitalists to oversee patient quality care and safety improvement projects, the realm to which antimicrobial stewardship belongs. Regarding clinical pharmacists, an alternative to formal residency training for PharmDs are online certification programs such as MAD‐ID (Making a Difference in Infectious Diseases Pharmacotherapy), the Society of Infectious Diseases Pharmacists, or via a limited number of state medical societies.28, 29 Such certification programs should increase the number of pharmacists and PharmDs with infectious diseases training in the near future.
Antimicrobial stewardship is best considered a medical staff, rather than primary hospital, function. Individuals from the medical staff, and particularly medical staff leadership, are most adept in employing the 3 Cs that are important when constructing, implementing, and operating an institutional antimicrobial stewardship programconceptualization, communication, and coercion. Conceptualization deals with understanding what needs to be done, why it needs to be done, and how to do it, whereas communication is making sure the providers of antimicrobials receive and understand this information. Coercion might seem like a strong term, but it refers to the pressure exerted by thought leaders and others involved in the process to get things done within the institution, including all units or departments. Although ultimate responsibility for an antimicrobial stewardship program should probably lie with the medical staff, the IDSA/SHEA guidelines correctly indicate that support and collaboration of hospital administration, medical staff leadership, and local providers are essential to the success of any such program.24
A Case Study: the Wake Forest University Baptist Medical Center (WFUBMC) Program
Figure 1A,B provides an overview of the general structure of the antimicrobial stewardship program at WFUBMC implemented in 2000. To establish and provide the information needed for day‐to‐day operations of a stewardship program at WFUBMC, data are needed on how, where, and by whom antibiotics are used within the institution. In addition, microbiology data, including the frequency and susceptibility of infecting pathogens, are essential. Obtaining these data often requires the help and cooperation of the information technology (IT) staff at the institution. Considerable time and effort may be required at the outset, but once information system programs are established, ongoing data mining is much easier. At the time of program initiation, it was decided to assess antibiotic use or density (amount of drug per inpatient geographic unit) using the defined‐daily‐dose (DDD) method. This entails assigning a predetermined weight of administered antibiotic as a dose and dividing by a denominator of 1000 patient days. Subsequently, days of therapy per drug has been found to be a more accurate measure of antimicrobial consumption. When developing a program, it is vital to first obtain baseline usage data. Such data should include, if possible, a detailed inventory of usage within different units of the hospital or for particular services, or sometimes even for a particular provider with a history of high antimicrobial usage. Ongoing measurement over time allows the impact of new stewardship interventions and guidelines to be measured, as well as identifying potential new problem areas in usage.

Good microbiology data are also essential to determine problem pathogens at the institution and where they are located. Such data are useful not only to define areas of resistance (potentially warranting changes in antimicrobial policies to alter selection pressures), but also for gathering information necessary for defining local guidelines for antimicrobial use. For example, if the local antibiograms show that a particular pathogen in the hospital ICU has a particular resistance pattern, then initial empiric therapy for patients at risk of infection with those organisms should be chosen to cover the problematic resistant pathogen. Once subsequent microbiology data become available, patients not infected with the pathogen can be de‐escalated to a more narrow‐spectrum antibiotic.
As illustrated in Figure 1A, at WFUBMC, all the collected data are integrated to provide information concerning antibiotic density, usage, and patterns of antimicrobial resistance. This information is received by the staff of the antimicrobial stewardship program, which at WFUBMC is called the Center for Antimicrobial Utilization, Stewardship and Epidemiology (CAUSE). The CAUSE staff works with the day‐to‐day elements of program administration and operations and includes 2 infectious diseases physicians and 2 infectious disease PharmDs. The CAUSE staff works very closely with the microbiology laboratory, hospital pharmacy, and the medical director of hospital epidemiology and infection control.
The CAUSE program at WFUBMC administratively functions through an advisory board committee that includes thought leaders from different medical specialties and patient units of the hospitalparticularly those with high antimicrobial usage, such as hematology/oncology, pulmonary, critical care, and transplantation. The CAUSE staff and advisory board exist to exchange ideas concerning what is working or not working and where problem areas may be, and to propose possible changes in antimicrobial practices at the institution. In addition, thought leaders on the advisory board also receive and evaluate information from various sources about new antimicrobial agents and national guidelines, and, in turn, help disseminate this information to the hospital personnel who will be involved in program implementation.
At WFUBMC, it is the advisory board committee, working in conjunction with the CAUSE staff/medical director, that presents antimicrobials for formulary consideration to the Pharmacy and Therapeutics (P&T) Committee, in addition to any major interventions CAUSE and its advisory board feel are indicated. The P&T committee then reports to the medical staff executive committee and hospital leadership. As should be evident, the approach to stewardship at WFUBMC is medical staff‐driven, rather than a function of administrative constituents.
Finally, no matter how well‐organized an antimicrobial stewardship program is, it will not be fully successful if the entire medical staff does not buy into the process and agree with the need for the proposed changes and interventions involving the practice of antimicrobial therapy. It is important to spend some time early in program development to ensure that the need for an antimicrobial stewardship program, the process, and the outcomes (both in terms of patient care and clinical outcomes at the institution) are clearly communicated to the medical staff, and that their full commitment and cooperation are enlisted. In cases where hospital‐wide infection or resistance rates are known and antimicrobial utilization data are available, it is important to present such information in an understandable and convincing manner that makes the case for a proposed change or intervention, not only at the hospital level but also at the level of the patient.
Elements of a Successful Program: Basic Strategies
Potential strategies or elements of an antimicrobial stewardship program are listed in Table 2. Two evidence‐based fundamental or core strategies have been recommended by the IDSA/SHEA guidelines24 and implemented at numerous institutions with various levels of success. The first is a so‐called back‐end approach to modifying antimicrobial therapy on the basis of prospective audit of antimicrobial use, with intervention and feedback to the provider. The second is a front‐end approach using formulary restriction and preauthorization requirements for specific antimicrobial agents. Various supplemental strategies, including large group and patient case‐based education, guidelines and clinical pathways, antimicrobial order forms, and computerized clinical decision support, are also recommended.
| Program Element | Advantages | Disadvantages | Comments |
|---|---|---|---|
| Prospective Audit and Feedback | Proven in clinical studies to reduce and modify antimicrobial consumption, improve selected clinical outcomes, and decrease antimicrobial expenditures Provides one‐on‐one patient‐centered education to the clinician Allows optimization of anti‐infective pharmacology | Adherence to stewardship interventions by the clinician is voluntary Resource intensive Requires a greater amount of team member training and experience in anti‐infective therapy | Back‐end approach Identify and intervene on patients already started on antimicrobials Interventions include changing, streamlining, de‐escalation, pharmacodynamic/dose optimization, IV to PO switch, and limitation of duration of therapy |
| Restriction or Preauthorization | Proven in clinical studies to reduce and modify antimicrobial consumption, improve selected clinical outcomes, and decrease antimicrobial expenditures Together with infection control effective in controlling outbreaks of resistant or secondary pathogens (such as C. diff) | Less appealing to clinicians Loss of prescriber autonomy Potential need for after‐hours service Time intensive Potential for delay in antimicrobial administration | Front‐end approach Formulary restriction or contact a stewardship team member to obtain authorization to prescribe a selected antimicrobial Each intervention is a mini‐consult |
| Large Group Education | Can reach a large number of prescribers in a short period of time Effective for communicating the need and rationale for subsequent stewardship interventions | Not particularly effective in changing prescribing behavior without other interventions Rapid extinction of gained knowledge | Grand rounds or clinical staff meeting venues Provides information to prescribers and thought leader clinicians on justification for stewardship Feedback antimicrobial susceptibility and use data to clinicians |
| Guidelines and Pathways | Limits variation in therapy of infectious diseases Best evidence‐based Assists in adherence with regulatory and third‐party payer stipulations | Often not utilized unless combined with other stewardship strategies or elements | Best if local data and conditions are used to adapt guidelines to a specific institution |
| Computerized Physician Order Entry and Clinical Decision Support | Shown in limited clinical studies to reduce and modify antimicrobial consumption, improve selected clinical outcomes, and decrease antimicrobial expenditures Once established can greatly assist with implementation of guidelines and best‐evidence therapy. Reduces adverse events related to antimicrobials | Resource intensive during design and implementation Expensive Not readily available | Often entails modification of existing or purchasing of additional informatics |
| Microbiology Interventions | Potential to improve antimicrobial use and anti‐infective therapy for the individual patient | Not well studied | Includes cascade reporting to hide antimicrobial susceptibilities that might promote suboptimal therapy (eg, fluoroquinolone susceptibility for invasive S. aureus) Assistance with choices of automated susceptibility profile, communication of new or changes in testing protocols Preauthorization of susceptibility testing for unconventional antibiotics |
| Rapid Diagnostics | Provides opportunity for early targeted therapy Assists with de‐escalation Shown in very limited studies to decrease antimicrobial consumption and improve clinical outcomes | Not readily available Expensive | Includes PCR and antigen testing of clinical specimens or early culture growth with rapid turnaround of test results |
| Antimicrobial Cycling | Potential to decrease antimicrobial resistance for an institution or geographic unit | Not consistently shown in clinical trials to improve clinical outcomes or decrease resistance Often increases antimicrobial consumption Extremely labor intensive to ensure adherence | Changing antimicrobial protocols periodically in an attempt to reduce selection pressure for resistance |
Prospective Audit With Intervention and Feedback
This approach usually involves the use of an antimicrobial support team that reviews initial or ongoing therapy and then intervenes to provide feedback and suggested modifications to the medical care provider to improve therapy. This can be done by an infectious diseases physician, a clinical pharmacist, or a hospitalist or internist with expertise in antimicrobial therapy. The aim is to provide patient‐specific education and/or suggest changes to antimicrobial utilization (when needed) to improve and streamline therapy. Suggested interventions could include discontinuing or changing 1 or more drugs, switching intravenous to oral drug administration, and suggesting a short‐course duration of therapy. Occasionally, suggestions are made when appropriate to actually escalate or intensify therapy to increase efficacy. Identification of patients for targeting or focusing prospective audit and feedback efforts typically involves using computer surveillance to single out problem antimicrobials or problematic usage, given local resistance patterns or patient characteristics.24 Examples could include a focus on asymptomatic bacteruria, excessive duration of therapy for ventilator‐associated pneumonia, or overzealous use of certain classes of antimicrobials. Another potential activity for a prospective audit and feedback team is to review reports of patient‐specific blood and sterile body fluid culture results matched to the patient's current antimicrobial therapy. This allows for daily review of the appropriateness of therapy for potentially serious infections. Some patients seen by the antibiotic support team may be referred for infectious diseases or other expert consultative opinion if their infections or therapy are felt to be too complicated for routine prospective audit and feedback recommendations.
A number of studies have demonstrated that strategies involving prospective audit with intervention and feedback can improve antibiotic stewardship, as measured by reductions in inappropriate antibiotic use,30 reduced antibiotic costs or overall consumption,3135 greater compliance with hospital treatment guidelines or policies33, 36, 37 and, in some cases, reduced number of infections due to C difficile infection32, 37 or resistant pathogens.31, 32, 37 Prospective audit with feedback is probably the best and most effective core strategy for a community hospital program where other interventions are cumbersome or not as well tolerated by the medical staff. One potential disadvantage of the prospective audit with intervention and feedback approach is that medical provider adherence is largely voluntary. The team can make suggestions, but if the provider disagrees or is unobtainable, the suggestion is never implemented. Also, this strategy can also be resource‐intensive from a personnel perspective.
Formulary Restriction and Preauthorization
The other major strategy used to achieve antimicrobial stewardship goals involves antimicrobial restriction. This can be accomplished either by not including the particular antimicrobial agent on the hospital formulary or by requiring the medical provider to obtain preauthorization before prescribing a restricted drug. A pager system or telephone call is often used for preauthorization, whereby the clinician wishing to prescribe a particular agent calls or pages a member of the stewardship team in order to obtain prescribing permission. When using preauthorization, it is important that the individuals who receive the calls actually see patients and have clinical experience and the respect of the medical staff, as each call may be a mini‐consult. Oftentimes, the provider or prescriber making the call is asking for suggestions as to what antimicrobial might be used, and not simply to obtain authorization to use a drug that is otherwise restricted. Studies have shown that effective interventions supporting stewardship are better provided by attending infectious diseases staff or clinical pharmacists, rather than persons in training.38
Regarding the identification of antimicrobials for restriction, a program should preferentially choose those drugs that are involved in therapy for complex patients and infections. It is also a reasonable approach for drugs that are, or have the potential to be, overused for certain infections where alternatives exist. For work‐horse antimicrobials, those drugs overused or misused for several different infectious diseases, prospective audit and feedback is arguably a better strategy to reduce and modulate consumption.
Formulary restriction and preauthorization is clearly effective in modulating antimicrobial use. A large number of studies have demonstrated reductions in antibiotic drug use, and often in cost, after hospital implementation of a formulary restriction or preauthorization approach to antimicrobial stewardship.3947 It has been more difficult to demonstrate other benefits associated with this approach, although there is some support for its aid in controlling nosocomial infection outbreaks. Restriction of clindamycin48 (or clindamycin, cefotaxime, and vancomycin27) has been shown to control outbreaks of nosocomial C difficileassociated diarrhea and VRE, respectively. More recently, Internet‐based antimicrobial restriction programs49, 50 and a computerized (electronic) approval system51 have been demonstrated to reduce antibiotic use at tertiary hospitals.
Some studies have reported increased antibiotic drug susceptibilities after implementation of institutional preauthorization policies,45, 46, 51 and at least 1 reported a decreased incidence of ceftazidime‐resistant Klebsiella species after instituting a preapproval policy for cephalosporins.52 However, there is concern that restricting 1 class of antibiotics and replacing it with another will simply replace 1 resistant species with another, the so‐called squeezing the balloon effect.53 This was observed in the latter study, where a 44% reduction in ceftazidime‐resistant Klebsiella species at the hospital was accompanied by a 69% increase in incidence of imipenem‐resistant P aeruginosa.52 To assess and enable response to possible squeezing the balloon effects, the guidelines recommend monitoring overall trends in antimicrobial use for institutions using preauthorization strategies.
Possible disadvantages of preauthorization and restriction include perceived loss of autonomy for prescribers, the potential need for all‐hours support, inaccurate or misleading information from the prescriber (leading to inappropriate recommendations),24 and significant delay in stat antimicrobial administration.54 Delay in antimicrobial administration due to the time required to obtain preauthorization and have the approval communicated to the pharmacy was not observed when studied as a process measure at WFUBMC (Ohl, unpublished data, 2008).
A study by Linkin and colleagues showed that 39% of telephone calls for preauthorization of a restricted antimicrobial contained an inaccuracy in at least 1 type of patient data.38 A follow‐up by the same group demonstrated that inaccurate communication was significantly associated with inappropriate antimicrobial recommendations (odds ratio [OR] 2.2; P = .03); this was particularly the case for inaccuracies in microbiologic data (OR 7.5; P = .002).55 Also, if all‐hours support is not provided, at least 1 study has shown some physicians may engage in stealth dosing, that is, avoiding having to obtain preauthorization for restricted antimicrobials by waiting until off‐hours to place orders.56 The latter can be dealt with by following up on such orders with a prospective audit and feedback component of the program. Preauthorization is usually more difficult to employ and less accepted in non‐academic medical centers. Prospective audit and feedback may be more appropriate in such settings.
Supplemental Strategies
A number of additional options are available to supplement the 2 core strategies just described, and are listed in Table 2. Education is generally considered an essential component of any effective antimicrobial stewardship program, but it generally has little lasting impact on providers' behavior, unless it is incorporated with other active interventions.24 In particular, the large group or Grand Roundstype education, where someone describes what needs to be done and why, typically does not produce lasting behavioral changes. There might be, and often is, some short‐term modification, but long‐lasting change at the provider level requires consistent and repeated educational endeavors. Such large group educational venues are more effective and better used as a forum to describe or garner support for an impending stewardship program or intervention, rather than to teach a specific practice.
Using the antimicrobial stewardship program to adapt national guidelines to local antimicrobial use, microbiology, and resistance patterns57, 58 or using clinical (critical) pathways59 has also been shown to improve antimicrobial utilization at hospitals. National guidelines generally enjoy widespread support, but they commonly lack specific information about how to implement recommendations at a given hospital or how to incorporate local data relevant for decision making. A 2006 report by Beardsley and coworkers provides a model from WFUBMC on how local microbiologic data can be used to modify national treatment guidelines to better serve the needs of patients treated at a particular institution.60 Using American Thoracic Society (ATS) and IDSA guidelines for the management of hospital‐acquired pneumonia (HAP), together with local data on the most common bacterial pathogens and their susceptibility to piperacillin‐tazobactam, cefepime, ciprofloxacin, and amikacin (based on length of hospitalization), the WFUBMC CAUSE Advisory Board developed institution‐specific HAP guidelines. The new guidelines divided the ATS/IDSA late onset/risk of the MDR pathogens group of patients into 2 subcategories, early‐late and late‐late pneumonias. Also, unlike the national guidelines, the new guidelines did not recommend ciprofloxacin as empiric therapy, instead recommending amikacin as a component of regimens targeting late‐late pneumonias.
Newer (and in some cases not so new) information technologies can be adapted to healthcare delivery and prescriber support to improve antimicrobial stewardship. These include computer decision support61 and alert systems6265; computerized physician order entry (CPOE)66, 67; electronic medical records24; electronic retrieval of treatment guidelines or clinical texts68; and personal digital assistant (PDA) applications providing information on pathogens, diagnosis, medication, and treatment.68, 69 In addition, computer‐based surveillance64, 70, 71 and Web‐based systems for antimicrobial approval; automated clinical decision support; and/or enhanced real‐time communication between prescribers and other members of the antimicrobial stewardship team show promise for antimicrobial stewardship programs.49, 50
Computer‐assisted decision support has been shown to improve or reduce antibiotic‐susceptibility mismatches (improve selection of effective therapy), overall antibiotic use, excess antimicrobial dosages, excessive‐dose days, selection of antimicrobials for which the patient was poorly matched in terms of allergies, and antimicrobial‐related adverse events, as well as reduce antimicrobial drug costs, total hospital costs, and length of hospital stay.7277 For their part, CPOE systems have been shown to improve compliance with treatment guidelines, decrease medication and other medical errors, shorten length of hospital stay, and decrease pharmaceutical costs.66, 67, 78 In many cases, CPOE systems can now be modified to include some clinical decision support to improve antimicrobial use.78
The IDSA/SHEA guidelines note that antimicrobial decisions can be improved through use of CPOE, clinical decision support, and electronic medical records that enable incorporation of data on patient‐specific microbiology cultures and susceptibilities, hepatic and renal function, drug interactions, allergies, and cost. They also point out that computer‐based surveillance can facilitate good stewardship by enabling more efficient targeting of antimicrobial interventions, tracking of antimicrobial resistance patterns, and identification of HAIs and adverse drug events.24 Recently, a few proprietary informatics programs that perform such functions for the hospital epidemiologist and antimicrobial steward have become available, including but not limited to TheraDoc (Salt Lake City, UT), SafetySurveillor (Premier, Inc., Charlotte, NC), and BD Protect (BD Diagnostics, Austin, TX). Perhaps one of the best‐known comprehensive hospital information systems that incorporates and integrates several information technologies to improve patient care at the level of the prescriber is the Health Evaluation through Logical Processing (HELP) system at LDS Hospital in Salt Lake City, Utah.7981 Unfortunately, these programs are expensive, need considerable time for installation and validation, and do not always perform the functions needed by the medical center. The medical community has generally been slow to incorporate healthcare information technology to improve antimicrobial use or general medical care, but in the last few years more hospitals are finding their merit.
On the basis of evidence currently available, the 2007 guidelines do not recommend the routine use of antimicrobial cycling or combination therapy to prevent or reduce antimicrobial resistance. Such strategies, where at first glance might intuitively seem to make sense, have not been shown to improve patient care, improve antimicrobial choices, or reduce antimicrobial resistance. In addition, antimicrobial cycling in particular is difficult to implement and labor intensive to oversee.24
One strategy for improving antimicrobial stewardship not mentioned in the 2007 IDSA/SHEA guidelines, but might become increasingly important in the future, is the use of rapid molecular diagnostic testing. Knowing the identity of the causative pathogen sooner or being able to rapidly rule out certain pathogens should enable better decision‐making. During the 2009/2010 influenza season with H1N1 influenza, WFUBMC was able to implement rapid viral testing and learned some things that enabled improvement of hospital practices. It was found that approximately 10% to 15% of the pneumonias in immunocompromised patients at the center were not bacterial but viral, the pathogens being respiratory syncytial virus (RSV) or metapneumovirus (Ohl, unpublished data, 2010). Upon finding a viral etiology to a lower respiratory tract infection, rapid de‐escalation of antibiotic therapy was possible. If rapid diagnostics are to be performed, it is important that there are systems in place to respond quickly to the findings, so the benefits of having rapid data can be realized.
Evaluating Antimicrobial Stewardship Programs
Two general types of measures are used to evaluate the effectiveness of antimicrobial stewardship: process and outcome. As with most things done in the hospital, process measures are easier. They measure surrogate impacts of a program, accountability, resource use, and cost effectiveness. In essence, process measures evaluate whether the program accomplished what it set out to do in terms of changing certain processes or prescriber behaviors. It is important to measure resource use, as this helps to continue funding and to keep workers involved in the project. Good programs will save money; this can easily be measured, even if it is just as simple as going to the hospital pharmacy and looking at the cost of antimicrobials provided per patient day.
Outcomes like decreases in particular infections, less emergence of antimicrobial resistance, or other patient‐specific measures are likely more important in the big picture, but they are also much more difficult to measure. For example, where one would like to measure changes in pathogen resistance after making some changes in antimicrobial stewardship, it often takes years before the benefits of a particular intervention or change materialize in terms of less resistance or reduced emergence of resistance. If that type of change is to be measured, then one needs to be persistent and continue measurements over a long period of time. In addition, given the protracted amount of time before these outcomes may be observed, a number of other changes are likely to happen that coincide with the antimicrobial stewardship interventions and make assessment of causality difficult and biased.
Having said that, a number of studies have demonstrated a relationship between antibiotic restriction48, 8285 or other antimicrobial stewardship policies32, 86 and decreases in nosocomial C difficile infections or disease. Figure 2 illustrates the impact of a nonrestrictive antimicrobial stewardship program at a secondary/tertiary‐care hospital in Quebec, Canada, on an epidemic of C difficileassociated disease (CDAD) that occurred at the institution during the latter portion of 2003.86 Following program implementation, and the major drop in targeted antibiotic consumption, the incidence of CDAD also significantly decreased. Earlier implementation of infection control measures had no effect on CDAD incidence.
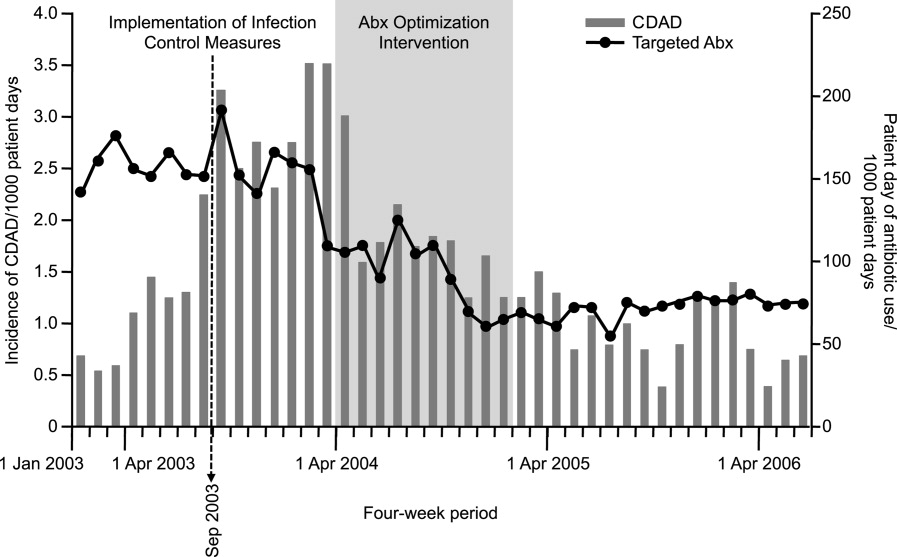
A smaller number of studies have reported decreases in resistant gram‐negative bacteria following implementation of antimicrobial stewardship programs. For example, Meyer and colleagues reported a marked reduction in ceftazidime‐resistant K pneumoniae at a 487‐bed general hospital in New York City after implementation of enhanced ceftazidime restriction and barrier precautions following an outbreak of infections caused by the resistant K pneumoniae.87 Similarly, Carling and coworkers reported a significant decrease in nosocomial infections caused by resistant Enterobacteriaceae following implementation of a multidisciplinary antibiotic stewardship program to minimize inappropriate use of third‐generation cephalosporins (Figure 3).32 More recently, a retrospective, longitudinal, multicenter analysis of a consortium of 22 academic health centers in the United States showed that incidence rates of carbapenem‐resistant P aeruginosa were lower at hospitals that restricted carbapenems than those that did not (P = .01).88
Evidence suggesting a beneficial impact of antimicrobial stewardship programs on resistance in gram‐positive organisms is limited. More specifically, the study by Carling and colleagues reported an apparent decrease in VRE rates following implementation of their program to reduce inappropriate use of third‐generation cephalosporins.32 The hospital had VRE rates similar to other NNIS System hospitals prior to beginning the program, but after antibiotic stewardship measures were implemented, the VRE rate began to drop, falling to 6% by 1999. This should be compared with a VRE rate of 24% for similar NNIS System hospitals in 1999.
As far as reducing healthcare costs, Figure 4A illustrates the direct antimicrobial cost savings at WFUBMC after implementation of the CAUSE antimicrobial stewardship program, and Figure 4B after supplemental interventions were implemented. Although decreasing antimicrobial cost is important, one would like to show decreases in overall healthcare costs associated with an antimicrobial stewardship program. Unfortunately, this is often a little more difficult to demonstrate. Extrapolations, however, may be possible. Because antimicrobial resistance, adverse drug effects, and secondary unintended infections such as C difficile colitis have been linked with increased patient morbidity and mortality, longer hospital stays, and increased healthcare costs,6, 89, 90 improved antimicrobial stewardship is expected to optimize patient care and lower overall healthcare costs. A study in a large tertiary care academic medical center estimated more than $4.25 million in total healthcare savings over 1 year with a stewardship program using both preauthorization and, to a lesser extent, prospective audit and feedback.91 Despite the fact cost saving should not be a primary goal of an antimicrobial stewardship program, lower antimicrobial costs can help keep a program funded and buttress a proposal for an antimicrobial stewardship program to hospital leadership.
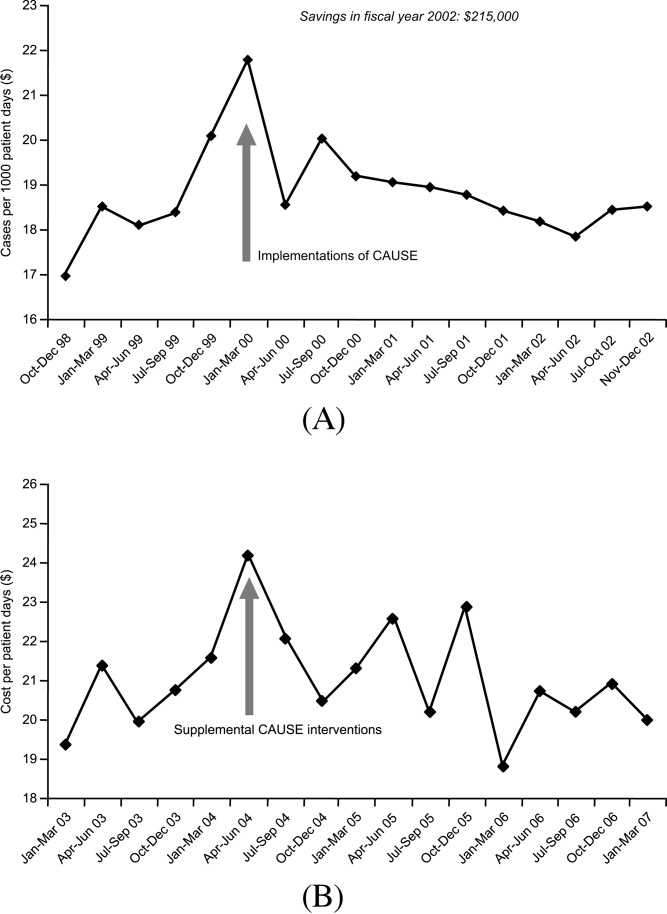
Many hospitals recognize other areas where an antimicrobial stewardship program can demonstrate its value. This includes implementation of a rapid change in drug utilization during antimicrobial supply shortages and assistance with regulatory mandates and surgical infection prophylaxis. Stewardship teams often assist microbiology with protocols for microbiology reporting, antibiograms, planning for susceptibility testing, and communicating changes in microbiology tests or protocols to clinicians.
Conclusions
Overuse or misuse of antibiotics and other antimicrobials for hospital inpatients is relatively common, and can be associated with several unintended negative consequences. Improving medical care necessarily includes better use of antimicrobials to optimize outcomes and preserve the effectiveness of currently available agents. Further, an important additional consequence of effective antimicrobial stewardship and improved patient care is typically a lowering of overall healthcare costs. The recent 2007 IDSA/SHEA guidelines provide recommendations for developing an institutional program to enhance antimicrobial stewardship. However, individual institutions need to look closely at their own systems and patients to develop an antimicrobial stewardship program that best serves the needs of their hospital and the people it serves.
- ,, et al.Estimating health care‐associated infections and deaths in U.S. hospitals, 2002.Public Health Rep.2007;122:160–166.
- ,,.Healthcare‐associated infection in Shiraz, Iran 2004–2005.J Hosp Infect.2008;69:283–287.
- ,,,,.Healthcare‐associated infections in Finnish acute care hospitals: a national prevalence survey, 2005.J Hosp Infect.2008;69:288–294.
- .Historical and changing epidemiology of healthcare‐associated infections.J Hosp Infect.2009;73:296–304.
- ,,, et al.Four country healthcare associated infection prevalence survey 2006: overview of the results.J Hosp Infect.2008;69:230–248.
- ,,.Clinical and economic burden of antimicrobial resistance.Expert Rev Anti Infect Ther.2008;6:751–763.
- National Nosocomial Infections Surveillance (NNIS) System Report, data summary from January 1992 through June 2004, issued October 2004.Am J Infect Control.2004;32:470–485.
- .Bad bugs, no drugs: no ESCAPE revisited.Clin Infect Dis.2009;49:992–993.
- .Federal funding for the study of antimicrobial resistance in nosocomial pathogens: no ESKAPE.J Infect Dis.2008;197:1079–1081.
- ,.Resistant gram‐negative bacilli: a neglected healthcare crisis?Am J Health Syst Pharm.2007;64:S3–S21; quizS22–S24.
- ,,, et al.Antimicrobial resistance among gram‐negative bacilli causing infections in intensive care unit patients in the United States between 1993 and 2004.J Clin Microbiol.2007;45:3352–3359.
- ,,.The emerging threat of multidrug‐resistant gram‐negative organisms in long‐term care facilities.J Gerontol A Biol Sci Med Sci.2009;64:138–141.
- ,,,,.Influx of multidrug‐resistant, gram‐negative bacteria in the hospital setting and the role of elderly patients with bacterial bloodstream infection.Infect Control Hosp Epidemiol.2009;30:325–331.
- ,,.Emergence of extensively drug‐resistant and pandrug‐resistant Gram‐negative bacilli in Europe.Euro Surveill.2008;13(47)pii:19045.
- ,,, et al.The epidemic of antibiotic‐resistant infections: a call to action for the medical community from the Infectious Diseases Society of America.Clin Infect Dis.2008;46:155–164.
- ,,,,,.Bad bugs need drugs: an update on the development pipeline from the Antimicrobial Availability Task Force of the Infectious Diseases Society of America.Clin Infect Dis.2006;42:657–668.
- ,.Observations on spiraling empiricism: its causes, allure, and perils, with particular reference to antibiotic therapy.Am J Med.1989;87:201–206.
- ,.Variability in rates of use of antibacterials among 130 US hospitals and risk‐adjustment models for interhospital comparison.Infect Control Hosp Epidemiol.2008;29:203–211.
- ,,,.Trends in antibacterial use in US academic health centers: 2002 to 2006.Arch Intern Med.2008;168:2254–2260.
- ,,,,.Unnecessary use of antimicrobials in hospitalized patients: current patterns of misuse with an emphasis on the antianaerobic spectrum of activity.Arch Intern Med.2003;163:972–978.
- Polk RE, Fishman NO, eds.Antimicrobial Stewardship.7th ed.Philadelphia, PA:Churchill Livingstone Elsevier;2010. Mandell GL, Bennett JE, Dolin R, eds. Mandell, Douglas, and Bennett's Principles and Practice of Infectious Diseases; No. 1.
- .Collateral damage and what the future might hold. The need to balance prudent antibiotic utilization and stewardship with effective patient management.Int J Infect Dis.2006;10:S17–S24.
- ,,, et al.A predominantly clonal multi‐institutional outbreak of Clostridium difficile‐associated diarrhea with high morbidity and mortality.N Engl J Med.2005;353:2442–2449.
- ,, et al.Infectious Diseases Society of America and the Society for Healthcare Epidemiology of America guidelines for developing an institutional program to enhance antimicrobial stewardship.Clin Infect Dis.2007;44:159–177.
- .Antimicrobial stewardship.Semin Infect Contr.2001;1:210–221.
- ,,,,.Insights from the Society of Infectious Diseases Pharmacists on antimicrobial stewardship guidelines from the Infectious Diseases Society of America and the Society for Healthcare Epidemiology of America.Pharmacotherapy.2009;29:593–607.
- ,,,,,.Manipulation of a hospital antimicrobial formulary to control an outbreak of vancomycin‐resistant enterococci.Clin Infect Dis.1996;23:1020–1025.
- MAD‐ID: Making a Difference in Infectious Diseases Pharmacotherapy. Available at http://www.mad‐id.com. Accessed August 17,2010.
- Society of Infectious Diseases Pharmacists. The implementation of antimicrobial stewardship using a multidisciplinary approach. CME program. Available at http://www.esymposia.ashp.org/cemantimicrobial/. Accessed August 17,2010.
- ,,, et al.Academic detailing to improve use of broad‐spectrum antibiotics at an academic medical center.Arch Intern Med.2001;161:1897–1902.
- ,,, et al.A hospitalwide intervention program to optimize the quality of antibiotic use: impact on prescribing practice, antibiotic consumption, cost savings, and bacterial resistance.Clin Infect Dis.2003;37:180–186.
- ,,,,.Favorable impact of a multidisciplinary antibiotic management program conducted during 7 years.Infect Control Hosp Epidemiol.2003;24:699–706.
- ,,, et al.Antimicrobial stewardship program directed at broad‐spectrum intravenous antibiotics prescription in a tertiary hospital.Eur J Clin Microbiol Infect Dis.2009;28:1447–1456.
- ,,,,,.Antibiotic optimization: an evaluation of patient safety and economic outcomes.Arch Intern Med.1997;157:1689–1694.
- .Concurrent antibiotic review programs: a role for infectious diseases specialists at small community hospitals.Clin Infect Dis.2003;37:742–743.
- ,,,,.Improving antimicrobial use in the hospital setting by providing usage feedback to prescribing physicians.Infect Control Hosp Epidemiol.2006;27:378–382.
- ,,, et al.Successful use of feedback to improve antibiotic prescribing and reduce Clostridium difficile infection: a controlled interrupted time series.J Antimicrob Chemother.2007;59:990–995.
- ,,,,.Inaccurate communications in telephone calls to an antimicrobial stewardship program.Infect Control Hosp Epidemiol.2006;27:688–694.
- ,,,,.Effect of a vancomycin restriction policy on ordering practices during an outbreak of vancomycin‐resistant Enterococcus faecium.Arch Intern Med.1997;157:1132–1136.
- ,.Impact of voluntary vs enforced compliance of third‐generation cephalosporin use in a teaching hospital.Arch Intern Med.1992;152:554–557.
- ,,.Cost containment through restriction of cephalosporins.Am J Hosp Pharm.1981;38:1897–1900.
- ,.Controlling cephalosporin and aminoglycoside costs through pharmacy and therapeutics committee restrictions.Am J Hosp Pharm.1985;42:1343–1347.
- ,.Enforcing a policy for restricting antimicrobial drug use.Am J Health Syst Pharm.1995;52:1433–1435.
- ,,,,,.Changes in antibiotic use, cost and consumption after an antibiotic restriction policy applied by infectious disease specialists.Jpn J Infect Dis.2005;58:338–343.
- ,,,,,.Impact of an antibiotic restriction policy on hospital expenditures and bacterial susceptibilities: a lesson from a pediatric institution in a developing country.Pediatr Infect Dis J.2000;19:200–206.
- ,,,,,.Effects of requiring prior authorization for selected antimicrobials: expenditures, susceptibilities, and clinical outcomes.Clin Infect Dis.1997;25:230–239.
- ,,,.Antibiotic cost savings from formulary restrictions and physician monitoring in a medical‐school‐affiliated hospital.Am J Med.1987;83:817–823.
- ,,,,.Decrease in nosocomial Clostridium difficile‐associated diarrhea by restricting clindamycin use.Ann Intern Med.1994;120:272–277.
- ,,, et al.A World Wide Web‐based antimicrobial stewardship program improves efficiency, communication, and user satisfaction and reduces cost in a tertiary care pediatric medical center.Clin Infect Dis.2008;47:747–753.
- ,,, et al.Impact of a web‐based antimicrobial approval system on broad‐spectrum cephalosporin use at a teaching hospital.Med J Aust.2003;178:386–390.
- ,,, et al.Electronic antibiotic stewardship: reduced consumption of broad‐spectrum antibiotics using a computerized antimicrobial approval system in a hospital setting.J Antimicrob Chemother.2008;62:608–616.
- ,,, et al.Class restriction of cephalosporin use to control total cephalosporin resistance in nosocomial Klebsiella.JAMA.1998;280:1233–1237.
- .Antibiotic resistance: squeezing the balloon?JAMA.1998;280:1270–1271.
- ,,.Impact of a restrictive antimicrobial policy on the process and timing of antimicrobial administration.J Hosp Med.2010;5:E41–E45.
- ,,, et al.Effect of communication errors during calls to an antimicrobial stewardship program.Infect Control Hosp Epidemiol.2007;28:1374–1381.
- ,,,,,.Evaluation of antimicrobial therapy orders circumventing an antimicrobial stewardship program: investigating the strategy of “stealth dosing”.Infect Control Hosp Epidemiol.2007;28:551–556.
- ,,,,,.Experience with a clinical guideline for the treatment of ventilator‐associated pneumonia.Crit Care Med.2001;29:1109–1115.
- ,,,,.Short‐course empiric antibiotic therapy for patients with pulmonary infiltrates in the intensive care unit: a proposed solution for indiscriminate antibiotic prescription.Am J Respir Crit Care Med.2000;162:505–511.
- ,,,,,.A controlled trial of a critical pathway for treatment of community‐acquired pneumonia. CAPITAL Study Investigators. Community‐Acquired Pneumonia Intervention Trial Assessing Levofloxacin.JAMA.2000;283:749–755.
- ,,,,,.Using local microbiologic data to develop institution‐specific guidelines for the treatment of hospital‐acquired pneumonia.Chest.2006;130:787–793.
- .Expert clinical decision support systems to enhance antimicrobial stewardship programs: insights from the Society of Infectious Diseases Pharmacists.Pharmacotherapy.2005;25:1116–1125.
- ,,,,,.Improved perioperative antibiotic use and reduced surgical wound infections through use of computer decision analysis.Infect Control Hosp Epidemiol.1989;10:316–320.
- ,,,,.Impact of a computer‐generated alert system prompting review of antibiotic use in hospitals.J Antimicrob Chemother.2009;63:1058–1063.
- ,,,,.Therapeutic antibiotic monitoring: surveillance using a computerized expert system.Am J Med.1990;88:43–48.
- ,,,,.Improvement of intraoperative antibiotic prophylaxis in prolonged cardiac surgery by automated alerts in the operating room.Infect Control Hosp Epidemiol.2003;24:13–16.
- ,.Computer physician order entry: benefits, costs, and issues.Ann Intern Med.2003;139:31–39.
- .Computerized physician order entry in the critical care and general inpatient setting: a narrative review.J Crit Care.2004;19:271–278.
- ,,.Information technology for optimizing the management of infectious diseases.Am J Health Syst Pharm.2006;63:957–965.
- ,,.Personal digital assistant infectious diseases applications for health care professionals.Clin Infect Dis.2003;36:1018–1029.
- ,,,.Computerized surveillance of adverse drug events in hospital patients.JAMA.1991;266:2847–2851.
- ,,, et al.Computer surveillance of hospital‐acquired infections and antibiotic use.JAMA.1986;256:1007–1011.
- ,,,,.Improving empiric antibiotic selection using computer decision support.Arch Intern Med.1994;154:878–884.
- ,,,.Evaluation of a computer‐assisted antibiotic‐dose monitor.Ann Pharmacother.1999;33:1026–1031.
- ,,, et al.A computer‐assisted management program for antibiotics and other antiinfective agents.N Engl J Med.1998;338:232–238.
- ,,, et al.Impact of a computerized clinical decision support system on reducing inappropriate antimicrobial use: a randomized controlled trial.J Am Med Inform Assoc.2006;13:378–384.
- ,,,.Development and impact of a computerized pediatric antiinfective decision support program.Pediatrics.2001;108:E75.
- ,,,,.Computerized antimicrobial decision support: an offline evaluation of a database‐driven empiric antimicrobial guidance program in hospitalized patients with a bloodstream infection.Int J Med Inform.2004;73:455–460.
- ,,, et al.The impact of computerized physician order entry on medication error prevention.J Am Med Inform Assoc.1999;6:313–321.
- .Maximizing appropriate antibiotic prophylaxis for surgical patients: an update from LDS Hospital, Salt Lake City.Clin Infect Dis.2001;33Suppl 2:S78–S83.
- ,,,,.The HELP system and its application to infection control.J Hosp Infect.1991;18Suppl A:424–431.
- ,,.Decision support in medicine: lessons from the HELP system.Int J Med Inform.2003;69:273–284.
- ,,,,,.Hospital‐wide restriction of clindamycin: effect on the incidence of Clostridium difficile‐associated diarrhea and cost.Ann Intern Med.1998;128:989–995.
- ,,,,,.An antibiotic policy associated with reduced risk of Clostridium difficile‐associated diarrhoea.Age Ageing.1999;28:578–580.
- ,,, et al.Successful control of Clostridium difficile infection in an elderly care unit through use of a restrictive antibiotic policy.J Antimicrob Chemother.1997;40:707–711.
- ,,,,,.Antibiotic prescribing policy and Clostridium difficile diarrhoea.QJM.2004;97:423–429.
- ,,,,.Impact of a reduction in the use of high‐risk antibiotics on the course of an epidemic of Clostridium difficile‐associated disease caused by the hypervirulent NAP1/027 strain.Clin Infect Dis.2007;45Suppl 2:S112–S121.
- ,,,,.Nosocomial outbreak of Klebsiella infection resistant to late‐generation cephalosporins.Ann Intern Med.1993;119:353–358.
- ,,.Relationship of carbapenem restriction in 22 university teaching hospitals to carbapenem use and carbapenem‐resistant Pseudomonas aeruginosa.Antimicrob Agents Chemother.2009;53:1983–1986.
- .The relationship between antimicrobial resistance and patient outcomes: mortality, length of hospital stay, and health care costs.Clin Infect Dis.2006;42Suppl 2:S82–S89.
- ,,, et al.Hospital and societal costs of antimicrobial‐resistant infections in a Chicago teaching hospital: implications for antibiotic stewardship.Clin Infect Dis.2009;49:1175–1184.
- .Antimicrobial stewardship.Am J Med.2006;119:S53–S61; discussionS62–S70.
Nosocomial, or hospital‐acquired, infections (HAIs) are a major cause of patient morbidity and mortality in the United States and other countries.15 In 2002, approximately 1.7 million HAIs occurred in US hospitals and were associated with an estimated 98,987 deaths.1 Of particular note, increasing percentages of HAIs are now caused by antimicrobial‐resistant pathogens, which have been linked with increases in morbidity, mortality, length of hospital stay, and healthcare costs.6
The 2004 data summary from the United States National Nosocomial Infections Surveillance (NNIS) System Report highlighted substantial increases for year 2003 versus 1998 through 2002 in vancomycin‐resistant enterococci (VRE); methicillin‐resistant Staphylococcus aureus; Klebsiella pneumoniae resistant to third‐generation cephalosporins; and Pseudomonas aeruginosa resistant to imipenem, quinolones, or third‐generation cephalosporins.7 Other gram‐negative bacteria of concern include Escherichia coli and Acinetobacter baumannii, as well as Enterobacter cloacae and E. aerogenes.8, 9
The increasing number of multidrug‐resistant (MDR) gram‐negative bacteria within the healthcare setting is particularly concerning.1013 Too frequently, clinicians in the United States now encounter gram‐negative bacteria species that are resistant to many, and occasionally all, currently available antibiotics. For many of these MDR gram‐negative pathogens the antimicrobials that potentially remain active (eg, aminoglycosides and polymyxins) are often more toxic and less efficacious for some infections.14 Particularly problematic is that the pharmaceutical industry's developmental pipeline for new antibiotics, with novel mechanisms of action that might be used against MDR gram‐negative pathogens, has virtually come to a standstill.15, 16 Even if an investigational drug was in phase 2 or 3 trials right now or entered the US Food and Drug Administration (FDA) Fast Track Development Program, it would be at least 10 or 15 years before that drug would be available on the US market.
What this means is that the clinician's current antibiotic armamentarium is all they can expect in the foreseeable future. It also means that special care needs to be taken to optimally use currently available agents to ensure continued activity against the pathogens encountered in the hospital (and community) setting, now and in the future. Maximizing clinical outcomes, while minimizing the emergence and spread of antimicrobial resistance (and other adverse effects associated with suboptimal antimicrobial drug use), falls under the purview of antimicrobial stewardship, the focus of this paper.
Antimicrobial StewardshipWhy Is It Needed, What Is It, and What Are Its Goals?
Inappropriate Antimicrobial Use
Early in the onset of many infections, the data needed to make a rational, informed decision about specific antibiotic therapy are usually unavailable. For many infections, therapy cannot be delayed waiting for microbiology or other findings, and broad‐spectrum empiric therapy is begun on the basis of educated guesses made from the patient's presentation and characteristics, and local or hospital antibiograms. In addition, for many serious infections, delay in antimicrobial therapy will increase patient morbidity and mortality. Generally, what occurs is the decision to treat empirically with one or more broad‐spectrum antibiotic agents, which are then continued for the entire course of therapy. Opportunities are often missed to tailor therapy later in the course of infection when microbiologic or other data are available. There is also a tendency for spiraling empiricism to occur when a patient is not doing well with initial therapy; additional agents with broad antimicrobial activity, including antifungals and antivirals, are added to the therapeutic regimen, often in a haphazard way.17
Besides the perceived need to prescribe broad‐spectrum and/or multiple antibiotics to cover possible or perceived resistant or uncommon pathogens, a number of other factors contribute to inappropriate antibiotic or antimicrobial use. Many times antimicrobials are initiated when no infection exists, such as for asymptomatic bacteruria, noninfectious pulmonary conditions, or endotracheal tube or Foley catheter colonization. Another example of inappropriate use is treating for longer than needed to eradicate infection. All of these events intensify the exposure of bacteria colonizing or infecting the patient to multiple anti‐infective drugs and increase the chances for selection of an MDR pathogen.
Examining antibiotic usage at the hospital level, approximately 60% of adult patients admitted to US hospitals receive at least 1 dose of an antibiotic agent during their stay (range: 44%74% for individual hospitals).18, 19 Similarly, at Wake Forest University Baptist Medical Center (WFUBMC), approximately 75% of inpatients receive antimicrobials at some point during their hospitalization (Ohl, unpublished data, 2007). One recent example by Hecker and colleagues conducted in a 650‐bed, university‐affiliated US hospital reported 30% of the total days of antibiotic therapy received by adult non‐ICU inpatients was unnecessary.20 The most common reasons for unnecessary use were administration for longer than recommended durations, administration for a noninfectious or nonbacterial syndrome, and treatment of colonizing or contaminating microorganisms.
Consequences of antibiotic misuse
Unwanted consequences of antimicrobial therapy include increased morbidity and mortality, adverse drug reactions, increased length of hospital stay and hospitalization costs, predisposition to secondary infections, and emergence and selection of drug‐resistant organisms.21, 22 Selection or induction of antimicrobial resistance and promotion of secondary infection with Clostridium difficileparticularly with new, more toxigenic strains23are of particular concern in the current hospital environment.22 These untoward consequences can be seen as a calculated risk of antibiotic therapy for any single‐treated patient, or as an undesired outcome measure for excessive use at the level of the healthcare institution. For example, a 7‐day course of a third‐generation cephalosporin in a particular patient increases the risk of subsequent infection from an extended‐spectrum beta‐lactamase (ESBL)‐producing gram‐negative rod. For the institution as a whole, excessive use of this antimicrobial will increase the overall prevalence and number of infections due to this troublesome resistance factor.
Definition and Goals of Antimicrobial Stewardship
The above studies show a clear need for improved, more careful and prudent use of antimicrobials, which is key to antimicrobial stewardship. Building on the definition given by the Infectious Diseases Society of America and Society for Healthcare Epidemiology of America (IDSA/SHEA),24 antimicrobial stewardship is essentially a system of personnel, informatics, data collection, and policy/procedures that promotes the optimal selection, dosing, and duration of therapy for antimicrobial agents throughout the course of their use. An effective antimicrobial stewardship program will limit inappropriate and excessive antimicrobial use, but more importantly improve and optimize therapy for the individual infected patient.
The goals of antimicrobial stewardship are listed in Table 1.24, 25 It is important to recognize that the primary goals of antimicrobial stewardship are not the reduction of healthcare costsand certainly not the reduction of drug acquisition or usage costs. As the 2007 IDSA/SHEA guidelines for institutional development of an antimicrobial stewardship program make clear, the primary goal is to focus on patient care; that is, to optimize clinical outcomes, while minimizing unintended consequences of antimicrobial use (emergence of resistance, selection of pathogenic organisms, and adverse drug reactions).24
| Prevent or slow the emergence of antimicrobial resistance |
| Optimize selection, dose and duration of therapy |
| Reduce adverse drug events, including secondary infection (eg, C. difficile antibiotic‐associated diarrhea) |
| Reduce morbidity and mortality |
| Reduce length of stay |
| Reduce healthcare expenditures |
Reduced healthcare costs without an adverse effect on quality of patient care is, however, a legitimate secondary goal of antimicrobial stewardship, and will result from optimized clinical outcomes and decreased potential collateral damage associated with pharmacotherapy. Unfortunately, it is much more difficult to measure the impact of an antimicrobial stewardship program on emergence of resistance than on drug acquisition or usage costs. As a consequence, reduction in drug acquisition/usage costs has too often been viewed as the primary (and sometimes only) justification for implementing an antimicrobial stewardship program.26
Finally, the role of effective infection control cannot be overemphasized. Infection control is clearly necessary and often sufficient to reduce HAIs. However, a comprehensive infection control program, combined with an effective antimicrobial stewardship agenda, synergistically limit the emergence and spread of antimicrobial‐resistant bacteria, reduce HAIs, control resistance, and improve overall inpatient care.24, 27 Hence, when instituting an antimicrobial stewardship program, it is essential to ensure the hospital or other healthcare institution already has a robust hospital epidemiology and infection control program in placeor to simultaneously institute one.
Constructing an Antimicrobial Stewardship Program
Infectious Diseases Society of America and Society for Healthcare Epidemiology of America Guidelines
Whereas the value of antimicrobial stewardship is widely appreciated, actually taking the steps to set up a healthcare facility program can be daunting. The guidelines established by the IDSA/SHEA for developing an institutional program represent a valuable resource and suggest that the best programs are comprehensivetaking into account local antimicrobial use and resistance patterns, as well as available resources.24 The size and nature of the institution can make a big difference in determining what program to set up and what elements it should entail; what works at one institution might not work as well at another. The program components and effectiveness of each will differ for community versus academic medical centers. A comprehensive program includes active monitoring, fostering of appropriate antimicrobial use, and collaboration with an effective infection control program as well as other hospital entities. The role of a multidisciplinary team, with administrative support, is particularly underscored in the guidelines. According to the guidelines, core members of the multidisciplinary team should include an infectious diseases physician and a clinical pharmacist with infectious diseases training. It should also ideally include a clinical microbiologist, information system specialist, infection control professional, and hospital epidemiologist.24 It is important that all members of the team are passionate about the program, oversee its implementation and daily functions, and have some sense of ownership of it. Compensation for its primary participants is crucial. Compensation not only ensures that adequate time is available for executing the daily activities of the program, but it also helps impart a greater sense of program ownership. Process and outcome measures of the program (discussed below) should be included in the performance evaluations of the compensated key participants.
Although the guidelines indicate that an infectious diseases physician should act as the program leader, this might not always be feasible or necessary. Many of the hospitals most in need of improved antimicrobial stewardship simply do not have an infectious diseases physician available to them. In addition, a lot of community hospitals share their infectious diseases physician on a consultative basis with other medical centers and facilities, and that particular specialist may not have a lot of time to invest in the program. Where having an infectious diseases physician as a core member and leader of the team is beneficial, it is not absolutely necessary. A similar argument can be made concerning the inclusion of a clinical pharmacist with infectious diseases training as a core member. Not all hospitals have or can find a clinical pharmacist with formal infectious diseases training through a didactic pharmacy residency program.
If an infectious diseases physician or clinical pharmacist with formal infectious diseases training is not available at a given institution, the team will need to include others ready to assume a greater leadership role. Although not mentioned in the guidelines, hospital medicine specialists and hospitalists are well‐suited to take on this role and can be integral to leadership of the multidisciplinary team. Hospitalists have knowledge of the hospital where they support a wide range of services and, at least in some cases, may have fewer time constraints than a subspecialty. In addition, hospital leadership and administration more often reach out to hospitalists to oversee patient quality care and safety improvement projects, the realm to which antimicrobial stewardship belongs. Regarding clinical pharmacists, an alternative to formal residency training for PharmDs are online certification programs such as MAD‐ID (Making a Difference in Infectious Diseases Pharmacotherapy), the Society of Infectious Diseases Pharmacists, or via a limited number of state medical societies.28, 29 Such certification programs should increase the number of pharmacists and PharmDs with infectious diseases training in the near future.
Antimicrobial stewardship is best considered a medical staff, rather than primary hospital, function. Individuals from the medical staff, and particularly medical staff leadership, are most adept in employing the 3 Cs that are important when constructing, implementing, and operating an institutional antimicrobial stewardship programconceptualization, communication, and coercion. Conceptualization deals with understanding what needs to be done, why it needs to be done, and how to do it, whereas communication is making sure the providers of antimicrobials receive and understand this information. Coercion might seem like a strong term, but it refers to the pressure exerted by thought leaders and others involved in the process to get things done within the institution, including all units or departments. Although ultimate responsibility for an antimicrobial stewardship program should probably lie with the medical staff, the IDSA/SHEA guidelines correctly indicate that support and collaboration of hospital administration, medical staff leadership, and local providers are essential to the success of any such program.24
A Case Study: the Wake Forest University Baptist Medical Center (WFUBMC) Program
Figure 1A,B provides an overview of the general structure of the antimicrobial stewardship program at WFUBMC implemented in 2000. To establish and provide the information needed for day‐to‐day operations of a stewardship program at WFUBMC, data are needed on how, where, and by whom antibiotics are used within the institution. In addition, microbiology data, including the frequency and susceptibility of infecting pathogens, are essential. Obtaining these data often requires the help and cooperation of the information technology (IT) staff at the institution. Considerable time and effort may be required at the outset, but once information system programs are established, ongoing data mining is much easier. At the time of program initiation, it was decided to assess antibiotic use or density (amount of drug per inpatient geographic unit) using the defined‐daily‐dose (DDD) method. This entails assigning a predetermined weight of administered antibiotic as a dose and dividing by a denominator of 1000 patient days. Subsequently, days of therapy per drug has been found to be a more accurate measure of antimicrobial consumption. When developing a program, it is vital to first obtain baseline usage data. Such data should include, if possible, a detailed inventory of usage within different units of the hospital or for particular services, or sometimes even for a particular provider with a history of high antimicrobial usage. Ongoing measurement over time allows the impact of new stewardship interventions and guidelines to be measured, as well as identifying potential new problem areas in usage.
Good microbiology data are also essential to determine problem pathogens at the institution and where they are located. Such data are useful not only to define areas of resistance (potentially warranting changes in antimicrobial policies to alter selection pressures), but also for gathering information necessary for defining local guidelines for antimicrobial use. For example, if the local antibiograms show that a particular pathogen in the hospital ICU has a particular resistance pattern, then initial empiric therapy for patients at risk of infection with those organisms should be chosen to cover the problematic resistant pathogen. Once subsequent microbiology data become available, patients not infected with the pathogen can be de‐escalated to a more narrow‐spectrum antibiotic.
As illustrated in Figure 1A, at WFUBMC, all the collected data are integrated to provide information concerning antibiotic density, usage, and patterns of antimicrobial resistance. This information is received by the staff of the antimicrobial stewardship program, which at WFUBMC is called the Center for Antimicrobial Utilization, Stewardship and Epidemiology (CAUSE). The CAUSE staff works with the day‐to‐day elements of program administration and operations and includes 2 infectious diseases physicians and 2 infectious disease PharmDs. The CAUSE staff works very closely with the microbiology laboratory, hospital pharmacy, and the medical director of hospital epidemiology and infection control.
The CAUSE program at WFUBMC administratively functions through an advisory board committee that includes thought leaders from different medical specialties and patient units of the hospitalparticularly those with high antimicrobial usage, such as hematology/oncology, pulmonary, critical care, and transplantation. The CAUSE staff and advisory board exist to exchange ideas concerning what is working or not working and where problem areas may be, and to propose possible changes in antimicrobial practices at the institution. In addition, thought leaders on the advisory board also receive and evaluate information from various sources about new antimicrobial agents and national guidelines, and, in turn, help disseminate this information to the hospital personnel who will be involved in program implementation.
At WFUBMC, it is the advisory board committee, working in conjunction with the CAUSE staff/medical director, that presents antimicrobials for formulary consideration to the Pharmacy and Therapeutics (P&T) Committee, in addition to any major interventions CAUSE and its advisory board feel are indicated. The P&T committee then reports to the medical staff executive committee and hospital leadership. As should be evident, the approach to stewardship at WFUBMC is medical staff‐driven, rather than a function of administrative constituents.
Finally, no matter how well‐organized an antimicrobial stewardship program is, it will not be fully successful if the entire medical staff does not buy into the process and agree with the need for the proposed changes and interventions involving the practice of antimicrobial therapy. It is important to spend some time early in program development to ensure that the need for an antimicrobial stewardship program, the process, and the outcomes (both in terms of patient care and clinical outcomes at the institution) are clearly communicated to the medical staff, and that their full commitment and cooperation are enlisted. In cases where hospital‐wide infection or resistance rates are known and antimicrobial utilization data are available, it is important to present such information in an understandable and convincing manner that makes the case for a proposed change or intervention, not only at the hospital level but also at the level of the patient.
Elements of a Successful Program: Basic Strategies
Potential strategies or elements of an antimicrobial stewardship program are listed in Table 2. Two evidence‐based fundamental or core strategies have been recommended by the IDSA/SHEA guidelines24 and implemented at numerous institutions with various levels of success. The first is a so‐called back‐end approach to modifying antimicrobial therapy on the basis of prospective audit of antimicrobial use, with intervention and feedback to the provider. The second is a front‐end approach using formulary restriction and preauthorization requirements for specific antimicrobial agents. Various supplemental strategies, including large group and patient case‐based education, guidelines and clinical pathways, antimicrobial order forms, and computerized clinical decision support, are also recommended.
| Program Element | Advantages | Disadvantages | Comments |
|---|---|---|---|
| Prospective Audit and Feedback | Proven in clinical studies to reduce and modify antimicrobial consumption, improve selected clinical outcomes, and decrease antimicrobial expenditures Provides one‐on‐one patient‐centered education to the clinician Allows optimization of anti‐infective pharmacology | Adherence to stewardship interventions by the clinician is voluntary Resource intensive Requires a greater amount of team member training and experience in anti‐infective therapy | Back‐end approach Identify and intervene on patients already started on antimicrobials Interventions include changing, streamlining, de‐escalation, pharmacodynamic/dose optimization, IV to PO switch, and limitation of duration of therapy |
| Restriction or Preauthorization | Proven in clinical studies to reduce and modify antimicrobial consumption, improve selected clinical outcomes, and decrease antimicrobial expenditures Together with infection control effective in controlling outbreaks of resistant or secondary pathogens (such as C. diff) | Less appealing to clinicians Loss of prescriber autonomy Potential need for after‐hours service Time intensive Potential for delay in antimicrobial administration | Front‐end approach Formulary restriction or contact a stewardship team member to obtain authorization to prescribe a selected antimicrobial Each intervention is a mini‐consult |
| Large Group Education | Can reach a large number of prescribers in a short period of time Effective for communicating the need and rationale for subsequent stewardship interventions | Not particularly effective in changing prescribing behavior without other interventions Rapid extinction of gained knowledge | Grand rounds or clinical staff meeting venues Provides information to prescribers and thought leader clinicians on justification for stewardship Feedback antimicrobial susceptibility and use data to clinicians |
| Guidelines and Pathways | Limits variation in therapy of infectious diseases Best evidence‐based Assists in adherence with regulatory and third‐party payer stipulations | Often not utilized unless combined with other stewardship strategies or elements | Best if local data and conditions are used to adapt guidelines to a specific institution |
| Computerized Physician Order Entry and Clinical Decision Support | Shown in limited clinical studies to reduce and modify antimicrobial consumption, improve selected clinical outcomes, and decrease antimicrobial expenditures Once established can greatly assist with implementation of guidelines and best‐evidence therapy. Reduces adverse events related to antimicrobials | Resource intensive during design and implementation Expensive Not readily available | Often entails modification of existing or purchasing of additional informatics |
| Microbiology Interventions | Potential to improve antimicrobial use and anti‐infective therapy for the individual patient | Not well studied | Includes cascade reporting to hide antimicrobial susceptibilities that might promote suboptimal therapy (eg, fluoroquinolone susceptibility for invasive S. aureus) Assistance with choices of automated susceptibility profile, communication of new or changes in testing protocols Preauthorization of susceptibility testing for unconventional antibiotics |
| Rapid Diagnostics | Provides opportunity for early targeted therapy Assists with de‐escalation Shown in very limited studies to decrease antimicrobial consumption and improve clinical outcomes | Not readily available Expensive | Includes PCR and antigen testing of clinical specimens or early culture growth with rapid turnaround of test results |
| Antimicrobial Cycling | Potential to decrease antimicrobial resistance for an institution or geographic unit | Not consistently shown in clinical trials to improve clinical outcomes or decrease resistance Often increases antimicrobial consumption Extremely labor intensive to ensure adherence | Changing antimicrobial protocols periodically in an attempt to reduce selection pressure for resistance |
Prospective Audit With Intervention and Feedback
This approach usually involves the use of an antimicrobial support team that reviews initial or ongoing therapy and then intervenes to provide feedback and suggested modifications to the medical care provider to improve therapy. This can be done by an infectious diseases physician, a clinical pharmacist, or a hospitalist or internist with expertise in antimicrobial therapy. The aim is to provide patient‐specific education and/or suggest changes to antimicrobial utilization (when needed) to improve and streamline therapy. Suggested interventions could include discontinuing or changing 1 or more drugs, switching intravenous to oral drug administration, and suggesting a short‐course duration of therapy. Occasionally, suggestions are made when appropriate to actually escalate or intensify therapy to increase efficacy. Identification of patients for targeting or focusing prospective audit and feedback efforts typically involves using computer surveillance to single out problem antimicrobials or problematic usage, given local resistance patterns or patient characteristics.24 Examples could include a focus on asymptomatic bacteruria, excessive duration of therapy for ventilator‐associated pneumonia, or overzealous use of certain classes of antimicrobials. Another potential activity for a prospective audit and feedback team is to review reports of patient‐specific blood and sterile body fluid culture results matched to the patient's current antimicrobial therapy. This allows for daily review of the appropriateness of therapy for potentially serious infections. Some patients seen by the antibiotic support team may be referred for infectious diseases or other expert consultative opinion if their infections or therapy are felt to be too complicated for routine prospective audit and feedback recommendations.
A number of studies have demonstrated that strategies involving prospective audit with intervention and feedback can improve antibiotic stewardship, as measured by reductions in inappropriate antibiotic use,30 reduced antibiotic costs or overall consumption,3135 greater compliance with hospital treatment guidelines or policies33, 36, 37 and, in some cases, reduced number of infections due to C difficile infection32, 37 or resistant pathogens.31, 32, 37 Prospective audit with feedback is probably the best and most effective core strategy for a community hospital program where other interventions are cumbersome or not as well tolerated by the medical staff. One potential disadvantage of the prospective audit with intervention and feedback approach is that medical provider adherence is largely voluntary. The team can make suggestions, but if the provider disagrees or is unobtainable, the suggestion is never implemented. Also, this strategy can also be resource‐intensive from a personnel perspective.
Formulary Restriction and Preauthorization
The other major strategy used to achieve antimicrobial stewardship goals involves antimicrobial restriction. This can be accomplished either by not including the particular antimicrobial agent on the hospital formulary or by requiring the medical provider to obtain preauthorization before prescribing a restricted drug. A pager system or telephone call is often used for preauthorization, whereby the clinician wishing to prescribe a particular agent calls or pages a member of the stewardship team in order to obtain prescribing permission. When using preauthorization, it is important that the individuals who receive the calls actually see patients and have clinical experience and the respect of the medical staff, as each call may be a mini‐consult. Oftentimes, the provider or prescriber making the call is asking for suggestions as to what antimicrobial might be used, and not simply to obtain authorization to use a drug that is otherwise restricted. Studies have shown that effective interventions supporting stewardship are better provided by attending infectious diseases staff or clinical pharmacists, rather than persons in training.38
Regarding the identification of antimicrobials for restriction, a program should preferentially choose those drugs that are involved in therapy for complex patients and infections. It is also a reasonable approach for drugs that are, or have the potential to be, overused for certain infections where alternatives exist. For work‐horse antimicrobials, those drugs overused or misused for several different infectious diseases, prospective audit and feedback is arguably a better strategy to reduce and modulate consumption.
Formulary restriction and preauthorization is clearly effective in modulating antimicrobial use. A large number of studies have demonstrated reductions in antibiotic drug use, and often in cost, after hospital implementation of a formulary restriction or preauthorization approach to antimicrobial stewardship.3947 It has been more difficult to demonstrate other benefits associated with this approach, although there is some support for its aid in controlling nosocomial infection outbreaks. Restriction of clindamycin48 (or clindamycin, cefotaxime, and vancomycin27) has been shown to control outbreaks of nosocomial C difficileassociated diarrhea and VRE, respectively. More recently, Internet‐based antimicrobial restriction programs49, 50 and a computerized (electronic) approval system51 have been demonstrated to reduce antibiotic use at tertiary hospitals.
Some studies have reported increased antibiotic drug susceptibilities after implementation of institutional preauthorization policies,45, 46, 51 and at least 1 reported a decreased incidence of ceftazidime‐resistant Klebsiella species after instituting a preapproval policy for cephalosporins.52 However, there is concern that restricting 1 class of antibiotics and replacing it with another will simply replace 1 resistant species with another, the so‐called squeezing the balloon effect.53 This was observed in the latter study, where a 44% reduction in ceftazidime‐resistant Klebsiella species at the hospital was accompanied by a 69% increase in incidence of imipenem‐resistant P aeruginosa.52 To assess and enable response to possible squeezing the balloon effects, the guidelines recommend monitoring overall trends in antimicrobial use for institutions using preauthorization strategies.
Possible disadvantages of preauthorization and restriction include perceived loss of autonomy for prescribers, the potential need for all‐hours support, inaccurate or misleading information from the prescriber (leading to inappropriate recommendations),24 and significant delay in stat antimicrobial administration.54 Delay in antimicrobial administration due to the time required to obtain preauthorization and have the approval communicated to the pharmacy was not observed when studied as a process measure at WFUBMC (Ohl, unpublished data, 2008).
A study by Linkin and colleagues showed that 39% of telephone calls for preauthorization of a restricted antimicrobial contained an inaccuracy in at least 1 type of patient data.38 A follow‐up by the same group demonstrated that inaccurate communication was significantly associated with inappropriate antimicrobial recommendations (odds ratio [OR] 2.2; P = .03); this was particularly the case for inaccuracies in microbiologic data (OR 7.5; P = .002).55 Also, if all‐hours support is not provided, at least 1 study has shown some physicians may engage in stealth dosing, that is, avoiding having to obtain preauthorization for restricted antimicrobials by waiting until off‐hours to place orders.56 The latter can be dealt with by following up on such orders with a prospective audit and feedback component of the program. Preauthorization is usually more difficult to employ and less accepted in non‐academic medical centers. Prospective audit and feedback may be more appropriate in such settings.
Supplemental Strategies
A number of additional options are available to supplement the 2 core strategies just described, and are listed in Table 2. Education is generally considered an essential component of any effective antimicrobial stewardship program, but it generally has little lasting impact on providers' behavior, unless it is incorporated with other active interventions.24 In particular, the large group or Grand Roundstype education, where someone describes what needs to be done and why, typically does not produce lasting behavioral changes. There might be, and often is, some short‐term modification, but long‐lasting change at the provider level requires consistent and repeated educational endeavors. Such large group educational venues are more effective and better used as a forum to describe or garner support for an impending stewardship program or intervention, rather than to teach a specific practice.
Using the antimicrobial stewardship program to adapt national guidelines to local antimicrobial use, microbiology, and resistance patterns57, 58 or using clinical (critical) pathways59 has also been shown to improve antimicrobial utilization at hospitals. National guidelines generally enjoy widespread support, but they commonly lack specific information about how to implement recommendations at a given hospital or how to incorporate local data relevant for decision making. A 2006 report by Beardsley and coworkers provides a model from WFUBMC on how local microbiologic data can be used to modify national treatment guidelines to better serve the needs of patients treated at a particular institution.60 Using American Thoracic Society (ATS) and IDSA guidelines for the management of hospital‐acquired pneumonia (HAP), together with local data on the most common bacterial pathogens and their susceptibility to piperacillin‐tazobactam, cefepime, ciprofloxacin, and amikacin (based on length of hospitalization), the WFUBMC CAUSE Advisory Board developed institution‐specific HAP guidelines. The new guidelines divided the ATS/IDSA late onset/risk of the MDR pathogens group of patients into 2 subcategories, early‐late and late‐late pneumonias. Also, unlike the national guidelines, the new guidelines did not recommend ciprofloxacin as empiric therapy, instead recommending amikacin as a component of regimens targeting late‐late pneumonias.
Newer (and in some cases not so new) information technologies can be adapted to healthcare delivery and prescriber support to improve antimicrobial stewardship. These include computer decision support61 and alert systems6265; computerized physician order entry (CPOE)66, 67; electronic medical records24; electronic retrieval of treatment guidelines or clinical texts68; and personal digital assistant (PDA) applications providing information on pathogens, diagnosis, medication, and treatment.68, 69 In addition, computer‐based surveillance64, 70, 71 and Web‐based systems for antimicrobial approval; automated clinical decision support; and/or enhanced real‐time communication between prescribers and other members of the antimicrobial stewardship team show promise for antimicrobial stewardship programs.49, 50
Computer‐assisted decision support has been shown to improve or reduce antibiotic‐susceptibility mismatches (improve selection of effective therapy), overall antibiotic use, excess antimicrobial dosages, excessive‐dose days, selection of antimicrobials for which the patient was poorly matched in terms of allergies, and antimicrobial‐related adverse events, as well as reduce antimicrobial drug costs, total hospital costs, and length of hospital stay.7277 For their part, CPOE systems have been shown to improve compliance with treatment guidelines, decrease medication and other medical errors, shorten length of hospital stay, and decrease pharmaceutical costs.66, 67, 78 In many cases, CPOE systems can now be modified to include some clinical decision support to improve antimicrobial use.78
The IDSA/SHEA guidelines note that antimicrobial decisions can be improved through use of CPOE, clinical decision support, and electronic medical records that enable incorporation of data on patient‐specific microbiology cultures and susceptibilities, hepatic and renal function, drug interactions, allergies, and cost. They also point out that computer‐based surveillance can facilitate good stewardship by enabling more efficient targeting of antimicrobial interventions, tracking of antimicrobial resistance patterns, and identification of HAIs and adverse drug events.24 Recently, a few proprietary informatics programs that perform such functions for the hospital epidemiologist and antimicrobial steward have become available, including but not limited to TheraDoc (Salt Lake City, UT), SafetySurveillor (Premier, Inc., Charlotte, NC), and BD Protect (BD Diagnostics, Austin, TX). Perhaps one of the best‐known comprehensive hospital information systems that incorporates and integrates several information technologies to improve patient care at the level of the prescriber is the Health Evaluation through Logical Processing (HELP) system at LDS Hospital in Salt Lake City, Utah.7981 Unfortunately, these programs are expensive, need considerable time for installation and validation, and do not always perform the functions needed by the medical center. The medical community has generally been slow to incorporate healthcare information technology to improve antimicrobial use or general medical care, but in the last few years more hospitals are finding their merit.
On the basis of evidence currently available, the 2007 guidelines do not recommend the routine use of antimicrobial cycling or combination therapy to prevent or reduce antimicrobial resistance. Such strategies, where at first glance might intuitively seem to make sense, have not been shown to improve patient care, improve antimicrobial choices, or reduce antimicrobial resistance. In addition, antimicrobial cycling in particular is difficult to implement and labor intensive to oversee.24
One strategy for improving antimicrobial stewardship not mentioned in the 2007 IDSA/SHEA guidelines, but might become increasingly important in the future, is the use of rapid molecular diagnostic testing. Knowing the identity of the causative pathogen sooner or being able to rapidly rule out certain pathogens should enable better decision‐making. During the 2009/2010 influenza season with H1N1 influenza, WFUBMC was able to implement rapid viral testing and learned some things that enabled improvement of hospital practices. It was found that approximately 10% to 15% of the pneumonias in immunocompromised patients at the center were not bacterial but viral, the pathogens being respiratory syncytial virus (RSV) or metapneumovirus (Ohl, unpublished data, 2010). Upon finding a viral etiology to a lower respiratory tract infection, rapid de‐escalation of antibiotic therapy was possible. If rapid diagnostics are to be performed, it is important that there are systems in place to respond quickly to the findings, so the benefits of having rapid data can be realized.
Evaluating Antimicrobial Stewardship Programs
Two general types of measures are used to evaluate the effectiveness of antimicrobial stewardship: process and outcome. As with most things done in the hospital, process measures are easier. They measure surrogate impacts of a program, accountability, resource use, and cost effectiveness. In essence, process measures evaluate whether the program accomplished what it set out to do in terms of changing certain processes or prescriber behaviors. It is important to measure resource use, as this helps to continue funding and to keep workers involved in the project. Good programs will save money; this can easily be measured, even if it is just as simple as going to the hospital pharmacy and looking at the cost of antimicrobials provided per patient day.
Outcomes like decreases in particular infections, less emergence of antimicrobial resistance, or other patient‐specific measures are likely more important in the big picture, but they are also much more difficult to measure. For example, where one would like to measure changes in pathogen resistance after making some changes in antimicrobial stewardship, it often takes years before the benefits of a particular intervention or change materialize in terms of less resistance or reduced emergence of resistance. If that type of change is to be measured, then one needs to be persistent and continue measurements over a long period of time. In addition, given the protracted amount of time before these outcomes may be observed, a number of other changes are likely to happen that coincide with the antimicrobial stewardship interventions and make assessment of causality difficult and biased.
Having said that, a number of studies have demonstrated a relationship between antibiotic restriction48, 8285 or other antimicrobial stewardship policies32, 86 and decreases in nosocomial C difficile infections or disease. Figure 2 illustrates the impact of a nonrestrictive antimicrobial stewardship program at a secondary/tertiary‐care hospital in Quebec, Canada, on an epidemic of C difficileassociated disease (CDAD) that occurred at the institution during the latter portion of 2003.86 Following program implementation, and the major drop in targeted antibiotic consumption, the incidence of CDAD also significantly decreased. Earlier implementation of infection control measures had no effect on CDAD incidence.
A smaller number of studies have reported decreases in resistant gram‐negative bacteria following implementation of antimicrobial stewardship programs. For example, Meyer and colleagues reported a marked reduction in ceftazidime‐resistant K pneumoniae at a 487‐bed general hospital in New York City after implementation of enhanced ceftazidime restriction and barrier precautions following an outbreak of infections caused by the resistant K pneumoniae.87 Similarly, Carling and coworkers reported a significant decrease in nosocomial infections caused by resistant Enterobacteriaceae following implementation of a multidisciplinary antibiotic stewardship program to minimize inappropriate use of third‐generation cephalosporins (Figure 3).32 More recently, a retrospective, longitudinal, multicenter analysis of a consortium of 22 academic health centers in the United States showed that incidence rates of carbapenem‐resistant P aeruginosa were lower at hospitals that restricted carbapenems than those that did not (P = .01).88
Evidence suggesting a beneficial impact of antimicrobial stewardship programs on resistance in gram‐positive organisms is limited. More specifically, the study by Carling and colleagues reported an apparent decrease in VRE rates following implementation of their program to reduce inappropriate use of third‐generation cephalosporins.32 The hospital had VRE rates similar to other NNIS System hospitals prior to beginning the program, but after antibiotic stewardship measures were implemented, the VRE rate began to drop, falling to 6% by 1999. This should be compared with a VRE rate of 24% for similar NNIS System hospitals in 1999.
As far as reducing healthcare costs, Figure 4A illustrates the direct antimicrobial cost savings at WFUBMC after implementation of the CAUSE antimicrobial stewardship program, and Figure 4B after supplemental interventions were implemented. Although decreasing antimicrobial cost is important, one would like to show decreases in overall healthcare costs associated with an antimicrobial stewardship program. Unfortunately, this is often a little more difficult to demonstrate. Extrapolations, however, may be possible. Because antimicrobial resistance, adverse drug effects, and secondary unintended infections such as C difficile colitis have been linked with increased patient morbidity and mortality, longer hospital stays, and increased healthcare costs,6, 89, 90 improved antimicrobial stewardship is expected to optimize patient care and lower overall healthcare costs. A study in a large tertiary care academic medical center estimated more than $4.25 million in total healthcare savings over 1 year with a stewardship program using both preauthorization and, to a lesser extent, prospective audit and feedback.91 Despite the fact cost saving should not be a primary goal of an antimicrobial stewardship program, lower antimicrobial costs can help keep a program funded and buttress a proposal for an antimicrobial stewardship program to hospital leadership.
Many hospitals recognize other areas where an antimicrobial stewardship program can demonstrate its value. This includes implementation of a rapid change in drug utilization during antimicrobial supply shortages and assistance with regulatory mandates and surgical infection prophylaxis. Stewardship teams often assist microbiology with protocols for microbiology reporting, antibiograms, planning for susceptibility testing, and communicating changes in microbiology tests or protocols to clinicians.
Conclusions
Overuse or misuse of antibiotics and other antimicrobials for hospital inpatients is relatively common, and can be associated with several unintended negative consequences. Improving medical care necessarily includes better use of antimicrobials to optimize outcomes and preserve the effectiveness of currently available agents. Further, an important additional consequence of effective antimicrobial stewardship and improved patient care is typically a lowering of overall healthcare costs. The recent 2007 IDSA/SHEA guidelines provide recommendations for developing an institutional program to enhance antimicrobial stewardship. However, individual institutions need to look closely at their own systems and patients to develop an antimicrobial stewardship program that best serves the needs of their hospital and the people it serves.
- ,, et al.Estimating health care‐associated infections and deaths in U.S. hospitals, 2002.Public Health Rep.2007;122:160–166.
- ,,.Healthcare‐associated infection in Shiraz, Iran 2004–2005.J Hosp Infect.2008;69:283–287.
- ,,,,.Healthcare‐associated infections in Finnish acute care hospitals: a national prevalence survey, 2005.J Hosp Infect.2008;69:288–294.
- .Historical and changing epidemiology of healthcare‐associated infections.J Hosp Infect.2009;73:296–304.
- ,,, et al.Four country healthcare associated infection prevalence survey 2006: overview of the results.J Hosp Infect.2008;69:230–248.
- ,,.Clinical and economic burden of antimicrobial resistance.Expert Rev Anti Infect Ther.2008;6:751–763.
- National Nosocomial Infections Surveillance (NNIS) System Report, data summary from January 1992 through June 2004, issued October 2004.Am J Infect Control.2004;32:470–485.
- .Bad bugs, no drugs: no ESCAPE revisited.Clin Infect Dis.2009;49:992–993.
- .Federal funding for the study of antimicrobial resistance in nosocomial pathogens: no ESKAPE.J Infect Dis.2008;197:1079–1081.
- ,.Resistant gram‐negative bacilli: a neglected healthcare crisis?Am J Health Syst Pharm.2007;64:S3–S21; quizS22–S24.
- ,,, et al.Antimicrobial resistance among gram‐negative bacilli causing infections in intensive care unit patients in the United States between 1993 and 2004.J Clin Microbiol.2007;45:3352–3359.
- ,,.The emerging threat of multidrug‐resistant gram‐negative organisms in long‐term care facilities.J Gerontol A Biol Sci Med Sci.2009;64:138–141.
- ,,,,.Influx of multidrug‐resistant, gram‐negative bacteria in the hospital setting and the role of elderly patients with bacterial bloodstream infection.Infect Control Hosp Epidemiol.2009;30:325–331.
- ,,.Emergence of extensively drug‐resistant and pandrug‐resistant Gram‐negative bacilli in Europe.Euro Surveill.2008;13(47)pii:19045.
- ,,, et al.The epidemic of antibiotic‐resistant infections: a call to action for the medical community from the Infectious Diseases Society of America.Clin Infect Dis.2008;46:155–164.
- ,,,,,.Bad bugs need drugs: an update on the development pipeline from the Antimicrobial Availability Task Force of the Infectious Diseases Society of America.Clin Infect Dis.2006;42:657–668.
- ,.Observations on spiraling empiricism: its causes, allure, and perils, with particular reference to antibiotic therapy.Am J Med.1989;87:201–206.
- ,.Variability in rates of use of antibacterials among 130 US hospitals and risk‐adjustment models for interhospital comparison.Infect Control Hosp Epidemiol.2008;29:203–211.
- ,,,.Trends in antibacterial use in US academic health centers: 2002 to 2006.Arch Intern Med.2008;168:2254–2260.
- ,,,,.Unnecessary use of antimicrobials in hospitalized patients: current patterns of misuse with an emphasis on the antianaerobic spectrum of activity.Arch Intern Med.2003;163:972–978.
- Polk RE, Fishman NO, eds.Antimicrobial Stewardship.7th ed.Philadelphia, PA:Churchill Livingstone Elsevier;2010. Mandell GL, Bennett JE, Dolin R, eds. Mandell, Douglas, and Bennett's Principles and Practice of Infectious Diseases; No. 1.
- .Collateral damage and what the future might hold. The need to balance prudent antibiotic utilization and stewardship with effective patient management.Int J Infect Dis.2006;10:S17–S24.
- ,,, et al.A predominantly clonal multi‐institutional outbreak of Clostridium difficile‐associated diarrhea with high morbidity and mortality.N Engl J Med.2005;353:2442–2449.
- ,, et al.Infectious Diseases Society of America and the Society for Healthcare Epidemiology of America guidelines for developing an institutional program to enhance antimicrobial stewardship.Clin Infect Dis.2007;44:159–177.
- .Antimicrobial stewardship.Semin Infect Contr.2001;1:210–221.
- ,,,,.Insights from the Society of Infectious Diseases Pharmacists on antimicrobial stewardship guidelines from the Infectious Diseases Society of America and the Society for Healthcare Epidemiology of America.Pharmacotherapy.2009;29:593–607.
- ,,,,,.Manipulation of a hospital antimicrobial formulary to control an outbreak of vancomycin‐resistant enterococci.Clin Infect Dis.1996;23:1020–1025.
- MAD‐ID: Making a Difference in Infectious Diseases Pharmacotherapy. Available at http://www.mad‐id.com. Accessed August 17,2010.
- Society of Infectious Diseases Pharmacists. The implementation of antimicrobial stewardship using a multidisciplinary approach. CME program. Available at http://www.esymposia.ashp.org/cemantimicrobial/. Accessed August 17,2010.
- ,,, et al.Academic detailing to improve use of broad‐spectrum antibiotics at an academic medical center.Arch Intern Med.2001;161:1897–1902.
- ,,, et al.A hospitalwide intervention program to optimize the quality of antibiotic use: impact on prescribing practice, antibiotic consumption, cost savings, and bacterial resistance.Clin Infect Dis.2003;37:180–186.
- ,,,,.Favorable impact of a multidisciplinary antibiotic management program conducted during 7 years.Infect Control Hosp Epidemiol.2003;24:699–706.
- ,,, et al.Antimicrobial stewardship program directed at broad‐spectrum intravenous antibiotics prescription in a tertiary hospital.Eur J Clin Microbiol Infect Dis.2009;28:1447–1456.
- ,,,,,.Antibiotic optimization: an evaluation of patient safety and economic outcomes.Arch Intern Med.1997;157:1689–1694.
- .Concurrent antibiotic review programs: a role for infectious diseases specialists at small community hospitals.Clin Infect Dis.2003;37:742–743.
- ,,,,.Improving antimicrobial use in the hospital setting by providing usage feedback to prescribing physicians.Infect Control Hosp Epidemiol.2006;27:378–382.
- ,,, et al.Successful use of feedback to improve antibiotic prescribing and reduce Clostridium difficile infection: a controlled interrupted time series.J Antimicrob Chemother.2007;59:990–995.
- ,,,,.Inaccurate communications in telephone calls to an antimicrobial stewardship program.Infect Control Hosp Epidemiol.2006;27:688–694.
- ,,,,.Effect of a vancomycin restriction policy on ordering practices during an outbreak of vancomycin‐resistant Enterococcus faecium.Arch Intern Med.1997;157:1132–1136.
- ,.Impact of voluntary vs enforced compliance of third‐generation cephalosporin use in a teaching hospital.Arch Intern Med.1992;152:554–557.
- ,,.Cost containment through restriction of cephalosporins.Am J Hosp Pharm.1981;38:1897–1900.
- ,.Controlling cephalosporin and aminoglycoside costs through pharmacy and therapeutics committee restrictions.Am J Hosp Pharm.1985;42:1343–1347.
- ,.Enforcing a policy for restricting antimicrobial drug use.Am J Health Syst Pharm.1995;52:1433–1435.
- ,,,,,.Changes in antibiotic use, cost and consumption after an antibiotic restriction policy applied by infectious disease specialists.Jpn J Infect Dis.2005;58:338–343.
- ,,,,,.Impact of an antibiotic restriction policy on hospital expenditures and bacterial susceptibilities: a lesson from a pediatric institution in a developing country.Pediatr Infect Dis J.2000;19:200–206.
- ,,,,,.Effects of requiring prior authorization for selected antimicrobials: expenditures, susceptibilities, and clinical outcomes.Clin Infect Dis.1997;25:230–239.
- ,,,.Antibiotic cost savings from formulary restrictions and physician monitoring in a medical‐school‐affiliated hospital.Am J Med.1987;83:817–823.
- ,,,,.Decrease in nosocomial Clostridium difficile‐associated diarrhea by restricting clindamycin use.Ann Intern Med.1994;120:272–277.
- ,,, et al.A World Wide Web‐based antimicrobial stewardship program improves efficiency, communication, and user satisfaction and reduces cost in a tertiary care pediatric medical center.Clin Infect Dis.2008;47:747–753.
- ,,, et al.Impact of a web‐based antimicrobial approval system on broad‐spectrum cephalosporin use at a teaching hospital.Med J Aust.2003;178:386–390.
- ,,, et al.Electronic antibiotic stewardship: reduced consumption of broad‐spectrum antibiotics using a computerized antimicrobial approval system in a hospital setting.J Antimicrob Chemother.2008;62:608–616.
- ,,, et al.Class restriction of cephalosporin use to control total cephalosporin resistance in nosocomial Klebsiella.JAMA.1998;280:1233–1237.
- .Antibiotic resistance: squeezing the balloon?JAMA.1998;280:1270–1271.
- ,,.Impact of a restrictive antimicrobial policy on the process and timing of antimicrobial administration.J Hosp Med.2010;5:E41–E45.
- ,,, et al.Effect of communication errors during calls to an antimicrobial stewardship program.Infect Control Hosp Epidemiol.2007;28:1374–1381.
- ,,,,,.Evaluation of antimicrobial therapy orders circumventing an antimicrobial stewardship program: investigating the strategy of “stealth dosing”.Infect Control Hosp Epidemiol.2007;28:551–556.
- ,,,,,.Experience with a clinical guideline for the treatment of ventilator‐associated pneumonia.Crit Care Med.2001;29:1109–1115.
- ,,,,.Short‐course empiric antibiotic therapy for patients with pulmonary infiltrates in the intensive care unit: a proposed solution for indiscriminate antibiotic prescription.Am J Respir Crit Care Med.2000;162:505–511.
- ,,,,,.A controlled trial of a critical pathway for treatment of community‐acquired pneumonia. CAPITAL Study Investigators. Community‐Acquired Pneumonia Intervention Trial Assessing Levofloxacin.JAMA.2000;283:749–755.
- ,,,,,.Using local microbiologic data to develop institution‐specific guidelines for the treatment of hospital‐acquired pneumonia.Chest.2006;130:787–793.
- .Expert clinical decision support systems to enhance antimicrobial stewardship programs: insights from the Society of Infectious Diseases Pharmacists.Pharmacotherapy.2005;25:1116–1125.
- ,,,,,.Improved perioperative antibiotic use and reduced surgical wound infections through use of computer decision analysis.Infect Control Hosp Epidemiol.1989;10:316–320.
- ,,,,.Impact of a computer‐generated alert system prompting review of antibiotic use in hospitals.J Antimicrob Chemother.2009;63:1058–1063.
- ,,,,.Therapeutic antibiotic monitoring: surveillance using a computerized expert system.Am J Med.1990;88:43–48.
- ,,,,.Improvement of intraoperative antibiotic prophylaxis in prolonged cardiac surgery by automated alerts in the operating room.Infect Control Hosp Epidemiol.2003;24:13–16.
- ,.Computer physician order entry: benefits, costs, and issues.Ann Intern Med.2003;139:31–39.
- .Computerized physician order entry in the critical care and general inpatient setting: a narrative review.J Crit Care.2004;19:271–278.
- ,,.Information technology for optimizing the management of infectious diseases.Am J Health Syst Pharm.2006;63:957–965.
- ,,.Personal digital assistant infectious diseases applications for health care professionals.Clin Infect Dis.2003;36:1018–1029.
- ,,,.Computerized surveillance of adverse drug events in hospital patients.JAMA.1991;266:2847–2851.
- ,,, et al.Computer surveillance of hospital‐acquired infections and antibiotic use.JAMA.1986;256:1007–1011.
- ,,,,.Improving empiric antibiotic selection using computer decision support.Arch Intern Med.1994;154:878–884.
- ,,,.Evaluation of a computer‐assisted antibiotic‐dose monitor.Ann Pharmacother.1999;33:1026–1031.
- ,,, et al.A computer‐assisted management program for antibiotics and other antiinfective agents.N Engl J Med.1998;338:232–238.
- ,,, et al.Impact of a computerized clinical decision support system on reducing inappropriate antimicrobial use: a randomized controlled trial.J Am Med Inform Assoc.2006;13:378–384.
- ,,,.Development and impact of a computerized pediatric antiinfective decision support program.Pediatrics.2001;108:E75.
- ,,,,.Computerized antimicrobial decision support: an offline evaluation of a database‐driven empiric antimicrobial guidance program in hospitalized patients with a bloodstream infection.Int J Med Inform.2004;73:455–460.
- ,,, et al.The impact of computerized physician order entry on medication error prevention.J Am Med Inform Assoc.1999;6:313–321.
- .Maximizing appropriate antibiotic prophylaxis for surgical patients: an update from LDS Hospital, Salt Lake City.Clin Infect Dis.2001;33Suppl 2:S78–S83.
- ,,,,.The HELP system and its application to infection control.J Hosp Infect.1991;18Suppl A:424–431.
- ,,.Decision support in medicine: lessons from the HELP system.Int J Med Inform.2003;69:273–284.
- ,,,,,.Hospital‐wide restriction of clindamycin: effect on the incidence of Clostridium difficile‐associated diarrhea and cost.Ann Intern Med.1998;128:989–995.
- ,,,,,.An antibiotic policy associated with reduced risk of Clostridium difficile‐associated diarrhoea.Age Ageing.1999;28:578–580.
- ,,, et al.Successful control of Clostridium difficile infection in an elderly care unit through use of a restrictive antibiotic policy.J Antimicrob Chemother.1997;40:707–711.
- ,,,,,.Antibiotic prescribing policy and Clostridium difficile diarrhoea.QJM.2004;97:423–429.
- ,,,,.Impact of a reduction in the use of high‐risk antibiotics on the course of an epidemic of Clostridium difficile‐associated disease caused by the hypervirulent NAP1/027 strain.Clin Infect Dis.2007;45Suppl 2:S112–S121.
- ,,,,.Nosocomial outbreak of Klebsiella infection resistant to late‐generation cephalosporins.Ann Intern Med.1993;119:353–358.
- ,,.Relationship of carbapenem restriction in 22 university teaching hospitals to carbapenem use and carbapenem‐resistant Pseudomonas aeruginosa.Antimicrob Agents Chemother.2009;53:1983–1986.
- .The relationship between antimicrobial resistance and patient outcomes: mortality, length of hospital stay, and health care costs.Clin Infect Dis.2006;42Suppl 2:S82–S89.
- ,,, et al.Hospital and societal costs of antimicrobial‐resistant infections in a Chicago teaching hospital: implications for antibiotic stewardship.Clin Infect Dis.2009;49:1175–1184.
- .Antimicrobial stewardship.Am J Med.2006;119:S53–S61; discussionS62–S70.
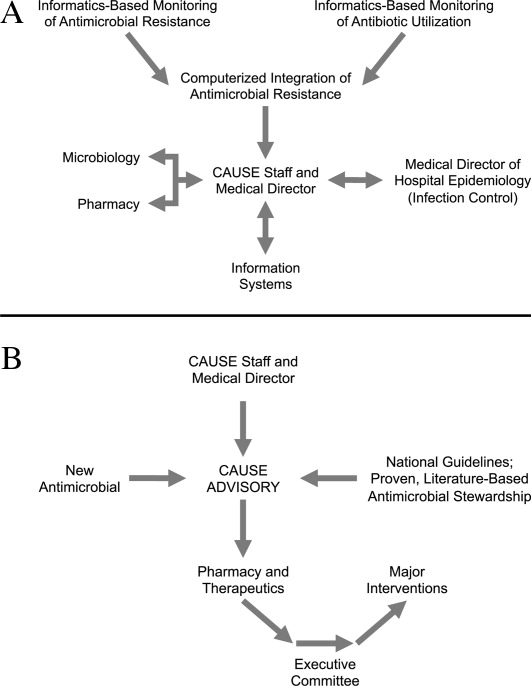
Community‐Based Parenteral Antimicrobial Therapy
. . . For the secret of the care of the patient is caring for the patient.Francis W. Peabody, October 21, 19251
Collaboration between members of a multidisciplinary team is a key component of an effective institutional antimicrobial stewardship program, which itself is a key component of optimizing the care of hospitalized patients being treated with antimicrobial agents for proven or suspected infectious diseases. However, patient care does not and should not end once the patient is discharged from the hospital. In fact, high‐quality, value‐based health care across the full range of a medical condition depends on planning for optimization of care within the hospital as well as transitions of care to the outpatient setting. This extended care plan includes collaboration with multiple members of the health care community, both inside and outside the institution. The current review examines 3 aspects of patient care across the full cycle of an infectious disease condition: (1) value‐based health care, (2) stewardship of antimicrobials, and (3) community‐based parenteral anti‐infective therapy (CoPAT) as a model for antimicrobial stewardship outside the institutional setting.
Value‐Based Health Care
Patients first want to know that the health care professionals treating them actually care about them as individuals, and only then are patients concerned about how much the medical team knows. Patient‐centered care is a critical component of value‐based health care, a term that was bandied about quite a bit during the recent and ongoing health care debate in the United States. But what exactly does it mean? First, value in health care is defined by health care outcomes as a function of or divided by the cost of delivery of care. As Dr. Michael Porter and Dr. Elizabeth Olmsted Teisberg delineated in their 2007 article in the Journal of the American Medical Association,2 as well as in the 2006 book Redefining Health Care,3 The purpose of the healthcare system is not to minimize costs but to deliver value to patients, that is, better health per dollar spent. As they discuss value, it is a patient‐centric measure, and is focused on individual patient (not just diagnosis‐related group) outcomes and the cost of care across the full cycle. In this way of looking at things, an episode of care goes beyond the treatment provided during the acute admission to also include the transition of care to the outpatient or posthospital setting.
The reforms proposed by Porter and Teisberg are best achieved when the participating health care institutions have developed an information technology platform able to integrate and fully measure care across the full cycle of a medical condition. Furthermore, there is strong evidence that patient value increases with physician and team experience and volume for a particular condition.2 High volumes tend to correlate with the development of better information technology, as well as the formation of dedicated teams with tailored facilities, and with a greater capacity for constructive feedback to improve patient outcomes. The more experience a physician and team have with the management of a particular medical condition, the greater is the opportunity to learn and refine practices to provide greater value to the patient.
The Institute of Medicine has recommended that all healthcare professionals should be educated to deliver patient‐centered care as members of an interdisciplinary team emphasizing evidence‐based practice, quality improvement, and informatics.4 As has been demonstrated for patients with congestive heart failure59 and other conditions,10, 11 outcomes improve when components of care are integrated (often by nurse‐directed teams), preparing for the transition of care from the hospital to the home.12 This concept is the basis for the community‐based parenteral anti‐infective therapy program (CoPAT) at the Cleveland Clinic as a model for antimicrobial stewardship for patients requiring parenteral antimicrobial therapy at the time of discharge from the inpatient setting.
Stewardship of Antimicrobials
The Merriam‐Webster dictionary alternatively defines a steward as: (1) an employee on a ship, airplane, bus, or train who manages the provisioning of food and attends to passengers or (2) one who actively manages affairs (manager).13 In the context of health care within an institution, one can think of clinicians as stewards or employees charged with managing patients and the drugs and other care they receive while they are attendants (passengers) at the institution. In the value‐based approach just discussed, where medical practice is organized around managing medical conditions for the entire care cycle, a medical steward would also be charged with managing or planning for patient care after discharge from the hospital or other institutional setting. Management or stewardship of antimicrobial agents is a key component of the care for patients with infectious diseases. In 2007, the Infectious Diseases Society of America and the Society for Healthcare Epidemiology of America (IDSA/SHEA) presented guidelines to aid institutions in the development of an effective hospital‐based antimicrobial stewardship program (a more detailed overview of antimicrobial stewardship is presented in the accompanying supplemental article by Dr. Ohl).14 The focus of the IDSA/SHEA guidelines was on development of programs within hospitals. Although the authors acknowledged that antimicrobial stewardship is also important in outpatient clinics and long‐term care facilities, transition of antimicrobial management after patient discharge from the hospital was not a focus of the 2007 guidelines.
A key objective of antimicrobial stewardship is to optimize antimicrobial drug selection and dosing to improve clinical outcomes while reducing drug toxicity and other potential untoward consequences of antimicrobial therapy, including selection of opportunistic organisms (eg, Clostridium difficile) or emergence of multidrug resistance in pathogens.14 A secondary objective is to reduce overall health care costs,14 which ideally would include inpatient as well as outpatient costs and those related to hospital readmission due to the initial infection or its outpatient treatment. Useful metrics for evaluation of an antimicrobial stewardship program include measures of pathogen/drug mismatch, antimicrobial costs, incidence of redundant therapy, compliance with antimicrobial drug restrictions (if applicable), days undergoing antimicrobial therapy, and number of cases of intravenous to oral conversion.14
Although the IDSA/SHEA guidelines for institutional antimicrobial stewardship programs suggest that an infectious diseases physician and clinical pharmacist with infectious diseases training should be core members of a multidisciplinary stewardship team,14 many community hospitals or smaller institutions do not have an infectious diseases physician or a readily available infectious diseases specialist for consultation. Hospitalists are often very effective advocates of appropriate use of antimicrobials and may play a leadership role on institutional antimicrobial stewardship teams. A recent study demonstrated that a hospitalist‐delivered academic detailing intervention (which included an individual appraisal of the provider's prescription pattern) significantly improved patterns of antibiotic prescribing for inpatients.15
Community‐Based Parenteral Anti‐Infective Therapy as a Systems‐Based Approach to Antimicrobial Stewardship
A systems‐based approach for antimicrobial stewardship, CoPAT has been in operation at the Cleveland Clinic, a 1200‐bed hospital in downtown Cleveland, Ohio, since November 1979. The experiences of the authors and their colleagues demonstrate it to be a value‐based proposition for the patient that uses an antimicrobial stewardship platform. Also known as outpatient parenteral antimicrobial therapy (OPAT), CoPAT refers to the practice of administering antimicrobial therapy in the home or other outpatient settings, first introduced by Rucker and Harrison in 1974 in the context of outpatient management of cystic fibrosis.16 In the United States, CoPAT is a common practice today, and the IDSA has created practice guidelines for it.17
In 1983, Rehm and Weinstein coauthored an article describing their experiences at the Cleveland Clinic, in which selected patients were trained for home‐based antimicrobial therapy.12 Figure 1 illustrates the astronomical growth that has occurred over the years at the Cleveland Clinic in the number of patients discharged from the acute care center undergoing CoPAT (Gordon, unpublished data). It is anticipated that this growth will continue and in large part reflects the complexity of patients being seen and the desire to reduce length of stay. Evaluating the quality of any medical care is difficult, but there are 3 general approaches to assessing or measuring the quality of medical care: assessing the structure of care, assessing processes of care, and assessing outcomes.18 The quality of the CoPAT program at the Cleveland Clinic can be examined in the context of these 3 areas of assessment.

Settings or the Structure of Care
In a 1966 publication on quality of medical care evaluations, Donabedian described assessment of the structure of care as one of the primary approaches to measuring the quality of care.18 By structure, Donabedian meant the settings in which medical care takes place, including the adequacy of facilities and equipment, qualifications or expertise of medical staff and their organization, the administrative structure of the institution or institutional program of interest, and other administrative and related processes supporting and directing the delivery of care. Although the structure of care has the advantage of being concrete and relatively easy to assess, to be most meaningful, it ultimately needs to be related to the processes and outcomes of care.
With respect to the CoPAT program at the Cleveland Clinic main hospital, infectious diseases consultation is required for every patient being considered for discharge with parenteral antibiotics, whether the patient is going home or to another facility, including the clinic's own skilled nursing facility (SNF). Arrangements are then made for the delivery of antibiotics at home or in SNFs or long‐term acute care (LTAC) centers. The Cleveland Clinic CoPAT program does not use an outpatient infusion center.
The Cleveland Clinic uses a mandatory infectious diseases consultation for CoPAT because there are a number of important issues that need to be addressed before the patient is discharged, and for our system this is best accomplished by an infectious diseases specialist.12 For example, is antimicrobial therapy actually required in the first place? If it is, what is the optimal type, route, and duration of therapy? Are there other medical issues that need to be addressed? Decisions also need to be made about optimal vascular access and antimicrobial selection and administration, as well as arrangements being made for monitoring clinical and laboratory aspects. It is important that there is a smooth transition of care and prescheduled follow‐up in the outpatient clinic. The identification and use of an infectious diseases clinician directing the process leads to accountability. Notably, mandatory infectious disease consultation for outpatient parenteral antibiotic therapy has been used at Baystate Medical Center with improvement in reducing costs.19
The Process of Care
Assessments of the process of care involve examination of the particulars of medical care delivery, or whether what is recognized or accepted as good medical care has been applied. As discussed by Donabedian, process of care deals with issues such as the appropriateness and completeness of information obtained through clinical history, physical examination, and diagnostic tests; justification of diagnosis and therapy; technical competence in the performance of diagnostic and therapeutic procedures; and coordination and continuity of care.18
The CoPAT initiation process at the Cleveland Clinic is illustrated in Figure 2. It is a bundled process. As already mentioned, an infectious diseases consultation and evaluation is scheduled for all patients considered for CoPAT, after which a CoPAT form is completed and a follow‐up appointment made before the patient is discharged. In addition, the vascular access team is consulted and an appropriate vascular access device is placed in the patient prior to discharge. Likewise, a case manager is enlisted to identify a health care agency or SNF for patient placement or to determine whether the patient will receive home treatment. Once the appropriate setting is identified, the case manager transmits a completed CoPAT form to the health care agency or SNF, while forwarding a copy to the CoPAT nurse coordinator in the infectious disease department.
An electronic health record system is used at the Cleveland Clinic to provide real‐time information relevant for patient management. In 2007, a structured data form for CoPAT start‐of‐care was created within the Cleveland Clinic hospital electronic health record (EHR). This form contains a number of elements relevant for setting up patients for transition to CoPAT. In particular, the electronic CoPAT form contains information about the infection(s) and microorganism(s) being treated, intravenous antibiotic(s) prescribed (including treatment stop date), concurrent oral antibiotics, premedication recommendations (if appropriate), and recommended monitoring of laboratory tests. In addition, the form contains the telephone and fax numbers of the CoPAT coordinator and the name of the responsible physician, including a scheduled appointment for follow‐up (Fig. 3). The staff physician is responsible for completing the electronic CoPAT form or prescription. This CoPAT prescription then becomes part of the patient's electronic record and is transmissible and viewable by anyone with access to the EHR. This is important in terms of follow‐up and care accountability: an infectious disease staff clinician is identified as the contact person for clinical issues when a patient is on CoPAT.
After the patient is discharged, the CoPAT coordinator in the infectious disease department becomes responsible, together with the clinic's outpatient pharmacy, for reviewing laboratory results and notifying clinicians of potential problems that need to be addressed. These issues can pertain to laboratory findings, vascular access, or new symptoms or signs observed by the home nurse or patient. All this information is communicated via electronic health record messaging and/or through direct calls to the physician, when needed.
The CoPAT program has been widely accepted by internal customers of the Cleveland Clinic, which include hospitalists. This is probably because there is autonomy and accountability with the infectious diseases staff, the program or team is available 7 days per week, and the EHR facilitates communication. In addition, the use of infectious disease‐specific subspecialty groups (eg, bone marrow and solid‐organ transplant, bone and joint, and infective endocarditis groups) increases clinical credibility, as well as value received by patients of the clinic. Furthermore, the electronic CoPAT script facilitates discharge planning. CoPATs constitute approximately 25% of all ID consultation requests at the Cleveland Clinic and help to justify the 20 clinical ID clinical FTEs.
Outcomes of Medical Care
Assessment of medical care outcomes is another frequently used approach for measuring the quality of medical care.18 Medical care outcomes that have been examined as measures of quality of care include survival, number of hospital readmissions, time between discharge and readmissions, length of initial hospital stay and subsequent readmissions, quality of life, and health care costs. As has often been said, If you cannot measure it, you cannot manage it. The CoPAT program using the EHR has facilitated retrieval of structured reports in a format that provides clinicians with real‐time data enabling assessment of outcomes. By examining this data, the CoPAT team is in a better position to contemplate potential interventions for improving outpatient care and the value patients receive.
A 36‐month review of Cleveland Clinic CoPAT patient demographics from July 2007 to June 2010 demonstrated 6287 patients (56% male) had been prescribed 9471 courses of CoPAT (Gordon, unpublished data). Seventy‐nine percent of the patients were white, 16% African American, and 5% of other races. Most patients received 1 antibiotic per CoPAT course (79.1%), whereas 18.2%, 2.5%, and 0.2% received 2, 3, and 4 antibiotics per CoPAT course, respectively. Figure 4 highlights CoPAT distribution by source for anatomic site of infection. Bone and joint infections were the most common diagnoses associated with CoPAT at the Cleveland Clinic, followed by abdominal, cardiovascular, primary disseminated disease (eg, catheter‐associated bloodstream infections), and skin and soft‐tissue infection.
Figure 5 highlights the top‐10 pathogenic microorganisms in patients being discharged from the Cleveland Clinic with CoPAT, and the top‐10 antimicrobials prescribed for these patients. As can be seen, Staphylococcus aureus (methicillin susceptible and methicillin resistant) was the number one pathogen identified for patients undergoing CoPAT, followed by coagulase‐negative Staphylococcus and Enterococcus species. The most commonly identified gram‐negative bacteria among discharged patients was Pseudomonas aeruginosa. Only 2 of the top 10 pathogens were nonbacterial: Candida species and cytomegalovirus (CMV), the latter being the result of the high volume of transplantations performed at the clinic. With respect to the intravenous antimicrobials prescribed for patients undergoing CoPAT, the most commonly prescribed agent was vancomycin, followed by piperacillin/tazobactam. Of the 10 agents, only micafungin and ganciclovir were not antibacterial agents, indicating that the vast majority of patients discharged from the Cleveland Clinic with CoPAT had had bacterial, rather than fungal or viral, infections.
Of particular note, data collected from July 2007 through December 2008 demonstrated that more than 80% of patients discharged from the hospital with CoPAT did so with a prescheduled follow‐up visit. This patient‐centric measure is important because patients may not follow through with establishing appointments for follow‐up visits once discharge has already occurred. The Cleveland Clinic prides itself on making sure that a follow‐up appointment is actually made before the time of discharge for the vast majority of patients. The process also facilitates continuity of care with a specific infectious disease physician.
The various outcomes data collected by the Cleveland Clinic CoPAT Registry puts it in the position of being able to use the data to identify areas for improvement. Some of the projects made possible by the CoPAT Registry include analysis of: (1) outcomes of CoPAT in patients with bone and joint infections, (2) intensity of care in patients with cardiac and cardiac device infections while undergoing CoPAT, (3) C. difficile infections in patients undergoing CoPAT, and (4) emergency department (ED) visits or unanticipated readmissions in patients undergoing CoPAT. With respect to the last point, a 2009 article by Jencks and colleagues reported that 19.6% of the approximately 12 million Medicare beneficiaries who had been discharged from a hospital were rehospitalized within 30 days.20 Moreover, more than a third (34%) were rehospitalized within 90 days of discharge. It was estimated that no more than 10% of these readmissions were scheduled. More than 50% of patients with a medical condition who were rehospitalized within 30 days of discharge had not been billed for a physician visit between the time of discharge and hospitalization.20 This suggests that scheduling a follow‐up visit at the time of discharge might have reduced the need for many of these rehospitalizations. Unplanned rehospitalizations among the Medicare patients examined were not only relatively common but were also costly, resulting in an estimated $17.4 billion in additional Medicare costs.20 A New York Times editorial accompanying publication of the Jencks article noted that rehospitalizations and accompanying costs might be reduced by better discharge planning and closer cooperation between hospitals and physicians to ensure follow‐up care.21
At the Cleveland Clinic, data have recently been collected on the reasons for ED visits or hospital readmissions for patients receiving CoPAT at home through the Cleveland Clinic home care program. As illustrated in Figure 6, 24% of ED visits22 and 41% of hospital readmissions (Gordon, unpublished data) were for the infection being treated. Vascular access complications accounted for 23% of ED visits but only 2% of hospital readmissions. Nearly 50% of ED visits and 60% of hospital readmissions were for a reason unrelated to the infection being treated or CoPAT. It is hoped that closer examination of the data and perhaps additional analyses will suggest interventions to further reduce preventable readmissions or ED visits among patients discharged from the Cleveland Clinic on CoPAT.
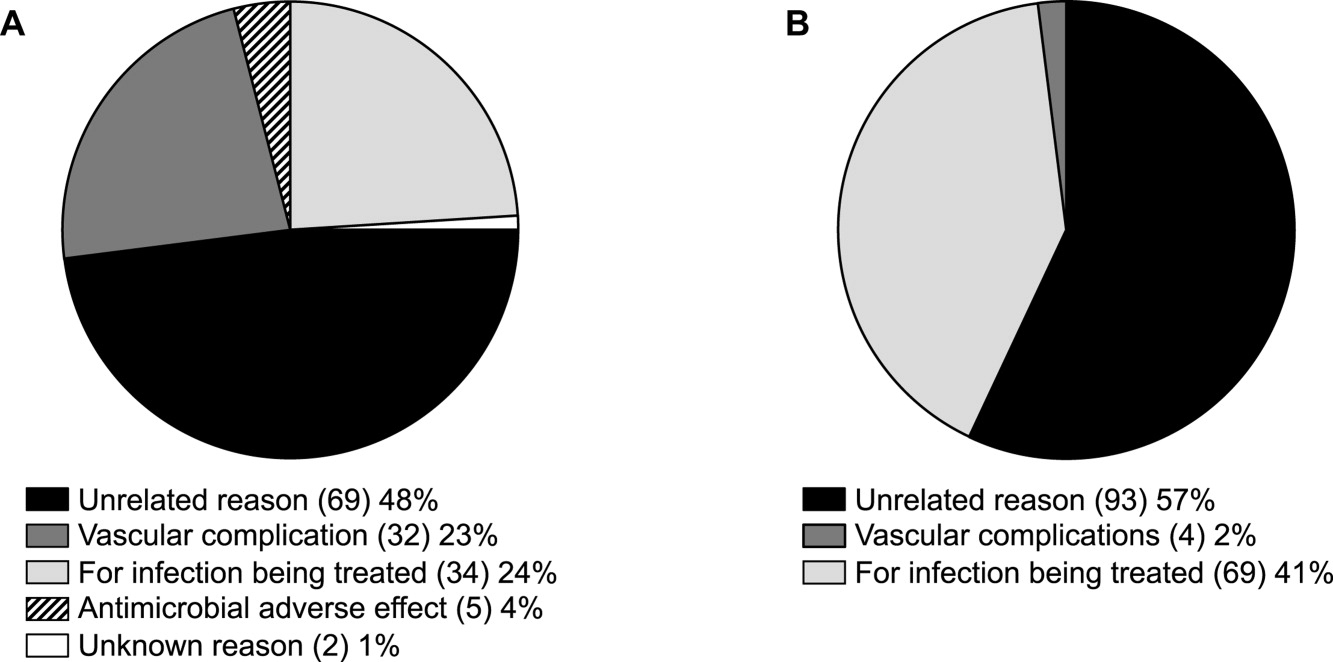
Conclusions
Attention to antimicrobial stewardship and patient care should not end once the patient is discharged from the hospital or other institutional setting. Patients expect and should receive value‐based health care across the full cycle of their medical condition, and it is the responsibility of those caring for them to prepare for and provide such care during as well as after hospital discharge. The CoPAT program at the Cleveland Clinic provides a model for the extension of antimicrobial stewardship into the outpatient setting. The effectiveness of the program depends on a patient‐centric approach involving coordination and use of the expertise of multiple members of a team dedicated to patient value and facilitated by hospital‐based EHRs specialized for optimizing the transition of care into the outpatient setting for all patients scheduled to receive CoPAT. The quality of medical care provided by the Cleveland Clinic or other hospitals can be accessed through measurements of the structure, processes, and outcomes of care provided by the respective institutions. The data obtained can then be used to further refine care to optimize outcomes and provide high value for the patients treated at the institution. Achieving and then maintaining high‐quality medical care that provides value to patients is an ongoing process that should never be taken for granted.
- .The caring physician: the life of Dr. Francis W. Peabody [book review].N Engl J Med.1993;328:817–818.
- ,.How physicians can change the future of health care.JAMA.2007;297:1103–1111.
- ,.Redefining Health Care: Creating Value‐Based Competition on Results.Boston, MA:Harvard Business Press;2006.
- Greiner AC, Knebel E, eds.Health Professions Education: A Bridge to Quality. Committee on the Health Professions Education Summit.Washington, DC:National Academies Press;2003.
- ,,, et al.Comprehensive discharge planning and home follow‐up of hospitalized elders: a randomized clinical trial.JAMA.1999;281:613–620.
- ,,,,,.Transitional care of older adults hospitalized with heart failure: a randomized, controlled trial.J Am Geriatr Soc.2004;52:675–684.
- ,,,,,.Comprehensive discharge planning with postdischarge support for older patients with congestive heart failure: a meta‐analysis.JAMA.2004;291:1358–1367.
- ,,,,,.A multidisciplinary intervention to prevent the readmission of elderly patients with congestive heart failure.N Engl J Med.1995;333:1190–1195.
- ,,,.Prolonged beneficial effects of a home‐based intervention on unplanned readmissions and mortality among patients with congestive heart failure.Arch Intern Med.1999;159:257–261.
- ,,,.A randomized, controlled trial of comprehensive geriatric assessment and multidisciplinary intervention after discharge of elderly from the emergency department–the DEED II study.J Am Geriatr Soc.2004;52:1417–1423.
- ,,,,.A randomized trial of comprehensive geriatric assessment and home intervention in the care of hospitalized patients.Age Ageing.1999;28:543–550.
- ,.Home intravenous antibiotic therapy: a team approach.Ann Intern Med.1983;99:388–392.
- Merriam‐Webster Dictionary Online. Definition of steward. Available at http://www.merriam‐webster.com/dictionary/steward. Accessed July 14,2010.
- ,,, et al.Infectious Diseases Society of America and the Society for Healthcare Epidemiology of America guidelines for developing an institutional program to enhance antimicrobial stewardship.Clin Infect Dis.2007;44:159–177.
- ,,,.Improving antibiotic utilization among hospitalists: a pilot academic detailing project with a public health approach.J Hosp Med.2008;3:64–70.
- ,.Outpatient intravenous medications in the management of cystic fibrosis.Pediatrics.1974;54:358–360.
- ,,, et al.Practice guidelines for outpatient parenteral antimicrobial therapy. IDSA guidelines.Clin Infect Dis.2004;38:1651–1672.
- .Evaluating the quality of medical care.Milbank Mem Fund Q.1966;44(Suppl):166–206.
- ,,.Impact of mandatory inpatient infectious disease consultation on outpatient parenteral antibiotic therapy.Am J Med Sci.2005;330:60–64.
- ,,.Rehospitalizations among patients in the Medicare fee‐for‐service program.N Engl J Med.2009;360:1418–1428.
- The New York Times. Editorial: Back in the Hospital Again. April 15, 2009. Available at http://www.nytimes.com/2009/04/16/opinion/16thu2.html. Accessed July 16,2010.
- ,,,,,.Emergency department visits of patients on community‐based parenteral anti‐infective therapy at home. Presented at the 47th annual meeting of IDSA, Philadelphia, PA, October 29‐November 1, 2009. Poster 462.
. . . For the secret of the care of the patient is caring for the patient.Francis W. Peabody, October 21, 19251
Collaboration between members of a multidisciplinary team is a key component of an effective institutional antimicrobial stewardship program, which itself is a key component of optimizing the care of hospitalized patients being treated with antimicrobial agents for proven or suspected infectious diseases. However, patient care does not and should not end once the patient is discharged from the hospital. In fact, high‐quality, value‐based health care across the full range of a medical condition depends on planning for optimization of care within the hospital as well as transitions of care to the outpatient setting. This extended care plan includes collaboration with multiple members of the health care community, both inside and outside the institution. The current review examines 3 aspects of patient care across the full cycle of an infectious disease condition: (1) value‐based health care, (2) stewardship of antimicrobials, and (3) community‐based parenteral anti‐infective therapy (CoPAT) as a model for antimicrobial stewardship outside the institutional setting.
Value‐Based Health Care
Patients first want to know that the health care professionals treating them actually care about them as individuals, and only then are patients concerned about how much the medical team knows. Patient‐centered care is a critical component of value‐based health care, a term that was bandied about quite a bit during the recent and ongoing health care debate in the United States. But what exactly does it mean? First, value in health care is defined by health care outcomes as a function of or divided by the cost of delivery of care. As Dr. Michael Porter and Dr. Elizabeth Olmsted Teisberg delineated in their 2007 article in the Journal of the American Medical Association,2 as well as in the 2006 book Redefining Health Care,3 The purpose of the healthcare system is not to minimize costs but to deliver value to patients, that is, better health per dollar spent. As they discuss value, it is a patient‐centric measure, and is focused on individual patient (not just diagnosis‐related group) outcomes and the cost of care across the full cycle. In this way of looking at things, an episode of care goes beyond the treatment provided during the acute admission to also include the transition of care to the outpatient or posthospital setting.
The reforms proposed by Porter and Teisberg are best achieved when the participating health care institutions have developed an information technology platform able to integrate and fully measure care across the full cycle of a medical condition. Furthermore, there is strong evidence that patient value increases with physician and team experience and volume for a particular condition.2 High volumes tend to correlate with the development of better information technology, as well as the formation of dedicated teams with tailored facilities, and with a greater capacity for constructive feedback to improve patient outcomes. The more experience a physician and team have with the management of a particular medical condition, the greater is the opportunity to learn and refine practices to provide greater value to the patient.
The Institute of Medicine has recommended that all healthcare professionals should be educated to deliver patient‐centered care as members of an interdisciplinary team emphasizing evidence‐based practice, quality improvement, and informatics.4 As has been demonstrated for patients with congestive heart failure59 and other conditions,10, 11 outcomes improve when components of care are integrated (often by nurse‐directed teams), preparing for the transition of care from the hospital to the home.12 This concept is the basis for the community‐based parenteral anti‐infective therapy program (CoPAT) at the Cleveland Clinic as a model for antimicrobial stewardship for patients requiring parenteral antimicrobial therapy at the time of discharge from the inpatient setting.
Stewardship of Antimicrobials
The Merriam‐Webster dictionary alternatively defines a steward as: (1) an employee on a ship, airplane, bus, or train who manages the provisioning of food and attends to passengers or (2) one who actively manages affairs (manager).13 In the context of health care within an institution, one can think of clinicians as stewards or employees charged with managing patients and the drugs and other care they receive while they are attendants (passengers) at the institution. In the value‐based approach just discussed, where medical practice is organized around managing medical conditions for the entire care cycle, a medical steward would also be charged with managing or planning for patient care after discharge from the hospital or other institutional setting. Management or stewardship of antimicrobial agents is a key component of the care for patients with infectious diseases. In 2007, the Infectious Diseases Society of America and the Society for Healthcare Epidemiology of America (IDSA/SHEA) presented guidelines to aid institutions in the development of an effective hospital‐based antimicrobial stewardship program (a more detailed overview of antimicrobial stewardship is presented in the accompanying supplemental article by Dr. Ohl).14 The focus of the IDSA/SHEA guidelines was on development of programs within hospitals. Although the authors acknowledged that antimicrobial stewardship is also important in outpatient clinics and long‐term care facilities, transition of antimicrobial management after patient discharge from the hospital was not a focus of the 2007 guidelines.
A key objective of antimicrobial stewardship is to optimize antimicrobial drug selection and dosing to improve clinical outcomes while reducing drug toxicity and other potential untoward consequences of antimicrobial therapy, including selection of opportunistic organisms (eg, Clostridium difficile) or emergence of multidrug resistance in pathogens.14 A secondary objective is to reduce overall health care costs,14 which ideally would include inpatient as well as outpatient costs and those related to hospital readmission due to the initial infection or its outpatient treatment. Useful metrics for evaluation of an antimicrobial stewardship program include measures of pathogen/drug mismatch, antimicrobial costs, incidence of redundant therapy, compliance with antimicrobial drug restrictions (if applicable), days undergoing antimicrobial therapy, and number of cases of intravenous to oral conversion.14
Although the IDSA/SHEA guidelines for institutional antimicrobial stewardship programs suggest that an infectious diseases physician and clinical pharmacist with infectious diseases training should be core members of a multidisciplinary stewardship team,14 many community hospitals or smaller institutions do not have an infectious diseases physician or a readily available infectious diseases specialist for consultation. Hospitalists are often very effective advocates of appropriate use of antimicrobials and may play a leadership role on institutional antimicrobial stewardship teams. A recent study demonstrated that a hospitalist‐delivered academic detailing intervention (which included an individual appraisal of the provider's prescription pattern) significantly improved patterns of antibiotic prescribing for inpatients.15
Community‐Based Parenteral Anti‐Infective Therapy as a Systems‐Based Approach to Antimicrobial Stewardship
A systems‐based approach for antimicrobial stewardship, CoPAT has been in operation at the Cleveland Clinic, a 1200‐bed hospital in downtown Cleveland, Ohio, since November 1979. The experiences of the authors and their colleagues demonstrate it to be a value‐based proposition for the patient that uses an antimicrobial stewardship platform. Also known as outpatient parenteral antimicrobial therapy (OPAT), CoPAT refers to the practice of administering antimicrobial therapy in the home or other outpatient settings, first introduced by Rucker and Harrison in 1974 in the context of outpatient management of cystic fibrosis.16 In the United States, CoPAT is a common practice today, and the IDSA has created practice guidelines for it.17
In 1983, Rehm and Weinstein coauthored an article describing their experiences at the Cleveland Clinic, in which selected patients were trained for home‐based antimicrobial therapy.12 Figure 1 illustrates the astronomical growth that has occurred over the years at the Cleveland Clinic in the number of patients discharged from the acute care center undergoing CoPAT (Gordon, unpublished data). It is anticipated that this growth will continue and in large part reflects the complexity of patients being seen and the desire to reduce length of stay. Evaluating the quality of any medical care is difficult, but there are 3 general approaches to assessing or measuring the quality of medical care: assessing the structure of care, assessing processes of care, and assessing outcomes.18 The quality of the CoPAT program at the Cleveland Clinic can be examined in the context of these 3 areas of assessment.
Settings or the Structure of Care
In a 1966 publication on quality of medical care evaluations, Donabedian described assessment of the structure of care as one of the primary approaches to measuring the quality of care.18 By structure, Donabedian meant the settings in which medical care takes place, including the adequacy of facilities and equipment, qualifications or expertise of medical staff and their organization, the administrative structure of the institution or institutional program of interest, and other administrative and related processes supporting and directing the delivery of care. Although the structure of care has the advantage of being concrete and relatively easy to assess, to be most meaningful, it ultimately needs to be related to the processes and outcomes of care.
With respect to the CoPAT program at the Cleveland Clinic main hospital, infectious diseases consultation is required for every patient being considered for discharge with parenteral antibiotics, whether the patient is going home or to another facility, including the clinic's own skilled nursing facility (SNF). Arrangements are then made for the delivery of antibiotics at home or in SNFs or long‐term acute care (LTAC) centers. The Cleveland Clinic CoPAT program does not use an outpatient infusion center.
The Cleveland Clinic uses a mandatory infectious diseases consultation for CoPAT because there are a number of important issues that need to be addressed before the patient is discharged, and for our system this is best accomplished by an infectious diseases specialist.12 For example, is antimicrobial therapy actually required in the first place? If it is, what is the optimal type, route, and duration of therapy? Are there other medical issues that need to be addressed? Decisions also need to be made about optimal vascular access and antimicrobial selection and administration, as well as arrangements being made for monitoring clinical and laboratory aspects. It is important that there is a smooth transition of care and prescheduled follow‐up in the outpatient clinic. The identification and use of an infectious diseases clinician directing the process leads to accountability. Notably, mandatory infectious disease consultation for outpatient parenteral antibiotic therapy has been used at Baystate Medical Center with improvement in reducing costs.19
The Process of Care
Assessments of the process of care involve examination of the particulars of medical care delivery, or whether what is recognized or accepted as good medical care has been applied. As discussed by Donabedian, process of care deals with issues such as the appropriateness and completeness of information obtained through clinical history, physical examination, and diagnostic tests; justification of diagnosis and therapy; technical competence in the performance of diagnostic and therapeutic procedures; and coordination and continuity of care.18
The CoPAT initiation process at the Cleveland Clinic is illustrated in Figure 2. It is a bundled process. As already mentioned, an infectious diseases consultation and evaluation is scheduled for all patients considered for CoPAT, after which a CoPAT form is completed and a follow‐up appointment made before the patient is discharged. In addition, the vascular access team is consulted and an appropriate vascular access device is placed in the patient prior to discharge. Likewise, a case manager is enlisted to identify a health care agency or SNF for patient placement or to determine whether the patient will receive home treatment. Once the appropriate setting is identified, the case manager transmits a completed CoPAT form to the health care agency or SNF, while forwarding a copy to the CoPAT nurse coordinator in the infectious disease department.
An electronic health record system is used at the Cleveland Clinic to provide real‐time information relevant for patient management. In 2007, a structured data form for CoPAT start‐of‐care was created within the Cleveland Clinic hospital electronic health record (EHR). This form contains a number of elements relevant for setting up patients for transition to CoPAT. In particular, the electronic CoPAT form contains information about the infection(s) and microorganism(s) being treated, intravenous antibiotic(s) prescribed (including treatment stop date), concurrent oral antibiotics, premedication recommendations (if appropriate), and recommended monitoring of laboratory tests. In addition, the form contains the telephone and fax numbers of the CoPAT coordinator and the name of the responsible physician, including a scheduled appointment for follow‐up (Fig. 3). The staff physician is responsible for completing the electronic CoPAT form or prescription. This CoPAT prescription then becomes part of the patient's electronic record and is transmissible and viewable by anyone with access to the EHR. This is important in terms of follow‐up and care accountability: an infectious disease staff clinician is identified as the contact person for clinical issues when a patient is on CoPAT.
After the patient is discharged, the CoPAT coordinator in the infectious disease department becomes responsible, together with the clinic's outpatient pharmacy, for reviewing laboratory results and notifying clinicians of potential problems that need to be addressed. These issues can pertain to laboratory findings, vascular access, or new symptoms or signs observed by the home nurse or patient. All this information is communicated via electronic health record messaging and/or through direct calls to the physician, when needed.
The CoPAT program has been widely accepted by internal customers of the Cleveland Clinic, which include hospitalists. This is probably because there is autonomy and accountability with the infectious diseases staff, the program or team is available 7 days per week, and the EHR facilitates communication. In addition, the use of infectious disease‐specific subspecialty groups (eg, bone marrow and solid‐organ transplant, bone and joint, and infective endocarditis groups) increases clinical credibility, as well as value received by patients of the clinic. Furthermore, the electronic CoPAT script facilitates discharge planning. CoPATs constitute approximately 25% of all ID consultation requests at the Cleveland Clinic and help to justify the 20 clinical ID clinical FTEs.
Outcomes of Medical Care
Assessment of medical care outcomes is another frequently used approach for measuring the quality of medical care.18 Medical care outcomes that have been examined as measures of quality of care include survival, number of hospital readmissions, time between discharge and readmissions, length of initial hospital stay and subsequent readmissions, quality of life, and health care costs. As has often been said, If you cannot measure it, you cannot manage it. The CoPAT program using the EHR has facilitated retrieval of structured reports in a format that provides clinicians with real‐time data enabling assessment of outcomes. By examining this data, the CoPAT team is in a better position to contemplate potential interventions for improving outpatient care and the value patients receive.
A 36‐month review of Cleveland Clinic CoPAT patient demographics from July 2007 to June 2010 demonstrated 6287 patients (56% male) had been prescribed 9471 courses of CoPAT (Gordon, unpublished data). Seventy‐nine percent of the patients were white, 16% African American, and 5% of other races. Most patients received 1 antibiotic per CoPAT course (79.1%), whereas 18.2%, 2.5%, and 0.2% received 2, 3, and 4 antibiotics per CoPAT course, respectively. Figure 4 highlights CoPAT distribution by source for anatomic site of infection. Bone and joint infections were the most common diagnoses associated with CoPAT at the Cleveland Clinic, followed by abdominal, cardiovascular, primary disseminated disease (eg, catheter‐associated bloodstream infections), and skin and soft‐tissue infection.
Figure 5 highlights the top‐10 pathogenic microorganisms in patients being discharged from the Cleveland Clinic with CoPAT, and the top‐10 antimicrobials prescribed for these patients. As can be seen, Staphylococcus aureus (methicillin susceptible and methicillin resistant) was the number one pathogen identified for patients undergoing CoPAT, followed by coagulase‐negative Staphylococcus and Enterococcus species. The most commonly identified gram‐negative bacteria among discharged patients was Pseudomonas aeruginosa. Only 2 of the top 10 pathogens were nonbacterial: Candida species and cytomegalovirus (CMV), the latter being the result of the high volume of transplantations performed at the clinic. With respect to the intravenous antimicrobials prescribed for patients undergoing CoPAT, the most commonly prescribed agent was vancomycin, followed by piperacillin/tazobactam. Of the 10 agents, only micafungin and ganciclovir were not antibacterial agents, indicating that the vast majority of patients discharged from the Cleveland Clinic with CoPAT had had bacterial, rather than fungal or viral, infections.
Of particular note, data collected from July 2007 through December 2008 demonstrated that more than 80% of patients discharged from the hospital with CoPAT did so with a prescheduled follow‐up visit. This patient‐centric measure is important because patients may not follow through with establishing appointments for follow‐up visits once discharge has already occurred. The Cleveland Clinic prides itself on making sure that a follow‐up appointment is actually made before the time of discharge for the vast majority of patients. The process also facilitates continuity of care with a specific infectious disease physician.
The various outcomes data collected by the Cleveland Clinic CoPAT Registry puts it in the position of being able to use the data to identify areas for improvement. Some of the projects made possible by the CoPAT Registry include analysis of: (1) outcomes of CoPAT in patients with bone and joint infections, (2) intensity of care in patients with cardiac and cardiac device infections while undergoing CoPAT, (3) C. difficile infections in patients undergoing CoPAT, and (4) emergency department (ED) visits or unanticipated readmissions in patients undergoing CoPAT. With respect to the last point, a 2009 article by Jencks and colleagues reported that 19.6% of the approximately 12 million Medicare beneficiaries who had been discharged from a hospital were rehospitalized within 30 days.20 Moreover, more than a third (34%) were rehospitalized within 90 days of discharge. It was estimated that no more than 10% of these readmissions were scheduled. More than 50% of patients with a medical condition who were rehospitalized within 30 days of discharge had not been billed for a physician visit between the time of discharge and hospitalization.20 This suggests that scheduling a follow‐up visit at the time of discharge might have reduced the need for many of these rehospitalizations. Unplanned rehospitalizations among the Medicare patients examined were not only relatively common but were also costly, resulting in an estimated $17.4 billion in additional Medicare costs.20 A New York Times editorial accompanying publication of the Jencks article noted that rehospitalizations and accompanying costs might be reduced by better discharge planning and closer cooperation between hospitals and physicians to ensure follow‐up care.21
At the Cleveland Clinic, data have recently been collected on the reasons for ED visits or hospital readmissions for patients receiving CoPAT at home through the Cleveland Clinic home care program. As illustrated in Figure 6, 24% of ED visits22 and 41% of hospital readmissions (Gordon, unpublished data) were for the infection being treated. Vascular access complications accounted for 23% of ED visits but only 2% of hospital readmissions. Nearly 50% of ED visits and 60% of hospital readmissions were for a reason unrelated to the infection being treated or CoPAT. It is hoped that closer examination of the data and perhaps additional analyses will suggest interventions to further reduce preventable readmissions or ED visits among patients discharged from the Cleveland Clinic on CoPAT.
Conclusions
Attention to antimicrobial stewardship and patient care should not end once the patient is discharged from the hospital or other institutional setting. Patients expect and should receive value‐based health care across the full cycle of their medical condition, and it is the responsibility of those caring for them to prepare for and provide such care during as well as after hospital discharge. The CoPAT program at the Cleveland Clinic provides a model for the extension of antimicrobial stewardship into the outpatient setting. The effectiveness of the program depends on a patient‐centric approach involving coordination and use of the expertise of multiple members of a team dedicated to patient value and facilitated by hospital‐based EHRs specialized for optimizing the transition of care into the outpatient setting for all patients scheduled to receive CoPAT. The quality of medical care provided by the Cleveland Clinic or other hospitals can be accessed through measurements of the structure, processes, and outcomes of care provided by the respective institutions. The data obtained can then be used to further refine care to optimize outcomes and provide high value for the patients treated at the institution. Achieving and then maintaining high‐quality medical care that provides value to patients is an ongoing process that should never be taken for granted.
- .The caring physician: the life of Dr. Francis W. Peabody [book review].N Engl J Med.1993;328:817–818.
- ,.How physicians can change the future of health care.JAMA.2007;297:1103–1111.
- ,.Redefining Health Care: Creating Value‐Based Competition on Results.Boston, MA:Harvard Business Press;2006.
- Greiner AC, Knebel E, eds.Health Professions Education: A Bridge to Quality. Committee on the Health Professions Education Summit.Washington, DC:National Academies Press;2003.
- ,,, et al.Comprehensive discharge planning and home follow‐up of hospitalized elders: a randomized clinical trial.JAMA.1999;281:613–620.
- ,,,,,.Transitional care of older adults hospitalized with heart failure: a randomized, controlled trial.J Am Geriatr Soc.2004;52:675–684.
- ,,,,,.Comprehensive discharge planning with postdischarge support for older patients with congestive heart failure: a meta‐analysis.JAMA.2004;291:1358–1367.
- ,,,,,.A multidisciplinary intervention to prevent the readmission of elderly patients with congestive heart failure.N Engl J Med.1995;333:1190–1195.
- ,,,.Prolonged beneficial effects of a home‐based intervention on unplanned readmissions and mortality among patients with congestive heart failure.Arch Intern Med.1999;159:257–261.
- ,,,.A randomized, controlled trial of comprehensive geriatric assessment and multidisciplinary intervention after discharge of elderly from the emergency department–the DEED II study.J Am Geriatr Soc.2004;52:1417–1423.
- ,,,,.A randomized trial of comprehensive geriatric assessment and home intervention in the care of hospitalized patients.Age Ageing.1999;28:543–550.
- ,.Home intravenous antibiotic therapy: a team approach.Ann Intern Med.1983;99:388–392.
- Merriam‐Webster Dictionary Online. Definition of steward. Available at http://www.merriam‐webster.com/dictionary/steward. Accessed July 14,2010.
- ,,, et al.Infectious Diseases Society of America and the Society for Healthcare Epidemiology of America guidelines for developing an institutional program to enhance antimicrobial stewardship.Clin Infect Dis.2007;44:159–177.
- ,,,.Improving antibiotic utilization among hospitalists: a pilot academic detailing project with a public health approach.J Hosp Med.2008;3:64–70.
- ,.Outpatient intravenous medications in the management of cystic fibrosis.Pediatrics.1974;54:358–360.
- ,,, et al.Practice guidelines for outpatient parenteral antimicrobial therapy. IDSA guidelines.Clin Infect Dis.2004;38:1651–1672.
- .Evaluating the quality of medical care.Milbank Mem Fund Q.1966;44(Suppl):166–206.
- ,,.Impact of mandatory inpatient infectious disease consultation on outpatient parenteral antibiotic therapy.Am J Med Sci.2005;330:60–64.
- ,,.Rehospitalizations among patients in the Medicare fee‐for‐service program.N Engl J Med.2009;360:1418–1428.
- The New York Times. Editorial: Back in the Hospital Again. April 15, 2009. Available at http://www.nytimes.com/2009/04/16/opinion/16thu2.html. Accessed July 16,2010.
- ,,,,,.Emergency department visits of patients on community‐based parenteral anti‐infective therapy at home. Presented at the 47th annual meeting of IDSA, Philadelphia, PA, October 29‐November 1, 2009. Poster 462.
Antibiotic stewardship: Optimizing antibiotic use in an era of increasing resistance and rising costs
RELEASE DATE: January 15, 2011 EXPIRATION DATE: January 31, 2012
Estimated time to complete the activity: 1 hour 45 minutes
Jointly sponsored by Postgraduate Institute for Medicine and Global Education Exchange, Inc
This activity is supported by an educational grant from Merck & Co., Inc.
Program Description
With antimicrobial resistance on the rise and very few new pharmaceutical agents in development, a well‐managed antimicrobial stewardship program in the hospital becomes the first‐line defense against the emergence of resistance and provides not only a cost‐containment measure but also ensures the continued efficacy of available antimicrobials. A successful stewardship program knows and understands the local epidemiology and utilizes a multidisciplinary strategy to ensure the selection of an appropriate antibiotic at the right dose for the right duration. In addition, stewardship in the community‐based parenteral antiinfective therapy (CoPAT) program provides an opportunity for an integrated patient‐centric model of care as well as continunity of care when patients transition from inpatient to outpatient setting.
Learning Objectives
-
Explain the impact of multidisciplinary antimicrobial stewardship programs on the emergence and transmission of antimicrobial‐resistant microorganisms
-
Identify potential challenges and controversies related to the implementation of antimicrobial stewardship programs in health systems
-
Use pharmacokinetic and pharmacodynamic data to facilitate appropriate antimicrobial use
-
Describe the role of CoPAT in an integrated patient‐centric model of antimicrobial stewardship and pharmaco epidemiology
-
Illustrate how a CoPAT model of care can be used to mitigate complications and prevent emergency room visits and readmissions
Target Audience
This activity has been designed to meet the educational needs of hospitalists and other healthcare providers involved in the treatment of patients with infectious diseases.
Accreditation Statement
This activity has been planned and implemented in accordance with the Essential Areas and policies of the Accreditation Council for Continuing Medical Education (ACCME) through the joint sponsorship of Postgraduate Institute for Medicine (PIM) and Global Education Exchange, Inc. (GLOBEX). PIM is accredited by the ACCME to provide continuing medical education for physicians.
Credit Designation
Postgraduate Institute for Medicine designates this educational activity for a maximum of 1.75 AMA PRA Category 1 Credit(s). Physicians should only claim credit commensurate with the extent of their participation in the activity.
Faculty
James Pile, MD [Chairman] Director, Division of Hospital Medicine Case Western Reserve University at MetroHealth Medical Center Cleveland, Ohio Steven M. Gordon, MD Chairman, Department of Infectious Disease Cleveland Clinic, Cleveland, Ohio Nabin Shrestha, MD Department of Infectious Disease Cleveland Clinic, Cleveland, Ohio Susan J. Rehm, MD Vice Chair, Department of Infectious Disease Cleveland Clinic, Cleveland, Ohio Thomas Lodise, PharmD Associate Professor, Albany College of Pharmacy Albany, New York Jill Butterfield, PharmD Albany College of Pharmacy Albany, New York Arjun Srinivasan, MD Division of Healthcare Quality Promotion Centers for Disease Control and Prevention Atlanta, Georgia Christopher A. Ohl, MD Associate Professor Internal Medicine‐Infectious Diseases Wake Forest University, Baptist Medical Center, Winston‐Salem, North Carolina Vera P. Luther, MD, Assistant Professor of Medicine Section of Infectious Diseases and Department of Internal Medicine Wake Forest University School of Medicine Winston‐Salem, North Carolina
Disclosure of Conflicts of Interest
The Postgraduate Institute for Medicine (PIM) assesses conflict of interest with its instructors, planners, managers and other individuals who are in a position to control the content of CME activities. All relevant conflicts of interest that are identified are thoroughly vetted by PIM for fair balance, scientific objectivity of studies utilized in this activity, and patient care recommendations. PIM is committed to providing its learners with high quality CME activities and related materials that promote improvements or quality in healthcare and not a specific proprietary business interest of a commercial interest.
The faculty reported the following financial relationships or relationships to products or devices they or their spouse/life partner have with commercial interests related to the content of this CME activity:0
| Name of Faculty or Presenter | Reported Financial Relationship |
|---|---|
| James Pile, MD | Consulting Fees: Pfizer |
| CME Symposia: URL Pharma | |
| Honorarium: Merck & Co. | |
| Steven M. Gordon, MD | Honorarium: Merck & Co. |
| Thomas Lodise, PharmD | Consulting Fees: Astellas Pharma, Cubist Pharmaceuticals, Forest Laboratories, Merck & Co. Inc., Pfizer |
| Grants: Astellas Pharma, Cubist Pharmaceuticals, Merck & Co. Inc., Pfizer | |
| Speaker's Bureau: Astellas Pharma, Cubist | |
| Honorarium: Merck & Co. | |
| Jill Butterfield, PhamD | No real or apparent conflicts of interest to report |
| Nabin Shrestha, MD | No real or apparent conflicts of interest to report |
| Susan J. Rehm, MD | No real or apparent conflicts of interest to report |
| Arjun Srinivasan, MD | No real or apparent conflicts of interest to report |
| Christopher A. Ohl, MD | Consulting Fees: CDC, Cubist, FDA, Ortho‐McNeil, Pfizer, USDA |
| Speaker's Bureau: CDC, Cubist, FDA, Ortho‐McNeil, Pfizer, USDA | |
| Honorarium: Merck & Co. | |
| Vera P. Luther, MD | No real or apparent conflicts of interest to report |
The planners and managers reported the following financial relationships or relationships to products or devices they or their spouse/life partner have with commercial interests related to the content of this CME activity:0, 0
| Name of Planner or Manager | Reported Financial Relationship |
|---|---|
| Meri D. Pozo, PhD | No real or apparent conflicts of interest to report |
| Jan Hixon, RN, BSN, MSN | No real or apparent conflicts of interest to report |
| Trace Hutchison, PharmD | No real or apparent conflicts of interest to report |
| Julia Kimball, RN, BSN | No real or apparent conflicts of interest to report |
| Samantha Mattiucci, PharmD | No real or apparent conflicts of interest to report |
| Jan Schultz, RN, MSN, CCMEP | No real or apparent conflicts of interest to report |
| Patricia Staples, MSN, NP‐C, CCRN | No real or apparent conflicts of interest to report |
| Name of Editor | Reported Financial Relationship |
|---|---|
| Daniel Brotman, MD, FHM | Honorarium from Wiley‐Blackwell for service as the Supplement Editor |
| Thomas Baudendistel, MD | Honorarium from Wiley‐Blackwell for service as the CME Editor |
Disclosure of Unlabeled Use
This educational activity may contain discussion of published and/or investigational uses of agents that are not indicated by the FDA. Postgraduate Institute for Medicine (PIM), Global Education Exchange, Inc. (GLOBEX) and Merck & Co., Inc. do not recommend the use of any agent outside of the labeled indications.
The opinions expressed in the educational activity are those of the faculty and do not necessarily represent the views of PIM, GLOBEX and Merck & Co., Inc. Please refer to the official prescribing information for each product for discussion of approved indications, contraindications, and warnings.
Method of Participation:
There are no fees for participating and receiving CME credit for this activity. During the period January 15, 2011 through January 31, 2012, participants must read the learning objectives and faculty disclosures and study the educational activity.
PIM supports Green CME by offering your Request for Credit online. If you wish to receive acknowledgment for completing this activity, please complete the post‐test and evaluation on
Media:
Journal supplement
Disclaimer
Participants have an implied responsibility to use the newly acquired information to enhance patient outcomes and their own professional development. The information presented in this activity is not meant to serve as a guideline for patient management. Any procedures, medications, or other courses of diagnosis or treatment discussed or suggested in this activity should not be used by clinicians without evaluation of their patient's conditions and possible contraindications on dangers in use, review of any applicable manufacturer's product information, and comparison with recommendations of other authorities.
Antimicrobial Stewardship: Optimizing Antibiotic Use
Clinicians want to use antimicrobials as effectively as possible, but good intentions frequently fail to translate into adherence to best available evidence. This was recognized as early as 1956, when Earnest Jawetz noted that [The physician] is under great pressure to prescribe the newest, best, broadest antibiotic preparation, prescribe it for any complaint whatever, quickly, and preferably without worrying too much about specific etiologic diagnosis or proper indication of the drug.1 That was true in 1956, and is more so in 2010.
The term that has come to describe the collection of practices intended to optimize antimicrobial therapy is antimicrobial stewardship. The label is a relatively new one; it appears to have been coined in the mid‐1990s, and has slowly crept into the medical lexicon since then. However, many clinicians remain uncertain of exactly what antimicrobial stewardship means or what practices characterize it. The 2007 Infectious Diseases Society of America (IDSA) and Society for Healthcare Epidemiology of America (SHEA) guidelines for developing institutional programs to enhance antimicrobial use define antimicrobial stewardship as an activity that includes appropriate selection, dosing, route, and duration of antimicrobial therapy, with a primary goal of optimizing clinical outcomes while minimizing unintended consequences of antimicrobial use.2
In 2004, IDSA published a document titled Bad Bugs, No Drugs that noted a marked decrease in research and development of new antimicrobials within the pharmaceutical industry, at the same time that the number of antibiotic‐resistant bacteria was dramatically increasing, particularly within healthcare settings.3, 4 Since that time, trends in antimicrobial drug development have not appreciably improved, and governmental agencies have been largely silent or ineffective in addressing the problem.58 The growth of multidrug‐resistant and sometimes pan‐resistant pathogens, at a time when newer agents with novel mechanisms of action are not available nor expected for years to come, is particularly troublesome. This scenario highlights the necessity of using currently available agents in a manner that prolongs their effectiveness and reduces further emergence and spread of resistant pathogensie, the crucial need for improved antimicrobial stewardship.
Antimicrobial stewardship recognizes that antimicrobials are a unique category of drugs, with potential to affect treatment outcomes in patients for whom the drug was not originally intended. For example, cardiac and oncologic medications can be costly, and may certainly be toxic, but their effects are limited to the patient that directly receives them. In contrast, the effects of antimicrobials prescribed to a patient in the hospital (or outside the hospital, for that matter), can ripple across the hospital system and beyond. This reflects the fact that suboptimal use of antimicrobials may induce or otherwise promote the development of antimicrobial‐resistant pathogens, with potential wide‐ranging impact.9, 10 Misuse or overuse of antimicrobials can also promote colonization and overgrowth of potentially toxic pathogens within hospitalized patients, such as Clostridium difficile, that may then be transferred widely within the hospital or other healthcare institutions, particularly when infection control measures are also less than optimal. This unique societal feature of antimicrobial drugs highlights the vital importance of antimicrobial stewardship within the hospital setting, especially at a time when few novel agents exist in the developmental pipeline, at least for gram‐negative pathogens.
Are hospitalists stakeholders in this? The answer is a resounding Yes, for several reasons. Hospitalists are the dominant prescribers of antibiotics and other antimicrobials in the United States, almost certainly prescribing more antibiotics in the hospital setting than infectious disease specialists, intensivists, or any other medical specialty or subspecialty. As such, hospitalists play a central role in the optimization of antimicrobial use in the hospital setting, including minimizing negative consequences arising from antimicrobial drug misuse or overuse. In addition, the role hospitalists play in this process is likely to increase in the future. The field of hospital medicine has grown from modest beginnings in the mid‐1990s to approximately 30,000 hospitalists in the United States today.11 Based on a sample of Medicare beneficiaries, 6% of general internists were identified as hospitalists in 1995 versus 19% in 2006, and the percentage of claims for inpatient services provided by general internists who were hospitalists increased from 9% to 37%.12 Current estimates are that >50% of medical inpatients in the United States are cared for by hospitalists (personal communication, J. Miller, Society of Hospital Medicine). Importantly, hospitalists manage patients not only on regular medical floors, but also in intensive care units (ICUs), where antimicrobial resistance is a particular problem.13, 14 Finally, hospitalists serve as gatekeepers for patients leaving the hospital on either oral or intravenous antibiotics or other antimicrobials. As such, via interactions with primary care physicians, hospitalists can play a key role in improving antimicrobial stewardship not only within, but also beyond, the hospital setting.
Hospital medicine is the first medical specialty to make patient safety and quality improvement central principles of its practice, and antimicrobial stewardship is an under‐recognized but central tenet of patient safety. As a consequence, hospitalists are natural allies of stewardship programs. Indeed, antimicrobial stewardship may be considered an example of the Holy Grail of quality improvement; ie, an intervention that improves outcomes while leading to cost savings, and should thus resonate with all hospitalists.
A number of clinical practice guidelines or campaigns have been developed by professional societies and governmental organizations in the United States2, 1526 and other countries2730 for the promotion of improved antimicrobial stewardship and/or infection control in hospitals and long‐term care facilities. The goals of these initiatives, campaigns, or guidelines are to provide information that can be utilized to prevent or slow the development and spread of hospital‐acquired infections, particularly those involving antimicrobial‐resistant pathogens. In addition, the United States Congress is currently considering the STAAR (Strategies to Address Antimicrobial Resistance) Act to encourage the use of innovative governmental and private approaches to combat this critical and expanding problem.31
This supplement to the Journal of Hospital Medicine contains several articles of interest to hospitalists seeking to positively impact patient care through improvements in antimicrobial stewardship. The first article by Christopher Ohl, MD, examines general principles of antimicrobial stewardship programs as they apply to inpatient facilities. The second article by Thomas Lodise, PharmD, explores the effective use of pharmacokinetic‐pharmacodynamic principles in antimicrobial stewardship. In the third article, Steven Gordon, MD, moves beyond the hospital setting to discuss antimicrobial stewardship at the time of hospital discharge and beyond. Finally, Arjun Srinivasan, MD, outlines several practical ways in which hospitalists may take leadership roles in stewardship efforts at their institutions. Our hope is that the supplement will be thought‐provoking, and ultimately lead to greater partnership between hospitalists and other stakeholders in antimicrobial stewardship.
- .Antimicrobial chemotherapy.Annu Rev Microbiol.1956;10:85–114.
- ,,, et al.Infectious Diseases Society of America and the Society for Healthcare Epidemiology of America guidelines for developing an institutional program to enhance antimicrobial stewardship.Clin Infect Dis.2007;44:159–177.
- Bad bugs, no drugs: as antibiotic R2004.
- ,,,,.Trends in antimicrobial drug development: implications for the future.Clin Infect Dis.2004;38:1279–1286.
- ,,, et al.Bad bugs, no drugs: no ESKAPE! An update from the Infectious Diseases Society of America.Clin Infect Dis.2009;48:1–12.
- .Federal funding for the study of antimicrobial resistance in nosocomial pathogens: no ESKAPE.J Infect Dis.2008;197:1079–1081.
- ,,, et al.The epidemic of antibiotic‐resistant infections: a call to action for the medical community from the Infectious Diseases Society of America.Clin Infect Dis.2008;46:155–164.
- ,,,,,.Bad bugs need drugs: an update on the development pipeline from the Antimicrobial Availability Task Force of the Infectious Diseases Society of America.Clin Infect Dis.2006;42:657–668.
- .“Collateral damage” from cephalosporin or quinolone antibiotic therapy.Clin Infect Dis.2004;38(Suppl 4):S341–345.
- .Collateral damage and what the future might hold. The need to balance prudent antibiotic utilization and stewardship with effective patient management.Int J Infect Dis.2006;10:S17–S24.
- .Hospitalists and intensivists: partners in caring for the critically ill‐−the time has come.J Hosp Med.2010;5:1–3.
- ,,,.Growth in the care of older patients by hospitalists in the United States.N Engl J Med.2009;360:1102–1112.
- ,,.Epidemiology and control of antibiotic resistance in the intensive care unit.Curr Opin Infect Dis.2004;17:309–316.
- .Bench‐to‐bedside review: antimicrobial utilization strategies aimed at preventing the emergence of bacterial resistance in the intensive care unit.Crit Care.2005;9:459–464.
- Centers for Disease Control and Prevention. Get smart: know when antibiotics work. Available at http://www.cdc.gov/getsmart/. Accessed June 20,2010.
- The Society for Healthcare Epidemiology of America. Compendium of strategies to prevent healthcare‐associated infections in acute care hospitals. Available at http://www.shea‐online.org/about/compendium.cfm. Accessed June 20,2010.
- ,,, et al.Therapeutic monitoring of vancomycin in adult patients: a consensus review of the American Society of Health‐System Pharmacists, the Infectious Diseases Society of America, and the Society of Infectious Diseases Pharmacists.Am J Health Syst Pharm.2009;66:82–98.
- Centers for Disease Control and Prevention. Department of Health and Human Services. Infection control in healthcare settings. Available at http://www.cdc.gov/nidod/dhqp/. Accessed February 17,2010.
- Centers for Disease Control and Prevention. Healthcare Infection Control Practices Advisory Committee (HICPAC). Available at http://www.cdc. gov/hicpac/. Accessed February 18,2010.
- Centers for Disease Control and Prevention. Campaign to prevent antimicrobial resistance in healthcare settings. Available at http://www.cdc. gov/drugresistance/healthcare/default.htm. Accessed February 18,2010.
- ,.Guideline for Hand Hygiene in Health‐Care Settings: recommendations of the Healthcare Infection Control Practices Advisory Committee and the HICPAC/SHEA/APIC/IDSA Hand Hygiene Task Force.Infect Control Hosp Epidemiol.2002;23:S3–40.
- ,,, et al.Clinical practice guidelines for Clostridium difficile infection in adults: 2010 update by the society for healthcare epidemiology of America (SHEA) and the infectious diseases society of America (IDSA).Infect Control Hosp Epidemiol.2010;31:431–455.
- ,,, et al.SHEA guideline for preventing nosocomial transmission of multidrug‐resistant strains of Staphylococcus aureus and enterococcus.Infect Control Hosp Epidemiol.2003;24:362–386.
- ,,, et al.Society for Healthcare Epidemiology of America and Infectious Diseases Society of America Joint Committee on the Prevention of Antimicrobial Resistance: guidelines for the prevention of antimicrobial resistance in hospitals.Clin Infect Dis.1997;25:584–599.
- ,,, et al.SHEA/APIC guideline: infection prevention and control in the long‐term care facility, July 2008.Infect Control Hosp Epidemiol.2008;29:785–814.
- ,,, et al.A compendium of strategies to prevent healthcare‐associated infections in acute care hospitals.Infect Control Hosp Epidemiol.2008;29 Suppl 1:S12–21.
- Australian Commission on Safety and Quality in Health Care (2009). Windows into Safety and Quality in Health Care 2009, ASCQHC, Sydney, Australia. Available at http://www.safetyandquality.gov/au. Accessed June 20, 2010.
- ,,,.Antibiotic stewardship implementation in the EU: the way forward.Expert Rev Anti Infect Ther.2009;7:1175–1183.
- ,,,.Optimization of antibiotic use in hospitals−antimicrobial stewardship and the EU project ABS international.Chemotherapy.2008;54:260–267.
- ,,,,,.European Antibiotic Awareness Day, 2008−The first European‐wide public information campaign on prudent antibiotic use: methods and survey of participating countries.Euro Surveill.2009;14:19280.
- The Infectious Diseases Society of America. Strategies to Address Antimicrobial Resistance (STAAR) Act. Available at http://www.idsociety.org/STAARAct.htm. Accessed June 20,2010.
Clinicians want to use antimicrobials as effectively as possible, but good intentions frequently fail to translate into adherence to best available evidence. This was recognized as early as 1956, when Earnest Jawetz noted that [The physician] is under great pressure to prescribe the newest, best, broadest antibiotic preparation, prescribe it for any complaint whatever, quickly, and preferably without worrying too much about specific etiologic diagnosis or proper indication of the drug.1 That was true in 1956, and is more so in 2010.
The term that has come to describe the collection of practices intended to optimize antimicrobial therapy is antimicrobial stewardship. The label is a relatively new one; it appears to have been coined in the mid‐1990s, and has slowly crept into the medical lexicon since then. However, many clinicians remain uncertain of exactly what antimicrobial stewardship means or what practices characterize it. The 2007 Infectious Diseases Society of America (IDSA) and Society for Healthcare Epidemiology of America (SHEA) guidelines for developing institutional programs to enhance antimicrobial use define antimicrobial stewardship as an activity that includes appropriate selection, dosing, route, and duration of antimicrobial therapy, with a primary goal of optimizing clinical outcomes while minimizing unintended consequences of antimicrobial use.2
In 2004, IDSA published a document titled Bad Bugs, No Drugs that noted a marked decrease in research and development of new antimicrobials within the pharmaceutical industry, at the same time that the number of antibiotic‐resistant bacteria was dramatically increasing, particularly within healthcare settings.3, 4 Since that time, trends in antimicrobial drug development have not appreciably improved, and governmental agencies have been largely silent or ineffective in addressing the problem.58 The growth of multidrug‐resistant and sometimes pan‐resistant pathogens, at a time when newer agents with novel mechanisms of action are not available nor expected for years to come, is particularly troublesome. This scenario highlights the necessity of using currently available agents in a manner that prolongs their effectiveness and reduces further emergence and spread of resistant pathogensie, the crucial need for improved antimicrobial stewardship.
Antimicrobial stewardship recognizes that antimicrobials are a unique category of drugs, with potential to affect treatment outcomes in patients for whom the drug was not originally intended. For example, cardiac and oncologic medications can be costly, and may certainly be toxic, but their effects are limited to the patient that directly receives them. In contrast, the effects of antimicrobials prescribed to a patient in the hospital (or outside the hospital, for that matter), can ripple across the hospital system and beyond. This reflects the fact that suboptimal use of antimicrobials may induce or otherwise promote the development of antimicrobial‐resistant pathogens, with potential wide‐ranging impact.9, 10 Misuse or overuse of antimicrobials can also promote colonization and overgrowth of potentially toxic pathogens within hospitalized patients, such as Clostridium difficile, that may then be transferred widely within the hospital or other healthcare institutions, particularly when infection control measures are also less than optimal. This unique societal feature of antimicrobial drugs highlights the vital importance of antimicrobial stewardship within the hospital setting, especially at a time when few novel agents exist in the developmental pipeline, at least for gram‐negative pathogens.
Are hospitalists stakeholders in this? The answer is a resounding Yes, for several reasons. Hospitalists are the dominant prescribers of antibiotics and other antimicrobials in the United States, almost certainly prescribing more antibiotics in the hospital setting than infectious disease specialists, intensivists, or any other medical specialty or subspecialty. As such, hospitalists play a central role in the optimization of antimicrobial use in the hospital setting, including minimizing negative consequences arising from antimicrobial drug misuse or overuse. In addition, the role hospitalists play in this process is likely to increase in the future. The field of hospital medicine has grown from modest beginnings in the mid‐1990s to approximately 30,000 hospitalists in the United States today.11 Based on a sample of Medicare beneficiaries, 6% of general internists were identified as hospitalists in 1995 versus 19% in 2006, and the percentage of claims for inpatient services provided by general internists who were hospitalists increased from 9% to 37%.12 Current estimates are that >50% of medical inpatients in the United States are cared for by hospitalists (personal communication, J. Miller, Society of Hospital Medicine). Importantly, hospitalists manage patients not only on regular medical floors, but also in intensive care units (ICUs), where antimicrobial resistance is a particular problem.13, 14 Finally, hospitalists serve as gatekeepers for patients leaving the hospital on either oral or intravenous antibiotics or other antimicrobials. As such, via interactions with primary care physicians, hospitalists can play a key role in improving antimicrobial stewardship not only within, but also beyond, the hospital setting.
Hospital medicine is the first medical specialty to make patient safety and quality improvement central principles of its practice, and antimicrobial stewardship is an under‐recognized but central tenet of patient safety. As a consequence, hospitalists are natural allies of stewardship programs. Indeed, antimicrobial stewardship may be considered an example of the Holy Grail of quality improvement; ie, an intervention that improves outcomes while leading to cost savings, and should thus resonate with all hospitalists.
A number of clinical practice guidelines or campaigns have been developed by professional societies and governmental organizations in the United States2, 1526 and other countries2730 for the promotion of improved antimicrobial stewardship and/or infection control in hospitals and long‐term care facilities. The goals of these initiatives, campaigns, or guidelines are to provide information that can be utilized to prevent or slow the development and spread of hospital‐acquired infections, particularly those involving antimicrobial‐resistant pathogens. In addition, the United States Congress is currently considering the STAAR (Strategies to Address Antimicrobial Resistance) Act to encourage the use of innovative governmental and private approaches to combat this critical and expanding problem.31
This supplement to the Journal of Hospital Medicine contains several articles of interest to hospitalists seeking to positively impact patient care through improvements in antimicrobial stewardship. The first article by Christopher Ohl, MD, examines general principles of antimicrobial stewardship programs as they apply to inpatient facilities. The second article by Thomas Lodise, PharmD, explores the effective use of pharmacokinetic‐pharmacodynamic principles in antimicrobial stewardship. In the third article, Steven Gordon, MD, moves beyond the hospital setting to discuss antimicrobial stewardship at the time of hospital discharge and beyond. Finally, Arjun Srinivasan, MD, outlines several practical ways in which hospitalists may take leadership roles in stewardship efforts at their institutions. Our hope is that the supplement will be thought‐provoking, and ultimately lead to greater partnership between hospitalists and other stakeholders in antimicrobial stewardship.
- .Antimicrobial chemotherapy.Annu Rev Microbiol.1956;10:85–114.
- ,,, et al.Infectious Diseases Society of America and the Society for Healthcare Epidemiology of America guidelines for developing an institutional program to enhance antimicrobial stewardship.Clin Infect Dis.2007;44:159–177.
- Bad bugs, no drugs: as antibiotic R2004.
- ,,,,.Trends in antimicrobial drug development: implications for the future.Clin Infect Dis.2004;38:1279–1286.
- ,,, et al.Bad bugs, no drugs: no ESKAPE! An update from the Infectious Diseases Society of America.Clin Infect Dis.2009;48:1–12.
- .Federal funding for the study of antimicrobial resistance in nosocomial pathogens: no ESKAPE.J Infect Dis.2008;197:1079–1081.
- ,,, et al.The epidemic of antibiotic‐resistant infections: a call to action for the medical community from the Infectious Diseases Society of America.Clin Infect Dis.2008;46:155–164.
- ,,,,,.Bad bugs need drugs: an update on the development pipeline from the Antimicrobial Availability Task Force of the Infectious Diseases Society of America.Clin Infect Dis.2006;42:657–668.
- .“Collateral damage” from cephalosporin or quinolone antibiotic therapy.Clin Infect Dis.2004;38(Suppl 4):S341–345.
- .Collateral damage and what the future might hold. The need to balance prudent antibiotic utilization and stewardship with effective patient management.Int J Infect Dis.2006;10:S17–S24.
- .Hospitalists and intensivists: partners in caring for the critically ill‐−the time has come.J Hosp Med.2010;5:1–3.
- ,,,.Growth in the care of older patients by hospitalists in the United States.N Engl J Med.2009;360:1102–1112.
- ,,.Epidemiology and control of antibiotic resistance in the intensive care unit.Curr Opin Infect Dis.2004;17:309–316.
- .Bench‐to‐bedside review: antimicrobial utilization strategies aimed at preventing the emergence of bacterial resistance in the intensive care unit.Crit Care.2005;9:459–464.
- Centers for Disease Control and Prevention. Get smart: know when antibiotics work. Available at http://www.cdc.gov/getsmart/. Accessed June 20,2010.
- The Society for Healthcare Epidemiology of America. Compendium of strategies to prevent healthcare‐associated infections in acute care hospitals. Available at http://www.shea‐online.org/about/compendium.cfm. Accessed June 20,2010.
- ,,, et al.Therapeutic monitoring of vancomycin in adult patients: a consensus review of the American Society of Health‐System Pharmacists, the Infectious Diseases Society of America, and the Society of Infectious Diseases Pharmacists.Am J Health Syst Pharm.2009;66:82–98.
- Centers for Disease Control and Prevention. Department of Health and Human Services. Infection control in healthcare settings. Available at http://www.cdc.gov/nidod/dhqp/. Accessed February 17,2010.
- Centers for Disease Control and Prevention. Healthcare Infection Control Practices Advisory Committee (HICPAC). Available at http://www.cdc. gov/hicpac/. Accessed February 18,2010.
- Centers for Disease Control and Prevention. Campaign to prevent antimicrobial resistance in healthcare settings. Available at http://www.cdc. gov/drugresistance/healthcare/default.htm. Accessed February 18,2010.
- ,.Guideline for Hand Hygiene in Health‐Care Settings: recommendations of the Healthcare Infection Control Practices Advisory Committee and the HICPAC/SHEA/APIC/IDSA Hand Hygiene Task Force.Infect Control Hosp Epidemiol.2002;23:S3–40.
- ,,, et al.Clinical practice guidelines for Clostridium difficile infection in adults: 2010 update by the society for healthcare epidemiology of America (SHEA) and the infectious diseases society of America (IDSA).Infect Control Hosp Epidemiol.2010;31:431–455.
- ,,, et al.SHEA guideline for preventing nosocomial transmission of multidrug‐resistant strains of Staphylococcus aureus and enterococcus.Infect Control Hosp Epidemiol.2003;24:362–386.
- ,,, et al.Society for Healthcare Epidemiology of America and Infectious Diseases Society of America Joint Committee on the Prevention of Antimicrobial Resistance: guidelines for the prevention of antimicrobial resistance in hospitals.Clin Infect Dis.1997;25:584–599.
- ,,, et al.SHEA/APIC guideline: infection prevention and control in the long‐term care facility, July 2008.Infect Control Hosp Epidemiol.2008;29:785–814.
- ,,, et al.A compendium of strategies to prevent healthcare‐associated infections in acute care hospitals.Infect Control Hosp Epidemiol.2008;29 Suppl 1:S12–21.
- Australian Commission on Safety and Quality in Health Care (2009). Windows into Safety and Quality in Health Care 2009, ASCQHC, Sydney, Australia. Available at http://www.safetyandquality.gov/au. Accessed June 20, 2010.
- ,,,.Antibiotic stewardship implementation in the EU: the way forward.Expert Rev Anti Infect Ther.2009;7:1175–1183.
- ,,,.Optimization of antibiotic use in hospitals−antimicrobial stewardship and the EU project ABS international.Chemotherapy.2008;54:260–267.
- ,,,,,.European Antibiotic Awareness Day, 2008−The first European‐wide public information campaign on prudent antibiotic use: methods and survey of participating countries.Euro Surveill.2009;14:19280.
- The Infectious Diseases Society of America. Strategies to Address Antimicrobial Resistance (STAAR) Act. Available at http://www.idsociety.org/STAARAct.htm. Accessed June 20,2010.
CDC on Antimicrobial Stewardship
What if there was a quality improvement initiative that had been proven in multiple, peer‐reviewed publications to improve individual patient outcomes, reduce the overall burden of antimicrobial resistance, and save healthcare dollars? Surely such an initiative would enjoy widespread, if not uniform, adoption by health care facilities. Antimicrobial stewardship is just such an intervention. Ensuring that hospitalized patients receive the right antimicrobial, at the right dose, at the right time, and for the right duration has been shown to reduce mortality,1 reduce the risks of Clostridium difficileassociated diarrhea,2 shorten length of stay,3 reduce overall antimicrobial resistance within the facility,4 and save money.5 Yet despite these benefits, antimicrobial stewardship programs and interventions are far from the norm in US hospitals.
There are 2 important myths about antimicrobial stewardship that likely contribute substantially to the gap between the recognized benefits and implementation of stewardship interventions. Dispelling these myths is a crucial step in promoting wider adoption efforts to improve antimicrobial use. The first myth stems from the very name antimicrobial stewardship program, which has created a misperception that optimal inpatient antimicrobial use is only possible in settings with formal stewardship programs that are staffed by infectious diseases (ID) physicians and pharmacist. The best guidelines on implementing stewardship programs, developed by the Infectious Diseases Society of America and the Society for Healthcare Epidemiology of America,6 may have contributed to this misperception by suggesting that optimal programs require dedicated time from both an ID physician and an ID‐trained pharmacist. However, many hospitals do not have ID physicians on staff, and the vast majority do not have access to an ID pharmacist who is comfortable with antimicrobial stewardship. Although these traditionally staffed programs have well‐proven benefits and are an excellent goal, they are not feasible in many hospitals. However, different types of stewardship interventions, led by a variety of health care providers and specialists, also have well‐proven benefits. Although these latter experiences are much less likely to appear in peer‐reviewed medical journals, experts in antimicrobial stewardship indicate that they often hear about very successful stewardship interventions being led by groups like general clinical pharmacists, intensivists, and hospitalists. Workshops on antimicrobial stewardship are often full of attendees who are successfully improving antimicrobial use in facilities that represent the full spectrum of US hospitals: large and small, urban and rural, teaching and nonteaching. Indeed, I prefer the term antimicrobial stewardship programs and interventions to convey that improving antimicrobial use can be done, and done well, even without the ideally staffed program.
The second myth is that the only goal of stewardship programs and interventions is to stop clinicians from using antimicrobials. This misperception has led to counterproductive attitudes toward stewardship programs and interventions in some facilities. Without question, stopping unnecessary antimicrobial use is an important aspect of stewardship interventions that has well‐established benefits for patients and hospitals. That one third to one half of all inpatient antimicrobial use might be unnecessary, combined with the growing problem of C. difficile, certainly supports the goal of reducing inappropriate antimicrobial use. However, the primary goal of stewardship is to optimize antimicrobial therapy. In many instances, this does involve stopping unneeded antimicrobials, and because stopping antibiotics has the most readily demonstrable benefits on patient and financial outcomes, interventions with this aim are the subject of nearly all published studies. However, anyone who has worked on stewardship interventions can describe numerous instances when the recommendation provided was to broaden or lengthen antimicrobial therapy. Moreover, surveys indicate that, far from viewing stewardship as an intrusion or infringement on their autonomy, clinicians appreciate and even want the assistance that these efforts provide.7
If stewardship has substantial proven benefits, can be implemented in nearly any hospital setting, and is welcomed by providers, what can be done to move toward broader implementation? I believe that engaging hospitalists more fully in stewardship efforts will be a critical step in this direction. Hospitalists already provide a substantial portion of all inpatient care in the United States, and the numbers of hospitalists are growing rapidly. Moreover, they are increasingly taking the lead in a variety of quality improvement initiatives. Hence, hospitalists are ideally positioned and well suited to move stewardship efforts forward. Some, including hospitalists, have also suggested that developing a practical stewardship implementation framework would be helpful in promoting these interventions.
This suggestion has led the Centers for Disease Control and Prevention's (CDC) Get Smart for Healthcare campaign to partner with the Institute for Healthcare Improvement (IHI) and a variety of external experts (including a hospitalist) to develop such a framework using the IHI's Driver Diagram and Change Package methodology. The driver diagram seeks to identify a core set of highly influential practices that lead to a desired outcome. For optimizing antimicrobial use, the primary drivers that were identified by experts include: 1) timely and appropriate initiation of antibiotics; 2) appropriate administration and de‐escalation of therapy; 3) data monitoring and transparency (measuring and feeding back to clinicians data on antimicrobial use and resistance); and 4) improving stewardship infrastructure, knowledge, and engagement in antimicrobial stewardship efforts. Once these drivers were identified, the expert panel then identified a number of specific practices, or change concepts, that would support progress toward each driver. Now that the Driver Diagram and Change Package has been drafted, the CDC and IHI are collaborating on a pilot testing effort and are working to ensure that a substantial number of the pilot projects are led by hospitalists. Our goal is that the Driver Diagram and Change Package will be honed and refined with the help of hospitalists so that the end result will be a highly implementable set of antimicrobial stewardship interventions that can be widely applied by hospitalists around the country.
However, we need not wait for finalization of the Driver Diagram and Change Package to begin a productive collaboration on antimicrobial stewardship. In addition to the project with IHI, Get Smart for Healthcare is working to identify a variety of resources that would be useful in implementing and improving stewardship efforts. To that end, we would love to hear from any hospitalists who would like to share their experiences with stewardship interventions or who have tools (eg, order sets), ideas (eg, particularly successful intervention projects), or success stories. They can be e‐mailed to [email protected].
For now, I would like to suggest that there are 4 antibiotic quality improvement projects hospitalists would be ideally suited to lead. The first is ensuring that all antibiotic orders include a Dose, Duration, Indication. Efforts to improve antibiotic use are often hampered because the nonprescribing providers are not sure why the patient is on antibiotics. This problem is amplified when patients are transitioned from one provider to another or when multiple providers are involved. Specifying the duration and indication in all antibiotic orders will ensure that treatments continue for the right amount of time and would allow therapy to be stopped if the initially suspected infection is ruled out or altered if another infection is identified. The second improvement project is developing a process to ensure that any patient with a positive blood culture is on the appropriate therapy. This is a relatively straightforward intervention that is based on the patient's own microbiology results, and it ensures the optimal therapy of a serious infection. Third is the development of an intervention to encourage the reassessment of patients who are started on antibiotics for community‐acquired pneumonia (CAP). Several hospitalists have suggested that the pressure to initiate therapy quickly in cases of CAP often leads to overtreatment. Interventions that encourage a reexamination of the CAP diagnosis when the clinical situation has stabilized would likely reduce this overtreatment. And the fourth improvement project is ensuring that urinary tract infections (UTIs) in hospitalized patients are properly diagnosed and treated. Work done by hospitalists at the University of Michigan suggests that improving the diagnosis and treatment of UTIs would have a significant impact on improving antibiotic use.8 Currently, the CDC is collaborating with these investigators to develop protocols and tools to improve the treatment of inpatient UTIs.
The time to promote aggressive implementation of antimicrobial stewardship interventions has come. Clinicians are increasingly encountering infections for which there are very limited or, in some cases, no good treatment optionsand there are very few new antibiotics on the horizon. Many groups are advocating for expanded efforts to develop new antibiotics.9 Although this is crucial, it is just as important that we work now to aggressively improve the use of the agents we have. Not only might this extend the life of our current agents, but it will also help ensure that any new agents will enjoy longer periods of effectiveness. Indeed, failing to inextricably link the development of new antibiotics with efforts to improve antibiotic use is akin to buying a new car to drive on a road full of potholes. Fortunately, there are a number of interventions that have proven successful; we now need to determine how best to apply these interventions in more settings. We want and need the involvement of hospitalists in these efforts. Yes, improving antimicrobial stewardship will require investments, but past experience tells us that the alternative could prove far more costly.
- .Inadequate antimicrobial treatment: an important determinant of outcome for hospitalized patients.Clin Infect Dis.2000;31:S131–S138.
- ,,, et al.Impact of a reduction in the use of high‐risk antibiotics on the course of an epidemic of Clostridium difficile‐associated disease caused by the hypervirulent NAP1/027 strain.Clin Infect Dis.2007;45(Suppl 2):S112–S121.
- ,,, et al.Early transition to oral antibiotic therapy for community‐acquired pneumonia: duration of therapy, clinical outcomes, and cost analysis.Respir Med.1998;92:1032–1039.
- ,,, et al.A hospitalwide intervention program to optimize the quality of antibiotic use: impact on prescribing practice, antibiotic consumption, cost savings, and bacterial resistance.Clin Infect Dis.2003;37:180–186.
- ,,, et al.A World Wide Web‐based antimicrobial stewardship program improves efficiency, communication, and user satisfaction and reduces cost in a tertiary care pediatric medical center.Clin Infect Dis.2008;47:747–753.
- ,,, et al.Infectious Diseases Society of America and the Society for Healthcare Epidemiology of America guidelines for developing an institutional program to enhance antimicrobial stewardship.Clin Infect Dis.2007;44:159–177.
- ,,, et al.A knowledge, attitudes and beliefs survey of housestaff physicians from various specialties concerning antimicrobial use and resistance.Arch Intern Med.2004;164:1451–1456.
- ,,, et al.Importance of urinary tract infection to antibiotic use among hospitalized patients.Infect Control Hosp Epidemiol.2009;30:193–195.
- Infectious Diseases Society of America.The 10 × '20 Initiative: pursuing a global commitment to develop 10 new antibacterial drugs by 2020.Clin Infect Dis.2010;50:1081–1083.
What if there was a quality improvement initiative that had been proven in multiple, peer‐reviewed publications to improve individual patient outcomes, reduce the overall burden of antimicrobial resistance, and save healthcare dollars? Surely such an initiative would enjoy widespread, if not uniform, adoption by health care facilities. Antimicrobial stewardship is just such an intervention. Ensuring that hospitalized patients receive the right antimicrobial, at the right dose, at the right time, and for the right duration has been shown to reduce mortality,1 reduce the risks of Clostridium difficileassociated diarrhea,2 shorten length of stay,3 reduce overall antimicrobial resistance within the facility,4 and save money.5 Yet despite these benefits, antimicrobial stewardship programs and interventions are far from the norm in US hospitals.
There are 2 important myths about antimicrobial stewardship that likely contribute substantially to the gap between the recognized benefits and implementation of stewardship interventions. Dispelling these myths is a crucial step in promoting wider adoption efforts to improve antimicrobial use. The first myth stems from the very name antimicrobial stewardship program, which has created a misperception that optimal inpatient antimicrobial use is only possible in settings with formal stewardship programs that are staffed by infectious diseases (ID) physicians and pharmacist. The best guidelines on implementing stewardship programs, developed by the Infectious Diseases Society of America and the Society for Healthcare Epidemiology of America,6 may have contributed to this misperception by suggesting that optimal programs require dedicated time from both an ID physician and an ID‐trained pharmacist. However, many hospitals do not have ID physicians on staff, and the vast majority do not have access to an ID pharmacist who is comfortable with antimicrobial stewardship. Although these traditionally staffed programs have well‐proven benefits and are an excellent goal, they are not feasible in many hospitals. However, different types of stewardship interventions, led by a variety of health care providers and specialists, also have well‐proven benefits. Although these latter experiences are much less likely to appear in peer‐reviewed medical journals, experts in antimicrobial stewardship indicate that they often hear about very successful stewardship interventions being led by groups like general clinical pharmacists, intensivists, and hospitalists. Workshops on antimicrobial stewardship are often full of attendees who are successfully improving antimicrobial use in facilities that represent the full spectrum of US hospitals: large and small, urban and rural, teaching and nonteaching. Indeed, I prefer the term antimicrobial stewardship programs and interventions to convey that improving antimicrobial use can be done, and done well, even without the ideally staffed program.
The second myth is that the only goal of stewardship programs and interventions is to stop clinicians from using antimicrobials. This misperception has led to counterproductive attitudes toward stewardship programs and interventions in some facilities. Without question, stopping unnecessary antimicrobial use is an important aspect of stewardship interventions that has well‐established benefits for patients and hospitals. That one third to one half of all inpatient antimicrobial use might be unnecessary, combined with the growing problem of C. difficile, certainly supports the goal of reducing inappropriate antimicrobial use. However, the primary goal of stewardship is to optimize antimicrobial therapy. In many instances, this does involve stopping unneeded antimicrobials, and because stopping antibiotics has the most readily demonstrable benefits on patient and financial outcomes, interventions with this aim are the subject of nearly all published studies. However, anyone who has worked on stewardship interventions can describe numerous instances when the recommendation provided was to broaden or lengthen antimicrobial therapy. Moreover, surveys indicate that, far from viewing stewardship as an intrusion or infringement on their autonomy, clinicians appreciate and even want the assistance that these efforts provide.7
If stewardship has substantial proven benefits, can be implemented in nearly any hospital setting, and is welcomed by providers, what can be done to move toward broader implementation? I believe that engaging hospitalists more fully in stewardship efforts will be a critical step in this direction. Hospitalists already provide a substantial portion of all inpatient care in the United States, and the numbers of hospitalists are growing rapidly. Moreover, they are increasingly taking the lead in a variety of quality improvement initiatives. Hence, hospitalists are ideally positioned and well suited to move stewardship efforts forward. Some, including hospitalists, have also suggested that developing a practical stewardship implementation framework would be helpful in promoting these interventions.
This suggestion has led the Centers for Disease Control and Prevention's (CDC) Get Smart for Healthcare campaign to partner with the Institute for Healthcare Improvement (IHI) and a variety of external experts (including a hospitalist) to develop such a framework using the IHI's Driver Diagram and Change Package methodology. The driver diagram seeks to identify a core set of highly influential practices that lead to a desired outcome. For optimizing antimicrobial use, the primary drivers that were identified by experts include: 1) timely and appropriate initiation of antibiotics; 2) appropriate administration and de‐escalation of therapy; 3) data monitoring and transparency (measuring and feeding back to clinicians data on antimicrobial use and resistance); and 4) improving stewardship infrastructure, knowledge, and engagement in antimicrobial stewardship efforts. Once these drivers were identified, the expert panel then identified a number of specific practices, or change concepts, that would support progress toward each driver. Now that the Driver Diagram and Change Package has been drafted, the CDC and IHI are collaborating on a pilot testing effort and are working to ensure that a substantial number of the pilot projects are led by hospitalists. Our goal is that the Driver Diagram and Change Package will be honed and refined with the help of hospitalists so that the end result will be a highly implementable set of antimicrobial stewardship interventions that can be widely applied by hospitalists around the country.
However, we need not wait for finalization of the Driver Diagram and Change Package to begin a productive collaboration on antimicrobial stewardship. In addition to the project with IHI, Get Smart for Healthcare is working to identify a variety of resources that would be useful in implementing and improving stewardship efforts. To that end, we would love to hear from any hospitalists who would like to share their experiences with stewardship interventions or who have tools (eg, order sets), ideas (eg, particularly successful intervention projects), or success stories. They can be e‐mailed to [email protected].
For now, I would like to suggest that there are 4 antibiotic quality improvement projects hospitalists would be ideally suited to lead. The first is ensuring that all antibiotic orders include a Dose, Duration, Indication. Efforts to improve antibiotic use are often hampered because the nonprescribing providers are not sure why the patient is on antibiotics. This problem is amplified when patients are transitioned from one provider to another or when multiple providers are involved. Specifying the duration and indication in all antibiotic orders will ensure that treatments continue for the right amount of time and would allow therapy to be stopped if the initially suspected infection is ruled out or altered if another infection is identified. The second improvement project is developing a process to ensure that any patient with a positive blood culture is on the appropriate therapy. This is a relatively straightforward intervention that is based on the patient's own microbiology results, and it ensures the optimal therapy of a serious infection. Third is the development of an intervention to encourage the reassessment of patients who are started on antibiotics for community‐acquired pneumonia (CAP). Several hospitalists have suggested that the pressure to initiate therapy quickly in cases of CAP often leads to overtreatment. Interventions that encourage a reexamination of the CAP diagnosis when the clinical situation has stabilized would likely reduce this overtreatment. And the fourth improvement project is ensuring that urinary tract infections (UTIs) in hospitalized patients are properly diagnosed and treated. Work done by hospitalists at the University of Michigan suggests that improving the diagnosis and treatment of UTIs would have a significant impact on improving antibiotic use.8 Currently, the CDC is collaborating with these investigators to develop protocols and tools to improve the treatment of inpatient UTIs.
The time to promote aggressive implementation of antimicrobial stewardship interventions has come. Clinicians are increasingly encountering infections for which there are very limited or, in some cases, no good treatment optionsand there are very few new antibiotics on the horizon. Many groups are advocating for expanded efforts to develop new antibiotics.9 Although this is crucial, it is just as important that we work now to aggressively improve the use of the agents we have. Not only might this extend the life of our current agents, but it will also help ensure that any new agents will enjoy longer periods of effectiveness. Indeed, failing to inextricably link the development of new antibiotics with efforts to improve antibiotic use is akin to buying a new car to drive on a road full of potholes. Fortunately, there are a number of interventions that have proven successful; we now need to determine how best to apply these interventions in more settings. We want and need the involvement of hospitalists in these efforts. Yes, improving antimicrobial stewardship will require investments, but past experience tells us that the alternative could prove far more costly.
- .Inadequate antimicrobial treatment: an important determinant of outcome for hospitalized patients.Clin Infect Dis.2000;31:S131–S138.
- ,,, et al.Impact of a reduction in the use of high‐risk antibiotics on the course of an epidemic of Clostridium difficile‐associated disease caused by the hypervirulent NAP1/027 strain.Clin Infect Dis.2007;45(Suppl 2):S112–S121.
- ,,, et al.Early transition to oral antibiotic therapy for community‐acquired pneumonia: duration of therapy, clinical outcomes, and cost analysis.Respir Med.1998;92:1032–1039.
- ,,, et al.A hospitalwide intervention program to optimize the quality of antibiotic use: impact on prescribing practice, antibiotic consumption, cost savings, and bacterial resistance.Clin Infect Dis.2003;37:180–186.
- ,,, et al.A World Wide Web‐based antimicrobial stewardship program improves efficiency, communication, and user satisfaction and reduces cost in a tertiary care pediatric medical center.Clin Infect Dis.2008;47:747–753.
- ,,, et al.Infectious Diseases Society of America and the Society for Healthcare Epidemiology of America guidelines for developing an institutional program to enhance antimicrobial stewardship.Clin Infect Dis.2007;44:159–177.
- ,,, et al.A knowledge, attitudes and beliefs survey of housestaff physicians from various specialties concerning antimicrobial use and resistance.Arch Intern Med.2004;164:1451–1456.
- ,,, et al.Importance of urinary tract infection to antibiotic use among hospitalized patients.Infect Control Hosp Epidemiol.2009;30:193–195.
- Infectious Diseases Society of America.The 10 × '20 Initiative: pursuing a global commitment to develop 10 new antibacterial drugs by 2020.Clin Infect Dis.2010;50:1081–1083.
Use of Pharmacodynamic Principles to Inform β‐Lactam Dosing
Tremendous strides have been made over the last 25 years in understanding the relationship between antimicrobial exposure and response.14 Many clinicians consider antimicrobial drug pharmacokinetics (PK) and pharmacodynamics (PD) a rather esoteric or academic topic without practical applicability or clinical utility. However, it is becoming increasingly clear, particularly as less‐susceptible pathogens emerge, that consideration of PK/PD in dose selection is essential for optimizing antimicrobial therapy and, as such, is a core component of effective antimicrobial stewardship and patient care. Antimicrobial therapy can fail if an appropriate agent is selected but the dosing regimen does not provide adequate exposure against the infecting pathogens, especially at the site of infection.5, 6
The 2007 guidelines from the Infectious Diseases Society of America (IDSA) and Society for Healthcare Epidemiology of America (SHEA) for developing institutional antimicrobial stewardship programs highlight dose optimization as one of the key strategies for enhancing antimicrobial stewardship.7 More specifically, they recommend optimizing dosing by focusing on individual patient characteristics, causative organism and site of infection, and the PK/PD characteristics of the drug. With advances in mathematical modeling (Monte Carlo simulation), it is possible to apply our understanding of PK/PD to clinical practice and design empiric regimens that have a high probability of achieving the PD target linked to effect. These mathematical modeling techniques have an array of other utilities and have become the standard methodologies for assessing the clinical viability of both experimental and approved antimicrobials.8, 9 Furthermore, the Clinical and Laboratory Standards Institute (CLSI) has recently begun to incorporate results from PK/PD analyses in determining MIC breakpoints.10 This paper provides a general overview of antimicrobial PD before demonstrating how to apply PD principles to clinical practice through the use of Monte Carlo simulation (MCS). Piperacillin/tazobactam (TZP) is used as a motivating example for this latter purpose.
Pharmacokinetics and Pharmacodynamics: Parameters and Principles
Pharmacokinetics describes the actions of the body on an administered drug, whereas PD describes the actions of the administered drug on the body. In essence, PK refers to the movement of the drug within the body, including absorption, distribution, metabolism, and excretion. Conversely, PD refers to the effects of the drug on the body, or its physiologic actions. A drug's PD is defined by its mechanism of action, and includes both desired and undesired effects. Typically, PK and PD work together to best define or predict the full range of effects of an administered drug on an individual patient, as described in greater detail below.
The Minimum Inhibitory Concentration
The MIC is the PD parameter most often used to describe the relationship between antimicrobial drug and physiologic activity. The MIC is defined as the lowest or minimum antimicrobial concentration that inhibits visible microbial growth in artificial medium after a fixed incubation time.10, 11 This is typically determined by placing a known quantity of bacteria (or other microorganism) into multiple test tubes, and then adding increasing concentrations of a particular antibiotic, typically in log2 dilution, into consecutive tubes. The lowest antibiotic concentration that inhibits bacterial growth is then defined as the MIC for that drug‐pathogen pairing.
While useful as a quantitative measure of drug activity or potency, the MIC is not without limitations.12 The MIC does not mimic physiologic conditions. The MIC is a static measure (fixed concentration of drug in an artificial growth medium for a fixed period of time) and is not reflective of the concentration‐time profile one would typically observe in patients; drug concentrations change throughout the dosing interval. Because the MIC only measures growth inhibition, it does not reflect the rate at which bacteria are killed, nor can it identify if a dosekill response relationship exists for a particular antibiotic‐pathogen pairing. Furthermore, the MIC only quantifies net growth over an 1824‐hour observation period. Killing and regrowth may well occur during this period, as long as the net growth is zero. Finally, the MIC does not account for the post‐antibiotic effects of antibiotics. Most antibiotics, depending on the pathogen and drug class, exhibit some persistence of bacteriostatic or bactericidal activity after the drug concentration at the target site has dropped below the MIC. This activity has been described as the post‐antibiotic effect,1315 post‐antibiotic sub‐MIC effect,1317 or post‐antibiotic leukocyte enhancement effect.18, 19
Common Pharmacodynamic Measures
Examination of PK measures of drug exposure (eg, serum/tissue concentrations) in relation to the MIC surmounts many of the limitations of the MIC and provides much better prediction of antimicrobial effect than the MIC or exposure profile alone. The 3 most common PK/PD indices (sometimes abbreviated as PD measures) used to predict drug response are: 1) the ratio of the maximal free drug concentration to the MIC (fCmax:MIC), 2) the ratio of the free area under the concentration‐time curve to the MIC (fAUC:MIC), and 3) the duration of time free drug concentrations remain above the MIC (fT>MIC).24, 20, 21 The PD parameter most predictive of outcomes varies by drug class (Table 1).20
| Antibiotic | Optimal PD measure(s) |
|---|---|
| |
| Aminoglycosides | Cmax:MIC; AUC:MIC |
| ‐lactams | |
| Penicillins | T>MIC |
| Cephalosporins | T>MIC |
| Carbapenems | T>MIC |
| Monobactams | T>MIC |
| Clindamycin | AUC:MIC |
| Fluoroquinolones | AUC:MIC, Cmax:MIC |
| Glycopeptides/lipopeptides | |
| Daptomycin | AUC:MIC, Cmax:MIC |
| Oritavancin | T>MIC, Cmax:MIC |
| Vancomycin | AUC:MIC |
| Linezolid | AUC:MIC |
| Macrolides | |
| Azithromycin | AUC:MIC |
| Clarithromycin | AUC:MIC |
| Telithromycin | AUC:MIC |
| Metronidazole | AUC:MIC, Cmax:MIC |
| Tetracyclines | |
| Doxycycline | AUC:MIC |
| Tigecycline | AUC:MIC |
Certain antibiotics exhibit concentration‐dependent bactericidal activity, while others exhibit time‐dependent activity (Table 1).24, 20 For concentration‐dependent antibiotics, a doseresponse relationship exists and the therapeutic goal is to maximize exposure at the target site. Alternatively, the activity of time‐dependent antibiotics is not dependent on the intensity of exposure but is a function of the duration of time concentrations are above the MIC during the dosing interval. For the time‐dependent antibiotics like the ‐lactams, concentrations do not have to remain above the MIC for the entire dosing interval, and the fraction of the dosing interval required for maximal bacterial effect varies for the different types of ‐lactams. Although the precise fT > MIC varies for different drugbacteria combinations, bacteriostatic effects are typically observed when the free drug concentration exceeds the MIC for 3540%, 30%, and 20% of the dosing interval for the cephalosporins, penicillins, and carbapenems, respectively. Near‐maximal bactericidal effects require 6070%, 50%, and 40% fT > MIC, respectively, for these ‐lactam classes.3, 4
It is important to note that it is the free (or unbound) fraction of drug that determines its ability to penetrate tissues and exert its microbiological effect.3, 4, 22 This was demonstrated as early as the 1940s with penicillin. There are occasionally exceptions, mostly with the therapy of gram‐positive infections. Daptomycin is one such example; protein binding is approximately 9092% (free drug 810%), but the agent behaves as if the drug is approximately 75% bound (25% free).23 Nonetheless, the guiding principle is that protein binding can have an adverse impact on the PD and microbiological activity of an antibacterial agent.
Monte Carlo Simulation
With advances in mathematical modeling, it is possible to apply our understanding of antimicrobial PD to clinical practice.12 In particular, MCS can be used to integrate PK, PD, and local microbiologic surveillance data to design antibiotic regimens that have a high probability of achieving the PD target linked to effect against the range of pathogens encountered in clinical practice. In short, MCS is a technique that incorporates the variability in PK among potential patients (between‐patient variability) when predicting antibiotic exposures, and allows calculation of the probability for obtaining a critical target exposure for the range of possible MIC values.12 If a number of volunteers or patients are given an antibiotic, there will be true variability in the observed concentration time profiles between people. For example, the peak serum concentrations and AUC0‐24h will vary between individuals. In essence, MCS is a mathematical modeling technique that simulates the dispersion or full spread of concentration‐time exposure values (eg, peak concentration, area under the curve) that would be seen in a large population after administration of a specific drug dose or regimen. Once the distribution in concentration‐time profiles is determined, the probability of achieving the PD target at each MIC value for a given MIC range (ie, probability of target attainment [PTA] profile) is ascertained.
There are several steps in the MCS process. First, a PK model for the antibiotic under study is embedded into the MCS. The mean PK parameters (eg, volume, clearance, intercompartmental transfer constant) and associated variability (variance and covariance) from the selected PK model are used to create a multivariate distribution of PK parameters. From this multivariate distribution, the MCS randomly selects a set of PK parameters, and these randomly selected PK parameters are used to simulate a concentration‐time profile for a virtual subject based on the desired antibiotic dosing regimen. This process is repeated a specified number of times (eg, 5000, 1000) to simulate the distribution of concentration‐time profiles one would expect to see in the population. Once the specified number of virtual patients has been simulated (eg, 10,000 virtual patients), the proportion of the simulated population that achieves the critical exposure target (eg, 50% fT > MIC) at each MIC value for a given MIC range can be calculated. Because the relationship between drug exposure and effect is expressed as a ratio (eg, AUC:MIC, Cmax:MIC, T:MIC), a unique drug exposure:MIC ratio and PTA exists for each unique MIC value within the distribution.12
In clinical practice, a distribution of MIC values exists for a given organism or infection. Therefore, the final step is determining the overall PTA for the distribution of organisms encountered clinically. As previously mentioned, the PTA is determined at each MIC value within a given MIC range. Because the fraction of organisms collected at each MIC value is known, the overall or weighted PTA average can be calculated by multiplying the PTA for a specific MIC and the proportion of isolates with that MIC. This product is calculated for each MIC value within the MIC distribution. The overall PTA is then calculated by summing the products (PTA at a given MIC value x proportion of isolates with that MIC value) of the MIC values encountered within the distribution.12
A key element for these simulations is the estimation of the PK parameters and their associated dispersion (variance and covariance). Pharmacokinetic data, especially for new compounds, are usually limited to data from healthy volunteer studies. Caution should be exercised when generalizing the results of volunteer studies to the population of interest. Volunteer studies are often considered as the most conservative evaluation of a new drug; volunteers are young and healthy, likely to have the highest drug clearances and shortest half lives. However, when one performs MCS, the measure of central tendency (high drug clearance, short half‐lives) is only part of the story. Because MCS are explicitly creating a distribution, it is important to understand the measure of dispersion. Secondary to the limited variation surrounding PK parameters from healthy volunteer studies, it is possible that they overestimate the PTA. Applicability to the target population must always be considered.12
Motivating Example: Piperacillin‐tazobactam
Piperacillin‐tazobactam (TZP) is an acylureido‐penicillinbeta‐lactamase inhibitor combination and is frequently used as first‐line empirical therapy for healthcare‐associated infections. Like all ‐lactams, the PD parameter most predictive of its efficacy is fT > MIC, and its activity is optimized when free drug concentrations exceed the MIC for 50% of the dosing interval (50% fT > MIC). Because it is used empirically, it is critical that the TZP regimens used in practice have a high probability of achieving 50% fT > MIC against the range of MIC values likely to be encountered in a given institution.
Since the MIC of the infecting pathogen is often not available at the start of therapy, clinicians frequently rely on the hospital antibiogram to determine the utility of an antibiotic as an empiric agent. The range of MIC values reported as susceptible in clinical practice is based on the CLSI susceptibility interpretive criteria. For TZP, Enterobacteriaceae and Acinetobacter baumannii isolates with MIC values 16 mg/L are considered susceptible. The CLSI breakpoint for Pseudomonas aeruginosa is higher and isolates with MIC values 64/4 mg/L are considered susceptible.11
It is important to recognize that these CLSI TZP susceptibility breakpoints were established prior to our current understanding of ‐lactam PD and are higher relative to other ‐lactams. It was not until sometime after the establishment of the TZP susceptibility interpretive criteria were MCS studies performed to determine the ability of the US Food and Drug Administration (FDA)‐approved TZP dosing regimens in achieving 50% fT > MIC against the range of MICs deemed susceptible by CLSI.
The first study to characterize the ability of standard TZP dosing (0.5‐hour infusion of 3.375 g every 6 hours) in achieving 50% T > MIC in its targeted population for the range of MIC values deemed susceptible by CLSI was published in 2004 by our group. Employing a population PK model derived in hospitalized patients, TZP 3.375 grams administered every 6 h provided high PTA rates for MICs of 8/4 mg/L (ie, 8 mg/L for piperacillin and 4 mg/L for tazobactam) when hospitalized‐patient data were used (Figure 1).24 In clinical situations in which the MICs are expected to be 16/4 mg/L, the results of the MCS indicate that caution should be exercised when using standard TZP dosing. More recently, DeRyke et al evaluated the PD profile of the TZP nosocomial dosing scheme (0.5‐hour infusion of 4.5 g every 6 hours). Using the same population PK model employed as our study, DeRyke and colleagues noted a slightly improved PTA profile at a MIC value of 16/4 mg/L with the TZP nosocomial pneumonia dosing scheme relative to standard dosing. However, the PTA was still suboptimal for MIC values 32/4 mg/L (Figure 1).25

These findings are concerning because the TZP CLSI susceptibility breakpoint for non‐lactose fermenting Gram‐negative bacteria is 64/4 mg/L.11 In essence, the conventional and nosocomial pneumonia TZP dosing schemes provide a suboptimal PD profile for a substantial portion of the MIC distribution deemed susceptible by CLSI. The clinical relevance of this is highlighted by a study by Tam and coworkers examining the efficacy of TZP in hospitalized patients with bacteremia due to P. aeruginosa (Figure 2).26 This retrospective cohort study examined 30‐day mortality among patients who received appropriate empiric therapy between 2002 and 2006. Therapy was defined as appropriate if: 1) ‐lactam treatment (in doses appropriate for renal function as recommended by the manufacturer) was started within 24 hours of blood culture collection, and 2) the isolate was found to be susceptible to the ‐lactam agent selected. The cohort was stratified by the TZP piperacillin MIC (3264 mg/L vs. 16 mg/L) and 30‐day mortality rates were compared within MIC strata between patients who received TZP or an alternative ‐lactam with activity against Pseudomonas aeruginosa. A total of 34 episodes with MICs of 32 or 64 mg/L were identified. Seven of these cases were empirically treated with TZP, while the remaining 27 received other ‐lactam agents. Forty‐nine episodes of P. aeruginosa bacteremias had MIC values 16 mg/L. Of these 49, 10 were empirically treated with TZP and the remaining 39 were treated with other ‐lactams. The results showed that the 30‐day mortality rate was significantly higher among patients treated with TZP versus control‐treated patients with isolates possessing a MIC of either 32 or 64 mg/L (86% vs. 22%, P value = 0.004), while there was no significant difference between the two treatment groups for isolates with a MIC of up to 16 mg/L (30% vs. 21%, P = 0.673). Interestingly, patients treated with a non‐TZP ‐lactam antibiotic had 30‐day mortality rates of 21%, regardless of the TZP MIC value. Collectively, these findings and the results of the TZP MCS studies highlight the importance of considering PTA data when evaluating the utility of an antibiotic dosing scheme. These data also cast uncertainty on the appropriateness of the current TZP CLSI susceptibility breakpoint in connection with the conventional dosing TZP strategies. The current CLSI interpretation of TZP susceptibility for non‐lactose‐fermenting gram‐negatives may inadvertently provide misleading guidance to clinicians for optimal patient care.
Dosing Strategies to Improve the Probability of Target Attainment Profile of ‐lactams
Three potential dosing strategies used to improve the PTA of a ‐lactam against the range of pathogens encountered in various clinical situations include: 1) increasing the dose, 2) increasing the dosing frequency, or 3) increasing the duration of infusion.12 Intuitively, it makes sense to simply increase the drug dose. However, as demonstrated in the aforementioned TZP MCS studies, increasing the TZP dose from 3.375 grams to 4.5 grams every 6 hours had a minimal impact on the PTA profile.24, 25 To increase fT >MIC by 1 half‐life, the dose would need to be doubled. Since most ‐lactams have a half‐life of 30 minutes to 1 hour, doubling the dose only provides an extra 30 minutes or hour above the MIC, which would not be expected to have much clinical impact. In addition, doubling the dose is not cost effective since it doubles drug acquisition costs.12, 27
Increasing the dosing frequency is a viable option and may be the optimal strategy in certain situations.12 However, it is often associated with increased drug acquisition costs (more doses per day) relative to the parent regimen and may not be a viable option from a nursing and pharmacy perspective due to increased administration and preparation time. In addition, there may be a higher potential for toxicity because a greater amount of drug is given per day.
Extending the infusion time is another ‐lactam dose optimization strategy that is becoming more commonly used in clinical practice. Administering a dose of a ‐lactam agent as an infusion longer than the conventional 0.51.0‐hour infusion duration has 2 main effects. First, it produces a lower peak concentration of the drug.24 Because the bacterial kill rate for these agents is not concentration‐dependent, this does not present a major disadvantage.3, 4, 2830 Second, the drug concentrations remain in excess of the MIC for a longer period of time. Because this is what drives antibacterial effect for ‐lactams, this will yield a more favorable PTA profile. It should also be noted that this can be done with less frequent drug dosing.27
Extending the infusion time can be accomplished by either prolonging the infusion time for a major portion of the dosing interval (prolonged infusion) or administering continuously throughout the day (continuous infusion). From a PD profiling viewpoint, the two infusion methodologies yield nearly identical PTA profiles. This was highlighted in the 2007 study by Kim et al, which compared PTA rates between intermittent (0.5 hour), prolonged (4 hours), and continuous infusions of TZP (Figure 3). In their study, the PTA curves for prolonged and continuous infusion TZP were superimposable and superior to the intermittent infusion regimen for MIC values in excess of 4 mg/L.31
There are several practicalities to consider when differentiating prolonged and continuous infusion methods. The principle advantages of continuous infusion are once‐daily administration and reduced costs for labor, supplies, and administration.12, 27 The major disadvantages of continuous infusion are the need for a dedicated line for infusion (which often leads to drug compatibility issues), issues of drug stability and waste, and lack of ambulation for the patient. The need for a dedicated infusion line is particularly impractical for patients with limited intravenous access or those requiring multiple daily infusions. In addition, continuous infusion often requires insertion of a central line, which places patients at unnecessary risk of secondary catheter‐related infection.12 Continuous infusion solutions are typically prepared as 24‐hour infusions containing the total daily amount of drug. Considerable drug wastage can occur with early discontinuation of therapy; all drug within the solution needs to be wasted and cannot be reused if the order is discontinued prior to scheduled completion.
Prolonged infusion provides many of the benefits of intermittent dosing, but with the PD advantages of continuous infusion. Administration of the infusion for a prolonged time, but not continuously, obviates the need to have a dedicated intravenous line just for ‐lactam continuous infusion. It also achieves the targeted fT > MIC at a total daily dose less than standard ‐lactam dosing methods. Drug wastage is also minimized because the intermittent administration formulations are used; there is no need to prepare antibiotic solutions for 24‐hour periods. Prolonged infusion also allows the patient to be ambulatory for much of the day. The potential disadvantages of prolonged infusion relative to continuous infusion include the increased use of labor, supplies, and administration resources. Although minimized, there is still the need to schedule or time the administration of incompatible drugs.12, 27
Data Examining the Outcomes Associated With Prolonged and Continuous ‐lactam Infusions
Over the years, a number of randomized controlled trials (RCTs) and observational studies have compared outcomes between extended and intermittent ‐lactam infusions. These studies, mostly small scale in nature, involved a number of different ‐lactam antibiotics and various infectious etiologies. To ascertain if there are any clinical benefits in extending the infusion duration (prolonged and continuous), Roberts and colleagues performed a systematic review of available data on PubMed (January 1950 to November 2007), EMBASE (1966 to November 2007), and the Cochrane Controlled Trial Register (updated November 2007).32 Randomized controlled trials were meta‐analyzed, and observational studies were reviewed. Among a total of 59 potentially RCTs, 14 involving a total of 846 patients from nine countries were deemed appropriate for meta‐analysis. The use of continuous infusion of a ‐lactam antibiotic was not associated with an improvement in clinical cure (n=755 patients; odds ratio: 1.04, 95% confidence interval: 0.741.46, P = 0.83) or mortality (n=541 patients; odds ratio: 1.00, 95% confidence interval: 0.482.06, P = 1.00). In contrast, the observational studies showed that ‐lactam administration by extended or continuous infusion confers an improvement in clinical cure and this was most pronounced in critically ill patients being treated for gram‐negative bacterial infections.
There are several possible explanations for the discrepancy in results between the meta‐analysis and observational studies. First, disease severity in the studies included in the meta‐analysis was generally low, as evidenced by low mortality rates in the majority of studies. Second, a diverse group of patients and infection types were included in the RCTs, which increased the heterogeneity of the cohort analyzed. Third, a higher antibiotic dose was used in the intermittent administration group in all RCTs except one. Fourth, microbiologic and PK/PD data were not available for the majority of RCTs. Collectively, the null result from the meta‐analysis and positive data from the nonrandomized studies suggest that prolonged or continuous infusion ‐lactams is unlikely to be advantageous for all hospitalized patient populations, but may be beneficial for specific groups, such as critically ill patients with higher MIC pathogens.
The benefits of prolonged ‐lactam infusion among critically ill patients were highlighted by the study performed at Albany Medical Center Hospital.27 Based on a MCS, prolonged infusion TZP (3.375 grams administered over a 4‐hour period every 8 hours) was identified as an alternative means to the intermittent TZP dosing (3.375 grams administered over 30 minutes every 4 or 6 hours) and adopted as the standard TZP dosing scheme in February 2002. Prior to February 2002, all patients received traditional infusion TZP; after this time, all patients received prolonged infusion TZP. To evaluate the impact of the automatic dose substitution program, 14‐day mortality and hospital length of stay post‐culture collection were compared between patients who received either intermittent or prolonged TZP infusion for a TZP‐susceptible P. aeruginosa infection between 2000 and 2004.27 The study was restricted to P. aeruginosa infections for several reasons. First, patients with P. aeruginosa represented a relatively homogenous patient population; this attribute minimized confounding and increased the ability to detect differences between treatment groups according to intervention. Second, patients with P. aeruginosa infections are more dependent on antimicrobial therapy than other populations, since patients infected with P. aeruginosa are frequently critically ill and often have an impaired innate immune system.33, 34 Third, P. aeruginosa isolates typically have a higher range of MICs to TZP than other organisms, and the benefits of optimizing fT>MIC were thought to be better elucidated in this patient population.35, 36
In patients who were identified as having the greatest risk for 14‐day mortality (Acute Physiology and Chronic Health Evaluation [APACHE] II score 17), there was a significantly lower 14‐day mortality rate and a shorter median hospital LOS after culture sample collection for patients who received prolonged infusion, compared with patients who received intermittent infusion (Figure 4). No differences between prolonged infusion and intermittent infusion of TZP were observed with respect to outcome in patients at lowest risk for death (APACHE II score 17). These findings support the notion that critically ill patients who have P. aeruginosa infection are most dependent upon drug exposure for good clinical outcomes. The results also suggest that improved outcomes can be achieved by optimizing antibiotic PD in this population. Furthermore, the results highlight the importance of examining the influence of treatment within a population at greatest risk for the outcome of interest.27
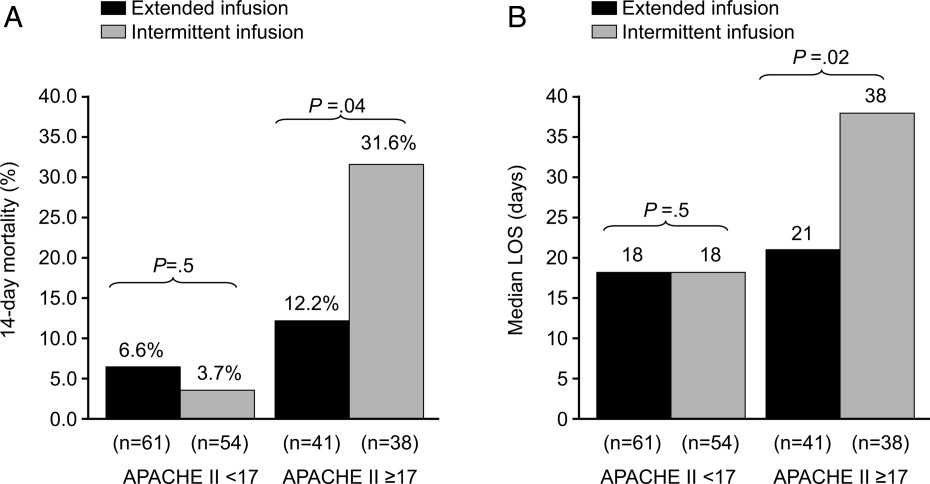
In addition to potential clinical benefits, prolonged infusions can provide cost savings by minimizing the amount of drug used per day. Prolonged infusion typically achieves the targeted fT > MIC at a total daily dose less than standard ‐lactam dosing methods. For example, TZP purchases totaled $275,000 the year before conversion at Albany Medical Center Hospital. Switching to the prolonged infusion strategy reduced the total daily dose by 25%50% (by 13 doses per day) representing a savings of $68,750$135,750 in annual direct drug acquisition costs.27
Additional Pharmacokinetic and Pharmacodynamic Considerations
When assessing the PK/PD of an antibiotic, it is also important to consider concentrations achieved at the site of infection. Most MCS studies have focused on free concentrations in plasma. Whereas free concentrations in plasma are often viewed as an acceptable approximation for free concentrations at the site of infection, this is not always the case. Of particular concern is in the treatment of lower respiratory tract infections. For ‐lactams, it was commonly believed that plasma and epithelial lining fluid (ELF) of the alveolar space concentrations were comparable; antibiotic concentrations in ELF are currently used to estimate the penetration of antibiotics into the respiratory tract. However, the median ELF/plasma penetration ratio for meropenem among patients with ventilator‐associated pneumonia (VAP) is only 25%.37 The only way to achieve a favorable fT > MIC PD profile at the site of infection with meropenem is to administer higher doses over prolonged periods of time (Figure 4). In light of the meropenem ELF data, data available on concentrations at the site of infection, particularly difficult‐to‐penetrate sites, such as ELF and cerebrospinal fluid, should be considered before designing dosing scheme for implementation into clinical practice.
Up to this point, this review has been focused on PD targets of clinical success. The next frontier in PK/PD is identifying antibiotic dosing schemes and drug combinations that minimize the emergence of resistance. Data available to date suggest that PD targets for resistance prevention are typically 24‐fold higher than PD targets for success. Tam et al showed that for meropenem, the PD target needed to suppress the emergence of resistance in P. aeruginosa was a Cmin:MIC ratio of 1.7.38 Further study is still needed in the area of resistance suppression but the current data suggest that obtaining the PK/PD target against the range of MIC encountered clinically is not likely with conventional ‐lactam dosing and will most likely require more intensive regimens administered over extended periods of time.38
Arguments Against Extended ‐lactam Infusions
Limited clinical trial data and lack of FDA approval are frequently cited as the major clinical barriers for implementing extended ‐lactam infusions into practice. Unfortunately, there is a relative dearth of large‐scale randomized clinical data supporting extending the infusion of ‐lactam therapy. In addition, the package inserts for the various ‐lactam antibiotics do not provide support for these prolonged infusion dosing.
While these are valid concerns, the clinical support for intermittent ‐lactam infusions is also limited. The clinical data are largely limited to complicated intra‐abdominal infections, complicated skin and soft tissue infections, complicated urinary tract infections, and community‐acquired pneumonia. None of the intermittently administered ‐lactams currently have an indication for bacteremia (except imipenem for bacterial septicemia), and there are only limited indications for hospital‐acquired pneumonia (HAP) or VAP (imipenem for lower respiratory tract infections and TZP in combination with an aminoglycoside for HAP). In addition, the clinical trials of intermittent ‐lactam infusion regimens have commonly assessed clinical response at the test‐of‐cure visit or after completion of therapy. Arguably, this is not a very clinically meaningful endpoint for the types of infections commonly encountered on a day‐to‐day basis in today's world, where mixed diagnoses and infecting pathogens are often seen. Most important, the bacteria have evolved since the early clinical trials used to obtain FDA approval, and those outdated studies do not address the resistance profiles currently observed in clinical practice.
Conclusions
Understanding exposure‐response relationships is critical when designing antibiotic dosing schemes. In the absence of therapeutic drug monitoring, MCS can be used to design antibiotic regimens that have a high probability of attaining the PD target linked to effect against the range of MICs likely to be encountered in clinical practice. When considering ‐lactam therapy for critically ill patients likely infected with high‐MIC or reduced‐susceptibility pathogens, a prolonged or continuous infusion regimen should be considered. Compared with intermittent dosing, prolonged infusion of ‐lactams is typically associated with improved PTA, as potential benefits of cost savings, and an enhanced PD profile at the site of infection.
- ,,,.Pharmacokinetic‐pharmacodynamic considerations in the design of hospital‐acquired or ventilator‐associated bacterial pneumonia studies: look before you leap!Clin Infect Dis.2010;51(Suppl 1):S103–S110.
- ,,, et al.Pharmacokinetics‐pharmacodynamics of antimicrobial therapy: it's not just for mice anymore.Clin Infect Dis.2007;44(1):79–86.
- .Pharmacokinetic/pharmacodynamic parameters: rationale for antibacterial dosing of mice and men.Clin Infect Dis.1998;26(1):1–10; quiz 11–12.
- .Antimicrobial pharmacodynamics: critical interactions of ‘bug and drug’.Nat Rev Microbiol.2004;2(4):289–300.
- ,,,,.Length of stay and hospital costs associated with a pharmacodynamic‐based clinical pathway for empiric antibiotic choice for ventilator‐associated pneumonia.Pharmacotherapy.2010;30(5):453–462.
- ,,, et al.Pharmacodynamic‐based clinical pathway for empiric antibiotic choice in patients with ventilator‐associated pneumonia.J Crit Care.2010;25(1):69–77.
- ,,, et al.Infectious Diseases Society of America and the Society for Healthcare Epidemiology of America guidelines for developing an institutional program to enhance antimicrobial stewardship.Clin Infect Dis.2007;44(2):159–177.
- ,,, et al.How modeling and simulation have enhanced decision making in new drug development.J Pharmacokinet Pharmacodyn.2005;32(2):185–197.
- ,,,,.PK/PD: new insights for antibacterial and antiviral applications.Curr Opin Pharmacol. Oct2008;8(5):549–556.
- CLSI. Performance Standards for Antimicrobial Susceptibility Testing; Twentieth Informational Supplement. CLSI document M100‐S20. Wayne, Pennsylvania: Clinical and Laboratory Standards Institute; 2010.
- Clinical and Laboratory Standards Institute/NCCLS. Performance standards for Antimicrobial disc diffusion tests; Approved standards. 9th ed. CLSI Document M2‐M9. Wayne, PA: Clinical and Laboratory Standards Institute; 2006.
- ,,.Application of antimicrobial pharmacodynamic concepts into clinical practice: focus on beta‐lactam antibiotics: insights from the Society of Infectious Diseases Pharmacists.Pharmacotherapy.2006;26(9):1320–1332.
- ,,,.Postantibiotic effect of imipenem on Pseudomonas aeruginosa.Antimicrob Agents Chemother.1984;26(5):678–682.
- ,,.Postantibiotic, postantibiotic sub‐MIC, and subinhibitory effects of PGE‐9509924, ciprofloxacin, and levofloxacin.Antimicrob Agents Chemother.2003;47(10):3352–3356.
- ,,, et al.In vitro evaluation of CBR‐2092, a novel rifamycin‐quinolone hybrid antibiotic: microbiology profiling studies with staphylococci and streptococci.Antimicrob Agents Chemother.2008;52(7):2324–2334.
- ,.The post‐antibiotic sub‐MIC effect in vitro and in vivo.J Antimicrob Chemother.1993;31(Suppl D):159–166.
- .Pharmacodynamic effects of subinhibitory antibiotic concentrations.Int J Antimicrob Agents.2001;17(1):1–8.
- ,,.Postantibiotic leukocyte enhancement: increased susceptibility of bacteria pretreated with antibiotics to activity of leukocytes.Rev Infect Dis.1981;3(1):38–44.
- ,.Enhancement of leukocyte activity against Escherichia coli after brief exposure to chloramphenicol.Antimicrob Agents Chemother.1979;16(6):695–700.
- ,.Pharmacokinetic and pharmacodynamic parameters of antimicrobials: potential for providing dosing regimens that are less vulnerable to resistance.Clin Pharmacokinet.2009;48(8):517–528.
- ,.Pharmacokinetics/pharmacodynamics of antibacterials in the intensive care unit: setting appropriate dosing regimens.Int J Antimicrob Agents.2008;32(4):294–301.
- ,,.Effect of protein binding on antibiotic activity in vivo.J Antimicrob Chemother.1983;11(3):233–238.
- ,,,,.Determining the active fraction of daptomycin against MRSA by evaluating bactericidal activity in the presence of protein and pharmacodynamic (PD) modeling. 49th Annual Interscience Conference on Antimicrobial Agents and Chemotherapy.2009;A1‐1270.
- ,,,,.Pharmacodynamic profiling of piperacillin in the presence of tazobactam in patients through the use of population pharmacokinetic models and Monte Carlo simulation.Antimicrob Agents Chemother.2004;48(12):4718–4724.
- ,,.Reevaluation of current susceptibility breakpoints for Gram‐negative rods based on pharmacodynamic assessment.Diagn Microbiol Infect Dis.2007;58(3):337–344.
- ,,, et al.Outcomes of bacteremia due to Pseudomonas aeruginosa with reduced susceptibility to piperacillin‐tazobactam: implications on the appropriateness of the resistance breakpoint.Clin Infect Dis. 152008;46(6):862–867.
- ,,.Piperacillin‐tazobactam for Pseudomonas aeruginosa infection: clinical implications of an extended‐infusion dosing strategy.Clin Infect Dis. 12007;44(3):357–363.
- ,.Pharmacokinetics and pharmacodynamics of antibiotics in otitis media.Pediatr Infect Dis J.1996;15(3):255–259.
- .Interrelationship between pharmacokinetics and pharmacodynamics in determining dosage regimens for broad‐spectrum cephalosporins.Diagn Microbiol Infect Dis.1995;22(1–2):89–96.
- .How does a patient maximally benefit from anti‐infective chemotherapy?Clin Infect Dis.2004;39(8):1245–1246.
- ,,,.Optimal dosing of piperacillin‐tazobactam for the treatment of Pseudomonas aeruginosa infections: prolonged or continuous infusion?Pharmacotherapy.2007;27(11):1490–1497.
- ,,,,.A systematic review on clinical benefits of continuous administration of beta‐lactam antibiotics.Crit Care Med.2009;37(6):2071–2078.
- ,,.Pharmacokinetic/pharmacodynamic modeling can help guide targeted antimicrobial therapy for nosocomial gram‐negative infections in critically ill patients.Diagn Microbiol Infect Dis.2004;48(2):125–130.
- ,,, et al.Pseudomonas aeruginosa bloodstream infection: importance of appropriate initial antimicrobial treatment.Antimicrob Agents Chemother.2005;49(4):1306–1311.
- ,,,.Assessment of pathogen occurrences and resistance profiles among infected patients in the intensive care unit: report from the SENTRY Antimicrobial Surveillance Program (North America, 2001).Int J Antimicrob Agents.2004;24(2):111–118.
- ,,.Results from the Meropenem Yearly Susceptibility Test Information Collection (MYSTIC) Programme: report of the 2001 data from 15 United States medical centres.Int J Antimicrob Agents.2004;23(1):52–59.
- ,,, et al.Penetration of meropenem into epithelial lining fluid of patients with ventilator‐associated pneumonia. Presented at the 48th Interscience Conference on Antimicrobial Agents and Chemotherapy/46th Annual Meeting of the Infectious Diseases Society of America. Washington DC,2008. Abstr 1889.
- ,,, et al.Optimization of meropenem minimum concentration/MIC ratio to suppress in vitro resistance of Pseudomonas aeruginosa.Antimicrob Agents Chemother. In press.
Tremendous strides have been made over the last 25 years in understanding the relationship between antimicrobial exposure and response.14 Many clinicians consider antimicrobial drug pharmacokinetics (PK) and pharmacodynamics (PD) a rather esoteric or academic topic without practical applicability or clinical utility. However, it is becoming increasingly clear, particularly as less‐susceptible pathogens emerge, that consideration of PK/PD in dose selection is essential for optimizing antimicrobial therapy and, as such, is a core component of effective antimicrobial stewardship and patient care. Antimicrobial therapy can fail if an appropriate agent is selected but the dosing regimen does not provide adequate exposure against the infecting pathogens, especially at the site of infection.5, 6
The 2007 guidelines from the Infectious Diseases Society of America (IDSA) and Society for Healthcare Epidemiology of America (SHEA) for developing institutional antimicrobial stewardship programs highlight dose optimization as one of the key strategies for enhancing antimicrobial stewardship.7 More specifically, they recommend optimizing dosing by focusing on individual patient characteristics, causative organism and site of infection, and the PK/PD characteristics of the drug. With advances in mathematical modeling (Monte Carlo simulation), it is possible to apply our understanding of PK/PD to clinical practice and design empiric regimens that have a high probability of achieving the PD target linked to effect. These mathematical modeling techniques have an array of other utilities and have become the standard methodologies for assessing the clinical viability of both experimental and approved antimicrobials.8, 9 Furthermore, the Clinical and Laboratory Standards Institute (CLSI) has recently begun to incorporate results from PK/PD analyses in determining MIC breakpoints.10 This paper provides a general overview of antimicrobial PD before demonstrating how to apply PD principles to clinical practice through the use of Monte Carlo simulation (MCS). Piperacillin/tazobactam (TZP) is used as a motivating example for this latter purpose.
Pharmacokinetics and Pharmacodynamics: Parameters and Principles
Pharmacokinetics describes the actions of the body on an administered drug, whereas PD describes the actions of the administered drug on the body. In essence, PK refers to the movement of the drug within the body, including absorption, distribution, metabolism, and excretion. Conversely, PD refers to the effects of the drug on the body, or its physiologic actions. A drug's PD is defined by its mechanism of action, and includes both desired and undesired effects. Typically, PK and PD work together to best define or predict the full range of effects of an administered drug on an individual patient, as described in greater detail below.
The Minimum Inhibitory Concentration
The MIC is the PD parameter most often used to describe the relationship between antimicrobial drug and physiologic activity. The MIC is defined as the lowest or minimum antimicrobial concentration that inhibits visible microbial growth in artificial medium after a fixed incubation time.10, 11 This is typically determined by placing a known quantity of bacteria (or other microorganism) into multiple test tubes, and then adding increasing concentrations of a particular antibiotic, typically in log2 dilution, into consecutive tubes. The lowest antibiotic concentration that inhibits bacterial growth is then defined as the MIC for that drug‐pathogen pairing.
While useful as a quantitative measure of drug activity or potency, the MIC is not without limitations.12 The MIC does not mimic physiologic conditions. The MIC is a static measure (fixed concentration of drug in an artificial growth medium for a fixed period of time) and is not reflective of the concentration‐time profile one would typically observe in patients; drug concentrations change throughout the dosing interval. Because the MIC only measures growth inhibition, it does not reflect the rate at which bacteria are killed, nor can it identify if a dosekill response relationship exists for a particular antibiotic‐pathogen pairing. Furthermore, the MIC only quantifies net growth over an 1824‐hour observation period. Killing and regrowth may well occur during this period, as long as the net growth is zero. Finally, the MIC does not account for the post‐antibiotic effects of antibiotics. Most antibiotics, depending on the pathogen and drug class, exhibit some persistence of bacteriostatic or bactericidal activity after the drug concentration at the target site has dropped below the MIC. This activity has been described as the post‐antibiotic effect,1315 post‐antibiotic sub‐MIC effect,1317 or post‐antibiotic leukocyte enhancement effect.18, 19
Common Pharmacodynamic Measures
Examination of PK measures of drug exposure (eg, serum/tissue concentrations) in relation to the MIC surmounts many of the limitations of the MIC and provides much better prediction of antimicrobial effect than the MIC or exposure profile alone. The 3 most common PK/PD indices (sometimes abbreviated as PD measures) used to predict drug response are: 1) the ratio of the maximal free drug concentration to the MIC (fCmax:MIC), 2) the ratio of the free area under the concentration‐time curve to the MIC (fAUC:MIC), and 3) the duration of time free drug concentrations remain above the MIC (fT>MIC).24, 20, 21 The PD parameter most predictive of outcomes varies by drug class (Table 1).20
| Antibiotic | Optimal PD measure(s) |
|---|---|
| |
| Aminoglycosides | Cmax:MIC; AUC:MIC |
| ‐lactams | |
| Penicillins | T>MIC |
| Cephalosporins | T>MIC |
| Carbapenems | T>MIC |
| Monobactams | T>MIC |
| Clindamycin | AUC:MIC |
| Fluoroquinolones | AUC:MIC, Cmax:MIC |
| Glycopeptides/lipopeptides | |
| Daptomycin | AUC:MIC, Cmax:MIC |
| Oritavancin | T>MIC, Cmax:MIC |
| Vancomycin | AUC:MIC |
| Linezolid | AUC:MIC |
| Macrolides | |
| Azithromycin | AUC:MIC |
| Clarithromycin | AUC:MIC |
| Telithromycin | AUC:MIC |
| Metronidazole | AUC:MIC, Cmax:MIC |
| Tetracyclines | |
| Doxycycline | AUC:MIC |
| Tigecycline | AUC:MIC |
Certain antibiotics exhibit concentration‐dependent bactericidal activity, while others exhibit time‐dependent activity (Table 1).24, 20 For concentration‐dependent antibiotics, a doseresponse relationship exists and the therapeutic goal is to maximize exposure at the target site. Alternatively, the activity of time‐dependent antibiotics is not dependent on the intensity of exposure but is a function of the duration of time concentrations are above the MIC during the dosing interval. For the time‐dependent antibiotics like the ‐lactams, concentrations do not have to remain above the MIC for the entire dosing interval, and the fraction of the dosing interval required for maximal bacterial effect varies for the different types of ‐lactams. Although the precise fT > MIC varies for different drugbacteria combinations, bacteriostatic effects are typically observed when the free drug concentration exceeds the MIC for 3540%, 30%, and 20% of the dosing interval for the cephalosporins, penicillins, and carbapenems, respectively. Near‐maximal bactericidal effects require 6070%, 50%, and 40% fT > MIC, respectively, for these ‐lactam classes.3, 4
It is important to note that it is the free (or unbound) fraction of drug that determines its ability to penetrate tissues and exert its microbiological effect.3, 4, 22 This was demonstrated as early as the 1940s with penicillin. There are occasionally exceptions, mostly with the therapy of gram‐positive infections. Daptomycin is one such example; protein binding is approximately 9092% (free drug 810%), but the agent behaves as if the drug is approximately 75% bound (25% free).23 Nonetheless, the guiding principle is that protein binding can have an adverse impact on the PD and microbiological activity of an antibacterial agent.
Monte Carlo Simulation
With advances in mathematical modeling, it is possible to apply our understanding of antimicrobial PD to clinical practice.12 In particular, MCS can be used to integrate PK, PD, and local microbiologic surveillance data to design antibiotic regimens that have a high probability of achieving the PD target linked to effect against the range of pathogens encountered in clinical practice. In short, MCS is a technique that incorporates the variability in PK among potential patients (between‐patient variability) when predicting antibiotic exposures, and allows calculation of the probability for obtaining a critical target exposure for the range of possible MIC values.12 If a number of volunteers or patients are given an antibiotic, there will be true variability in the observed concentration time profiles between people. For example, the peak serum concentrations and AUC0‐24h will vary between individuals. In essence, MCS is a mathematical modeling technique that simulates the dispersion or full spread of concentration‐time exposure values (eg, peak concentration, area under the curve) that would be seen in a large population after administration of a specific drug dose or regimen. Once the distribution in concentration‐time profiles is determined, the probability of achieving the PD target at each MIC value for a given MIC range (ie, probability of target attainment [PTA] profile) is ascertained.
There are several steps in the MCS process. First, a PK model for the antibiotic under study is embedded into the MCS. The mean PK parameters (eg, volume, clearance, intercompartmental transfer constant) and associated variability (variance and covariance) from the selected PK model are used to create a multivariate distribution of PK parameters. From this multivariate distribution, the MCS randomly selects a set of PK parameters, and these randomly selected PK parameters are used to simulate a concentration‐time profile for a virtual subject based on the desired antibiotic dosing regimen. This process is repeated a specified number of times (eg, 5000, 1000) to simulate the distribution of concentration‐time profiles one would expect to see in the population. Once the specified number of virtual patients has been simulated (eg, 10,000 virtual patients), the proportion of the simulated population that achieves the critical exposure target (eg, 50% fT > MIC) at each MIC value for a given MIC range can be calculated. Because the relationship between drug exposure and effect is expressed as a ratio (eg, AUC:MIC, Cmax:MIC, T:MIC), a unique drug exposure:MIC ratio and PTA exists for each unique MIC value within the distribution.12
In clinical practice, a distribution of MIC values exists for a given organism or infection. Therefore, the final step is determining the overall PTA for the distribution of organisms encountered clinically. As previously mentioned, the PTA is determined at each MIC value within a given MIC range. Because the fraction of organisms collected at each MIC value is known, the overall or weighted PTA average can be calculated by multiplying the PTA for a specific MIC and the proportion of isolates with that MIC. This product is calculated for each MIC value within the MIC distribution. The overall PTA is then calculated by summing the products (PTA at a given MIC value x proportion of isolates with that MIC value) of the MIC values encountered within the distribution.12
A key element for these simulations is the estimation of the PK parameters and their associated dispersion (variance and covariance). Pharmacokinetic data, especially for new compounds, are usually limited to data from healthy volunteer studies. Caution should be exercised when generalizing the results of volunteer studies to the population of interest. Volunteer studies are often considered as the most conservative evaluation of a new drug; volunteers are young and healthy, likely to have the highest drug clearances and shortest half lives. However, when one performs MCS, the measure of central tendency (high drug clearance, short half‐lives) is only part of the story. Because MCS are explicitly creating a distribution, it is important to understand the measure of dispersion. Secondary to the limited variation surrounding PK parameters from healthy volunteer studies, it is possible that they overestimate the PTA. Applicability to the target population must always be considered.12
Motivating Example: Piperacillin‐tazobactam
Piperacillin‐tazobactam (TZP) is an acylureido‐penicillinbeta‐lactamase inhibitor combination and is frequently used as first‐line empirical therapy for healthcare‐associated infections. Like all ‐lactams, the PD parameter most predictive of its efficacy is fT > MIC, and its activity is optimized when free drug concentrations exceed the MIC for 50% of the dosing interval (50% fT > MIC). Because it is used empirically, it is critical that the TZP regimens used in practice have a high probability of achieving 50% fT > MIC against the range of MIC values likely to be encountered in a given institution.
Since the MIC of the infecting pathogen is often not available at the start of therapy, clinicians frequently rely on the hospital antibiogram to determine the utility of an antibiotic as an empiric agent. The range of MIC values reported as susceptible in clinical practice is based on the CLSI susceptibility interpretive criteria. For TZP, Enterobacteriaceae and Acinetobacter baumannii isolates with MIC values 16 mg/L are considered susceptible. The CLSI breakpoint for Pseudomonas aeruginosa is higher and isolates with MIC values 64/4 mg/L are considered susceptible.11
It is important to recognize that these CLSI TZP susceptibility breakpoints were established prior to our current understanding of ‐lactam PD and are higher relative to other ‐lactams. It was not until sometime after the establishment of the TZP susceptibility interpretive criteria were MCS studies performed to determine the ability of the US Food and Drug Administration (FDA)‐approved TZP dosing regimens in achieving 50% fT > MIC against the range of MICs deemed susceptible by CLSI.
The first study to characterize the ability of standard TZP dosing (0.5‐hour infusion of 3.375 g every 6 hours) in achieving 50% T > MIC in its targeted population for the range of MIC values deemed susceptible by CLSI was published in 2004 by our group. Employing a population PK model derived in hospitalized patients, TZP 3.375 grams administered every 6 h provided high PTA rates for MICs of 8/4 mg/L (ie, 8 mg/L for piperacillin and 4 mg/L for tazobactam) when hospitalized‐patient data were used (Figure 1).24 In clinical situations in which the MICs are expected to be 16/4 mg/L, the results of the MCS indicate that caution should be exercised when using standard TZP dosing. More recently, DeRyke et al evaluated the PD profile of the TZP nosocomial dosing scheme (0.5‐hour infusion of 4.5 g every 6 hours). Using the same population PK model employed as our study, DeRyke and colleagues noted a slightly improved PTA profile at a MIC value of 16/4 mg/L with the TZP nosocomial pneumonia dosing scheme relative to standard dosing. However, the PTA was still suboptimal for MIC values 32/4 mg/L (Figure 1).25
These findings are concerning because the TZP CLSI susceptibility breakpoint for non‐lactose fermenting Gram‐negative bacteria is 64/4 mg/L.11 In essence, the conventional and nosocomial pneumonia TZP dosing schemes provide a suboptimal PD profile for a substantial portion of the MIC distribution deemed susceptible by CLSI. The clinical relevance of this is highlighted by a study by Tam and coworkers examining the efficacy of TZP in hospitalized patients with bacteremia due to P. aeruginosa (Figure 2).26 This retrospective cohort study examined 30‐day mortality among patients who received appropriate empiric therapy between 2002 and 2006. Therapy was defined as appropriate if: 1) ‐lactam treatment (in doses appropriate for renal function as recommended by the manufacturer) was started within 24 hours of blood culture collection, and 2) the isolate was found to be susceptible to the ‐lactam agent selected. The cohort was stratified by the TZP piperacillin MIC (3264 mg/L vs. 16 mg/L) and 30‐day mortality rates were compared within MIC strata between patients who received TZP or an alternative ‐lactam with activity against Pseudomonas aeruginosa. A total of 34 episodes with MICs of 32 or 64 mg/L were identified. Seven of these cases were empirically treated with TZP, while the remaining 27 received other ‐lactam agents. Forty‐nine episodes of P. aeruginosa bacteremias had MIC values 16 mg/L. Of these 49, 10 were empirically treated with TZP and the remaining 39 were treated with other ‐lactams. The results showed that the 30‐day mortality rate was significantly higher among patients treated with TZP versus control‐treated patients with isolates possessing a MIC of either 32 or 64 mg/L (86% vs. 22%, P value = 0.004), while there was no significant difference between the two treatment groups for isolates with a MIC of up to 16 mg/L (30% vs. 21%, P = 0.673). Interestingly, patients treated with a non‐TZP ‐lactam antibiotic had 30‐day mortality rates of 21%, regardless of the TZP MIC value. Collectively, these findings and the results of the TZP MCS studies highlight the importance of considering PTA data when evaluating the utility of an antibiotic dosing scheme. These data also cast uncertainty on the appropriateness of the current TZP CLSI susceptibility breakpoint in connection with the conventional dosing TZP strategies. The current CLSI interpretation of TZP susceptibility for non‐lactose‐fermenting gram‐negatives may inadvertently provide misleading guidance to clinicians for optimal patient care.
Dosing Strategies to Improve the Probability of Target Attainment Profile of ‐lactams
Three potential dosing strategies used to improve the PTA of a ‐lactam against the range of pathogens encountered in various clinical situations include: 1) increasing the dose, 2) increasing the dosing frequency, or 3) increasing the duration of infusion.12 Intuitively, it makes sense to simply increase the drug dose. However, as demonstrated in the aforementioned TZP MCS studies, increasing the TZP dose from 3.375 grams to 4.5 grams every 6 hours had a minimal impact on the PTA profile.24, 25 To increase fT >MIC by 1 half‐life, the dose would need to be doubled. Since most ‐lactams have a half‐life of 30 minutes to 1 hour, doubling the dose only provides an extra 30 minutes or hour above the MIC, which would not be expected to have much clinical impact. In addition, doubling the dose is not cost effective since it doubles drug acquisition costs.12, 27
Increasing the dosing frequency is a viable option and may be the optimal strategy in certain situations.12 However, it is often associated with increased drug acquisition costs (more doses per day) relative to the parent regimen and may not be a viable option from a nursing and pharmacy perspective due to increased administration and preparation time. In addition, there may be a higher potential for toxicity because a greater amount of drug is given per day.
Extending the infusion time is another ‐lactam dose optimization strategy that is becoming more commonly used in clinical practice. Administering a dose of a ‐lactam agent as an infusion longer than the conventional 0.51.0‐hour infusion duration has 2 main effects. First, it produces a lower peak concentration of the drug.24 Because the bacterial kill rate for these agents is not concentration‐dependent, this does not present a major disadvantage.3, 4, 2830 Second, the drug concentrations remain in excess of the MIC for a longer period of time. Because this is what drives antibacterial effect for ‐lactams, this will yield a more favorable PTA profile. It should also be noted that this can be done with less frequent drug dosing.27
Extending the infusion time can be accomplished by either prolonging the infusion time for a major portion of the dosing interval (prolonged infusion) or administering continuously throughout the day (continuous infusion). From a PD profiling viewpoint, the two infusion methodologies yield nearly identical PTA profiles. This was highlighted in the 2007 study by Kim et al, which compared PTA rates between intermittent (0.5 hour), prolonged (4 hours), and continuous infusions of TZP (Figure 3). In their study, the PTA curves for prolonged and continuous infusion TZP were superimposable and superior to the intermittent infusion regimen for MIC values in excess of 4 mg/L.31
There are several practicalities to consider when differentiating prolonged and continuous infusion methods. The principle advantages of continuous infusion are once‐daily administration and reduced costs for labor, supplies, and administration.12, 27 The major disadvantages of continuous infusion are the need for a dedicated line for infusion (which often leads to drug compatibility issues), issues of drug stability and waste, and lack of ambulation for the patient. The need for a dedicated infusion line is particularly impractical for patients with limited intravenous access or those requiring multiple daily infusions. In addition, continuous infusion often requires insertion of a central line, which places patients at unnecessary risk of secondary catheter‐related infection.12 Continuous infusion solutions are typically prepared as 24‐hour infusions containing the total daily amount of drug. Considerable drug wastage can occur with early discontinuation of therapy; all drug within the solution needs to be wasted and cannot be reused if the order is discontinued prior to scheduled completion.
Prolonged infusion provides many of the benefits of intermittent dosing, but with the PD advantages of continuous infusion. Administration of the infusion for a prolonged time, but not continuously, obviates the need to have a dedicated intravenous line just for ‐lactam continuous infusion. It also achieves the targeted fT > MIC at a total daily dose less than standard ‐lactam dosing methods. Drug wastage is also minimized because the intermittent administration formulations are used; there is no need to prepare antibiotic solutions for 24‐hour periods. Prolonged infusion also allows the patient to be ambulatory for much of the day. The potential disadvantages of prolonged infusion relative to continuous infusion include the increased use of labor, supplies, and administration resources. Although minimized, there is still the need to schedule or time the administration of incompatible drugs.12, 27
Data Examining the Outcomes Associated With Prolonged and Continuous ‐lactam Infusions
Over the years, a number of randomized controlled trials (RCTs) and observational studies have compared outcomes between extended and intermittent ‐lactam infusions. These studies, mostly small scale in nature, involved a number of different ‐lactam antibiotics and various infectious etiologies. To ascertain if there are any clinical benefits in extending the infusion duration (prolonged and continuous), Roberts and colleagues performed a systematic review of available data on PubMed (January 1950 to November 2007), EMBASE (1966 to November 2007), and the Cochrane Controlled Trial Register (updated November 2007).32 Randomized controlled trials were meta‐analyzed, and observational studies were reviewed. Among a total of 59 potentially RCTs, 14 involving a total of 846 patients from nine countries were deemed appropriate for meta‐analysis. The use of continuous infusion of a ‐lactam antibiotic was not associated with an improvement in clinical cure (n=755 patients; odds ratio: 1.04, 95% confidence interval: 0.741.46, P = 0.83) or mortality (n=541 patients; odds ratio: 1.00, 95% confidence interval: 0.482.06, P = 1.00). In contrast, the observational studies showed that ‐lactam administration by extended or continuous infusion confers an improvement in clinical cure and this was most pronounced in critically ill patients being treated for gram‐negative bacterial infections.
There are several possible explanations for the discrepancy in results between the meta‐analysis and observational studies. First, disease severity in the studies included in the meta‐analysis was generally low, as evidenced by low mortality rates in the majority of studies. Second, a diverse group of patients and infection types were included in the RCTs, which increased the heterogeneity of the cohort analyzed. Third, a higher antibiotic dose was used in the intermittent administration group in all RCTs except one. Fourth, microbiologic and PK/PD data were not available for the majority of RCTs. Collectively, the null result from the meta‐analysis and positive data from the nonrandomized studies suggest that prolonged or continuous infusion ‐lactams is unlikely to be advantageous for all hospitalized patient populations, but may be beneficial for specific groups, such as critically ill patients with higher MIC pathogens.
The benefits of prolonged ‐lactam infusion among critically ill patients were highlighted by the study performed at Albany Medical Center Hospital.27 Based on a MCS, prolonged infusion TZP (3.375 grams administered over a 4‐hour period every 8 hours) was identified as an alternative means to the intermittent TZP dosing (3.375 grams administered over 30 minutes every 4 or 6 hours) and adopted as the standard TZP dosing scheme in February 2002. Prior to February 2002, all patients received traditional infusion TZP; after this time, all patients received prolonged infusion TZP. To evaluate the impact of the automatic dose substitution program, 14‐day mortality and hospital length of stay post‐culture collection were compared between patients who received either intermittent or prolonged TZP infusion for a TZP‐susceptible P. aeruginosa infection between 2000 and 2004.27 The study was restricted to P. aeruginosa infections for several reasons. First, patients with P. aeruginosa represented a relatively homogenous patient population; this attribute minimized confounding and increased the ability to detect differences between treatment groups according to intervention. Second, patients with P. aeruginosa infections are more dependent on antimicrobial therapy than other populations, since patients infected with P. aeruginosa are frequently critically ill and often have an impaired innate immune system.33, 34 Third, P. aeruginosa isolates typically have a higher range of MICs to TZP than other organisms, and the benefits of optimizing fT>MIC were thought to be better elucidated in this patient population.35, 36
In patients who were identified as having the greatest risk for 14‐day mortality (Acute Physiology and Chronic Health Evaluation [APACHE] II score 17), there was a significantly lower 14‐day mortality rate and a shorter median hospital LOS after culture sample collection for patients who received prolonged infusion, compared with patients who received intermittent infusion (Figure 4). No differences between prolonged infusion and intermittent infusion of TZP were observed with respect to outcome in patients at lowest risk for death (APACHE II score 17). These findings support the notion that critically ill patients who have P. aeruginosa infection are most dependent upon drug exposure for good clinical outcomes. The results also suggest that improved outcomes can be achieved by optimizing antibiotic PD in this population. Furthermore, the results highlight the importance of examining the influence of treatment within a population at greatest risk for the outcome of interest.27
In addition to potential clinical benefits, prolonged infusions can provide cost savings by minimizing the amount of drug used per day. Prolonged infusion typically achieves the targeted fT > MIC at a total daily dose less than standard ‐lactam dosing methods. For example, TZP purchases totaled $275,000 the year before conversion at Albany Medical Center Hospital. Switching to the prolonged infusion strategy reduced the total daily dose by 25%50% (by 13 doses per day) representing a savings of $68,750$135,750 in annual direct drug acquisition costs.27
Additional Pharmacokinetic and Pharmacodynamic Considerations
When assessing the PK/PD of an antibiotic, it is also important to consider concentrations achieved at the site of infection. Most MCS studies have focused on free concentrations in plasma. Whereas free concentrations in plasma are often viewed as an acceptable approximation for free concentrations at the site of infection, this is not always the case. Of particular concern is in the treatment of lower respiratory tract infections. For ‐lactams, it was commonly believed that plasma and epithelial lining fluid (ELF) of the alveolar space concentrations were comparable; antibiotic concentrations in ELF are currently used to estimate the penetration of antibiotics into the respiratory tract. However, the median ELF/plasma penetration ratio for meropenem among patients with ventilator‐associated pneumonia (VAP) is only 25%.37 The only way to achieve a favorable fT > MIC PD profile at the site of infection with meropenem is to administer higher doses over prolonged periods of time (Figure 4). In light of the meropenem ELF data, data available on concentrations at the site of infection, particularly difficult‐to‐penetrate sites, such as ELF and cerebrospinal fluid, should be considered before designing dosing scheme for implementation into clinical practice.
Up to this point, this review has been focused on PD targets of clinical success. The next frontier in PK/PD is identifying antibiotic dosing schemes and drug combinations that minimize the emergence of resistance. Data available to date suggest that PD targets for resistance prevention are typically 24‐fold higher than PD targets for success. Tam et al showed that for meropenem, the PD target needed to suppress the emergence of resistance in P. aeruginosa was a Cmin:MIC ratio of 1.7.38 Further study is still needed in the area of resistance suppression but the current data suggest that obtaining the PK/PD target against the range of MIC encountered clinically is not likely with conventional ‐lactam dosing and will most likely require more intensive regimens administered over extended periods of time.38
Arguments Against Extended ‐lactam Infusions
Limited clinical trial data and lack of FDA approval are frequently cited as the major clinical barriers for implementing extended ‐lactam infusions into practice. Unfortunately, there is a relative dearth of large‐scale randomized clinical data supporting extending the infusion of ‐lactam therapy. In addition, the package inserts for the various ‐lactam antibiotics do not provide support for these prolonged infusion dosing.
While these are valid concerns, the clinical support for intermittent ‐lactam infusions is also limited. The clinical data are largely limited to complicated intra‐abdominal infections, complicated skin and soft tissue infections, complicated urinary tract infections, and community‐acquired pneumonia. None of the intermittently administered ‐lactams currently have an indication for bacteremia (except imipenem for bacterial septicemia), and there are only limited indications for hospital‐acquired pneumonia (HAP) or VAP (imipenem for lower respiratory tract infections and TZP in combination with an aminoglycoside for HAP). In addition, the clinical trials of intermittent ‐lactam infusion regimens have commonly assessed clinical response at the test‐of‐cure visit or after completion of therapy. Arguably, this is not a very clinically meaningful endpoint for the types of infections commonly encountered on a day‐to‐day basis in today's world, where mixed diagnoses and infecting pathogens are often seen. Most important, the bacteria have evolved since the early clinical trials used to obtain FDA approval, and those outdated studies do not address the resistance profiles currently observed in clinical practice.
Conclusions
Understanding exposure‐response relationships is critical when designing antibiotic dosing schemes. In the absence of therapeutic drug monitoring, MCS can be used to design antibiotic regimens that have a high probability of attaining the PD target linked to effect against the range of MICs likely to be encountered in clinical practice. When considering ‐lactam therapy for critically ill patients likely infected with high‐MIC or reduced‐susceptibility pathogens, a prolonged or continuous infusion regimen should be considered. Compared with intermittent dosing, prolonged infusion of ‐lactams is typically associated with improved PTA, as potential benefits of cost savings, and an enhanced PD profile at the site of infection.
- ,,,.Pharmacokinetic‐pharmacodynamic considerations in the design of hospital‐acquired or ventilator‐associated bacterial pneumonia studies: look before you leap!Clin Infect Dis.2010;51(Suppl 1):S103–S110.
- ,,, et al.Pharmacokinetics‐pharmacodynamics of antimicrobial therapy: it's not just for mice anymore.Clin Infect Dis.2007;44(1):79–86.
- .Pharmacokinetic/pharmacodynamic parameters: rationale for antibacterial dosing of mice and men.Clin Infect Dis.1998;26(1):1–10; quiz 11–12.
- .Antimicrobial pharmacodynamics: critical interactions of ‘bug and drug’.Nat Rev Microbiol.2004;2(4):289–300.
- ,,,,.Length of stay and hospital costs associated with a pharmacodynamic‐based clinical pathway for empiric antibiotic choice for ventilator‐associated pneumonia.Pharmacotherapy.2010;30(5):453–462.
- ,,, et al.Pharmacodynamic‐based clinical pathway for empiric antibiotic choice in patients with ventilator‐associated pneumonia.J Crit Care.2010;25(1):69–77.
- ,,, et al.Infectious Diseases Society of America and the Society for Healthcare Epidemiology of America guidelines for developing an institutional program to enhance antimicrobial stewardship.Clin Infect Dis.2007;44(2):159–177.
- ,,, et al.How modeling and simulation have enhanced decision making in new drug development.J Pharmacokinet Pharmacodyn.2005;32(2):185–197.
- ,,,,.PK/PD: new insights for antibacterial and antiviral applications.Curr Opin Pharmacol. Oct2008;8(5):549–556.
- CLSI. Performance Standards for Antimicrobial Susceptibility Testing; Twentieth Informational Supplement. CLSI document M100‐S20. Wayne, Pennsylvania: Clinical and Laboratory Standards Institute; 2010.
- Clinical and Laboratory Standards Institute/NCCLS. Performance standards for Antimicrobial disc diffusion tests; Approved standards. 9th ed. CLSI Document M2‐M9. Wayne, PA: Clinical and Laboratory Standards Institute; 2006.
- ,,.Application of antimicrobial pharmacodynamic concepts into clinical practice: focus on beta‐lactam antibiotics: insights from the Society of Infectious Diseases Pharmacists.Pharmacotherapy.2006;26(9):1320–1332.
- ,,,.Postantibiotic effect of imipenem on Pseudomonas aeruginosa.Antimicrob Agents Chemother.1984;26(5):678–682.
- ,,.Postantibiotic, postantibiotic sub‐MIC, and subinhibitory effects of PGE‐9509924, ciprofloxacin, and levofloxacin.Antimicrob Agents Chemother.2003;47(10):3352–3356.
- ,,, et al.In vitro evaluation of CBR‐2092, a novel rifamycin‐quinolone hybrid antibiotic: microbiology profiling studies with staphylococci and streptococci.Antimicrob Agents Chemother.2008;52(7):2324–2334.
- ,.The post‐antibiotic sub‐MIC effect in vitro and in vivo.J Antimicrob Chemother.1993;31(Suppl D):159–166.
- .Pharmacodynamic effects of subinhibitory antibiotic concentrations.Int J Antimicrob Agents.2001;17(1):1–8.
- ,,.Postantibiotic leukocyte enhancement: increased susceptibility of bacteria pretreated with antibiotics to activity of leukocytes.Rev Infect Dis.1981;3(1):38–44.
- ,.Enhancement of leukocyte activity against Escherichia coli after brief exposure to chloramphenicol.Antimicrob Agents Chemother.1979;16(6):695–700.
- ,.Pharmacokinetic and pharmacodynamic parameters of antimicrobials: potential for providing dosing regimens that are less vulnerable to resistance.Clin Pharmacokinet.2009;48(8):517–528.
- ,.Pharmacokinetics/pharmacodynamics of antibacterials in the intensive care unit: setting appropriate dosing regimens.Int J Antimicrob Agents.2008;32(4):294–301.
- ,,.Effect of protein binding on antibiotic activity in vivo.J Antimicrob Chemother.1983;11(3):233–238.
- ,,,,.Determining the active fraction of daptomycin against MRSA by evaluating bactericidal activity in the presence of protein and pharmacodynamic (PD) modeling. 49th Annual Interscience Conference on Antimicrobial Agents and Chemotherapy.2009;A1‐1270.
- ,,,,.Pharmacodynamic profiling of piperacillin in the presence of tazobactam in patients through the use of population pharmacokinetic models and Monte Carlo simulation.Antimicrob Agents Chemother.2004;48(12):4718–4724.
- ,,.Reevaluation of current susceptibility breakpoints for Gram‐negative rods based on pharmacodynamic assessment.Diagn Microbiol Infect Dis.2007;58(3):337–344.
- ,,, et al.Outcomes of bacteremia due to Pseudomonas aeruginosa with reduced susceptibility to piperacillin‐tazobactam: implications on the appropriateness of the resistance breakpoint.Clin Infect Dis. 152008;46(6):862–867.
- ,,.Piperacillin‐tazobactam for Pseudomonas aeruginosa infection: clinical implications of an extended‐infusion dosing strategy.Clin Infect Dis. 12007;44(3):357–363.
- ,.Pharmacokinetics and pharmacodynamics of antibiotics in otitis media.Pediatr Infect Dis J.1996;15(3):255–259.
- .Interrelationship between pharmacokinetics and pharmacodynamics in determining dosage regimens for broad‐spectrum cephalosporins.Diagn Microbiol Infect Dis.1995;22(1–2):89–96.
- .How does a patient maximally benefit from anti‐infective chemotherapy?Clin Infect Dis.2004;39(8):1245–1246.
- ,,,.Optimal dosing of piperacillin‐tazobactam for the treatment of Pseudomonas aeruginosa infections: prolonged or continuous infusion?Pharmacotherapy.2007;27(11):1490–1497.
- ,,,,.A systematic review on clinical benefits of continuous administration of beta‐lactam antibiotics.Crit Care Med.2009;37(6):2071–2078.
- ,,.Pharmacokinetic/pharmacodynamic modeling can help guide targeted antimicrobial therapy for nosocomial gram‐negative infections in critically ill patients.Diagn Microbiol Infect Dis.2004;48(2):125–130.
- ,,, et al.Pseudomonas aeruginosa bloodstream infection: importance of appropriate initial antimicrobial treatment.Antimicrob Agents Chemother.2005;49(4):1306–1311.
- ,,,.Assessment of pathogen occurrences and resistance profiles among infected patients in the intensive care unit: report from the SENTRY Antimicrobial Surveillance Program (North America, 2001).Int J Antimicrob Agents.2004;24(2):111–118.
- ,,.Results from the Meropenem Yearly Susceptibility Test Information Collection (MYSTIC) Programme: report of the 2001 data from 15 United States medical centres.Int J Antimicrob Agents.2004;23(1):52–59.
- ,,, et al.Penetration of meropenem into epithelial lining fluid of patients with ventilator‐associated pneumonia. Presented at the 48th Interscience Conference on Antimicrobial Agents and Chemotherapy/46th Annual Meeting of the Infectious Diseases Society of America. Washington DC,2008. Abstr 1889.
- ,,, et al.Optimization of meropenem minimum concentration/MIC ratio to suppress in vitro resistance of Pseudomonas aeruginosa.Antimicrob Agents Chemother. In press.
How to Get Ahead in Community-Based Hospital Medicine
What does it take to advance your career in the community hospital setting? Good communication and relationship skills top the list, according to Joe Metcalf, MD, director of the Hospital Medicine Service at Faith Regional Health Services in Norfolk, Neb. When Dr. Metcalf started the hospitalist service at the 227-bed regional referral center three and a half years ago, he was not looking for "brilliant" physicians. Instead, he says, "I was looking for excellent communicators."
"Patients are not interested in exceedingly smart clinicians," Dr. Metcalf says. "They are interested in clinicians who are willing to sit at the bedside, hold the elderly patient’s hand, listen to their concerns, and communicate the plans of care in ways they can understand."
Listening is a part of communication that is often neglected, he says.
Versatile and Teachable
Family-practice-trained, ED-hospitalist Joseph Babbitt, MD, works at 22-bed Blue Hill Memorial Hospital in Blue Hill, Maine. The key to success for hospitalists in the small-community-hospital setting is versatility, he says. It’s not unusual for hospitalists at Blue Hill to perform cardiac stress tests for a cardiology colleague or provide perioperative comanagement for surgical colleagues, he adds.
Dr. Babbitt underscores the willingness to acquire a broad range of skills. Dr. Metcalf agrees, and explains it’s one of the reasons he looks for "teachability" in hospitalist job candidates.
"It goes without saying that physicians must be proficient clinicians," he says, "but what I’m also listening for is whether they truly have a passion for patient-centered care."
Dr. Metcalf values honesty in his team members, and respects hospitalists who ask for help with their difficult cases.
Wired for Small
When it comes to community hospital settings, size matters. The hospital setting and job description should fit your preferences. Dr. Babbitt advises candidates to "listen to your gut" when interviewing for community hospital jobs. "If your reaction after checking out a job prospect is, ‘Well, I think I can make this work,’ then don’t try to make it work, because it probably won’t," he says. "You’re either ‘wired for small’ or you’re not."
Residents can prepare for a new job at a small community hospital. Dr. Babbitt recalls one young physician who, after a medical school rotation in a small hospital, realized that he was interested in becoming a "small-hospital hospitalist." He acquired additional training in emergency medicine because he identified it as a skill set that he needed to strengthen.
One thing is for sure: Variety is the order of the day in community settings. "You can bet," Dr. Babbitt says, "that the job you’re hired for is not going to be the job you’re doing in a year. Something about it will have changed."
Gretchen Henkel is a frequent contributor to The Hospitalist.
SOUND CAREER ADVICE
For more tips and strategies for advancing or establishing a career in hospital medicine, visit the SHM Career Center.