User login
Severe Hypertriglyceridemia: A Review
The patient with a markedly high serum triglyceride (TG) level poses an interesting challenge for hospitalists. Hypertriglyceridemia (HTG) is defined as a fasting plasma TG level that is above the 95th percentile for age and sex.1 TG levels are commonly classified into categories according to Adult Treatment Panel III guidelines with desirable levels 150 mg/dL (1.7 mmol/L), borderline levels 150199, high levels 200499 mg/dL, and very high levels >500 mg/dL (5.6 mmol/L).2 A TG level exceeding an arbitrary threshold of >1000 mg/dL (11.3 mmol/L) is referred to as severe HTG. The Lipid Research Clinics Program Prevalence Study found that 1.79 per 10,000 outpatients (0.02%) had TG levels > 2000 mg/dL.3 Chylomicronemia syndrome occurs when severe HTG is accompanied by 1 or more of the following: symptoms of abdominal pain or acute pancreatitis or physical examination findings such as eruptive xanthomas or lipemia retinalis. There is no TG level above which pancreatitis invariably occurs, making the decision to hospitalize difficult. The goal of this review is to discuss the causes of severe HTG; the clinical assessment, including criteria for hospitalization; and the available treatment options for this infrequent but serious condition. We begin with a clinical case of severe HTG.
CASE PRESENTATION
A 47‐year‐old woman with a history of chronic myelogenous leukemia was admitted to the hospital with a serum triglyceride level of 17,393 mg/dL. Two years prior to admission, she underwent allogenic stem cell transplantation for chronic myelogenous leukemia and has since remained in remission. Six months prior to admission, severe diarrhea from intestinal graft‐versus‐host disease required the use of total parenteral nutrition (TPN) and immunosuppressive therapy consisting of prednisone 20 mg/day, mycophenolate mofetil 250 mg thrice daily, and sirolimus 0.3 mg/day. During treatment with steroids, she developed diabetes mellitus requiring insulin, with a subsequent hemoglobin A1c level of 7.7% (normal, 7%). The serum TG level prior to transplantation was unknown but was 343 mg/dL prior to TPN initiation. One month prior to admission, the diarrhea resolved and TPN was stopped. The TG level was 7463 mg/dL 1 week prior to admission, and despite use of fenofibrate, it rose to 17,393 mg/dL. The patient denied abdominal pain, and did not have abdominal tenderness or eruptive xanthomas. She denied a family history of dyslipidemia or recent medication changes. Given the extreme TG elevation, the lack of response to outpatient treatment and the concern for developing acute pancreatitis, the patient was admitted to the hospital for inpatient TG‐lowering treatment.
Upon admission, serum lipase and amylase were within normal limits, but the blood glucose level was 243 mg/dL. Insulin infusion and oral fenofibrate 145 mg/day was started, and the patient was kept non per os (NPO). Six hours later, despite insulin infusion, the TG level rose to 26,250 mg/dL. Therapeutic plasma exchange (TPE) was performed on 2 consecutive days with a resultant decrease in TG level to 530 mg/dL. The patient was later discharged home on fenofibrate and omega‐3 ethyl esters, her same immunosuppressive and insulin regimen, and instructions for a very low‐fat diet. In the next 3 months, her serum TG level did not rise above 530 mg/dL. The cause of our patient's extreme TG elevation was likely a combination of genetic factors exacerbated by immunosuppressive and glucocorticoid therapy.
This case featured dramatic elevations in serum TG levels that the managing doctors believed merited a hospital admission. Management of patients with severe HTG first requires an understanding of TG metabolism.
ETIOLOGY
Serum TGs produced by the liver are carried by very low‐density lipoproteins (VLDLs), whereas TGs derived from dietary fat are carried by chylomicrons. Both chylomicrons and VLDLs are hydrolyzed by the same enzymelipoprotein lipase (LPL). TGs are hydrolyzed into fatty acids for uptake by muscle and adipose tissue, whereas remnants of VLDL and chylomicrons are removed by the liver. More details on TG pathophysiology may be found in a recent review.4 When LPL is saturated with VLDL, ingestion of a fatty meal may cause chylomicrons to linger in circulation for days instead of hours. Asking the laboratory to spin down the blood of a patient with severe HTG and keep the test tube upright at 4C may reveal a large creamy supernatant layer demonstrating chylomicronemia.
A fasting TG level drawn 12 hours after the last meal reflects hepatic TG production. Although a nonfasting TG level may reflect postprandial chylomicrons, values above 1000 mg/dL strongly suggest true HTG, particularly in the setting of acute pancreatitis. Treatment should not be delayed to obtain a fasting TG level.
HTG may result from increased VLDL production, reduced VLDL/chylomicron clearance, or more likely a combination of the two. The causes of these metabolic derangements are classified as primary (genetic) or secondary (acquired) (Table 1). In adult patients, HTG is usually the result of a combination of primary and secondary causes. A study of 123 patients with TG levels >2000 mg/dL found that all patients had a primary metabolic defect and 110/123 had a coexistent secondary cause.3 An underlying genetic lipoprotein metabolism derangement is often clinically silent until coupled with a secondary cause of HTG that together raise TG levels high enough to cause the chylomicronemia syndrome.
|
| Primary |
| Familial lipid disorders |
| Lipoprotein pattern type I |
| Familial chylomicronemia |
| Deficiency in LPL and/or apo‐CII |
| Autosomal recessive; presents in childhood |
| Rare functional disorders in LPL |
| Lipoprotein pattern type III |
| Familial dysbetalipoproteinemia |
| Inadequate VLDL clearance from apo‐E2 |
| Autosomal recessive; presents in adulthood |
| Lipoprotein pattern type IV |
| Familial HTG: increased VLDL |
| Autosomal dominant; presents in adulthood |
| Familial combined hyperlipidemia |
| Multiple phenotypes seen; increased apo‐B levels |
| Lipoprotein pattern type V |
| Mixed HTG: increased VLDL and chylomicrons; presents in adulthood |
| Secondary |
| Disease |
| Poorly controlled diabetes mellitus; hypothyroid; SLE; Cushing syndrome; HIV infection; sarcoid multiple myeloma; obesity; renal disease (nephrotic) |
| Disorder of metabolism |
| Pregnancy |
| Diet |
| Excessive alcohol, especially with high‐fat diet |
| Drugs |
| Estrogen; tamoxifen; glucocorticoids; protease inhibitors; nonselective beta‐blockers; propofol; isotretinoin; some antipsychotic medications (clozapine, olanzapine); tacrolimus; sirolimus; cyclosporine; bexarotene; all‐trans retinoic acid; L‐asparaginase; interferon‐ |
The most common primary cause of HTG in adults is familial HTG, an autosomal dominant condition with a population prevalence ranging from 1%2% to 5%10% and age‐dependent penetrance.5, 6 Other genetic causes are much rarer, such as LPL deficiency (1 in 1 million patients), apolipoprotein‐CII, and other mutations resulting in impaired binding to LPL.79 Primary causes of HTG are often listed as Fredrickson phenotypes (Table 1). Recent genome‐wide association studies reveal a complex polygenic basis to the Fredrickson categories and suggest additional undefined genes or nongenetic factors may significantly contribute to the final phenotype.10 Diagnosis of familial lipid disorders requires an accurate family history that may be difficult to obtain.
Secondary causes of HTG can be categorized using a four‐D mnemonic: Diseases, Diet, Disorder of Metabolism, and Drugs.11 The most common condition associated with HTG is obesity.6 The mechanism between obesity and HTG is complex and likely involves an increase in fatty acid flux from adipose tissue to other tissues and insulin resistance.12 Asking whether a patient's current weight is close to the heaviest lifetime weight is a clue to diagnosing obesity‐driven HTG. One case series of hypertriglyceridemic pancreatitis found that diabetes or excessive alcohol intake account for the majority of secondary causes of HTG.13 The cause of HTG among patients with diabetes is multifactorial: insulin deficiency reduces LPL levels (insulin is required for synthesis of LPL), whereas insulin resistance attenuates the ability of insulin to decrease hepatic cholesterol synthesis and thus increases hepatic secretion of VLDL.14 Alcohol impairs lipolysis and increases VLDL production that can lead to severe HTG, particularly in those patients with an underlying functional deficiency in LPL. Other secondary etiologies of severe HTG may be elicited through careful attention to medical and medication history.
CLINICAL ASSESSMENT
Table 2 proposes a reasonable initial assessment of the history and physical and laboratory tests in patients with severe HTG.
|
| History |
| Family history of lipid disorders |
| Maximal weight and when achieved |
| Detailed medication history (including those recently stopped) |
| Alcohol consumption |
| Diabetes mellitus |
| Possible physical examination findings |
| Eruptive xanthomas |
| Lipemia retinalis |
| Hepatomegaly |
| Lymphadenopathy |
| Laboratory tests |
| Basic Metabolic Panel* with glucose |
| Lipid panel |
| Thyroid‐stimulating hormone, free T4 |
| Liver function, amylase, lipase |
| Hemoglobin A1c |
| Urinalysis |
Distinguishing physical examination findings may arise when serum TG levels exceed 1000 mg/dL. Eruptive xanthoma form when large amounts of TG are sequestered in cutaneous histiocytes, resulting in small yellow‐orange papules with an erythematous base. This finding is seen in a minority of HTG patients and may be missed altogether without a careful examination of the extensor surfaces of arms, legs, back, and buttocks.15 Effective TG‐lowering treatment will result in resolution of these xanthomas. An ophthalmologic examination may reveal lipemia retinalis, a condition that occurs when retinal vessels appear white from lipemic serum and contrast against a pale salmon‐colored retina. Although a dramatic finding, these changes do not result in vision impairment. Hepatomegaly from fatty infiltration of the liver occurs frequently,16 and diffuse lymphadenopathy may also be found.17
Laboratory tests are also essential in the clinical assessment of severe HTG. Important tests include thyroid‐stimulating hormone, creatinine, serum urea nitrogen, and a urinalysis. A hemoglobin A1c test provides information on the level of glycemic control and is now recognized by the American Diabetes Association to diagnose diabetes mellitus.18 Liver function tests commonly reveal a transaminase elevation from underlying steatohepatitis and also provide a baseline value prior to initiating any lipid‐lowering medications. Additional diagnostic tests may be useful in selected patients: HIV testing, serum protein electrophoresis, and urine protein electrophoresis to help diagnose paraproteinemias such as multiple myeloma, and an antinuclear antibody and double‐stranded DNA for systemic lupus erythematosus.
Severe HTG may interfere with the result of 2 commonly obtained laboratory tests. The sodium concentration can be falsely low (pseudohyponatremia) due to the high levels of TG displacing sodium containing water from the plasma.19 Due to interference by plasma lipids, amylase levels may be near normal in up to 50% of patients with hypertriglyceridemic pancreatitis at the time of admission.20 Thus, if the suspicion for pancreatitis is high, it is reasonable to proceed to imaging if amylase or lipase levels are not confirmatory. Abdominal imaging with computed tomography or magnetic resonance imaging may be used to diagnose acute pancreatitis.
Behind excessive alcohol consumption and gallstone disease, HTG is the third leading cause of pancreatitis, accounting for up to 10% of cases in the general population.21 The exact mechanism by which HTG causes pancreatitis is unclear. One theory is that elevated plasma TG levels are hydrolyzed in the pancreas to cause an increase in local free fatty acids, which in turn may cause inflammation and overt pancreatitis.22 Another theory proposes that elevated levels of chylomicrons lead to plasma hyperviscosity, which causes ischemia and local acidosis in pancreatic capillaries.23 Whatever the cause, it is unclear why only some patients with severe HTG develop acute pancreatitis. One study of 129 patients with severe HTG found mean serum TG levels to be higher in patients with acute pancreatitis than in those without (4470 versus 2450 mg/dL), suggesting the threshold to develop acute pancreatitis is higher than previously thought.24 Without a firm TG threshold above which patients develop pancreatitis, the decision to hospitalize can be difficult.
WHEN TO HOSPITALIZE?
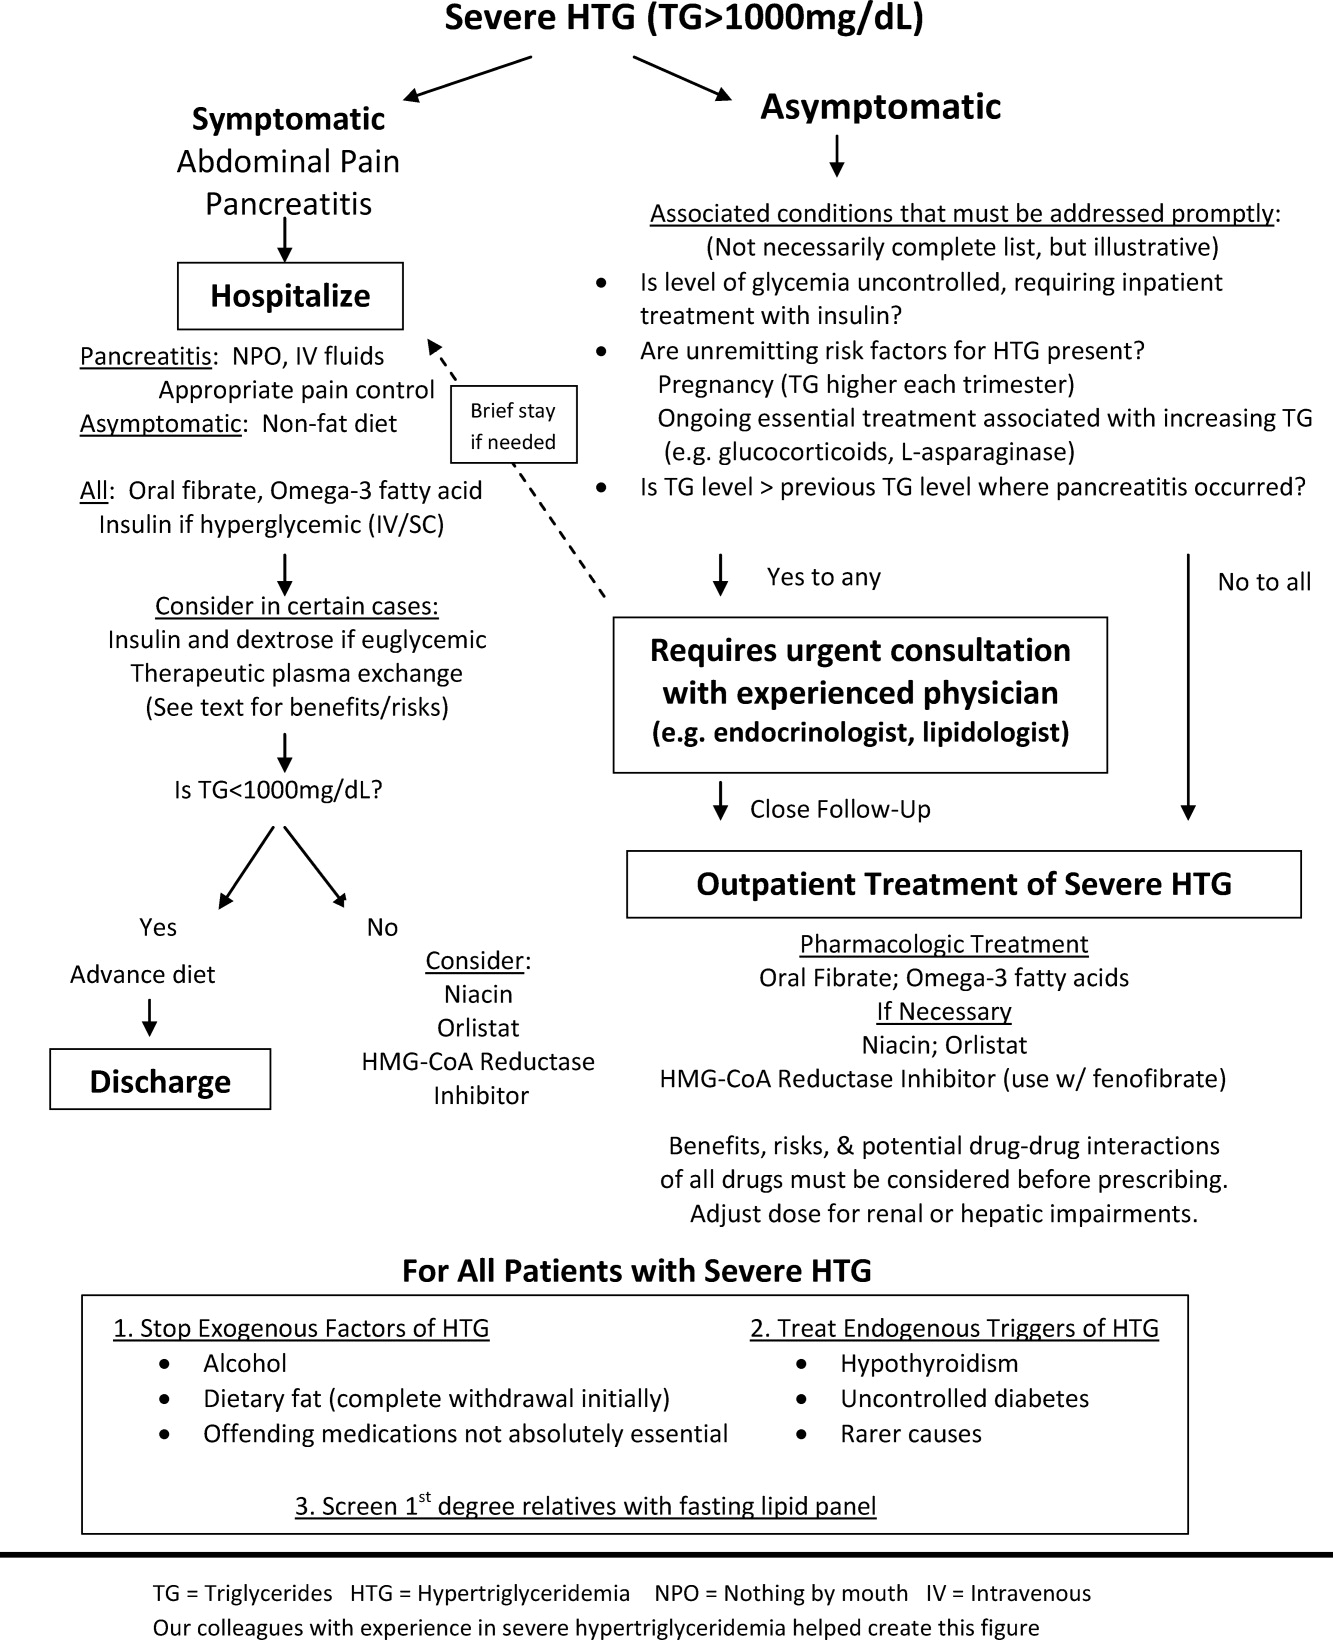
The choice of whether to hospitalize a patient with severe HTG is first based on the presence or absence of abdominal pain and/or acute pancreatitis. Figure 1 diagrams a suggested admission and treatment algorithm. If abdominal pain is present, the patient should be hospitalized and assessed for possible triggers with prompt initiation of pharmacologic treatment. In the absence of abdominal pain, the decision to admit the patient with severe HTG requires clinical judgment. In these cases, prompt consultation with a physician experienced in the management of lipid disorders is recommended. In our experience, admission is usually driven by factors such as (1) severe hyperglycemia requiring inpatient insulin therapy; (2) severe HTG at or near a level where pancreatitis has occurred in the past in a patient for whom adherence is suspect (mindful of the great variability at the levels where patients develop pancreatitis); (3) unremitting triggers of severe HTG such as ongoing use of essential medications also known to exacerbate HTG (such as some forms of chemotherapy) or pregnancy in the third trimester. TG levels rise continuously throughout pregnancy and peak during the third trimester, when hypertriglyceridemic pancreatitis most often occurs. Asymptomatic patients with severe HTG not requiring hospitalization need close outpatient follow‐up to prevent the onset of chylomicronemia syndrome.
INPATIENT MANAGEMENT
No professional recommendations exist regarding a standardized treatment plan for severe HTG. The treatment regimen is first based on the presence or absence of symptoms. Treatment of hypertriglyceridemic pancreatitis should target a serum TG level 1000 mg/dL and resolution of abdominal pain. The initial goal for asymptomatic patients is a TG level 1000 mg/dL, as this level represents a significant reduction in the risk of developing chylomicronemia syndrome. In either case, the first 2 components of the treatment regimen are dietary changes and oral medications.
Dietary Changes
Patients with hypertriglyceridemic pancreatitis should be made NPO, with the exception of necessary medications taken only with water to provide bowel rest and eliminate fat intake. As chylomicron production in the intestine falls, TG levels will fall dramatically within 12 days of NPO status regardless of other treatments. Once TG levels approach 1000 mg/dL and there is no residual abdominal pain, a no‐fat diet can be given. Patients with persistent abdominal pain requiring a prolonged fast (>57 days) may require nutrition through alternate means such as an enteral formula through a feeding tube or the use of TPN. If a feeding tube is required, we suggest beginning with an elemental, peptide‐based, fat‐free formula, with help from a nutrition consult to assist with individual tube‐feeding options.25 Enteral formula can be supplemented with medium‐chain triglyceride oils (found in coconut and palm kernel) to provide some additional nutritional support. MCTs do not raise serum TG levels, as they are absorbed directly into the portal vein for prompt oxidation by the liver, whereas long‐chain TGs are converted into chylomicrons for peripheral transport. One case report describes a dramatic therapeutic response to medium‐chain triglyceride oils in a patient with familial chylomicronemia,26 although we do not routinely recommend these oils as therapy given lack of long‐term safety data. Lastly, if TPN is required, it is crucial to avoid lipid emulsions to prevent a rise in serum TG levels.
Asymptomatic patients with severe HTG can be fed upon admission, but should be placed on a fat‐free diet. Fat is added back into the diet when TG levels fall below 1000 mg/dL and is slowly increased to a target fat content of 10% of the total calories, usually not exceeding 25 g/day.
Oral Medications
Oral medications should be initiated to lower TG levels for both symptomatic and asymptomatic patients. Table 3 lists the different classes of medications. In our experience, oral fibrates are a recommended first‐line treatment, with other agents used as adjunctive therapy. Through complex mechanisms, fibrates reduce hepatic VLDL secretion and increase serum lipolysis of TG.27 In patients who do not have diabetes and are at low risk for coronary heart disease (CHD), either gemfibrozil or fenofibrate may be used to lower serum TG levels. However, in patients with diabetes, CHD, or a CHD risk equivalent, use of fenofibrate is preferred as an HMG‐CoA reductase inhibitor (a statin) and will almost always be necessary to reach low‐density lipoprotein (LDL)‐cholesterol goals. Fenofibrate, unlike gemfibrozil, does not interfere with the glucuronidation of statins by the liver.28
| Drug | Usual Dose | TG Reduction | Cautions or Contraindications | Comments |
|---|---|---|---|---|
| ||||
| Fenofibrate | 130200 mg/day | 50% | Hepatic or renal insufficiency | Best fibrate to use with HMG‐CoA reductase Inhibitors |
| Gemfibrozil | 600 mg BID | 50% | Hepatic or renal insufficiency | Avoid combination with statins |
| HMG‐CoA reductase inhibitors or statins | Variable; the more potent LDL lowering, the more TG lowering | 25% | Decompensated cirrhosis; end‐stage renal disease | Not the primary treatment for patients with TG levels >1000 mg/dL; some statins such as atorvastatin and fluvastatin are favored for patients with renal insufficiency due to less renal excretion than other statins |
| Omega‐3 fatty acids | 2 g BID Lovaza (840 mg DHA/EPA per dose) | 25%50% with monotherapy (the higher the TG level, the greater the reduction); 30% with combination therapy | Allergy to fish | Fishy aftertaste; may cause flatulence; may increase serum glucose and LDL; low risk of clinical bleeding |
| Nicotinic acid | 12 g/day ER; up‐titrate from lowest dose | 15%35% | Active liver disease; active peptic ulcer disease; arterial bleeding | Can increase blood sugar levels by increasing insulin resistance |
| Orlistat (Xenical) | 120 mg TID | 15%35% | Cases of serious liver dysfunction have been reported | Can interfere with drug absorption, especially fat‐soluble vitamins; oily rectal discharge |
| Insulin | IV 0.10.3 U/kg/hr; titrate to serum glucose 140180 mg/dL OR basal/bolus subcutaneously | Variable; >50% in some cases | Hypoglycemia | Useful in patients who have diabetes |
If a fibrate fails to achieve an acceptable serum TG level, we recommend adjunctive therapy with omega‐3 fatty acid esters. Omega‐3 fatty acids lower serum TG levels by decreasing VLDL production and can lower TG levels by as much as 45% in cases of severe HTG.29 This medication is typically the first adjunctive medication chosen due to its low side effect profile.
If additional TG lowering is needed, niacin or nicotinic acid (vitamin B3) may be added next. This medication decreases VLDL production, lowers LDL, and increases high‐density lipoprotein, but invariably with initiation, patients exhibit prominent skin flushing, burning, or itching. This prostaglandin‐mediated effect may be prevented or at least reduced in severity by taking 325 mg aspirin 1 hour before niacin administration. If the TG level is still not at goal, orlistat, a lipase or fat blocker, may be useful.30 Orlistat improves postprandial lipemia through reduction of dietary fat absorption. Finally, although potent statins such as atorvastatin and rosuvastatin can lower TGs derived from VLDL substantially,31 their use should be prompted by the patient's risk for atherosclerotic cardiovascular disease. Because all of the hypotriglyceridemic medications can affect the liver, regular liver function testing is prudent, as is a periodic re‐evaluation of the ongoing need for these medications. Statin use causing mild transaminase elevation (up to 3 times the upper limit of normal) may be safely tolerated.32
Additional Inpatient Management
Insulin
Insulin increases lipoprotein lipase activity, thereby accelerating chylomicron degradation.33 Insulin (along with glucose if necessary to maintain euglycemia) is therefore a useful adjunctive TG‐lowering medication to oral medications, even in nondiabetic patients. Insulin administered intravenously should follow a titration protocol with hourly monitoring of blood glucose. The goal of the insulin protocol with severe HTG is not maintaining strict euglycemia but rather maintenance of LPL activation by exogenous insulin with avoidance of hypoglycemia. In hospitals where an insulin infusion protocol for diabetic ketoacidosis or postsurgical hyperglycemia already exists, the protocol can be applied for HTG management with minor modifications: introduce dextrose‐containing fluids at higher blood glucoses (180 mg/dL or less) and eliminate insulin boluses. A suggested dose is a continuous intravenous insulin drip at 0.10.3 U/kg/hr with glucose to maintain blood glucose levels between 140 and 180 mg/dL, although there are no guidelines from professional societies. Subcutaneous insulin has also been used to successfully lower TG levels.34, 35 The major limitation of subcutaneous administration is the inability to rapidly adjust the dosing when needed, which is particularly concerning when treating patients who do not have diabetes. We prefer to use subcutaneous basal insulin in patients requiring long‐term use of insulin after a significant TG reduction with intravenous insulin. Subcutaneous bolus prandial insulin should not be used until the patient has resumed a solid diet, because a liquid diet may not reliably contain enough carbohydrates for bolus therapy.
Intravenous Heparin
Heparin has been used in case reports as adjunctive treatment for hypertriglyceridemic pancreatitis.36, 37 Although heparin may increase circulating LPL levels, this effect is short‐lived and is quickly followed by increased hepatic LPL degradation.38 Therefore, the use of heparin to treat severe HTG cannot be routinely recommended.
Therapeutic Plasma Exchange
First used in 1978, therapeutic plasma exchange (TPE) has been demonstrated to quickly and dramatically lower serum TG levels.39 Since its first use, TPE has been used in several small case studies.4042 Without data from larger studies, the optimal frequency and duration of TPE remains unclear. One review suggests the use of TPE as first‐line therapy provided the patient is euglycemic, apheresis can be started within 48 hours of diagnosis, and the patient can tolerate the central venous access.43 On the other hand, guidelines from the American Society of Apheresis incorporating low‐quality evidence do not recommend TPE as routine first‐ or second‐line treatment for hypertriglyceridemic pancreatitis, but rather suggest the use of TPE on a case‐by‐case basis.44 When TPE is needed, this society recommends daily treatment for 13 days until an adequate postapheresis TG level is obtained. Although TPE rapidly lowers TG levels, it is also aggressive (requires placement of a pheresis catheter), expensive, and may not be readily available. We believe it remains an option for patients with severe HTG who do not respond readily to fat restriction, glycemic control with insulin, and pharmacologic treatment with a fibrate and omega‐3 fatty acids. In our judgment, routine use of TPE cannot be recommended without data from a randomized clinical trial examining the value of immediate lowering of TG levels with TPE versus the usually prompt fall in TG levels with less aggressive measures.
Discharge Planning
Typically, asymptomatic patients are discharged once their TG levels approach 1000 mg/dL. Patients recovering from hypertriglyceridemic pancreatitis may be discharged once they tolerate a no‐fat diet without recurrence of abdominal pain and without a significant TG increase above 1000 mg/dL.
Discharge Diet and Activity
At discharge, the diet should be high in fiber, fruits, vegetables, and lean protein, with fat intake restricted to approximately 10% of total calories. Insulin‐resistant patients and patients with diabetes should avoid sugar‐sweetened foods and drinks. Specifically, the daily amount of fructose intake should be no more than 50 mg to avoid a dose‐dependent increase in plasma TG levels compared with other sugars.4 At least 2 servings per week of marine foods naturally rich in omega‐3 fatty acids (fatty fish such as salmon or trout) are recommended. Nonmarine forms of omega‐3 fatty acids (walnuts, flaxseed), which have not demonstrated consistent reductions in TG, cannot be routinely recommended.4 In addition, alcohol consumption should be eliminated.
Once patients maintain a TG level near 500 mg/dL, we allow for dietary flexibility by slowly increasing the amount of dietary unsaturated fat. For patients with TG levels 500 mg/dL, Adult Treatment Panel III advocated restriction of daily dietary saturated fat levels to 7% and keeping the total fat level between 25% and 35%.2 A range in total fat was provided so that unsaturated fat could be increased to limit dietary carbohydrates if glycemic control was needed. In addition to dietary changes, counseling patients about the importance of physical activity and weight loss is crucial for long‐term management of severe HTG. TG lowering in response to diet and weight loss varies, but typically approximates 25%.45
Outpatient Medications
Patients without significant contraindications should be discharged on a fibrate and omega‐3 fatty acids. As mentioned, niacin, orlistat, and/or a statin may be used as adjunctive therapy. Despite use of these hypotriglyceridemic medications, secondary causes of HTG should be modified (such as removal of aggravating medications or appropriately treating uncontrolled diabetes) to yield lasting improvements in TG levels.
CONCLUSIONS
As the prevalence of obesity and diabetes continues to rise, so too does the clinical importance of proper management of severe HTG. Recognizing chylomicronemia syndromeone of the most dramatic consequences of lipid disordersand the underlying primary and secondary causes of HTG is required before starting treatment. Patients with severe HTG may require hospitalization for immediate reduction in TG levels and relief of abdominal pain, if present. Treatment involves modifying secondary causes, if possible, and eliminating dietary fat intake. Although use of medications such as an oral fibrate, omega‐3 fatty acids, and insulin are routine, the use of a more invasive procedure such as TPE should be considered on a case‐by‐case basis and may be limited by availability. Upon hospital discharge, careful follow‐up should promote lifestyle changes and medication adherence to prevent recurrence of severe HTG.
- ,,,.Pathophysiology of triglyceride‐rich lipoproteins in atherothrombosis: clinical aspects.Clin Cardiol.1999;22:II15–II20.
- Executive Summary of The Third Report of The National Cholesterol Education Program (NCEP) Expert Panel on Detection, Evaluation, and Treatment of High Blood Cholesterol In Adults (Adult Treatment Panel III).JAMA.2001;285:2486–2497.
- ,.Chylomicronemia syndrome. Interaction of genetic and acquired hypertriglyceridemia.Med Clin North Am.1982;66:455–468.
- ,,, et al.Triglycerides and cardiovascular disease: a scientific statement from the American Heart Association.Circulation.2011;123:2292–2333.
- .Familial lipoprotein lipase deficiency and other causes of the chylomicronemia syndrome. In: Scriver C, Beaudet A, Sly W, Valle D, eds.The Metabolic and Molecular Basis of Inherited Disease.7th ed.New York:McGraw‐Hill;1995:1913–1932.
- ,,.Hypertriglyceridemia: its etiology, effects and treatment.CMAJ.2007;176:1113–1120.
- ,,, et al.Chylomicronemia with a mutant GPIHBP1 (Q115P) that cannot bind lipoprotein lipase.Arterioscler Thromb Vasc Biol.2009;29:956–962.
- ,,, et al.A mutation in the human lipoprotein lipase gene as the most common cause of familial chylomicronemia in French Canadians.N Engl J Med.1991;324:1761–1766.
- ,,, et al.Inherited apolipoprotein A‐V deficiency in severe hypertriglyceridemia.Arterioscler Thromb Vasc Biol.2005;25:411–417.
- ,,, et al.A polygenic basis for four classical Fredrickson hyperlipoproteinemia phenotypes that are characterized by hypertriglyceridemia.Hum Mol Genet.2009;18:4189–4194.
- .Secondary causes of hyperlipidemia.Med Clin North Am.1994;78:117–141.
- ,,.Hypertriglyceridemic hyperapob: the unappreciated atherogenic dyslipoproteinemia in type 2 diabetes mellitus.Ann Intern Med.2001;135:447–459.
- .Hyperlipidemic pancreatitis.Gastroenterol Clin North Am.1990;19:783–791.
- ,,, et al.Effects of insulin on cholesterol synthesis in type II diabetes patients.Diabetes Care.1995;18:1362–1369.
- ,,,.Evidence for the chylomicron origin of lipids accumulating in diabetic eruptive xanthomas: a correlative lipid biochemical, histochemical, and electron microscopic study.J Clin Invest.1970;49:2172–2187.
- .Dyslipidaemia.Lancet.2003;362:717–731.
- ,,.Lymphadenopathy associated with severe hypertriglyceridemia.JAMA.1990;264:727–728.
- Diagnosis and classification of diabetes mellitus.Diabetes Care.2010;33(suppl 1):S62–S69.
- ,.Pseudohyponatremia in acute hyperlipemic pancreatitis. A potential pitfall in therapy.Arch Surg.1985;120:1053–1055.
- ,,.Suppression of amylase activity by hypertriglyceridemia.JAMA.1973;225:1331–1334.
- ,,,.Dyslipidaemic pancreatitis clinical assessment and analysis of disease severity and outcomes.Pancreatology.2009;9:252–257.
- .Pathogenesis, differentiation and management of hypertriglyceridemia.Adv Intern Med.1969;15:117–154.
- ,.Role of hypertriglyceridemia in the pathogenesis of experimental acute pancreatitis in rats.Int J Pancreatol.1996;20:177–184.
- ,,, et al.Acute pancreatitis in a cohort of 129 patients referred for severe hypertriglyceridemia.Pancreas.2008;37:13–12.
- ,,, et al.ESPEN Guidelines on Enteral Nutrition: pancreas.Clin Nutr.2006;25:275–284.
- ,,, et al.Therapeutic response to medium‐chain triglycerides and omega‐3 fatty acids in a patient with the familial chylomicronemia syndrome.Arterioscler Thromb Vasc Biol.1997;17:1400–1406.
- ,,,,,.Mechanism of action of fibrates on lipid and lipoprotein metabolism.Circulation.1998;98:2088–2093.
- ,,.Drug interactions with lipid‐lowering drugs: mechanisms and clinical relevance.Clin Pharmacol Ther.2006;80:565–81.
- ,,, et al.Safety and efficacy of Omacor in severe hypertriglyceridemia.J Cardiovasc Risk.1997;4:385–391.
- ,,.Usefulness of Orlistat in the treatment of severe hypertriglyceridemia.Am J Cardiol.2002;89:229–231.
- ,,, et al.Effects of intensive atorvastatin and rosuvastatin treatment on apolipoprotein B‐48 and remnant lipoprotein cholesterol levels.Atherosclerosis.2009;205:197–201.
- ,,,.Final conclusions and recommendations of the National Lipid Association Statin Safety Assessment Task Force.Am J Cardiol.2006;97:89C–94C.
- .Lipoprotein lipase. A multifunctional enzyme relevant to common metabolic diseases.N Engl J Med.1989;320:1060–1068.
- ,,.Insulin therapy for a non‐diabetic patient with severe hypertriglyceridemia.J Am Coll Nutr.1998;17:458–461.
- ,,,,.Treatment of severe hypertriglyceridemia in nondiabetic patients with insulin.Am J Emerg Med.2005;23:415–417.
- ,.Decreasing the plasma triglyceride level in hypertriglyceridemia‐induced pancreatitis in pregnancy: a case report.Am J Obstet Gynecol.2002;187:241–242.
- ,,,,,.Pancreatitis may occur with a normal amylase concentration in hypertriglyceridaemia.BMJ.1996;313:1265.
- ,,,.Lipoprotein lipase during continuous heparin infusion: tissue stores become partially depleted.J Lab Clin Med.2001;138:206–13.
- ,,,,,.Treatment of severe diabetic hypertriglyceridaemia by plasma exchange.Lancet.1978;1:1368.
- ,,,.Therapeutic plasma exchange in patients with hyperlipidemic pancreatitis.World J Gastroenterol.2004;10:2272–2274.
- ,,.Plasma exchange in severe hypertriglyceridemia a clinical study.Transfus Apher Sci.2006;34:253–257.
- ,,, et al.Management of acute severe hyperlipidemic pancreatitis.Digestion.2006;73:259–264.
- ,,,,.Hypertriglyceridemic pancreatitis: presentation and management.Am J Gastroenterol.2009;104:984–991.
- ,,, et al.Guidelines on the use of therapeutic apheresis in clinical practice—evidence‐based approach from the Apheresis Applications Committee of the American Society for Apheresis.J Clin Apher.2010;25:83–177.
- ,,,,,.Effects of a low‐fat diet compared with those of a high‐monounsaturated fat diet on body weight, plasma lipids and lipoproteins, and glycemic control in type 2 diabetes.Am J Clin Nutr.2004;80:668–673.
The patient with a markedly high serum triglyceride (TG) level poses an interesting challenge for hospitalists. Hypertriglyceridemia (HTG) is defined as a fasting plasma TG level that is above the 95th percentile for age and sex.1 TG levels are commonly classified into categories according to Adult Treatment Panel III guidelines with desirable levels 150 mg/dL (1.7 mmol/L), borderline levels 150199, high levels 200499 mg/dL, and very high levels >500 mg/dL (5.6 mmol/L).2 A TG level exceeding an arbitrary threshold of >1000 mg/dL (11.3 mmol/L) is referred to as severe HTG. The Lipid Research Clinics Program Prevalence Study found that 1.79 per 10,000 outpatients (0.02%) had TG levels > 2000 mg/dL.3 Chylomicronemia syndrome occurs when severe HTG is accompanied by 1 or more of the following: symptoms of abdominal pain or acute pancreatitis or physical examination findings such as eruptive xanthomas or lipemia retinalis. There is no TG level above which pancreatitis invariably occurs, making the decision to hospitalize difficult. The goal of this review is to discuss the causes of severe HTG; the clinical assessment, including criteria for hospitalization; and the available treatment options for this infrequent but serious condition. We begin with a clinical case of severe HTG.
CASE PRESENTATION
A 47‐year‐old woman with a history of chronic myelogenous leukemia was admitted to the hospital with a serum triglyceride level of 17,393 mg/dL. Two years prior to admission, she underwent allogenic stem cell transplantation for chronic myelogenous leukemia and has since remained in remission. Six months prior to admission, severe diarrhea from intestinal graft‐versus‐host disease required the use of total parenteral nutrition (TPN) and immunosuppressive therapy consisting of prednisone 20 mg/day, mycophenolate mofetil 250 mg thrice daily, and sirolimus 0.3 mg/day. During treatment with steroids, she developed diabetes mellitus requiring insulin, with a subsequent hemoglobin A1c level of 7.7% (normal, 7%). The serum TG level prior to transplantation was unknown but was 343 mg/dL prior to TPN initiation. One month prior to admission, the diarrhea resolved and TPN was stopped. The TG level was 7463 mg/dL 1 week prior to admission, and despite use of fenofibrate, it rose to 17,393 mg/dL. The patient denied abdominal pain, and did not have abdominal tenderness or eruptive xanthomas. She denied a family history of dyslipidemia or recent medication changes. Given the extreme TG elevation, the lack of response to outpatient treatment and the concern for developing acute pancreatitis, the patient was admitted to the hospital for inpatient TG‐lowering treatment.
Upon admission, serum lipase and amylase were within normal limits, but the blood glucose level was 243 mg/dL. Insulin infusion and oral fenofibrate 145 mg/day was started, and the patient was kept non per os (NPO). Six hours later, despite insulin infusion, the TG level rose to 26,250 mg/dL. Therapeutic plasma exchange (TPE) was performed on 2 consecutive days with a resultant decrease in TG level to 530 mg/dL. The patient was later discharged home on fenofibrate and omega‐3 ethyl esters, her same immunosuppressive and insulin regimen, and instructions for a very low‐fat diet. In the next 3 months, her serum TG level did not rise above 530 mg/dL. The cause of our patient's extreme TG elevation was likely a combination of genetic factors exacerbated by immunosuppressive and glucocorticoid therapy.
This case featured dramatic elevations in serum TG levels that the managing doctors believed merited a hospital admission. Management of patients with severe HTG first requires an understanding of TG metabolism.
ETIOLOGY
Serum TGs produced by the liver are carried by very low‐density lipoproteins (VLDLs), whereas TGs derived from dietary fat are carried by chylomicrons. Both chylomicrons and VLDLs are hydrolyzed by the same enzymelipoprotein lipase (LPL). TGs are hydrolyzed into fatty acids for uptake by muscle and adipose tissue, whereas remnants of VLDL and chylomicrons are removed by the liver. More details on TG pathophysiology may be found in a recent review.4 When LPL is saturated with VLDL, ingestion of a fatty meal may cause chylomicrons to linger in circulation for days instead of hours. Asking the laboratory to spin down the blood of a patient with severe HTG and keep the test tube upright at 4C may reveal a large creamy supernatant layer demonstrating chylomicronemia.
A fasting TG level drawn 12 hours after the last meal reflects hepatic TG production. Although a nonfasting TG level may reflect postprandial chylomicrons, values above 1000 mg/dL strongly suggest true HTG, particularly in the setting of acute pancreatitis. Treatment should not be delayed to obtain a fasting TG level.
HTG may result from increased VLDL production, reduced VLDL/chylomicron clearance, or more likely a combination of the two. The causes of these metabolic derangements are classified as primary (genetic) or secondary (acquired) (Table 1). In adult patients, HTG is usually the result of a combination of primary and secondary causes. A study of 123 patients with TG levels >2000 mg/dL found that all patients had a primary metabolic defect and 110/123 had a coexistent secondary cause.3 An underlying genetic lipoprotein metabolism derangement is often clinically silent until coupled with a secondary cause of HTG that together raise TG levels high enough to cause the chylomicronemia syndrome.
|
| Primary |
| Familial lipid disorders |
| Lipoprotein pattern type I |
| Familial chylomicronemia |
| Deficiency in LPL and/or apo‐CII |
| Autosomal recessive; presents in childhood |
| Rare functional disorders in LPL |
| Lipoprotein pattern type III |
| Familial dysbetalipoproteinemia |
| Inadequate VLDL clearance from apo‐E2 |
| Autosomal recessive; presents in adulthood |
| Lipoprotein pattern type IV |
| Familial HTG: increased VLDL |
| Autosomal dominant; presents in adulthood |
| Familial combined hyperlipidemia |
| Multiple phenotypes seen; increased apo‐B levels |
| Lipoprotein pattern type V |
| Mixed HTG: increased VLDL and chylomicrons; presents in adulthood |
| Secondary |
| Disease |
| Poorly controlled diabetes mellitus; hypothyroid; SLE; Cushing syndrome; HIV infection; sarcoid multiple myeloma; obesity; renal disease (nephrotic) |
| Disorder of metabolism |
| Pregnancy |
| Diet |
| Excessive alcohol, especially with high‐fat diet |
| Drugs |
| Estrogen; tamoxifen; glucocorticoids; protease inhibitors; nonselective beta‐blockers; propofol; isotretinoin; some antipsychotic medications (clozapine, olanzapine); tacrolimus; sirolimus; cyclosporine; bexarotene; all‐trans retinoic acid; L‐asparaginase; interferon‐ |
The most common primary cause of HTG in adults is familial HTG, an autosomal dominant condition with a population prevalence ranging from 1%2% to 5%10% and age‐dependent penetrance.5, 6 Other genetic causes are much rarer, such as LPL deficiency (1 in 1 million patients), apolipoprotein‐CII, and other mutations resulting in impaired binding to LPL.79 Primary causes of HTG are often listed as Fredrickson phenotypes (Table 1). Recent genome‐wide association studies reveal a complex polygenic basis to the Fredrickson categories and suggest additional undefined genes or nongenetic factors may significantly contribute to the final phenotype.10 Diagnosis of familial lipid disorders requires an accurate family history that may be difficult to obtain.
Secondary causes of HTG can be categorized using a four‐D mnemonic: Diseases, Diet, Disorder of Metabolism, and Drugs.11 The most common condition associated with HTG is obesity.6 The mechanism between obesity and HTG is complex and likely involves an increase in fatty acid flux from adipose tissue to other tissues and insulin resistance.12 Asking whether a patient's current weight is close to the heaviest lifetime weight is a clue to diagnosing obesity‐driven HTG. One case series of hypertriglyceridemic pancreatitis found that diabetes or excessive alcohol intake account for the majority of secondary causes of HTG.13 The cause of HTG among patients with diabetes is multifactorial: insulin deficiency reduces LPL levels (insulin is required for synthesis of LPL), whereas insulin resistance attenuates the ability of insulin to decrease hepatic cholesterol synthesis and thus increases hepatic secretion of VLDL.14 Alcohol impairs lipolysis and increases VLDL production that can lead to severe HTG, particularly in those patients with an underlying functional deficiency in LPL. Other secondary etiologies of severe HTG may be elicited through careful attention to medical and medication history.
CLINICAL ASSESSMENT
Table 2 proposes a reasonable initial assessment of the history and physical and laboratory tests in patients with severe HTG.
|
| History |
| Family history of lipid disorders |
| Maximal weight and when achieved |
| Detailed medication history (including those recently stopped) |
| Alcohol consumption |
| Diabetes mellitus |
| Possible physical examination findings |
| Eruptive xanthomas |
| Lipemia retinalis |
| Hepatomegaly |
| Lymphadenopathy |
| Laboratory tests |
| Basic Metabolic Panel* with glucose |
| Lipid panel |
| Thyroid‐stimulating hormone, free T4 |
| Liver function, amylase, lipase |
| Hemoglobin A1c |
| Urinalysis |
Distinguishing physical examination findings may arise when serum TG levels exceed 1000 mg/dL. Eruptive xanthoma form when large amounts of TG are sequestered in cutaneous histiocytes, resulting in small yellow‐orange papules with an erythematous base. This finding is seen in a minority of HTG patients and may be missed altogether without a careful examination of the extensor surfaces of arms, legs, back, and buttocks.15 Effective TG‐lowering treatment will result in resolution of these xanthomas. An ophthalmologic examination may reveal lipemia retinalis, a condition that occurs when retinal vessels appear white from lipemic serum and contrast against a pale salmon‐colored retina. Although a dramatic finding, these changes do not result in vision impairment. Hepatomegaly from fatty infiltration of the liver occurs frequently,16 and diffuse lymphadenopathy may also be found.17
Laboratory tests are also essential in the clinical assessment of severe HTG. Important tests include thyroid‐stimulating hormone, creatinine, serum urea nitrogen, and a urinalysis. A hemoglobin A1c test provides information on the level of glycemic control and is now recognized by the American Diabetes Association to diagnose diabetes mellitus.18 Liver function tests commonly reveal a transaminase elevation from underlying steatohepatitis and also provide a baseline value prior to initiating any lipid‐lowering medications. Additional diagnostic tests may be useful in selected patients: HIV testing, serum protein electrophoresis, and urine protein electrophoresis to help diagnose paraproteinemias such as multiple myeloma, and an antinuclear antibody and double‐stranded DNA for systemic lupus erythematosus.
Severe HTG may interfere with the result of 2 commonly obtained laboratory tests. The sodium concentration can be falsely low (pseudohyponatremia) due to the high levels of TG displacing sodium containing water from the plasma.19 Due to interference by plasma lipids, amylase levels may be near normal in up to 50% of patients with hypertriglyceridemic pancreatitis at the time of admission.20 Thus, if the suspicion for pancreatitis is high, it is reasonable to proceed to imaging if amylase or lipase levels are not confirmatory. Abdominal imaging with computed tomography or magnetic resonance imaging may be used to diagnose acute pancreatitis.
Behind excessive alcohol consumption and gallstone disease, HTG is the third leading cause of pancreatitis, accounting for up to 10% of cases in the general population.21 The exact mechanism by which HTG causes pancreatitis is unclear. One theory is that elevated plasma TG levels are hydrolyzed in the pancreas to cause an increase in local free fatty acids, which in turn may cause inflammation and overt pancreatitis.22 Another theory proposes that elevated levels of chylomicrons lead to plasma hyperviscosity, which causes ischemia and local acidosis in pancreatic capillaries.23 Whatever the cause, it is unclear why only some patients with severe HTG develop acute pancreatitis. One study of 129 patients with severe HTG found mean serum TG levels to be higher in patients with acute pancreatitis than in those without (4470 versus 2450 mg/dL), suggesting the threshold to develop acute pancreatitis is higher than previously thought.24 Without a firm TG threshold above which patients develop pancreatitis, the decision to hospitalize can be difficult.
WHEN TO HOSPITALIZE?
The choice of whether to hospitalize a patient with severe HTG is first based on the presence or absence of abdominal pain and/or acute pancreatitis. Figure 1 diagrams a suggested admission and treatment algorithm. If abdominal pain is present, the patient should be hospitalized and assessed for possible triggers with prompt initiation of pharmacologic treatment. In the absence of abdominal pain, the decision to admit the patient with severe HTG requires clinical judgment. In these cases, prompt consultation with a physician experienced in the management of lipid disorders is recommended. In our experience, admission is usually driven by factors such as (1) severe hyperglycemia requiring inpatient insulin therapy; (2) severe HTG at or near a level where pancreatitis has occurred in the past in a patient for whom adherence is suspect (mindful of the great variability at the levels where patients develop pancreatitis); (3) unremitting triggers of severe HTG such as ongoing use of essential medications also known to exacerbate HTG (such as some forms of chemotherapy) or pregnancy in the third trimester. TG levels rise continuously throughout pregnancy and peak during the third trimester, when hypertriglyceridemic pancreatitis most often occurs. Asymptomatic patients with severe HTG not requiring hospitalization need close outpatient follow‐up to prevent the onset of chylomicronemia syndrome.
INPATIENT MANAGEMENT
No professional recommendations exist regarding a standardized treatment plan for severe HTG. The treatment regimen is first based on the presence or absence of symptoms. Treatment of hypertriglyceridemic pancreatitis should target a serum TG level 1000 mg/dL and resolution of abdominal pain. The initial goal for asymptomatic patients is a TG level 1000 mg/dL, as this level represents a significant reduction in the risk of developing chylomicronemia syndrome. In either case, the first 2 components of the treatment regimen are dietary changes and oral medications.
Dietary Changes
Patients with hypertriglyceridemic pancreatitis should be made NPO, with the exception of necessary medications taken only with water to provide bowel rest and eliminate fat intake. As chylomicron production in the intestine falls, TG levels will fall dramatically within 12 days of NPO status regardless of other treatments. Once TG levels approach 1000 mg/dL and there is no residual abdominal pain, a no‐fat diet can be given. Patients with persistent abdominal pain requiring a prolonged fast (>57 days) may require nutrition through alternate means such as an enteral formula through a feeding tube or the use of TPN. If a feeding tube is required, we suggest beginning with an elemental, peptide‐based, fat‐free formula, with help from a nutrition consult to assist with individual tube‐feeding options.25 Enteral formula can be supplemented with medium‐chain triglyceride oils (found in coconut and palm kernel) to provide some additional nutritional support. MCTs do not raise serum TG levels, as they are absorbed directly into the portal vein for prompt oxidation by the liver, whereas long‐chain TGs are converted into chylomicrons for peripheral transport. One case report describes a dramatic therapeutic response to medium‐chain triglyceride oils in a patient with familial chylomicronemia,26 although we do not routinely recommend these oils as therapy given lack of long‐term safety data. Lastly, if TPN is required, it is crucial to avoid lipid emulsions to prevent a rise in serum TG levels.
Asymptomatic patients with severe HTG can be fed upon admission, but should be placed on a fat‐free diet. Fat is added back into the diet when TG levels fall below 1000 mg/dL and is slowly increased to a target fat content of 10% of the total calories, usually not exceeding 25 g/day.
Oral Medications
Oral medications should be initiated to lower TG levels for both symptomatic and asymptomatic patients. Table 3 lists the different classes of medications. In our experience, oral fibrates are a recommended first‐line treatment, with other agents used as adjunctive therapy. Through complex mechanisms, fibrates reduce hepatic VLDL secretion and increase serum lipolysis of TG.27 In patients who do not have diabetes and are at low risk for coronary heart disease (CHD), either gemfibrozil or fenofibrate may be used to lower serum TG levels. However, in patients with diabetes, CHD, or a CHD risk equivalent, use of fenofibrate is preferred as an HMG‐CoA reductase inhibitor (a statin) and will almost always be necessary to reach low‐density lipoprotein (LDL)‐cholesterol goals. Fenofibrate, unlike gemfibrozil, does not interfere with the glucuronidation of statins by the liver.28
| Drug | Usual Dose | TG Reduction | Cautions or Contraindications | Comments |
|---|---|---|---|---|
| ||||
| Fenofibrate | 130200 mg/day | 50% | Hepatic or renal insufficiency | Best fibrate to use with HMG‐CoA reductase Inhibitors |
| Gemfibrozil | 600 mg BID | 50% | Hepatic or renal insufficiency | Avoid combination with statins |
| HMG‐CoA reductase inhibitors or statins | Variable; the more potent LDL lowering, the more TG lowering | 25% | Decompensated cirrhosis; end‐stage renal disease | Not the primary treatment for patients with TG levels >1000 mg/dL; some statins such as atorvastatin and fluvastatin are favored for patients with renal insufficiency due to less renal excretion than other statins |
| Omega‐3 fatty acids | 2 g BID Lovaza (840 mg DHA/EPA per dose) | 25%50% with monotherapy (the higher the TG level, the greater the reduction); 30% with combination therapy | Allergy to fish | Fishy aftertaste; may cause flatulence; may increase serum glucose and LDL; low risk of clinical bleeding |
| Nicotinic acid | 12 g/day ER; up‐titrate from lowest dose | 15%35% | Active liver disease; active peptic ulcer disease; arterial bleeding | Can increase blood sugar levels by increasing insulin resistance |
| Orlistat (Xenical) | 120 mg TID | 15%35% | Cases of serious liver dysfunction have been reported | Can interfere with drug absorption, especially fat‐soluble vitamins; oily rectal discharge |
| Insulin | IV 0.10.3 U/kg/hr; titrate to serum glucose 140180 mg/dL OR basal/bolus subcutaneously | Variable; >50% in some cases | Hypoglycemia | Useful in patients who have diabetes |
If a fibrate fails to achieve an acceptable serum TG level, we recommend adjunctive therapy with omega‐3 fatty acid esters. Omega‐3 fatty acids lower serum TG levels by decreasing VLDL production and can lower TG levels by as much as 45% in cases of severe HTG.29 This medication is typically the first adjunctive medication chosen due to its low side effect profile.
If additional TG lowering is needed, niacin or nicotinic acid (vitamin B3) may be added next. This medication decreases VLDL production, lowers LDL, and increases high‐density lipoprotein, but invariably with initiation, patients exhibit prominent skin flushing, burning, or itching. This prostaglandin‐mediated effect may be prevented or at least reduced in severity by taking 325 mg aspirin 1 hour before niacin administration. If the TG level is still not at goal, orlistat, a lipase or fat blocker, may be useful.30 Orlistat improves postprandial lipemia through reduction of dietary fat absorption. Finally, although potent statins such as atorvastatin and rosuvastatin can lower TGs derived from VLDL substantially,31 their use should be prompted by the patient's risk for atherosclerotic cardiovascular disease. Because all of the hypotriglyceridemic medications can affect the liver, regular liver function testing is prudent, as is a periodic re‐evaluation of the ongoing need for these medications. Statin use causing mild transaminase elevation (up to 3 times the upper limit of normal) may be safely tolerated.32
Additional Inpatient Management
Insulin
Insulin increases lipoprotein lipase activity, thereby accelerating chylomicron degradation.33 Insulin (along with glucose if necessary to maintain euglycemia) is therefore a useful adjunctive TG‐lowering medication to oral medications, even in nondiabetic patients. Insulin administered intravenously should follow a titration protocol with hourly monitoring of blood glucose. The goal of the insulin protocol with severe HTG is not maintaining strict euglycemia but rather maintenance of LPL activation by exogenous insulin with avoidance of hypoglycemia. In hospitals where an insulin infusion protocol for diabetic ketoacidosis or postsurgical hyperglycemia already exists, the protocol can be applied for HTG management with minor modifications: introduce dextrose‐containing fluids at higher blood glucoses (180 mg/dL or less) and eliminate insulin boluses. A suggested dose is a continuous intravenous insulin drip at 0.10.3 U/kg/hr with glucose to maintain blood glucose levels between 140 and 180 mg/dL, although there are no guidelines from professional societies. Subcutaneous insulin has also been used to successfully lower TG levels.34, 35 The major limitation of subcutaneous administration is the inability to rapidly adjust the dosing when needed, which is particularly concerning when treating patients who do not have diabetes. We prefer to use subcutaneous basal insulin in patients requiring long‐term use of insulin after a significant TG reduction with intravenous insulin. Subcutaneous bolus prandial insulin should not be used until the patient has resumed a solid diet, because a liquid diet may not reliably contain enough carbohydrates for bolus therapy.
Intravenous Heparin
Heparin has been used in case reports as adjunctive treatment for hypertriglyceridemic pancreatitis.36, 37 Although heparin may increase circulating LPL levels, this effect is short‐lived and is quickly followed by increased hepatic LPL degradation.38 Therefore, the use of heparin to treat severe HTG cannot be routinely recommended.
Therapeutic Plasma Exchange
First used in 1978, therapeutic plasma exchange (TPE) has been demonstrated to quickly and dramatically lower serum TG levels.39 Since its first use, TPE has been used in several small case studies.4042 Without data from larger studies, the optimal frequency and duration of TPE remains unclear. One review suggests the use of TPE as first‐line therapy provided the patient is euglycemic, apheresis can be started within 48 hours of diagnosis, and the patient can tolerate the central venous access.43 On the other hand, guidelines from the American Society of Apheresis incorporating low‐quality evidence do not recommend TPE as routine first‐ or second‐line treatment for hypertriglyceridemic pancreatitis, but rather suggest the use of TPE on a case‐by‐case basis.44 When TPE is needed, this society recommends daily treatment for 13 days until an adequate postapheresis TG level is obtained. Although TPE rapidly lowers TG levels, it is also aggressive (requires placement of a pheresis catheter), expensive, and may not be readily available. We believe it remains an option for patients with severe HTG who do not respond readily to fat restriction, glycemic control with insulin, and pharmacologic treatment with a fibrate and omega‐3 fatty acids. In our judgment, routine use of TPE cannot be recommended without data from a randomized clinical trial examining the value of immediate lowering of TG levels with TPE versus the usually prompt fall in TG levels with less aggressive measures.
Discharge Planning
Typically, asymptomatic patients are discharged once their TG levels approach 1000 mg/dL. Patients recovering from hypertriglyceridemic pancreatitis may be discharged once they tolerate a no‐fat diet without recurrence of abdominal pain and without a significant TG increase above 1000 mg/dL.
Discharge Diet and Activity
At discharge, the diet should be high in fiber, fruits, vegetables, and lean protein, with fat intake restricted to approximately 10% of total calories. Insulin‐resistant patients and patients with diabetes should avoid sugar‐sweetened foods and drinks. Specifically, the daily amount of fructose intake should be no more than 50 mg to avoid a dose‐dependent increase in plasma TG levels compared with other sugars.4 At least 2 servings per week of marine foods naturally rich in omega‐3 fatty acids (fatty fish such as salmon or trout) are recommended. Nonmarine forms of omega‐3 fatty acids (walnuts, flaxseed), which have not demonstrated consistent reductions in TG, cannot be routinely recommended.4 In addition, alcohol consumption should be eliminated.
Once patients maintain a TG level near 500 mg/dL, we allow for dietary flexibility by slowly increasing the amount of dietary unsaturated fat. For patients with TG levels 500 mg/dL, Adult Treatment Panel III advocated restriction of daily dietary saturated fat levels to 7% and keeping the total fat level between 25% and 35%.2 A range in total fat was provided so that unsaturated fat could be increased to limit dietary carbohydrates if glycemic control was needed. In addition to dietary changes, counseling patients about the importance of physical activity and weight loss is crucial for long‐term management of severe HTG. TG lowering in response to diet and weight loss varies, but typically approximates 25%.45
Outpatient Medications
Patients without significant contraindications should be discharged on a fibrate and omega‐3 fatty acids. As mentioned, niacin, orlistat, and/or a statin may be used as adjunctive therapy. Despite use of these hypotriglyceridemic medications, secondary causes of HTG should be modified (such as removal of aggravating medications or appropriately treating uncontrolled diabetes) to yield lasting improvements in TG levels.
CONCLUSIONS
As the prevalence of obesity and diabetes continues to rise, so too does the clinical importance of proper management of severe HTG. Recognizing chylomicronemia syndromeone of the most dramatic consequences of lipid disordersand the underlying primary and secondary causes of HTG is required before starting treatment. Patients with severe HTG may require hospitalization for immediate reduction in TG levels and relief of abdominal pain, if present. Treatment involves modifying secondary causes, if possible, and eliminating dietary fat intake. Although use of medications such as an oral fibrate, omega‐3 fatty acids, and insulin are routine, the use of a more invasive procedure such as TPE should be considered on a case‐by‐case basis and may be limited by availability. Upon hospital discharge, careful follow‐up should promote lifestyle changes and medication adherence to prevent recurrence of severe HTG.
The patient with a markedly high serum triglyceride (TG) level poses an interesting challenge for hospitalists. Hypertriglyceridemia (HTG) is defined as a fasting plasma TG level that is above the 95th percentile for age and sex.1 TG levels are commonly classified into categories according to Adult Treatment Panel III guidelines with desirable levels 150 mg/dL (1.7 mmol/L), borderline levels 150199, high levels 200499 mg/dL, and very high levels >500 mg/dL (5.6 mmol/L).2 A TG level exceeding an arbitrary threshold of >1000 mg/dL (11.3 mmol/L) is referred to as severe HTG. The Lipid Research Clinics Program Prevalence Study found that 1.79 per 10,000 outpatients (0.02%) had TG levels > 2000 mg/dL.3 Chylomicronemia syndrome occurs when severe HTG is accompanied by 1 or more of the following: symptoms of abdominal pain or acute pancreatitis or physical examination findings such as eruptive xanthomas or lipemia retinalis. There is no TG level above which pancreatitis invariably occurs, making the decision to hospitalize difficult. The goal of this review is to discuss the causes of severe HTG; the clinical assessment, including criteria for hospitalization; and the available treatment options for this infrequent but serious condition. We begin with a clinical case of severe HTG.
CASE PRESENTATION
A 47‐year‐old woman with a history of chronic myelogenous leukemia was admitted to the hospital with a serum triglyceride level of 17,393 mg/dL. Two years prior to admission, she underwent allogenic stem cell transplantation for chronic myelogenous leukemia and has since remained in remission. Six months prior to admission, severe diarrhea from intestinal graft‐versus‐host disease required the use of total parenteral nutrition (TPN) and immunosuppressive therapy consisting of prednisone 20 mg/day, mycophenolate mofetil 250 mg thrice daily, and sirolimus 0.3 mg/day. During treatment with steroids, she developed diabetes mellitus requiring insulin, with a subsequent hemoglobin A1c level of 7.7% (normal, 7%). The serum TG level prior to transplantation was unknown but was 343 mg/dL prior to TPN initiation. One month prior to admission, the diarrhea resolved and TPN was stopped. The TG level was 7463 mg/dL 1 week prior to admission, and despite use of fenofibrate, it rose to 17,393 mg/dL. The patient denied abdominal pain, and did not have abdominal tenderness or eruptive xanthomas. She denied a family history of dyslipidemia or recent medication changes. Given the extreme TG elevation, the lack of response to outpatient treatment and the concern for developing acute pancreatitis, the patient was admitted to the hospital for inpatient TG‐lowering treatment.
Upon admission, serum lipase and amylase were within normal limits, but the blood glucose level was 243 mg/dL. Insulin infusion and oral fenofibrate 145 mg/day was started, and the patient was kept non per os (NPO). Six hours later, despite insulin infusion, the TG level rose to 26,250 mg/dL. Therapeutic plasma exchange (TPE) was performed on 2 consecutive days with a resultant decrease in TG level to 530 mg/dL. The patient was later discharged home on fenofibrate and omega‐3 ethyl esters, her same immunosuppressive and insulin regimen, and instructions for a very low‐fat diet. In the next 3 months, her serum TG level did not rise above 530 mg/dL. The cause of our patient's extreme TG elevation was likely a combination of genetic factors exacerbated by immunosuppressive and glucocorticoid therapy.
This case featured dramatic elevations in serum TG levels that the managing doctors believed merited a hospital admission. Management of patients with severe HTG first requires an understanding of TG metabolism.
ETIOLOGY
Serum TGs produced by the liver are carried by very low‐density lipoproteins (VLDLs), whereas TGs derived from dietary fat are carried by chylomicrons. Both chylomicrons and VLDLs are hydrolyzed by the same enzymelipoprotein lipase (LPL). TGs are hydrolyzed into fatty acids for uptake by muscle and adipose tissue, whereas remnants of VLDL and chylomicrons are removed by the liver. More details on TG pathophysiology may be found in a recent review.4 When LPL is saturated with VLDL, ingestion of a fatty meal may cause chylomicrons to linger in circulation for days instead of hours. Asking the laboratory to spin down the blood of a patient with severe HTG and keep the test tube upright at 4C may reveal a large creamy supernatant layer demonstrating chylomicronemia.
A fasting TG level drawn 12 hours after the last meal reflects hepatic TG production. Although a nonfasting TG level may reflect postprandial chylomicrons, values above 1000 mg/dL strongly suggest true HTG, particularly in the setting of acute pancreatitis. Treatment should not be delayed to obtain a fasting TG level.
HTG may result from increased VLDL production, reduced VLDL/chylomicron clearance, or more likely a combination of the two. The causes of these metabolic derangements are classified as primary (genetic) or secondary (acquired) (Table 1). In adult patients, HTG is usually the result of a combination of primary and secondary causes. A study of 123 patients with TG levels >2000 mg/dL found that all patients had a primary metabolic defect and 110/123 had a coexistent secondary cause.3 An underlying genetic lipoprotein metabolism derangement is often clinically silent until coupled with a secondary cause of HTG that together raise TG levels high enough to cause the chylomicronemia syndrome.
|
| Primary |
| Familial lipid disorders |
| Lipoprotein pattern type I |
| Familial chylomicronemia |
| Deficiency in LPL and/or apo‐CII |
| Autosomal recessive; presents in childhood |
| Rare functional disorders in LPL |
| Lipoprotein pattern type III |
| Familial dysbetalipoproteinemia |
| Inadequate VLDL clearance from apo‐E2 |
| Autosomal recessive; presents in adulthood |
| Lipoprotein pattern type IV |
| Familial HTG: increased VLDL |
| Autosomal dominant; presents in adulthood |
| Familial combined hyperlipidemia |
| Multiple phenotypes seen; increased apo‐B levels |
| Lipoprotein pattern type V |
| Mixed HTG: increased VLDL and chylomicrons; presents in adulthood |
| Secondary |
| Disease |
| Poorly controlled diabetes mellitus; hypothyroid; SLE; Cushing syndrome; HIV infection; sarcoid multiple myeloma; obesity; renal disease (nephrotic) |
| Disorder of metabolism |
| Pregnancy |
| Diet |
| Excessive alcohol, especially with high‐fat diet |
| Drugs |
| Estrogen; tamoxifen; glucocorticoids; protease inhibitors; nonselective beta‐blockers; propofol; isotretinoin; some antipsychotic medications (clozapine, olanzapine); tacrolimus; sirolimus; cyclosporine; bexarotene; all‐trans retinoic acid; L‐asparaginase; interferon‐ |
The most common primary cause of HTG in adults is familial HTG, an autosomal dominant condition with a population prevalence ranging from 1%2% to 5%10% and age‐dependent penetrance.5, 6 Other genetic causes are much rarer, such as LPL deficiency (1 in 1 million patients), apolipoprotein‐CII, and other mutations resulting in impaired binding to LPL.79 Primary causes of HTG are often listed as Fredrickson phenotypes (Table 1). Recent genome‐wide association studies reveal a complex polygenic basis to the Fredrickson categories and suggest additional undefined genes or nongenetic factors may significantly contribute to the final phenotype.10 Diagnosis of familial lipid disorders requires an accurate family history that may be difficult to obtain.
Secondary causes of HTG can be categorized using a four‐D mnemonic: Diseases, Diet, Disorder of Metabolism, and Drugs.11 The most common condition associated with HTG is obesity.6 The mechanism between obesity and HTG is complex and likely involves an increase in fatty acid flux from adipose tissue to other tissues and insulin resistance.12 Asking whether a patient's current weight is close to the heaviest lifetime weight is a clue to diagnosing obesity‐driven HTG. One case series of hypertriglyceridemic pancreatitis found that diabetes or excessive alcohol intake account for the majority of secondary causes of HTG.13 The cause of HTG among patients with diabetes is multifactorial: insulin deficiency reduces LPL levels (insulin is required for synthesis of LPL), whereas insulin resistance attenuates the ability of insulin to decrease hepatic cholesterol synthesis and thus increases hepatic secretion of VLDL.14 Alcohol impairs lipolysis and increases VLDL production that can lead to severe HTG, particularly in those patients with an underlying functional deficiency in LPL. Other secondary etiologies of severe HTG may be elicited through careful attention to medical and medication history.
CLINICAL ASSESSMENT
Table 2 proposes a reasonable initial assessment of the history and physical and laboratory tests in patients with severe HTG.
|
| History |
| Family history of lipid disorders |
| Maximal weight and when achieved |
| Detailed medication history (including those recently stopped) |
| Alcohol consumption |
| Diabetes mellitus |
| Possible physical examination findings |
| Eruptive xanthomas |
| Lipemia retinalis |
| Hepatomegaly |
| Lymphadenopathy |
| Laboratory tests |
| Basic Metabolic Panel* with glucose |
| Lipid panel |
| Thyroid‐stimulating hormone, free T4 |
| Liver function, amylase, lipase |
| Hemoglobin A1c |
| Urinalysis |
Distinguishing physical examination findings may arise when serum TG levels exceed 1000 mg/dL. Eruptive xanthoma form when large amounts of TG are sequestered in cutaneous histiocytes, resulting in small yellow‐orange papules with an erythematous base. This finding is seen in a minority of HTG patients and may be missed altogether without a careful examination of the extensor surfaces of arms, legs, back, and buttocks.15 Effective TG‐lowering treatment will result in resolution of these xanthomas. An ophthalmologic examination may reveal lipemia retinalis, a condition that occurs when retinal vessels appear white from lipemic serum and contrast against a pale salmon‐colored retina. Although a dramatic finding, these changes do not result in vision impairment. Hepatomegaly from fatty infiltration of the liver occurs frequently,16 and diffuse lymphadenopathy may also be found.17
Laboratory tests are also essential in the clinical assessment of severe HTG. Important tests include thyroid‐stimulating hormone, creatinine, serum urea nitrogen, and a urinalysis. A hemoglobin A1c test provides information on the level of glycemic control and is now recognized by the American Diabetes Association to diagnose diabetes mellitus.18 Liver function tests commonly reveal a transaminase elevation from underlying steatohepatitis and also provide a baseline value prior to initiating any lipid‐lowering medications. Additional diagnostic tests may be useful in selected patients: HIV testing, serum protein electrophoresis, and urine protein electrophoresis to help diagnose paraproteinemias such as multiple myeloma, and an antinuclear antibody and double‐stranded DNA for systemic lupus erythematosus.
Severe HTG may interfere with the result of 2 commonly obtained laboratory tests. The sodium concentration can be falsely low (pseudohyponatremia) due to the high levels of TG displacing sodium containing water from the plasma.19 Due to interference by plasma lipids, amylase levels may be near normal in up to 50% of patients with hypertriglyceridemic pancreatitis at the time of admission.20 Thus, if the suspicion for pancreatitis is high, it is reasonable to proceed to imaging if amylase or lipase levels are not confirmatory. Abdominal imaging with computed tomography or magnetic resonance imaging may be used to diagnose acute pancreatitis.
Behind excessive alcohol consumption and gallstone disease, HTG is the third leading cause of pancreatitis, accounting for up to 10% of cases in the general population.21 The exact mechanism by which HTG causes pancreatitis is unclear. One theory is that elevated plasma TG levels are hydrolyzed in the pancreas to cause an increase in local free fatty acids, which in turn may cause inflammation and overt pancreatitis.22 Another theory proposes that elevated levels of chylomicrons lead to plasma hyperviscosity, which causes ischemia and local acidosis in pancreatic capillaries.23 Whatever the cause, it is unclear why only some patients with severe HTG develop acute pancreatitis. One study of 129 patients with severe HTG found mean serum TG levels to be higher in patients with acute pancreatitis than in those without (4470 versus 2450 mg/dL), suggesting the threshold to develop acute pancreatitis is higher than previously thought.24 Without a firm TG threshold above which patients develop pancreatitis, the decision to hospitalize can be difficult.
WHEN TO HOSPITALIZE?
The choice of whether to hospitalize a patient with severe HTG is first based on the presence or absence of abdominal pain and/or acute pancreatitis. Figure 1 diagrams a suggested admission and treatment algorithm. If abdominal pain is present, the patient should be hospitalized and assessed for possible triggers with prompt initiation of pharmacologic treatment. In the absence of abdominal pain, the decision to admit the patient with severe HTG requires clinical judgment. In these cases, prompt consultation with a physician experienced in the management of lipid disorders is recommended. In our experience, admission is usually driven by factors such as (1) severe hyperglycemia requiring inpatient insulin therapy; (2) severe HTG at or near a level where pancreatitis has occurred in the past in a patient for whom adherence is suspect (mindful of the great variability at the levels where patients develop pancreatitis); (3) unremitting triggers of severe HTG such as ongoing use of essential medications also known to exacerbate HTG (such as some forms of chemotherapy) or pregnancy in the third trimester. TG levels rise continuously throughout pregnancy and peak during the third trimester, when hypertriglyceridemic pancreatitis most often occurs. Asymptomatic patients with severe HTG not requiring hospitalization need close outpatient follow‐up to prevent the onset of chylomicronemia syndrome.
INPATIENT MANAGEMENT
No professional recommendations exist regarding a standardized treatment plan for severe HTG. The treatment regimen is first based on the presence or absence of symptoms. Treatment of hypertriglyceridemic pancreatitis should target a serum TG level 1000 mg/dL and resolution of abdominal pain. The initial goal for asymptomatic patients is a TG level 1000 mg/dL, as this level represents a significant reduction in the risk of developing chylomicronemia syndrome. In either case, the first 2 components of the treatment regimen are dietary changes and oral medications.
Dietary Changes
Patients with hypertriglyceridemic pancreatitis should be made NPO, with the exception of necessary medications taken only with water to provide bowel rest and eliminate fat intake. As chylomicron production in the intestine falls, TG levels will fall dramatically within 12 days of NPO status regardless of other treatments. Once TG levels approach 1000 mg/dL and there is no residual abdominal pain, a no‐fat diet can be given. Patients with persistent abdominal pain requiring a prolonged fast (>57 days) may require nutrition through alternate means such as an enteral formula through a feeding tube or the use of TPN. If a feeding tube is required, we suggest beginning with an elemental, peptide‐based, fat‐free formula, with help from a nutrition consult to assist with individual tube‐feeding options.25 Enteral formula can be supplemented with medium‐chain triglyceride oils (found in coconut and palm kernel) to provide some additional nutritional support. MCTs do not raise serum TG levels, as they are absorbed directly into the portal vein for prompt oxidation by the liver, whereas long‐chain TGs are converted into chylomicrons for peripheral transport. One case report describes a dramatic therapeutic response to medium‐chain triglyceride oils in a patient with familial chylomicronemia,26 although we do not routinely recommend these oils as therapy given lack of long‐term safety data. Lastly, if TPN is required, it is crucial to avoid lipid emulsions to prevent a rise in serum TG levels.
Asymptomatic patients with severe HTG can be fed upon admission, but should be placed on a fat‐free diet. Fat is added back into the diet when TG levels fall below 1000 mg/dL and is slowly increased to a target fat content of 10% of the total calories, usually not exceeding 25 g/day.
Oral Medications
Oral medications should be initiated to lower TG levels for both symptomatic and asymptomatic patients. Table 3 lists the different classes of medications. In our experience, oral fibrates are a recommended first‐line treatment, with other agents used as adjunctive therapy. Through complex mechanisms, fibrates reduce hepatic VLDL secretion and increase serum lipolysis of TG.27 In patients who do not have diabetes and are at low risk for coronary heart disease (CHD), either gemfibrozil or fenofibrate may be used to lower serum TG levels. However, in patients with diabetes, CHD, or a CHD risk equivalent, use of fenofibrate is preferred as an HMG‐CoA reductase inhibitor (a statin) and will almost always be necessary to reach low‐density lipoprotein (LDL)‐cholesterol goals. Fenofibrate, unlike gemfibrozil, does not interfere with the glucuronidation of statins by the liver.28
| Drug | Usual Dose | TG Reduction | Cautions or Contraindications | Comments |
|---|---|---|---|---|
| ||||
| Fenofibrate | 130200 mg/day | 50% | Hepatic or renal insufficiency | Best fibrate to use with HMG‐CoA reductase Inhibitors |
| Gemfibrozil | 600 mg BID | 50% | Hepatic or renal insufficiency | Avoid combination with statins |
| HMG‐CoA reductase inhibitors or statins | Variable; the more potent LDL lowering, the more TG lowering | 25% | Decompensated cirrhosis; end‐stage renal disease | Not the primary treatment for patients with TG levels >1000 mg/dL; some statins such as atorvastatin and fluvastatin are favored for patients with renal insufficiency due to less renal excretion than other statins |
| Omega‐3 fatty acids | 2 g BID Lovaza (840 mg DHA/EPA per dose) | 25%50% with monotherapy (the higher the TG level, the greater the reduction); 30% with combination therapy | Allergy to fish | Fishy aftertaste; may cause flatulence; may increase serum glucose and LDL; low risk of clinical bleeding |
| Nicotinic acid | 12 g/day ER; up‐titrate from lowest dose | 15%35% | Active liver disease; active peptic ulcer disease; arterial bleeding | Can increase blood sugar levels by increasing insulin resistance |
| Orlistat (Xenical) | 120 mg TID | 15%35% | Cases of serious liver dysfunction have been reported | Can interfere with drug absorption, especially fat‐soluble vitamins; oily rectal discharge |
| Insulin | IV 0.10.3 U/kg/hr; titrate to serum glucose 140180 mg/dL OR basal/bolus subcutaneously | Variable; >50% in some cases | Hypoglycemia | Useful in patients who have diabetes |
If a fibrate fails to achieve an acceptable serum TG level, we recommend adjunctive therapy with omega‐3 fatty acid esters. Omega‐3 fatty acids lower serum TG levels by decreasing VLDL production and can lower TG levels by as much as 45% in cases of severe HTG.29 This medication is typically the first adjunctive medication chosen due to its low side effect profile.
If additional TG lowering is needed, niacin or nicotinic acid (vitamin B3) may be added next. This medication decreases VLDL production, lowers LDL, and increases high‐density lipoprotein, but invariably with initiation, patients exhibit prominent skin flushing, burning, or itching. This prostaglandin‐mediated effect may be prevented or at least reduced in severity by taking 325 mg aspirin 1 hour before niacin administration. If the TG level is still not at goal, orlistat, a lipase or fat blocker, may be useful.30 Orlistat improves postprandial lipemia through reduction of dietary fat absorption. Finally, although potent statins such as atorvastatin and rosuvastatin can lower TGs derived from VLDL substantially,31 their use should be prompted by the patient's risk for atherosclerotic cardiovascular disease. Because all of the hypotriglyceridemic medications can affect the liver, regular liver function testing is prudent, as is a periodic re‐evaluation of the ongoing need for these medications. Statin use causing mild transaminase elevation (up to 3 times the upper limit of normal) may be safely tolerated.32
Additional Inpatient Management
Insulin
Insulin increases lipoprotein lipase activity, thereby accelerating chylomicron degradation.33 Insulin (along with glucose if necessary to maintain euglycemia) is therefore a useful adjunctive TG‐lowering medication to oral medications, even in nondiabetic patients. Insulin administered intravenously should follow a titration protocol with hourly monitoring of blood glucose. The goal of the insulin protocol with severe HTG is not maintaining strict euglycemia but rather maintenance of LPL activation by exogenous insulin with avoidance of hypoglycemia. In hospitals where an insulin infusion protocol for diabetic ketoacidosis or postsurgical hyperglycemia already exists, the protocol can be applied for HTG management with minor modifications: introduce dextrose‐containing fluids at higher blood glucoses (180 mg/dL or less) and eliminate insulin boluses. A suggested dose is a continuous intravenous insulin drip at 0.10.3 U/kg/hr with glucose to maintain blood glucose levels between 140 and 180 mg/dL, although there are no guidelines from professional societies. Subcutaneous insulin has also been used to successfully lower TG levels.34, 35 The major limitation of subcutaneous administration is the inability to rapidly adjust the dosing when needed, which is particularly concerning when treating patients who do not have diabetes. We prefer to use subcutaneous basal insulin in patients requiring long‐term use of insulin after a significant TG reduction with intravenous insulin. Subcutaneous bolus prandial insulin should not be used until the patient has resumed a solid diet, because a liquid diet may not reliably contain enough carbohydrates for bolus therapy.
Intravenous Heparin
Heparin has been used in case reports as adjunctive treatment for hypertriglyceridemic pancreatitis.36, 37 Although heparin may increase circulating LPL levels, this effect is short‐lived and is quickly followed by increased hepatic LPL degradation.38 Therefore, the use of heparin to treat severe HTG cannot be routinely recommended.
Therapeutic Plasma Exchange
First used in 1978, therapeutic plasma exchange (TPE) has been demonstrated to quickly and dramatically lower serum TG levels.39 Since its first use, TPE has been used in several small case studies.4042 Without data from larger studies, the optimal frequency and duration of TPE remains unclear. One review suggests the use of TPE as first‐line therapy provided the patient is euglycemic, apheresis can be started within 48 hours of diagnosis, and the patient can tolerate the central venous access.43 On the other hand, guidelines from the American Society of Apheresis incorporating low‐quality evidence do not recommend TPE as routine first‐ or second‐line treatment for hypertriglyceridemic pancreatitis, but rather suggest the use of TPE on a case‐by‐case basis.44 When TPE is needed, this society recommends daily treatment for 13 days until an adequate postapheresis TG level is obtained. Although TPE rapidly lowers TG levels, it is also aggressive (requires placement of a pheresis catheter), expensive, and may not be readily available. We believe it remains an option for patients with severe HTG who do not respond readily to fat restriction, glycemic control with insulin, and pharmacologic treatment with a fibrate and omega‐3 fatty acids. In our judgment, routine use of TPE cannot be recommended without data from a randomized clinical trial examining the value of immediate lowering of TG levels with TPE versus the usually prompt fall in TG levels with less aggressive measures.
Discharge Planning
Typically, asymptomatic patients are discharged once their TG levels approach 1000 mg/dL. Patients recovering from hypertriglyceridemic pancreatitis may be discharged once they tolerate a no‐fat diet without recurrence of abdominal pain and without a significant TG increase above 1000 mg/dL.
Discharge Diet and Activity
At discharge, the diet should be high in fiber, fruits, vegetables, and lean protein, with fat intake restricted to approximately 10% of total calories. Insulin‐resistant patients and patients with diabetes should avoid sugar‐sweetened foods and drinks. Specifically, the daily amount of fructose intake should be no more than 50 mg to avoid a dose‐dependent increase in plasma TG levels compared with other sugars.4 At least 2 servings per week of marine foods naturally rich in omega‐3 fatty acids (fatty fish such as salmon or trout) are recommended. Nonmarine forms of omega‐3 fatty acids (walnuts, flaxseed), which have not demonstrated consistent reductions in TG, cannot be routinely recommended.4 In addition, alcohol consumption should be eliminated.
Once patients maintain a TG level near 500 mg/dL, we allow for dietary flexibility by slowly increasing the amount of dietary unsaturated fat. For patients with TG levels 500 mg/dL, Adult Treatment Panel III advocated restriction of daily dietary saturated fat levels to 7% and keeping the total fat level between 25% and 35%.2 A range in total fat was provided so that unsaturated fat could be increased to limit dietary carbohydrates if glycemic control was needed. In addition to dietary changes, counseling patients about the importance of physical activity and weight loss is crucial for long‐term management of severe HTG. TG lowering in response to diet and weight loss varies, but typically approximates 25%.45
Outpatient Medications
Patients without significant contraindications should be discharged on a fibrate and omega‐3 fatty acids. As mentioned, niacin, orlistat, and/or a statin may be used as adjunctive therapy. Despite use of these hypotriglyceridemic medications, secondary causes of HTG should be modified (such as removal of aggravating medications or appropriately treating uncontrolled diabetes) to yield lasting improvements in TG levels.
CONCLUSIONS
As the prevalence of obesity and diabetes continues to rise, so too does the clinical importance of proper management of severe HTG. Recognizing chylomicronemia syndromeone of the most dramatic consequences of lipid disordersand the underlying primary and secondary causes of HTG is required before starting treatment. Patients with severe HTG may require hospitalization for immediate reduction in TG levels and relief of abdominal pain, if present. Treatment involves modifying secondary causes, if possible, and eliminating dietary fat intake. Although use of medications such as an oral fibrate, omega‐3 fatty acids, and insulin are routine, the use of a more invasive procedure such as TPE should be considered on a case‐by‐case basis and may be limited by availability. Upon hospital discharge, careful follow‐up should promote lifestyle changes and medication adherence to prevent recurrence of severe HTG.
- ,,,.Pathophysiology of triglyceride‐rich lipoproteins in atherothrombosis: clinical aspects.Clin Cardiol.1999;22:II15–II20.
- Executive Summary of The Third Report of The National Cholesterol Education Program (NCEP) Expert Panel on Detection, Evaluation, and Treatment of High Blood Cholesterol In Adults (Adult Treatment Panel III).JAMA.2001;285:2486–2497.
- ,.Chylomicronemia syndrome. Interaction of genetic and acquired hypertriglyceridemia.Med Clin North Am.1982;66:455–468.
- ,,, et al.Triglycerides and cardiovascular disease: a scientific statement from the American Heart Association.Circulation.2011;123:2292–2333.
- .Familial lipoprotein lipase deficiency and other causes of the chylomicronemia syndrome. In: Scriver C, Beaudet A, Sly W, Valle D, eds.The Metabolic and Molecular Basis of Inherited Disease.7th ed.New York:McGraw‐Hill;1995:1913–1932.
- ,,.Hypertriglyceridemia: its etiology, effects and treatment.CMAJ.2007;176:1113–1120.
- ,,, et al.Chylomicronemia with a mutant GPIHBP1 (Q115P) that cannot bind lipoprotein lipase.Arterioscler Thromb Vasc Biol.2009;29:956–962.
- ,,, et al.A mutation in the human lipoprotein lipase gene as the most common cause of familial chylomicronemia in French Canadians.N Engl J Med.1991;324:1761–1766.
- ,,, et al.Inherited apolipoprotein A‐V deficiency in severe hypertriglyceridemia.Arterioscler Thromb Vasc Biol.2005;25:411–417.
- ,,, et al.A polygenic basis for four classical Fredrickson hyperlipoproteinemia phenotypes that are characterized by hypertriglyceridemia.Hum Mol Genet.2009;18:4189–4194.
- .Secondary causes of hyperlipidemia.Med Clin North Am.1994;78:117–141.
- ,,.Hypertriglyceridemic hyperapob: the unappreciated atherogenic dyslipoproteinemia in type 2 diabetes mellitus.Ann Intern Med.2001;135:447–459.
- .Hyperlipidemic pancreatitis.Gastroenterol Clin North Am.1990;19:783–791.
- ,,, et al.Effects of insulin on cholesterol synthesis in type II diabetes patients.Diabetes Care.1995;18:1362–1369.
- ,,,.Evidence for the chylomicron origin of lipids accumulating in diabetic eruptive xanthomas: a correlative lipid biochemical, histochemical, and electron microscopic study.J Clin Invest.1970;49:2172–2187.
- .Dyslipidaemia.Lancet.2003;362:717–731.
- ,,.Lymphadenopathy associated with severe hypertriglyceridemia.JAMA.1990;264:727–728.
- Diagnosis and classification of diabetes mellitus.Diabetes Care.2010;33(suppl 1):S62–S69.
- ,.Pseudohyponatremia in acute hyperlipemic pancreatitis. A potential pitfall in therapy.Arch Surg.1985;120:1053–1055.
- ,,.Suppression of amylase activity by hypertriglyceridemia.JAMA.1973;225:1331–1334.
- ,,,.Dyslipidaemic pancreatitis clinical assessment and analysis of disease severity and outcomes.Pancreatology.2009;9:252–257.
- .Pathogenesis, differentiation and management of hypertriglyceridemia.Adv Intern Med.1969;15:117–154.
- ,.Role of hypertriglyceridemia in the pathogenesis of experimental acute pancreatitis in rats.Int J Pancreatol.1996;20:177–184.
- ,,, et al.Acute pancreatitis in a cohort of 129 patients referred for severe hypertriglyceridemia.Pancreas.2008;37:13–12.
- ,,, et al.ESPEN Guidelines on Enteral Nutrition: pancreas.Clin Nutr.2006;25:275–284.
- ,,, et al.Therapeutic response to medium‐chain triglycerides and omega‐3 fatty acids in a patient with the familial chylomicronemia syndrome.Arterioscler Thromb Vasc Biol.1997;17:1400–1406.
- ,,,,,.Mechanism of action of fibrates on lipid and lipoprotein metabolism.Circulation.1998;98:2088–2093.
- ,,.Drug interactions with lipid‐lowering drugs: mechanisms and clinical relevance.Clin Pharmacol Ther.2006;80:565–81.
- ,,, et al.Safety and efficacy of Omacor in severe hypertriglyceridemia.J Cardiovasc Risk.1997;4:385–391.
- ,,.Usefulness of Orlistat in the treatment of severe hypertriglyceridemia.Am J Cardiol.2002;89:229–231.
- ,,, et al.Effects of intensive atorvastatin and rosuvastatin treatment on apolipoprotein B‐48 and remnant lipoprotein cholesterol levels.Atherosclerosis.2009;205:197–201.
- ,,,.Final conclusions and recommendations of the National Lipid Association Statin Safety Assessment Task Force.Am J Cardiol.2006;97:89C–94C.
- .Lipoprotein lipase. A multifunctional enzyme relevant to common metabolic diseases.N Engl J Med.1989;320:1060–1068.
- ,,.Insulin therapy for a non‐diabetic patient with severe hypertriglyceridemia.J Am Coll Nutr.1998;17:458–461.
- ,,,,.Treatment of severe hypertriglyceridemia in nondiabetic patients with insulin.Am J Emerg Med.2005;23:415–417.
- ,.Decreasing the plasma triglyceride level in hypertriglyceridemia‐induced pancreatitis in pregnancy: a case report.Am J Obstet Gynecol.2002;187:241–242.
- ,,,,,.Pancreatitis may occur with a normal amylase concentration in hypertriglyceridaemia.BMJ.1996;313:1265.
- ,,,.Lipoprotein lipase during continuous heparin infusion: tissue stores become partially depleted.J Lab Clin Med.2001;138:206–13.
- ,,,,,.Treatment of severe diabetic hypertriglyceridaemia by plasma exchange.Lancet.1978;1:1368.
- ,,,.Therapeutic plasma exchange in patients with hyperlipidemic pancreatitis.World J Gastroenterol.2004;10:2272–2274.
- ,,.Plasma exchange in severe hypertriglyceridemia a clinical study.Transfus Apher Sci.2006;34:253–257.
- ,,, et al.Management of acute severe hyperlipidemic pancreatitis.Digestion.2006;73:259–264.
- ,,,,.Hypertriglyceridemic pancreatitis: presentation and management.Am J Gastroenterol.2009;104:984–991.
- ,,, et al.Guidelines on the use of therapeutic apheresis in clinical practice—evidence‐based approach from the Apheresis Applications Committee of the American Society for Apheresis.J Clin Apher.2010;25:83–177.
- ,,,,,.Effects of a low‐fat diet compared with those of a high‐monounsaturated fat diet on body weight, plasma lipids and lipoproteins, and glycemic control in type 2 diabetes.Am J Clin Nutr.2004;80:668–673.
- ,,,.Pathophysiology of triglyceride‐rich lipoproteins in atherothrombosis: clinical aspects.Clin Cardiol.1999;22:II15–II20.
- Executive Summary of The Third Report of The National Cholesterol Education Program (NCEP) Expert Panel on Detection, Evaluation, and Treatment of High Blood Cholesterol In Adults (Adult Treatment Panel III).JAMA.2001;285:2486–2497.
- ,.Chylomicronemia syndrome. Interaction of genetic and acquired hypertriglyceridemia.Med Clin North Am.1982;66:455–468.
- ,,, et al.Triglycerides and cardiovascular disease: a scientific statement from the American Heart Association.Circulation.2011;123:2292–2333.
- .Familial lipoprotein lipase deficiency and other causes of the chylomicronemia syndrome. In: Scriver C, Beaudet A, Sly W, Valle D, eds.The Metabolic and Molecular Basis of Inherited Disease.7th ed.New York:McGraw‐Hill;1995:1913–1932.
- ,,.Hypertriglyceridemia: its etiology, effects and treatment.CMAJ.2007;176:1113–1120.
- ,,, et al.Chylomicronemia with a mutant GPIHBP1 (Q115P) that cannot bind lipoprotein lipase.Arterioscler Thromb Vasc Biol.2009;29:956–962.
- ,,, et al.A mutation in the human lipoprotein lipase gene as the most common cause of familial chylomicronemia in French Canadians.N Engl J Med.1991;324:1761–1766.
- ,,, et al.Inherited apolipoprotein A‐V deficiency in severe hypertriglyceridemia.Arterioscler Thromb Vasc Biol.2005;25:411–417.
- ,,, et al.A polygenic basis for four classical Fredrickson hyperlipoproteinemia phenotypes that are characterized by hypertriglyceridemia.Hum Mol Genet.2009;18:4189–4194.
- .Secondary causes of hyperlipidemia.Med Clin North Am.1994;78:117–141.
- ,,.Hypertriglyceridemic hyperapob: the unappreciated atherogenic dyslipoproteinemia in type 2 diabetes mellitus.Ann Intern Med.2001;135:447–459.
- .Hyperlipidemic pancreatitis.Gastroenterol Clin North Am.1990;19:783–791.
- ,,, et al.Effects of insulin on cholesterol synthesis in type II diabetes patients.Diabetes Care.1995;18:1362–1369.
- ,,,.Evidence for the chylomicron origin of lipids accumulating in diabetic eruptive xanthomas: a correlative lipid biochemical, histochemical, and electron microscopic study.J Clin Invest.1970;49:2172–2187.
- .Dyslipidaemia.Lancet.2003;362:717–731.
- ,,.Lymphadenopathy associated with severe hypertriglyceridemia.JAMA.1990;264:727–728.
- Diagnosis and classification of diabetes mellitus.Diabetes Care.2010;33(suppl 1):S62–S69.
- ,.Pseudohyponatremia in acute hyperlipemic pancreatitis. A potential pitfall in therapy.Arch Surg.1985;120:1053–1055.
- ,,.Suppression of amylase activity by hypertriglyceridemia.JAMA.1973;225:1331–1334.
- ,,,.Dyslipidaemic pancreatitis clinical assessment and analysis of disease severity and outcomes.Pancreatology.2009;9:252–257.
- .Pathogenesis, differentiation and management of hypertriglyceridemia.Adv Intern Med.1969;15:117–154.
- ,.Role of hypertriglyceridemia in the pathogenesis of experimental acute pancreatitis in rats.Int J Pancreatol.1996;20:177–184.
- ,,, et al.Acute pancreatitis in a cohort of 129 patients referred for severe hypertriglyceridemia.Pancreas.2008;37:13–12.
- ,,, et al.ESPEN Guidelines on Enteral Nutrition: pancreas.Clin Nutr.2006;25:275–284.
- ,,, et al.Therapeutic response to medium‐chain triglycerides and omega‐3 fatty acids in a patient with the familial chylomicronemia syndrome.Arterioscler Thromb Vasc Biol.1997;17:1400–1406.
- ,,,,,.Mechanism of action of fibrates on lipid and lipoprotein metabolism.Circulation.1998;98:2088–2093.
- ,,.Drug interactions with lipid‐lowering drugs: mechanisms and clinical relevance.Clin Pharmacol Ther.2006;80:565–81.
- ,,, et al.Safety and efficacy of Omacor in severe hypertriglyceridemia.J Cardiovasc Risk.1997;4:385–391.
- ,,.Usefulness of Orlistat in the treatment of severe hypertriglyceridemia.Am J Cardiol.2002;89:229–231.
- ,,, et al.Effects of intensive atorvastatin and rosuvastatin treatment on apolipoprotein B‐48 and remnant lipoprotein cholesterol levels.Atherosclerosis.2009;205:197–201.
- ,,,.Final conclusions and recommendations of the National Lipid Association Statin Safety Assessment Task Force.Am J Cardiol.2006;97:89C–94C.
- .Lipoprotein lipase. A multifunctional enzyme relevant to common metabolic diseases.N Engl J Med.1989;320:1060–1068.
- ,,.Insulin therapy for a non‐diabetic patient with severe hypertriglyceridemia.J Am Coll Nutr.1998;17:458–461.
- ,,,,.Treatment of severe hypertriglyceridemia in nondiabetic patients with insulin.Am J Emerg Med.2005;23:415–417.
- ,.Decreasing the plasma triglyceride level in hypertriglyceridemia‐induced pancreatitis in pregnancy: a case report.Am J Obstet Gynecol.2002;187:241–242.
- ,,,,,.Pancreatitis may occur with a normal amylase concentration in hypertriglyceridaemia.BMJ.1996;313:1265.
- ,,,.Lipoprotein lipase during continuous heparin infusion: tissue stores become partially depleted.J Lab Clin Med.2001;138:206–13.
- ,,,,,.Treatment of severe diabetic hypertriglyceridaemia by plasma exchange.Lancet.1978;1:1368.
- ,,,.Therapeutic plasma exchange in patients with hyperlipidemic pancreatitis.World J Gastroenterol.2004;10:2272–2274.
- ,,.Plasma exchange in severe hypertriglyceridemia a clinical study.Transfus Apher Sci.2006;34:253–257.
- ,,, et al.Management of acute severe hyperlipidemic pancreatitis.Digestion.2006;73:259–264.
- ,,,,.Hypertriglyceridemic pancreatitis: presentation and management.Am J Gastroenterol.2009;104:984–991.
- ,,, et al.Guidelines on the use of therapeutic apheresis in clinical practice—evidence‐based approach from the Apheresis Applications Committee of the American Society for Apheresis.J Clin Apher.2010;25:83–177.
- ,,,,,.Effects of a low‐fat diet compared with those of a high‐monounsaturated fat diet on body weight, plasma lipids and lipoproteins, and glycemic control in type 2 diabetes.Am J Clin Nutr.2004;80:668–673.
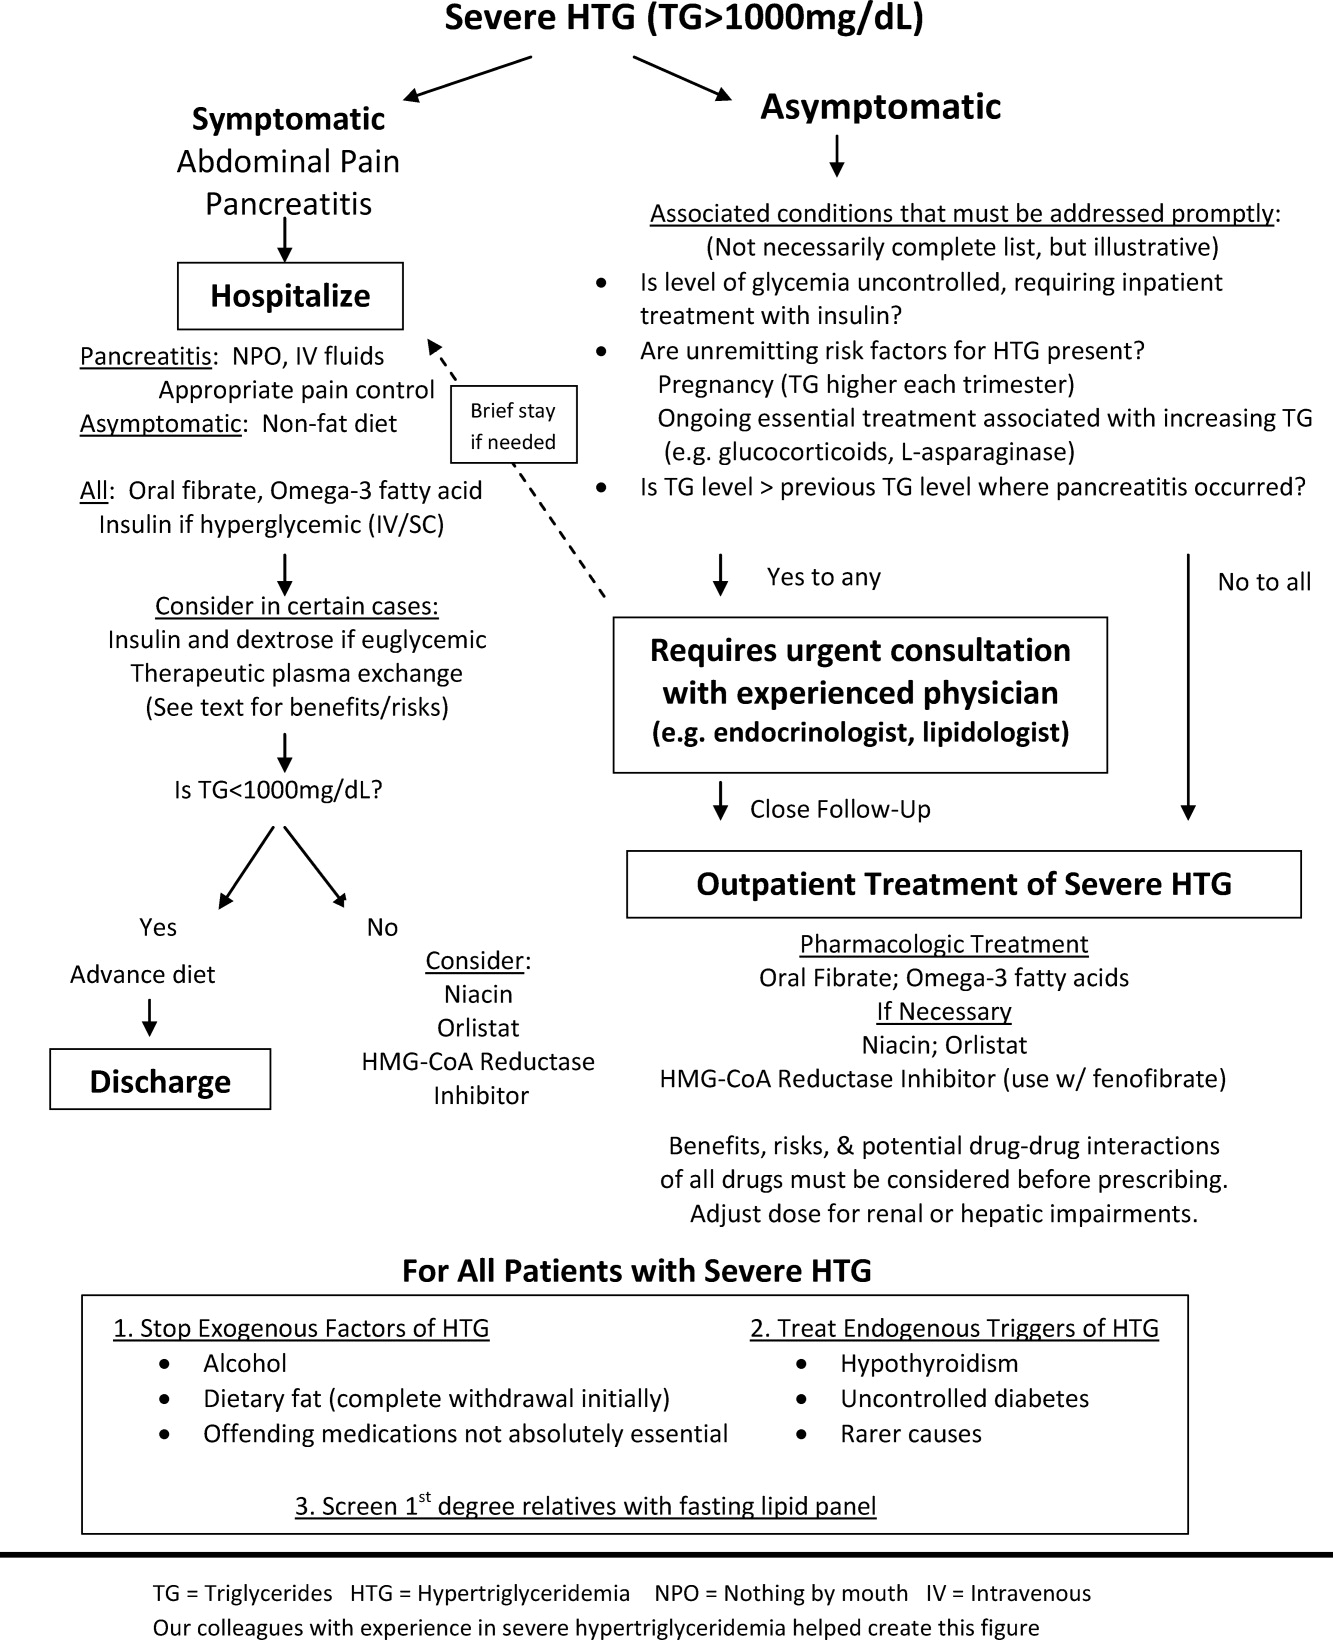
Patients' Diverse Beliefs about Death
Every health professional bears responsibility at some point for helping dying patients and their survivors face death spiritually and emotionally. But, because most Americans die in hospitals, that responsibility falls disproportionately to hospitalists and other hospital‐based health professionals.
Personal beliefs about what happens at death surely influence whether patients welcome or dread it, and whether survivors remember it with relief or regret.1 We believe, therefore, that competent, compassionate end‐of‐life care requires hospitalists and other health professionals who attend dying patients to address such beliefs. But people do not readily volunteer them, health professionals rarely elicit them, and little research describes them.
We, therefore, performed a large exploratory study to begin characterizing patients' beliefs about what happens at the time of death. We assumed that culturethe values a group uses to interpret shared experiences and transmits across generations2, 3influences those beliefs.1, 410 We reasoned that, because death is a universal human experience, every culture must address its meaning.5 Prior studies showing ethnic cultural differences over advance care planning, life support, and other aspects of dying further supported our assumption.3, 8, 1012
Our interview study revealed occasional beliefs that may characterize Americans in general, some beliefs that may characterize only certain ethnic groups or genders, and many beliefs that may characterize only particular individuals.
METHODS
We constructed a semistructured interview, based on topics and questions from the end‐of‐life literature and our own encounters with dying patients and their survivors. The interview schedule covered topics such as the right time to die, what happens at death, and the afterlife. We pretested all questions before using them in interviews.
Study participants were older inpatients from the 3 largest American ethnic groupsMexican Americans (MAs), Euro‐Americans (EAs), and African Americans (AAs),13 as identified by a validated ethnic algorithm.14 We reasoned that age, current serious (though not necessarily terminal) illness, and having experienced the deaths of others had already prompted these older inpatients to think about death.11
Admission logs from 2 San Antonio, Texas, hospitals identified all patients, aged 50 to 79, who were admitted over a 9‐month period for any of 10 common internal medicine diagnoses. From these logs we selected interviewees by purposive sampling, a nonstatistical technique that ensured adequate participant numbers by ethnic group and gender.15, 16 We invited patients to interview only after their primary physicians gave permission.
Sixty of 65 participants who began interviews completed them, and 58 of the 60 could be classified into 1 of the 3 ethnic groups.14 These 58, who produced saturation for all themes mentioned by more than 5% of participants, constituted our analysis sample. Participants included 26 MAs (14 men, 12 women), 18 EAs (7 men, 11 women), and 14 AAs (7 men, 7 women). The most prevalent admitting diagnoses were congestive heart failure (19 participants), angina (17 participants), and pneumonia and chronic obstructive pulmonary disease (5 participants each). The 3 ethnic group samples had similar mean ages but differed in other ways (Table 1). MAs were typically Roman Catholic, educated through grade 7, and married; EAs were divided between Roman Catholic and Protestant, educated through grade 12, and mostly unmarried; and AAs were nearly all Protestant, educated through grade 11, and mostly unmarried. The genders within each ethnic group sample were similar by age, religion, and education (data not shown). AA men and women were also similar by marital status. However, MAs and EAs had more men than women who were married, and more women than men who were widowed.
| Characteristics | Mexican Americans (26 Total: 14 Men, 12 Women) | Euro‐Americans (18 Total: 7 Men, 11 Women) | African Americans (14 Total: 7 Men, 7 Women) |
|---|---|---|---|
| Age (years) | |||
| Mean | 63 | 63 | 59 |
| Standard deviation | 8.5 | 8.4 | 5.8 |
| Religion, % | |||
| Roman Catholic | 77 | 39 | 0 |
| Protestant | 15 | 50 | 93 |
| Other | 8 | 11 | 7 |
| Education (years) | |||
| Median | 7 | 12 | 11 |
| Interquartile range | 311 | 1012 | 1012 |
| Currently married, % | 58 | 33 | 29 |
Two trained, bilingual women1 MA and 1 EA, not specifically matched to participants by ethnic groupused the schedule of questions to interview participants. The interviews usually took place 3 days after admission, involved one‐on‐one engagement in participants' hospital rooms, were audiotaped, and lasted roughly 90 minutes. Most questions were open‐ended, allowing participants to express beliefs in their own words. For example, the open‐ended question, What do you think happens at the end of a person's life? introduced the topic covered here. To help focus responses, interviewers asked participants early on to name the closest person to them to have died. Interviewers then encouraged participants to describe their beliefs specifically in terms of that person's death. (We assumed the closeness of the relationships had kept those deaths vivid for participants even years afterward.) Most participants responded by referring to that person, but a few described their own death‐like experiences or their general beliefs about death. Interviewers probed as necessary to clarify responses.
Participants interviewed in Spanish or English as they preferred. Two MAs interviewed entirely in Spanish, 10 MAs interviewed partly in Spanish and partly in English, and all other participants interviewed entirely in English. Bilingual typists transcribed the audiotapes, translating any Spanish into English. Two bilingual experts independently confirmed the accuracy of the translations.
The coders who content‐analyzed responses varied by ethnic group, gender, and professional training. They conducted their analysis in 4 steps, each involving initial, independent, blinded reviews by 2 coders; comparison of interpretations; and consensual resolution of disagreements. First, 2 coders deleted any comments irrelevant to death or dying. Second, the same coders assembled the remaining passages by topic, such as beliefs about what happens at the time of death. Third, 1 original coder and a senior investigator naive to the responses identified themes within each topic. Fourth, that original coder and either of 2 new coders determined for each interview the presence or absence of each theme. Theme presence required agreement between the original coder and the new coder or, when they differed, agreement between one of these coders and an independent adjudicator. Lastly, the 3 authors aggregated themes into meaningful categories by consensus, and checked these categories for trustworthiness against participants' original comments.
We report the results for each theme primarily as the percentages of participants within these ethnic group or gender samples who mentioned the theme. Though content analyses are usually reported qualitatively, percentages have 2 advantages here.17 First, readers can see the percentages and judge for themselves the important similarities, differences, and patterns in the data. Second, percentages enable researchers to formulate their own questions for further study, say, questions based on the largest percentages or largest percentage differences in the data. We also report representative quotes to illustrate the depth and richness of participant responses.
The study complied with all institutional review board requirements.
RESULTS
Most participants in all 3 ethnic group samples named a parent as the closest person to them to have died (Table 2). Among these participants, MAs named their mothers overwhelmingly, but EAs and AAs named their mothers and fathers nearly equally. Other participants named siblings, children, other relatives, or friends. Of 13 widowed participants, only 4 named their spouses.
| Characteristic | Mexican Americans* (n = 26) | Euro‐ Americans* (n = 18) | African Americans* (n = 14) |
|---|---|---|---|
| |||
| Relationship of closest person to participant | |||
| Mother | 42 | 28 | 29 |
| Father | 12 | 22 | 29 |
| Spouse | 4 | 11 | 7 |
| Other | 42 | 39 | 36 |
| Closest person's death was | |||
| Momentary | 35 | 50 | 21 |
| Prolonged | 42 | 22 | 21 |
| Participant mentioned medical treatment that closest person received at time of death | 19 | 44 | 43 |
| Participant believed medical treatment caused closest person to suffer at time of death | 0 | 6 | 29 |
Thirty‐nine participants20 MAs, 13 EAs, and 6 AAsdescribed the closest person's time of death as either momentary (typically less than a minute) or prolonged (longer than a few minutes). More EAs described it as momentary than as prolonged (50% vs 22%). One EA woman said, We were right outside [the hospital room when my father suffered his cardiac arrest]. We knew, when the alarm went off on the heart monitor, it was the last time we'd see him alive. In contrast, MAs and AAs split roughly equally between describing death as momentary or as prolonged (MAs: 35% and 42%, respectively; AAs: 21% for both).
The ethnic group samples also differed about harm from treatments the closest person had received when dying. Of participants who specified such treatments, disproportionately more AAs (4 of 6) than MAs (0 of 5) or EAs (1 of 8) said those treatments had caused the person to suffer at the time of death. Recalling the prolonged resuscitation efforts on his father, one AA man said that the doctors were trying to keep him alive I said, Don't put his body through that.
Many participants went on to describe their beliefs about what happens at the time of death, about the physiologic signs that define that time, and about the senses that persist after death.
Beliefs about What Happens at the Time of Death
Because words embody meaning, the synonyms used for death, dying, or dead give clues to people's beliefs about what happens at death.18 Fifty‐three participants (91%) used such synonyms.
Reflecting a sense of separation, the most prevalent synonyms implied movement of the dead away from this life and the living (Table 3). Forty‐six participants (79%) used one of these synonyms. Two, goes and leaves, definitely implied movement but not necessarily due to an external force (theme 3A). Thirty‐two participants (55%)including majorities of all 3 ethnic group samples (range, 54%‐57%) and of 5 of 6 gender subsamples (range, 55%‐64%, except for 42% for MA women)used at least one of these terms. An EA man, for example, described death as leav[ing] this life, and go[ing] to the next. Other synonyms, variations on passes (theme 3B), may have also implied movement. Large minorities of all ethnic group samples (range, 38%‐44%) and gender subsamples (range, 29%‐50%) used at least one of these terms. As an MA woman said, [W]e are born, and we die. [We] stay here a while, [and then] pass through to the other side. Still other synonyms, variations on taken (theme 3C), definitely implied that an external force actively removes the dead from this life. Notably more MAs than EAs or AAs used one of these terms (35% vs 6%, and 21%, respectively). All participants who did attributed the external force to God or Jesus. We're here on borrowed time, one MA man explained. When God tells you [that] you gotta leave [t]hat's when you die. He is going to take your soul.
| The Dying Person | Group | Mexican Americans (26 Total: 14 Men, 12 Women) (%)* | Euro‐Americans (18 Total: 7 Men, 11 Women) (%)* | African Americans (14 Total: 7 Men, 7 Women) (%)* |
|---|---|---|---|---|
| ||||
| A. Goes or leaves | ||||
| All participants | 54 | 56 | 57 | |
| Men alone | 64 | 57 | 57 | |
| Women alone | 42 | 55 | 57 | |
| B. Passes on or away | ||||
| All participants | 38 | 44 | 43 | |
| Men alone | 29 | 43 | 43 | |
| Women alone | 50 | 45 | 43 | |
| C. Is taken | ||||
| All participants | 35 | 6 | 21 | |
| Men alone | 43 | 0 | 14 | |
| Women alone | 25 | 9 | 29 | |
Less prevalent synonyms for death carried no implication of movement and fell into 2 groups. One group included terms such as sleeping or resting that implied relief from life's struggles. Modest minorities of all ethnic group samples (range, 14%‐19%) and of 5 of the 6 gender subsamples (range, 17%‐29%, except for 0% for AA women) used such terms. Recalling his sister's death after a long illness, one MA man said, [H]er soul went to heaven, and she's resting. The second group included terms about being lost to the living. Modest minorities of MAs and EAs (15% and 11%, respectively), but no AAs, used these terms. One MA woman remembered her daughter's death in childbirth, saying, Her death took part of my life away [but] my grandson lost his mother.
Beliefs about the Physiologic Signs That Define the Time of Death
Twenty‐three participants (40%) specified physiologic signs they believed define this time (Table 4). Nineteen participants did so referring to hospital deaths; 4 participants, to home deaths. More EAs than MAs or AAs specified at least one such sign (67% vs 23% and 36%, respectively).
| Signs | Group | Mexican Americans (26 Total: 14 Men, 12 Women) (%)* | Euro‐Americans (18 Total: 7 Men, 11 Women) (%)* | African Americans (14 Total: 7 Men, 7 Women) (%)* |
|---|---|---|---|---|
| ||||
| Any sign mentioned | ||||
| All participants | 23 | 67 | 36 | |
| Men alone | 36 | 57 | 29 | |
| Women alone | 8 | 73 | 43 | |
| Specific signs mentioned | ||||
| A. Cessation of breathing | ||||
| All participants | 8 | 17 | 21 | |
| Men alone | 7 | 0 | 0 | |
| Women alone | 8 | 27 | 43 | |
| B. Cessation of heartbeat | ||||
| All participants | 8 | 22 | 7 | |
| Men alone | 14 | 14 | 14 | |
| Women alone | 0 | 27 | 0 | |
| C. Cooling of the body | ||||
| All participants | 12 | 17 | 0 | |
| Men alone | 21 | 0 | 0 | |
| Women alone | 0 | 27 | 0 | |
| D. Other signs mentioned | ||||
| All participants | 8 | 22 | 14 | |
| Men alone | 14 | 43 | 29 | |
| Women alone | 0 | 9 | 0 | |
Seventeen of the 23 participants cited only one sign each as defining the time of death; the other 6 participants cited multiple signs. Overall, 8 physiologic signs were cited, but none predominated in any ethnic or gender group. The most common signs were cessation of breathing (theme 4A, 8 participants), cessation of heartbeat (theme 4B, 7 participants), and cooling of the body (theme 4C, 6 participants). Illustrating these signs in order, one AA woman said, Once that breath is going out of the body [a person's] already dead; an MA man said, My mother died [as] her heart monitor kept going down little by little; and an EA woman explained, I didn't feel the coldness of [my dead mother in the coffin] she didn't belong there I felt like she was asleep. I was telling her to get up. Interestingly, no AAs cited cooling of the body as a sign defining the time of death. Furthermore, only 4 participants, all of whom described in‐hospital deaths, cited coma or other severe brain dysfunction as such a sign.
Beliefs about Senses Persisting after Death
Of the 29 participants (50%) who expressed opinions on this topic (Table 5), 17 said the senses definitely or possibly persist after death (theme 5A), and 12 said they definitely do not (theme 5B). Prevalences of these contrasting beliefs differed little within ethnic group or gender samples with one exception: More EA women said the senses definitely or possibly persist after death than said they do not (45% vs 9%).
| Do the Senses Persist after Death?* | Group | Mexican Americans (26 Total: 14 Men, 12 Women) (%) | Euro‐Americans (18 Total; 7 Men, 11 Women) (%) | African Americans (14 Total: 7 Men, 7 Women) (%) |
|---|---|---|---|---|
| ||||
| A. Definitely yes or possibly | ||||
| All participants | 31 | 33 | 21 | |
| Men alone | 36 | 14 | 29 | |
| Women alone | 25 | 45 | 14 | |
| B. Definitely no | ||||
| All participants | 23 | 11 | 29 | |
| Men alone | 21 | 14 | 43 | |
| Women alone | 25 | 9 | 14 | |
The senses mentioned most often as persisting after death were sight (8 participants), hearing (7 participants), and touch (7 participants). Only 1 participant mentioned smell, and none mentioned taste. Some participants associated persistent senses with the dead person's spirit; other participants associated them with the body. All who mentioned sight associated it with the spirit. As one MA woman explained, at death the soul is not in the body but lingers above [watching] to see how the family takes [the death]. Among those who mentioned hearing, more associated it with the spirit than with the body. Associating hearing with the spirit, one MA man said, [W]hen I had my aneurysm I died three times I could hear music that had never been heard. It wasn't in the room like somebody was calling me. In contrast, an AA man insisted his dead father's body could hear you. Unlike either sight or hearing, touch was associated more often with the body than with the spirit. When asked about practicing invasive procedures on the cadaver, an EA man exclaimed, [If the doctors] hurt the guy that's dead, he ain't going to holler. They wouldn't know they hurt him. [They're] liable to get back too far and hit the bone.
The large percentages of both Protestants and Roman Catholics among MAs and EAs allowed us to check religion as a potential alternative explanation for differences between ethnic groups. We found only one possible instance: In both ethnic group samples, about 50% of Protestants but only about 15% of Roman Catholics described death as momentary.
DISCUSSION
Beliefs about what happens at death surely affect the whole dying experience1 and may help guide end‐of‐life care. Yet for all the research on dying, the health professions literatures contain virtually no studies describing such beliefs.19 This exploratory study begins the descriptive process.
The results suggest a taxonomyhowever provisionalfor those beliefs (Table 6). Occasional beliefs, such as the one that death separates the dead from the living, may be held by many Americans and thereby characterize American society in general. Other beliefs may characterize only particular American ethnic groups or genders. Ethnically based beliefs may include, for MAs, the belief that death occurs when an external force, specifically God or Jesus, takes the dead person away; for EAs, the beliefs that death occurs in less than a minute and that physiologic signs define the time of death; and, for AAs, the belief that cooling of the body never defines the time of death. A gender‐based belief may be the belief of EA women that some senses persist after death. Still other beliefs may be idiosyncratic, varying among individuals without a demographic pattern. Idiosyncratic beliefs may include which particular physiologic sign defines the time of death.
| Level | Example(s) of Beliefs | Highest Prevalence Group(s) |
|---|---|---|
| Society‐wide | Death separates the dead from the living. | Americans in general |
| Particular ethnic groups | Death occurs when an external powerspecifically God or Jesustakes the dead person away. | Mexican Americans |
| Death occurs in less than a minute. | Euro‐Americans | |
| Physiologic signs define the time of death. | Euro‐Americans | |
| Cooling of the body never define the time of death. | African Americans | |
| Particular gender subgroups | Some senses persist after death. | Euro‐American women |
| Individuals | Which particular physiologic sign defines the time of death. | Idiosyncratic, no demographic pattern |
The reader must consider these results in light of the study's assumptions, weaknesses, and strengths. Two assumptions were key: that participants expressed themselves fully (despite the difficulty of articulating such beliefs), and that the content analysts interpreted them accurately. Study weaknesses included possible conditioning of responses through prior interview questions, incomplete responsiveness about certain themes, nongeneralizability beyond these sample groups due to the purposive sampling, and educational and marital status differences as possible alternative explanations for the results. Important study strengths included the clinically important topic; the ill, older participants who had already faced death for themselves or others; the pretested, bilingual interview schedule; the open‐ended questions allowing participants to express beliefs in their own words; and the rigorous content analysis.
While indicating directions for future research, our results also provide several useful lessons for current end‐of‐life care. First, hospitalists and other health professionals who attend the dying must not assume they can accurately predict the beliefs of patients or survivors about what happens at the time of death. Many beliefs that participants expressed here neither we nor the health professionals to whom we have presented the results could have imagined beforehand. Health professionals simply cannot expect patients and survivors to hold the same beliefs as they. Furthermore, while some beliefs may characterize certain demographic groups in general, large idiosyncratic variation within groups compromises many demographically based predictions of particular individuals' beliefs. Thus, health professionals can probably learn such beliefs only by eliciting them individual by individual.18 Admittedly awkward, the necessary inquiries6, 20, 21 demand courage and patience, but, when done well, may help prepare all for the death.
Second, these inquiries require health professionals to cultivate techniques for eliciting people's beliefs sensitively and accurately.18 For example, health professionals might ask questions using the same terms for death (such as goes, passes, or rests) that the patient or survivors use. This technique encourages open expression of beliefs by assuring people that health professionals are listening carefully. Still, professionals must guard against misunderstandings that such terms may createparticularly by giving false hope or ignoring sad realities.
Third, armed with knowledge of patient and survivor beliefs, health professionals should tailor perimortem care accordingly. For example, because many people suffer pangs of separation at a death, health professionals should address those feelings expressly.22 Doing so may promote closure for the grieving.20, 2325 Health professionals should also attend to beliefs such as those about the signs and duration of the time of death. As this study showed, different people may time death by different physiologic signs. The patient with a warm body but no heartbeat may be simultaneously alive to someone who sees cooling of the body as defining the time of death, and dead to someone else who sees cessation of heartbeat as doing so.18, 26 Unfortunately, certain perimortem procedures, such as harvesting organs for transplantation, moving the body to the morgue, or performing an autopsy, require declaring death unambiguously at one specific time. When differences may exist over the signs or duration of death, the best way to avoid agonizing arguments or decisional paralysis when death occurs is to articulate any differences beforehand and to resolve them with a mutually acceptable management plan.27 Health professionals should also honor survivor beliefs about sentience of the dead. Unlike differences over signs and duration of death, differences over sentience of the dead may often be accommodated without definitive resolution. For example, although health professionals should treat any body respectfully, they must make special efforts to handle the dead body gently in case survivors believe it can still feel pain.
CONCLUSION
A patient's death is a climactic event for patient, survivors, and health professionals alike. It warrants careful management. Personal beliefs about what happens at death surely affect how patients anticipate it and what survivors remember of it. Compassionate perimortem care, therefore, must address those beliefs.28
Yet demographic characteristics such as ethnic group or gender offer only limited clues to such beliefs, making health professionals elicit them directly.4, 6, 9, 21 Discussions with patients and survivors about these beliefs are bound to create emotional discomfort for everybody, but health professionals may dispel much of it by demonstrating a sincere commitment to personalized end‐of‐life care, showing respect for the beliefs of patients and survivors,7, 21, 23 and accommodating those beliefs whenever possible.2, 28 The result may be the best of all possible outcomessensitive, respectful, and compassionate care for patients and survivors, and rewarding caregiving experiences for health professionals.20, 24, 25
Acknowledgements
Charles Cavazos provided computer support, and Susan Bagby helped edit the manuscript.
- ,,.Communication strategies and cultural issues in the delivery of bad news.J Palliat Med.2007;10(4):958–977.
- ,,.Cross‐cultural considerations in clinical ethics consultations.Arch Fam Med.1995;4:159–164.
- ,.Negotiating cross‐cultural issues at the end of life: “You got to go where he lives.”JAMA.2001;286(23):2993–3001.
- .Understanding cultural difference in caring for dying patients.West J Med.1995;163(3):244–249.
- ,,.Cultural considerations of death and dying in the United States.Clin Geriatr Med.1996;12(2):393–405.
- ,.Palliative care in undergraduate medical education: status report and future directions.JAMA.1997;278(9):733–738.
- ,.Bridging cultural differences in medical practice: the case of discussing negative information with Navajo patients.J Gen Intern Med.2000;15(2):92–96.
- ,,.Barriers to optimum end‐of‐life care for minority patients.J Am Geriatr Soc.2002;50(1):182–190.
- ,,,.Strategies for culturally effective end‐of‐life care.Ann Intern Med.2002;136(9):673–679.
- ,,,,,.Treatment preferences and advance care planning at end of life: the role of ethnicity and spiritual coping in cancer patients.Ann Behav Med.2005;30(2):174–179.
- ,,,.Differences in end‐of‐life decision making among black and white ambulatory cancer patients.J Gen Intern Med.1996;11(11):651–656.
- ,, ,,.Racial and ethnic differences in end‐of‐life costs: why do minorities cost more than whites?Arch Intern Med.2009;169(5):493–501.
- ,,, et al.Exploring chronically ill seniors' attitudes about discussing death and postmortem medical procedures.J Am Geriatr Soc.2005;53(5):895–900.
- ,,, et al.A comparison of three indicators for identifying Mexican Americans in epidemiologic research: methodologic findings in the San Antonio Heart Study.Am J Epidemiol.1986;123:96–112.
- ,.Naturalistic Inquiry.Newbury Park CA:Sage;1985:199–202.
- ,,,.Voices of African American, Caucasian, and Hispanic surrogates on the burdens of end‐of‐life decision‐making.J Gen Intern Med2008;23:267–274.
- ,,.Cultural beliefs about a patient's right time to die.J Gen Intern Med.2009;24(11):1240–1247.
- .Information needs at the end of life: a content analysis of one person's story.J Med Libr Assoc.2004;92(1):78–82.
- ,.The promise of a good death.Lancet.1998;351(suppl 2):21–29.
- ,,, et al.In search of a good death: observations of patients, families, and providers.Ann Intern Med.2000;132(10):825–832.
- .Initiating end‐of‐life discussions with seriously ill patients: addressing the “elephant in the room.”JAMA.2000;284(19):2502–2507.
- ,,,,.Empathy and life support decisions in intensive care units.J Gen Intern Med.2008;23:1311–1317.
- ,.End‐of‐life conversations: evolving practice and theory.JAMA.2000;284(12):1573–1578.
- .A “good death” for whom? Quality of a spouse's death and psychological distress among older widowed persons.J Health Soc Behav.2003;44(2):215–232.
- ,,, et al.Abandonment at the end of life from patient, caregiver, nurse, and physician perspectives.Arch Intern Med.2009;169(5):474–479.
- ,,.Death is just not what it used to be.Cambr Q Healthc Ethics.2010;19:7–16.
- ,,.Ethics of practicing medical procedures on newly dead and nearly dead patients.J Gen Intern Med.2002;17:774–778.
- .The art of dying well.Hast Cen Rep.2010:40(6):22–24.
Every health professional bears responsibility at some point for helping dying patients and their survivors face death spiritually and emotionally. But, because most Americans die in hospitals, that responsibility falls disproportionately to hospitalists and other hospital‐based health professionals.
Personal beliefs about what happens at death surely influence whether patients welcome or dread it, and whether survivors remember it with relief or regret.1 We believe, therefore, that competent, compassionate end‐of‐life care requires hospitalists and other health professionals who attend dying patients to address such beliefs. But people do not readily volunteer them, health professionals rarely elicit them, and little research describes them.
We, therefore, performed a large exploratory study to begin characterizing patients' beliefs about what happens at the time of death. We assumed that culturethe values a group uses to interpret shared experiences and transmits across generations2, 3influences those beliefs.1, 410 We reasoned that, because death is a universal human experience, every culture must address its meaning.5 Prior studies showing ethnic cultural differences over advance care planning, life support, and other aspects of dying further supported our assumption.3, 8, 1012
Our interview study revealed occasional beliefs that may characterize Americans in general, some beliefs that may characterize only certain ethnic groups or genders, and many beliefs that may characterize only particular individuals.
METHODS
We constructed a semistructured interview, based on topics and questions from the end‐of‐life literature and our own encounters with dying patients and their survivors. The interview schedule covered topics such as the right time to die, what happens at death, and the afterlife. We pretested all questions before using them in interviews.
Study participants were older inpatients from the 3 largest American ethnic groupsMexican Americans (MAs), Euro‐Americans (EAs), and African Americans (AAs),13 as identified by a validated ethnic algorithm.14 We reasoned that age, current serious (though not necessarily terminal) illness, and having experienced the deaths of others had already prompted these older inpatients to think about death.11
Admission logs from 2 San Antonio, Texas, hospitals identified all patients, aged 50 to 79, who were admitted over a 9‐month period for any of 10 common internal medicine diagnoses. From these logs we selected interviewees by purposive sampling, a nonstatistical technique that ensured adequate participant numbers by ethnic group and gender.15, 16 We invited patients to interview only after their primary physicians gave permission.
Sixty of 65 participants who began interviews completed them, and 58 of the 60 could be classified into 1 of the 3 ethnic groups.14 These 58, who produced saturation for all themes mentioned by more than 5% of participants, constituted our analysis sample. Participants included 26 MAs (14 men, 12 women), 18 EAs (7 men, 11 women), and 14 AAs (7 men, 7 women). The most prevalent admitting diagnoses were congestive heart failure (19 participants), angina (17 participants), and pneumonia and chronic obstructive pulmonary disease (5 participants each). The 3 ethnic group samples had similar mean ages but differed in other ways (Table 1). MAs were typically Roman Catholic, educated through grade 7, and married; EAs were divided between Roman Catholic and Protestant, educated through grade 12, and mostly unmarried; and AAs were nearly all Protestant, educated through grade 11, and mostly unmarried. The genders within each ethnic group sample were similar by age, religion, and education (data not shown). AA men and women were also similar by marital status. However, MAs and EAs had more men than women who were married, and more women than men who were widowed.
| Characteristics | Mexican Americans (26 Total: 14 Men, 12 Women) | Euro‐Americans (18 Total: 7 Men, 11 Women) | African Americans (14 Total: 7 Men, 7 Women) |
|---|---|---|---|
| Age (years) | |||
| Mean | 63 | 63 | 59 |
| Standard deviation | 8.5 | 8.4 | 5.8 |
| Religion, % | |||
| Roman Catholic | 77 | 39 | 0 |
| Protestant | 15 | 50 | 93 |
| Other | 8 | 11 | 7 |
| Education (years) | |||
| Median | 7 | 12 | 11 |
| Interquartile range | 311 | 1012 | 1012 |
| Currently married, % | 58 | 33 | 29 |
Two trained, bilingual women1 MA and 1 EA, not specifically matched to participants by ethnic groupused the schedule of questions to interview participants. The interviews usually took place 3 days after admission, involved one‐on‐one engagement in participants' hospital rooms, were audiotaped, and lasted roughly 90 minutes. Most questions were open‐ended, allowing participants to express beliefs in their own words. For example, the open‐ended question, What do you think happens at the end of a person's life? introduced the topic covered here. To help focus responses, interviewers asked participants early on to name the closest person to them to have died. Interviewers then encouraged participants to describe their beliefs specifically in terms of that person's death. (We assumed the closeness of the relationships had kept those deaths vivid for participants even years afterward.) Most participants responded by referring to that person, but a few described their own death‐like experiences or their general beliefs about death. Interviewers probed as necessary to clarify responses.
Participants interviewed in Spanish or English as they preferred. Two MAs interviewed entirely in Spanish, 10 MAs interviewed partly in Spanish and partly in English, and all other participants interviewed entirely in English. Bilingual typists transcribed the audiotapes, translating any Spanish into English. Two bilingual experts independently confirmed the accuracy of the translations.
The coders who content‐analyzed responses varied by ethnic group, gender, and professional training. They conducted their analysis in 4 steps, each involving initial, independent, blinded reviews by 2 coders; comparison of interpretations; and consensual resolution of disagreements. First, 2 coders deleted any comments irrelevant to death or dying. Second, the same coders assembled the remaining passages by topic, such as beliefs about what happens at the time of death. Third, 1 original coder and a senior investigator naive to the responses identified themes within each topic. Fourth, that original coder and either of 2 new coders determined for each interview the presence or absence of each theme. Theme presence required agreement between the original coder and the new coder or, when they differed, agreement between one of these coders and an independent adjudicator. Lastly, the 3 authors aggregated themes into meaningful categories by consensus, and checked these categories for trustworthiness against participants' original comments.
We report the results for each theme primarily as the percentages of participants within these ethnic group or gender samples who mentioned the theme. Though content analyses are usually reported qualitatively, percentages have 2 advantages here.17 First, readers can see the percentages and judge for themselves the important similarities, differences, and patterns in the data. Second, percentages enable researchers to formulate their own questions for further study, say, questions based on the largest percentages or largest percentage differences in the data. We also report representative quotes to illustrate the depth and richness of participant responses.
The study complied with all institutional review board requirements.
RESULTS
Most participants in all 3 ethnic group samples named a parent as the closest person to them to have died (Table 2). Among these participants, MAs named their mothers overwhelmingly, but EAs and AAs named their mothers and fathers nearly equally. Other participants named siblings, children, other relatives, or friends. Of 13 widowed participants, only 4 named their spouses.
| Characteristic | Mexican Americans* (n = 26) | Euro‐ Americans* (n = 18) | African Americans* (n = 14) |
|---|---|---|---|
| |||
| Relationship of closest person to participant | |||
| Mother | 42 | 28 | 29 |
| Father | 12 | 22 | 29 |
| Spouse | 4 | 11 | 7 |
| Other | 42 | 39 | 36 |
| Closest person's death was | |||
| Momentary | 35 | 50 | 21 |
| Prolonged | 42 | 22 | 21 |
| Participant mentioned medical treatment that closest person received at time of death | 19 | 44 | 43 |
| Participant believed medical treatment caused closest person to suffer at time of death | 0 | 6 | 29 |
Thirty‐nine participants20 MAs, 13 EAs, and 6 AAsdescribed the closest person's time of death as either momentary (typically less than a minute) or prolonged (longer than a few minutes). More EAs described it as momentary than as prolonged (50% vs 22%). One EA woman said, We were right outside [the hospital room when my father suffered his cardiac arrest]. We knew, when the alarm went off on the heart monitor, it was the last time we'd see him alive. In contrast, MAs and AAs split roughly equally between describing death as momentary or as prolonged (MAs: 35% and 42%, respectively; AAs: 21% for both).
The ethnic group samples also differed about harm from treatments the closest person had received when dying. Of participants who specified such treatments, disproportionately more AAs (4 of 6) than MAs (0 of 5) or EAs (1 of 8) said those treatments had caused the person to suffer at the time of death. Recalling the prolonged resuscitation efforts on his father, one AA man said that the doctors were trying to keep him alive I said, Don't put his body through that.
Many participants went on to describe their beliefs about what happens at the time of death, about the physiologic signs that define that time, and about the senses that persist after death.
Beliefs about What Happens at the Time of Death
Because words embody meaning, the synonyms used for death, dying, or dead give clues to people's beliefs about what happens at death.18 Fifty‐three participants (91%) used such synonyms.
Reflecting a sense of separation, the most prevalent synonyms implied movement of the dead away from this life and the living (Table 3). Forty‐six participants (79%) used one of these synonyms. Two, goes and leaves, definitely implied movement but not necessarily due to an external force (theme 3A). Thirty‐two participants (55%)including majorities of all 3 ethnic group samples (range, 54%‐57%) and of 5 of 6 gender subsamples (range, 55%‐64%, except for 42% for MA women)used at least one of these terms. An EA man, for example, described death as leav[ing] this life, and go[ing] to the next. Other synonyms, variations on passes (theme 3B), may have also implied movement. Large minorities of all ethnic group samples (range, 38%‐44%) and gender subsamples (range, 29%‐50%) used at least one of these terms. As an MA woman said, [W]e are born, and we die. [We] stay here a while, [and then] pass through to the other side. Still other synonyms, variations on taken (theme 3C), definitely implied that an external force actively removes the dead from this life. Notably more MAs than EAs or AAs used one of these terms (35% vs 6%, and 21%, respectively). All participants who did attributed the external force to God or Jesus. We're here on borrowed time, one MA man explained. When God tells you [that] you gotta leave [t]hat's when you die. He is going to take your soul.
| The Dying Person | Group | Mexican Americans (26 Total: 14 Men, 12 Women) (%)* | Euro‐Americans (18 Total: 7 Men, 11 Women) (%)* | African Americans (14 Total: 7 Men, 7 Women) (%)* |
|---|---|---|---|---|
| ||||
| A. Goes or leaves | ||||
| All participants | 54 | 56 | 57 | |
| Men alone | 64 | 57 | 57 | |
| Women alone | 42 | 55 | 57 | |
| B. Passes on or away | ||||
| All participants | 38 | 44 | 43 | |
| Men alone | 29 | 43 | 43 | |
| Women alone | 50 | 45 | 43 | |
| C. Is taken | ||||
| All participants | 35 | 6 | 21 | |
| Men alone | 43 | 0 | 14 | |
| Women alone | 25 | 9 | 29 | |
Less prevalent synonyms for death carried no implication of movement and fell into 2 groups. One group included terms such as sleeping or resting that implied relief from life's struggles. Modest minorities of all ethnic group samples (range, 14%‐19%) and of 5 of the 6 gender subsamples (range, 17%‐29%, except for 0% for AA women) used such terms. Recalling his sister's death after a long illness, one MA man said, [H]er soul went to heaven, and she's resting. The second group included terms about being lost to the living. Modest minorities of MAs and EAs (15% and 11%, respectively), but no AAs, used these terms. One MA woman remembered her daughter's death in childbirth, saying, Her death took part of my life away [but] my grandson lost his mother.
Beliefs about the Physiologic Signs That Define the Time of Death
Twenty‐three participants (40%) specified physiologic signs they believed define this time (Table 4). Nineteen participants did so referring to hospital deaths; 4 participants, to home deaths. More EAs than MAs or AAs specified at least one such sign (67% vs 23% and 36%, respectively).
| Signs | Group | Mexican Americans (26 Total: 14 Men, 12 Women) (%)* | Euro‐Americans (18 Total: 7 Men, 11 Women) (%)* | African Americans (14 Total: 7 Men, 7 Women) (%)* |
|---|---|---|---|---|
| ||||
| Any sign mentioned | ||||
| All participants | 23 | 67 | 36 | |
| Men alone | 36 | 57 | 29 | |
| Women alone | 8 | 73 | 43 | |
| Specific signs mentioned | ||||
| A. Cessation of breathing | ||||
| All participants | 8 | 17 | 21 | |
| Men alone | 7 | 0 | 0 | |
| Women alone | 8 | 27 | 43 | |
| B. Cessation of heartbeat | ||||
| All participants | 8 | 22 | 7 | |
| Men alone | 14 | 14 | 14 | |
| Women alone | 0 | 27 | 0 | |
| C. Cooling of the body | ||||
| All participants | 12 | 17 | 0 | |
| Men alone | 21 | 0 | 0 | |
| Women alone | 0 | 27 | 0 | |
| D. Other signs mentioned | ||||
| All participants | 8 | 22 | 14 | |
| Men alone | 14 | 43 | 29 | |
| Women alone | 0 | 9 | 0 | |
Seventeen of the 23 participants cited only one sign each as defining the time of death; the other 6 participants cited multiple signs. Overall, 8 physiologic signs were cited, but none predominated in any ethnic or gender group. The most common signs were cessation of breathing (theme 4A, 8 participants), cessation of heartbeat (theme 4B, 7 participants), and cooling of the body (theme 4C, 6 participants). Illustrating these signs in order, one AA woman said, Once that breath is going out of the body [a person's] already dead; an MA man said, My mother died [as] her heart monitor kept going down little by little; and an EA woman explained, I didn't feel the coldness of [my dead mother in the coffin] she didn't belong there I felt like she was asleep. I was telling her to get up. Interestingly, no AAs cited cooling of the body as a sign defining the time of death. Furthermore, only 4 participants, all of whom described in‐hospital deaths, cited coma or other severe brain dysfunction as such a sign.
Beliefs about Senses Persisting after Death
Of the 29 participants (50%) who expressed opinions on this topic (Table 5), 17 said the senses definitely or possibly persist after death (theme 5A), and 12 said they definitely do not (theme 5B). Prevalences of these contrasting beliefs differed little within ethnic group or gender samples with one exception: More EA women said the senses definitely or possibly persist after death than said they do not (45% vs 9%).
| Do the Senses Persist after Death?* | Group | Mexican Americans (26 Total: 14 Men, 12 Women) (%) | Euro‐Americans (18 Total; 7 Men, 11 Women) (%) | African Americans (14 Total: 7 Men, 7 Women) (%) |
|---|---|---|---|---|
| ||||
| A. Definitely yes or possibly | ||||
| All participants | 31 | 33 | 21 | |
| Men alone | 36 | 14 | 29 | |
| Women alone | 25 | 45 | 14 | |
| B. Definitely no | ||||
| All participants | 23 | 11 | 29 | |
| Men alone | 21 | 14 | 43 | |
| Women alone | 25 | 9 | 14 | |
The senses mentioned most often as persisting after death were sight (8 participants), hearing (7 participants), and touch (7 participants). Only 1 participant mentioned smell, and none mentioned taste. Some participants associated persistent senses with the dead person's spirit; other participants associated them with the body. All who mentioned sight associated it with the spirit. As one MA woman explained, at death the soul is not in the body but lingers above [watching] to see how the family takes [the death]. Among those who mentioned hearing, more associated it with the spirit than with the body. Associating hearing with the spirit, one MA man said, [W]hen I had my aneurysm I died three times I could hear music that had never been heard. It wasn't in the room like somebody was calling me. In contrast, an AA man insisted his dead father's body could hear you. Unlike either sight or hearing, touch was associated more often with the body than with the spirit. When asked about practicing invasive procedures on the cadaver, an EA man exclaimed, [If the doctors] hurt the guy that's dead, he ain't going to holler. They wouldn't know they hurt him. [They're] liable to get back too far and hit the bone.
The large percentages of both Protestants and Roman Catholics among MAs and EAs allowed us to check religion as a potential alternative explanation for differences between ethnic groups. We found only one possible instance: In both ethnic group samples, about 50% of Protestants but only about 15% of Roman Catholics described death as momentary.
DISCUSSION
Beliefs about what happens at death surely affect the whole dying experience1 and may help guide end‐of‐life care. Yet for all the research on dying, the health professions literatures contain virtually no studies describing such beliefs.19 This exploratory study begins the descriptive process.
The results suggest a taxonomyhowever provisionalfor those beliefs (Table 6). Occasional beliefs, such as the one that death separates the dead from the living, may be held by many Americans and thereby characterize American society in general. Other beliefs may characterize only particular American ethnic groups or genders. Ethnically based beliefs may include, for MAs, the belief that death occurs when an external force, specifically God or Jesus, takes the dead person away; for EAs, the beliefs that death occurs in less than a minute and that physiologic signs define the time of death; and, for AAs, the belief that cooling of the body never defines the time of death. A gender‐based belief may be the belief of EA women that some senses persist after death. Still other beliefs may be idiosyncratic, varying among individuals without a demographic pattern. Idiosyncratic beliefs may include which particular physiologic sign defines the time of death.
| Level | Example(s) of Beliefs | Highest Prevalence Group(s) |
|---|---|---|
| Society‐wide | Death separates the dead from the living. | Americans in general |
| Particular ethnic groups | Death occurs when an external powerspecifically God or Jesustakes the dead person away. | Mexican Americans |
| Death occurs in less than a minute. | Euro‐Americans | |
| Physiologic signs define the time of death. | Euro‐Americans | |
| Cooling of the body never define the time of death. | African Americans | |
| Particular gender subgroups | Some senses persist after death. | Euro‐American women |
| Individuals | Which particular physiologic sign defines the time of death. | Idiosyncratic, no demographic pattern |
The reader must consider these results in light of the study's assumptions, weaknesses, and strengths. Two assumptions were key: that participants expressed themselves fully (despite the difficulty of articulating such beliefs), and that the content analysts interpreted them accurately. Study weaknesses included possible conditioning of responses through prior interview questions, incomplete responsiveness about certain themes, nongeneralizability beyond these sample groups due to the purposive sampling, and educational and marital status differences as possible alternative explanations for the results. Important study strengths included the clinically important topic; the ill, older participants who had already faced death for themselves or others; the pretested, bilingual interview schedule; the open‐ended questions allowing participants to express beliefs in their own words; and the rigorous content analysis.
While indicating directions for future research, our results also provide several useful lessons for current end‐of‐life care. First, hospitalists and other health professionals who attend the dying must not assume they can accurately predict the beliefs of patients or survivors about what happens at the time of death. Many beliefs that participants expressed here neither we nor the health professionals to whom we have presented the results could have imagined beforehand. Health professionals simply cannot expect patients and survivors to hold the same beliefs as they. Furthermore, while some beliefs may characterize certain demographic groups in general, large idiosyncratic variation within groups compromises many demographically based predictions of particular individuals' beliefs. Thus, health professionals can probably learn such beliefs only by eliciting them individual by individual.18 Admittedly awkward, the necessary inquiries6, 20, 21 demand courage and patience, but, when done well, may help prepare all for the death.
Second, these inquiries require health professionals to cultivate techniques for eliciting people's beliefs sensitively and accurately.18 For example, health professionals might ask questions using the same terms for death (such as goes, passes, or rests) that the patient or survivors use. This technique encourages open expression of beliefs by assuring people that health professionals are listening carefully. Still, professionals must guard against misunderstandings that such terms may createparticularly by giving false hope or ignoring sad realities.
Third, armed with knowledge of patient and survivor beliefs, health professionals should tailor perimortem care accordingly. For example, because many people suffer pangs of separation at a death, health professionals should address those feelings expressly.22 Doing so may promote closure for the grieving.20, 2325 Health professionals should also attend to beliefs such as those about the signs and duration of the time of death. As this study showed, different people may time death by different physiologic signs. The patient with a warm body but no heartbeat may be simultaneously alive to someone who sees cooling of the body as defining the time of death, and dead to someone else who sees cessation of heartbeat as doing so.18, 26 Unfortunately, certain perimortem procedures, such as harvesting organs for transplantation, moving the body to the morgue, or performing an autopsy, require declaring death unambiguously at one specific time. When differences may exist over the signs or duration of death, the best way to avoid agonizing arguments or decisional paralysis when death occurs is to articulate any differences beforehand and to resolve them with a mutually acceptable management plan.27 Health professionals should also honor survivor beliefs about sentience of the dead. Unlike differences over signs and duration of death, differences over sentience of the dead may often be accommodated without definitive resolution. For example, although health professionals should treat any body respectfully, they must make special efforts to handle the dead body gently in case survivors believe it can still feel pain.
CONCLUSION
A patient's death is a climactic event for patient, survivors, and health professionals alike. It warrants careful management. Personal beliefs about what happens at death surely affect how patients anticipate it and what survivors remember of it. Compassionate perimortem care, therefore, must address those beliefs.28
Yet demographic characteristics such as ethnic group or gender offer only limited clues to such beliefs, making health professionals elicit them directly.4, 6, 9, 21 Discussions with patients and survivors about these beliefs are bound to create emotional discomfort for everybody, but health professionals may dispel much of it by demonstrating a sincere commitment to personalized end‐of‐life care, showing respect for the beliefs of patients and survivors,7, 21, 23 and accommodating those beliefs whenever possible.2, 28 The result may be the best of all possible outcomessensitive, respectful, and compassionate care for patients and survivors, and rewarding caregiving experiences for health professionals.20, 24, 25
Acknowledgements
Charles Cavazos provided computer support, and Susan Bagby helped edit the manuscript.
Every health professional bears responsibility at some point for helping dying patients and their survivors face death spiritually and emotionally. But, because most Americans die in hospitals, that responsibility falls disproportionately to hospitalists and other hospital‐based health professionals.
Personal beliefs about what happens at death surely influence whether patients welcome or dread it, and whether survivors remember it with relief or regret.1 We believe, therefore, that competent, compassionate end‐of‐life care requires hospitalists and other health professionals who attend dying patients to address such beliefs. But people do not readily volunteer them, health professionals rarely elicit them, and little research describes them.
We, therefore, performed a large exploratory study to begin characterizing patients' beliefs about what happens at the time of death. We assumed that culturethe values a group uses to interpret shared experiences and transmits across generations2, 3influences those beliefs.1, 410 We reasoned that, because death is a universal human experience, every culture must address its meaning.5 Prior studies showing ethnic cultural differences over advance care planning, life support, and other aspects of dying further supported our assumption.3, 8, 1012
Our interview study revealed occasional beliefs that may characterize Americans in general, some beliefs that may characterize only certain ethnic groups or genders, and many beliefs that may characterize only particular individuals.
METHODS
We constructed a semistructured interview, based on topics and questions from the end‐of‐life literature and our own encounters with dying patients and their survivors. The interview schedule covered topics such as the right time to die, what happens at death, and the afterlife. We pretested all questions before using them in interviews.
Study participants were older inpatients from the 3 largest American ethnic groupsMexican Americans (MAs), Euro‐Americans (EAs), and African Americans (AAs),13 as identified by a validated ethnic algorithm.14 We reasoned that age, current serious (though not necessarily terminal) illness, and having experienced the deaths of others had already prompted these older inpatients to think about death.11
Admission logs from 2 San Antonio, Texas, hospitals identified all patients, aged 50 to 79, who were admitted over a 9‐month period for any of 10 common internal medicine diagnoses. From these logs we selected interviewees by purposive sampling, a nonstatistical technique that ensured adequate participant numbers by ethnic group and gender.15, 16 We invited patients to interview only after their primary physicians gave permission.
Sixty of 65 participants who began interviews completed them, and 58 of the 60 could be classified into 1 of the 3 ethnic groups.14 These 58, who produced saturation for all themes mentioned by more than 5% of participants, constituted our analysis sample. Participants included 26 MAs (14 men, 12 women), 18 EAs (7 men, 11 women), and 14 AAs (7 men, 7 women). The most prevalent admitting diagnoses were congestive heart failure (19 participants), angina (17 participants), and pneumonia and chronic obstructive pulmonary disease (5 participants each). The 3 ethnic group samples had similar mean ages but differed in other ways (Table 1). MAs were typically Roman Catholic, educated through grade 7, and married; EAs were divided between Roman Catholic and Protestant, educated through grade 12, and mostly unmarried; and AAs were nearly all Protestant, educated through grade 11, and mostly unmarried. The genders within each ethnic group sample were similar by age, religion, and education (data not shown). AA men and women were also similar by marital status. However, MAs and EAs had more men than women who were married, and more women than men who were widowed.
| Characteristics | Mexican Americans (26 Total: 14 Men, 12 Women) | Euro‐Americans (18 Total: 7 Men, 11 Women) | African Americans (14 Total: 7 Men, 7 Women) |
|---|---|---|---|
| Age (years) | |||
| Mean | 63 | 63 | 59 |
| Standard deviation | 8.5 | 8.4 | 5.8 |
| Religion, % | |||
| Roman Catholic | 77 | 39 | 0 |
| Protestant | 15 | 50 | 93 |
| Other | 8 | 11 | 7 |
| Education (years) | |||
| Median | 7 | 12 | 11 |
| Interquartile range | 311 | 1012 | 1012 |
| Currently married, % | 58 | 33 | 29 |
Two trained, bilingual women1 MA and 1 EA, not specifically matched to participants by ethnic groupused the schedule of questions to interview participants. The interviews usually took place 3 days after admission, involved one‐on‐one engagement in participants' hospital rooms, were audiotaped, and lasted roughly 90 minutes. Most questions were open‐ended, allowing participants to express beliefs in their own words. For example, the open‐ended question, What do you think happens at the end of a person's life? introduced the topic covered here. To help focus responses, interviewers asked participants early on to name the closest person to them to have died. Interviewers then encouraged participants to describe their beliefs specifically in terms of that person's death. (We assumed the closeness of the relationships had kept those deaths vivid for participants even years afterward.) Most participants responded by referring to that person, but a few described their own death‐like experiences or their general beliefs about death. Interviewers probed as necessary to clarify responses.
Participants interviewed in Spanish or English as they preferred. Two MAs interviewed entirely in Spanish, 10 MAs interviewed partly in Spanish and partly in English, and all other participants interviewed entirely in English. Bilingual typists transcribed the audiotapes, translating any Spanish into English. Two bilingual experts independently confirmed the accuracy of the translations.
The coders who content‐analyzed responses varied by ethnic group, gender, and professional training. They conducted their analysis in 4 steps, each involving initial, independent, blinded reviews by 2 coders; comparison of interpretations; and consensual resolution of disagreements. First, 2 coders deleted any comments irrelevant to death or dying. Second, the same coders assembled the remaining passages by topic, such as beliefs about what happens at the time of death. Third, 1 original coder and a senior investigator naive to the responses identified themes within each topic. Fourth, that original coder and either of 2 new coders determined for each interview the presence or absence of each theme. Theme presence required agreement between the original coder and the new coder or, when they differed, agreement between one of these coders and an independent adjudicator. Lastly, the 3 authors aggregated themes into meaningful categories by consensus, and checked these categories for trustworthiness against participants' original comments.
We report the results for each theme primarily as the percentages of participants within these ethnic group or gender samples who mentioned the theme. Though content analyses are usually reported qualitatively, percentages have 2 advantages here.17 First, readers can see the percentages and judge for themselves the important similarities, differences, and patterns in the data. Second, percentages enable researchers to formulate their own questions for further study, say, questions based on the largest percentages or largest percentage differences in the data. We also report representative quotes to illustrate the depth and richness of participant responses.
The study complied with all institutional review board requirements.
RESULTS
Most participants in all 3 ethnic group samples named a parent as the closest person to them to have died (Table 2). Among these participants, MAs named their mothers overwhelmingly, but EAs and AAs named their mothers and fathers nearly equally. Other participants named siblings, children, other relatives, or friends. Of 13 widowed participants, only 4 named their spouses.
| Characteristic | Mexican Americans* (n = 26) | Euro‐ Americans* (n = 18) | African Americans* (n = 14) |
|---|---|---|---|
| |||
| Relationship of closest person to participant | |||
| Mother | 42 | 28 | 29 |
| Father | 12 | 22 | 29 |
| Spouse | 4 | 11 | 7 |
| Other | 42 | 39 | 36 |
| Closest person's death was | |||
| Momentary | 35 | 50 | 21 |
| Prolonged | 42 | 22 | 21 |
| Participant mentioned medical treatment that closest person received at time of death | 19 | 44 | 43 |
| Participant believed medical treatment caused closest person to suffer at time of death | 0 | 6 | 29 |
Thirty‐nine participants20 MAs, 13 EAs, and 6 AAsdescribed the closest person's time of death as either momentary (typically less than a minute) or prolonged (longer than a few minutes). More EAs described it as momentary than as prolonged (50% vs 22%). One EA woman said, We were right outside [the hospital room when my father suffered his cardiac arrest]. We knew, when the alarm went off on the heart monitor, it was the last time we'd see him alive. In contrast, MAs and AAs split roughly equally between describing death as momentary or as prolonged (MAs: 35% and 42%, respectively; AAs: 21% for both).
The ethnic group samples also differed about harm from treatments the closest person had received when dying. Of participants who specified such treatments, disproportionately more AAs (4 of 6) than MAs (0 of 5) or EAs (1 of 8) said those treatments had caused the person to suffer at the time of death. Recalling the prolonged resuscitation efforts on his father, one AA man said that the doctors were trying to keep him alive I said, Don't put his body through that.
Many participants went on to describe their beliefs about what happens at the time of death, about the physiologic signs that define that time, and about the senses that persist after death.
Beliefs about What Happens at the Time of Death
Because words embody meaning, the synonyms used for death, dying, or dead give clues to people's beliefs about what happens at death.18 Fifty‐three participants (91%) used such synonyms.
Reflecting a sense of separation, the most prevalent synonyms implied movement of the dead away from this life and the living (Table 3). Forty‐six participants (79%) used one of these synonyms. Two, goes and leaves, definitely implied movement but not necessarily due to an external force (theme 3A). Thirty‐two participants (55%)including majorities of all 3 ethnic group samples (range, 54%‐57%) and of 5 of 6 gender subsamples (range, 55%‐64%, except for 42% for MA women)used at least one of these terms. An EA man, for example, described death as leav[ing] this life, and go[ing] to the next. Other synonyms, variations on passes (theme 3B), may have also implied movement. Large minorities of all ethnic group samples (range, 38%‐44%) and gender subsamples (range, 29%‐50%) used at least one of these terms. As an MA woman said, [W]e are born, and we die. [We] stay here a while, [and then] pass through to the other side. Still other synonyms, variations on taken (theme 3C), definitely implied that an external force actively removes the dead from this life. Notably more MAs than EAs or AAs used one of these terms (35% vs 6%, and 21%, respectively). All participants who did attributed the external force to God or Jesus. We're here on borrowed time, one MA man explained. When God tells you [that] you gotta leave [t]hat's when you die. He is going to take your soul.
| The Dying Person | Group | Mexican Americans (26 Total: 14 Men, 12 Women) (%)* | Euro‐Americans (18 Total: 7 Men, 11 Women) (%)* | African Americans (14 Total: 7 Men, 7 Women) (%)* |
|---|---|---|---|---|
| ||||
| A. Goes or leaves | ||||
| All participants | 54 | 56 | 57 | |
| Men alone | 64 | 57 | 57 | |
| Women alone | 42 | 55 | 57 | |
| B. Passes on or away | ||||
| All participants | 38 | 44 | 43 | |
| Men alone | 29 | 43 | 43 | |
| Women alone | 50 | 45 | 43 | |
| C. Is taken | ||||
| All participants | 35 | 6 | 21 | |
| Men alone | 43 | 0 | 14 | |
| Women alone | 25 | 9 | 29 | |
Less prevalent synonyms for death carried no implication of movement and fell into 2 groups. One group included terms such as sleeping or resting that implied relief from life's struggles. Modest minorities of all ethnic group samples (range, 14%‐19%) and of 5 of the 6 gender subsamples (range, 17%‐29%, except for 0% for AA women) used such terms. Recalling his sister's death after a long illness, one MA man said, [H]er soul went to heaven, and she's resting. The second group included terms about being lost to the living. Modest minorities of MAs and EAs (15% and 11%, respectively), but no AAs, used these terms. One MA woman remembered her daughter's death in childbirth, saying, Her death took part of my life away [but] my grandson lost his mother.
Beliefs about the Physiologic Signs That Define the Time of Death
Twenty‐three participants (40%) specified physiologic signs they believed define this time (Table 4). Nineteen participants did so referring to hospital deaths; 4 participants, to home deaths. More EAs than MAs or AAs specified at least one such sign (67% vs 23% and 36%, respectively).
| Signs | Group | Mexican Americans (26 Total: 14 Men, 12 Women) (%)* | Euro‐Americans (18 Total: 7 Men, 11 Women) (%)* | African Americans (14 Total: 7 Men, 7 Women) (%)* |
|---|---|---|---|---|
| ||||
| Any sign mentioned | ||||
| All participants | 23 | 67 | 36 | |
| Men alone | 36 | 57 | 29 | |
| Women alone | 8 | 73 | 43 | |
| Specific signs mentioned | ||||
| A. Cessation of breathing | ||||
| All participants | 8 | 17 | 21 | |
| Men alone | 7 | 0 | 0 | |
| Women alone | 8 | 27 | 43 | |
| B. Cessation of heartbeat | ||||
| All participants | 8 | 22 | 7 | |
| Men alone | 14 | 14 | 14 | |
| Women alone | 0 | 27 | 0 | |
| C. Cooling of the body | ||||
| All participants | 12 | 17 | 0 | |
| Men alone | 21 | 0 | 0 | |
| Women alone | 0 | 27 | 0 | |
| D. Other signs mentioned | ||||
| All participants | 8 | 22 | 14 | |
| Men alone | 14 | 43 | 29 | |
| Women alone | 0 | 9 | 0 | |
Seventeen of the 23 participants cited only one sign each as defining the time of death; the other 6 participants cited multiple signs. Overall, 8 physiologic signs were cited, but none predominated in any ethnic or gender group. The most common signs were cessation of breathing (theme 4A, 8 participants), cessation of heartbeat (theme 4B, 7 participants), and cooling of the body (theme 4C, 6 participants). Illustrating these signs in order, one AA woman said, Once that breath is going out of the body [a person's] already dead; an MA man said, My mother died [as] her heart monitor kept going down little by little; and an EA woman explained, I didn't feel the coldness of [my dead mother in the coffin] she didn't belong there I felt like she was asleep. I was telling her to get up. Interestingly, no AAs cited cooling of the body as a sign defining the time of death. Furthermore, only 4 participants, all of whom described in‐hospital deaths, cited coma or other severe brain dysfunction as such a sign.
Beliefs about Senses Persisting after Death
Of the 29 participants (50%) who expressed opinions on this topic (Table 5), 17 said the senses definitely or possibly persist after death (theme 5A), and 12 said they definitely do not (theme 5B). Prevalences of these contrasting beliefs differed little within ethnic group or gender samples with one exception: More EA women said the senses definitely or possibly persist after death than said they do not (45% vs 9%).
| Do the Senses Persist after Death?* | Group | Mexican Americans (26 Total: 14 Men, 12 Women) (%) | Euro‐Americans (18 Total; 7 Men, 11 Women) (%) | African Americans (14 Total: 7 Men, 7 Women) (%) |
|---|---|---|---|---|
| ||||
| A. Definitely yes or possibly | ||||
| All participants | 31 | 33 | 21 | |
| Men alone | 36 | 14 | 29 | |
| Women alone | 25 | 45 | 14 | |
| B. Definitely no | ||||
| All participants | 23 | 11 | 29 | |
| Men alone | 21 | 14 | 43 | |
| Women alone | 25 | 9 | 14 | |
The senses mentioned most often as persisting after death were sight (8 participants), hearing (7 participants), and touch (7 participants). Only 1 participant mentioned smell, and none mentioned taste. Some participants associated persistent senses with the dead person's spirit; other participants associated them with the body. All who mentioned sight associated it with the spirit. As one MA woman explained, at death the soul is not in the body but lingers above [watching] to see how the family takes [the death]. Among those who mentioned hearing, more associated it with the spirit than with the body. Associating hearing with the spirit, one MA man said, [W]hen I had my aneurysm I died three times I could hear music that had never been heard. It wasn't in the room like somebody was calling me. In contrast, an AA man insisted his dead father's body could hear you. Unlike either sight or hearing, touch was associated more often with the body than with the spirit. When asked about practicing invasive procedures on the cadaver, an EA man exclaimed, [If the doctors] hurt the guy that's dead, he ain't going to holler. They wouldn't know they hurt him. [They're] liable to get back too far and hit the bone.
The large percentages of both Protestants and Roman Catholics among MAs and EAs allowed us to check religion as a potential alternative explanation for differences between ethnic groups. We found only one possible instance: In both ethnic group samples, about 50% of Protestants but only about 15% of Roman Catholics described death as momentary.
DISCUSSION
Beliefs about what happens at death surely affect the whole dying experience1 and may help guide end‐of‐life care. Yet for all the research on dying, the health professions literatures contain virtually no studies describing such beliefs.19 This exploratory study begins the descriptive process.
The results suggest a taxonomyhowever provisionalfor those beliefs (Table 6). Occasional beliefs, such as the one that death separates the dead from the living, may be held by many Americans and thereby characterize American society in general. Other beliefs may characterize only particular American ethnic groups or genders. Ethnically based beliefs may include, for MAs, the belief that death occurs when an external force, specifically God or Jesus, takes the dead person away; for EAs, the beliefs that death occurs in less than a minute and that physiologic signs define the time of death; and, for AAs, the belief that cooling of the body never defines the time of death. A gender‐based belief may be the belief of EA women that some senses persist after death. Still other beliefs may be idiosyncratic, varying among individuals without a demographic pattern. Idiosyncratic beliefs may include which particular physiologic sign defines the time of death.
| Level | Example(s) of Beliefs | Highest Prevalence Group(s) |
|---|---|---|
| Society‐wide | Death separates the dead from the living. | Americans in general |
| Particular ethnic groups | Death occurs when an external powerspecifically God or Jesustakes the dead person away. | Mexican Americans |
| Death occurs in less than a minute. | Euro‐Americans | |
| Physiologic signs define the time of death. | Euro‐Americans | |
| Cooling of the body never define the time of death. | African Americans | |
| Particular gender subgroups | Some senses persist after death. | Euro‐American women |
| Individuals | Which particular physiologic sign defines the time of death. | Idiosyncratic, no demographic pattern |
The reader must consider these results in light of the study's assumptions, weaknesses, and strengths. Two assumptions were key: that participants expressed themselves fully (despite the difficulty of articulating such beliefs), and that the content analysts interpreted them accurately. Study weaknesses included possible conditioning of responses through prior interview questions, incomplete responsiveness about certain themes, nongeneralizability beyond these sample groups due to the purposive sampling, and educational and marital status differences as possible alternative explanations for the results. Important study strengths included the clinically important topic; the ill, older participants who had already faced death for themselves or others; the pretested, bilingual interview schedule; the open‐ended questions allowing participants to express beliefs in their own words; and the rigorous content analysis.
While indicating directions for future research, our results also provide several useful lessons for current end‐of‐life care. First, hospitalists and other health professionals who attend the dying must not assume they can accurately predict the beliefs of patients or survivors about what happens at the time of death. Many beliefs that participants expressed here neither we nor the health professionals to whom we have presented the results could have imagined beforehand. Health professionals simply cannot expect patients and survivors to hold the same beliefs as they. Furthermore, while some beliefs may characterize certain demographic groups in general, large idiosyncratic variation within groups compromises many demographically based predictions of particular individuals' beliefs. Thus, health professionals can probably learn such beliefs only by eliciting them individual by individual.18 Admittedly awkward, the necessary inquiries6, 20, 21 demand courage and patience, but, when done well, may help prepare all for the death.
Second, these inquiries require health professionals to cultivate techniques for eliciting people's beliefs sensitively and accurately.18 For example, health professionals might ask questions using the same terms for death (such as goes, passes, or rests) that the patient or survivors use. This technique encourages open expression of beliefs by assuring people that health professionals are listening carefully. Still, professionals must guard against misunderstandings that such terms may createparticularly by giving false hope or ignoring sad realities.
Third, armed with knowledge of patient and survivor beliefs, health professionals should tailor perimortem care accordingly. For example, because many people suffer pangs of separation at a death, health professionals should address those feelings expressly.22 Doing so may promote closure for the grieving.20, 2325 Health professionals should also attend to beliefs such as those about the signs and duration of the time of death. As this study showed, different people may time death by different physiologic signs. The patient with a warm body but no heartbeat may be simultaneously alive to someone who sees cooling of the body as defining the time of death, and dead to someone else who sees cessation of heartbeat as doing so.18, 26 Unfortunately, certain perimortem procedures, such as harvesting organs for transplantation, moving the body to the morgue, or performing an autopsy, require declaring death unambiguously at one specific time. When differences may exist over the signs or duration of death, the best way to avoid agonizing arguments or decisional paralysis when death occurs is to articulate any differences beforehand and to resolve them with a mutually acceptable management plan.27 Health professionals should also honor survivor beliefs about sentience of the dead. Unlike differences over signs and duration of death, differences over sentience of the dead may often be accommodated without definitive resolution. For example, although health professionals should treat any body respectfully, they must make special efforts to handle the dead body gently in case survivors believe it can still feel pain.
CONCLUSION
A patient's death is a climactic event for patient, survivors, and health professionals alike. It warrants careful management. Personal beliefs about what happens at death surely affect how patients anticipate it and what survivors remember of it. Compassionate perimortem care, therefore, must address those beliefs.28
Yet demographic characteristics such as ethnic group or gender offer only limited clues to such beliefs, making health professionals elicit them directly.4, 6, 9, 21 Discussions with patients and survivors about these beliefs are bound to create emotional discomfort for everybody, but health professionals may dispel much of it by demonstrating a sincere commitment to personalized end‐of‐life care, showing respect for the beliefs of patients and survivors,7, 21, 23 and accommodating those beliefs whenever possible.2, 28 The result may be the best of all possible outcomessensitive, respectful, and compassionate care for patients and survivors, and rewarding caregiving experiences for health professionals.20, 24, 25
Acknowledgements
Charles Cavazos provided computer support, and Susan Bagby helped edit the manuscript.
- ,,.Communication strategies and cultural issues in the delivery of bad news.J Palliat Med.2007;10(4):958–977.
- ,,.Cross‐cultural considerations in clinical ethics consultations.Arch Fam Med.1995;4:159–164.
- ,.Negotiating cross‐cultural issues at the end of life: “You got to go where he lives.”JAMA.2001;286(23):2993–3001.
- .Understanding cultural difference in caring for dying patients.West J Med.1995;163(3):244–249.
- ,,.Cultural considerations of death and dying in the United States.Clin Geriatr Med.1996;12(2):393–405.
- ,.Palliative care in undergraduate medical education: status report and future directions.JAMA.1997;278(9):733–738.
- ,.Bridging cultural differences in medical practice: the case of discussing negative information with Navajo patients.J Gen Intern Med.2000;15(2):92–96.
- ,,.Barriers to optimum end‐of‐life care for minority patients.J Am Geriatr Soc.2002;50(1):182–190.
- ,,,.Strategies for culturally effective end‐of‐life care.Ann Intern Med.2002;136(9):673–679.
- ,,,,,.Treatment preferences and advance care planning at end of life: the role of ethnicity and spiritual coping in cancer patients.Ann Behav Med.2005;30(2):174–179.
- ,,,.Differences in end‐of‐life decision making among black and white ambulatory cancer patients.J Gen Intern Med.1996;11(11):651–656.
- ,, ,,.Racial and ethnic differences in end‐of‐life costs: why do minorities cost more than whites?Arch Intern Med.2009;169(5):493–501.
- ,,, et al.Exploring chronically ill seniors' attitudes about discussing death and postmortem medical procedures.J Am Geriatr Soc.2005;53(5):895–900.
- ,,, et al.A comparison of three indicators for identifying Mexican Americans in epidemiologic research: methodologic findings in the San Antonio Heart Study.Am J Epidemiol.1986;123:96–112.
- ,.Naturalistic Inquiry.Newbury Park CA:Sage;1985:199–202.
- ,,,.Voices of African American, Caucasian, and Hispanic surrogates on the burdens of end‐of‐life decision‐making.J Gen Intern Med2008;23:267–274.
- ,,.Cultural beliefs about a patient's right time to die.J Gen Intern Med.2009;24(11):1240–1247.
- .Information needs at the end of life: a content analysis of one person's story.J Med Libr Assoc.2004;92(1):78–82.
- ,.The promise of a good death.Lancet.1998;351(suppl 2):21–29.
- ,,, et al.In search of a good death: observations of patients, families, and providers.Ann Intern Med.2000;132(10):825–832.
- .Initiating end‐of‐life discussions with seriously ill patients: addressing the “elephant in the room.”JAMA.2000;284(19):2502–2507.
- ,,,,.Empathy and life support decisions in intensive care units.J Gen Intern Med.2008;23:1311–1317.
- ,.End‐of‐life conversations: evolving practice and theory.JAMA.2000;284(12):1573–1578.
- .A “good death” for whom? Quality of a spouse's death and psychological distress among older widowed persons.J Health Soc Behav.2003;44(2):215–232.
- ,,, et al.Abandonment at the end of life from patient, caregiver, nurse, and physician perspectives.Arch Intern Med.2009;169(5):474–479.
- ,,.Death is just not what it used to be.Cambr Q Healthc Ethics.2010;19:7–16.
- ,,.Ethics of practicing medical procedures on newly dead and nearly dead patients.J Gen Intern Med.2002;17:774–778.
- .The art of dying well.Hast Cen Rep.2010:40(6):22–24.
- ,,.Communication strategies and cultural issues in the delivery of bad news.J Palliat Med.2007;10(4):958–977.
- ,,.Cross‐cultural considerations in clinical ethics consultations.Arch Fam Med.1995;4:159–164.
- ,.Negotiating cross‐cultural issues at the end of life: “You got to go where he lives.”JAMA.2001;286(23):2993–3001.
- .Understanding cultural difference in caring for dying patients.West J Med.1995;163(3):244–249.
- ,,.Cultural considerations of death and dying in the United States.Clin Geriatr Med.1996;12(2):393–405.
- ,.Palliative care in undergraduate medical education: status report and future directions.JAMA.1997;278(9):733–738.
- ,.Bridging cultural differences in medical practice: the case of discussing negative information with Navajo patients.J Gen Intern Med.2000;15(2):92–96.
- ,,.Barriers to optimum end‐of‐life care for minority patients.J Am Geriatr Soc.2002;50(1):182–190.
- ,,,.Strategies for culturally effective end‐of‐life care.Ann Intern Med.2002;136(9):673–679.
- ,,,,,.Treatment preferences and advance care planning at end of life: the role of ethnicity and spiritual coping in cancer patients.Ann Behav Med.2005;30(2):174–179.
- ,,,.Differences in end‐of‐life decision making among black and white ambulatory cancer patients.J Gen Intern Med.1996;11(11):651–656.
- ,, ,,.Racial and ethnic differences in end‐of‐life costs: why do minorities cost more than whites?Arch Intern Med.2009;169(5):493–501.
- ,,, et al.Exploring chronically ill seniors' attitudes about discussing death and postmortem medical procedures.J Am Geriatr Soc.2005;53(5):895–900.
- ,,, et al.A comparison of three indicators for identifying Mexican Americans in epidemiologic research: methodologic findings in the San Antonio Heart Study.Am J Epidemiol.1986;123:96–112.
- ,.Naturalistic Inquiry.Newbury Park CA:Sage;1985:199–202.
- ,,,.Voices of African American, Caucasian, and Hispanic surrogates on the burdens of end‐of‐life decision‐making.J Gen Intern Med2008;23:267–274.
- ,,.Cultural beliefs about a patient's right time to die.J Gen Intern Med.2009;24(11):1240–1247.
- .Information needs at the end of life: a content analysis of one person's story.J Med Libr Assoc.2004;92(1):78–82.
- ,.The promise of a good death.Lancet.1998;351(suppl 2):21–29.
- ,,, et al.In search of a good death: observations of patients, families, and providers.Ann Intern Med.2000;132(10):825–832.
- .Initiating end‐of‐life discussions with seriously ill patients: addressing the “elephant in the room.”JAMA.2000;284(19):2502–2507.
- ,,,,.Empathy and life support decisions in intensive care units.J Gen Intern Med.2008;23:1311–1317.
- ,.End‐of‐life conversations: evolving practice and theory.JAMA.2000;284(12):1573–1578.
- .A “good death” for whom? Quality of a spouse's death and psychological distress among older widowed persons.J Health Soc Behav.2003;44(2):215–232.
- ,,, et al.Abandonment at the end of life from patient, caregiver, nurse, and physician perspectives.Arch Intern Med.2009;169(5):474–479.
- ,,.Death is just not what it used to be.Cambr Q Healthc Ethics.2010;19:7–16.
- ,,.Ethics of practicing medical procedures on newly dead and nearly dead patients.J Gen Intern Med.2002;17:774–778.
- .The art of dying well.Hast Cen Rep.2010:40(6):22–24.
Copyright © 2011 Society of Hospital Medicine
Helen P. Hazuda, Helen P. Hazuda, PhD, c/o Division of Clinical Epidemiology, Department of Medicine, The University of Texas Health Science Center, 7703 Floyd Curl Dr, San Antonio, TX 78229‐3900
Continuous Versus Intermittent Furosemide in ADHF
Acute decompensated heart failure (ADHF) is the most common cause of hospitalization among adults in the United States and is associated with high morbidity and mortality.1 The estimated direct and indirect cost of ADHF management in the United States was $40 billion in 2010.1 There are approximately 5.7 million patients with heart failure in the United States with an annual mortality rate of 300,000 deaths per year.2 The Healthcare Cost and Utilization Project reported 1.1 million hospital admissions, an average hospital stay of 5.5 days, and 4% in‐hospital mortality for patients with heart failure in 2004.3
Intravenous administration of loop diuretics is the mainstay of treatment of volume overload in patients hospitalized with ADHF.4 However, when administered as intermittent bolus injections, loop diuretics usually lead to rapid intravascular volume changes,5 significant electrolyte abnormalities,6, 7 renal dysfunction,8, 9 and undesired neurohormonal activity.10, 11 Compared with intermittent bolus injections, continuous infusion of loop diuretics may induce a more sustained and greater diuresis and fewer electrolyte abnormalities.1216 Several studies of limited duration have compared the effectiveness of the 2 routes of intravenous administration of loop diuretics; however, the results of these studies are contradictory.13, 14, 17, 18 In a meta‐analysis, Salvador et al19 compared the effectiveness of continuous infusion and intermittent bolus injections of loop diuretics. The authors reported greater diuresis (measured as 24‐hour urinary output) in patients receiving continuous infusion of loop diuretics. However, the meta‐analysis included studies that examined loop diuretics other than furosemide,20 allowed concomitant use of hypertonic saline infusions,21 and included patients with pulmonary edema from noncardiogenic causes.22
Furosemide is one of the most commonly used loop diuretics.23 The current literature lacks a systematic review and meta‐analysis comparing the effectiveness of continuous infusion and intermittent bolus furosemide therapy among nonsurgical, hemodynamically stable, hospitalized patients with ADHF. In addition, several important randomized trials published in recent years comparing the effectiveness of the 2 routes of intravenous furosemide delivery warrant17, 2427 systematic review, because the last published meta‐analysis (by Salvador et al19) was in 2005.
We therefore conducted a systematic review and meta‐analysis of randomized controlled trials that compared the effects of continuous infusion and intermittent bolus of furosemide in patients hospitalized with ADHF.
METHODS
Study Selection
We searched the PubMed, EMBASE, and The Cochrane Central Register of Controlled Trials electronic databases systematically from their inception through March 2011 using the search terms lasix, furosemide, diuretic, congestive heart failure, infusion, and bolus. The electronic database search was supplemented by hand‐searching bibliographies of the retrieved articles. Two investigators independently reviewed all retrieved articles for their eligibility based on predefined criteria. Disagreement on study selection was resolved by mutual consensus and by the involvement of a third investigator. All selected studies were assessed for content validity.
We included both crossover and parallel‐arm randomized control trials. Studies were included if patients were randomized to intermittent bolus or continuous infusion of furosemide, and data were reported on 24‐hour urinary volume, total body weight loss, 24‐hour urinary sodium excretion, and duration of hospital stay. Randomized control trials that included patients with cardiogenic shock requiring concomitant vasopressor therapy, renal failure with or without hemodialysis, and loop diuretics other than furosemide were excluded. The primary authors of the included studies were contacted if the results of the selected outcomes either were not reported or required further clarification. A flow diagram was produced following guidelines from The Quality of Reporting of Meta‐analyses (QUOROM) group28 to provide information on randomized clinical trial identification for the final inclusion in the meta‐analysis.
Data Extraction
Data on study design, participant characteristics, methods, intervention, and selected outcomes were independently extracted by 2 investigators. Interobserver agreement for full study selection was calculated using an unweighted kappa statistic. A chi‐square test (2) and I2 statistic were used to report the percentage of variability in the effect estimates across studies.
Quality Assessment
The quality of included trials was assessed using a validated scale developed by Jadad et al29 that assigns a score from 0 to 5, with a higher score indicating higher quality. Two investigators independently evaluated studies on 3 parameters: randomization, blinding, and dropouts. The third investigator helped resolve discordant assessments. We assessed publication bias visually by examining the symmetry of funnel plots and statistically using Begg30 and Egger31 tests.
Data Synthesis and Analysis
For the reported outcomes, we recorded the mean difference between the groups and measures of dispersion. If a mean difference was not reported, we calculated point estimates by using the mean difference from baseline for each group. If a mean difference from baseline was not reported, we calculated point estimates using the baseline and final value for each group. If a measure of dispersion was not reported for the between‐group difference, we calculated it by using the sum of the variance for the mean difference from baseline in each group. If no measure of dispersion was reported for the mean difference from baseline for each group, we calculated variance by using the standard deviation of the baseline and final values, and assumed a correlation between the baseline and final values of 0.5.
Urinary volume was measured in milliliters per 24 hours per 100 mg furosemide to compare the diuretic effect between the 2 routes of intravenous administration. Total body weight loss was measured in kilograms. Urinary sodium was measured in millimoles per 24 hours, and duration of hospital stay was measured in days.
Weighted mean differences (WMDs) with 95% confidence intervals (CIs) were calculated for all prespecified outcomes using Review Manager (RevMan) Version 5.0. Copenhagen: The Nordic Cochrane Centre, The Cochrane Collaboration, 2008. We pooled results from individual studies using a random‐effects model. Statistical significance was set at P 0.05 using a 2‐tailed Z‐test. Sensitivity analyses were conducted by omitting one study at a time for all outcomes.
RESULTS
Study Selection
We identified 104 studies using the previously stated search terms. Following QUOROM guidelines, ten randomized clinical trials, enrolling a total of 564 patients, fulfilled the inclusion criteria (Figure 1). The interobserver agreement (unweighted kappa statistic) between investigators for study selection was 0.75.

Study Characteristics
The majority of patients were male (60%) with a mean age of 62.8 years (range 54 ‐ 74.1 years). The duration of follow‐up while on furosemide in both arms ranged from twelve hours24 to six days13 (Table 1). We found significant variability in dose, frequency, and duration of treatment across studies for both routes of intravenous furosemide administration (Table 2). Four of 10 studies were crossover trials13, 14, 18, 32 and the rest were parallel‐arm trials. Randomization to 1 of the 2 treatment groups was reported in all 4 crossover trials.
| Study | Study Design* | Total (N) | Mean Age (years) | Male (n) | Duration on Furosemide (days) | Country of Study | NYHA Class | Jadad Quality Score |
|---|---|---|---|---|---|---|---|---|
| ||||||||
| Aaser et al18 | CO | 8 | 54 | 6 | 2 | Norway | III‐IV | 1 |
| Allen et al17 | PA | 41 | 61 | 26 | 2 | USA | NR | 3 |
| Dormans et al13 | CO | 20 | 71 | 13 | 6 | Netherlands | III‐IV | 1 |
| Felker et al27 | PA | 308 | 66 | 226 | 3 | USA | NR | 4 |
| Lahav et al14 | CO | 9 | 74.1 | 5 | 4 | Israel | III‐IV | 1 |
| Mojtahedzadeh et al33 | PA | 22 | NR | NR | 1.5 | Iran | NR | 2 |
| Mojtahedzadeh et al24 | PA | 21 | 56.5 | 11 | 0.5 | Iran | NR | 2 |
| Ostermann et al26 | PA | 59 | 64 | 31 | 2 | UK/Canada | NR | 3 |
| Pivac et al32 | CO | 20 | 62.2 | 9 | 3 | Croatia | III | 1 |
| Thomson et al25 | PA | 56 | 56.4 | 32 | 3.54.6 | USA | III‐IV | 3 |
| Study | Furosemide Dose (Mean SD) | Additional Comments | |
|---|---|---|---|
| Intermittent Bolus | Continuous Infusion | ||
| |||
| Aaser et al18 | 145 80 mg bid | 145 80 mg/24 hr | Furosemide dose was same as usual daily oral dose |
| Allen et al17 | 162 48 mg bid | 162 52 mg/24 hr | Dose was determined by attending physician after enrollement |
| Dormans et al13 | Single bolus of continous dose | 690 mg/8 hr (2502000 mg) | Patients received additional single oral doses of furosemide on first and second day |
| Felker et al27 | 134 53 mg/day | 127 50 mg/day | Treatment was continued for up to 72 hours; at 48 hours, the treating physician had the option of adjusting the diurtetic dose on the basis of clinical response |
| Lahav et al14 | 3040 mg/8 hr | 6080 mg/24 hr | Continuous group received 3040 mg bolus furosemide as loading dose |
| Mojtahedzadeh et al33 | 320 mg/dose | 0.75 mg/kg/hr | All patients received 20 mg of furosemide as initial bolus in both arms |
| Mojtahedzadeh et al24 | 20 mg initial, then doubled every 3 hr* | 0.1 mg/kg/hr (total 250 mg) | Both regimens were titrated for a goal net fluid balance of at least 1 mL/kg/hr |
| Ostermann et al26 | 0.65.14/kg/dose | 0.40.6 mg/kg/hr | Predefined alogrithms aiming for minimum hourly urine output was used in both arms |
| Pivac et al32 | 40 mg bid | 40 mg bid | Goal was to increase urine output to at least 50% from baseline or a minimum of 1 mL/kg/hr |
| Thomson et al25 | 172 97 mg | 197 148 mg/day | The mean duration of study drug administration was shorter by approximately 1 day in the continous group |
Outcomes
Data on 24‐hour urinary volume were reported in all 10 studies. We found that the continuous infusion of furosemide was associated with a statistically significant increase in 24‐hour urinary output compared with intermittent bolus injections (WMD, 240.54 mL/24 hours/100 mg furosemide; 95% CI, 462.42 to 18.66; P = 0.03). There was evidence of statistically significant heterogeneity between the studies for the outcome of 24‐hour urinary volume (I2 = 89%; 2 = 93.11; P 0.001) (Figure 2). The magnitude of statistical heterogeneity decreased (I2 = 53%; 2 = 19.11; P = 0.02) but remained significant after removing a study by Ostermann et al.26
Data on total body weight loss was reported in 3 parallel trials. Patients treated with a continuous infusion of furosemide had statistically greater changes in total body weight (WMD, 0.78 kg; 95% CI, 1.54 to 0.03; P = 0.04) when compared with patients receiving bolus injections of furosemide. Data for total body weight loss were collected at 72 hours of treatment in 2 trials17, 27 and was reported for the duration of the entire study by Thomson et al.25 There was no statistical evidence of heterogeneity between the studies for total body weight loss (I2 = 0 %; 2 = 0.66; P = 0.72) (Figure 3).
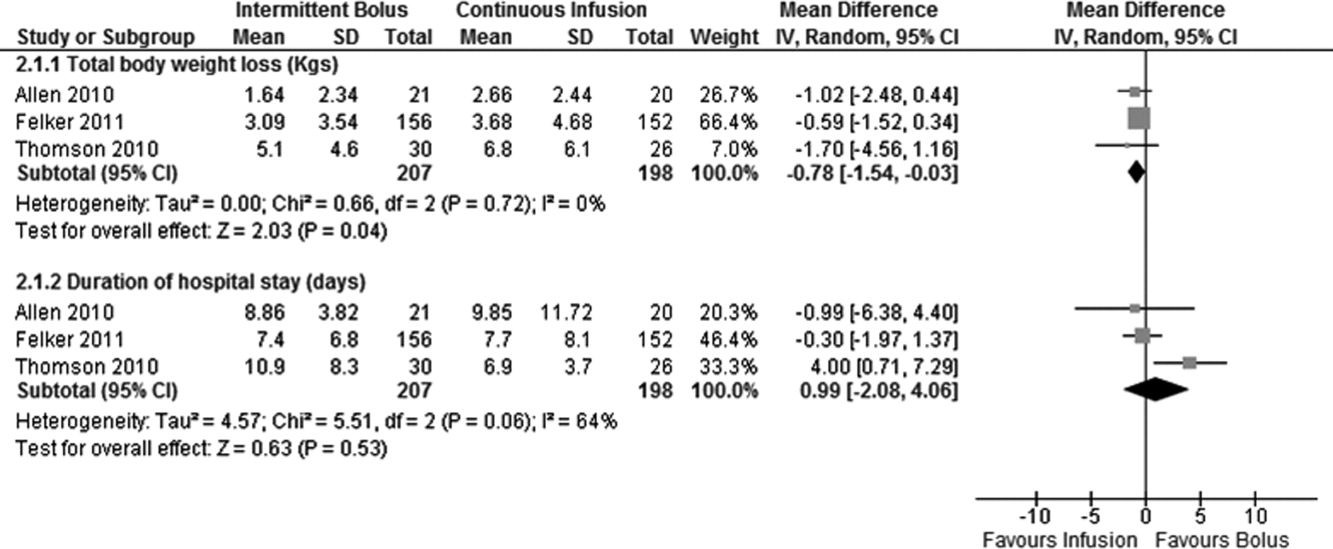
Data on 24‐hour urinary sodium excretion was reported for 57 patients in the 4 crossover studies. A continuous infusion of furosemide was associated with a statistically insignificant increase in 24‐hour urinary sodium (WMD, 20.26 mmol/24 hours; 95% CI, 60.48 to 19.96; P = 0.32). There was no statistical evidence of heterogeneity between studies for 24‐hour urinary sodium excretion (I2 = 0%; 2 = 2.76; P = 0.60) (Figure 2).
Duration of hospital stay was reported in 3 parallel trials. Patients receiving intermittent injections of bolus furosemide had longer hospital stays (WMD, 0.99 days; 95% CI, 2.08 to 4.06; P = 0.53), but this difference was not statistically significant. There was no evidence of heterogeneity between the studies for the duration of hospital stay (I2 = 64%; 2 = 5.51; P = 0.06) (Figure 3).
Risk of Bias and Sensitivity Analysis
Individual quality assessment scores based on a scoring system developed by Jadad et al29 for included trials are reported (Table 1). Randomization was reported by all studies, but the explicit methodology of randomization was defined in only 4 studies.17, 2527 Allocation concealment was defined in 1 study.26 Dropouts were reported in 4 studies.2426, 33 Adherence to intervention per study protocol was not reported in any of the selected studies. Three studies mentioned intention to treat.25, 26 Sensitivity analyses demonstrated that the direction of the mean estimates did not change for any of the 4 outcomes when individual studies were excluded.
DISCUSSION
Our meta‐analysis of 10 randomized, controlled clinical trials found that continuous infusion of furosemide results in significantly greater diuresis and reduction in total body weight than intermittent boluses in patients hospitalized with ADHF. No statistical differences were observed in urinary sodium excretion or the duration of hospital stay between the 2 routes of intravenous furosemide administration. The data on greater diuresis from the available clinical trials was widely heterogeneous that may limit the merits of assessment of greater diuresis between the 2 methods of intravenous furosemide administration. In addition, data on clinical outcomes such as rates of rehospitalization, cardiovascular, and all‐cause mortality were not reported in the studies selected for this meta‐analysis.
The mean effective dose of loop diuretics administered as intermittent boluses varies widely5 and quickly dissipates to a level that fails to block Na+ reabsorption in renal tubules.34 Additionally, the effectiveness of loop diuretics is limited by the rebound in sodium reabsorption during periods of subtherapeutic renal tubular concentration because of their short half‐life.4, 6, 35 It is possible that the ineffectiveness of subtherapeutic tubular filtrate levels of loop diuretics toward the end of a dosing interval when administered as a bolus is responsible for their unsustained diuretic effects. Bolus injections of furosemide have been associated with diuretic tolerance, reduced short‐term natriuresis, and a probable rise in plasma aldosterone levels in the settings of salt restriction.36 Data from physiological studies suggest that greater diuresis, which also results in weight loss with continuous infusion of loop diuretics, is due to the minimal variation in the mean effective dose of drug in the renal tubules.1216 By preventing subtherapeutic tubular dose concentrations, continuous infusion may limit rebound resorption helping to improve symptoms of ADHF.4
Our study has several limitations. First, we examined only surrogate endpoints. Second, we included crossover trials13, 14, 18, 32 in the analysis, and the variation in the washout periods of these trials may have affected the reported outcomes. The study by Aaser et al18 lacked a washout period because the authors were concerned for the hemodynamic stability of diuretic‐dependent ADHF patients. Lahav et al14 reported a washout period of 3 hours, while Dormans et al13 and Pivac et al32 did not report the duration of washout periods. Finally, we excluded studies that enrolled postsurgical patients and patients with pulmonary edema from noncardiac causes. As a result, the generalizability of our findings is limited to relatively stable ADHF patients hospitalized because of medical, dietary, or pharmacological noncompliance. We restricted our analysis to studies using furosemide therapy only. By excluding trials using loop diuretics other than furosemide and trials reporting concomitant use of vasopressors or hypertonic saline in the study population, we are confident in the assessment of the isolated effects of furosemide for either route of its intravenous administration in patients hospitalized with ADHF.
The continuous infusion of furosemide has been well tolerated in most instances.13, 2527, 32 Thomson et al25 found no difference on the incidence of significant hemodynamic changes or need for renal replacement therapy between the 2 groups. Similarly, Ostermann et al26 reported no significant differences in heart rate and mean arterial pressures changes from two treatment groups. In addition, Felker et al27 and Pivac et al32 found no differences in the proportion of serious adverse effects between the 2 routes of intravenous furosemide administration.
In the absence of information on clinical endpoints such as rehospitalization, all‐cause mortality, and cardiovascular mortality, this meta‐analysis could not settle the issue to provide definitive recommendations for treatment guidelines to use either route of intravenous furosemide in ADHF patients. However, it is important to note that despite different study populations, our finding of greater diuresis with continuous infusion of furosemide is consistent with results reported by Salvador et al.19 Given the higher prevalence, mortality, and significant cost related with ADHF management in the United States, we support the use of furosemide as a continuous infusion to ensure limited but established benefits, such as greater diuresis and reduction in total body weight,. This approach seems reasonable, especially when the safety profiles between the 2 treatment groups are not different.2527, 32 However, the benefits on surrogate outcomes cannot be overstressed due to lack of information on the cost‐effectiveness of furosemide or other loop diuretics administered as a continuous infusion.
CONCLUSIONS
We report a systematic review and meta‐analysis comparing the effectiveness of 2 routes of intravenous furosemide administration in patients with ADHF. We found that continuous infusion of furosemide results in greater diuresis and greater reduction in total body weight. With the exception of greater diuresis, available data are homogenous for the reported outcomes in this meta‐analysis. Due to lack of information on clinical endpoints and cost‐effectiveness from currently available data, robust recommendations for clinical practice guidelines cannot be made at this time. Randomized controlled trials measuring hard clinical endpoints in larger patient populations may add stronger evidence to settle this issue in future. Further studies comparing cost‐effectiveness related with continuous infusion of furosemide may provide critical information to establish it as the preferred route over intermittent bolus injection in clinical practice.
- ,,, et al.Heart disease and stroke statistics 2009 update: a report from the American Heart Association Statistics Committee and Stroke Statistics Subcommittee.Circulation.2009;119:e21–e181.
- National Heart, Lung, and Blood Institute. What Is Heart Failure? Available at: http://www.nhlbi.nih.gov/health/health‐topics/topics/hf/. Accessed March 6,2011.
- ,,. Hospital Stays for Circulatory Diseases, 2004. Healthcare Cost and Utilization Project Statistical Brief No. 26. Rockville, MD: Agency for Healthcare Research and Quality; February 2007. Available at: http://www.hcup‐us.ahrq.gov/reports/statbriefs/sb26.jsp. Accessed February 22,2010.
- ,,, et al.2009 focused update: ACCF/AHA Guidelines for the Diagnosis and Management of Heart Failure in Adults: a report of the American College of Cardiology Foundation/American Heart Association Task Force on Practice Guidelines: developed in collaboration with the International Society for Heart and Lung Transplantation.Circulation.2009;119:1977–2016.
- ,,,.Determinants of response to furosemide in normal subjects.Br J Clin Pharmacol.1977;4:121–127.
- .Diuretic therapy.N Engl J Med.1998;339:387–395.
- ,,,,.Diuretics and risk of arrhythmic death in patients with left ventricular dysfunction.Circulation.1999;100:1311–1315.
- ,,, et al.Increased toxicity of high dose furosemide versus low‐dose dopamine in the treatment of refractory congestive heart failure.Clin Pharmacol Ther.1997;62:187–193.
- ,,, et al.Relationship between heart failure treatment and development of worsening renal function among hospitalized patients.Am Heart J.2004;147:331–338.
- ,,,.Haemodynamic and hormone responses to acute and chronic furosemide therapy in congestive heart failure.Clin Sci.1980;59:443–449.
- ,,,,.Untreated heart failure: clinical and neuroendocrine effects of introducing diuretics.Br Heart J.1987;57:17–22.
- ,,.The time course of delivery of furosemide into urine: an independent determinant of overall response.Kidney Int.1982;22:69–74.
- ,,,,,.Diuretic efficacy of high dose furosemide in severe heart failure: bolus injection versus continuous infusion.J Am Coll Cardiol.1996;28:376–382.
- ,,,.Intermittent administration of furosemide vs continuous infusion preceded by a loading dose for congestive heart failure.Chest.1992;102:725–731.
- ,,,,.Diuresis with continuous infusion of furosemide after cardiac surgery.Am J Surg.1983;146:796.
- ,,,.Continuous infusion of furosemide in refractory edema.BMJ.1978;2:476.
- ,,,,,.Continuous versus bolus dosing of furosemide for patients hospitalized for heart failure.Am J Cardiol.2010;105:1794–1797.
- ,,, et al.Effect of bolus injection versus continuous infusion of furosemide on diuresis and neurohormonal activation in patients with severe congestive heart failure.Scand J Clin Lab Invest.1997;57:361–367.
- ,,,.Continuous infusion versus bolus injection of loop diuretics in congestive heart failure.Cochrane Database Syst Rev.2005;(3):CD003178.
- ,,, et al.Pharmacodynamics of torsemide administered as an intravenous injection and as a continuous infusion to patients with congestive heart failure.J Clin Pharmacol.1996;36:265–270.
- ,,, et al.Effects of high‐dose furosemide and small‐volume hypertonic saline solution infusion in comparison with a high dose of furosemide as bolus in refractory congestive heart failure: long‐term effects.Am Heart J.2003;145:459–466.
- ,,.Protocol‐ guided diuretic management: comparison of furosemide by continuous infusion and intermittent bolus.Crit Care Med.1997;25:1969–1975.
- Cardiovascular Pharmacology Concepts. Diuretics. Available at: http://www.cvpharmacology.com/diuretic/diuretics.htm. Accessed July 22,2010.
- ,,, et al.The relationship between pharmacokinetics variables and pharmacodynamics profiles of bolus versus continuous infusion of furosemide in critically ill patients.J Infus Nurs.2005;13:127–132.
- ,,,,,.Continuous versus intermittent infusion of furosemide in acute decompensated heart failure.J Card Fail.2010;16:188–193.
- ,,,.Frusemide administration in critically ill patients by continuous compared to bolus therapy.Nephron Clin Pract.2007;107:c70–c76.
- ,,, et al;NHLBI Heart Failure Clinical Research Network. Diuretic strategies in patients with acute decompensated heart failure.N Engl J Med.2011;364:797–805.
- ,,,,,.Improving the quality of reports of meta‐analyses of randomised controlled trials: the QUOROM statement. Quality of Reporting of Meta‐analyses.Lancet.1999;354:1896–1900.
- ,,, et al.Assessing the quality of reports of randomized clinical trials: is blinding necessary?Control Clin Trials.1996;17:1–12.
- ,.Operating characteristics of a rank correlation test for publication bias.Biometrics.1994;50:1088–1101.
- ,,,.Bias in meta‐analysis detected by a simple, graphical test.BMJ.1997;315:629–634.
- ,,, et al.Diuretic effects of furosemide infusion versus bolus injection in congestive heart failure.Int J Clin Pharmacol Res.1998;18:121–128.
- ,,, et al.Comparison of hemodynamic and biochemical effects of furosemide by continuous infusion and intermittent bolus in critically ill patients.Infus Nurs.2004;27:255–261.
- .Diuretic resistance: mechanisms and therapeutic strategies.Cardiology.1994;84(suppl 2):57–67.
- ,.Loop diuretics: from the Na‐K‐2Cl transporter to clinical use.Am J Physiol Renal Physiol.2003;284:F11–F21.
- ,,, et al.Response to furosemide. I. Effects of salt intake and renal compensation.J Lab Clin Med.1983;102:450–458.
Acute decompensated heart failure (ADHF) is the most common cause of hospitalization among adults in the United States and is associated with high morbidity and mortality.1 The estimated direct and indirect cost of ADHF management in the United States was $40 billion in 2010.1 There are approximately 5.7 million patients with heart failure in the United States with an annual mortality rate of 300,000 deaths per year.2 The Healthcare Cost and Utilization Project reported 1.1 million hospital admissions, an average hospital stay of 5.5 days, and 4% in‐hospital mortality for patients with heart failure in 2004.3
Intravenous administration of loop diuretics is the mainstay of treatment of volume overload in patients hospitalized with ADHF.4 However, when administered as intermittent bolus injections, loop diuretics usually lead to rapid intravascular volume changes,5 significant electrolyte abnormalities,6, 7 renal dysfunction,8, 9 and undesired neurohormonal activity.10, 11 Compared with intermittent bolus injections, continuous infusion of loop diuretics may induce a more sustained and greater diuresis and fewer electrolyte abnormalities.1216 Several studies of limited duration have compared the effectiveness of the 2 routes of intravenous administration of loop diuretics; however, the results of these studies are contradictory.13, 14, 17, 18 In a meta‐analysis, Salvador et al19 compared the effectiveness of continuous infusion and intermittent bolus injections of loop diuretics. The authors reported greater diuresis (measured as 24‐hour urinary output) in patients receiving continuous infusion of loop diuretics. However, the meta‐analysis included studies that examined loop diuretics other than furosemide,20 allowed concomitant use of hypertonic saline infusions,21 and included patients with pulmonary edema from noncardiogenic causes.22
Furosemide is one of the most commonly used loop diuretics.23 The current literature lacks a systematic review and meta‐analysis comparing the effectiveness of continuous infusion and intermittent bolus furosemide therapy among nonsurgical, hemodynamically stable, hospitalized patients with ADHF. In addition, several important randomized trials published in recent years comparing the effectiveness of the 2 routes of intravenous furosemide delivery warrant17, 2427 systematic review, because the last published meta‐analysis (by Salvador et al19) was in 2005.
We therefore conducted a systematic review and meta‐analysis of randomized controlled trials that compared the effects of continuous infusion and intermittent bolus of furosemide in patients hospitalized with ADHF.
METHODS
Study Selection
We searched the PubMed, EMBASE, and The Cochrane Central Register of Controlled Trials electronic databases systematically from their inception through March 2011 using the search terms lasix, furosemide, diuretic, congestive heart failure, infusion, and bolus. The electronic database search was supplemented by hand‐searching bibliographies of the retrieved articles. Two investigators independently reviewed all retrieved articles for their eligibility based on predefined criteria. Disagreement on study selection was resolved by mutual consensus and by the involvement of a third investigator. All selected studies were assessed for content validity.
We included both crossover and parallel‐arm randomized control trials. Studies were included if patients were randomized to intermittent bolus or continuous infusion of furosemide, and data were reported on 24‐hour urinary volume, total body weight loss, 24‐hour urinary sodium excretion, and duration of hospital stay. Randomized control trials that included patients with cardiogenic shock requiring concomitant vasopressor therapy, renal failure with or without hemodialysis, and loop diuretics other than furosemide were excluded. The primary authors of the included studies were contacted if the results of the selected outcomes either were not reported or required further clarification. A flow diagram was produced following guidelines from The Quality of Reporting of Meta‐analyses (QUOROM) group28 to provide information on randomized clinical trial identification for the final inclusion in the meta‐analysis.
Data Extraction
Data on study design, participant characteristics, methods, intervention, and selected outcomes were independently extracted by 2 investigators. Interobserver agreement for full study selection was calculated using an unweighted kappa statistic. A chi‐square test (2) and I2 statistic were used to report the percentage of variability in the effect estimates across studies.
Quality Assessment
The quality of included trials was assessed using a validated scale developed by Jadad et al29 that assigns a score from 0 to 5, with a higher score indicating higher quality. Two investigators independently evaluated studies on 3 parameters: randomization, blinding, and dropouts. The third investigator helped resolve discordant assessments. We assessed publication bias visually by examining the symmetry of funnel plots and statistically using Begg30 and Egger31 tests.
Data Synthesis and Analysis
For the reported outcomes, we recorded the mean difference between the groups and measures of dispersion. If a mean difference was not reported, we calculated point estimates by using the mean difference from baseline for each group. If a mean difference from baseline was not reported, we calculated point estimates using the baseline and final value for each group. If a measure of dispersion was not reported for the between‐group difference, we calculated it by using the sum of the variance for the mean difference from baseline in each group. If no measure of dispersion was reported for the mean difference from baseline for each group, we calculated variance by using the standard deviation of the baseline and final values, and assumed a correlation between the baseline and final values of 0.5.
Urinary volume was measured in milliliters per 24 hours per 100 mg furosemide to compare the diuretic effect between the 2 routes of intravenous administration. Total body weight loss was measured in kilograms. Urinary sodium was measured in millimoles per 24 hours, and duration of hospital stay was measured in days.
Weighted mean differences (WMDs) with 95% confidence intervals (CIs) were calculated for all prespecified outcomes using Review Manager (RevMan) Version 5.0. Copenhagen: The Nordic Cochrane Centre, The Cochrane Collaboration, 2008. We pooled results from individual studies using a random‐effects model. Statistical significance was set at P 0.05 using a 2‐tailed Z‐test. Sensitivity analyses were conducted by omitting one study at a time for all outcomes.
RESULTS
Study Selection
We identified 104 studies using the previously stated search terms. Following QUOROM guidelines, ten randomized clinical trials, enrolling a total of 564 patients, fulfilled the inclusion criteria (Figure 1). The interobserver agreement (unweighted kappa statistic) between investigators for study selection was 0.75.
Study Characteristics
The majority of patients were male (60%) with a mean age of 62.8 years (range 54 ‐ 74.1 years). The duration of follow‐up while on furosemide in both arms ranged from twelve hours24 to six days13 (Table 1). We found significant variability in dose, frequency, and duration of treatment across studies for both routes of intravenous furosemide administration (Table 2). Four of 10 studies were crossover trials13, 14, 18, 32 and the rest were parallel‐arm trials. Randomization to 1 of the 2 treatment groups was reported in all 4 crossover trials.
| Study | Study Design* | Total (N) | Mean Age (years) | Male (n) | Duration on Furosemide (days) | Country of Study | NYHA Class | Jadad Quality Score |
|---|---|---|---|---|---|---|---|---|
| ||||||||
| Aaser et al18 | CO | 8 | 54 | 6 | 2 | Norway | III‐IV | 1 |
| Allen et al17 | PA | 41 | 61 | 26 | 2 | USA | NR | 3 |
| Dormans et al13 | CO | 20 | 71 | 13 | 6 | Netherlands | III‐IV | 1 |
| Felker et al27 | PA | 308 | 66 | 226 | 3 | USA | NR | 4 |
| Lahav et al14 | CO | 9 | 74.1 | 5 | 4 | Israel | III‐IV | 1 |
| Mojtahedzadeh et al33 | PA | 22 | NR | NR | 1.5 | Iran | NR | 2 |
| Mojtahedzadeh et al24 | PA | 21 | 56.5 | 11 | 0.5 | Iran | NR | 2 |
| Ostermann et al26 | PA | 59 | 64 | 31 | 2 | UK/Canada | NR | 3 |
| Pivac et al32 | CO | 20 | 62.2 | 9 | 3 | Croatia | III | 1 |
| Thomson et al25 | PA | 56 | 56.4 | 32 | 3.54.6 | USA | III‐IV | 3 |
| Study | Furosemide Dose (Mean SD) | Additional Comments | |
|---|---|---|---|
| Intermittent Bolus | Continuous Infusion | ||
| |||
| Aaser et al18 | 145 80 mg bid | 145 80 mg/24 hr | Furosemide dose was same as usual daily oral dose |
| Allen et al17 | 162 48 mg bid | 162 52 mg/24 hr | Dose was determined by attending physician after enrollement |
| Dormans et al13 | Single bolus of continous dose | 690 mg/8 hr (2502000 mg) | Patients received additional single oral doses of furosemide on first and second day |
| Felker et al27 | 134 53 mg/day | 127 50 mg/day | Treatment was continued for up to 72 hours; at 48 hours, the treating physician had the option of adjusting the diurtetic dose on the basis of clinical response |
| Lahav et al14 | 3040 mg/8 hr | 6080 mg/24 hr | Continuous group received 3040 mg bolus furosemide as loading dose |
| Mojtahedzadeh et al33 | 320 mg/dose | 0.75 mg/kg/hr | All patients received 20 mg of furosemide as initial bolus in both arms |
| Mojtahedzadeh et al24 | 20 mg initial, then doubled every 3 hr* | 0.1 mg/kg/hr (total 250 mg) | Both regimens were titrated for a goal net fluid balance of at least 1 mL/kg/hr |
| Ostermann et al26 | 0.65.14/kg/dose | 0.40.6 mg/kg/hr | Predefined alogrithms aiming for minimum hourly urine output was used in both arms |
| Pivac et al32 | 40 mg bid | 40 mg bid | Goal was to increase urine output to at least 50% from baseline or a minimum of 1 mL/kg/hr |
| Thomson et al25 | 172 97 mg | 197 148 mg/day | The mean duration of study drug administration was shorter by approximately 1 day in the continous group |
Outcomes
Data on 24‐hour urinary volume were reported in all 10 studies. We found that the continuous infusion of furosemide was associated with a statistically significant increase in 24‐hour urinary output compared with intermittent bolus injections (WMD, 240.54 mL/24 hours/100 mg furosemide; 95% CI, 462.42 to 18.66; P = 0.03). There was evidence of statistically significant heterogeneity between the studies for the outcome of 24‐hour urinary volume (I2 = 89%; 2 = 93.11; P 0.001) (Figure 2). The magnitude of statistical heterogeneity decreased (I2 = 53%; 2 = 19.11; P = 0.02) but remained significant after removing a study by Ostermann et al.26
Data on total body weight loss was reported in 3 parallel trials. Patients treated with a continuous infusion of furosemide had statistically greater changes in total body weight (WMD, 0.78 kg; 95% CI, 1.54 to 0.03; P = 0.04) when compared with patients receiving bolus injections of furosemide. Data for total body weight loss were collected at 72 hours of treatment in 2 trials17, 27 and was reported for the duration of the entire study by Thomson et al.25 There was no statistical evidence of heterogeneity between the studies for total body weight loss (I2 = 0 %; 2 = 0.66; P = 0.72) (Figure 3).
Data on 24‐hour urinary sodium excretion was reported for 57 patients in the 4 crossover studies. A continuous infusion of furosemide was associated with a statistically insignificant increase in 24‐hour urinary sodium (WMD, 20.26 mmol/24 hours; 95% CI, 60.48 to 19.96; P = 0.32). There was no statistical evidence of heterogeneity between studies for 24‐hour urinary sodium excretion (I2 = 0%; 2 = 2.76; P = 0.60) (Figure 2).
Duration of hospital stay was reported in 3 parallel trials. Patients receiving intermittent injections of bolus furosemide had longer hospital stays (WMD, 0.99 days; 95% CI, 2.08 to 4.06; P = 0.53), but this difference was not statistically significant. There was no evidence of heterogeneity between the studies for the duration of hospital stay (I2 = 64%; 2 = 5.51; P = 0.06) (Figure 3).
Risk of Bias and Sensitivity Analysis
Individual quality assessment scores based on a scoring system developed by Jadad et al29 for included trials are reported (Table 1). Randomization was reported by all studies, but the explicit methodology of randomization was defined in only 4 studies.17, 2527 Allocation concealment was defined in 1 study.26 Dropouts were reported in 4 studies.2426, 33 Adherence to intervention per study protocol was not reported in any of the selected studies. Three studies mentioned intention to treat.25, 26 Sensitivity analyses demonstrated that the direction of the mean estimates did not change for any of the 4 outcomes when individual studies were excluded.
DISCUSSION
Our meta‐analysis of 10 randomized, controlled clinical trials found that continuous infusion of furosemide results in significantly greater diuresis and reduction in total body weight than intermittent boluses in patients hospitalized with ADHF. No statistical differences were observed in urinary sodium excretion or the duration of hospital stay between the 2 routes of intravenous furosemide administration. The data on greater diuresis from the available clinical trials was widely heterogeneous that may limit the merits of assessment of greater diuresis between the 2 methods of intravenous furosemide administration. In addition, data on clinical outcomes such as rates of rehospitalization, cardiovascular, and all‐cause mortality were not reported in the studies selected for this meta‐analysis.
The mean effective dose of loop diuretics administered as intermittent boluses varies widely5 and quickly dissipates to a level that fails to block Na+ reabsorption in renal tubules.34 Additionally, the effectiveness of loop diuretics is limited by the rebound in sodium reabsorption during periods of subtherapeutic renal tubular concentration because of their short half‐life.4, 6, 35 It is possible that the ineffectiveness of subtherapeutic tubular filtrate levels of loop diuretics toward the end of a dosing interval when administered as a bolus is responsible for their unsustained diuretic effects. Bolus injections of furosemide have been associated with diuretic tolerance, reduced short‐term natriuresis, and a probable rise in plasma aldosterone levels in the settings of salt restriction.36 Data from physiological studies suggest that greater diuresis, which also results in weight loss with continuous infusion of loop diuretics, is due to the minimal variation in the mean effective dose of drug in the renal tubules.1216 By preventing subtherapeutic tubular dose concentrations, continuous infusion may limit rebound resorption helping to improve symptoms of ADHF.4
Our study has several limitations. First, we examined only surrogate endpoints. Second, we included crossover trials13, 14, 18, 32 in the analysis, and the variation in the washout periods of these trials may have affected the reported outcomes. The study by Aaser et al18 lacked a washout period because the authors were concerned for the hemodynamic stability of diuretic‐dependent ADHF patients. Lahav et al14 reported a washout period of 3 hours, while Dormans et al13 and Pivac et al32 did not report the duration of washout periods. Finally, we excluded studies that enrolled postsurgical patients and patients with pulmonary edema from noncardiac causes. As a result, the generalizability of our findings is limited to relatively stable ADHF patients hospitalized because of medical, dietary, or pharmacological noncompliance. We restricted our analysis to studies using furosemide therapy only. By excluding trials using loop diuretics other than furosemide and trials reporting concomitant use of vasopressors or hypertonic saline in the study population, we are confident in the assessment of the isolated effects of furosemide for either route of its intravenous administration in patients hospitalized with ADHF.
The continuous infusion of furosemide has been well tolerated in most instances.13, 2527, 32 Thomson et al25 found no difference on the incidence of significant hemodynamic changes or need for renal replacement therapy between the 2 groups. Similarly, Ostermann et al26 reported no significant differences in heart rate and mean arterial pressures changes from two treatment groups. In addition, Felker et al27 and Pivac et al32 found no differences in the proportion of serious adverse effects between the 2 routes of intravenous furosemide administration.
In the absence of information on clinical endpoints such as rehospitalization, all‐cause mortality, and cardiovascular mortality, this meta‐analysis could not settle the issue to provide definitive recommendations for treatment guidelines to use either route of intravenous furosemide in ADHF patients. However, it is important to note that despite different study populations, our finding of greater diuresis with continuous infusion of furosemide is consistent with results reported by Salvador et al.19 Given the higher prevalence, mortality, and significant cost related with ADHF management in the United States, we support the use of furosemide as a continuous infusion to ensure limited but established benefits, such as greater diuresis and reduction in total body weight,. This approach seems reasonable, especially when the safety profiles between the 2 treatment groups are not different.2527, 32 However, the benefits on surrogate outcomes cannot be overstressed due to lack of information on the cost‐effectiveness of furosemide or other loop diuretics administered as a continuous infusion.
CONCLUSIONS
We report a systematic review and meta‐analysis comparing the effectiveness of 2 routes of intravenous furosemide administration in patients with ADHF. We found that continuous infusion of furosemide results in greater diuresis and greater reduction in total body weight. With the exception of greater diuresis, available data are homogenous for the reported outcomes in this meta‐analysis. Due to lack of information on clinical endpoints and cost‐effectiveness from currently available data, robust recommendations for clinical practice guidelines cannot be made at this time. Randomized controlled trials measuring hard clinical endpoints in larger patient populations may add stronger evidence to settle this issue in future. Further studies comparing cost‐effectiveness related with continuous infusion of furosemide may provide critical information to establish it as the preferred route over intermittent bolus injection in clinical practice.
Acute decompensated heart failure (ADHF) is the most common cause of hospitalization among adults in the United States and is associated with high morbidity and mortality.1 The estimated direct and indirect cost of ADHF management in the United States was $40 billion in 2010.1 There are approximately 5.7 million patients with heart failure in the United States with an annual mortality rate of 300,000 deaths per year.2 The Healthcare Cost and Utilization Project reported 1.1 million hospital admissions, an average hospital stay of 5.5 days, and 4% in‐hospital mortality for patients with heart failure in 2004.3
Intravenous administration of loop diuretics is the mainstay of treatment of volume overload in patients hospitalized with ADHF.4 However, when administered as intermittent bolus injections, loop diuretics usually lead to rapid intravascular volume changes,5 significant electrolyte abnormalities,6, 7 renal dysfunction,8, 9 and undesired neurohormonal activity.10, 11 Compared with intermittent bolus injections, continuous infusion of loop diuretics may induce a more sustained and greater diuresis and fewer electrolyte abnormalities.1216 Several studies of limited duration have compared the effectiveness of the 2 routes of intravenous administration of loop diuretics; however, the results of these studies are contradictory.13, 14, 17, 18 In a meta‐analysis, Salvador et al19 compared the effectiveness of continuous infusion and intermittent bolus injections of loop diuretics. The authors reported greater diuresis (measured as 24‐hour urinary output) in patients receiving continuous infusion of loop diuretics. However, the meta‐analysis included studies that examined loop diuretics other than furosemide,20 allowed concomitant use of hypertonic saline infusions,21 and included patients with pulmonary edema from noncardiogenic causes.22
Furosemide is one of the most commonly used loop diuretics.23 The current literature lacks a systematic review and meta‐analysis comparing the effectiveness of continuous infusion and intermittent bolus furosemide therapy among nonsurgical, hemodynamically stable, hospitalized patients with ADHF. In addition, several important randomized trials published in recent years comparing the effectiveness of the 2 routes of intravenous furosemide delivery warrant17, 2427 systematic review, because the last published meta‐analysis (by Salvador et al19) was in 2005.
We therefore conducted a systematic review and meta‐analysis of randomized controlled trials that compared the effects of continuous infusion and intermittent bolus of furosemide in patients hospitalized with ADHF.
METHODS
Study Selection
We searched the PubMed, EMBASE, and The Cochrane Central Register of Controlled Trials electronic databases systematically from their inception through March 2011 using the search terms lasix, furosemide, diuretic, congestive heart failure, infusion, and bolus. The electronic database search was supplemented by hand‐searching bibliographies of the retrieved articles. Two investigators independently reviewed all retrieved articles for their eligibility based on predefined criteria. Disagreement on study selection was resolved by mutual consensus and by the involvement of a third investigator. All selected studies were assessed for content validity.
We included both crossover and parallel‐arm randomized control trials. Studies were included if patients were randomized to intermittent bolus or continuous infusion of furosemide, and data were reported on 24‐hour urinary volume, total body weight loss, 24‐hour urinary sodium excretion, and duration of hospital stay. Randomized control trials that included patients with cardiogenic shock requiring concomitant vasopressor therapy, renal failure with or without hemodialysis, and loop diuretics other than furosemide were excluded. The primary authors of the included studies were contacted if the results of the selected outcomes either were not reported or required further clarification. A flow diagram was produced following guidelines from The Quality of Reporting of Meta‐analyses (QUOROM) group28 to provide information on randomized clinical trial identification for the final inclusion in the meta‐analysis.
Data Extraction
Data on study design, participant characteristics, methods, intervention, and selected outcomes were independently extracted by 2 investigators. Interobserver agreement for full study selection was calculated using an unweighted kappa statistic. A chi‐square test (2) and I2 statistic were used to report the percentage of variability in the effect estimates across studies.
Quality Assessment
The quality of included trials was assessed using a validated scale developed by Jadad et al29 that assigns a score from 0 to 5, with a higher score indicating higher quality. Two investigators independently evaluated studies on 3 parameters: randomization, blinding, and dropouts. The third investigator helped resolve discordant assessments. We assessed publication bias visually by examining the symmetry of funnel plots and statistically using Begg30 and Egger31 tests.
Data Synthesis and Analysis
For the reported outcomes, we recorded the mean difference between the groups and measures of dispersion. If a mean difference was not reported, we calculated point estimates by using the mean difference from baseline for each group. If a mean difference from baseline was not reported, we calculated point estimates using the baseline and final value for each group. If a measure of dispersion was not reported for the between‐group difference, we calculated it by using the sum of the variance for the mean difference from baseline in each group. If no measure of dispersion was reported for the mean difference from baseline for each group, we calculated variance by using the standard deviation of the baseline and final values, and assumed a correlation between the baseline and final values of 0.5.
Urinary volume was measured in milliliters per 24 hours per 100 mg furosemide to compare the diuretic effect between the 2 routes of intravenous administration. Total body weight loss was measured in kilograms. Urinary sodium was measured in millimoles per 24 hours, and duration of hospital stay was measured in days.
Weighted mean differences (WMDs) with 95% confidence intervals (CIs) were calculated for all prespecified outcomes using Review Manager (RevMan) Version 5.0. Copenhagen: The Nordic Cochrane Centre, The Cochrane Collaboration, 2008. We pooled results from individual studies using a random‐effects model. Statistical significance was set at P 0.05 using a 2‐tailed Z‐test. Sensitivity analyses were conducted by omitting one study at a time for all outcomes.
RESULTS
Study Selection
We identified 104 studies using the previously stated search terms. Following QUOROM guidelines, ten randomized clinical trials, enrolling a total of 564 patients, fulfilled the inclusion criteria (Figure 1). The interobserver agreement (unweighted kappa statistic) between investigators for study selection was 0.75.
Study Characteristics
The majority of patients were male (60%) with a mean age of 62.8 years (range 54 ‐ 74.1 years). The duration of follow‐up while on furosemide in both arms ranged from twelve hours24 to six days13 (Table 1). We found significant variability in dose, frequency, and duration of treatment across studies for both routes of intravenous furosemide administration (Table 2). Four of 10 studies were crossover trials13, 14, 18, 32 and the rest were parallel‐arm trials. Randomization to 1 of the 2 treatment groups was reported in all 4 crossover trials.
| Study | Study Design* | Total (N) | Mean Age (years) | Male (n) | Duration on Furosemide (days) | Country of Study | NYHA Class | Jadad Quality Score |
|---|---|---|---|---|---|---|---|---|
| ||||||||
| Aaser et al18 | CO | 8 | 54 | 6 | 2 | Norway | III‐IV | 1 |
| Allen et al17 | PA | 41 | 61 | 26 | 2 | USA | NR | 3 |
| Dormans et al13 | CO | 20 | 71 | 13 | 6 | Netherlands | III‐IV | 1 |
| Felker et al27 | PA | 308 | 66 | 226 | 3 | USA | NR | 4 |
| Lahav et al14 | CO | 9 | 74.1 | 5 | 4 | Israel | III‐IV | 1 |
| Mojtahedzadeh et al33 | PA | 22 | NR | NR | 1.5 | Iran | NR | 2 |
| Mojtahedzadeh et al24 | PA | 21 | 56.5 | 11 | 0.5 | Iran | NR | 2 |
| Ostermann et al26 | PA | 59 | 64 | 31 | 2 | UK/Canada | NR | 3 |
| Pivac et al32 | CO | 20 | 62.2 | 9 | 3 | Croatia | III | 1 |
| Thomson et al25 | PA | 56 | 56.4 | 32 | 3.54.6 | USA | III‐IV | 3 |
| Study | Furosemide Dose (Mean SD) | Additional Comments | |
|---|---|---|---|
| Intermittent Bolus | Continuous Infusion | ||
| |||
| Aaser et al18 | 145 80 mg bid | 145 80 mg/24 hr | Furosemide dose was same as usual daily oral dose |
| Allen et al17 | 162 48 mg bid | 162 52 mg/24 hr | Dose was determined by attending physician after enrollement |
| Dormans et al13 | Single bolus of continous dose | 690 mg/8 hr (2502000 mg) | Patients received additional single oral doses of furosemide on first and second day |
| Felker et al27 | 134 53 mg/day | 127 50 mg/day | Treatment was continued for up to 72 hours; at 48 hours, the treating physician had the option of adjusting the diurtetic dose on the basis of clinical response |
| Lahav et al14 | 3040 mg/8 hr | 6080 mg/24 hr | Continuous group received 3040 mg bolus furosemide as loading dose |
| Mojtahedzadeh et al33 | 320 mg/dose | 0.75 mg/kg/hr | All patients received 20 mg of furosemide as initial bolus in both arms |
| Mojtahedzadeh et al24 | 20 mg initial, then doubled every 3 hr* | 0.1 mg/kg/hr (total 250 mg) | Both regimens were titrated for a goal net fluid balance of at least 1 mL/kg/hr |
| Ostermann et al26 | 0.65.14/kg/dose | 0.40.6 mg/kg/hr | Predefined alogrithms aiming for minimum hourly urine output was used in both arms |
| Pivac et al32 | 40 mg bid | 40 mg bid | Goal was to increase urine output to at least 50% from baseline or a minimum of 1 mL/kg/hr |
| Thomson et al25 | 172 97 mg | 197 148 mg/day | The mean duration of study drug administration was shorter by approximately 1 day in the continous group |
Outcomes
Data on 24‐hour urinary volume were reported in all 10 studies. We found that the continuous infusion of furosemide was associated with a statistically significant increase in 24‐hour urinary output compared with intermittent bolus injections (WMD, 240.54 mL/24 hours/100 mg furosemide; 95% CI, 462.42 to 18.66; P = 0.03). There was evidence of statistically significant heterogeneity between the studies for the outcome of 24‐hour urinary volume (I2 = 89%; 2 = 93.11; P 0.001) (Figure 2). The magnitude of statistical heterogeneity decreased (I2 = 53%; 2 = 19.11; P = 0.02) but remained significant after removing a study by Ostermann et al.26
Data on total body weight loss was reported in 3 parallel trials. Patients treated with a continuous infusion of furosemide had statistically greater changes in total body weight (WMD, 0.78 kg; 95% CI, 1.54 to 0.03; P = 0.04) when compared with patients receiving bolus injections of furosemide. Data for total body weight loss were collected at 72 hours of treatment in 2 trials17, 27 and was reported for the duration of the entire study by Thomson et al.25 There was no statistical evidence of heterogeneity between the studies for total body weight loss (I2 = 0 %; 2 = 0.66; P = 0.72) (Figure 3).
Data on 24‐hour urinary sodium excretion was reported for 57 patients in the 4 crossover studies. A continuous infusion of furosemide was associated with a statistically insignificant increase in 24‐hour urinary sodium (WMD, 20.26 mmol/24 hours; 95% CI, 60.48 to 19.96; P = 0.32). There was no statistical evidence of heterogeneity between studies for 24‐hour urinary sodium excretion (I2 = 0%; 2 = 2.76; P = 0.60) (Figure 2).
Duration of hospital stay was reported in 3 parallel trials. Patients receiving intermittent injections of bolus furosemide had longer hospital stays (WMD, 0.99 days; 95% CI, 2.08 to 4.06; P = 0.53), but this difference was not statistically significant. There was no evidence of heterogeneity between the studies for the duration of hospital stay (I2 = 64%; 2 = 5.51; P = 0.06) (Figure 3).
Risk of Bias and Sensitivity Analysis
Individual quality assessment scores based on a scoring system developed by Jadad et al29 for included trials are reported (Table 1). Randomization was reported by all studies, but the explicit methodology of randomization was defined in only 4 studies.17, 2527 Allocation concealment was defined in 1 study.26 Dropouts were reported in 4 studies.2426, 33 Adherence to intervention per study protocol was not reported in any of the selected studies. Three studies mentioned intention to treat.25, 26 Sensitivity analyses demonstrated that the direction of the mean estimates did not change for any of the 4 outcomes when individual studies were excluded.
DISCUSSION
Our meta‐analysis of 10 randomized, controlled clinical trials found that continuous infusion of furosemide results in significantly greater diuresis and reduction in total body weight than intermittent boluses in patients hospitalized with ADHF. No statistical differences were observed in urinary sodium excretion or the duration of hospital stay between the 2 routes of intravenous furosemide administration. The data on greater diuresis from the available clinical trials was widely heterogeneous that may limit the merits of assessment of greater diuresis between the 2 methods of intravenous furosemide administration. In addition, data on clinical outcomes such as rates of rehospitalization, cardiovascular, and all‐cause mortality were not reported in the studies selected for this meta‐analysis.
The mean effective dose of loop diuretics administered as intermittent boluses varies widely5 and quickly dissipates to a level that fails to block Na+ reabsorption in renal tubules.34 Additionally, the effectiveness of loop diuretics is limited by the rebound in sodium reabsorption during periods of subtherapeutic renal tubular concentration because of their short half‐life.4, 6, 35 It is possible that the ineffectiveness of subtherapeutic tubular filtrate levels of loop diuretics toward the end of a dosing interval when administered as a bolus is responsible for their unsustained diuretic effects. Bolus injections of furosemide have been associated with diuretic tolerance, reduced short‐term natriuresis, and a probable rise in plasma aldosterone levels in the settings of salt restriction.36 Data from physiological studies suggest that greater diuresis, which also results in weight loss with continuous infusion of loop diuretics, is due to the minimal variation in the mean effective dose of drug in the renal tubules.1216 By preventing subtherapeutic tubular dose concentrations, continuous infusion may limit rebound resorption helping to improve symptoms of ADHF.4
Our study has several limitations. First, we examined only surrogate endpoints. Second, we included crossover trials13, 14, 18, 32 in the analysis, and the variation in the washout periods of these trials may have affected the reported outcomes. The study by Aaser et al18 lacked a washout period because the authors were concerned for the hemodynamic stability of diuretic‐dependent ADHF patients. Lahav et al14 reported a washout period of 3 hours, while Dormans et al13 and Pivac et al32 did not report the duration of washout periods. Finally, we excluded studies that enrolled postsurgical patients and patients with pulmonary edema from noncardiac causes. As a result, the generalizability of our findings is limited to relatively stable ADHF patients hospitalized because of medical, dietary, or pharmacological noncompliance. We restricted our analysis to studies using furosemide therapy only. By excluding trials using loop diuretics other than furosemide and trials reporting concomitant use of vasopressors or hypertonic saline in the study population, we are confident in the assessment of the isolated effects of furosemide for either route of its intravenous administration in patients hospitalized with ADHF.
The continuous infusion of furosemide has been well tolerated in most instances.13, 2527, 32 Thomson et al25 found no difference on the incidence of significant hemodynamic changes or need for renal replacement therapy between the 2 groups. Similarly, Ostermann et al26 reported no significant differences in heart rate and mean arterial pressures changes from two treatment groups. In addition, Felker et al27 and Pivac et al32 found no differences in the proportion of serious adverse effects between the 2 routes of intravenous furosemide administration.
In the absence of information on clinical endpoints such as rehospitalization, all‐cause mortality, and cardiovascular mortality, this meta‐analysis could not settle the issue to provide definitive recommendations for treatment guidelines to use either route of intravenous furosemide in ADHF patients. However, it is important to note that despite different study populations, our finding of greater diuresis with continuous infusion of furosemide is consistent with results reported by Salvador et al.19 Given the higher prevalence, mortality, and significant cost related with ADHF management in the United States, we support the use of furosemide as a continuous infusion to ensure limited but established benefits, such as greater diuresis and reduction in total body weight,. This approach seems reasonable, especially when the safety profiles between the 2 treatment groups are not different.2527, 32 However, the benefits on surrogate outcomes cannot be overstressed due to lack of information on the cost‐effectiveness of furosemide or other loop diuretics administered as a continuous infusion.
CONCLUSIONS
We report a systematic review and meta‐analysis comparing the effectiveness of 2 routes of intravenous furosemide administration in patients with ADHF. We found that continuous infusion of furosemide results in greater diuresis and greater reduction in total body weight. With the exception of greater diuresis, available data are homogenous for the reported outcomes in this meta‐analysis. Due to lack of information on clinical endpoints and cost‐effectiveness from currently available data, robust recommendations for clinical practice guidelines cannot be made at this time. Randomized controlled trials measuring hard clinical endpoints in larger patient populations may add stronger evidence to settle this issue in future. Further studies comparing cost‐effectiveness related with continuous infusion of furosemide may provide critical information to establish it as the preferred route over intermittent bolus injection in clinical practice.
- ,,, et al.Heart disease and stroke statistics 2009 update: a report from the American Heart Association Statistics Committee and Stroke Statistics Subcommittee.Circulation.2009;119:e21–e181.
- National Heart, Lung, and Blood Institute. What Is Heart Failure? Available at: http://www.nhlbi.nih.gov/health/health‐topics/topics/hf/. Accessed March 6,2011.
- ,,. Hospital Stays for Circulatory Diseases, 2004. Healthcare Cost and Utilization Project Statistical Brief No. 26. Rockville, MD: Agency for Healthcare Research and Quality; February 2007. Available at: http://www.hcup‐us.ahrq.gov/reports/statbriefs/sb26.jsp. Accessed February 22,2010.
- ,,, et al.2009 focused update: ACCF/AHA Guidelines for the Diagnosis and Management of Heart Failure in Adults: a report of the American College of Cardiology Foundation/American Heart Association Task Force on Practice Guidelines: developed in collaboration with the International Society for Heart and Lung Transplantation.Circulation.2009;119:1977–2016.
- ,,,.Determinants of response to furosemide in normal subjects.Br J Clin Pharmacol.1977;4:121–127.
- .Diuretic therapy.N Engl J Med.1998;339:387–395.
- ,,,,.Diuretics and risk of arrhythmic death in patients with left ventricular dysfunction.Circulation.1999;100:1311–1315.
- ,,, et al.Increased toxicity of high dose furosemide versus low‐dose dopamine in the treatment of refractory congestive heart failure.Clin Pharmacol Ther.1997;62:187–193.
- ,,, et al.Relationship between heart failure treatment and development of worsening renal function among hospitalized patients.Am Heart J.2004;147:331–338.
- ,,,.Haemodynamic and hormone responses to acute and chronic furosemide therapy in congestive heart failure.Clin Sci.1980;59:443–449.
- ,,,,.Untreated heart failure: clinical and neuroendocrine effects of introducing diuretics.Br Heart J.1987;57:17–22.
- ,,.The time course of delivery of furosemide into urine: an independent determinant of overall response.Kidney Int.1982;22:69–74.
- ,,,,,.Diuretic efficacy of high dose furosemide in severe heart failure: bolus injection versus continuous infusion.J Am Coll Cardiol.1996;28:376–382.
- ,,,.Intermittent administration of furosemide vs continuous infusion preceded by a loading dose for congestive heart failure.Chest.1992;102:725–731.
- ,,,,.Diuresis with continuous infusion of furosemide after cardiac surgery.Am J Surg.1983;146:796.
- ,,,.Continuous infusion of furosemide in refractory edema.BMJ.1978;2:476.
- ,,,,,.Continuous versus bolus dosing of furosemide for patients hospitalized for heart failure.Am J Cardiol.2010;105:1794–1797.
- ,,, et al.Effect of bolus injection versus continuous infusion of furosemide on diuresis and neurohormonal activation in patients with severe congestive heart failure.Scand J Clin Lab Invest.1997;57:361–367.
- ,,,.Continuous infusion versus bolus injection of loop diuretics in congestive heart failure.Cochrane Database Syst Rev.2005;(3):CD003178.
- ,,, et al.Pharmacodynamics of torsemide administered as an intravenous injection and as a continuous infusion to patients with congestive heart failure.J Clin Pharmacol.1996;36:265–270.
- ,,, et al.Effects of high‐dose furosemide and small‐volume hypertonic saline solution infusion in comparison with a high dose of furosemide as bolus in refractory congestive heart failure: long‐term effects.Am Heart J.2003;145:459–466.
- ,,.Protocol‐ guided diuretic management: comparison of furosemide by continuous infusion and intermittent bolus.Crit Care Med.1997;25:1969–1975.
- Cardiovascular Pharmacology Concepts. Diuretics. Available at: http://www.cvpharmacology.com/diuretic/diuretics.htm. Accessed July 22,2010.
- ,,, et al.The relationship between pharmacokinetics variables and pharmacodynamics profiles of bolus versus continuous infusion of furosemide in critically ill patients.J Infus Nurs.2005;13:127–132.
- ,,,,,.Continuous versus intermittent infusion of furosemide in acute decompensated heart failure.J Card Fail.2010;16:188–193.
- ,,,.Frusemide administration in critically ill patients by continuous compared to bolus therapy.Nephron Clin Pract.2007;107:c70–c76.
- ,,, et al;NHLBI Heart Failure Clinical Research Network. Diuretic strategies in patients with acute decompensated heart failure.N Engl J Med.2011;364:797–805.
- ,,,,,.Improving the quality of reports of meta‐analyses of randomised controlled trials: the QUOROM statement. Quality of Reporting of Meta‐analyses.Lancet.1999;354:1896–1900.
- ,,, et al.Assessing the quality of reports of randomized clinical trials: is blinding necessary?Control Clin Trials.1996;17:1–12.
- ,.Operating characteristics of a rank correlation test for publication bias.Biometrics.1994;50:1088–1101.
- ,,,.Bias in meta‐analysis detected by a simple, graphical test.BMJ.1997;315:629–634.
- ,,, et al.Diuretic effects of furosemide infusion versus bolus injection in congestive heart failure.Int J Clin Pharmacol Res.1998;18:121–128.
- ,,, et al.Comparison of hemodynamic and biochemical effects of furosemide by continuous infusion and intermittent bolus in critically ill patients.Infus Nurs.2004;27:255–261.
- .Diuretic resistance: mechanisms and therapeutic strategies.Cardiology.1994;84(suppl 2):57–67.
- ,.Loop diuretics: from the Na‐K‐2Cl transporter to clinical use.Am J Physiol Renal Physiol.2003;284:F11–F21.
- ,,, et al.Response to furosemide. I. Effects of salt intake and renal compensation.J Lab Clin Med.1983;102:450–458.
- ,,, et al.Heart disease and stroke statistics 2009 update: a report from the American Heart Association Statistics Committee and Stroke Statistics Subcommittee.Circulation.2009;119:e21–e181.
- National Heart, Lung, and Blood Institute. What Is Heart Failure? Available at: http://www.nhlbi.nih.gov/health/health‐topics/topics/hf/. Accessed March 6,2011.
- ,,. Hospital Stays for Circulatory Diseases, 2004. Healthcare Cost and Utilization Project Statistical Brief No. 26. Rockville, MD: Agency for Healthcare Research and Quality; February 2007. Available at: http://www.hcup‐us.ahrq.gov/reports/statbriefs/sb26.jsp. Accessed February 22,2010.
- ,,, et al.2009 focused update: ACCF/AHA Guidelines for the Diagnosis and Management of Heart Failure in Adults: a report of the American College of Cardiology Foundation/American Heart Association Task Force on Practice Guidelines: developed in collaboration with the International Society for Heart and Lung Transplantation.Circulation.2009;119:1977–2016.
- ,,,.Determinants of response to furosemide in normal subjects.Br J Clin Pharmacol.1977;4:121–127.
- .Diuretic therapy.N Engl J Med.1998;339:387–395.
- ,,,,.Diuretics and risk of arrhythmic death in patients with left ventricular dysfunction.Circulation.1999;100:1311–1315.
- ,,, et al.Increased toxicity of high dose furosemide versus low‐dose dopamine in the treatment of refractory congestive heart failure.Clin Pharmacol Ther.1997;62:187–193.
- ,,, et al.Relationship between heart failure treatment and development of worsening renal function among hospitalized patients.Am Heart J.2004;147:331–338.
- ,,,.Haemodynamic and hormone responses to acute and chronic furosemide therapy in congestive heart failure.Clin Sci.1980;59:443–449.
- ,,,,.Untreated heart failure: clinical and neuroendocrine effects of introducing diuretics.Br Heart J.1987;57:17–22.
- ,,.The time course of delivery of furosemide into urine: an independent determinant of overall response.Kidney Int.1982;22:69–74.
- ,,,,,.Diuretic efficacy of high dose furosemide in severe heart failure: bolus injection versus continuous infusion.J Am Coll Cardiol.1996;28:376–382.
- ,,,.Intermittent administration of furosemide vs continuous infusion preceded by a loading dose for congestive heart failure.Chest.1992;102:725–731.
- ,,,,.Diuresis with continuous infusion of furosemide after cardiac surgery.Am J Surg.1983;146:796.
- ,,,.Continuous infusion of furosemide in refractory edema.BMJ.1978;2:476.
- ,,,,,.Continuous versus bolus dosing of furosemide for patients hospitalized for heart failure.Am J Cardiol.2010;105:1794–1797.
- ,,, et al.Effect of bolus injection versus continuous infusion of furosemide on diuresis and neurohormonal activation in patients with severe congestive heart failure.Scand J Clin Lab Invest.1997;57:361–367.
- ,,,.Continuous infusion versus bolus injection of loop diuretics in congestive heart failure.Cochrane Database Syst Rev.2005;(3):CD003178.
- ,,, et al.Pharmacodynamics of torsemide administered as an intravenous injection and as a continuous infusion to patients with congestive heart failure.J Clin Pharmacol.1996;36:265–270.
- ,,, et al.Effects of high‐dose furosemide and small‐volume hypertonic saline solution infusion in comparison with a high dose of furosemide as bolus in refractory congestive heart failure: long‐term effects.Am Heart J.2003;145:459–466.
- ,,.Protocol‐ guided diuretic management: comparison of furosemide by continuous infusion and intermittent bolus.Crit Care Med.1997;25:1969–1975.
- Cardiovascular Pharmacology Concepts. Diuretics. Available at: http://www.cvpharmacology.com/diuretic/diuretics.htm. Accessed July 22,2010.
- ,,, et al.The relationship between pharmacokinetics variables and pharmacodynamics profiles of bolus versus continuous infusion of furosemide in critically ill patients.J Infus Nurs.2005;13:127–132.
- ,,,,,.Continuous versus intermittent infusion of furosemide in acute decompensated heart failure.J Card Fail.2010;16:188–193.
- ,,,.Frusemide administration in critically ill patients by continuous compared to bolus therapy.Nephron Clin Pract.2007;107:c70–c76.
- ,,, et al;NHLBI Heart Failure Clinical Research Network. Diuretic strategies in patients with acute decompensated heart failure.N Engl J Med.2011;364:797–805.
- ,,,,,.Improving the quality of reports of meta‐analyses of randomised controlled trials: the QUOROM statement. Quality of Reporting of Meta‐analyses.Lancet.1999;354:1896–1900.
- ,,, et al.Assessing the quality of reports of randomized clinical trials: is blinding necessary?Control Clin Trials.1996;17:1–12.
- ,.Operating characteristics of a rank correlation test for publication bias.Biometrics.1994;50:1088–1101.
- ,,,.Bias in meta‐analysis detected by a simple, graphical test.BMJ.1997;315:629–634.
- ,,, et al.Diuretic effects of furosemide infusion versus bolus injection in congestive heart failure.Int J Clin Pharmacol Res.1998;18:121–128.
- ,,, et al.Comparison of hemodynamic and biochemical effects of furosemide by continuous infusion and intermittent bolus in critically ill patients.Infus Nurs.2004;27:255–261.
- .Diuretic resistance: mechanisms and therapeutic strategies.Cardiology.1994;84(suppl 2):57–67.
- ,.Loop diuretics: from the Na‐K‐2Cl transporter to clinical use.Am J Physiol Renal Physiol.2003;284:F11–F21.
- ,,, et al.Response to furosemide. I. Effects of salt intake and renal compensation.J Lab Clin Med.1983;102:450–458.
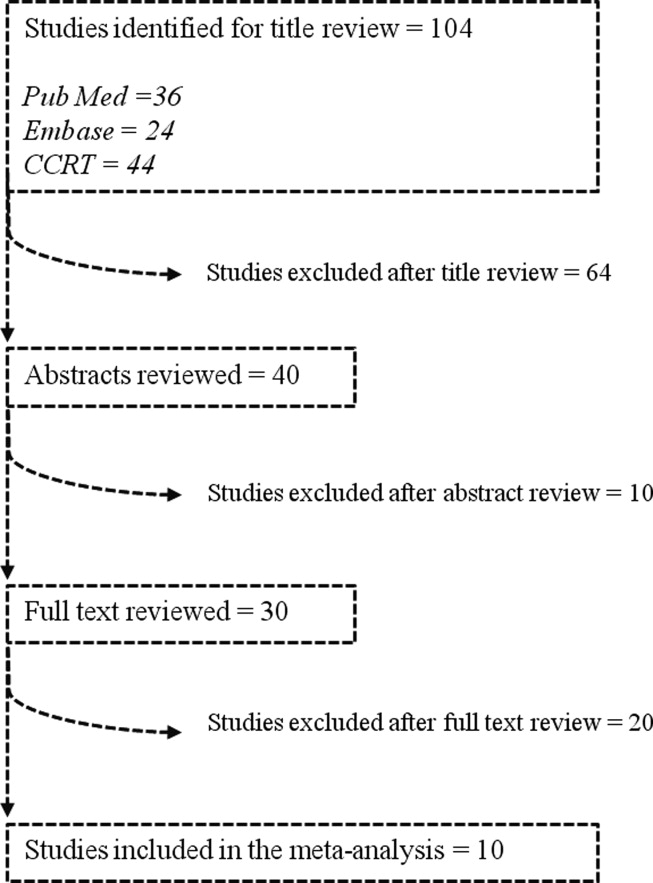
Pediatric Hospitalist Role in Transition
Optimal health care is achieved when every person at every age receives health care that is medically and developmentally appropriate.1 For healthy patients, medically and developmentally appropriate care is usually available, but for children with special healthcare needs (SHCN), receiving this care can be a challenge that is magnified as a child with SHCN grows into a teenager and then a young adult. For these children, simply transferring care, which is essentially a handoff of responsibility, to adult providers is insufficient to meet the needs of a special healthcare population.1 Transition is the purposeful planned movement of adolescents and young adults with chronic medical conditions and disabilities from pediatric (child‐centered) to adult‐oriented providers and facilities.2
The 2005‐2006 National Survey of Children with SHCN identified 4 component measures of transition which included discussions between the patient and the healthcare provider about: 1) shifting to adult providers, 2) adult healthcare needs, 3) health insurance, and 4) encouraging the patient to take responsibility for his/her care.34 Overall, only 41% of youth with SHCN met the core outcomes.4 The survey also found that those most affected by their health conditions were less likely to have transition discussions compared with less‐affected youth.3
The importance of healthcare transition also resonates with pediatric hospitalists. The results of a 1988 National Health Survey revealed that 4% of all children with SHCN were hospitalized, and 2% of those with severe chronic conditions accounted for 27% of all hospital bed days.5 Or, stated differently, a small percentage of patients are admitted most frequently and stay the longest in the hospital. Further, transition for those with significant cognitive delay was more difficult, because of the lack of adult‐oriented providers who are willing to care for the patient and work collaboratively with the family.6 This has a significant implication for pediatric hospitalists, because it increases the likelihood that a severely affected 21 to 25‐year‐old patient will be admitted to the pediatric hospitalist service having not yet made a successful transition to an adult‐oriented provider.
Clearly, transition of care should have its roots in the outpatient medical home; however, often a patient with a chronic medical condition will spend extended periods of time in the hospital and away from their identified medical home. Although not a widely accepted concept, some may consider the pediatric hospitalist service to be an extension of the medical home for inpatients. The pediatric hospitalist is often the physician who cares for inpatients with SHCN because of their complexity. There are components of the transition process that specifically deal with hospitalization. Pediatric hospitalists should understand transition and their role in it, so that the process does not stop when patients are hospitalized.
Our hypothesis is that pediatric hospitalists are well poised to provide inpatient transition services, but insufficient understanding of the concepts and practical processes related to transition limit involvement. Through this exploratory survey, we hope to understand current attitudes and knowledge about transition. We survey the degree to which pediatric hospitalists want to participate in the process, the level of support that healthcare transition services receive from the institutions in which pediatric hospitalists practice, and potential barriers and benefits of their participation.
METHODS
Participants
After a review of current literature, we developed an exploratory survey for pediatric hospitalists that was approved by our institutional review board, and was reviewed for content and face validity by a qualitative expert on transition of care. Using Survey Monkey, the survey was piloted with a small group of pediatric hospitalists for feedback regarding the clarity of the survey questions before it was introduced to the American Academy of Pediatrics (AAP)/Pediatric Hospital Medicine Listserv. The Listserv is available to any pediatric hospitalist that joins. The exact number of pediatric hospitalists is unknown. A reasonable approximation of Listserv members at the time the survey was introduced is 1800. A fraction of that number is active on the Listserv, as defined by multiple postings during the course of an academic year. Pediatric hospitalists were the targeted group because of their expertise in the care of the adolescent and, often, young adult, with SHCN. The survey was voluntary and anonymous, and was reintroduced 3 times to capture as many participants as possible. The purpose of the survey was to gauge the interest, attitudes, and understanding of healthcare transition in a cross section of pediatric hospitalists.
Definitions
For clarity, in this survey, transfer is defined as an event, a handoff of responsibility for the management of a patient from one physician to another. Transition is defined as the purposeful planned movement of adolescents and young adults, with chronic medical conditions and disabilities, from pediatric (child‐centered) to adult‐oriented providers and facilities.2
Survey
This questionnaire contained 33 items and included a mixture of open‐ended questions, yes and no questions, and questions with responses that used a modified Likert scale. The survey questions were not adapted from another study or survey; they were developed in conjunction with 2 well‐published experts on the subject of transition. The demographic questions were used to help determine whether patterns related to transition services and knowledge could be detected based on age, gender, or type of practice, whether academic or community. The survey content included several areas: 1) Who is responsible for the care of young adults and adolescents; 2) Hospital‐based transition services; 3) Benefits or challenges for pediatric hospitalists who become involved in health care transition (HCT); 4) Knowledge of HCT and education opportunities. Informed consent was the first page; if consent was obtained, the participant could move forward in the survey (Table 1).
| Who is primarily responsible for inpatient care of patients 16‐21? |
| Please rate your knowledge of healthcare transition. |
| Are there healthcare transition services in your hospital? |
| How old are patients when they first receive inpatient‐oriented healthcare transition services? |
| How beneficial are these services to the patient and the provider if available? |
| Does your hospital have a policy that mandates the age by which an adolescent/young adult patient must be transferred from Pediatrics to adult providers and facilities? |
| What factors determine age of transfer? |
| How big a problem is it transferring adolescent/young adult patients from Pediatrics to adult providers and facilities? |
| How prepared are adolescents and young adults in your institution for transition to adult services? |
| Should pediatric hospitalists be involved in providing healthcare transition services and supports to patients with chronic healthcare conditions in the inpatient setting? |
| How often have you been asked by a subspecialist to provide healthcare transition services and supports to patients with chronic health conditions in the inpatient setting? |
| Who is best qualified to provide healthcare transition services? |
| What are the biggest impediments and benefits to hospitalist involvement in healthcare transition services? |
| If there was an online educational training module about healthcare transitions, would you take it? |
RESULTS
There were 131 participants who consented to participate in, and completed, the survey.
Demographics
Of all participants, 42.5% identified their primary practice site as a pediatric hospital; 40.8% identified their primary practice setting as a children's hospital within a general hospital, and 15.8% identified their primary practice setting as a general hospital with pediatric beds but no designation as a children's hospital. The participants came from nearly every state in the United States; 69.2% were women and 30.8% were men. The ages ranged from 27 to 67, with the majority of participants in their mid‐30s and 40s. Most were boarded in Pediatrics and/or Internal Medicine with some subspecialties such as Physical Medical and Rehabilitation, Cardiology, Critical Care, Pulmonology, and Developmental and Behavioral Pediatrics represented. Although the sample size is small, it is representative of the larger population of pediatric hospitalists. There were no patterns detected based on demographics relative to the knowledge or participation in healthcare transition (Table 2).
| Male | Female | |
|---|---|---|
| Age range | 3267 years | 2761 years |
| Boarded in Pediatrics/Pediatric subspecialty | 92% | 99% |
| Practice setting | ||
| Pediatric hospital | 51.4% | 38.6% |
| General hospital with a pediatric hospital within it | 27% | 47% |
| General hospital with pediatric beds but no children's hospital designation | 21.6% | 13.3% |
| Other | 8.1% | 7.2% |
Which Groups of Physicians Are Caring for Adolescent and Young Adult Patients?
Establishing whether pediatric subspecialists, adult providers, or pediatric hospitalists are the primary caregivers for adolescents and young adults with SCHN is important to determine whether the pediatric hospitalist is really well poised to deal with transition issues. If the pediatric hospitalist does not care for these patients, then developing modules to educate them about healthcare transition may not be necessary. As expected, pediatric hospitalists believe they care for adolescent and young adult patients with special healthcare needs in the vast majority of cases. Table 3 illustrates in more detail who is specifically responsible for their care.
| Patient Age | ||
|---|---|---|
| 1617 | 1820 | |
| ||
| Inpatient care provider | ||
| Pediatric hospitalist | 70.1%* | 36.8% |
| Adult hospitalist | 0.9% | 27.4% |
| Pediatric subspecialist | 27.4% | 25.6% |
| Adult subspecialist | 0.9% | 2.6% |
| Other/not sure | 7.7% | 0.9% |
Knowledge of Healthcare Transition
Participants in the survey were provided definitions of healthcare transition; they were asked to rate their knowledge of healthcare transition on a modified Likert scale, given the definition provided. The results can be seen in Figure 1.
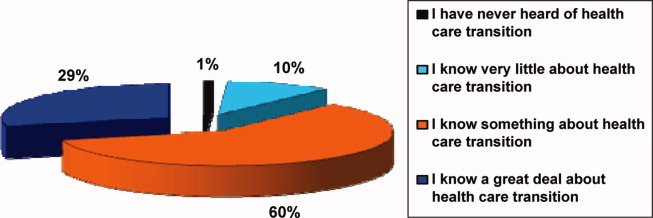
Transition Programs
Of all participants, 60.9% did not know if their hospital had inpatient‐oriented healthcare transition services. Another 27.8% only had informal or unstructured services for some patients with a chronic condition, and less than 1% of all respondents said they had a formal or structured program at their institution for inpatients with any chronic medical condition. Eighty percent thought transferring adolescent or young adult patients from pediatric to adult providers was a moderate to major problem.
Of those who responded to the survey, 97.6% feel that inpatient‐oriented healthcare transition services would be beneficial to adolescent and young adult patients, and 92.2% felt that these supports would be beneficial to pediatric providers. This is consistent with the data from another question in which respondents felt that only 1% of patients were quite a bit prepared for transition to inpatient adult providers, and that over half were only a little bit or not at all prepared.
Institutional Mandates
Nearly 40% of institutions have a mandated age by which adolescent and young adult patients must be transferred to adult providers and facilities. Additionally, only 5.2% of those institutions have a written procedure or protocol that describes how these pediatric patients will be transferred to adult providers and institutions.
Pediatric Hospitalist Participation in Transition
Sixty‐eight percent of respondents believe that the patient's primary care provider is the most qualified to discuss healthcare transition issues, followed by their pediatric subspecialists. However, more than 75% of respondents agree or strongly agree that pediatric hospitalists should be involved in providing healthcare transition services and supports to inpatients with chronic health conditions. Please refer to Table 4. Despite this, 58% of pediatric hospitalists are rarely, if ever, asked to participate in healthcare transition by their subspecialist counterparts.
| Respondents, % (No.) | |
|---|---|
| Strongly agree | 28.6 (28) |
| Agree | 50.0 (49) |
| Neither agree or disagree | 12.2 (12) |
| Disagree | 6.1 (6) |
| Strongly disagree | 3.1 (3) |
Barriers to Pediatric Hospitalist Participation in Transition
The survey participants were given a list of potential barriers to participation in healthcare transition and were asked to rank 3 of the choices in order of significance, with 1 being the biggest perceived impediment and 3 being the least significant. Seventeen percent ranked lack of familiarity with healthcare transition resources as the biggest barrier in their setting. Thirteen percent indicated that lack of support from pediatric and adult subspecialists is the major barrier, and 13% felt that insufficient time to provide transition services and supports would be the most significant barrier to their participation in transition. Interestingly, billing and reimbursement issues were not seen as obstacles (see Supporting Information 1/Table 5 in the online version of this article).
Advantages to Pediatric Hospitalist Participation in Transition
The participants were given a set of potential benefits that might result from the pediatric hospitalist participation in transition of care. They were asked to rank 3 of the choices in order of importance, with 1 being the most important positive outcome to 3 being a lesser, but still positive, outcome. Twenty‐three percent of respondents ranked improved communication between pediatric and adult providers and facilities as being the most significant advantage. Twenty‐one percent ranked both better continuity of care in the inpatient setting, and better quality of care for adolescents and young adults with chronic healthcare conditions, as the most important potential advantages of pediatric hospitalist involvement in healthcare transition. However, most felt that improved cost effectiveness would not be an important result (see Supporting Information 2/Table 6 in the online version of this article).
Educational Process
If an educational module was offered, over half of the respondents would definitely or probably take the training, and another 22% might take the training.
LIMITATIONS
This is an exploratory study which is limited by the small number of participants. Although the demographics of the participants include both young and experienced hospitalists, as well as academic and community institutions, it is difficult to determine whether the results are truly representative of the larger pediatric hospitalist population. The survey was also too long which may have deterred participation. Given the lack of experience and literature on pediatric hospitalist involvement in transition of care, it is difficult to construct a concise survey that addresses all of the concerns of the diverse hospitalist population. This is a new area of exploration for pediatric hospitalists, and ideally new questions will arise out of these preliminary findings, despite the limitations in the survey. Future surveys should focus on singular issues related to transition, and every attempt should be made to increase participation in the survey.
DISCUSSION
The survey demonstrates that the majority of the pediatric hospitalists believe providing transition services is important, but that transition programs are, for all practical purposes, nonexistent. Hospitalists believe the primary care doctor or the subspecialists should direct the transition process, but most clearly believe that their participation in the process would be beneficial for their patients, as evidenced by a 97.6% positive response to that question in the survey. Transition of care should be handled predominantly in the medical home.1 At this point, there is no literature that describes a pediatric hospitalist service as an inpatient medical home. However, pediatric hospitalists, not pediatric subspecialists, care for the majority of patients with SHCN in the transition age range while they are hospitalized; therefore, continuing the transition discussion while a patient is hospitalized may be a key component to its success. Better quality and continuity of care for the inpatient with SHCN is a potential advantage, as is coordination of services. Having the support of the pediatric subspecialists and the pediatric primary care provider is not only important, but it is critical in successful transition. Further, most pediatric hospitalists identify transfer of pediatric patients to adult providers as a major problem, and the perception is that only 1% of patients are adequately prepared for this transfer of care. Few institutions have a formalized process by which patients are transferred to adult care providers; however, many institutions have a mandated age at which they expect transfer of care to occur.
The literature about transition of care highlights the issues in the outpatient setting. Reiss and Gibson used focus groups comprised of caregivers, and youth and young adults with SHCN, to explore the issues related to transition of care.7 They identified several factors associated with successful transition that are pertinent to inpatient pediatrics. Involving the patient as a responsible member of the treatment team is important because it fosters independence and problem solving.7 Advocating this in the inpatient setting gives the patient and caregivers confidence that the patient can participate in the healthcare process, thereby making it a habit.7 A second important factor is attending to the patient's personal preferences and interpersonal dynamics.7 Many adolescents and young adult patients prefer to be cared for by their pediatric providers on adult wards away from crying infants and children.7 This may be their first indication that they'd like to explore the adult medical world.7
Pediatric hospitalists should be prepared to meet the needs of adolescent and young adult patients with SCHN by becoming familiar with the components of the transition process. Saidi and Kovacs provide a checklist of practical transition strategies that are helpful to review, and many are quite pertinent to the practice of pediatric hospital medicine.8 Education is a fundamental aspect of the identity of the pediatric hospitalist and is also the foundation of the transition process. Identifying established institutional transition resources, developing educational tools for faculty and residents to learn about transition, as well as adapting the transition checklist to inpatient needs are useful tools for developing a culture of effective healthcare transition. Simple strategies, such as speaking to young patients on their own, and displaying a public commitment to transition are other easy changes that can be made to the everyday activities of the pediatric hospitalist.8
Other key issues that would be important for the pediatric hospitalist to address are the adolescents' understanding of his/her disease, current treatments, long‐term complications, and the impact of healthy and unhealthy behaviors.9 Because these issues can directly affect his/her hospitalization, the pediatric hospitalist should play a role in discussing these issues and reaffirming their importance in the overall health of the patient. This affirmation will also support the process of transition, and will give further confidence to the patient and family that the patient is becoming a responsible member of the healthcare team.
Many of the strategies espoused by experts in transition are part of what the pediatric hospitalist does regularly. The pediatric hospitalist is a resource for patients, families, and subspecialists, because of their comfort and expertise managing complex pediatric patients and because of their understanding of the hospital and how it functions. The process of transition of care should be part of what pediatric hospitalists are prepared to teach, because of the numbers of adolescent and young adult patients that are in their care. The current knowledge base for most pediatric hospitalists seems to be a basic understanding of what transition of care means, but little knowledge about how to go about engaging in the process. More and more transition is relevant to primary care doctors and hospitalists, as the medically complex patient survives into adolescence and adulthood.
CONCLUSION
The survey provides a snapshot of the current attitudes and beliefs of pediatric hospitalists relative to involvement in healthcare transition. This article addresses what we believe to be important questions for the pediatric hospitalist to ask, prior to becoming involved in healthcare transition. Our hypothesis, that pediatric hospitalists are well poised to provide inpatient transition services but are limited by lack of understanding of the concepts and process, is supported by the responses in the survey which show that pediatric hospitalists are interested in participating in healthcare transition but feel impeded by time, support, and understanding of the process of transition. A larger sample size is needed to strengthen the data and lend support to these observations. Additionally, more research to compare current models of transition services and a hospitalist model could be important in realizing the potential positive outcomes predicted in this survey. Education and resources for transition of care are inadequate. Targeted educational modules might provide a foundation for pediatric hospitalists to build their scope of practice to include transition services. The next step for interested pediatric hospitalists might be developing a web‐based module that addresses the unique needs of the inpatient provider and the chronically ill pediatric patient who spends a great deal of time as an inpatient. The measurable outcomes for such an intervention might well be the feeling of preparation that the family and patient have as they move into the adult provider world.
- A consensus statement on health care transitions for young adults with special health care needs.Pediatrics.2002;110(6 pt 2):1304–1306.
- ,,,,,.Perceptions of transitional care needs and experiences in pediatric heart transplant recipients.Am J Transplant.2009;9(3):614–619.
- ,,,,,.Planning for health care transitions: results from the 2005–2006 National Survey of Children With Special Health Care Needs.Pediatrics.2009;123(1):e145–e152.
- US Department of Health and Human Services, Health Resources and Services Administration, Maternal and Child Health Bureau.The National Survey of Children With Special Health Care Needs, Chartbook 2005–2006.Rockville, MD:US Department of Health and Human Services;2008.
- ,,,,,.Changes in hospitalization patterns among patients with congenital heart disease during the transition from adolescence to adulthood.J Am Coll Cardiol.2007;49(8):875–882.
- ,,.Health care transition: youth, family, and provider perspectives.Pediatrics.2005;115(1):112–120.
- ,.Health care transition: destinations unknown.Pediatrics.2002;110(6 pt 2):1307–1314.
- ,.Developing a transition program from pediatric‐ to adult‐focused cardiology care: practical considerations.Congenit Heart Dis.2009;4(4):204–215.
- .Transition for youth with chronic conditions: primary care physicians' approaches.Pediatrics.2002;110(6 pt 2):1315–1321.
Optimal health care is achieved when every person at every age receives health care that is medically and developmentally appropriate.1 For healthy patients, medically and developmentally appropriate care is usually available, but for children with special healthcare needs (SHCN), receiving this care can be a challenge that is magnified as a child with SHCN grows into a teenager and then a young adult. For these children, simply transferring care, which is essentially a handoff of responsibility, to adult providers is insufficient to meet the needs of a special healthcare population.1 Transition is the purposeful planned movement of adolescents and young adults with chronic medical conditions and disabilities from pediatric (child‐centered) to adult‐oriented providers and facilities.2
The 2005‐2006 National Survey of Children with SHCN identified 4 component measures of transition which included discussions between the patient and the healthcare provider about: 1) shifting to adult providers, 2) adult healthcare needs, 3) health insurance, and 4) encouraging the patient to take responsibility for his/her care.34 Overall, only 41% of youth with SHCN met the core outcomes.4 The survey also found that those most affected by their health conditions were less likely to have transition discussions compared with less‐affected youth.3
The importance of healthcare transition also resonates with pediatric hospitalists. The results of a 1988 National Health Survey revealed that 4% of all children with SHCN were hospitalized, and 2% of those with severe chronic conditions accounted for 27% of all hospital bed days.5 Or, stated differently, a small percentage of patients are admitted most frequently and stay the longest in the hospital. Further, transition for those with significant cognitive delay was more difficult, because of the lack of adult‐oriented providers who are willing to care for the patient and work collaboratively with the family.6 This has a significant implication for pediatric hospitalists, because it increases the likelihood that a severely affected 21 to 25‐year‐old patient will be admitted to the pediatric hospitalist service having not yet made a successful transition to an adult‐oriented provider.
Clearly, transition of care should have its roots in the outpatient medical home; however, often a patient with a chronic medical condition will spend extended periods of time in the hospital and away from their identified medical home. Although not a widely accepted concept, some may consider the pediatric hospitalist service to be an extension of the medical home for inpatients. The pediatric hospitalist is often the physician who cares for inpatients with SHCN because of their complexity. There are components of the transition process that specifically deal with hospitalization. Pediatric hospitalists should understand transition and their role in it, so that the process does not stop when patients are hospitalized.
Our hypothesis is that pediatric hospitalists are well poised to provide inpatient transition services, but insufficient understanding of the concepts and practical processes related to transition limit involvement. Through this exploratory survey, we hope to understand current attitudes and knowledge about transition. We survey the degree to which pediatric hospitalists want to participate in the process, the level of support that healthcare transition services receive from the institutions in which pediatric hospitalists practice, and potential barriers and benefits of their participation.
METHODS
Participants
After a review of current literature, we developed an exploratory survey for pediatric hospitalists that was approved by our institutional review board, and was reviewed for content and face validity by a qualitative expert on transition of care. Using Survey Monkey, the survey was piloted with a small group of pediatric hospitalists for feedback regarding the clarity of the survey questions before it was introduced to the American Academy of Pediatrics (AAP)/Pediatric Hospital Medicine Listserv. The Listserv is available to any pediatric hospitalist that joins. The exact number of pediatric hospitalists is unknown. A reasonable approximation of Listserv members at the time the survey was introduced is 1800. A fraction of that number is active on the Listserv, as defined by multiple postings during the course of an academic year. Pediatric hospitalists were the targeted group because of their expertise in the care of the adolescent and, often, young adult, with SHCN. The survey was voluntary and anonymous, and was reintroduced 3 times to capture as many participants as possible. The purpose of the survey was to gauge the interest, attitudes, and understanding of healthcare transition in a cross section of pediatric hospitalists.
Definitions
For clarity, in this survey, transfer is defined as an event, a handoff of responsibility for the management of a patient from one physician to another. Transition is defined as the purposeful planned movement of adolescents and young adults, with chronic medical conditions and disabilities, from pediatric (child‐centered) to adult‐oriented providers and facilities.2
Survey
This questionnaire contained 33 items and included a mixture of open‐ended questions, yes and no questions, and questions with responses that used a modified Likert scale. The survey questions were not adapted from another study or survey; they were developed in conjunction with 2 well‐published experts on the subject of transition. The demographic questions were used to help determine whether patterns related to transition services and knowledge could be detected based on age, gender, or type of practice, whether academic or community. The survey content included several areas: 1) Who is responsible for the care of young adults and adolescents; 2) Hospital‐based transition services; 3) Benefits or challenges for pediatric hospitalists who become involved in health care transition (HCT); 4) Knowledge of HCT and education opportunities. Informed consent was the first page; if consent was obtained, the participant could move forward in the survey (Table 1).
| Who is primarily responsible for inpatient care of patients 16‐21? |
| Please rate your knowledge of healthcare transition. |
| Are there healthcare transition services in your hospital? |
| How old are patients when they first receive inpatient‐oriented healthcare transition services? |
| How beneficial are these services to the patient and the provider if available? |
| Does your hospital have a policy that mandates the age by which an adolescent/young adult patient must be transferred from Pediatrics to adult providers and facilities? |
| What factors determine age of transfer? |
| How big a problem is it transferring adolescent/young adult patients from Pediatrics to adult providers and facilities? |
| How prepared are adolescents and young adults in your institution for transition to adult services? |
| Should pediatric hospitalists be involved in providing healthcare transition services and supports to patients with chronic healthcare conditions in the inpatient setting? |
| How often have you been asked by a subspecialist to provide healthcare transition services and supports to patients with chronic health conditions in the inpatient setting? |
| Who is best qualified to provide healthcare transition services? |
| What are the biggest impediments and benefits to hospitalist involvement in healthcare transition services? |
| If there was an online educational training module about healthcare transitions, would you take it? |
RESULTS
There were 131 participants who consented to participate in, and completed, the survey.
Demographics
Of all participants, 42.5% identified their primary practice site as a pediatric hospital; 40.8% identified their primary practice setting as a children's hospital within a general hospital, and 15.8% identified their primary practice setting as a general hospital with pediatric beds but no designation as a children's hospital. The participants came from nearly every state in the United States; 69.2% were women and 30.8% were men. The ages ranged from 27 to 67, with the majority of participants in their mid‐30s and 40s. Most were boarded in Pediatrics and/or Internal Medicine with some subspecialties such as Physical Medical and Rehabilitation, Cardiology, Critical Care, Pulmonology, and Developmental and Behavioral Pediatrics represented. Although the sample size is small, it is representative of the larger population of pediatric hospitalists. There were no patterns detected based on demographics relative to the knowledge or participation in healthcare transition (Table 2).
| Male | Female | |
|---|---|---|
| Age range | 3267 years | 2761 years |
| Boarded in Pediatrics/Pediatric subspecialty | 92% | 99% |
| Practice setting | ||
| Pediatric hospital | 51.4% | 38.6% |
| General hospital with a pediatric hospital within it | 27% | 47% |
| General hospital with pediatric beds but no children's hospital designation | 21.6% | 13.3% |
| Other | 8.1% | 7.2% |
Which Groups of Physicians Are Caring for Adolescent and Young Adult Patients?
Establishing whether pediatric subspecialists, adult providers, or pediatric hospitalists are the primary caregivers for adolescents and young adults with SCHN is important to determine whether the pediatric hospitalist is really well poised to deal with transition issues. If the pediatric hospitalist does not care for these patients, then developing modules to educate them about healthcare transition may not be necessary. As expected, pediatric hospitalists believe they care for adolescent and young adult patients with special healthcare needs in the vast majority of cases. Table 3 illustrates in more detail who is specifically responsible for their care.
| Patient Age | ||
|---|---|---|
| 1617 | 1820 | |
| ||
| Inpatient care provider | ||
| Pediatric hospitalist | 70.1%* | 36.8% |
| Adult hospitalist | 0.9% | 27.4% |
| Pediatric subspecialist | 27.4% | 25.6% |
| Adult subspecialist | 0.9% | 2.6% |
| Other/not sure | 7.7% | 0.9% |
Knowledge of Healthcare Transition
Participants in the survey were provided definitions of healthcare transition; they were asked to rate their knowledge of healthcare transition on a modified Likert scale, given the definition provided. The results can be seen in Figure 1.
Transition Programs
Of all participants, 60.9% did not know if their hospital had inpatient‐oriented healthcare transition services. Another 27.8% only had informal or unstructured services for some patients with a chronic condition, and less than 1% of all respondents said they had a formal or structured program at their institution for inpatients with any chronic medical condition. Eighty percent thought transferring adolescent or young adult patients from pediatric to adult providers was a moderate to major problem.
Of those who responded to the survey, 97.6% feel that inpatient‐oriented healthcare transition services would be beneficial to adolescent and young adult patients, and 92.2% felt that these supports would be beneficial to pediatric providers. This is consistent with the data from another question in which respondents felt that only 1% of patients were quite a bit prepared for transition to inpatient adult providers, and that over half were only a little bit or not at all prepared.
Institutional Mandates
Nearly 40% of institutions have a mandated age by which adolescent and young adult patients must be transferred to adult providers and facilities. Additionally, only 5.2% of those institutions have a written procedure or protocol that describes how these pediatric patients will be transferred to adult providers and institutions.
Pediatric Hospitalist Participation in Transition
Sixty‐eight percent of respondents believe that the patient's primary care provider is the most qualified to discuss healthcare transition issues, followed by their pediatric subspecialists. However, more than 75% of respondents agree or strongly agree that pediatric hospitalists should be involved in providing healthcare transition services and supports to inpatients with chronic health conditions. Please refer to Table 4. Despite this, 58% of pediatric hospitalists are rarely, if ever, asked to participate in healthcare transition by their subspecialist counterparts.
| Respondents, % (No.) | |
|---|---|
| Strongly agree | 28.6 (28) |
| Agree | 50.0 (49) |
| Neither agree or disagree | 12.2 (12) |
| Disagree | 6.1 (6) |
| Strongly disagree | 3.1 (3) |
Barriers to Pediatric Hospitalist Participation in Transition
The survey participants were given a list of potential barriers to participation in healthcare transition and were asked to rank 3 of the choices in order of significance, with 1 being the biggest perceived impediment and 3 being the least significant. Seventeen percent ranked lack of familiarity with healthcare transition resources as the biggest barrier in their setting. Thirteen percent indicated that lack of support from pediatric and adult subspecialists is the major barrier, and 13% felt that insufficient time to provide transition services and supports would be the most significant barrier to their participation in transition. Interestingly, billing and reimbursement issues were not seen as obstacles (see Supporting Information 1/Table 5 in the online version of this article).
Advantages to Pediatric Hospitalist Participation in Transition
The participants were given a set of potential benefits that might result from the pediatric hospitalist participation in transition of care. They were asked to rank 3 of the choices in order of importance, with 1 being the most important positive outcome to 3 being a lesser, but still positive, outcome. Twenty‐three percent of respondents ranked improved communication between pediatric and adult providers and facilities as being the most significant advantage. Twenty‐one percent ranked both better continuity of care in the inpatient setting, and better quality of care for adolescents and young adults with chronic healthcare conditions, as the most important potential advantages of pediatric hospitalist involvement in healthcare transition. However, most felt that improved cost effectiveness would not be an important result (see Supporting Information 2/Table 6 in the online version of this article).
Educational Process
If an educational module was offered, over half of the respondents would definitely or probably take the training, and another 22% might take the training.
LIMITATIONS
This is an exploratory study which is limited by the small number of participants. Although the demographics of the participants include both young and experienced hospitalists, as well as academic and community institutions, it is difficult to determine whether the results are truly representative of the larger pediatric hospitalist population. The survey was also too long which may have deterred participation. Given the lack of experience and literature on pediatric hospitalist involvement in transition of care, it is difficult to construct a concise survey that addresses all of the concerns of the diverse hospitalist population. This is a new area of exploration for pediatric hospitalists, and ideally new questions will arise out of these preliminary findings, despite the limitations in the survey. Future surveys should focus on singular issues related to transition, and every attempt should be made to increase participation in the survey.
DISCUSSION
The survey demonstrates that the majority of the pediatric hospitalists believe providing transition services is important, but that transition programs are, for all practical purposes, nonexistent. Hospitalists believe the primary care doctor or the subspecialists should direct the transition process, but most clearly believe that their participation in the process would be beneficial for their patients, as evidenced by a 97.6% positive response to that question in the survey. Transition of care should be handled predominantly in the medical home.1 At this point, there is no literature that describes a pediatric hospitalist service as an inpatient medical home. However, pediatric hospitalists, not pediatric subspecialists, care for the majority of patients with SHCN in the transition age range while they are hospitalized; therefore, continuing the transition discussion while a patient is hospitalized may be a key component to its success. Better quality and continuity of care for the inpatient with SHCN is a potential advantage, as is coordination of services. Having the support of the pediatric subspecialists and the pediatric primary care provider is not only important, but it is critical in successful transition. Further, most pediatric hospitalists identify transfer of pediatric patients to adult providers as a major problem, and the perception is that only 1% of patients are adequately prepared for this transfer of care. Few institutions have a formalized process by which patients are transferred to adult care providers; however, many institutions have a mandated age at which they expect transfer of care to occur.
The literature about transition of care highlights the issues in the outpatient setting. Reiss and Gibson used focus groups comprised of caregivers, and youth and young adults with SHCN, to explore the issues related to transition of care.7 They identified several factors associated with successful transition that are pertinent to inpatient pediatrics. Involving the patient as a responsible member of the treatment team is important because it fosters independence and problem solving.7 Advocating this in the inpatient setting gives the patient and caregivers confidence that the patient can participate in the healthcare process, thereby making it a habit.7 A second important factor is attending to the patient's personal preferences and interpersonal dynamics.7 Many adolescents and young adult patients prefer to be cared for by their pediatric providers on adult wards away from crying infants and children.7 This may be their first indication that they'd like to explore the adult medical world.7
Pediatric hospitalists should be prepared to meet the needs of adolescent and young adult patients with SCHN by becoming familiar with the components of the transition process. Saidi and Kovacs provide a checklist of practical transition strategies that are helpful to review, and many are quite pertinent to the practice of pediatric hospital medicine.8 Education is a fundamental aspect of the identity of the pediatric hospitalist and is also the foundation of the transition process. Identifying established institutional transition resources, developing educational tools for faculty and residents to learn about transition, as well as adapting the transition checklist to inpatient needs are useful tools for developing a culture of effective healthcare transition. Simple strategies, such as speaking to young patients on their own, and displaying a public commitment to transition are other easy changes that can be made to the everyday activities of the pediatric hospitalist.8
Other key issues that would be important for the pediatric hospitalist to address are the adolescents' understanding of his/her disease, current treatments, long‐term complications, and the impact of healthy and unhealthy behaviors.9 Because these issues can directly affect his/her hospitalization, the pediatric hospitalist should play a role in discussing these issues and reaffirming their importance in the overall health of the patient. This affirmation will also support the process of transition, and will give further confidence to the patient and family that the patient is becoming a responsible member of the healthcare team.
Many of the strategies espoused by experts in transition are part of what the pediatric hospitalist does regularly. The pediatric hospitalist is a resource for patients, families, and subspecialists, because of their comfort and expertise managing complex pediatric patients and because of their understanding of the hospital and how it functions. The process of transition of care should be part of what pediatric hospitalists are prepared to teach, because of the numbers of adolescent and young adult patients that are in their care. The current knowledge base for most pediatric hospitalists seems to be a basic understanding of what transition of care means, but little knowledge about how to go about engaging in the process. More and more transition is relevant to primary care doctors and hospitalists, as the medically complex patient survives into adolescence and adulthood.
CONCLUSION
The survey provides a snapshot of the current attitudes and beliefs of pediatric hospitalists relative to involvement in healthcare transition. This article addresses what we believe to be important questions for the pediatric hospitalist to ask, prior to becoming involved in healthcare transition. Our hypothesis, that pediatric hospitalists are well poised to provide inpatient transition services but are limited by lack of understanding of the concepts and process, is supported by the responses in the survey which show that pediatric hospitalists are interested in participating in healthcare transition but feel impeded by time, support, and understanding of the process of transition. A larger sample size is needed to strengthen the data and lend support to these observations. Additionally, more research to compare current models of transition services and a hospitalist model could be important in realizing the potential positive outcomes predicted in this survey. Education and resources for transition of care are inadequate. Targeted educational modules might provide a foundation for pediatric hospitalists to build their scope of practice to include transition services. The next step for interested pediatric hospitalists might be developing a web‐based module that addresses the unique needs of the inpatient provider and the chronically ill pediatric patient who spends a great deal of time as an inpatient. The measurable outcomes for such an intervention might well be the feeling of preparation that the family and patient have as they move into the adult provider world.
Optimal health care is achieved when every person at every age receives health care that is medically and developmentally appropriate.1 For healthy patients, medically and developmentally appropriate care is usually available, but for children with special healthcare needs (SHCN), receiving this care can be a challenge that is magnified as a child with SHCN grows into a teenager and then a young adult. For these children, simply transferring care, which is essentially a handoff of responsibility, to adult providers is insufficient to meet the needs of a special healthcare population.1 Transition is the purposeful planned movement of adolescents and young adults with chronic medical conditions and disabilities from pediatric (child‐centered) to adult‐oriented providers and facilities.2
The 2005‐2006 National Survey of Children with SHCN identified 4 component measures of transition which included discussions between the patient and the healthcare provider about: 1) shifting to adult providers, 2) adult healthcare needs, 3) health insurance, and 4) encouraging the patient to take responsibility for his/her care.34 Overall, only 41% of youth with SHCN met the core outcomes.4 The survey also found that those most affected by their health conditions were less likely to have transition discussions compared with less‐affected youth.3
The importance of healthcare transition also resonates with pediatric hospitalists. The results of a 1988 National Health Survey revealed that 4% of all children with SHCN were hospitalized, and 2% of those with severe chronic conditions accounted for 27% of all hospital bed days.5 Or, stated differently, a small percentage of patients are admitted most frequently and stay the longest in the hospital. Further, transition for those with significant cognitive delay was more difficult, because of the lack of adult‐oriented providers who are willing to care for the patient and work collaboratively with the family.6 This has a significant implication for pediatric hospitalists, because it increases the likelihood that a severely affected 21 to 25‐year‐old patient will be admitted to the pediatric hospitalist service having not yet made a successful transition to an adult‐oriented provider.
Clearly, transition of care should have its roots in the outpatient medical home; however, often a patient with a chronic medical condition will spend extended periods of time in the hospital and away from their identified medical home. Although not a widely accepted concept, some may consider the pediatric hospitalist service to be an extension of the medical home for inpatients. The pediatric hospitalist is often the physician who cares for inpatients with SHCN because of their complexity. There are components of the transition process that specifically deal with hospitalization. Pediatric hospitalists should understand transition and their role in it, so that the process does not stop when patients are hospitalized.
Our hypothesis is that pediatric hospitalists are well poised to provide inpatient transition services, but insufficient understanding of the concepts and practical processes related to transition limit involvement. Through this exploratory survey, we hope to understand current attitudes and knowledge about transition. We survey the degree to which pediatric hospitalists want to participate in the process, the level of support that healthcare transition services receive from the institutions in which pediatric hospitalists practice, and potential barriers and benefits of their participation.
METHODS
Participants
After a review of current literature, we developed an exploratory survey for pediatric hospitalists that was approved by our institutional review board, and was reviewed for content and face validity by a qualitative expert on transition of care. Using Survey Monkey, the survey was piloted with a small group of pediatric hospitalists for feedback regarding the clarity of the survey questions before it was introduced to the American Academy of Pediatrics (AAP)/Pediatric Hospital Medicine Listserv. The Listserv is available to any pediatric hospitalist that joins. The exact number of pediatric hospitalists is unknown. A reasonable approximation of Listserv members at the time the survey was introduced is 1800. A fraction of that number is active on the Listserv, as defined by multiple postings during the course of an academic year. Pediatric hospitalists were the targeted group because of their expertise in the care of the adolescent and, often, young adult, with SHCN. The survey was voluntary and anonymous, and was reintroduced 3 times to capture as many participants as possible. The purpose of the survey was to gauge the interest, attitudes, and understanding of healthcare transition in a cross section of pediatric hospitalists.
Definitions
For clarity, in this survey, transfer is defined as an event, a handoff of responsibility for the management of a patient from one physician to another. Transition is defined as the purposeful planned movement of adolescents and young adults, with chronic medical conditions and disabilities, from pediatric (child‐centered) to adult‐oriented providers and facilities.2
Survey
This questionnaire contained 33 items and included a mixture of open‐ended questions, yes and no questions, and questions with responses that used a modified Likert scale. The survey questions were not adapted from another study or survey; they were developed in conjunction with 2 well‐published experts on the subject of transition. The demographic questions were used to help determine whether patterns related to transition services and knowledge could be detected based on age, gender, or type of practice, whether academic or community. The survey content included several areas: 1) Who is responsible for the care of young adults and adolescents; 2) Hospital‐based transition services; 3) Benefits or challenges for pediatric hospitalists who become involved in health care transition (HCT); 4) Knowledge of HCT and education opportunities. Informed consent was the first page; if consent was obtained, the participant could move forward in the survey (Table 1).
| Who is primarily responsible for inpatient care of patients 16‐21? |
| Please rate your knowledge of healthcare transition. |
| Are there healthcare transition services in your hospital? |
| How old are patients when they first receive inpatient‐oriented healthcare transition services? |
| How beneficial are these services to the patient and the provider if available? |
| Does your hospital have a policy that mandates the age by which an adolescent/young adult patient must be transferred from Pediatrics to adult providers and facilities? |
| What factors determine age of transfer? |
| How big a problem is it transferring adolescent/young adult patients from Pediatrics to adult providers and facilities? |
| How prepared are adolescents and young adults in your institution for transition to adult services? |
| Should pediatric hospitalists be involved in providing healthcare transition services and supports to patients with chronic healthcare conditions in the inpatient setting? |
| How often have you been asked by a subspecialist to provide healthcare transition services and supports to patients with chronic health conditions in the inpatient setting? |
| Who is best qualified to provide healthcare transition services? |
| What are the biggest impediments and benefits to hospitalist involvement in healthcare transition services? |
| If there was an online educational training module about healthcare transitions, would you take it? |
RESULTS
There were 131 participants who consented to participate in, and completed, the survey.
Demographics
Of all participants, 42.5% identified their primary practice site as a pediatric hospital; 40.8% identified their primary practice setting as a children's hospital within a general hospital, and 15.8% identified their primary practice setting as a general hospital with pediatric beds but no designation as a children's hospital. The participants came from nearly every state in the United States; 69.2% were women and 30.8% were men. The ages ranged from 27 to 67, with the majority of participants in their mid‐30s and 40s. Most were boarded in Pediatrics and/or Internal Medicine with some subspecialties such as Physical Medical and Rehabilitation, Cardiology, Critical Care, Pulmonology, and Developmental and Behavioral Pediatrics represented. Although the sample size is small, it is representative of the larger population of pediatric hospitalists. There were no patterns detected based on demographics relative to the knowledge or participation in healthcare transition (Table 2).
| Male | Female | |
|---|---|---|
| Age range | 3267 years | 2761 years |
| Boarded in Pediatrics/Pediatric subspecialty | 92% | 99% |
| Practice setting | ||
| Pediatric hospital | 51.4% | 38.6% |
| General hospital with a pediatric hospital within it | 27% | 47% |
| General hospital with pediatric beds but no children's hospital designation | 21.6% | 13.3% |
| Other | 8.1% | 7.2% |
Which Groups of Physicians Are Caring for Adolescent and Young Adult Patients?
Establishing whether pediatric subspecialists, adult providers, or pediatric hospitalists are the primary caregivers for adolescents and young adults with SCHN is important to determine whether the pediatric hospitalist is really well poised to deal with transition issues. If the pediatric hospitalist does not care for these patients, then developing modules to educate them about healthcare transition may not be necessary. As expected, pediatric hospitalists believe they care for adolescent and young adult patients with special healthcare needs in the vast majority of cases. Table 3 illustrates in more detail who is specifically responsible for their care.
| Patient Age | ||
|---|---|---|
| 1617 | 1820 | |
| ||
| Inpatient care provider | ||
| Pediatric hospitalist | 70.1%* | 36.8% |
| Adult hospitalist | 0.9% | 27.4% |
| Pediatric subspecialist | 27.4% | 25.6% |
| Adult subspecialist | 0.9% | 2.6% |
| Other/not sure | 7.7% | 0.9% |
Knowledge of Healthcare Transition
Participants in the survey were provided definitions of healthcare transition; they were asked to rate their knowledge of healthcare transition on a modified Likert scale, given the definition provided. The results can be seen in Figure 1.
Transition Programs
Of all participants, 60.9% did not know if their hospital had inpatient‐oriented healthcare transition services. Another 27.8% only had informal or unstructured services for some patients with a chronic condition, and less than 1% of all respondents said they had a formal or structured program at their institution for inpatients with any chronic medical condition. Eighty percent thought transferring adolescent or young adult patients from pediatric to adult providers was a moderate to major problem.
Of those who responded to the survey, 97.6% feel that inpatient‐oriented healthcare transition services would be beneficial to adolescent and young adult patients, and 92.2% felt that these supports would be beneficial to pediatric providers. This is consistent with the data from another question in which respondents felt that only 1% of patients were quite a bit prepared for transition to inpatient adult providers, and that over half were only a little bit or not at all prepared.
Institutional Mandates
Nearly 40% of institutions have a mandated age by which adolescent and young adult patients must be transferred to adult providers and facilities. Additionally, only 5.2% of those institutions have a written procedure or protocol that describes how these pediatric patients will be transferred to adult providers and institutions.
Pediatric Hospitalist Participation in Transition
Sixty‐eight percent of respondents believe that the patient's primary care provider is the most qualified to discuss healthcare transition issues, followed by their pediatric subspecialists. However, more than 75% of respondents agree or strongly agree that pediatric hospitalists should be involved in providing healthcare transition services and supports to inpatients with chronic health conditions. Please refer to Table 4. Despite this, 58% of pediatric hospitalists are rarely, if ever, asked to participate in healthcare transition by their subspecialist counterparts.
| Respondents, % (No.) | |
|---|---|
| Strongly agree | 28.6 (28) |
| Agree | 50.0 (49) |
| Neither agree or disagree | 12.2 (12) |
| Disagree | 6.1 (6) |
| Strongly disagree | 3.1 (3) |
Barriers to Pediatric Hospitalist Participation in Transition
The survey participants were given a list of potential barriers to participation in healthcare transition and were asked to rank 3 of the choices in order of significance, with 1 being the biggest perceived impediment and 3 being the least significant. Seventeen percent ranked lack of familiarity with healthcare transition resources as the biggest barrier in their setting. Thirteen percent indicated that lack of support from pediatric and adult subspecialists is the major barrier, and 13% felt that insufficient time to provide transition services and supports would be the most significant barrier to their participation in transition. Interestingly, billing and reimbursement issues were not seen as obstacles (see Supporting Information 1/Table 5 in the online version of this article).
Advantages to Pediatric Hospitalist Participation in Transition
The participants were given a set of potential benefits that might result from the pediatric hospitalist participation in transition of care. They were asked to rank 3 of the choices in order of importance, with 1 being the most important positive outcome to 3 being a lesser, but still positive, outcome. Twenty‐three percent of respondents ranked improved communication between pediatric and adult providers and facilities as being the most significant advantage. Twenty‐one percent ranked both better continuity of care in the inpatient setting, and better quality of care for adolescents and young adults with chronic healthcare conditions, as the most important potential advantages of pediatric hospitalist involvement in healthcare transition. However, most felt that improved cost effectiveness would not be an important result (see Supporting Information 2/Table 6 in the online version of this article).
Educational Process
If an educational module was offered, over half of the respondents would definitely or probably take the training, and another 22% might take the training.
LIMITATIONS
This is an exploratory study which is limited by the small number of participants. Although the demographics of the participants include both young and experienced hospitalists, as well as academic and community institutions, it is difficult to determine whether the results are truly representative of the larger pediatric hospitalist population. The survey was also too long which may have deterred participation. Given the lack of experience and literature on pediatric hospitalist involvement in transition of care, it is difficult to construct a concise survey that addresses all of the concerns of the diverse hospitalist population. This is a new area of exploration for pediatric hospitalists, and ideally new questions will arise out of these preliminary findings, despite the limitations in the survey. Future surveys should focus on singular issues related to transition, and every attempt should be made to increase participation in the survey.
DISCUSSION
The survey demonstrates that the majority of the pediatric hospitalists believe providing transition services is important, but that transition programs are, for all practical purposes, nonexistent. Hospitalists believe the primary care doctor or the subspecialists should direct the transition process, but most clearly believe that their participation in the process would be beneficial for their patients, as evidenced by a 97.6% positive response to that question in the survey. Transition of care should be handled predominantly in the medical home.1 At this point, there is no literature that describes a pediatric hospitalist service as an inpatient medical home. However, pediatric hospitalists, not pediatric subspecialists, care for the majority of patients with SHCN in the transition age range while they are hospitalized; therefore, continuing the transition discussion while a patient is hospitalized may be a key component to its success. Better quality and continuity of care for the inpatient with SHCN is a potential advantage, as is coordination of services. Having the support of the pediatric subspecialists and the pediatric primary care provider is not only important, but it is critical in successful transition. Further, most pediatric hospitalists identify transfer of pediatric patients to adult providers as a major problem, and the perception is that only 1% of patients are adequately prepared for this transfer of care. Few institutions have a formalized process by which patients are transferred to adult care providers; however, many institutions have a mandated age at which they expect transfer of care to occur.
The literature about transition of care highlights the issues in the outpatient setting. Reiss and Gibson used focus groups comprised of caregivers, and youth and young adults with SHCN, to explore the issues related to transition of care.7 They identified several factors associated with successful transition that are pertinent to inpatient pediatrics. Involving the patient as a responsible member of the treatment team is important because it fosters independence and problem solving.7 Advocating this in the inpatient setting gives the patient and caregivers confidence that the patient can participate in the healthcare process, thereby making it a habit.7 A second important factor is attending to the patient's personal preferences and interpersonal dynamics.7 Many adolescents and young adult patients prefer to be cared for by their pediatric providers on adult wards away from crying infants and children.7 This may be their first indication that they'd like to explore the adult medical world.7
Pediatric hospitalists should be prepared to meet the needs of adolescent and young adult patients with SCHN by becoming familiar with the components of the transition process. Saidi and Kovacs provide a checklist of practical transition strategies that are helpful to review, and many are quite pertinent to the practice of pediatric hospital medicine.8 Education is a fundamental aspect of the identity of the pediatric hospitalist and is also the foundation of the transition process. Identifying established institutional transition resources, developing educational tools for faculty and residents to learn about transition, as well as adapting the transition checklist to inpatient needs are useful tools for developing a culture of effective healthcare transition. Simple strategies, such as speaking to young patients on their own, and displaying a public commitment to transition are other easy changes that can be made to the everyday activities of the pediatric hospitalist.8
Other key issues that would be important for the pediatric hospitalist to address are the adolescents' understanding of his/her disease, current treatments, long‐term complications, and the impact of healthy and unhealthy behaviors.9 Because these issues can directly affect his/her hospitalization, the pediatric hospitalist should play a role in discussing these issues and reaffirming their importance in the overall health of the patient. This affirmation will also support the process of transition, and will give further confidence to the patient and family that the patient is becoming a responsible member of the healthcare team.
Many of the strategies espoused by experts in transition are part of what the pediatric hospitalist does regularly. The pediatric hospitalist is a resource for patients, families, and subspecialists, because of their comfort and expertise managing complex pediatric patients and because of their understanding of the hospital and how it functions. The process of transition of care should be part of what pediatric hospitalists are prepared to teach, because of the numbers of adolescent and young adult patients that are in their care. The current knowledge base for most pediatric hospitalists seems to be a basic understanding of what transition of care means, but little knowledge about how to go about engaging in the process. More and more transition is relevant to primary care doctors and hospitalists, as the medically complex patient survives into adolescence and adulthood.
CONCLUSION
The survey provides a snapshot of the current attitudes and beliefs of pediatric hospitalists relative to involvement in healthcare transition. This article addresses what we believe to be important questions for the pediatric hospitalist to ask, prior to becoming involved in healthcare transition. Our hypothesis, that pediatric hospitalists are well poised to provide inpatient transition services but are limited by lack of understanding of the concepts and process, is supported by the responses in the survey which show that pediatric hospitalists are interested in participating in healthcare transition but feel impeded by time, support, and understanding of the process of transition. A larger sample size is needed to strengthen the data and lend support to these observations. Additionally, more research to compare current models of transition services and a hospitalist model could be important in realizing the potential positive outcomes predicted in this survey. Education and resources for transition of care are inadequate. Targeted educational modules might provide a foundation for pediatric hospitalists to build their scope of practice to include transition services. The next step for interested pediatric hospitalists might be developing a web‐based module that addresses the unique needs of the inpatient provider and the chronically ill pediatric patient who spends a great deal of time as an inpatient. The measurable outcomes for such an intervention might well be the feeling of preparation that the family and patient have as they move into the adult provider world.
- A consensus statement on health care transitions for young adults with special health care needs.Pediatrics.2002;110(6 pt 2):1304–1306.
- ,,,,,.Perceptions of transitional care needs and experiences in pediatric heart transplant recipients.Am J Transplant.2009;9(3):614–619.
- ,,,,,.Planning for health care transitions: results from the 2005–2006 National Survey of Children With Special Health Care Needs.Pediatrics.2009;123(1):e145–e152.
- US Department of Health and Human Services, Health Resources and Services Administration, Maternal and Child Health Bureau.The National Survey of Children With Special Health Care Needs, Chartbook 2005–2006.Rockville, MD:US Department of Health and Human Services;2008.
- ,,,,,.Changes in hospitalization patterns among patients with congenital heart disease during the transition from adolescence to adulthood.J Am Coll Cardiol.2007;49(8):875–882.
- ,,.Health care transition: youth, family, and provider perspectives.Pediatrics.2005;115(1):112–120.
- ,.Health care transition: destinations unknown.Pediatrics.2002;110(6 pt 2):1307–1314.
- ,.Developing a transition program from pediatric‐ to adult‐focused cardiology care: practical considerations.Congenit Heart Dis.2009;4(4):204–215.
- .Transition for youth with chronic conditions: primary care physicians' approaches.Pediatrics.2002;110(6 pt 2):1315–1321.
- A consensus statement on health care transitions for young adults with special health care needs.Pediatrics.2002;110(6 pt 2):1304–1306.
- ,,,,,.Perceptions of transitional care needs and experiences in pediatric heart transplant recipients.Am J Transplant.2009;9(3):614–619.
- ,,,,,.Planning for health care transitions: results from the 2005–2006 National Survey of Children With Special Health Care Needs.Pediatrics.2009;123(1):e145–e152.
- US Department of Health and Human Services, Health Resources and Services Administration, Maternal and Child Health Bureau.The National Survey of Children With Special Health Care Needs, Chartbook 2005–2006.Rockville, MD:US Department of Health and Human Services;2008.
- ,,,,,.Changes in hospitalization patterns among patients with congenital heart disease during the transition from adolescence to adulthood.J Am Coll Cardiol.2007;49(8):875–882.
- ,,.Health care transition: youth, family, and provider perspectives.Pediatrics.2005;115(1):112–120.
- ,.Health care transition: destinations unknown.Pediatrics.2002;110(6 pt 2):1307–1314.
- ,.Developing a transition program from pediatric‐ to adult‐focused cardiology care: practical considerations.Congenit Heart Dis.2009;4(4):204–215.
- .Transition for youth with chronic conditions: primary care physicians' approaches.Pediatrics.2002;110(6 pt 2):1315–1321.
Copyright © 2011 Society of Hospital Medicine
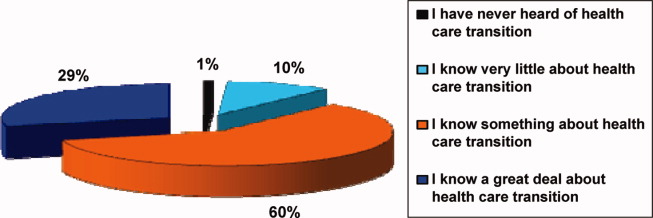
HPS: Benefits, Safety Persist With Long-Term Statin Use
The protection against vascular morbidity and mortality that resulted from lowering LDL cholesterol with simvastatin over a period of about 5 years in the Heart Protection Study persisted for nearly 6 additional years after study treatment ended, according to findings from an extended follow-up of the large randomized controlled trial.
Furthermore, no evidence of emerging safety concerns was apparent during the follow-up, the Heart Protection Study Collaborative Group reported online on Nov. 23 in the Lancet.
Participants in the Medical Research Council and British Heart Foundation Heart Protection Study (HPS) was composed of 20,536 adults aged 40-80 years who were at increased risk of vascular events and who were enrolled between July 1994 and May 1997. Those allocated to receive simvastatin experienced a mean reduction in LDL cholesterol of 1.0 mmol/L and a proportional reduction of 23% in major cardiovascular events during the 5-year study period.
The findings, along with those from other major trials of statins, provided "compelling evidence" of the value of lowering LDL cholesterol – and led to the widespread use of long-term statin treatment – but evidence from observational studies has raised concerns about possible increases in the risk of certain types of cancer and other nonvascular morbidity and mortality in patients with lower blood cholesterol concentrations, according to the study group.
The findings of the HPS extended follow-up appear to lay those concerns to rest.
At a mean of 5.3 years (for a total HPS follow-up of 11 years), the rate of first vascular events in previously event-free participants was similar in both the initial simvastatin group and the initial placebo (21.7% and 22.5%, respectively; risk ratio 0.95), the investigators said (Lancet 2011 Nov. 23 [doi:10.1016/S0140-6736(11)61125-2]).
Although a further 14% decrease in vascular events occurred in the first year in the simvastatin group, little difference was seen between the treatment and placebo groups thereafter. Similar patterns were seen for major coronary events, strokes, and revascularization procedures.
Vascular mortality was also similar in the two groups during the post-trial follow-up (11.5% and 11.6% in the simvastatin and placebo groups). During the in-trial period, an 18% proportional reduction in vascular mortality was seen in the treatment group, so the follow-up findings indicate that the in-trial survival gains persisted, they investigators said.
Nonvascular mortality rates were also similar in the two groups during the post-trial follow-up (10.6% and 10.9%). There were no differences in deaths from cancer, respiratory disease, or nonmedical causes.
"When the 11 years of in-trial and post-trial follow-up are considered together, allocation to about 5 years of statin treatment was not associated with any increase in nonvascular mortality, either overall [14.8% vs. 15.1%] or for any prespecified category of death," they said.
As for first diagnoses of any type of cancer, rates were also similar in the in-trial and post-trial periods, for a combined incidence of 17% in each group.
"Indeed, even during the later years of this prolonged follow-up, no suggestion was noted of any emerging difference in the overall incidence of cancer," the investigators said, noting that the large numbers of incident cancer that occurred during the entire in-trial and post-trial period allowed for reliable assessment of the effects of the substantial 5-year reduction in cholesterol on 11-year risks of common cancer types. No significant differences were seen in the incidences of genitourinary, gastrointestinal, respiratory, hematologic, or any other malignant disease, even in those aged 70 years or older at baseline, and in those with below-average pretreatment cholesterol concentrations.
Statin use was encouraged in all HPS participants following the initial study treatment period and was similar in both treatment groups during the post-trial follow-up at about 59% in the first year and increasing to about 84% in the fifth year. LDL cholesterol concentrations were also similar at 2.6 mmol/L in both groups at 3.2 years, the investigators noted.
Although 11 years might not be long enough to fully discern all cancer and other risks in this study population, it is notable that no adverse trend was noted, even during the later years of follow-up, the researchers wrote.
The findings are consistent with those from four other large randomized trials of statin treatment, and, taken together, the data support the prompt initiation and long-term continuation of statin treatment in individuals at increased risk of vascular events, they concluded.
This study was supported by the UK Medical Research Council, the British Heart Foundation, Merck & Co., and Roche Vitamins. The HPS Collaborative Study Group is bound by a policy of not accepting honoraria or other payments from the pharmaceutical industry other than reimbursement of costs to participate in scientific meetings. As a result, the only disclosures of the group relate to such reimbursement.
In light of the findings of the HPS Collaborative Study Group, doctors should feel reassured about the long-term safety of statin use to lower LDL cholesterol, Dr. Payal Kohli and Dr. Christopher P. Cannon wrote in an editorial.
Given that follow-up in most prior studies did not extend beyond 5 years and that some data have suggested an increase in cancer risk in patients with very-low cholesterol levels – and possibly with prolonged statin treatment – concerns about an increased risk of cancers that take longer than 5 years to emerge have persisted, they said.
The finding of the HPS extended follow-up, however, provide "contemporary and confirmatory" evidence to the contrary, they added (Lancet 2011 Nov. 23[doi.10.1016/S0140-6736(11)61544-4]).
The findings indicate the risk of cancer and nonvascular mortality is not increased with extended statin use, even among elderly patients.
The original concerns about statin safety were from observational data, which were most likely heavily confounded, they said.
"We now have strong evidence from HPS and several other randomized controlled trials that prolonged treatment with statins is indeed efficacious, safe, and has long-lasting beneficial effects, even after discontinuation of therapy," they concluded.
Dr. Kohli and Dr. Cannon are with the TIMI Study Group, Cardiovascular Division, Brigham and Women’s Hospital, Boston. Dr. Cannon disclosed that he has received research funding from Accumetrics, AstraZeneca, GlaxoSmithKline, Merck, and Takeda, and that he has received honoraria from Pfizer and AstraZeneca. He has also participated in advisory boards for Bristol-Myers Squibb/Sanofi, Novartis, and Alnylam, and he has equity in Automedics Medical Systems. Dr. Kohli had no disclosures.
In light of the findings of the HPS Collaborative Study Group, doctors should feel reassured about the long-term safety of statin use to lower LDL cholesterol, Dr. Payal Kohli and Dr. Christopher P. Cannon wrote in an editorial.
Given that follow-up in most prior studies did not extend beyond 5 years and that some data have suggested an increase in cancer risk in patients with very-low cholesterol levels – and possibly with prolonged statin treatment – concerns about an increased risk of cancers that take longer than 5 years to emerge have persisted, they said.
The finding of the HPS extended follow-up, however, provide "contemporary and confirmatory" evidence to the contrary, they added (Lancet 2011 Nov. 23[doi.10.1016/S0140-6736(11)61544-4]).
The findings indicate the risk of cancer and nonvascular mortality is not increased with extended statin use, even among elderly patients.
The original concerns about statin safety were from observational data, which were most likely heavily confounded, they said.
"We now have strong evidence from HPS and several other randomized controlled trials that prolonged treatment with statins is indeed efficacious, safe, and has long-lasting beneficial effects, even after discontinuation of therapy," they concluded.
Dr. Kohli and Dr. Cannon are with the TIMI Study Group, Cardiovascular Division, Brigham and Women’s Hospital, Boston. Dr. Cannon disclosed that he has received research funding from Accumetrics, AstraZeneca, GlaxoSmithKline, Merck, and Takeda, and that he has received honoraria from Pfizer and AstraZeneca. He has also participated in advisory boards for Bristol-Myers Squibb/Sanofi, Novartis, and Alnylam, and he has equity in Automedics Medical Systems. Dr. Kohli had no disclosures.
In light of the findings of the HPS Collaborative Study Group, doctors should feel reassured about the long-term safety of statin use to lower LDL cholesterol, Dr. Payal Kohli and Dr. Christopher P. Cannon wrote in an editorial.
Given that follow-up in most prior studies did not extend beyond 5 years and that some data have suggested an increase in cancer risk in patients with very-low cholesterol levels – and possibly with prolonged statin treatment – concerns about an increased risk of cancers that take longer than 5 years to emerge have persisted, they said.
The finding of the HPS extended follow-up, however, provide "contemporary and confirmatory" evidence to the contrary, they added (Lancet 2011 Nov. 23[doi.10.1016/S0140-6736(11)61544-4]).
The findings indicate the risk of cancer and nonvascular mortality is not increased with extended statin use, even among elderly patients.
The original concerns about statin safety were from observational data, which were most likely heavily confounded, they said.
"We now have strong evidence from HPS and several other randomized controlled trials that prolonged treatment with statins is indeed efficacious, safe, and has long-lasting beneficial effects, even after discontinuation of therapy," they concluded.
Dr. Kohli and Dr. Cannon are with the TIMI Study Group, Cardiovascular Division, Brigham and Women’s Hospital, Boston. Dr. Cannon disclosed that he has received research funding from Accumetrics, AstraZeneca, GlaxoSmithKline, Merck, and Takeda, and that he has received honoraria from Pfizer and AstraZeneca. He has also participated in advisory boards for Bristol-Myers Squibb/Sanofi, Novartis, and Alnylam, and he has equity in Automedics Medical Systems. Dr. Kohli had no disclosures.
The protection against vascular morbidity and mortality that resulted from lowering LDL cholesterol with simvastatin over a period of about 5 years in the Heart Protection Study persisted for nearly 6 additional years after study treatment ended, according to findings from an extended follow-up of the large randomized controlled trial.
Furthermore, no evidence of emerging safety concerns was apparent during the follow-up, the Heart Protection Study Collaborative Group reported online on Nov. 23 in the Lancet.
Participants in the Medical Research Council and British Heart Foundation Heart Protection Study (HPS) was composed of 20,536 adults aged 40-80 years who were at increased risk of vascular events and who were enrolled between July 1994 and May 1997. Those allocated to receive simvastatin experienced a mean reduction in LDL cholesterol of 1.0 mmol/L and a proportional reduction of 23% in major cardiovascular events during the 5-year study period.
The findings, along with those from other major trials of statins, provided "compelling evidence" of the value of lowering LDL cholesterol – and led to the widespread use of long-term statin treatment – but evidence from observational studies has raised concerns about possible increases in the risk of certain types of cancer and other nonvascular morbidity and mortality in patients with lower blood cholesterol concentrations, according to the study group.
The findings of the HPS extended follow-up appear to lay those concerns to rest.
At a mean of 5.3 years (for a total HPS follow-up of 11 years), the rate of first vascular events in previously event-free participants was similar in both the initial simvastatin group and the initial placebo (21.7% and 22.5%, respectively; risk ratio 0.95), the investigators said (Lancet 2011 Nov. 23 [doi:10.1016/S0140-6736(11)61125-2]).
Although a further 14% decrease in vascular events occurred in the first year in the simvastatin group, little difference was seen between the treatment and placebo groups thereafter. Similar patterns were seen for major coronary events, strokes, and revascularization procedures.
Vascular mortality was also similar in the two groups during the post-trial follow-up (11.5% and 11.6% in the simvastatin and placebo groups). During the in-trial period, an 18% proportional reduction in vascular mortality was seen in the treatment group, so the follow-up findings indicate that the in-trial survival gains persisted, they investigators said.
Nonvascular mortality rates were also similar in the two groups during the post-trial follow-up (10.6% and 10.9%). There were no differences in deaths from cancer, respiratory disease, or nonmedical causes.
"When the 11 years of in-trial and post-trial follow-up are considered together, allocation to about 5 years of statin treatment was not associated with any increase in nonvascular mortality, either overall [14.8% vs. 15.1%] or for any prespecified category of death," they said.
As for first diagnoses of any type of cancer, rates were also similar in the in-trial and post-trial periods, for a combined incidence of 17% in each group.
"Indeed, even during the later years of this prolonged follow-up, no suggestion was noted of any emerging difference in the overall incidence of cancer," the investigators said, noting that the large numbers of incident cancer that occurred during the entire in-trial and post-trial period allowed for reliable assessment of the effects of the substantial 5-year reduction in cholesterol on 11-year risks of common cancer types. No significant differences were seen in the incidences of genitourinary, gastrointestinal, respiratory, hematologic, or any other malignant disease, even in those aged 70 years or older at baseline, and in those with below-average pretreatment cholesterol concentrations.
Statin use was encouraged in all HPS participants following the initial study treatment period and was similar in both treatment groups during the post-trial follow-up at about 59% in the first year and increasing to about 84% in the fifth year. LDL cholesterol concentrations were also similar at 2.6 mmol/L in both groups at 3.2 years, the investigators noted.
Although 11 years might not be long enough to fully discern all cancer and other risks in this study population, it is notable that no adverse trend was noted, even during the later years of follow-up, the researchers wrote.
The findings are consistent with those from four other large randomized trials of statin treatment, and, taken together, the data support the prompt initiation and long-term continuation of statin treatment in individuals at increased risk of vascular events, they concluded.
This study was supported by the UK Medical Research Council, the British Heart Foundation, Merck & Co., and Roche Vitamins. The HPS Collaborative Study Group is bound by a policy of not accepting honoraria or other payments from the pharmaceutical industry other than reimbursement of costs to participate in scientific meetings. As a result, the only disclosures of the group relate to such reimbursement.
The protection against vascular morbidity and mortality that resulted from lowering LDL cholesterol with simvastatin over a period of about 5 years in the Heart Protection Study persisted for nearly 6 additional years after study treatment ended, according to findings from an extended follow-up of the large randomized controlled trial.
Furthermore, no evidence of emerging safety concerns was apparent during the follow-up, the Heart Protection Study Collaborative Group reported online on Nov. 23 in the Lancet.
Participants in the Medical Research Council and British Heart Foundation Heart Protection Study (HPS) was composed of 20,536 adults aged 40-80 years who were at increased risk of vascular events and who were enrolled between July 1994 and May 1997. Those allocated to receive simvastatin experienced a mean reduction in LDL cholesterol of 1.0 mmol/L and a proportional reduction of 23% in major cardiovascular events during the 5-year study period.
The findings, along with those from other major trials of statins, provided "compelling evidence" of the value of lowering LDL cholesterol – and led to the widespread use of long-term statin treatment – but evidence from observational studies has raised concerns about possible increases in the risk of certain types of cancer and other nonvascular morbidity and mortality in patients with lower blood cholesterol concentrations, according to the study group.
The findings of the HPS extended follow-up appear to lay those concerns to rest.
At a mean of 5.3 years (for a total HPS follow-up of 11 years), the rate of first vascular events in previously event-free participants was similar in both the initial simvastatin group and the initial placebo (21.7% and 22.5%, respectively; risk ratio 0.95), the investigators said (Lancet 2011 Nov. 23 [doi:10.1016/S0140-6736(11)61125-2]).
Although a further 14% decrease in vascular events occurred in the first year in the simvastatin group, little difference was seen between the treatment and placebo groups thereafter. Similar patterns were seen for major coronary events, strokes, and revascularization procedures.
Vascular mortality was also similar in the two groups during the post-trial follow-up (11.5% and 11.6% in the simvastatin and placebo groups). During the in-trial period, an 18% proportional reduction in vascular mortality was seen in the treatment group, so the follow-up findings indicate that the in-trial survival gains persisted, they investigators said.
Nonvascular mortality rates were also similar in the two groups during the post-trial follow-up (10.6% and 10.9%). There were no differences in deaths from cancer, respiratory disease, or nonmedical causes.
"When the 11 years of in-trial and post-trial follow-up are considered together, allocation to about 5 years of statin treatment was not associated with any increase in nonvascular mortality, either overall [14.8% vs. 15.1%] or for any prespecified category of death," they said.
As for first diagnoses of any type of cancer, rates were also similar in the in-trial and post-trial periods, for a combined incidence of 17% in each group.
"Indeed, even during the later years of this prolonged follow-up, no suggestion was noted of any emerging difference in the overall incidence of cancer," the investigators said, noting that the large numbers of incident cancer that occurred during the entire in-trial and post-trial period allowed for reliable assessment of the effects of the substantial 5-year reduction in cholesterol on 11-year risks of common cancer types. No significant differences were seen in the incidences of genitourinary, gastrointestinal, respiratory, hematologic, or any other malignant disease, even in those aged 70 years or older at baseline, and in those with below-average pretreatment cholesterol concentrations.
Statin use was encouraged in all HPS participants following the initial study treatment period and was similar in both treatment groups during the post-trial follow-up at about 59% in the first year and increasing to about 84% in the fifth year. LDL cholesterol concentrations were also similar at 2.6 mmol/L in both groups at 3.2 years, the investigators noted.
Although 11 years might not be long enough to fully discern all cancer and other risks in this study population, it is notable that no adverse trend was noted, even during the later years of follow-up, the researchers wrote.
The findings are consistent with those from four other large randomized trials of statin treatment, and, taken together, the data support the prompt initiation and long-term continuation of statin treatment in individuals at increased risk of vascular events, they concluded.
This study was supported by the UK Medical Research Council, the British Heart Foundation, Merck & Co., and Roche Vitamins. The HPS Collaborative Study Group is bound by a policy of not accepting honoraria or other payments from the pharmaceutical industry other than reimbursement of costs to participate in scientific meetings. As a result, the only disclosures of the group relate to such reimbursement.
FROM THE LANCET
Major Finding: At a mean of 5.3 years (for a total HPS follow-up of 11 years), the rate of first vascular events in previously event-free participants was similar in both the initial simvastatin group and the initial placebo (21.7% and 22.5%, respectively; risk ratio, 0.95).Similar patterns were seen for major coronary events (RR, 0.96), strokes (RR 0.98), revascularization procedures (RR, 0.93), vascular mortality (RR, 0.98), nonvascular mortality (RR, 0.97), and cancer incidence (RR, 0.98).
Data Source: An extended follow-up of the randomized controlled Health Protection Study
Disclosures: This study was supported by the UK Medical Research Council, the British Heart Foundation, Merck & Co., and Roche Vitamins. The HPS Collaborative Study Group is bound by a policy of not accepting honoraria or other payments from the pharmaceutical industry other than reimbursement of costs to participate in scientific meetings. As a result, the only disclosures of the group relate to such reimbursement.
Branching Out
Michele Torres, MD, a family-medicine-trained hospitalist at Good Samaritan Hospital in Dayton, Ohio, wanted to diversify her medical practice. So she created Youthinity, a cosmetic spa that utilizes laser lipolysis to sculpt, slim, and contour women’s bodies.
Launched in September following 18 months of business planning, the spa includes other cosmetic treatments, such as Botox and Juvederm, for wrinkles in a relaxed spa environment. The business employs a full-time office manager and a per-diem nurse to help with procedures.
“I love hospital medicine and don’t want to leave it, but I don’t want to have all my eggs in one basket, either,” Dr. Torres says..jpg)
Dr. Torres has been a hospitalist for five years and founded an HM program at another hospital. But hospital mergers, the uncertainties of healthcare reform, and hospitalist scheduling demands made her want to establish a second medical practice that didn’t tie her down to as many hospital shifts. She currently works a seven-on, seven-off HM schedule, and is able to schedule laser procedures during the off weeks or after hours. She also hopes to reduce her HM hours as the business grows.
Another driving force behind the business was the desire as a female physician to offer procedures that are primarily—although not exclusively—sought by women.
"It's really a very different experience than hospital medicine. You need to enjoy doing procedures," she adds. "In a business like this, it's also very market-driven and hands-on. People having the procedures done want to know their doctors. If someone is paying for this procedure, they want to feel pampered."
Michele Torres, MD, a family-medicine-trained hospitalist at Good Samaritan Hospital in Dayton, Ohio, wanted to diversify her medical practice. So she created Youthinity, a cosmetic spa that utilizes laser lipolysis to sculpt, slim, and contour women’s bodies.
Launched in September following 18 months of business planning, the spa includes other cosmetic treatments, such as Botox and Juvederm, for wrinkles in a relaxed spa environment. The business employs a full-time office manager and a per-diem nurse to help with procedures.
“I love hospital medicine and don’t want to leave it, but I don’t want to have all my eggs in one basket, either,” Dr. Torres says.
Dr. Torres has been a hospitalist for five years and founded an HM program at another hospital. But hospital mergers, the uncertainties of healthcare reform, and hospitalist scheduling demands made her want to establish a second medical practice that didn’t tie her down to as many hospital shifts. She currently works a seven-on, seven-off HM schedule, and is able to schedule laser procedures during the off weeks or after hours. She also hopes to reduce her HM hours as the business grows.
Another driving force behind the business was the desire as a female physician to offer procedures that are primarily—although not exclusively—sought by women.
"It's really a very different experience than hospital medicine. You need to enjoy doing procedures," she adds. "In a business like this, it's also very market-driven and hands-on. People having the procedures done want to know their doctors. If someone is paying for this procedure, they want to feel pampered."
Michele Torres, MD, a family-medicine-trained hospitalist at Good Samaritan Hospital in Dayton, Ohio, wanted to diversify her medical practice. So she created Youthinity, a cosmetic spa that utilizes laser lipolysis to sculpt, slim, and contour women’s bodies.
Launched in September following 18 months of business planning, the spa includes other cosmetic treatments, such as Botox and Juvederm, for wrinkles in a relaxed spa environment. The business employs a full-time office manager and a per-diem nurse to help with procedures.
“I love hospital medicine and don’t want to leave it, but I don’t want to have all my eggs in one basket, either,” Dr. Torres says.
Dr. Torres has been a hospitalist for five years and founded an HM program at another hospital. But hospital mergers, the uncertainties of healthcare reform, and hospitalist scheduling demands made her want to establish a second medical practice that didn’t tie her down to as many hospital shifts. She currently works a seven-on, seven-off HM schedule, and is able to schedule laser procedures during the off weeks or after hours. She also hopes to reduce her HM hours as the business grows.
Another driving force behind the business was the desire as a female physician to offer procedures that are primarily—although not exclusively—sought by women.
"It's really a very different experience than hospital medicine. You need to enjoy doing procedures," she adds. "In a business like this, it's also very market-driven and hands-on. People having the procedures done want to know their doctors. If someone is paying for this procedure, they want to feel pampered."

FDA Approves Chemotherapeutic Enzyme L-Asparaginase
The Food and Drug Administration on Nov. 18 granted orphan drug status to asparaginase Erwinia chrysanthemi, a chemotherapeutic enzyme indicated for patients with acute lymphoblastic leukemia* who have become allergic to pegaspargase or asparaginase derived from Escherichia coli.
The new drug (Erwinaze) is derived from Erwinia chrysanthemi, a gram-negative bacillus related to E. coli.
It works by the same mechanism as the two previously approved agents – blocking asparagine, a protein necessary for the proliferation of neoplastic cells, according to an FDA press statement.
"The approval of Erwinaze underscores the FDA’s commitment to the approval of drugs for conditions with limited patient populations with unmet medical needs using novel trial end points," Dr. Richard Pazdur, director of the Office of Hematology and Oncology Products in the FDA’s Center for Drug Evaluation and Research, said in the statement.
According to the prescribing information, asparaginase Erwinia chrysanthemi is indicated as part of a multi-agent treatment regimen for patients with hypersensitivity to E. coli–derived asparaginase.
To substitute for a dose of pegaspargase, patients should receive 25,000 IU/m2 of asparaginase Erwinia chrysanthemi administered intramuscularly three times a week (six doses for each planned dose of pegaspargase). To substitute for a dose of native E. coli asparaginase, the recommended dose of asparaginase Erwinia chrysanthemi is 25,000 IU/m2 intramuscularly for each scheduled dose of the E. coli–derived drug.
Two pivotal trials influenced the approval, the press statement noted. These included the ongoing Erwinase Master Treatment Protocol with full data on 843 patients, and a completed trial of 58 patients.
In each study, the main end point was the number of patients with sustained asparaginase activity levels that have been correlated with better disease control and survival, according to a statement on the National Cancer Institute Web site.
"The major efficacy outcome was attainment of sustained serum asparaginase activity levels of 0.1 IU/mL or higher, which has been demonstrated to correlate with asparagine depletion and to serum levels that predict clinical efficacy," according to the prescribing information. Among 48 patients with available samples, all achieved this threshold trough level of asparaginase activity.
The most common side effect associated with the drug was allergic reaction (17%), the prescribing information notes. Other side effects included pancreatitis (4%), coagulation abnormalities (3%), abnormal liver function (4%), and hyperglycemia (2%).
Nausea, vomiting, or abdominal pain was reported in 5%, while headache, diarrhea, or seizure occurred in 1% each.
EUSA Pharma Inc. of Langhorne, Pa., manufactures the drug. A patient education page is available.
*CORRECTION 12/22/11: This sentence originally stated that the enzyme was indicated for chronic lymphoblastic anemia. The sentence has been corrected to chronic lymphoblastic leukemia.
The Food and Drug Administration on Nov. 18 granted orphan drug status to asparaginase Erwinia chrysanthemi, a chemotherapeutic enzyme indicated for patients with acute lymphoblastic leukemia* who have become allergic to pegaspargase or asparaginase derived from Escherichia coli.
The new drug (Erwinaze) is derived from Erwinia chrysanthemi, a gram-negative bacillus related to E. coli.
It works by the same mechanism as the two previously approved agents – blocking asparagine, a protein necessary for the proliferation of neoplastic cells, according to an FDA press statement.
"The approval of Erwinaze underscores the FDA’s commitment to the approval of drugs for conditions with limited patient populations with unmet medical needs using novel trial end points," Dr. Richard Pazdur, director of the Office of Hematology and Oncology Products in the FDA’s Center for Drug Evaluation and Research, said in the statement.
According to the prescribing information, asparaginase Erwinia chrysanthemi is indicated as part of a multi-agent treatment regimen for patients with hypersensitivity to E. coli–derived asparaginase.
To substitute for a dose of pegaspargase, patients should receive 25,000 IU/m2 of asparaginase Erwinia chrysanthemi administered intramuscularly three times a week (six doses for each planned dose of pegaspargase). To substitute for a dose of native E. coli asparaginase, the recommended dose of asparaginase Erwinia chrysanthemi is 25,000 IU/m2 intramuscularly for each scheduled dose of the E. coli–derived drug.
Two pivotal trials influenced the approval, the press statement noted. These included the ongoing Erwinase Master Treatment Protocol with full data on 843 patients, and a completed trial of 58 patients.
In each study, the main end point was the number of patients with sustained asparaginase activity levels that have been correlated with better disease control and survival, according to a statement on the National Cancer Institute Web site.
"The major efficacy outcome was attainment of sustained serum asparaginase activity levels of 0.1 IU/mL or higher, which has been demonstrated to correlate with asparagine depletion and to serum levels that predict clinical efficacy," according to the prescribing information. Among 48 patients with available samples, all achieved this threshold trough level of asparaginase activity.
The most common side effect associated with the drug was allergic reaction (17%), the prescribing information notes. Other side effects included pancreatitis (4%), coagulation abnormalities (3%), abnormal liver function (4%), and hyperglycemia (2%).
Nausea, vomiting, or abdominal pain was reported in 5%, while headache, diarrhea, or seizure occurred in 1% each.
EUSA Pharma Inc. of Langhorne, Pa., manufactures the drug. A patient education page is available.
*CORRECTION 12/22/11: This sentence originally stated that the enzyme was indicated for chronic lymphoblastic anemia. The sentence has been corrected to chronic lymphoblastic leukemia.
The Food and Drug Administration on Nov. 18 granted orphan drug status to asparaginase Erwinia chrysanthemi, a chemotherapeutic enzyme indicated for patients with acute lymphoblastic leukemia* who have become allergic to pegaspargase or asparaginase derived from Escherichia coli.
The new drug (Erwinaze) is derived from Erwinia chrysanthemi, a gram-negative bacillus related to E. coli.
It works by the same mechanism as the two previously approved agents – blocking asparagine, a protein necessary for the proliferation of neoplastic cells, according to an FDA press statement.
"The approval of Erwinaze underscores the FDA’s commitment to the approval of drugs for conditions with limited patient populations with unmet medical needs using novel trial end points," Dr. Richard Pazdur, director of the Office of Hematology and Oncology Products in the FDA’s Center for Drug Evaluation and Research, said in the statement.
According to the prescribing information, asparaginase Erwinia chrysanthemi is indicated as part of a multi-agent treatment regimen for patients with hypersensitivity to E. coli–derived asparaginase.
To substitute for a dose of pegaspargase, patients should receive 25,000 IU/m2 of asparaginase Erwinia chrysanthemi administered intramuscularly three times a week (six doses for each planned dose of pegaspargase). To substitute for a dose of native E. coli asparaginase, the recommended dose of asparaginase Erwinia chrysanthemi is 25,000 IU/m2 intramuscularly for each scheduled dose of the E. coli–derived drug.
Two pivotal trials influenced the approval, the press statement noted. These included the ongoing Erwinase Master Treatment Protocol with full data on 843 patients, and a completed trial of 58 patients.
In each study, the main end point was the number of patients with sustained asparaginase activity levels that have been correlated with better disease control and survival, according to a statement on the National Cancer Institute Web site.
"The major efficacy outcome was attainment of sustained serum asparaginase activity levels of 0.1 IU/mL or higher, which has been demonstrated to correlate with asparagine depletion and to serum levels that predict clinical efficacy," according to the prescribing information. Among 48 patients with available samples, all achieved this threshold trough level of asparaginase activity.
The most common side effect associated with the drug was allergic reaction (17%), the prescribing information notes. Other side effects included pancreatitis (4%), coagulation abnormalities (3%), abnormal liver function (4%), and hyperglycemia (2%).
Nausea, vomiting, or abdominal pain was reported in 5%, while headache, diarrhea, or seizure occurred in 1% each.
EUSA Pharma Inc. of Langhorne, Pa., manufactures the drug. A patient education page is available.
*CORRECTION 12/22/11: This sentence originally stated that the enzyme was indicated for chronic lymphoblastic anemia. The sentence has been corrected to chronic lymphoblastic leukemia.
Novel Gout Treatment Boosts Response in Allopurinol Nonresponders
CHICAGO – Combined treatment with allopurinol and the novel purine nucleoside phosphorylase inhibitor BCX4208 significantly lowered serum uric acid levels in gout patients who had failed to respond to allopurinol alone, according to findings from a randomized placebo-controlled trial involving 278 adults.
Between 33% and 49% of patients who received 12 weeks of combined treatment with BCX4208 at doses ranging from 5 to 40 mg/day plus allopurinol at 300 mg/day achieved the goal serum uric acid level of less than 6.0 mg/dL, compared with only 18% of those receiving placebo and allopurinol, Dr. William P. Sheridan reported during a late-breaking abstract session at the annual meeting of the American College of Rheumatology.
The response rates differed by BCX4208 dose, with 45%, 33%, 39%, and 49% of those receiving 5, 10, 20, and 40 mg, respectively, achieving goal serum uric acid levels. The differences between the 5, 20, and 40 mg groups and the placebo arm were statistically significant, said Dr. Sheridan of BioCryst Pharmaceuticals, Durham, N.C., which is the maker of BCX4208 and the sponsor of the study.
Gout flares occurred in 5%-11% of patient in each BCX4208 arm and in 5% of patient in the placebo group, and both the severity and frequency of adverse events were evenly distributed across dose groups. No opportunistic infections occurred.
Also, dose-related reductions in lymphocytes and lymphocyte subsets occurred during drug administration, but these appeared to plateau within 12 weeks, Dr. Sheridan said.
Discontinuations occurred in both the 20- and 40-mg groups because of confirmed CD4+ cell counts less than 350 cells/mm3. No patients in the other groups discontinued because of low CD4+ cell counts, he said.
Study participants were adults with a mean age of 49 years with a gout diagnosis and serum uric acid levels of 6.0 mg/dL or less who had not responded sufficiently after treatment with at least 2 weeks of allopurinol at 300 mg/day. All patients received colchicine or naproxen as prophylaxis for gout flares.
The participants had a high mean body mass index of 36 kg/m2, and comorbidities were common; 58% had hypertension, 16% had diabetes, and 39% had hypercholesterolemia.
The findings suggest that BCX4208 is generally safe and well tolerated when combined with allopurinol, and that the combination improves the likelihood that gout patient will reach goal serum uric acid levels, Dr. Sheridan said, noting that the findings are important given that few alternatives have existed for patients who fail to reach serum uric acid goal range with a xanthine oxidase inhibitor alone.
BCX4208 appears shows promise for those patients, and an extension phase of the study is underway, he said.
"The safety and tolerability profile on BCX4208 was quite satisfactory and certainly adequate for consideration of further clinical research," he concluded, noting that phase III studies are in development.
Dr. Sheridan disclosed that he is employed by BioCryst Pharmaceuticals, which is the maker of BCX4208 and the sponsor of this study.
CHICAGO – Combined treatment with allopurinol and the novel purine nucleoside phosphorylase inhibitor BCX4208 significantly lowered serum uric acid levels in gout patients who had failed to respond to allopurinol alone, according to findings from a randomized placebo-controlled trial involving 278 adults.
Between 33% and 49% of patients who received 12 weeks of combined treatment with BCX4208 at doses ranging from 5 to 40 mg/day plus allopurinol at 300 mg/day achieved the goal serum uric acid level of less than 6.0 mg/dL, compared with only 18% of those receiving placebo and allopurinol, Dr. William P. Sheridan reported during a late-breaking abstract session at the annual meeting of the American College of Rheumatology.
The response rates differed by BCX4208 dose, with 45%, 33%, 39%, and 49% of those receiving 5, 10, 20, and 40 mg, respectively, achieving goal serum uric acid levels. The differences between the 5, 20, and 40 mg groups and the placebo arm were statistically significant, said Dr. Sheridan of BioCryst Pharmaceuticals, Durham, N.C., which is the maker of BCX4208 and the sponsor of the study.
Gout flares occurred in 5%-11% of patient in each BCX4208 arm and in 5% of patient in the placebo group, and both the severity and frequency of adverse events were evenly distributed across dose groups. No opportunistic infections occurred.
Also, dose-related reductions in lymphocytes and lymphocyte subsets occurred during drug administration, but these appeared to plateau within 12 weeks, Dr. Sheridan said.
Discontinuations occurred in both the 20- and 40-mg groups because of confirmed CD4+ cell counts less than 350 cells/mm3. No patients in the other groups discontinued because of low CD4+ cell counts, he said.
Study participants were adults with a mean age of 49 years with a gout diagnosis and serum uric acid levels of 6.0 mg/dL or less who had not responded sufficiently after treatment with at least 2 weeks of allopurinol at 300 mg/day. All patients received colchicine or naproxen as prophylaxis for gout flares.
The participants had a high mean body mass index of 36 kg/m2, and comorbidities were common; 58% had hypertension, 16% had diabetes, and 39% had hypercholesterolemia.
The findings suggest that BCX4208 is generally safe and well tolerated when combined with allopurinol, and that the combination improves the likelihood that gout patient will reach goal serum uric acid levels, Dr. Sheridan said, noting that the findings are important given that few alternatives have existed for patients who fail to reach serum uric acid goal range with a xanthine oxidase inhibitor alone.
BCX4208 appears shows promise for those patients, and an extension phase of the study is underway, he said.
"The safety and tolerability profile on BCX4208 was quite satisfactory and certainly adequate for consideration of further clinical research," he concluded, noting that phase III studies are in development.
Dr. Sheridan disclosed that he is employed by BioCryst Pharmaceuticals, which is the maker of BCX4208 and the sponsor of this study.
CHICAGO – Combined treatment with allopurinol and the novel purine nucleoside phosphorylase inhibitor BCX4208 significantly lowered serum uric acid levels in gout patients who had failed to respond to allopurinol alone, according to findings from a randomized placebo-controlled trial involving 278 adults.
Between 33% and 49% of patients who received 12 weeks of combined treatment with BCX4208 at doses ranging from 5 to 40 mg/day plus allopurinol at 300 mg/day achieved the goal serum uric acid level of less than 6.0 mg/dL, compared with only 18% of those receiving placebo and allopurinol, Dr. William P. Sheridan reported during a late-breaking abstract session at the annual meeting of the American College of Rheumatology.
The response rates differed by BCX4208 dose, with 45%, 33%, 39%, and 49% of those receiving 5, 10, 20, and 40 mg, respectively, achieving goal serum uric acid levels. The differences between the 5, 20, and 40 mg groups and the placebo arm were statistically significant, said Dr. Sheridan of BioCryst Pharmaceuticals, Durham, N.C., which is the maker of BCX4208 and the sponsor of the study.
Gout flares occurred in 5%-11% of patient in each BCX4208 arm and in 5% of patient in the placebo group, and both the severity and frequency of adverse events were evenly distributed across dose groups. No opportunistic infections occurred.
Also, dose-related reductions in lymphocytes and lymphocyte subsets occurred during drug administration, but these appeared to plateau within 12 weeks, Dr. Sheridan said.
Discontinuations occurred in both the 20- and 40-mg groups because of confirmed CD4+ cell counts less than 350 cells/mm3. No patients in the other groups discontinued because of low CD4+ cell counts, he said.
Study participants were adults with a mean age of 49 years with a gout diagnosis and serum uric acid levels of 6.0 mg/dL or less who had not responded sufficiently after treatment with at least 2 weeks of allopurinol at 300 mg/day. All patients received colchicine or naproxen as prophylaxis for gout flares.
The participants had a high mean body mass index of 36 kg/m2, and comorbidities were common; 58% had hypertension, 16% had diabetes, and 39% had hypercholesterolemia.
The findings suggest that BCX4208 is generally safe and well tolerated when combined with allopurinol, and that the combination improves the likelihood that gout patient will reach goal serum uric acid levels, Dr. Sheridan said, noting that the findings are important given that few alternatives have existed for patients who fail to reach serum uric acid goal range with a xanthine oxidase inhibitor alone.
BCX4208 appears shows promise for those patients, and an extension phase of the study is underway, he said.
"The safety and tolerability profile on BCX4208 was quite satisfactory and certainly adequate for consideration of further clinical research," he concluded, noting that phase III studies are in development.
Dr. Sheridan disclosed that he is employed by BioCryst Pharmaceuticals, which is the maker of BCX4208 and the sponsor of this study.
FROM THE ANNUAL MEETING OF THE AMERICAN COLLEGE OF RHEUMATOLOGY
Major Finding: Between 33% and 49% of patients who received 12 weeks of combined treatment with BCX4208 at doses ranging from 5 to 40 mg/day plus allopurinol at 300 mg/day achieved the goal serum uric acid level of less than 6.0 mg/dL, compared with only 18% of those receiving placebo and allopurinol.
Data Source: A randomized placebo-controlled study.
Disclosures: Dr. Sheridan disclosed that he is employed by BioCryst Pharmaceuticals, which is the maker of BCX4208 and the sponsor of this study.
VTE Prophylaxis in Focus
Heparin prophylaxis had no significant impact on mortality rates in medical patients, according to a new report in Annals of Internal Medicine. And one of the authors suggests that the results should push hospitalists to use a more critical eye when considering pharmacological prophylaxis.
"Venous Thromboembolism Prophylaxis in Hospitalized Medical Patients and Those With Stroke: A Background Review for an American College of Physicians Clinical Practice Guideline" showed that in medical patients, heparin prophylaxis had no "statistically significant effect on any outcome in patients with acute stroke except for an increase in major bleeding events" (OR, 1.66 [CI, 1.20 to 2.28]). The authors concluded that precautionary use of heparin might have reduced pulmonary embolisms in both medical and stroke patients, but combined with upticks in bleeding and major bleeding events, the overall outcome results "in little or no net benefit."
"Our results do not really decide the issue for a physician and a patient whether prophylaxis should be used but rather show that this is a question that is still very much up in the air," says author Frank Lederle, MD, professor of medicine at the Minneapolis VA Medical Center. "That there may be good reasons to use prophylaxis, but it certainly shouldn't be something we're mandating or trying to achieve uniformity on when we don't have the evidence to do so."
Dr. Lederle adds that while some researchers are publishing papers on how well hospitalists and other physicians adhere to prophylactic procedures, he'd like to see more evidence-based analysis of the tactic's efficacy.
"The reason that this is not universally accepted by physicians is that people are aware that the data aren't that supportive of it," he says. "And that, really, the question should go back to 'Does it work and in whom does it work?' not 'Why are physicians failing to follow a guideline?'"
Heparin prophylaxis had no significant impact on mortality rates in medical patients, according to a new report in Annals of Internal Medicine. And one of the authors suggests that the results should push hospitalists to use a more critical eye when considering pharmacological prophylaxis.
"Venous Thromboembolism Prophylaxis in Hospitalized Medical Patients and Those With Stroke: A Background Review for an American College of Physicians Clinical Practice Guideline" showed that in medical patients, heparin prophylaxis had no "statistically significant effect on any outcome in patients with acute stroke except for an increase in major bleeding events" (OR, 1.66 [CI, 1.20 to 2.28]). The authors concluded that precautionary use of heparin might have reduced pulmonary embolisms in both medical and stroke patients, but combined with upticks in bleeding and major bleeding events, the overall outcome results "in little or no net benefit."
"Our results do not really decide the issue for a physician and a patient whether prophylaxis should be used but rather show that this is a question that is still very much up in the air," says author Frank Lederle, MD, professor of medicine at the Minneapolis VA Medical Center. "That there may be good reasons to use prophylaxis, but it certainly shouldn't be something we're mandating or trying to achieve uniformity on when we don't have the evidence to do so."
Dr. Lederle adds that while some researchers are publishing papers on how well hospitalists and other physicians adhere to prophylactic procedures, he'd like to see more evidence-based analysis of the tactic's efficacy.
"The reason that this is not universally accepted by physicians is that people are aware that the data aren't that supportive of it," he says. "And that, really, the question should go back to 'Does it work and in whom does it work?' not 'Why are physicians failing to follow a guideline?'"
Heparin prophylaxis had no significant impact on mortality rates in medical patients, according to a new report in Annals of Internal Medicine. And one of the authors suggests that the results should push hospitalists to use a more critical eye when considering pharmacological prophylaxis.
"Venous Thromboembolism Prophylaxis in Hospitalized Medical Patients and Those With Stroke: A Background Review for an American College of Physicians Clinical Practice Guideline" showed that in medical patients, heparin prophylaxis had no "statistically significant effect on any outcome in patients with acute stroke except for an increase in major bleeding events" (OR, 1.66 [CI, 1.20 to 2.28]). The authors concluded that precautionary use of heparin might have reduced pulmonary embolisms in both medical and stroke patients, but combined with upticks in bleeding and major bleeding events, the overall outcome results "in little or no net benefit."
"Our results do not really decide the issue for a physician and a patient whether prophylaxis should be used but rather show that this is a question that is still very much up in the air," says author Frank Lederle, MD, professor of medicine at the Minneapolis VA Medical Center. "That there may be good reasons to use prophylaxis, but it certainly shouldn't be something we're mandating or trying to achieve uniformity on when we don't have the evidence to do so."
Dr. Lederle adds that while some researchers are publishing papers on how well hospitalists and other physicians adhere to prophylactic procedures, he'd like to see more evidence-based analysis of the tactic's efficacy.
"The reason that this is not universally accepted by physicians is that people are aware that the data aren't that supportive of it," he says. "And that, really, the question should go back to 'Does it work and in whom does it work?' not 'Why are physicians failing to follow a guideline?'"
Improving Stroke Alert Response Time
In‐hospital strokes account for a significant proportion of the almost 800,000 cerebrovascular accidents that occur each year in the United States.1 Although inpatient strokes are thought to be under‐recognized and under‐reported, between 4% and 17% of all stroke patients in the hospital experienced stroke onset during hospitalization.2, 3 Estimates place the number of in‐hospital strokes at 35,000‐75,000 each year in the United States.4
As a result of the exquisite sensitivity of brain tissue to ischemic events, stroke is a medical emergency and time‐to‐treatment is of the essence. With each minute of ischemia, 1.9 million neurons are destroyed.5 Evidence suggests benefit of treatment with intravenous thrombolysis up to 4.5 hours after symptom onset, with lower disability associated with more rapid initiation of therapy.6, 7 To facilitate timely thrombolytic therapy, the American Stroke Association (ASA) recommends that imaging of the brain be initiated within 25 minutes of presentation for patients with suspected stroke.8
Studies demonstrate greater delays in the evaluation of hospitalized patients suffering from stroke compared to stroke patients presenting to the Emergency Department (ED).9, 10 Performance of timely evaluation of in‐hospital stroke rarely meets ASA goals. Analysis of a Michigan stroke registry found that only 3.1% of patients with in‐hospital strokes received computed tomography (CT) scan within 25 minutes of symptom recognition, and a Colorado stroke registry found time‐to‐evaluation to be more than twice the recommended benchmark.11, 12 Data from a multicenter stroke registry in Spain showed that half of all thrombolysis‐eligible, in‐hospital stroke patients could not be treated due to delays in evaluation.13
Our prior work demonstrated that the use of an in‐hospital stroke response team significantly reduced time to evaluation for true ischemic strokes.10 Even with this rapid response mechanism, the evaluation time for in‐hospital stroke was still more than twice that observed in the ED despite using the same team to respond to both settings. Hospital rapid response systems, specifically for patients with suspected stroke, have been described in the literature and outline in‐hospital response systems capable of meeting evaluation time goals.1415 How to optimize a stroke response system has not been previously described. The aim of this quality improvement (QI) initiative was to reduce time‐to‐evaluation for strokes occurring in patients already hospitalized using systems analysis and modification. We describe key elements and tools for implementing institutional QI for in‐hospital stroke.
METHODS
The QI initiative was implemented at the University of Colorado Hospital (UCH), a tertiary care academic medical center. The Colorado Multiple Institutional Review Board determined this project to be in the exempt category. UCH uses a protocol in which all stroke alerts undergo non‐contrast CT of the brain. If no intracranial bleeding is found, and the patient is a thrombolytic candidate, advanced CT imaging including CT perfusion and CT angiogram will also be performed during the alert. Magnetic resonance imaging (MRI) with diffusion weighted imaging is done non‐emergently for subsequent stroke evaluation, but is not part of the stroke alert protocol. The primary endpoint of time from alert to initiation of CT was chosen because it represents an unambiguous interval which is present for all stroke alerts. Pre‐intervention data was gathered for 6 months, from September 2008 to February 2009. During this period, the process through which in‐hospital strokes were identified, referred for evaluation, and treated was mapped to identify inefficient or unreliable steps, and the process was redesigned to enhance efficiency. The intervention was rolled out over a 3‐month period from March 2009 to May 2009. During the intervention roll‐out period, the refined stroke alert process and a checklist containing the optimal in‐hospital stroke alert response system was implemented. An education campaign was initiated, for acute stroke team members and nursing staff, on signs of stroke and each individual's role in response to symptoms of in‐hospital stroke based on the new process. During the roll‐out period, each unit in the hospital was provided in‐hospital stroke alert posters and a packet containing specific stroke education on the in‐hospital stroke alert process. Unit educators were empowered to determine how to best deliver the education to their staff, and many chose to invite the stroke program coordinator to give an hour‐long presentation on stroke prior to shift or during lunch. Each unit educator kept record of the stroke instruction provided and submitted staff signatures to the stroke program. Nursing staff was also provided with in‐hospital stroke protocol badge cards that outlined optimal approach to stroke identification and treatment using the revised protocol. Interventions were being implemented in a progressive fashion throughout the roll‐out period. Starting during the roll‐out and continuing into the post‐intervention period, feedback on all in‐hospital stroke alerts was provided to the stroke team and front‐line providers. The impact of the intervention was followed for 6 months post‐intervention from June 2009 to November 2009. The QI tools used in this project are well described by the Institute of Healthcare Improvement, and each step in the QI process is outlined in detail below:16
Step 1: Process Map With Identification of Unreliable and Reliably Slow Steps
A detailed process map was created to outline steps in the existing stroke alert process (see Supporting Figures, Process Maps, in the online version of this article). One investigator (R.Z.) interviewed key members of the multidisciplinary stroke team, including representatives from the departments of neurology, nursing, hospital medicine, neurosurgery, radiology, and transportation. Interviews with key stakeholders and frequent participants in stroke alerts revealed evidence of episodic unreliable steps. Stakeholders were noted to have slightly different conceptions of how the process flow was intended to occur, and where responsibility lay for certain tasks. The interviews aided in identification of pitfalls, bottlenecks, misconceptions, and areas that needed clarification or change in the alert process.
Examples of unreliable and bottleneck steps include: In the pre‐intervention process, the transportation department was responsible for moving patients to radiology; this step was identified as reliably slow. Investigation revealed that the transportation department did not have a mechanism for rapid response to emergency transport requests. Analysis also revealed that 2 key steps necessary for treating in‐hospital stroke were occasionally neglected: ensuring adequate intravenous (IV) access, and ordering of the correct panel of laboratory tests. Finally, a process communication deficit was identified, with CT technicians periodically unaware of the pending arrival of an in‐hospital stroke patient, thus preventing the scan from being cleared for the emergent stroke imaging.
Direct observation of real‐time stroke alerts in both the inpatient and ED settings was also employed to outline the process and identify areas of inefficiency. Direct observation of stroke alerts in progress verified the unified picture of process flow developed from stakeholder interviews (see Supporting Figures, Process Maps, in the online version of this article). Particular note was made of differences between the stroke alert process in the ED and the inpatient setting.
Step 2: System Redesign With Input From All Stakeholders
Proposed interventions were presented to hospital governing councils, including the interdisciplinary Stroke Council and Nurse Managers Council. After verification of the shortcomings of the existing alert process and obtaining buy‐in from key participants and governing departments, a new process was designed (see Supporting Figures, Process Maps, in the online version of this article). Specific changes include the following examples: First, electrocardiogram was moved to occur after CT scan. Second, investigation revealed that the transportation department within the hospital was designed for non‐emergent transportation and not amenable to change. The mechanism of patient transportation was changed such that, rather than using the transportation department, patients were now transported by the neurology resident responding to the stroke alert, accompanied by the patient's ward nurse. This both removed a bottleneck step and assured critical staff presence during the transportation of a potentially unstable patient. Third, to ensure effective communication, CT technicians were provided with stroke alert pagers that receive text messages regarding incoming in‐hospital stroke alert patients. Fourth, a time limit was set for IV attempts prior to transportation. The new protocol, along with explicit expectations for the role of the patient's nurse in in‐hospital stroke alerts, was described in a hospital‐wide nursing stroke education initiative.
Step 3: In‐Hospital Stroke Alert Checklist
A new standardized protocol for optimal in‐hospital stroke care was detailed on a laminated pocket card. The checklist described exactly what steps were to be performed, by whom, how to make them occur, and in what order. The checklist was designed to reduce the incidence of omitted steps, such as ordering of correct laboratory evaluations. The laminated cards highlighted the benchmark time to evaluation of 25 minutes. Process checklist cards were distributed to all members of the acute stroke alert response team, and short versions designed specifically for nursing staff were distributed as badge cards and posted on clinical care units (Supporting Information Appendix I).
Step 4: Real‐Time Feedback
During the intervention roll‐out and post‐intervention periods, feedback was provided from the stroke program to the front‐line providers following each in‐hospital stroke alert. The clinicians involved were notified of the final diagnosis and patient outcome, and were provided with feedback about how the patient's evaluation times compared with benchmark goals. Feedback may serve to motivate, based on clinician professionalism, but performance in the alert was not tied to rewards or penalties for the providers involved. The feedback process was designed to be bi‐directional, with requests for input from staff on barriers to rapid evaluation experienced and suggestions for future process improvement (Supporting Information Appendix II).
Statistical Analysis
The primary outcome was the change in time from stroke alert to CT scan (alert‐to‐CT), comparing pre‐intervention and post‐intervention periods. This time interval was chosen because its calculation involved unambiguous time points, which are available for all patients for whom an in‐hospital alert is called. It is a measure of process efficiency, with minimal expected variation based on differences in patient characteristics (ie, hemorrhagic vs ischemic stroke). Non‐overlapping Kaplan‐Meier curves confirmed the proportional hazards assumption for 2 Cox proportional hazards models: unadjusted and adjusted by group characteristics with P‐value 0.10. Relative hazards and estimates for the percent of patients with alert‐to‐CT scan 25 minutes, according to intervention groups, were obtained from these models. For analyses, admit unit was re‐categorized as intensive care unit (ICU), Med/Surg, or Other. Analyses were conducted using SAS Version 9.2 (SAS Institute, Inc, Cary, NC).
RESULTS
During the study intervals, there were 82 inpatient stroke alerts. Of these alerts, 75 were included in the analysis. Seven were excluded for the following reasons: alert canceled by the stroke team (3), time of alert was not recorded (1), patient identifiers not recorded (1), or stroke alert was preceded by CT imaging (2).
During the 6 months prior to intervention, the median inpatient stroke alert‐to‐CT time (n = 31) was 69.0 minutes (Table 1). Nineteen percent of these alerts met the goal of 25 minutes from alert‐to‐CT time. During the 6‐month post‐intervention period, the median inpatient alert‐to‐CT time (n = 44) was 29.5 minutes. Thirty‐two percent of these alerts met the 25‐minute alert‐to‐CT time benchmark. In the unadjusted model, patients during the post‐intervention period were significantly more likely to have alert‐to‐CT scan time 25 minutes compared to patients prior to the intervention (post‐intervention compared to pre‐intervention, Relative Hazard (RH): 3.03; 95% confidence interval [CI]: 1.76‐5.20; log‐rank P 0.0001). This remained significant after adjustment for hyperlipidemia, active cancer, final diagnosis of ischemic brain injury, and final diagnosis of stroke mimic (RH: 4.96; 95% CI: 2.65‐9.32; P 0.0001); data not shown. Admit unit was not included in the adjusted model since there was no indication of differences in the 3‐level variable according to intervention group (P = 0.27). In addition to reduction in median response times, the variability of response times was markedly reduced, and no patient in the 6‐month post‐intervention period had delay to CT sufficient to preclude use of IV thrombolysis (Figure 1).
| Pre‐Intervention (n = 31) | Post‐Intervention (n = 44) | P Value | |
|---|---|---|---|
| |||
| Stroke alert to CT time, median [95% CI] | 69 min [34, 103] | 29.5 min [26, 40] | P 0.0001 |
| Age, median [IQR] | 61.0 [54.0, 70.0] | 60.5 [48.5, 70.5] | 0.94 |
| Female (%) | 19 (61.3) | 23 (52.3) | 0.44 |
| Race (%) | |||
| Asian | 1 (3.2) | 1 (2.3) | 0.31 |
| Black | 4 (12.9) | 6 (13.6) | |
| Caucasian | 21 (67.7) | 27 (61.4) | |
| Hispanic | 3 (9.7) | 10 (22.7) | |
| Unknown | 2 (6.5) | 0 (0) | |
| Admit unit (%) | |||
| Intensive care | 12 (38.7) | 10 (22.7) | 0.07 |
| Medicine/surgery | 15 (48.4) | 24 (54.6) | |
| Neurology | 0 (0) | 5 (11.4) | |
| Post‐acute care | 3 (9.7) | 0 (0) | |
| Rehabilitation | 1 (3.2) | 2 (4.6) | |
| Women's and maternal care | 0 (0) | 2 (4.6) | |
| Cardiology | 0 (0) | 1 (2.3) | |
| Case mix index, median [IQR] | n = 29 2.6 [1.1, 5.0] | n = 42 2.2 [1.6, 4.5] | 0.82 |
| Prior cerebrovascular accident (%) | 5 (16.1) | 8 (18.2) | 0.82 |
| Hypertension (%) | 17 (54.8) | 24 (54.6) | 0.98 |
| Diabetes mellitus (%) | 7 (22.6) | 11 (25.0) | 0.81 |
| Hyperlipidemia (%) | 15 (48.4) | 9 (20.5) | 0.01 |
| Tobacco abuse, current (%) | 4 (12.9) | 1 (2.3) | 0.15 |
| Alcohol abuse (%) | 2 (6.5) | 0 (0) | 0.17 |
| Active cancer (%) | 8 (25.8) | 5 (11.4) | 0.10 |
| Peripheral vascular disease (%) | 2 (6.5) | 3 (6.8) | 1.0 |
| Coronary artery disease (%) | 6 (19.4) | 7 (15.9) | 0.70 |
| Congestive heart failure (%) | n = 30 5 (16.7) | 4 (9.1) | 0.47 |
| Valvulopathy (%) | 0 (0) | 1 (2.3) | 1.0 |
| Atrial fibrillation (%) | 3 (9.7) | 10 (22.7) | 0.14 |
| Anticoagulation (%) | 7 (22.6) | 7 (15.9) | 0.47 |
| Final diagnosis ischemic brain injury (%) | 15 (48.4) | 11 (25.0) | 0.04 |
| Final diagnosis hemorrhagic brain injury (%) | 3 (9.7) | 4 (9.1) | 1.0 |
| Final diagnosis stroke mimic (symptoms not due to ischemic or hemorrhagic brain injury) (%) | 13 (41.9) | 29 (65.9) | 0.04 |
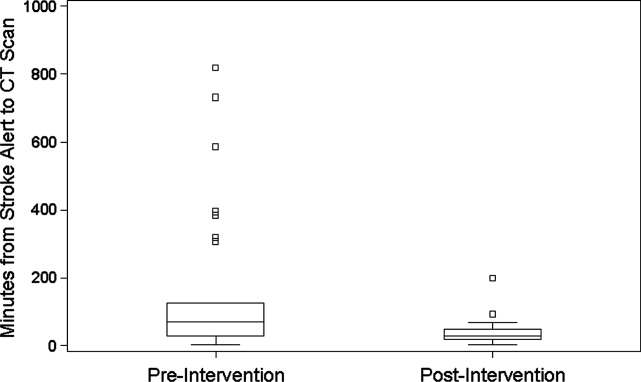
CONCLUSIONS
In‐hospital strokes represent an emergency for which response time is critical. Neurologic injury progresses with every minute of ischemia, and current recommendations offer a limited time window for intravenous thrombolysis. For stroke with symptom onset in the monitored setting of the hospital, there is a compelling imperative to reduce all delays from system inefficiencies. The findings of the current QI initiative suggest that dramatic improvements are possible through systematic evaluation and redesign of hospital response processes, a checklist for in‐hospital stroke carried by front‐line responders, and ongoing real‐time feedback.
Limitations of this study include a prepost design. The necessity of implementing system change hospital‐wide precluded use of a concurrent control group. The time goals for evaluation are derived from American Stroke Association targets for patients arriving in the Emergency Department. There are differences in process between the hospital ward and the Emergency Department, but the fundamental concept of minimizing time to evaluation once patient symptoms are recognized by hospital staff remains valid.
The possibility of system improvements not due to this QI initiative cannot be excluded. In 2006, this hospital expanded the responsibility of the stroke response team to include acute neurologic deficits outside of the ED without other changes to the in‐hospital stroke alert process. This reduced time to evaluation for in‐hospital ischemic strokes compared to usual care, but even with the same acute stroke response team responding to stroke alerts in both settings, in‐hospital stroke response times remained significantly longer than response times for stroke in the ED.10 The presence of an in‐hospital stroke alert response team alone was not capable of reducing evaluation times to goal. Minimal improvement in median in‐hospital stroke alert evaluation time was seen in the intervening year, following the completion of our previously published analysis, suggesting explicit system QI was necessary.
The Hawthorne effect, in which individuals who know they are being observed modify behavior while such monitoring is in effect, is a major limitation of interpreting QI initiatives. By committing to continuous and ongoing feedback to front‐line providers, this phenomenon can be harnessed to sustain improvement.17 In effect, the study of efficient response to the in‐hospital stroke never ceases. UCH has continued to employ the post‐intervention stroke alert protocol and engage in ongoing feedback after each stroke alert. In the 12 months following the conclusion of this study, the median response time to in‐hospital strokes continues to be 30 minutes, and 7 additional in‐hospital stroke patients have been treated with thrombolysis.
This inpatient stroke alert initiative decreased median inpatient alert‐to‐CT time by 57%, and demonstrates that quality of in‐hospital stroke care can be improved. Decrease in stroke alert‐to‐CT time facilitates earlier thrombolytic therapy. Analysis of treatment and patient outcomes was outside of the scope of the current study, but earlier treatment has potential to significantly improve clinical outcomes.
The Society of Hospital Medicine defines one of the goals of QI to be the change in processes with reduction in variation, thus improving the care for all patients rather than focusing exclusively on outlier events.18 This initiative markedly reduced evaluation variability, allowing a greater percentage of patients to be eligible for treatment within the critical time window. Prior to the intervention, almost a quarter of patients had delays in evaluation sufficient to preclude IV thrombolysis, whereas in the 6 months after the intervention was initiated, not a single patient had evaluation delayed to the point that IV thrombolysis would not have been an option (Figure 1). The goal of in‐hospital stroke QI must be to improve the speed of the process for all patients, and assure that no patient is denied the potential for therapy as a result of inefficiencies in hospital systems.
Acknowledgements
The authors thank Traci Yamashita, PRA, for her work in the statistical analysis for this publication, and Dr Jeffrey Glasheen for development of the University of Colorado Hospital's Hospitalist Training Track Quality Improvement Program of which this work is a product.
- ,,, et al.Heart disease and stroke statistics—2010 update: a report from the American Heart Association.Circulation.2010;121:e46–e215.
- ,,.Characteristics of in‐hospital onset ischemic stroke.Eur Neurol.2006;55:155–159.
- ,.Inpatient and community ischemic strokes in a community hospital.Neuroepidemiology.2007;28:86–92.
- .In‐hospital stroke.Lancet Neurol.2003;2:741–746.
- .Time is brain‐quantified.Stroke.2006;37:263–266.
- ,,, et al.Ultra‐early thrombolysis in acute ischemic stroke is associated with better outcomes and lower mortality.Stroke.2010;41:712–716.
- ,,,.Expansion of the time window for treatment of acute ischemic stroke with intravenous tissue plasminogen activator: a science advisory from the American Heart Association/American Stroke Association.Stroke.2009;40:2945–2948.
- ,,, et al.Guidelines for early management of adults with ischemic stroke.Stroke.2007;38;1655–1711.
- ,,, et al.In‐hospital stroke treated with intravenous tissue plasminogen activator.Stroke.2008;39:2614–2616.
- ,,,,.Stroke alert program improves recognition and evaluation time of in‐hospital ischemic stroke.J Stroke Cerebrovasc Dis.2009;19:494–496.
- ,,,,,.In‐hospital stroke in a statewide stroke registry.Cerebrovasc Dis.2008;25:12–20.
- ,,,,.Quality of care for in‐hospital stroke: analysis of a statewide registry.Stroke.2011;42:207–210.
- ,,, et al.In‐hospital stroke: a multi‐center prospective registry.Eur J Neurol.2011;18:170–176.
- ,,.Code Gray—an organized approach to inpatient stroke.Crit Care Nurs Q.2003;26:296–302.
- ,,.ID, stat‐rapid response to in‐hospital stroke patients.Nurs Manage.2009;40:34–38.
- Institute of Healthcare Improvement. Quality Improvement Tools. Available at: http://www.ihi.org/IHI/Topics/Improvement/ImprovementMethods/Tools/. Accessed December 1,2010.
- ,,,,,.Variability in the Hawthorne effect with regard to hand hygiene performance in high‐ and low‐performing inpatient care units.Infect Control Hosp Epidemiol.2009;30:222–225.
- Society of Hospital Medicine Quality Improvement Resources. Available at: http://www.hospitalmedicine.org/ResourceRoomRedesign/html/32. Accessed December 1,2010.
In‐hospital strokes account for a significant proportion of the almost 800,000 cerebrovascular accidents that occur each year in the United States.1 Although inpatient strokes are thought to be under‐recognized and under‐reported, between 4% and 17% of all stroke patients in the hospital experienced stroke onset during hospitalization.2, 3 Estimates place the number of in‐hospital strokes at 35,000‐75,000 each year in the United States.4
As a result of the exquisite sensitivity of brain tissue to ischemic events, stroke is a medical emergency and time‐to‐treatment is of the essence. With each minute of ischemia, 1.9 million neurons are destroyed.5 Evidence suggests benefit of treatment with intravenous thrombolysis up to 4.5 hours after symptom onset, with lower disability associated with more rapid initiation of therapy.6, 7 To facilitate timely thrombolytic therapy, the American Stroke Association (ASA) recommends that imaging of the brain be initiated within 25 minutes of presentation for patients with suspected stroke.8
Studies demonstrate greater delays in the evaluation of hospitalized patients suffering from stroke compared to stroke patients presenting to the Emergency Department (ED).9, 10 Performance of timely evaluation of in‐hospital stroke rarely meets ASA goals. Analysis of a Michigan stroke registry found that only 3.1% of patients with in‐hospital strokes received computed tomography (CT) scan within 25 minutes of symptom recognition, and a Colorado stroke registry found time‐to‐evaluation to be more than twice the recommended benchmark.11, 12 Data from a multicenter stroke registry in Spain showed that half of all thrombolysis‐eligible, in‐hospital stroke patients could not be treated due to delays in evaluation.13
Our prior work demonstrated that the use of an in‐hospital stroke response team significantly reduced time to evaluation for true ischemic strokes.10 Even with this rapid response mechanism, the evaluation time for in‐hospital stroke was still more than twice that observed in the ED despite using the same team to respond to both settings. Hospital rapid response systems, specifically for patients with suspected stroke, have been described in the literature and outline in‐hospital response systems capable of meeting evaluation time goals.1415 How to optimize a stroke response system has not been previously described. The aim of this quality improvement (QI) initiative was to reduce time‐to‐evaluation for strokes occurring in patients already hospitalized using systems analysis and modification. We describe key elements and tools for implementing institutional QI for in‐hospital stroke.
METHODS
The QI initiative was implemented at the University of Colorado Hospital (UCH), a tertiary care academic medical center. The Colorado Multiple Institutional Review Board determined this project to be in the exempt category. UCH uses a protocol in which all stroke alerts undergo non‐contrast CT of the brain. If no intracranial bleeding is found, and the patient is a thrombolytic candidate, advanced CT imaging including CT perfusion and CT angiogram will also be performed during the alert. Magnetic resonance imaging (MRI) with diffusion weighted imaging is done non‐emergently for subsequent stroke evaluation, but is not part of the stroke alert protocol. The primary endpoint of time from alert to initiation of CT was chosen because it represents an unambiguous interval which is present for all stroke alerts. Pre‐intervention data was gathered for 6 months, from September 2008 to February 2009. During this period, the process through which in‐hospital strokes were identified, referred for evaluation, and treated was mapped to identify inefficient or unreliable steps, and the process was redesigned to enhance efficiency. The intervention was rolled out over a 3‐month period from March 2009 to May 2009. During the intervention roll‐out period, the refined stroke alert process and a checklist containing the optimal in‐hospital stroke alert response system was implemented. An education campaign was initiated, for acute stroke team members and nursing staff, on signs of stroke and each individual's role in response to symptoms of in‐hospital stroke based on the new process. During the roll‐out period, each unit in the hospital was provided in‐hospital stroke alert posters and a packet containing specific stroke education on the in‐hospital stroke alert process. Unit educators were empowered to determine how to best deliver the education to their staff, and many chose to invite the stroke program coordinator to give an hour‐long presentation on stroke prior to shift or during lunch. Each unit educator kept record of the stroke instruction provided and submitted staff signatures to the stroke program. Nursing staff was also provided with in‐hospital stroke protocol badge cards that outlined optimal approach to stroke identification and treatment using the revised protocol. Interventions were being implemented in a progressive fashion throughout the roll‐out period. Starting during the roll‐out and continuing into the post‐intervention period, feedback on all in‐hospital stroke alerts was provided to the stroke team and front‐line providers. The impact of the intervention was followed for 6 months post‐intervention from June 2009 to November 2009. The QI tools used in this project are well described by the Institute of Healthcare Improvement, and each step in the QI process is outlined in detail below:16
Step 1: Process Map With Identification of Unreliable and Reliably Slow Steps
A detailed process map was created to outline steps in the existing stroke alert process (see Supporting Figures, Process Maps, in the online version of this article). One investigator (R.Z.) interviewed key members of the multidisciplinary stroke team, including representatives from the departments of neurology, nursing, hospital medicine, neurosurgery, radiology, and transportation. Interviews with key stakeholders and frequent participants in stroke alerts revealed evidence of episodic unreliable steps. Stakeholders were noted to have slightly different conceptions of how the process flow was intended to occur, and where responsibility lay for certain tasks. The interviews aided in identification of pitfalls, bottlenecks, misconceptions, and areas that needed clarification or change in the alert process.
Examples of unreliable and bottleneck steps include: In the pre‐intervention process, the transportation department was responsible for moving patients to radiology; this step was identified as reliably slow. Investigation revealed that the transportation department did not have a mechanism for rapid response to emergency transport requests. Analysis also revealed that 2 key steps necessary for treating in‐hospital stroke were occasionally neglected: ensuring adequate intravenous (IV) access, and ordering of the correct panel of laboratory tests. Finally, a process communication deficit was identified, with CT technicians periodically unaware of the pending arrival of an in‐hospital stroke patient, thus preventing the scan from being cleared for the emergent stroke imaging.
Direct observation of real‐time stroke alerts in both the inpatient and ED settings was also employed to outline the process and identify areas of inefficiency. Direct observation of stroke alerts in progress verified the unified picture of process flow developed from stakeholder interviews (see Supporting Figures, Process Maps, in the online version of this article). Particular note was made of differences between the stroke alert process in the ED and the inpatient setting.
Step 2: System Redesign With Input From All Stakeholders
Proposed interventions were presented to hospital governing councils, including the interdisciplinary Stroke Council and Nurse Managers Council. After verification of the shortcomings of the existing alert process and obtaining buy‐in from key participants and governing departments, a new process was designed (see Supporting Figures, Process Maps, in the online version of this article). Specific changes include the following examples: First, electrocardiogram was moved to occur after CT scan. Second, investigation revealed that the transportation department within the hospital was designed for non‐emergent transportation and not amenable to change. The mechanism of patient transportation was changed such that, rather than using the transportation department, patients were now transported by the neurology resident responding to the stroke alert, accompanied by the patient's ward nurse. This both removed a bottleneck step and assured critical staff presence during the transportation of a potentially unstable patient. Third, to ensure effective communication, CT technicians were provided with stroke alert pagers that receive text messages regarding incoming in‐hospital stroke alert patients. Fourth, a time limit was set for IV attempts prior to transportation. The new protocol, along with explicit expectations for the role of the patient's nurse in in‐hospital stroke alerts, was described in a hospital‐wide nursing stroke education initiative.
Step 3: In‐Hospital Stroke Alert Checklist
A new standardized protocol for optimal in‐hospital stroke care was detailed on a laminated pocket card. The checklist described exactly what steps were to be performed, by whom, how to make them occur, and in what order. The checklist was designed to reduce the incidence of omitted steps, such as ordering of correct laboratory evaluations. The laminated cards highlighted the benchmark time to evaluation of 25 minutes. Process checklist cards were distributed to all members of the acute stroke alert response team, and short versions designed specifically for nursing staff were distributed as badge cards and posted on clinical care units (Supporting Information Appendix I).
Step 4: Real‐Time Feedback
During the intervention roll‐out and post‐intervention periods, feedback was provided from the stroke program to the front‐line providers following each in‐hospital stroke alert. The clinicians involved were notified of the final diagnosis and patient outcome, and were provided with feedback about how the patient's evaluation times compared with benchmark goals. Feedback may serve to motivate, based on clinician professionalism, but performance in the alert was not tied to rewards or penalties for the providers involved. The feedback process was designed to be bi‐directional, with requests for input from staff on barriers to rapid evaluation experienced and suggestions for future process improvement (Supporting Information Appendix II).
Statistical Analysis
The primary outcome was the change in time from stroke alert to CT scan (alert‐to‐CT), comparing pre‐intervention and post‐intervention periods. This time interval was chosen because its calculation involved unambiguous time points, which are available for all patients for whom an in‐hospital alert is called. It is a measure of process efficiency, with minimal expected variation based on differences in patient characteristics (ie, hemorrhagic vs ischemic stroke). Non‐overlapping Kaplan‐Meier curves confirmed the proportional hazards assumption for 2 Cox proportional hazards models: unadjusted and adjusted by group characteristics with P‐value 0.10. Relative hazards and estimates for the percent of patients with alert‐to‐CT scan 25 minutes, according to intervention groups, were obtained from these models. For analyses, admit unit was re‐categorized as intensive care unit (ICU), Med/Surg, or Other. Analyses were conducted using SAS Version 9.2 (SAS Institute, Inc, Cary, NC).
RESULTS
During the study intervals, there were 82 inpatient stroke alerts. Of these alerts, 75 were included in the analysis. Seven were excluded for the following reasons: alert canceled by the stroke team (3), time of alert was not recorded (1), patient identifiers not recorded (1), or stroke alert was preceded by CT imaging (2).
During the 6 months prior to intervention, the median inpatient stroke alert‐to‐CT time (n = 31) was 69.0 minutes (Table 1). Nineteen percent of these alerts met the goal of 25 minutes from alert‐to‐CT time. During the 6‐month post‐intervention period, the median inpatient alert‐to‐CT time (n = 44) was 29.5 minutes. Thirty‐two percent of these alerts met the 25‐minute alert‐to‐CT time benchmark. In the unadjusted model, patients during the post‐intervention period were significantly more likely to have alert‐to‐CT scan time 25 minutes compared to patients prior to the intervention (post‐intervention compared to pre‐intervention, Relative Hazard (RH): 3.03; 95% confidence interval [CI]: 1.76‐5.20; log‐rank P 0.0001). This remained significant after adjustment for hyperlipidemia, active cancer, final diagnosis of ischemic brain injury, and final diagnosis of stroke mimic (RH: 4.96; 95% CI: 2.65‐9.32; P 0.0001); data not shown. Admit unit was not included in the adjusted model since there was no indication of differences in the 3‐level variable according to intervention group (P = 0.27). In addition to reduction in median response times, the variability of response times was markedly reduced, and no patient in the 6‐month post‐intervention period had delay to CT sufficient to preclude use of IV thrombolysis (Figure 1).
| Pre‐Intervention (n = 31) | Post‐Intervention (n = 44) | P Value | |
|---|---|---|---|
| |||
| Stroke alert to CT time, median [95% CI] | 69 min [34, 103] | 29.5 min [26, 40] | P 0.0001 |
| Age, median [IQR] | 61.0 [54.0, 70.0] | 60.5 [48.5, 70.5] | 0.94 |
| Female (%) | 19 (61.3) | 23 (52.3) | 0.44 |
| Race (%) | |||
| Asian | 1 (3.2) | 1 (2.3) | 0.31 |
| Black | 4 (12.9) | 6 (13.6) | |
| Caucasian | 21 (67.7) | 27 (61.4) | |
| Hispanic | 3 (9.7) | 10 (22.7) | |
| Unknown | 2 (6.5) | 0 (0) | |
| Admit unit (%) | |||
| Intensive care | 12 (38.7) | 10 (22.7) | 0.07 |
| Medicine/surgery | 15 (48.4) | 24 (54.6) | |
| Neurology | 0 (0) | 5 (11.4) | |
| Post‐acute care | 3 (9.7) | 0 (0) | |
| Rehabilitation | 1 (3.2) | 2 (4.6) | |
| Women's and maternal care | 0 (0) | 2 (4.6) | |
| Cardiology | 0 (0) | 1 (2.3) | |
| Case mix index, median [IQR] | n = 29 2.6 [1.1, 5.0] | n = 42 2.2 [1.6, 4.5] | 0.82 |
| Prior cerebrovascular accident (%) | 5 (16.1) | 8 (18.2) | 0.82 |
| Hypertension (%) | 17 (54.8) | 24 (54.6) | 0.98 |
| Diabetes mellitus (%) | 7 (22.6) | 11 (25.0) | 0.81 |
| Hyperlipidemia (%) | 15 (48.4) | 9 (20.5) | 0.01 |
| Tobacco abuse, current (%) | 4 (12.9) | 1 (2.3) | 0.15 |
| Alcohol abuse (%) | 2 (6.5) | 0 (0) | 0.17 |
| Active cancer (%) | 8 (25.8) | 5 (11.4) | 0.10 |
| Peripheral vascular disease (%) | 2 (6.5) | 3 (6.8) | 1.0 |
| Coronary artery disease (%) | 6 (19.4) | 7 (15.9) | 0.70 |
| Congestive heart failure (%) | n = 30 5 (16.7) | 4 (9.1) | 0.47 |
| Valvulopathy (%) | 0 (0) | 1 (2.3) | 1.0 |
| Atrial fibrillation (%) | 3 (9.7) | 10 (22.7) | 0.14 |
| Anticoagulation (%) | 7 (22.6) | 7 (15.9) | 0.47 |
| Final diagnosis ischemic brain injury (%) | 15 (48.4) | 11 (25.0) | 0.04 |
| Final diagnosis hemorrhagic brain injury (%) | 3 (9.7) | 4 (9.1) | 1.0 |
| Final diagnosis stroke mimic (symptoms not due to ischemic or hemorrhagic brain injury) (%) | 13 (41.9) | 29 (65.9) | 0.04 |
CONCLUSIONS
In‐hospital strokes represent an emergency for which response time is critical. Neurologic injury progresses with every minute of ischemia, and current recommendations offer a limited time window for intravenous thrombolysis. For stroke with symptom onset in the monitored setting of the hospital, there is a compelling imperative to reduce all delays from system inefficiencies. The findings of the current QI initiative suggest that dramatic improvements are possible through systematic evaluation and redesign of hospital response processes, a checklist for in‐hospital stroke carried by front‐line responders, and ongoing real‐time feedback.
Limitations of this study include a prepost design. The necessity of implementing system change hospital‐wide precluded use of a concurrent control group. The time goals for evaluation are derived from American Stroke Association targets for patients arriving in the Emergency Department. There are differences in process between the hospital ward and the Emergency Department, but the fundamental concept of minimizing time to evaluation once patient symptoms are recognized by hospital staff remains valid.
The possibility of system improvements not due to this QI initiative cannot be excluded. In 2006, this hospital expanded the responsibility of the stroke response team to include acute neurologic deficits outside of the ED without other changes to the in‐hospital stroke alert process. This reduced time to evaluation for in‐hospital ischemic strokes compared to usual care, but even with the same acute stroke response team responding to stroke alerts in both settings, in‐hospital stroke response times remained significantly longer than response times for stroke in the ED.10 The presence of an in‐hospital stroke alert response team alone was not capable of reducing evaluation times to goal. Minimal improvement in median in‐hospital stroke alert evaluation time was seen in the intervening year, following the completion of our previously published analysis, suggesting explicit system QI was necessary.
The Hawthorne effect, in which individuals who know they are being observed modify behavior while such monitoring is in effect, is a major limitation of interpreting QI initiatives. By committing to continuous and ongoing feedback to front‐line providers, this phenomenon can be harnessed to sustain improvement.17 In effect, the study of efficient response to the in‐hospital stroke never ceases. UCH has continued to employ the post‐intervention stroke alert protocol and engage in ongoing feedback after each stroke alert. In the 12 months following the conclusion of this study, the median response time to in‐hospital strokes continues to be 30 minutes, and 7 additional in‐hospital stroke patients have been treated with thrombolysis.
This inpatient stroke alert initiative decreased median inpatient alert‐to‐CT time by 57%, and demonstrates that quality of in‐hospital stroke care can be improved. Decrease in stroke alert‐to‐CT time facilitates earlier thrombolytic therapy. Analysis of treatment and patient outcomes was outside of the scope of the current study, but earlier treatment has potential to significantly improve clinical outcomes.
The Society of Hospital Medicine defines one of the goals of QI to be the change in processes with reduction in variation, thus improving the care for all patients rather than focusing exclusively on outlier events.18 This initiative markedly reduced evaluation variability, allowing a greater percentage of patients to be eligible for treatment within the critical time window. Prior to the intervention, almost a quarter of patients had delays in evaluation sufficient to preclude IV thrombolysis, whereas in the 6 months after the intervention was initiated, not a single patient had evaluation delayed to the point that IV thrombolysis would not have been an option (Figure 1). The goal of in‐hospital stroke QI must be to improve the speed of the process for all patients, and assure that no patient is denied the potential for therapy as a result of inefficiencies in hospital systems.
Acknowledgements
The authors thank Traci Yamashita, PRA, for her work in the statistical analysis for this publication, and Dr Jeffrey Glasheen for development of the University of Colorado Hospital's Hospitalist Training Track Quality Improvement Program of which this work is a product.
In‐hospital strokes account for a significant proportion of the almost 800,000 cerebrovascular accidents that occur each year in the United States.1 Although inpatient strokes are thought to be under‐recognized and under‐reported, between 4% and 17% of all stroke patients in the hospital experienced stroke onset during hospitalization.2, 3 Estimates place the number of in‐hospital strokes at 35,000‐75,000 each year in the United States.4
As a result of the exquisite sensitivity of brain tissue to ischemic events, stroke is a medical emergency and time‐to‐treatment is of the essence. With each minute of ischemia, 1.9 million neurons are destroyed.5 Evidence suggests benefit of treatment with intravenous thrombolysis up to 4.5 hours after symptom onset, with lower disability associated with more rapid initiation of therapy.6, 7 To facilitate timely thrombolytic therapy, the American Stroke Association (ASA) recommends that imaging of the brain be initiated within 25 minutes of presentation for patients with suspected stroke.8
Studies demonstrate greater delays in the evaluation of hospitalized patients suffering from stroke compared to stroke patients presenting to the Emergency Department (ED).9, 10 Performance of timely evaluation of in‐hospital stroke rarely meets ASA goals. Analysis of a Michigan stroke registry found that only 3.1% of patients with in‐hospital strokes received computed tomography (CT) scan within 25 minutes of symptom recognition, and a Colorado stroke registry found time‐to‐evaluation to be more than twice the recommended benchmark.11, 12 Data from a multicenter stroke registry in Spain showed that half of all thrombolysis‐eligible, in‐hospital stroke patients could not be treated due to delays in evaluation.13
Our prior work demonstrated that the use of an in‐hospital stroke response team significantly reduced time to evaluation for true ischemic strokes.10 Even with this rapid response mechanism, the evaluation time for in‐hospital stroke was still more than twice that observed in the ED despite using the same team to respond to both settings. Hospital rapid response systems, specifically for patients with suspected stroke, have been described in the literature and outline in‐hospital response systems capable of meeting evaluation time goals.1415 How to optimize a stroke response system has not been previously described. The aim of this quality improvement (QI) initiative was to reduce time‐to‐evaluation for strokes occurring in patients already hospitalized using systems analysis and modification. We describe key elements and tools for implementing institutional QI for in‐hospital stroke.
METHODS
The QI initiative was implemented at the University of Colorado Hospital (UCH), a tertiary care academic medical center. The Colorado Multiple Institutional Review Board determined this project to be in the exempt category. UCH uses a protocol in which all stroke alerts undergo non‐contrast CT of the brain. If no intracranial bleeding is found, and the patient is a thrombolytic candidate, advanced CT imaging including CT perfusion and CT angiogram will also be performed during the alert. Magnetic resonance imaging (MRI) with diffusion weighted imaging is done non‐emergently for subsequent stroke evaluation, but is not part of the stroke alert protocol. The primary endpoint of time from alert to initiation of CT was chosen because it represents an unambiguous interval which is present for all stroke alerts. Pre‐intervention data was gathered for 6 months, from September 2008 to February 2009. During this period, the process through which in‐hospital strokes were identified, referred for evaluation, and treated was mapped to identify inefficient or unreliable steps, and the process was redesigned to enhance efficiency. The intervention was rolled out over a 3‐month period from March 2009 to May 2009. During the intervention roll‐out period, the refined stroke alert process and a checklist containing the optimal in‐hospital stroke alert response system was implemented. An education campaign was initiated, for acute stroke team members and nursing staff, on signs of stroke and each individual's role in response to symptoms of in‐hospital stroke based on the new process. During the roll‐out period, each unit in the hospital was provided in‐hospital stroke alert posters and a packet containing specific stroke education on the in‐hospital stroke alert process. Unit educators were empowered to determine how to best deliver the education to their staff, and many chose to invite the stroke program coordinator to give an hour‐long presentation on stroke prior to shift or during lunch. Each unit educator kept record of the stroke instruction provided and submitted staff signatures to the stroke program. Nursing staff was also provided with in‐hospital stroke protocol badge cards that outlined optimal approach to stroke identification and treatment using the revised protocol. Interventions were being implemented in a progressive fashion throughout the roll‐out period. Starting during the roll‐out and continuing into the post‐intervention period, feedback on all in‐hospital stroke alerts was provided to the stroke team and front‐line providers. The impact of the intervention was followed for 6 months post‐intervention from June 2009 to November 2009. The QI tools used in this project are well described by the Institute of Healthcare Improvement, and each step in the QI process is outlined in detail below:16
Step 1: Process Map With Identification of Unreliable and Reliably Slow Steps
A detailed process map was created to outline steps in the existing stroke alert process (see Supporting Figures, Process Maps, in the online version of this article). One investigator (R.Z.) interviewed key members of the multidisciplinary stroke team, including representatives from the departments of neurology, nursing, hospital medicine, neurosurgery, radiology, and transportation. Interviews with key stakeholders and frequent participants in stroke alerts revealed evidence of episodic unreliable steps. Stakeholders were noted to have slightly different conceptions of how the process flow was intended to occur, and where responsibility lay for certain tasks. The interviews aided in identification of pitfalls, bottlenecks, misconceptions, and areas that needed clarification or change in the alert process.
Examples of unreliable and bottleneck steps include: In the pre‐intervention process, the transportation department was responsible for moving patients to radiology; this step was identified as reliably slow. Investigation revealed that the transportation department did not have a mechanism for rapid response to emergency transport requests. Analysis also revealed that 2 key steps necessary for treating in‐hospital stroke were occasionally neglected: ensuring adequate intravenous (IV) access, and ordering of the correct panel of laboratory tests. Finally, a process communication deficit was identified, with CT technicians periodically unaware of the pending arrival of an in‐hospital stroke patient, thus preventing the scan from being cleared for the emergent stroke imaging.
Direct observation of real‐time stroke alerts in both the inpatient and ED settings was also employed to outline the process and identify areas of inefficiency. Direct observation of stroke alerts in progress verified the unified picture of process flow developed from stakeholder interviews (see Supporting Figures, Process Maps, in the online version of this article). Particular note was made of differences between the stroke alert process in the ED and the inpatient setting.
Step 2: System Redesign With Input From All Stakeholders
Proposed interventions were presented to hospital governing councils, including the interdisciplinary Stroke Council and Nurse Managers Council. After verification of the shortcomings of the existing alert process and obtaining buy‐in from key participants and governing departments, a new process was designed (see Supporting Figures, Process Maps, in the online version of this article). Specific changes include the following examples: First, electrocardiogram was moved to occur after CT scan. Second, investigation revealed that the transportation department within the hospital was designed for non‐emergent transportation and not amenable to change. The mechanism of patient transportation was changed such that, rather than using the transportation department, patients were now transported by the neurology resident responding to the stroke alert, accompanied by the patient's ward nurse. This both removed a bottleneck step and assured critical staff presence during the transportation of a potentially unstable patient. Third, to ensure effective communication, CT technicians were provided with stroke alert pagers that receive text messages regarding incoming in‐hospital stroke alert patients. Fourth, a time limit was set for IV attempts prior to transportation. The new protocol, along with explicit expectations for the role of the patient's nurse in in‐hospital stroke alerts, was described in a hospital‐wide nursing stroke education initiative.
Step 3: In‐Hospital Stroke Alert Checklist
A new standardized protocol for optimal in‐hospital stroke care was detailed on a laminated pocket card. The checklist described exactly what steps were to be performed, by whom, how to make them occur, and in what order. The checklist was designed to reduce the incidence of omitted steps, such as ordering of correct laboratory evaluations. The laminated cards highlighted the benchmark time to evaluation of 25 minutes. Process checklist cards were distributed to all members of the acute stroke alert response team, and short versions designed specifically for nursing staff were distributed as badge cards and posted on clinical care units (Supporting Information Appendix I).
Step 4: Real‐Time Feedback
During the intervention roll‐out and post‐intervention periods, feedback was provided from the stroke program to the front‐line providers following each in‐hospital stroke alert. The clinicians involved were notified of the final diagnosis and patient outcome, and were provided with feedback about how the patient's evaluation times compared with benchmark goals. Feedback may serve to motivate, based on clinician professionalism, but performance in the alert was not tied to rewards or penalties for the providers involved. The feedback process was designed to be bi‐directional, with requests for input from staff on barriers to rapid evaluation experienced and suggestions for future process improvement (Supporting Information Appendix II).
Statistical Analysis
The primary outcome was the change in time from stroke alert to CT scan (alert‐to‐CT), comparing pre‐intervention and post‐intervention periods. This time interval was chosen because its calculation involved unambiguous time points, which are available for all patients for whom an in‐hospital alert is called. It is a measure of process efficiency, with minimal expected variation based on differences in patient characteristics (ie, hemorrhagic vs ischemic stroke). Non‐overlapping Kaplan‐Meier curves confirmed the proportional hazards assumption for 2 Cox proportional hazards models: unadjusted and adjusted by group characteristics with P‐value 0.10. Relative hazards and estimates for the percent of patients with alert‐to‐CT scan 25 minutes, according to intervention groups, were obtained from these models. For analyses, admit unit was re‐categorized as intensive care unit (ICU), Med/Surg, or Other. Analyses were conducted using SAS Version 9.2 (SAS Institute, Inc, Cary, NC).
RESULTS
During the study intervals, there were 82 inpatient stroke alerts. Of these alerts, 75 were included in the analysis. Seven were excluded for the following reasons: alert canceled by the stroke team (3), time of alert was not recorded (1), patient identifiers not recorded (1), or stroke alert was preceded by CT imaging (2).
During the 6 months prior to intervention, the median inpatient stroke alert‐to‐CT time (n = 31) was 69.0 minutes (Table 1). Nineteen percent of these alerts met the goal of 25 minutes from alert‐to‐CT time. During the 6‐month post‐intervention period, the median inpatient alert‐to‐CT time (n = 44) was 29.5 minutes. Thirty‐two percent of these alerts met the 25‐minute alert‐to‐CT time benchmark. In the unadjusted model, patients during the post‐intervention period were significantly more likely to have alert‐to‐CT scan time 25 minutes compared to patients prior to the intervention (post‐intervention compared to pre‐intervention, Relative Hazard (RH): 3.03; 95% confidence interval [CI]: 1.76‐5.20; log‐rank P 0.0001). This remained significant after adjustment for hyperlipidemia, active cancer, final diagnosis of ischemic brain injury, and final diagnosis of stroke mimic (RH: 4.96; 95% CI: 2.65‐9.32; P 0.0001); data not shown. Admit unit was not included in the adjusted model since there was no indication of differences in the 3‐level variable according to intervention group (P = 0.27). In addition to reduction in median response times, the variability of response times was markedly reduced, and no patient in the 6‐month post‐intervention period had delay to CT sufficient to preclude use of IV thrombolysis (Figure 1).
| Pre‐Intervention (n = 31) | Post‐Intervention (n = 44) | P Value | |
|---|---|---|---|
| |||
| Stroke alert to CT time, median [95% CI] | 69 min [34, 103] | 29.5 min [26, 40] | P 0.0001 |
| Age, median [IQR] | 61.0 [54.0, 70.0] | 60.5 [48.5, 70.5] | 0.94 |
| Female (%) | 19 (61.3) | 23 (52.3) | 0.44 |
| Race (%) | |||
| Asian | 1 (3.2) | 1 (2.3) | 0.31 |
| Black | 4 (12.9) | 6 (13.6) | |
| Caucasian | 21 (67.7) | 27 (61.4) | |
| Hispanic | 3 (9.7) | 10 (22.7) | |
| Unknown | 2 (6.5) | 0 (0) | |
| Admit unit (%) | |||
| Intensive care | 12 (38.7) | 10 (22.7) | 0.07 |
| Medicine/surgery | 15 (48.4) | 24 (54.6) | |
| Neurology | 0 (0) | 5 (11.4) | |
| Post‐acute care | 3 (9.7) | 0 (0) | |
| Rehabilitation | 1 (3.2) | 2 (4.6) | |
| Women's and maternal care | 0 (0) | 2 (4.6) | |
| Cardiology | 0 (0) | 1 (2.3) | |
| Case mix index, median [IQR] | n = 29 2.6 [1.1, 5.0] | n = 42 2.2 [1.6, 4.5] | 0.82 |
| Prior cerebrovascular accident (%) | 5 (16.1) | 8 (18.2) | 0.82 |
| Hypertension (%) | 17 (54.8) | 24 (54.6) | 0.98 |
| Diabetes mellitus (%) | 7 (22.6) | 11 (25.0) | 0.81 |
| Hyperlipidemia (%) | 15 (48.4) | 9 (20.5) | 0.01 |
| Tobacco abuse, current (%) | 4 (12.9) | 1 (2.3) | 0.15 |
| Alcohol abuse (%) | 2 (6.5) | 0 (0) | 0.17 |
| Active cancer (%) | 8 (25.8) | 5 (11.4) | 0.10 |
| Peripheral vascular disease (%) | 2 (6.5) | 3 (6.8) | 1.0 |
| Coronary artery disease (%) | 6 (19.4) | 7 (15.9) | 0.70 |
| Congestive heart failure (%) | n = 30 5 (16.7) | 4 (9.1) | 0.47 |
| Valvulopathy (%) | 0 (0) | 1 (2.3) | 1.0 |
| Atrial fibrillation (%) | 3 (9.7) | 10 (22.7) | 0.14 |
| Anticoagulation (%) | 7 (22.6) | 7 (15.9) | 0.47 |
| Final diagnosis ischemic brain injury (%) | 15 (48.4) | 11 (25.0) | 0.04 |
| Final diagnosis hemorrhagic brain injury (%) | 3 (9.7) | 4 (9.1) | 1.0 |
| Final diagnosis stroke mimic (symptoms not due to ischemic or hemorrhagic brain injury) (%) | 13 (41.9) | 29 (65.9) | 0.04 |
CONCLUSIONS
In‐hospital strokes represent an emergency for which response time is critical. Neurologic injury progresses with every minute of ischemia, and current recommendations offer a limited time window for intravenous thrombolysis. For stroke with symptom onset in the monitored setting of the hospital, there is a compelling imperative to reduce all delays from system inefficiencies. The findings of the current QI initiative suggest that dramatic improvements are possible through systematic evaluation and redesign of hospital response processes, a checklist for in‐hospital stroke carried by front‐line responders, and ongoing real‐time feedback.
Limitations of this study include a prepost design. The necessity of implementing system change hospital‐wide precluded use of a concurrent control group. The time goals for evaluation are derived from American Stroke Association targets for patients arriving in the Emergency Department. There are differences in process between the hospital ward and the Emergency Department, but the fundamental concept of minimizing time to evaluation once patient symptoms are recognized by hospital staff remains valid.
The possibility of system improvements not due to this QI initiative cannot be excluded. In 2006, this hospital expanded the responsibility of the stroke response team to include acute neurologic deficits outside of the ED without other changes to the in‐hospital stroke alert process. This reduced time to evaluation for in‐hospital ischemic strokes compared to usual care, but even with the same acute stroke response team responding to stroke alerts in both settings, in‐hospital stroke response times remained significantly longer than response times for stroke in the ED.10 The presence of an in‐hospital stroke alert response team alone was not capable of reducing evaluation times to goal. Minimal improvement in median in‐hospital stroke alert evaluation time was seen in the intervening year, following the completion of our previously published analysis, suggesting explicit system QI was necessary.
The Hawthorne effect, in which individuals who know they are being observed modify behavior while such monitoring is in effect, is a major limitation of interpreting QI initiatives. By committing to continuous and ongoing feedback to front‐line providers, this phenomenon can be harnessed to sustain improvement.17 In effect, the study of efficient response to the in‐hospital stroke never ceases. UCH has continued to employ the post‐intervention stroke alert protocol and engage in ongoing feedback after each stroke alert. In the 12 months following the conclusion of this study, the median response time to in‐hospital strokes continues to be 30 minutes, and 7 additional in‐hospital stroke patients have been treated with thrombolysis.
This inpatient stroke alert initiative decreased median inpatient alert‐to‐CT time by 57%, and demonstrates that quality of in‐hospital stroke care can be improved. Decrease in stroke alert‐to‐CT time facilitates earlier thrombolytic therapy. Analysis of treatment and patient outcomes was outside of the scope of the current study, but earlier treatment has potential to significantly improve clinical outcomes.
The Society of Hospital Medicine defines one of the goals of QI to be the change in processes with reduction in variation, thus improving the care for all patients rather than focusing exclusively on outlier events.18 This initiative markedly reduced evaluation variability, allowing a greater percentage of patients to be eligible for treatment within the critical time window. Prior to the intervention, almost a quarter of patients had delays in evaluation sufficient to preclude IV thrombolysis, whereas in the 6 months after the intervention was initiated, not a single patient had evaluation delayed to the point that IV thrombolysis would not have been an option (Figure 1). The goal of in‐hospital stroke QI must be to improve the speed of the process for all patients, and assure that no patient is denied the potential for therapy as a result of inefficiencies in hospital systems.
Acknowledgements
The authors thank Traci Yamashita, PRA, for her work in the statistical analysis for this publication, and Dr Jeffrey Glasheen for development of the University of Colorado Hospital's Hospitalist Training Track Quality Improvement Program of which this work is a product.
- ,,, et al.Heart disease and stroke statistics—2010 update: a report from the American Heart Association.Circulation.2010;121:e46–e215.
- ,,.Characteristics of in‐hospital onset ischemic stroke.Eur Neurol.2006;55:155–159.
- ,.Inpatient and community ischemic strokes in a community hospital.Neuroepidemiology.2007;28:86–92.
- .In‐hospital stroke.Lancet Neurol.2003;2:741–746.
- .Time is brain‐quantified.Stroke.2006;37:263–266.
- ,,, et al.Ultra‐early thrombolysis in acute ischemic stroke is associated with better outcomes and lower mortality.Stroke.2010;41:712–716.
- ,,,.Expansion of the time window for treatment of acute ischemic stroke with intravenous tissue plasminogen activator: a science advisory from the American Heart Association/American Stroke Association.Stroke.2009;40:2945–2948.
- ,,, et al.Guidelines for early management of adults with ischemic stroke.Stroke.2007;38;1655–1711.
- ,,, et al.In‐hospital stroke treated with intravenous tissue plasminogen activator.Stroke.2008;39:2614–2616.
- ,,,,.Stroke alert program improves recognition and evaluation time of in‐hospital ischemic stroke.J Stroke Cerebrovasc Dis.2009;19:494–496.
- ,,,,,.In‐hospital stroke in a statewide stroke registry.Cerebrovasc Dis.2008;25:12–20.
- ,,,,.Quality of care for in‐hospital stroke: analysis of a statewide registry.Stroke.2011;42:207–210.
- ,,, et al.In‐hospital stroke: a multi‐center prospective registry.Eur J Neurol.2011;18:170–176.
- ,,.Code Gray—an organized approach to inpatient stroke.Crit Care Nurs Q.2003;26:296–302.
- ,,.ID, stat‐rapid response to in‐hospital stroke patients.Nurs Manage.2009;40:34–38.
- Institute of Healthcare Improvement. Quality Improvement Tools. Available at: http://www.ihi.org/IHI/Topics/Improvement/ImprovementMethods/Tools/. Accessed December 1,2010.
- ,,,,,.Variability in the Hawthorne effect with regard to hand hygiene performance in high‐ and low‐performing inpatient care units.Infect Control Hosp Epidemiol.2009;30:222–225.
- Society of Hospital Medicine Quality Improvement Resources. Available at: http://www.hospitalmedicine.org/ResourceRoomRedesign/html/32. Accessed December 1,2010.
- ,,, et al.Heart disease and stroke statistics—2010 update: a report from the American Heart Association.Circulation.2010;121:e46–e215.
- ,,.Characteristics of in‐hospital onset ischemic stroke.Eur Neurol.2006;55:155–159.
- ,.Inpatient and community ischemic strokes in a community hospital.Neuroepidemiology.2007;28:86–92.
- .In‐hospital stroke.Lancet Neurol.2003;2:741–746.
- .Time is brain‐quantified.Stroke.2006;37:263–266.
- ,,, et al.Ultra‐early thrombolysis in acute ischemic stroke is associated with better outcomes and lower mortality.Stroke.2010;41:712–716.
- ,,,.Expansion of the time window for treatment of acute ischemic stroke with intravenous tissue plasminogen activator: a science advisory from the American Heart Association/American Stroke Association.Stroke.2009;40:2945–2948.
- ,,, et al.Guidelines for early management of adults with ischemic stroke.Stroke.2007;38;1655–1711.
- ,,, et al.In‐hospital stroke treated with intravenous tissue plasminogen activator.Stroke.2008;39:2614–2616.
- ,,,,.Stroke alert program improves recognition and evaluation time of in‐hospital ischemic stroke.J Stroke Cerebrovasc Dis.2009;19:494–496.
- ,,,,,.In‐hospital stroke in a statewide stroke registry.Cerebrovasc Dis.2008;25:12–20.
- ,,,,.Quality of care for in‐hospital stroke: analysis of a statewide registry.Stroke.2011;42:207–210.
- ,,, et al.In‐hospital stroke: a multi‐center prospective registry.Eur J Neurol.2011;18:170–176.
- ,,.Code Gray—an organized approach to inpatient stroke.Crit Care Nurs Q.2003;26:296–302.
- ,,.ID, stat‐rapid response to in‐hospital stroke patients.Nurs Manage.2009;40:34–38.
- Institute of Healthcare Improvement. Quality Improvement Tools. Available at: http://www.ihi.org/IHI/Topics/Improvement/ImprovementMethods/Tools/. Accessed December 1,2010.
- ,,,,,.Variability in the Hawthorne effect with regard to hand hygiene performance in high‐ and low‐performing inpatient care units.Infect Control Hosp Epidemiol.2009;30:222–225.
- Society of Hospital Medicine Quality Improvement Resources. Available at: http://www.hospitalmedicine.org/ResourceRoomRedesign/html/32. Accessed December 1,2010.