User login
AVAHO
div[contains(@class, 'header__large-screen')]
div[contains(@class, 'read-next-article')]
div[contains(@class, 'nav-primary')]
nav[contains(@class, 'nav-primary')]
section[contains(@class, 'footer-nav-section-wrapper')]
footer[@id='footer']
div[contains(@class, 'main-prefix')]
section[contains(@class, 'nav-hidden')]
div[contains(@class, 'ce-card-content')]
nav[contains(@class, 'nav-ce-stack')]
NCCN recommends third COVID-19 dose for patients with cancer
Experts at the National Comprehensive Cancer Network have now issued an updated recommendation for COVID-19 vaccination in people with cancer. The panel calls for these patients to be among the highest-priority group to be vaccinated against COVID-19 and to receive the newly approved third dose of vaccine.
The NCCN has recommended in February that all patients receiving active cancer treatment should receive a COVID-19 vaccine and should be prioritized for vaccination. In August, the FDA authorized a third dose of either the Pfizer or Moderna COVID-19 vaccines for people with compromised immune systems. Those eligible for a third dose include solid organ transplant recipients, those undergoing cancer treatments, and people with autoimmune diseases that suppress their immune systems
The new NCCN recommendations state that the following groups should be considered eligible for a third dose of the mRNA COVID-19 vaccine immediately, based on the latest decisions from the Food and Drug Administration and the Centers for Disease Control and Prevention:
- Patients with solid tumors (either new or recurring) receiving treatment within 1 year of their initial vaccine dose, regardless of their type of cancer therapy.
- Patients with active hematologic malignancies regardless of whether they are currently receiving cancer therapy.
- Anyone who received a stem cell transplant (SCT) or engineered cellular therapy (for example, chimeric antigen receptor T cells), especially within the past 2 years.
- Any recipients of allogeneic SCT on immunosuppressive therapy or with a history of graft-versus-host disease regardless of the time of transplant.
- Anyone with an additional immunosuppressive condition (for example, HIV) or being treated with immunosuppressive agents unrelated to their cancer therapy.
Cancer patients at high risk of complications
As previously reported by this news organization, infection with COVID-19 in people with cancer can severely impact survival. One study published in 2020 found that patients with both COVID-19 infection and progressing cancer had a fivefold increase in the risk of 30-day mortality, compared with COVID-19–positive cancer patients who were in remission or had no evidence of cancer.
Another study found that cancer type, stage, and recent treatment could affect outcomes of COVID-19 in patients with cancer. Patients with hematologic malignancies and metastatic cancers had higher risks of developing severe or critical COVID-19 symptoms, being admitted to the ICU, requiring ventilation, and dying. Conversely, those with nonmetastatic disease had outcomes that were comparable with persons without cancer and a COVID-19 infection. This study also found that having undergone recent surgery or receiving immunotherapy also put patients at a higher risk of poor outcomes, although patients with cancer who were treated with radiotherapy had outcomes similar to those of noncancer COVID-19 patients.
“COVID-19 can be very dangerous, especially for people living with cancer, which is why we’re so grateful for safe and effective vaccines that are saving lives,” Robert W. Carlson, MD, CEO of NCCN, said in a statement.
Right timing and location
The current NCCN update also recommends that individuals wait at least 4 weeks between the second and third doses, and those who are infected with COVID-19 after being vaccinated should wait until they have documented clearance of the virus before receiving a third dose.
It also recommends that people who live in the same household with immunocompromised individuals should also get a third dose once it becomes available, and that it is best to have a third dose of the same type of vaccine as the first two doses. However, a different mRNA vaccine is also acceptable.
Immunocompromised individuals should try to receive their third dose in a health care delivery setting, as opposed to a pharmacy or public vaccination clinic if possible, as it would limit their risk of exposure to the general population.
Steve Pergam, MD, MPH, associate professor, vaccine and infectious disease division, Fred Hutchinson Cancer Research Center, Seattle, commented that it is still necessary to take precautions, even after getting the booster dose.
“That means, even after a third dose of vaccine, we still recommend immunocompromised people, such as those undergoing cancer treatment, continue to be cautious, wear masks, and avoid large group gatherings, particularly around those who are unvaccinated,” said Dr. Pergam, who is also coleader of the NCCN COVID-19 Vaccination Advisory Committee. “All of us should do our part to reduce the spread of COVID-19 and get vaccinated to protect those around us from preventable suffering.”
A version of this article first appeared on Medscape.com.
Advances in Hematology and Oncology
Advances in Hematology and Oncology

- Integrated Care for Cancer-Related Distress
- Solid Tumor Checkpoint Inhibitor Dosing Models and Toxicity
- Evidence-Based Algorithm for Prostate Cancer Bone Health
- QOL and Toxicity After High-Dose Brachytherapy for Prostate Cancer
- An Interdisciplinary Approach to Comorbid Pancreatic Cancer and Substance Use Disorder
- Three Primary Cancers in a Veteran With Toxic Exposures
Advances in Hematology and Oncology
- Integrated Care for Cancer-Related Distress
- Solid Tumor Checkpoint Inhibitor Dosing Models and Toxicity
- Evidence-Based Algorithm for Prostate Cancer Bone Health
- QOL and Toxicity After High-Dose Brachytherapy for Prostate Cancer
- An Interdisciplinary Approach to Comorbid Pancreatic Cancer and Substance Use Disorder
- Three Primary Cancers in a Veteran With Toxic Exposures

Antiviral Therapy Improves Hepatocellular Cancer Survival
Hepatocellular cancer (HCC) is the most common type of hepatic cancers, accounting for 65% of all hepatic cancers.1 Among all cancers, HCC is one of the fastest growing causes of death in the United States, and the rate of new HCC cases are on the rise over several decades.2 There are many risk factors leading to HCC, including alcohol use, obesity, and smoking. Infection with hepatitis C virus (HCV) poses a significant risk.1
The pathogenesis of HCV-induced carcinogenesis is mediated by a unique host-induced immunologic response. Viral replication induces production of inflammatory factors, such as tumor necrosis factor (TNF-α), interferon (IFN), and oxidative stress on hepatocytes, resulting in cell injury, death, and regeneration. Repetitive cycles of cellular death and regeneration induce fibrosis, which may lead to cirrhosis.3 Hence, early treatment of HCV infection and achieving sustained virologic response (SVR) may lead to decreased incidence and mortality associated with HCC.
Treatment of HCV infection has become more effective with the development of direct-acting antivirals (DAAs) leading to SVR in > 90% of patients compared with 40 to 50% with IFN-based treatment.4,5 DAAs have been proved safe and highly effective in eradicating HCV infection even in patients with advanced liver disease with decompensated cirrhosis.6 Although achieving SVR indicates a complete cure from chronic HCV infection, several studies have shown subsequent risk of developing HCC persists even after successful HCV treatment.7-9 Some studies show that using DAAs to achieve SVR in patients with HCV infection leads to a decreased relative risk of HCC development compared with patients who do not receive treatment.10-12 But data on HCC risk following DAA-induced SVR vs IFN-induced SVR are somewhat conflicting.
Much of the information regarding the association between SVR and HCC has been gleaned from large data banks without accounting for individual patient characteristics that can be obtained through full chart review. Due to small sample sizes in many chart review studies, the impact that SVR from DAA therapy has on the progression and severity of HCC is not entirely clear. The aim of our study is to evaluate the effect of HCV treatment and SVR status on overall survival (OS) in patients with HCC. Second, we aim to compare survival benefits, if any exist, among the 2 major HCV treatment modalities (IFN vs DAA).
Methods
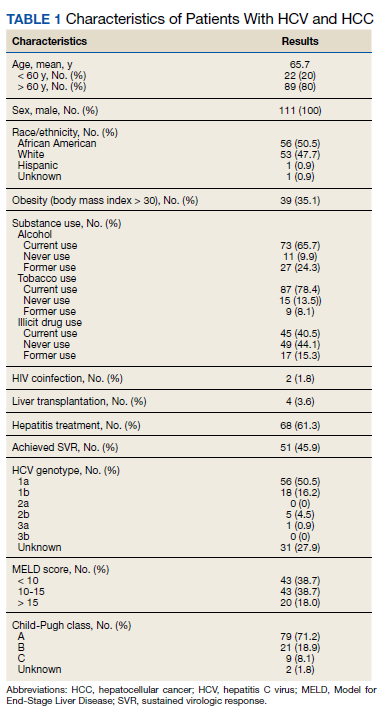
We performed a retrospective review of patients at Memphis Veterans Affairs Medical Center (VAMC) in Tennessee to determine whether treatment for HCV infection in general, and achieving SVR in particular, makes a difference in progression, recurrence, or OS among patients with HCV infection who develop HCC. We identified 111 patients with a diagnosis of both HCV and new or recurrent HCC lesions from November 2008 to March 2019 (Table 1). We divided these patients based on their HCV treatment status, SVR status, and treatment types (IFN vs DAA).
The inclusion criteria were patients aged > 18 years treated at the Memphis VAMC who have HCV infection and developed HCC. Exclusion criteria were patients who developed HCC from other causes such as alcoholic steatohepatitis, hepatitis B virus infection, hemochromatosis, patients without HCV infection, and patients who were not established at the Memphis VAMC. This protocol was approved by the Memphis VAMC Institutional Review Board.
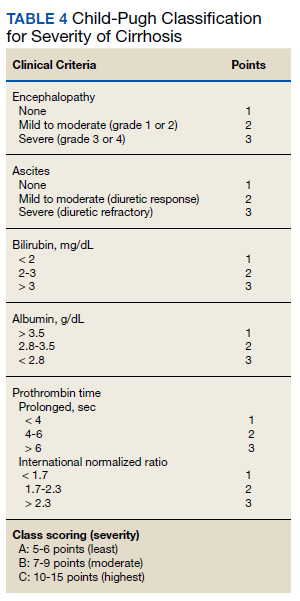
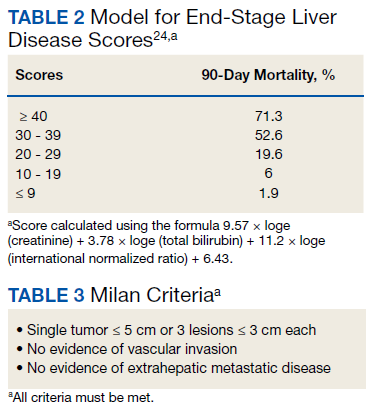
HCC diagnosis was determined using International Classification of Diseases codes (9th revision: 155 and 155.2; 10th revision: CD 22 and 22.9). We also used records of multidisciplinary gastrointestinal malignancy tumor conferences to identify patient who had been diagnosed and treated for HCV infection. We identified patients who were treated with DAA vs IFN as well as patients who had achieved SVR (classified as having negative HCV RNA tests at the end of DAA treatment). We were unable to evaluate Barcelona Clinic Liver Cancer staging since this required documented performance status that was not available in many patient records. We selected cases consistent with both treatment for HCV infection and subsequent development of HCC. Patient data included age; OS time; HIV status HCV genotype; time and status of progression to HCC; type and duration of treatment; and alcohol, tobacco, and drug use. Disease status was measured using the Model for End-Stage Liver Disease (MELD) score (Table 2), Milan criteria (Table 3), and Child-Pugh score (Table 4).
Statistical Analysis
OS was measured from the date of HCC diagnosis to the date of death or last follow-up. Progression-free survival (PFS) was defined from the date of HCC treatment initiation to the date of first HCC recurrence. We compared survival data for the SVR and non-SVR subgroups, the HCV treatment vs non-HCV treatment subgroups, and the IFN therapy vs DAA therapy subgroups, using the Kaplan-Meier method. The differences between subgroups were assessed using a log-rank test. Multivariate analysis using Cox proportional hazards regression model was used to identify factors that had significant impact on OS. Those factors included age; race; alcohol, tobacco, and illicit drug use; SVR status; HCV treatment status; IFN-based regimen vs DAA; MELD, and Child-Pugh scores. The results were expressed as hazard ratios (HRs) and 95% CI. Calculations were made using Statistical Analysis SAS and IBM SPSS software.
Results
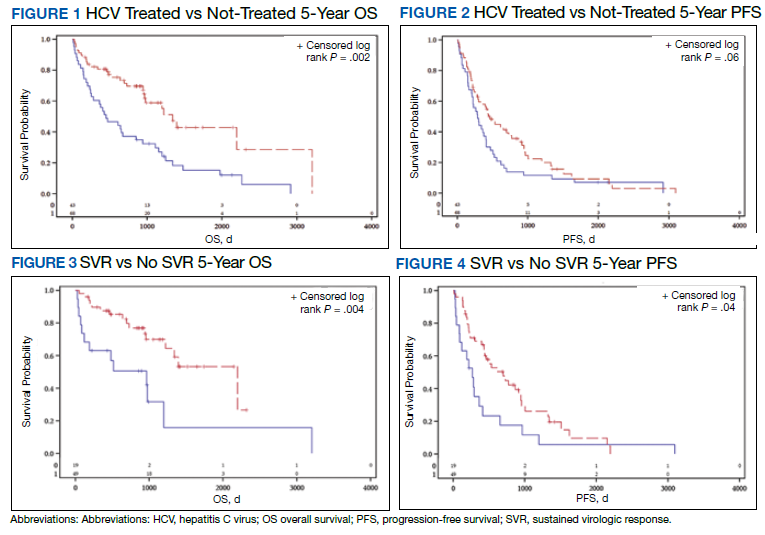
The study included 111 patients. The mean age was 65.7 years; all were male and half of were Black patients. The gender imbalance was due to the predominantly male patient population at Memphis VAMC. Among 111 patients with HCV infection and HCC, 68 patients were treated for HCV infection and had significantly improved OS and PFS compared with the nontreatment group. The median 5-year OS was 44.6 months (95% CI, 966-3202) in the treated HCV infection group compared with 15.1 months in the untreated HCV infection group with a Wilcoxon P = .0005 (Figure 1). Similarly, patients treated for HCV infection had a significantly better 5-year PFS of 15.3 months (95% CI, 294-726) compared with the nontreatment group 9.5 months (95% CI, 205-405) with a Wilcoxon P = .04 (Figure 2).
Among 68 patients treated for HCV infection, 51 achieved SVR, and 34 achieved SVR after the diagnosis of HCC. Patients who achieved SVR had an improved 5-year OS when compared with patients who did not achieve SVR (median 65.8 months [95% CI, 1222-NA] vs 15.7 months [95% CI, 242-853], Wilcoxon P < .001) (Figure 3). Similarly, patients with SVR had improved 5-year PFS when compared with the non-SVR group (median 20.5 months [95% CI, 431-914] vs 8.9 months [95% CI, 191-340], Wilcoxon P = .007 (Figure 4). Achievement of SVR after HCC diagnosis suggests a significantly improved OS (HR 0.37) compared with achievement prior to HCC diagnosis (HR, 0.65; 95% CI, 0.23-1.82, P = .41)
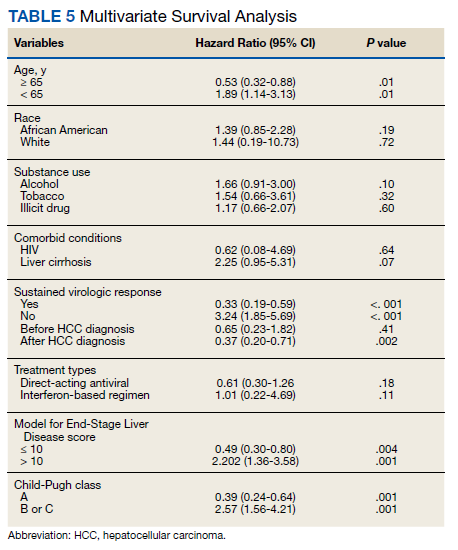
Multivariate Cox regression was used to determine factors with significant survival impact. Advanced age at diagnosis (aged ≥ 65 years) (HR, 0.53; 95% CI, 0.320-0.880; P = .01), SVR status (HR, 0.33; 95% CI, 0.190-0.587; P < .001), achieving SVR after HCC diagnosis (HR, 0.37; 95% CI, 0.20-0.71; P = .002), low MELD score (< 10) (HR, 0.49; 95% CI, 0.30-0.80; P = .004) and low Child-Pugh score (class A) (HR, 0.39; 95% CI, 0.24-0.64; P = .001) have a significant positive impact on OS. Survival was not significantly influenced by race, tobacco, drug use, HIV or cirrhosis status, or HCV treatment type. In addition, higher Child-Pugh class (B or C), higher MELD score (> 10), and younger age at diagnosis (< 65 years) have a negative impact on survival outcome (Table 5).
Discussion
The survival benefit of HCV eradication and achieving SVR status has been well established in patients with HCC.13 In a retrospective cohort study of 250 patients with HCV infection who had received curative treatment for HCC, multivariate analysis demonstrated that achieving SVR is an independent predictor of OS.14 The 3-year and 5-year OS rates were 97% and 94% for the SVR group, and 91% and 60% for the non‐SVR group, respectively (P < .001). Similarly, according to Sou and colleagues, of 122 patients with HCV-related HCC, patients with SVR had longer OS than patients with no SVR (P = .04).15 One of the hypotheses that could explain the survival benefit in patients who achieved SVR is the effect of achieving SVR in reducing persistent liver inflammation and associated liver mortality, and therefore lowering risks of complication in patients with HCC.16 In our study, multivariate analysis shows that achieving SVR is associated with significant improved OS (HR, 0.33). In contrast, patients with HCC who have not achieved SVR are associated with worse survival (HR, 3.24). This finding supports early treatment of HCV to obtain SVR in HCV-related patients with HCC, even after development of HCC.
Among 68 patients treated for HCV infection, 45 patients were treated after HCC diagnosis, and 34 patients achieved SVR after HCC diagnosis. The average time between HCV infection treatment after HCC diagnosis was 6 months. Our data suggested that achievement of SVR after HCC diagnosis suggests an improved OS (HR, 0.37) compared with achievement prior to HCC diagnosis (HR, 0.65; 95% CI,0.23-1.82; P = .41). This lack of statistical significance is likely due to small sample size of patients achieving SVR prior to HCC diagnosis. Our results are consistent with the findings regarding the efficacy and timing of DAA treatment in patients with active HCC. According to Singal and colleagues, achieving SVR after DAA therapy may result in improved liver function and facilitate additional HCC-directed therapy, which potentially improves survival.17-19
Nagaoki and colleagues found that there was no significant difference in OS in patients with HCC between the DAA and IFN groups. According to the study, the 3-year and 5-year OS rates were 96% and 96% for DAA patients and 93% and 73% for IFN patients, respectively (P = .16).14 This finding is consistent with the results of our study. HCV treatment type (IFN vs DAA) was not found to be associated with either OS or PFS time, regardless of time period.
A higher MELD score (> 10) and a higher Child-Pugh class (B or C) score are associated with worse survival outcome regardless of SVR status. While patients with a low MELD score (≤ 10) have a better survival rate (HR 0.49), a higher MELD score has a significantly higher HR and therefore worse survival outcomes (HR, 2.20). Similarly, patients with Child-Pugh A (HR, 0.39) have a better survival outcome compared with those patients with Child-Pugh class B or C (HR, 2.57). This finding is consistent with results of multiple studies indicating that advanced liver disease, as measured by a high MELD score and Child-Pugh class score, can be used to predict the survival outcome in patients with HCV-related HCC.20-22
Unlike other studies that look at a single prognostic variable, our study evaluated prognostic impacts of multiple variables (age, SVR status, the order of SVR in relation to HCC development, HCV treatment type, MELD score and Child-Pugh class) in patients with HCC. The study included patients treated for HCV after development of HCC along with other multiple variables leading to OS benefit. It is one of the only studies in the United States that compared 5-year OS and PFS among patients with HCC treated for HCV and achieved SVR. The studies by Nagaoki and colleagues and Sou and colleagues were conducted in Japan, and some of their subset analyses were univariate. Among our study population of veterans, 50% were African American patients, suggesting that they may have similar OS benefit when compared to White patients with HCC and HCV treatment.
Limitations
Our findings were limited in that our study population is too small to conduct further subset analysis that would allow statistical significance of those subsets, such as the suggested benefit of SVR in patients who presented with HCC after antiviral therapy. Another limitation is the all-male population, likely a result of the older veteran population at the Memphis VAMC. The mean age at diagnosis was 65 years, which is slightly higher than the general population. Compared to the SEER database, HCC is most frequently diagnosed among people aged 55 to 64 years.23 The age difference was likely due to our aging veteran population.
Further studies are needed to determine the significance of SVR on HCC recurrence and treatment. Immunotherapy is now first-line treatment for patients with local advanced HCC. All the immunotherapy studies excluded patients with active HCV infection. Hence, we need more data on HCV treatment timing among patients scheduled to start treatment with immunotherapy.
Conclusions
In a population of older veterans, treatment of HCV infection leads to OS benefit among patients with HCC. In addition, patients with HCV infection who achieve SVR have an OS benefit over patients unable to achieve SVR. The type of treatment, DAA vs IFN-based regimen, did not show significant survival benefit.
1. Ghouri YA, Mian I, Rowe JH. Review of hepatocellular carcinoma: epidemiology, etiology, and carcinogenesis. J Carcinog. 2017;16:1. Published 2017 May 29. doi:10.4103/jcar.JCar_9_16
2. Bray F, Ferlay J, Soerjomataram I, Siegel RL, Torre LA, Jemal A. Global cancer statistics 2018: GLOBOCAN estimates of incidence and mortality worldwide for 36 cancers in 185 countries. CA Cancer J Clin. 2018;68(6):394-424. doi:10.3322/caac.21492
3. Farazi PA, DePinho RA. Hepatocellular carcinoma pathogenesis: from genes to environment. Nat Rev Cancer. 2006;6(9):674-687. doi:10.1038/nrc1934
4. Falade-Nwulia O, Suarez-Cuervo C, Nelson DR, Fried MW, Segal JB, Sulkowski MS. Oral direct-acting agent therapy for hepatitis c virus infection: a systematic review. Ann Intern Med. 2017;166(9):637-648. doi:10.7326/M16-2575
5. Kouris G, Hydery T, Greenwood BC, et al. Effectiveness of Ledipasvir/Sofosbuvir and predictors of treatment failure in members with hepatitis C genotype 1 infection: a retrospective cohort study in a medicaid population. J Manag Care Spec Pharm. 2018;24(7):591-597. doi:10.18553/jmcp.2018.24.7.591
6. Jacobson IM, Lawitz E, Kwo PY, et al. Safety and efficacy of elbasvir/grazoprevir in patients with hepatitis c virus infection and compensated cirrhosis: an integrated analysis. Gastroenterology. 2017;152(6):1372-1382.e2. doi:10.1053/j.gastro.2017.01.050
7. Nahon P, Layese R, Bourcier V, et al. Incidence of hepatocellular carcinoma after direct antiviral therapy for HCV in patients with cirrhosis included in surveillance programs. Gastroenterology. 2018;155(5):1436-1450.e6. doi:10.1053/j.gastro.2018.07.01510.
8. Innes H, Barclay ST, Hayes PC, et al. The risk of hepatocellular carcinoma in cirrhotic patients with hepatitis C and sustained viral response: role of the treatment regimen. J Hepatol. 2018;68(4):646-654. doi:10.1016/j.jhep.2017.10.033
9. Romano A, Angeli P, Piovesan S, et al. Newly diagnosed hepatocellular carcinoma in patients with advanced hepatitis C treated with DAAs: a prospective population study. J Hepatol. 2018;69(2):345-352. doi:10.1016/j.jhep.2018.03.009
10. Kanwal F, Kramer J, Asch SM, Chayanupatkul M, Cao Y, El-Serag HB. Risk of hepatocellular cancer in HCV patients treated with direct-acting antiviral agents. Gastroenterology. 2017;153(4):996-1005.e1. doi:10.1053/j.gastro.2017.06.0122
11. Singh S, Nautiyal A, Loke YK. Oral direct-acting antivirals and the incidence or recurrence of hepatocellular carcinoma: a systematic review and meta-analysis. Frontline Gastroenterol. 2018;9(4):262-270. doi:10.1136/flgastro-2018-101017
12. Kuftinec G, Loehfelm T, Corwin M, et al. De novo hepatocellular carcinoma occurrence in hepatitis C cirrhotics treated with direct-acting antiviral agents. Hepat Oncol. 2018;5(1):HEP06. Published 2018 Jul 25. doi:10.2217/hep-2018-00033
13. Morgan RL, Baack B, Smith BD, Yartel A, Pitasi M, Falck-Ytter Y. Eradication of hepatitis C virus infection and the development of hepatocellular carcinoma: a meta-analysis of observational studies. Ann Intern Med. 2013;158(5 Pt 1):329-337. doi:10.7326/0003-4819-158-5-201303050-00005
14. Nagaoki Y, Imamura M, Nishida Y, et al. The impact of interferon-free direct-acting antivirals on clinical outcome after curative treatment for hepatitis C virus-associated hepatocellular carcinoma: comparison with interferon-based therapy. J Med Virol. 2019;91(4):650-658. doi:10.1002/jmv.25352
15. Sou FM, Wu CK, Chang KC, et al. Clinical characteristics and prognosis of HCC occurrence after antiviral therapy for HCV patients between sustained and non-sustained responders. J Formos Med Assoc. 2019;118(1 Pt 3):504-513. doi:10.1016/j.jfma.2018.10.017
16. Roche B, Coilly A, Duclos-Vallee JC, Samuel D. The impact of treatment of hepatitis C with DAAs on the occurrence of HCC. Liver Int. 2018;38(suppl 1):139-145. doi:10.1111/liv.13659
17. Singal AG, Lim JK, Kanwal F. AGA clinical practice update on interaction between oral direct-acting antivirals for chronic hepatitis C infection and hepatocellular carcinoma: expert review. Gastroenterology. 2019;156(8):2149-2157. doi:10.1053/j.gastro.2019.02.046
18. Toyoda H, Kumada T, Hayashi K, et al. Characteristics and prognosis of hepatocellular carcinoma detected in sustained responders to interferon therapy for chronic hepatitis C. Cancer Detect Prev. 2003;27(6):498-502. doi:10.1016/j.cdp.2003.09.00719. Okamura Y, Sugiura T, Ito T, et al. The achievement of a sustained virological response either before or after hepatectomy improves the prognosis of patients with primary hepatitis C virus-related hepatocellular carcinoma. Ann Surg Oncol. 2019; 26(13):4566-4575. doi:10.1245/s10434-019-07911-w
20. Wray CJ, Harvin JA, Silberfein EJ, Ko TC, Kao LS. Pilot prognostic model of extremely poor survival among high-risk hepatocellular carcinoma patients. Cancer. 2012;118(24):6118-6125. doi:10.1002/cncr.27649
21. Kim JH, Kim JH, Choi JH, et al. Value of the model for end-stage liver disease for predicting survival in hepatocellular carcinoma patients treated with transarterial chemoembolization. Scand J Gastroenterol. 2009;44(3):346-357. doi:10.1080/00365520802530838
22. Vogeler M, Mohr I, Pfeiffenberger J, et al. Applicability of scoring systems predicting outcome of transarterial chemoembolization for hepatocellular carcinoma. J Cancer Res Clin Oncol. 2020;146(4):1033-1050. doi:10.1007/s00432-020-03135-8
23. National Institutes of Health, Surveillance, Epidemiology, and End Results. Cancer stat facts: cancer of the liver and intrahepatic bile duct. Accessed July 15, 2021. https://seer.cancer.gov/statfacts/html/livibd.html
24. Singal AK, Kamath PS. Model for End-stage Liver Disease. J Clin Exp Hepatol. 2013;3(1):50-60. doi:10.1016/j.jceh.2012.11.002
Hepatocellular cancer (HCC) is the most common type of hepatic cancers, accounting for 65% of all hepatic cancers.1 Among all cancers, HCC is one of the fastest growing causes of death in the United States, and the rate of new HCC cases are on the rise over several decades.2 There are many risk factors leading to HCC, including alcohol use, obesity, and smoking. Infection with hepatitis C virus (HCV) poses a significant risk.1
The pathogenesis of HCV-induced carcinogenesis is mediated by a unique host-induced immunologic response. Viral replication induces production of inflammatory factors, such as tumor necrosis factor (TNF-α), interferon (IFN), and oxidative stress on hepatocytes, resulting in cell injury, death, and regeneration. Repetitive cycles of cellular death and regeneration induce fibrosis, which may lead to cirrhosis.3 Hence, early treatment of HCV infection and achieving sustained virologic response (SVR) may lead to decreased incidence and mortality associated with HCC.
Treatment of HCV infection has become more effective with the development of direct-acting antivirals (DAAs) leading to SVR in > 90% of patients compared with 40 to 50% with IFN-based treatment.4,5 DAAs have been proved safe and highly effective in eradicating HCV infection even in patients with advanced liver disease with decompensated cirrhosis.6 Although achieving SVR indicates a complete cure from chronic HCV infection, several studies have shown subsequent risk of developing HCC persists even after successful HCV treatment.7-9 Some studies show that using DAAs to achieve SVR in patients with HCV infection leads to a decreased relative risk of HCC development compared with patients who do not receive treatment.10-12 But data on HCC risk following DAA-induced SVR vs IFN-induced SVR are somewhat conflicting.
Much of the information regarding the association between SVR and HCC has been gleaned from large data banks without accounting for individual patient characteristics that can be obtained through full chart review. Due to small sample sizes in many chart review studies, the impact that SVR from DAA therapy has on the progression and severity of HCC is not entirely clear. The aim of our study is to evaluate the effect of HCV treatment and SVR status on overall survival (OS) in patients with HCC. Second, we aim to compare survival benefits, if any exist, among the 2 major HCV treatment modalities (IFN vs DAA).
Methods
We performed a retrospective review of patients at Memphis Veterans Affairs Medical Center (VAMC) in Tennessee to determine whether treatment for HCV infection in general, and achieving SVR in particular, makes a difference in progression, recurrence, or OS among patients with HCV infection who develop HCC. We identified 111 patients with a diagnosis of both HCV and new or recurrent HCC lesions from November 2008 to March 2019 (Table 1). We divided these patients based on their HCV treatment status, SVR status, and treatment types (IFN vs DAA).
The inclusion criteria were patients aged > 18 years treated at the Memphis VAMC who have HCV infection and developed HCC. Exclusion criteria were patients who developed HCC from other causes such as alcoholic steatohepatitis, hepatitis B virus infection, hemochromatosis, patients without HCV infection, and patients who were not established at the Memphis VAMC. This protocol was approved by the Memphis VAMC Institutional Review Board.
HCC diagnosis was determined using International Classification of Diseases codes (9th revision: 155 and 155.2; 10th revision: CD 22 and 22.9). We also used records of multidisciplinary gastrointestinal malignancy tumor conferences to identify patient who had been diagnosed and treated for HCV infection. We identified patients who were treated with DAA vs IFN as well as patients who had achieved SVR (classified as having negative HCV RNA tests at the end of DAA treatment). We were unable to evaluate Barcelona Clinic Liver Cancer staging since this required documented performance status that was not available in many patient records. We selected cases consistent with both treatment for HCV infection and subsequent development of HCC. Patient data included age; OS time; HIV status HCV genotype; time and status of progression to HCC; type and duration of treatment; and alcohol, tobacco, and drug use. Disease status was measured using the Model for End-Stage Liver Disease (MELD) score (Table 2), Milan criteria (Table 3), and Child-Pugh score (Table 4).
Statistical Analysis
OS was measured from the date of HCC diagnosis to the date of death or last follow-up. Progression-free survival (PFS) was defined from the date of HCC treatment initiation to the date of first HCC recurrence. We compared survival data for the SVR and non-SVR subgroups, the HCV treatment vs non-HCV treatment subgroups, and the IFN therapy vs DAA therapy subgroups, using the Kaplan-Meier method. The differences between subgroups were assessed using a log-rank test. Multivariate analysis using Cox proportional hazards regression model was used to identify factors that had significant impact on OS. Those factors included age; race; alcohol, tobacco, and illicit drug use; SVR status; HCV treatment status; IFN-based regimen vs DAA; MELD, and Child-Pugh scores. The results were expressed as hazard ratios (HRs) and 95% CI. Calculations were made using Statistical Analysis SAS and IBM SPSS software.
Results
The study included 111 patients. The mean age was 65.7 years; all were male and half of were Black patients. The gender imbalance was due to the predominantly male patient population at Memphis VAMC. Among 111 patients with HCV infection and HCC, 68 patients were treated for HCV infection and had significantly improved OS and PFS compared with the nontreatment group. The median 5-year OS was 44.6 months (95% CI, 966-3202) in the treated HCV infection group compared with 15.1 months in the untreated HCV infection group with a Wilcoxon P = .0005 (Figure 1). Similarly, patients treated for HCV infection had a significantly better 5-year PFS of 15.3 months (95% CI, 294-726) compared with the nontreatment group 9.5 months (95% CI, 205-405) with a Wilcoxon P = .04 (Figure 2).
Among 68 patients treated for HCV infection, 51 achieved SVR, and 34 achieved SVR after the diagnosis of HCC. Patients who achieved SVR had an improved 5-year OS when compared with patients who did not achieve SVR (median 65.8 months [95% CI, 1222-NA] vs 15.7 months [95% CI, 242-853], Wilcoxon P < .001) (Figure 3). Similarly, patients with SVR had improved 5-year PFS when compared with the non-SVR group (median 20.5 months [95% CI, 431-914] vs 8.9 months [95% CI, 191-340], Wilcoxon P = .007 (Figure 4). Achievement of SVR after HCC diagnosis suggests a significantly improved OS (HR 0.37) compared with achievement prior to HCC diagnosis (HR, 0.65; 95% CI, 0.23-1.82, P = .41)
Multivariate Cox regression was used to determine factors with significant survival impact. Advanced age at diagnosis (aged ≥ 65 years) (HR, 0.53; 95% CI, 0.320-0.880; P = .01), SVR status (HR, 0.33; 95% CI, 0.190-0.587; P < .001), achieving SVR after HCC diagnosis (HR, 0.37; 95% CI, 0.20-0.71; P = .002), low MELD score (< 10) (HR, 0.49; 95% CI, 0.30-0.80; P = .004) and low Child-Pugh score (class A) (HR, 0.39; 95% CI, 0.24-0.64; P = .001) have a significant positive impact on OS. Survival was not significantly influenced by race, tobacco, drug use, HIV or cirrhosis status, or HCV treatment type. In addition, higher Child-Pugh class (B or C), higher MELD score (> 10), and younger age at diagnosis (< 65 years) have a negative impact on survival outcome (Table 5).
Discussion
The survival benefit of HCV eradication and achieving SVR status has been well established in patients with HCC.13 In a retrospective cohort study of 250 patients with HCV infection who had received curative treatment for HCC, multivariate analysis demonstrated that achieving SVR is an independent predictor of OS.14 The 3-year and 5-year OS rates were 97% and 94% for the SVR group, and 91% and 60% for the non‐SVR group, respectively (P < .001). Similarly, according to Sou and colleagues, of 122 patients with HCV-related HCC, patients with SVR had longer OS than patients with no SVR (P = .04).15 One of the hypotheses that could explain the survival benefit in patients who achieved SVR is the effect of achieving SVR in reducing persistent liver inflammation and associated liver mortality, and therefore lowering risks of complication in patients with HCC.16 In our study, multivariate analysis shows that achieving SVR is associated with significant improved OS (HR, 0.33). In contrast, patients with HCC who have not achieved SVR are associated with worse survival (HR, 3.24). This finding supports early treatment of HCV to obtain SVR in HCV-related patients with HCC, even after development of HCC.
Among 68 patients treated for HCV infection, 45 patients were treated after HCC diagnosis, and 34 patients achieved SVR after HCC diagnosis. The average time between HCV infection treatment after HCC diagnosis was 6 months. Our data suggested that achievement of SVR after HCC diagnosis suggests an improved OS (HR, 0.37) compared with achievement prior to HCC diagnosis (HR, 0.65; 95% CI,0.23-1.82; P = .41). This lack of statistical significance is likely due to small sample size of patients achieving SVR prior to HCC diagnosis. Our results are consistent with the findings regarding the efficacy and timing of DAA treatment in patients with active HCC. According to Singal and colleagues, achieving SVR after DAA therapy may result in improved liver function and facilitate additional HCC-directed therapy, which potentially improves survival.17-19
Nagaoki and colleagues found that there was no significant difference in OS in patients with HCC between the DAA and IFN groups. According to the study, the 3-year and 5-year OS rates were 96% and 96% for DAA patients and 93% and 73% for IFN patients, respectively (P = .16).14 This finding is consistent with the results of our study. HCV treatment type (IFN vs DAA) was not found to be associated with either OS or PFS time, regardless of time period.
A higher MELD score (> 10) and a higher Child-Pugh class (B or C) score are associated with worse survival outcome regardless of SVR status. While patients with a low MELD score (≤ 10) have a better survival rate (HR 0.49), a higher MELD score has a significantly higher HR and therefore worse survival outcomes (HR, 2.20). Similarly, patients with Child-Pugh A (HR, 0.39) have a better survival outcome compared with those patients with Child-Pugh class B or C (HR, 2.57). This finding is consistent with results of multiple studies indicating that advanced liver disease, as measured by a high MELD score and Child-Pugh class score, can be used to predict the survival outcome in patients with HCV-related HCC.20-22
Unlike other studies that look at a single prognostic variable, our study evaluated prognostic impacts of multiple variables (age, SVR status, the order of SVR in relation to HCC development, HCV treatment type, MELD score and Child-Pugh class) in patients with HCC. The study included patients treated for HCV after development of HCC along with other multiple variables leading to OS benefit. It is one of the only studies in the United States that compared 5-year OS and PFS among patients with HCC treated for HCV and achieved SVR. The studies by Nagaoki and colleagues and Sou and colleagues were conducted in Japan, and some of their subset analyses were univariate. Among our study population of veterans, 50% were African American patients, suggesting that they may have similar OS benefit when compared to White patients with HCC and HCV treatment.
Limitations
Our findings were limited in that our study population is too small to conduct further subset analysis that would allow statistical significance of those subsets, such as the suggested benefit of SVR in patients who presented with HCC after antiviral therapy. Another limitation is the all-male population, likely a result of the older veteran population at the Memphis VAMC. The mean age at diagnosis was 65 years, which is slightly higher than the general population. Compared to the SEER database, HCC is most frequently diagnosed among people aged 55 to 64 years.23 The age difference was likely due to our aging veteran population.
Further studies are needed to determine the significance of SVR on HCC recurrence and treatment. Immunotherapy is now first-line treatment for patients with local advanced HCC. All the immunotherapy studies excluded patients with active HCV infection. Hence, we need more data on HCV treatment timing among patients scheduled to start treatment with immunotherapy.
Conclusions
In a population of older veterans, treatment of HCV infection leads to OS benefit among patients with HCC. In addition, patients with HCV infection who achieve SVR have an OS benefit over patients unable to achieve SVR. The type of treatment, DAA vs IFN-based regimen, did not show significant survival benefit.
1. Ghouri YA, Mian I, Rowe JH. Review of hepatocellular carcinoma: epidemiology, etiology, and carcinogenesis. J Carcinog. 2017;16:1. Published 2017 May 29. doi:10.4103/jcar.JCar_9_16
2. Bray F, Ferlay J, Soerjomataram I, Siegel RL, Torre LA, Jemal A. Global cancer statistics 2018: GLOBOCAN estimates of incidence and mortality worldwide for 36 cancers in 185 countries. CA Cancer J Clin. 2018;68(6):394-424. doi:10.3322/caac.21492
3. Farazi PA, DePinho RA. Hepatocellular carcinoma pathogenesis: from genes to environment. Nat Rev Cancer. 2006;6(9):674-687. doi:10.1038/nrc1934
4. Falade-Nwulia O, Suarez-Cuervo C, Nelson DR, Fried MW, Segal JB, Sulkowski MS. Oral direct-acting agent therapy for hepatitis c virus infection: a systematic review. Ann Intern Med. 2017;166(9):637-648. doi:10.7326/M16-2575
5. Kouris G, Hydery T, Greenwood BC, et al. Effectiveness of Ledipasvir/Sofosbuvir and predictors of treatment failure in members with hepatitis C genotype 1 infection: a retrospective cohort study in a medicaid population. J Manag Care Spec Pharm. 2018;24(7):591-597. doi:10.18553/jmcp.2018.24.7.591
6. Jacobson IM, Lawitz E, Kwo PY, et al. Safety and efficacy of elbasvir/grazoprevir in patients with hepatitis c virus infection and compensated cirrhosis: an integrated analysis. Gastroenterology. 2017;152(6):1372-1382.e2. doi:10.1053/j.gastro.2017.01.050
7. Nahon P, Layese R, Bourcier V, et al. Incidence of hepatocellular carcinoma after direct antiviral therapy for HCV in patients with cirrhosis included in surveillance programs. Gastroenterology. 2018;155(5):1436-1450.e6. doi:10.1053/j.gastro.2018.07.01510.
8. Innes H, Barclay ST, Hayes PC, et al. The risk of hepatocellular carcinoma in cirrhotic patients with hepatitis C and sustained viral response: role of the treatment regimen. J Hepatol. 2018;68(4):646-654. doi:10.1016/j.jhep.2017.10.033
9. Romano A, Angeli P, Piovesan S, et al. Newly diagnosed hepatocellular carcinoma in patients with advanced hepatitis C treated with DAAs: a prospective population study. J Hepatol. 2018;69(2):345-352. doi:10.1016/j.jhep.2018.03.009
10. Kanwal F, Kramer J, Asch SM, Chayanupatkul M, Cao Y, El-Serag HB. Risk of hepatocellular cancer in HCV patients treated with direct-acting antiviral agents. Gastroenterology. 2017;153(4):996-1005.e1. doi:10.1053/j.gastro.2017.06.0122
11. Singh S, Nautiyal A, Loke YK. Oral direct-acting antivirals and the incidence or recurrence of hepatocellular carcinoma: a systematic review and meta-analysis. Frontline Gastroenterol. 2018;9(4):262-270. doi:10.1136/flgastro-2018-101017
12. Kuftinec G, Loehfelm T, Corwin M, et al. De novo hepatocellular carcinoma occurrence in hepatitis C cirrhotics treated with direct-acting antiviral agents. Hepat Oncol. 2018;5(1):HEP06. Published 2018 Jul 25. doi:10.2217/hep-2018-00033
13. Morgan RL, Baack B, Smith BD, Yartel A, Pitasi M, Falck-Ytter Y. Eradication of hepatitis C virus infection and the development of hepatocellular carcinoma: a meta-analysis of observational studies. Ann Intern Med. 2013;158(5 Pt 1):329-337. doi:10.7326/0003-4819-158-5-201303050-00005
14. Nagaoki Y, Imamura M, Nishida Y, et al. The impact of interferon-free direct-acting antivirals on clinical outcome after curative treatment for hepatitis C virus-associated hepatocellular carcinoma: comparison with interferon-based therapy. J Med Virol. 2019;91(4):650-658. doi:10.1002/jmv.25352
15. Sou FM, Wu CK, Chang KC, et al. Clinical characteristics and prognosis of HCC occurrence after antiviral therapy for HCV patients between sustained and non-sustained responders. J Formos Med Assoc. 2019;118(1 Pt 3):504-513. doi:10.1016/j.jfma.2018.10.017
16. Roche B, Coilly A, Duclos-Vallee JC, Samuel D. The impact of treatment of hepatitis C with DAAs on the occurrence of HCC. Liver Int. 2018;38(suppl 1):139-145. doi:10.1111/liv.13659
17. Singal AG, Lim JK, Kanwal F. AGA clinical practice update on interaction between oral direct-acting antivirals for chronic hepatitis C infection and hepatocellular carcinoma: expert review. Gastroenterology. 2019;156(8):2149-2157. doi:10.1053/j.gastro.2019.02.046
18. Toyoda H, Kumada T, Hayashi K, et al. Characteristics and prognosis of hepatocellular carcinoma detected in sustained responders to interferon therapy for chronic hepatitis C. Cancer Detect Prev. 2003;27(6):498-502. doi:10.1016/j.cdp.2003.09.00719. Okamura Y, Sugiura T, Ito T, et al. The achievement of a sustained virological response either before or after hepatectomy improves the prognosis of patients with primary hepatitis C virus-related hepatocellular carcinoma. Ann Surg Oncol. 2019; 26(13):4566-4575. doi:10.1245/s10434-019-07911-w
20. Wray CJ, Harvin JA, Silberfein EJ, Ko TC, Kao LS. Pilot prognostic model of extremely poor survival among high-risk hepatocellular carcinoma patients. Cancer. 2012;118(24):6118-6125. doi:10.1002/cncr.27649
21. Kim JH, Kim JH, Choi JH, et al. Value of the model for end-stage liver disease for predicting survival in hepatocellular carcinoma patients treated with transarterial chemoembolization. Scand J Gastroenterol. 2009;44(3):346-357. doi:10.1080/00365520802530838
22. Vogeler M, Mohr I, Pfeiffenberger J, et al. Applicability of scoring systems predicting outcome of transarterial chemoembolization for hepatocellular carcinoma. J Cancer Res Clin Oncol. 2020;146(4):1033-1050. doi:10.1007/s00432-020-03135-8
23. National Institutes of Health, Surveillance, Epidemiology, and End Results. Cancer stat facts: cancer of the liver and intrahepatic bile duct. Accessed July 15, 2021. https://seer.cancer.gov/statfacts/html/livibd.html
24. Singal AK, Kamath PS. Model for End-stage Liver Disease. J Clin Exp Hepatol. 2013;3(1):50-60. doi:10.1016/j.jceh.2012.11.002
Although inconclusive, CV safety study of cancer therapy attracts attention
The first global trial to compare the cardiovascular (CV) safety of two therapies for prostate cancer proved inconclusive because of inadequate enrollment and events, but the study is a harbinger of growth in the emerging specialty of cardio-oncology, according to experts.

“Many new cancer agents have extended patient survival, yet some of these agents have significant potential cardiovascular toxicity,” said Renato D. Lopes, MD, in presenting a study at the annual congress of the European Society of Cardiology.
In the context of improving survival in patients with or at risk for both cancer and cardiovascular disease, he suggested that the prostate cancer study he led could be “a model for interdisciplinary collaboration” needed to address the relative and sometimes competing risks of these disease states.
This point was seconded by several pioneers in cardio-oncology who participated in the discussion of the results of the trial, called PRONOUNCE.
“We know many drugs in oncology increase cardiovascular risk, so these are the types of trials we need,” according Thomas M. Suter, MD, who leads the cardio-oncology service at the University Hospital, Berne, Switzerland. He was the ESC-invited discussant for PRONOUNCE.
More than 100 centers in 12 countries involved
In PRONOUNCE, 545 patients with prostate cancer and established atherosclerotic cardiovascular disease were randomized to degarelix, a gonadotropin-releasing hormone antagonist, or leuprolide, a GnRH agonist. The patients were enrolled at 113 participating centers in 12 countries. All of the patients had an indication for an androgen-deprivation therapy (ADT).

In numerous previous studies, “ADT has been associated with higher CV morbidity and mortality, particularly in men with preexisting CV disease,” explained Dr. Lopes, but the relative cardiovascular safety of GnRH agonists relative to GnRH antagonists has been “controversial.”
The PRONOUNCE study was designed to resolve this issue, but the study was terminated early because of slow enrollment (not related to the COVID-19 pandemic). The planned enrollment was 900 patients.
In addition, the rate of major adverse cardiovascular events (MACE), defined as myocardial infarction, stroke, or death, was lower over the course of follow-up than anticipated in the study design.
No significant difference on primary endpoint
At the end of 12 months, MACE occurred in 11 (4.1%) of patients randomized to leuprolide and 15 (5.5%) of those randomized to degarelix. The greater hazard ratio for MACE in the degarelix group did not approach statistical significance (hazard ratio, 1.28; P = .53).
As a result, the question of the relative CV safety of these drugs “remains unresolved,” according to Dr. Lopes, professor of medicine at Duke University Medical Center, Durham, N.C.
This does not diminish the need to answer this question. In the addition to the fact that cancer is a malignancy primarily of advancing age when CV disease is prevalent – the mean age in this study was 73 years and 44% were over age 75 – it is often an indolent disease with long periods of survival, according to Dr. Lopes. About half of prostate cancer patients have concomitant CV disease, and about half will receive ADT at some point in their treatment.
In patients receiving ADT, leuprolide is far more commonly used than GnRH antagonists, which are offered in only about 4% of patients, according to data cited by Dr. Lopes. The underlying hypothesis of this study was that leuprolide is associated with greater CV risk, which might have been relevant to a risk-benefit calculation, if the hypothesis had been confirmed.
Cancer drugs can increase CV risk
Based on experimental data, “there is concern the leuprolide is involved in plaque destabilization,” said Dr. Lopes, but he noted that ADTs in general are associated with adverse metabolic changes, including increases in LDL cholesterol, insulin resistance, and body fat, all of which could be relevant to CV risk.
It is the improving rates of survival for prostate cancer as well for other types of cancer that have increased attention to the potential for cancer drugs to increase CV risk, another major cause of early mortality. For these competing risks, objective data are needed to evaluate a relative risk-to-benefit ratio for treatment choices.
This dilemma led the ESC to recently establish its Council on Cardio-Oncology, and many centers around the world are also creating interdisciplinary groups to guide treatment choices for patients with both diseases.
“You will certainly get a lot of referrals,” said Rudolf de Boer, MD, professor of translational cardiology, University Medical Center, Groningen, Netherlands. Basing his remark on his own experience starting a cardio-oncology clinic at his institution, he called this work challenging and agreed that the need for objective data is urgent.
“We need data to provide common ground on which to judge relative risks,” Dr. de Boer said. He also praised the PRONOUNCE investigators for their efforts even if the data failed to answer the question posed.
The PRONOUNCE results were published online in Circulation at the time of Dr. Lopes’s presentation.
The study received funding from Ferring Pharmaceuticals. Dr. Lopes reports financial relationships with Bristol-Myers Squibb, GlaxoSmithKline, Medtronic, Pfizer, and Sanofi. Dr. Suter reports financial relationships with Boehringer Ingelheim, GlaxoSmithKline, and Roche. Dr. de Boer reports financial relationships with AstraZeneca, Abbott, Bristol-Myers Squibb, Novartis, Novo Nordisk, and Roche.
The first global trial to compare the cardiovascular (CV) safety of two therapies for prostate cancer proved inconclusive because of inadequate enrollment and events, but the study is a harbinger of growth in the emerging specialty of cardio-oncology, according to experts.
“Many new cancer agents have extended patient survival, yet some of these agents have significant potential cardiovascular toxicity,” said Renato D. Lopes, MD, in presenting a study at the annual congress of the European Society of Cardiology.
In the context of improving survival in patients with or at risk for both cancer and cardiovascular disease, he suggested that the prostate cancer study he led could be “a model for interdisciplinary collaboration” needed to address the relative and sometimes competing risks of these disease states.
This point was seconded by several pioneers in cardio-oncology who participated in the discussion of the results of the trial, called PRONOUNCE.
“We know many drugs in oncology increase cardiovascular risk, so these are the types of trials we need,” according Thomas M. Suter, MD, who leads the cardio-oncology service at the University Hospital, Berne, Switzerland. He was the ESC-invited discussant for PRONOUNCE.
More than 100 centers in 12 countries involved
In PRONOUNCE, 545 patients with prostate cancer and established atherosclerotic cardiovascular disease were randomized to degarelix, a gonadotropin-releasing hormone antagonist, or leuprolide, a GnRH agonist. The patients were enrolled at 113 participating centers in 12 countries. All of the patients had an indication for an androgen-deprivation therapy (ADT).
In numerous previous studies, “ADT has been associated with higher CV morbidity and mortality, particularly in men with preexisting CV disease,” explained Dr. Lopes, but the relative cardiovascular safety of GnRH agonists relative to GnRH antagonists has been “controversial.”
The PRONOUNCE study was designed to resolve this issue, but the study was terminated early because of slow enrollment (not related to the COVID-19 pandemic). The planned enrollment was 900 patients.
In addition, the rate of major adverse cardiovascular events (MACE), defined as myocardial infarction, stroke, or death, was lower over the course of follow-up than anticipated in the study design.
No significant difference on primary endpoint
At the end of 12 months, MACE occurred in 11 (4.1%) of patients randomized to leuprolide and 15 (5.5%) of those randomized to degarelix. The greater hazard ratio for MACE in the degarelix group did not approach statistical significance (hazard ratio, 1.28; P = .53).
As a result, the question of the relative CV safety of these drugs “remains unresolved,” according to Dr. Lopes, professor of medicine at Duke University Medical Center, Durham, N.C.
This does not diminish the need to answer this question. In the addition to the fact that cancer is a malignancy primarily of advancing age when CV disease is prevalent – the mean age in this study was 73 years and 44% were over age 75 – it is often an indolent disease with long periods of survival, according to Dr. Lopes. About half of prostate cancer patients have concomitant CV disease, and about half will receive ADT at some point in their treatment.
In patients receiving ADT, leuprolide is far more commonly used than GnRH antagonists, which are offered in only about 4% of patients, according to data cited by Dr. Lopes. The underlying hypothesis of this study was that leuprolide is associated with greater CV risk, which might have been relevant to a risk-benefit calculation, if the hypothesis had been confirmed.
Cancer drugs can increase CV risk
Based on experimental data, “there is concern the leuprolide is involved in plaque destabilization,” said Dr. Lopes, but he noted that ADTs in general are associated with adverse metabolic changes, including increases in LDL cholesterol, insulin resistance, and body fat, all of which could be relevant to CV risk.
It is the improving rates of survival for prostate cancer as well for other types of cancer that have increased attention to the potential for cancer drugs to increase CV risk, another major cause of early mortality. For these competing risks, objective data are needed to evaluate a relative risk-to-benefit ratio for treatment choices.
This dilemma led the ESC to recently establish its Council on Cardio-Oncology, and many centers around the world are also creating interdisciplinary groups to guide treatment choices for patients with both diseases.
“You will certainly get a lot of referrals,” said Rudolf de Boer, MD, professor of translational cardiology, University Medical Center, Groningen, Netherlands. Basing his remark on his own experience starting a cardio-oncology clinic at his institution, he called this work challenging and agreed that the need for objective data is urgent.
“We need data to provide common ground on which to judge relative risks,” Dr. de Boer said. He also praised the PRONOUNCE investigators for their efforts even if the data failed to answer the question posed.
The PRONOUNCE results were published online in Circulation at the time of Dr. Lopes’s presentation.
The study received funding from Ferring Pharmaceuticals. Dr. Lopes reports financial relationships with Bristol-Myers Squibb, GlaxoSmithKline, Medtronic, Pfizer, and Sanofi. Dr. Suter reports financial relationships with Boehringer Ingelheim, GlaxoSmithKline, and Roche. Dr. de Boer reports financial relationships with AstraZeneca, Abbott, Bristol-Myers Squibb, Novartis, Novo Nordisk, and Roche.
FROM ESC 2021
Pandemic-related drops in breast cancer screening hit hardest among medically underserved
Breast cancer screening rates at community health centers (CHCs) in the United States declined during the pandemic, particularly among Black and uninsured individuals, based on a retrospective look at 32 sites.
Still, drops in screening were less dramatic than national declines previously reported, possibly because of the American Cancer Society–directed CHANGE program, which was simultaneously underway at the CHCs involved, reported lead author Stacey A. Fedewa, PhD, senior principal scientist at the ACS in Atlanta, and colleagues.
“This is one of the first studies to examine breast cancer screening rates during the pandemic specifically among clinics providing care to communities of color and lower income populations, a group with lower utilization of and greater barriers to [breast cancer] screening,” the investigators wrote in Cancer. “This is important because these populations have longstanding barriers to accessing care, lower breast screening rates, higher breast cancer mortality rates, and are especially vulnerable to health care disruptions.”
According to a previous analysis of electronic health records by Mast and Munoz del Rio, breast cancer screening rates in the United States dropped 94% in March/April 2020, when the COVID-19 pandemic was declared a national emergency. Although a recent follow-up report showed a rebound in breast cancer screening, the estimated rate remains 13% below average.
The present study evaluated data from 32 out of 1,385 CHCs in the United States. All centers were involved in the ACS-run CHANGE grant program, which funded the clinics for 2 years, during which time they implemented at least three evidence-based provider and client interventions, such as patient navigation or electronic medical record enhancements. The clinics reported breast cancer screening rates on a routine basis throughout the 2-year period, beginning August 2018.
Breast cancer screening rate was defined as the percentage of women aged 50-74 years who had a screening mammogram within the past 27 months, out of a total pool of women who had a medical visit within the past year. For 2018, 2019, and 2020, respectively, 142,207; 142,003; and 150,630 women had a medical visit. Screening rates were compared across years in either June or July. Findings were further characterized by demographic characteristics, urban/rural status, and clinic region.
From 2018 to 2019 breast cancer screening rates rose 18%, from 45.8% to 53.9%. This increase was followed by an 8% decline during the 2019-2020 period, from 53.9% to 49.6%.
The investigators estimated the number of missed mammograms and breast cancer diagnoses for two comparative, hypothetical scenarios: first, if the rising trend from 2018 to 2019 had continued through 2020, and second, if the rate had plateaued at 53.9%.
The rising trend model suggested that 47,517 fewer mammograms than normal were conducted during 2019-2020, resulting in 242 missed breast cancer diagnoses, of which 166 were invasive and 76 were ductal carcinoma in situ. The plateau model suggested that 6,477 fewer mammograms were conducted, leading to 33 missed diagnoses.
Compared with the 8% decline in screening overall, the rate among Black patients dropped 12%, while rates at clinics with a lower proportion of uninsured patients dropped an average of 15%. In contrast, clinics in the South did not have a significant reduction in screening, “possibly reflecting lower baseline rates or impact of stay-at-home orders,” the investigators wrote.
Dr. Fedewa and colleagues also noted that their findings were less dramatic than those reported by Mast and Munoz del Rio. They suggested that the CHANGE program may have softened the blow dealt by the pandemic.
“The CHANGE program–funded interventions – that were established before and continued through 2020 – may have mitigated the pandemic’s effects on breast cancer screening services among the 32 CHCs that were studied,” they wrote. “Further investigation of breast cancer screening rates among additional CHCs will further inform where targeted interventions (e.g., client reminders, education on return to screening) are most needed.”
According to Madeline Sutton, MD, assistant professor of obstetrics and gynecology at Morehouse School of Medicine, Atlanta, “Progress seen with the CHANGE program should be duplicated in other clinical venues based on improvements seen in numbers of mammograms and breast cancers detected.”
Still, Dr. Sutton noted that the racial/ethnic disparities remain cause for concern.
“This study has implications for persons served at CHCs, especially if breast cancer racial/ethnic disparities are unintentionally widened during this pandemic,” Dr. Sutton said in a written comment. “Policy-level changes that decrease BCSR [breast cancer screen rate] gaps for women are warranted.”

Ana Velázquez Mañana, MD, a medical oncology fellow at the University of California, San Francisco, suggested that the effects of the pandemic may have been even more pronounced among medically underserved patients in whom interventions to increase screening were not being conducted, as they were through the CHANGE program.
“One must wonder to what degree these interventions reduced the decline in screening mammography rates observed during the pandemic and to what degree could disparities in screening be magnified in community health centers with less resources,” Dr. Velázquez said in a written comment. “Therefore, understanding barriers to breast cancer screening among our specific health care systems is key to guide resource allocation and the development of evidence-based multilevel interventions that can address these barriers, and ultimately increase screening rates.”
Dr. Velázquez also noted that the study by Dr. Fedewa and colleagues may have missed drops in screening among vulnerable populations that occurred later in the pandemic and in geographic hotspots. In a recent JAMA Network Open study, Dr. Velázquez reported a 41% drop in breast cancer screening at a safety-net hospital in San Francisco during the first stay-at-home order, which lasted from Feb. 1, 2020 to May 31, 2020.
The Breast Health Equity CHANGE grant was funded by the National Football League in partnership with the American Cancer Society. The investigators reported employment by the American Cancer Society. Dr. Wehling and Dr. Wysocki disclosed grants from Pfizer unrelated to this research. Dr. Sutton and Dr. Velázquez disclosed no conflicts of interest.
Breast cancer screening rates at community health centers (CHCs) in the United States declined during the pandemic, particularly among Black and uninsured individuals, based on a retrospective look at 32 sites.
Still, drops in screening were less dramatic than national declines previously reported, possibly because of the American Cancer Society–directed CHANGE program, which was simultaneously underway at the CHCs involved, reported lead author Stacey A. Fedewa, PhD, senior principal scientist at the ACS in Atlanta, and colleagues.
“This is one of the first studies to examine breast cancer screening rates during the pandemic specifically among clinics providing care to communities of color and lower income populations, a group with lower utilization of and greater barriers to [breast cancer] screening,” the investigators wrote in Cancer. “This is important because these populations have longstanding barriers to accessing care, lower breast screening rates, higher breast cancer mortality rates, and are especially vulnerable to health care disruptions.”
According to a previous analysis of electronic health records by Mast and Munoz del Rio, breast cancer screening rates in the United States dropped 94% in March/April 2020, when the COVID-19 pandemic was declared a national emergency. Although a recent follow-up report showed a rebound in breast cancer screening, the estimated rate remains 13% below average.
The present study evaluated data from 32 out of 1,385 CHCs in the United States. All centers were involved in the ACS-run CHANGE grant program, which funded the clinics for 2 years, during which time they implemented at least three evidence-based provider and client interventions, such as patient navigation or electronic medical record enhancements. The clinics reported breast cancer screening rates on a routine basis throughout the 2-year period, beginning August 2018.
Breast cancer screening rate was defined as the percentage of women aged 50-74 years who had a screening mammogram within the past 27 months, out of a total pool of women who had a medical visit within the past year. For 2018, 2019, and 2020, respectively, 142,207; 142,003; and 150,630 women had a medical visit. Screening rates were compared across years in either June or July. Findings were further characterized by demographic characteristics, urban/rural status, and clinic region.
From 2018 to 2019 breast cancer screening rates rose 18%, from 45.8% to 53.9%. This increase was followed by an 8% decline during the 2019-2020 period, from 53.9% to 49.6%.
The investigators estimated the number of missed mammograms and breast cancer diagnoses for two comparative, hypothetical scenarios: first, if the rising trend from 2018 to 2019 had continued through 2020, and second, if the rate had plateaued at 53.9%.
The rising trend model suggested that 47,517 fewer mammograms than normal were conducted during 2019-2020, resulting in 242 missed breast cancer diagnoses, of which 166 were invasive and 76 were ductal carcinoma in situ. The plateau model suggested that 6,477 fewer mammograms were conducted, leading to 33 missed diagnoses.
Compared with the 8% decline in screening overall, the rate among Black patients dropped 12%, while rates at clinics with a lower proportion of uninsured patients dropped an average of 15%. In contrast, clinics in the South did not have a significant reduction in screening, “possibly reflecting lower baseline rates or impact of stay-at-home orders,” the investigators wrote.
Dr. Fedewa and colleagues also noted that their findings were less dramatic than those reported by Mast and Munoz del Rio. They suggested that the CHANGE program may have softened the blow dealt by the pandemic.
“The CHANGE program–funded interventions – that were established before and continued through 2020 – may have mitigated the pandemic’s effects on breast cancer screening services among the 32 CHCs that were studied,” they wrote. “Further investigation of breast cancer screening rates among additional CHCs will further inform where targeted interventions (e.g., client reminders, education on return to screening) are most needed.”
According to Madeline Sutton, MD, assistant professor of obstetrics and gynecology at Morehouse School of Medicine, Atlanta, “Progress seen with the CHANGE program should be duplicated in other clinical venues based on improvements seen in numbers of mammograms and breast cancers detected.”
Still, Dr. Sutton noted that the racial/ethnic disparities remain cause for concern.
“This study has implications for persons served at CHCs, especially if breast cancer racial/ethnic disparities are unintentionally widened during this pandemic,” Dr. Sutton said in a written comment. “Policy-level changes that decrease BCSR [breast cancer screen rate] gaps for women are warranted.”
Ana Velázquez Mañana, MD, a medical oncology fellow at the University of California, San Francisco, suggested that the effects of the pandemic may have been even more pronounced among medically underserved patients in whom interventions to increase screening were not being conducted, as they were through the CHANGE program.
“One must wonder to what degree these interventions reduced the decline in screening mammography rates observed during the pandemic and to what degree could disparities in screening be magnified in community health centers with less resources,” Dr. Velázquez said in a written comment. “Therefore, understanding barriers to breast cancer screening among our specific health care systems is key to guide resource allocation and the development of evidence-based multilevel interventions that can address these barriers, and ultimately increase screening rates.”
Dr. Velázquez also noted that the study by Dr. Fedewa and colleagues may have missed drops in screening among vulnerable populations that occurred later in the pandemic and in geographic hotspots. In a recent JAMA Network Open study, Dr. Velázquez reported a 41% drop in breast cancer screening at a safety-net hospital in San Francisco during the first stay-at-home order, which lasted from Feb. 1, 2020 to May 31, 2020.
The Breast Health Equity CHANGE grant was funded by the National Football League in partnership with the American Cancer Society. The investigators reported employment by the American Cancer Society. Dr. Wehling and Dr. Wysocki disclosed grants from Pfizer unrelated to this research. Dr. Sutton and Dr. Velázquez disclosed no conflicts of interest.
FROM CANCER
FDA warns clinicians to stop using Eco-Med products because of contamination concerns
Earlier this month, the Centers for Disease Control and Prevention and the FDA announced an outbreak of at least 15 Bcc infections associated with contaminated ultrasound gel, and, according to the FDA, Eco-Med ultrasound gels have now been linked to at least 59 infections, 48 of which were blood infections.
On Aug. 4, the Canadian pharmaceutical company, based in Etobicoke, Ont., initiated a voluntary recall of certain lots of EcoGel 200 Ultrasound gel because of contamination with Bcc, but now the FDA warns that all Eco-Med’s ultrasound gels and lotions are at risk.
“The FDA’s determination is based on concerns that the company did not complete its investigation of the issues, the root cause and extent of bacterial contamination was not identified, and multiple products could be affected by manufacturing issues associated with the company’s ultrasound gel (such as inappropriate testing of finished product, inadequate testing of raw materials, and a lack of environmental controls),” the FDA said in a letter to health care providers published Aug. 18.
The letter lists 25 products manufactured by Eco-Med that are sold by distributors in 10 different countries, including the United States and Canada. The list may not be completely comprehensive, the organization notes.
Eco-Med has ceased all operations and is no longer manufacturing or distributing products, according to the FDA statement. Both phone numbers listed for the company were not in operation at the time of reporting.
Beyond stopping use of and discarding Eco-Med products, the FDA recommends that health care providers and facilities stop purchases of Eco-Med products, contact distributors with product disposal questions, and follow professional society guidelines and CDC guidelines for ultrasound use and cleaning products. Providers are encouraged to report adverse events related to Eco-Med ultrasound gels or lotions through MedWatch: The FDA Safety Information and Adverse Event Reporting program.
Though Eco-Med is listed as one of the “prominent players in the ultrasound gel market,” according to a June 2020 report by Grand View Research, the announcement will likely not cause many issues, Lauren Golding, MD, chair of the American College of Radiology Commission on Ultrasound, said in an interview.
“Fortunately, several companies produce ultrasound gel. Barring unforeseen circumstances, we do not expect this FDA action to have a widespread impact on patients’ access to ultrasound exams in the United States,” she said.
A version of this article first appeared on Medscape.com.
Oncologists’ income and net worth rise despite pandemic
Overall, oncologists’ average annual income rose from $377,000 in 2020 to $403,000 this year.
Although many offices closed for periods during 2020, some physicians used the Paycheck Protection Program. Others found other methods to keep their earnings relatively stable, such as switching to telehealth, cutting staff, and renegotiating leases.
The overall net worth of oncologists also increased. This year, 55% reported a net worth of $1.5 million, compared to 42% last year. A contributing factor is the rise in home prices, suggested Joel Greenwald, MD, CFP, a wealth management advisor for physicians.
The rise in the stock market also played a role, he noted. “And I’ve seen clients accumulate cash, which has added to their net worth. They cut back on spending because they were worried about big declines in income and also because there was simply less to spend money on.”
The percentage of oncologists (16%) with a net worth of more than $5 million stayed pretty much the same. Oncology remained in the upper half of the list of wealthy specialties. Topping that list are dermatology (28%), orthopedics and orthopedic surgery (25%), and plastic surgery (24%).
On the flip side, the percentage of oncologists on the lower end of the net worth scale declined from last year. Oncology was the specialty with the lowest percentage of practitioners (16%) reporting a net worth of under $500,000.
Expenses and debts
Similar to reports from previous years, this latest survey found that more than half of oncologists (56%) said they are paying off a mortgage on a primary residence. About a third (32%) are paying off a car loan. Credit card debt (19%), college or medical school loans (17%), childcare (14%), and medical expenses for themselves or a loved one (12%) were also reported.
When it comes to paying off school loans, oncology was near the bottom of the list of 29 medical specialties, along with nephrology, gastroenterology, and diabetes and endocrinology. Emergency medicine topped that list, followed by family medicine, pediatrics, physical medicine, and rehabilitation (all 31%).
Although the vast majority of oncologists (94%) were able to keep up with their bills, the pandemic did take a toll on some. Six percent said that they were unable to keep up with their bills, and 3% could not meet their mortgage. This is far superior to the American population at large – a quarter of adults missed a mortgage payment or rent payment because of challenges associated with the pandemic.
Saving and losses
Most oncologists did not take any extra steps to curtail spending – 77% reported that they had not done anything to reduce major expenses. About a quarter of respondents took significant steps to lower their expenses, such as deferring or refinancing loans (11%), switching to a different type of car (6%), or moving to a different home (5%).
Savings for tax deferred accounts this year was a mixed bag. More than half (56%) of oncologists said that they put aside the same amount every month, give or take; 11% do not regularly put money into a 401(k) retirement account or tax-deferred savings account. Compared to last year, 32% put less money into their savings accounts. Having fewer patients or working fewer hours during the pandemic may have resulted in oncologists needing more of their income, or even their full income, to pay their bills.
Similar results were seen with taxable savings. Half of oncologists were putting the same amount into bank accounts; 20% reported that they do not regularly put money into this type of account. Compared to last year, 29% put less money into taxable savings.
Most oncologists (75%) reported that they did not experience any significant financial losses during the past year. This was similar to last year (77%). The percentage of those who had losses related to their practice rose from 3% to 8%. Much of this increase was due to COVID-19.
Living within their means
The vast majority of oncologists live within or below their means (94%). “There are certainly folks who believe that as long as they pay their credit card every month and contribute to their 401(k) enough to get their employer match, they’re doing okay,” said Dr. Greenwald. “I would say living within one’s means is having a 3 to 6 months’ emergency fund and saving at least 20% of gross income toward retirement.”
Although most oncologists live within their means, they also have a higher than average number of credit cards. More than half (54%) have at least five; the average American has four. Nineteen percent of oncologists reported having seven or more credit cards, and none said they had no credit cards.
Mortgage payments varied considerably among respondents, from less than $100,000 (16%) to more than half a million (21%). More than a third (37%) reported having no mortgage at all. According to the Mortgage Bankers Association, the overall average size of a home mortgage loan was $344,556 in March 2020.
For household finances, 57% reported that they pool incomes to pay the bills, regardless of how much each person earns. A quarter said that they do not have joint finances with a spouse or partner, and for 13%, the person with the higher income paid a larger share.
A version of this article first appeared on Medscape.com.
Better to binge drink than regularly tipple, suggests GI cancer study
When weekly levels are similar
Alcohol use is a known risk factor for gastrointestinal (GI) cancers. Now, new research indicates that this risk is more associated with frequent drinking – even in smaller amounts – compared with higher amounts or binge drinking, given similar weekly levels.
“The novel finding of the current study is that frequent drinking may be more dangerous than binge drinking with regard to GI cancers. Alcohol use is a known risk factor for gastrointestinal (GI) cancers. Now, new research indicates that this risk is more associated with frequent drinking – even in smaller amounts -- compared with higher amounts or binge drinking, given similar weekly levels.” first author Jung Eun Yook, MD, of Seoul (South Korea) National University Hospital, and colleagues reported in an article published Aug. 18, 2021, in JAMA Network Open (doi: 10.1001/jamanetworkopen.2021.20382).
“This finding suggests that repeated alcohol consumption events even at lower amounts of alcohol may have a greater carcinogenic effect on GI organs than the consumption of larger amounts of alcohol at a lower frequency,” the investigators wrote.
A possible reason behind the difference in risk may be that the chronic “carcinogenic insult” from regular alcohol use may promote cancer development, whereas less frequent, episodic alcohol exposures may allow physiologic recovery, said the authors.
The results are from a population-based study that involved 11,737,467 participants in the Korean National Health System database who did not have cancer and who took part in a national screening program between January 2009 and December 2010.
They were followed from the year after their screening until either they had received a diagnosis of a GI cancer, death occurred, or the end of December 2017.
During a median follow-up of 6.4 years, 319,202 (2.7%) of those in the study developed a GI cancer.
The increase in the risk associated with alcohol consumption was dose dependent.
Compared with those who did not consume alcohol, the risk of developing GI cancer was higher for mild drinkers (adjusted hazard ratio, 1.04; 95% confidence interval, 1.03-1.05), moderate drinkers (aHR, 1.14; 95% CI, 1.12-1.15), and heavy drinkers (aHR, 1.28; 95% CI, 1.26-1.29), after adjusting for age, sex, income, smoking status with intensity, regular exercise, body mass index, diabetes, hypertension, and dyslipidemia.
There was a linear association between the frequency of drinking and GI cancer risk, with an aHR of 1.39 for individuals who reported drinking every day (95% CI, 1.36-1.41). The risk for GI cancer increased with consumption of five to seven units per occasion (aHR, 1.15). Notably, there were no similar increases with higher intake, including intake of 8-14 units per occasion (aHR, 1.11; 95% CI, 1.09-1.12), and even up to more than 14 units per occasion (aHR, 1.11; 95%CI, 1.08-1.14), in comparison with an intake of 5-7 units per occasion.
“Given similar weekly alcohol consumption levels, the risk of GI cancer increased with a higher frequency of drinking and decreased with a higher amount per occasion,” the authors write.
“Most previous studies just assess alcohol consumption as a total amount, [such as] drinks per occasion times occasion per week equals drinks per week [and] grams per week,” coauthor Dong Wook Shin, MD, DrPH, Samsung Medical Center, Sungkyunkwan University, Seoul, South Korea, said in an interview.
“But it was not known whether frequent drinking with small amount is more harmful than binge drinking, given a similar level of total drinking,” Dr. Shin said.
The increased risk associated with frequent drinking was generally similar with respect to esophageal, gastric, colorectal, biliary, and pancreatic cancer.
An exception was liver cancer, which showed a slightly decreased risk among mild drinkers (aHR, 0.91; 95% CI, 0.89-0.93).
Of note, the association between alcohol intake and the incidence of GI cancer was lower among women than men in terms of weekly consumption, frequency, and amount of alcohol consumed per occasion.
The associations between drinking and cancer type in terms of esophageal and liver cancers were similar between men and women. However, the alcohol-related risk for colorectal, biliary, and pancreatic cancers was less prominent for women.
Possible mechanisms related to regular drinking
A factor that might account for the increase in GI cancer risk with frequent drinking is that regular alcohol consumption “promotes the accumulation of cell divisions in the stem cells that maintain tissues in homeostasis,” the authors explained.
Another possible explanation is that long-term alcohol exposure may promote carcinogenesis, whereas less frequent exposure might allow “physiological homeostasis,” the authors wrote, adding that in vivo experiments have shown that duration and dose of alcohol exposure have been linked to cancer development.
Importantly, the findings support the importance of reducing the frequency of alcohol use to prevent cancer, the authors noted.
“Alcohol users who have a glass of wine or beer during dinner every day may develop more cancer than people who occasionally consume several drinks,” they cautioned.
Genetics, self-reporting considerations
In a related commentary, John D. Potter, MBBS, PhD, of the Research Center for Hauora and Health, Massey University, Wellington, New Zealand, noted that, in addition to supporting the known link between alcohol and cancers of the esophagus, colorectum, and liver, the study “strengthens evidence for a role of alcohol in stomach, biliary tract, and pancreas cancers.”
In comparison with nondrinkers, those who reported heavy drinking were much more likely to be smokers (51.6% vs. 9.0%); however, the study adjusted for smoking.
“Because the researchers were able to control for tobacco, this last finding [regarding the association with cancers of the stomach, biliary tract, and pancreas] is particularly informative,” Dr. Potter noted.
An important caveat is that more than a quarter of the Korean population is known to have an inactive form of the aldehyde dehydrogenase gene (ALDH2), which could have effects on alcohol metabolism as well as the risk for cancer, Dr. Potter wrote.
“This common polymorphism in ALDH2 (ALDH2 rs671 [c.1510G>A (Glu504Lys)]) has paradoxical effects,” he wrote.
“It increases the level of acetaldehyde in the blood of drinkers, which in turn increases the risk of cancer because acetaldehyde is a key player in the carcinogenicity of alcoholic beverages,” Dr. Potter explained. “On the other hand, the accumulation of acetaldehyde and the resultant flushing response are sufficiently unpleasant that they tend to reduce alcohol consumption among those with the Lys allele.”
The study results may therefore not be generalizable to a population in which the distribution of the variation in the ALDH2 enzyme differs, Dr. Potter added.
The lower prevalence of the inactive form (in North America, for instance) would mean that this lower prevalence was not a constraint on individuals’ drinking behavior as it is for some in Korea, Dr. Potter explained.
He noted another consideration: the underreporting of alcohol use is a well-known limitation of studies involving the assessment of alcohol consumption.
Dr. Shin agreed that underreporting is a limitation.
“People tend to underestimate their alcohol use,” Dr. Shin said in an interview.
However, he noted that “our study participants are health-screening participants aged 40 years and older, [and] people who participate in health screening tend to have higher awareness and better health behavior than nonparticipants.”
The authors and Dr. Potter disclosed no relevant financial relationships.
A version of this article first appeared on Medscape.com.
When weekly levels are similar
When weekly levels are similar
Alcohol use is a known risk factor for gastrointestinal (GI) cancers. Now, new research indicates that this risk is more associated with frequent drinking – even in smaller amounts – compared with higher amounts or binge drinking, given similar weekly levels.
“The novel finding of the current study is that frequent drinking may be more dangerous than binge drinking with regard to GI cancers. Alcohol use is a known risk factor for gastrointestinal (GI) cancers. Now, new research indicates that this risk is more associated with frequent drinking – even in smaller amounts -- compared with higher amounts or binge drinking, given similar weekly levels.” first author Jung Eun Yook, MD, of Seoul (South Korea) National University Hospital, and colleagues reported in an article published Aug. 18, 2021, in JAMA Network Open (doi: 10.1001/jamanetworkopen.2021.20382).
“This finding suggests that repeated alcohol consumption events even at lower amounts of alcohol may have a greater carcinogenic effect on GI organs than the consumption of larger amounts of alcohol at a lower frequency,” the investigators wrote.
A possible reason behind the difference in risk may be that the chronic “carcinogenic insult” from regular alcohol use may promote cancer development, whereas less frequent, episodic alcohol exposures may allow physiologic recovery, said the authors.
The results are from a population-based study that involved 11,737,467 participants in the Korean National Health System database who did not have cancer and who took part in a national screening program between January 2009 and December 2010.
They were followed from the year after their screening until either they had received a diagnosis of a GI cancer, death occurred, or the end of December 2017.
During a median follow-up of 6.4 years, 319,202 (2.7%) of those in the study developed a GI cancer.
The increase in the risk associated with alcohol consumption was dose dependent.
Compared with those who did not consume alcohol, the risk of developing GI cancer was higher for mild drinkers (adjusted hazard ratio, 1.04; 95% confidence interval, 1.03-1.05), moderate drinkers (aHR, 1.14; 95% CI, 1.12-1.15), and heavy drinkers (aHR, 1.28; 95% CI, 1.26-1.29), after adjusting for age, sex, income, smoking status with intensity, regular exercise, body mass index, diabetes, hypertension, and dyslipidemia.
There was a linear association between the frequency of drinking and GI cancer risk, with an aHR of 1.39 for individuals who reported drinking every day (95% CI, 1.36-1.41). The risk for GI cancer increased with consumption of five to seven units per occasion (aHR, 1.15). Notably, there were no similar increases with higher intake, including intake of 8-14 units per occasion (aHR, 1.11; 95% CI, 1.09-1.12), and even up to more than 14 units per occasion (aHR, 1.11; 95%CI, 1.08-1.14), in comparison with an intake of 5-7 units per occasion.
“Given similar weekly alcohol consumption levels, the risk of GI cancer increased with a higher frequency of drinking and decreased with a higher amount per occasion,” the authors write.
“Most previous studies just assess alcohol consumption as a total amount, [such as] drinks per occasion times occasion per week equals drinks per week [and] grams per week,” coauthor Dong Wook Shin, MD, DrPH, Samsung Medical Center, Sungkyunkwan University, Seoul, South Korea, said in an interview.
“But it was not known whether frequent drinking with small amount is more harmful than binge drinking, given a similar level of total drinking,” Dr. Shin said.
The increased risk associated with frequent drinking was generally similar with respect to esophageal, gastric, colorectal, biliary, and pancreatic cancer.
An exception was liver cancer, which showed a slightly decreased risk among mild drinkers (aHR, 0.91; 95% CI, 0.89-0.93).
Of note, the association between alcohol intake and the incidence of GI cancer was lower among women than men in terms of weekly consumption, frequency, and amount of alcohol consumed per occasion.
The associations between drinking and cancer type in terms of esophageal and liver cancers were similar between men and women. However, the alcohol-related risk for colorectal, biliary, and pancreatic cancers was less prominent for women.
Possible mechanisms related to regular drinking
A factor that might account for the increase in GI cancer risk with frequent drinking is that regular alcohol consumption “promotes the accumulation of cell divisions in the stem cells that maintain tissues in homeostasis,” the authors explained.
Another possible explanation is that long-term alcohol exposure may promote carcinogenesis, whereas less frequent exposure might allow “physiological homeostasis,” the authors wrote, adding that in vivo experiments have shown that duration and dose of alcohol exposure have been linked to cancer development.
Importantly, the findings support the importance of reducing the frequency of alcohol use to prevent cancer, the authors noted.
“Alcohol users who have a glass of wine or beer during dinner every day may develop more cancer than people who occasionally consume several drinks,” they cautioned.
Genetics, self-reporting considerations
In a related commentary, John D. Potter, MBBS, PhD, of the Research Center for Hauora and Health, Massey University, Wellington, New Zealand, noted that, in addition to supporting the known link between alcohol and cancers of the esophagus, colorectum, and liver, the study “strengthens evidence for a role of alcohol in stomach, biliary tract, and pancreas cancers.”
In comparison with nondrinkers, those who reported heavy drinking were much more likely to be smokers (51.6% vs. 9.0%); however, the study adjusted for smoking.
“Because the researchers were able to control for tobacco, this last finding [regarding the association with cancers of the stomach, biliary tract, and pancreas] is particularly informative,” Dr. Potter noted.
An important caveat is that more than a quarter of the Korean population is known to have an inactive form of the aldehyde dehydrogenase gene (ALDH2), which could have effects on alcohol metabolism as well as the risk for cancer, Dr. Potter wrote.
“This common polymorphism in ALDH2 (ALDH2 rs671 [c.1510G>A (Glu504Lys)]) has paradoxical effects,” he wrote.
“It increases the level of acetaldehyde in the blood of drinkers, which in turn increases the risk of cancer because acetaldehyde is a key player in the carcinogenicity of alcoholic beverages,” Dr. Potter explained. “On the other hand, the accumulation of acetaldehyde and the resultant flushing response are sufficiently unpleasant that they tend to reduce alcohol consumption among those with the Lys allele.”
The study results may therefore not be generalizable to a population in which the distribution of the variation in the ALDH2 enzyme differs, Dr. Potter added.
The lower prevalence of the inactive form (in North America, for instance) would mean that this lower prevalence was not a constraint on individuals’ drinking behavior as it is for some in Korea, Dr. Potter explained.
He noted another consideration: the underreporting of alcohol use is a well-known limitation of studies involving the assessment of alcohol consumption.
Dr. Shin agreed that underreporting is a limitation.
“People tend to underestimate their alcohol use,” Dr. Shin said in an interview.
However, he noted that “our study participants are health-screening participants aged 40 years and older, [and] people who participate in health screening tend to have higher awareness and better health behavior than nonparticipants.”
The authors and Dr. Potter disclosed no relevant financial relationships.
A version of this article first appeared on Medscape.com.
Use and Toxicity of Checkpoint Inhibitors for Solid Tumor Treatment in a Veteran Population
Due to the high cost of newer chemotherapy agents, institutions search for strategies to minimize drug cost and drug waste. Programmed death-1 (PD-1) inhibitors, nivolumab and pembrolizumab, are commonly used in the treatment of solid tumors; however, the agents cost thousands of dollars per dose. Nivolumab and pembrolizumab were initially approved using weight-based dosing, but package labeling for both agents now includes fixed dosing.1,2 A combination of these 2 dosing strategies could be used by institutions depending on individual patient’s weight to maximize cost savings, minimize drug waste, and maintain safety and efficacy of PD-1 inhibitors. Irrespective of dosing strategy, the development of immune-related adverse events (IrAEs) has been demonstrated with PD-1 inhibitors as a result of the mechanism of action.
PD-1 expression suppresses T cell activity to prevent the development of autoimmunity; however, this is also a mechanism in which tumor cells can evade the host immune system.3-5 Binding of PD-1 and programmed death-ligand 1 (PD-L1) suppresses T cell activity, whereas the inhibition of PD-1 and PD-L1 results in T cell activation.4,5 Increased T cell activity elicits the anticancer effect, but also contributes to the development of IrAEs.4,5 Hypothyroidism is one of the most common IrAEs, with a reported incidence of 9% with nivolumab therapy and 8.5% with pembrolizumab.1,2
Data from the US Department of Veterans Affairs (VA) medical centers is stored in the centralized Corporate Data Warehouse (CDW). VA researchers can obtain approval to use CDW data, which allows for large scale retrospective review of veterans who have received care at VA medical centers (VAMCs). This study aimed to describe the PD-1 inhibitor dosing used within VAMCs and identify actual and potential cost savings. Due to the frequency of immunemediated hypothyroidism and objective data that can be obtained from CDW reports, the study estimated the incidence of immune-mediated hypothyroidism within the veteran population as a safety outcome.
Background
The US Food and Drug Administration (FDA) initially approved dosing for IV nivolumab at 3 mg/kg of patient body weight every 2 weeks and for IV pembrolizumab 2 mg/kg of patient body weight every 3 weeks.1,2 Subsequent pharmacokinetic studies found that these agents have similar exposure and efficacy with fixed doses of nivolumab 240 mg IV every 2 weeks and pembrolizumab 200 mg IV every 3 weeks; in 2016, FDA labeling shifted from weight-based dosing to fixed dosing for most solid tumor indications.6-9 Depending on patient weight, a combination of weightbased and fixed dosing could be used by institutions to maximize cost-savings opportunities, minimize drug waste, and maintain clinical efficacy with PD-1 inhibitors. For example, a patient initiating nivolumab who weighs 80 kg would receive 240 mg for both weight-based (3 mg/kg x 80 kg = 240 mg) and fixed dosing; therefore, no cost-savings opportunities would be available. However, for a patient who weighs ≤ 73.3 kg, it would be more costeffective to use weight-based dosing vs the fixed dose. Since nivolumab is available in 40- mg, 100-mg, and 240-mg vials with similar unit prices, a combination of vial sizes could be used to minimize drug waste. Alternatively, for a patient who weighs ≥ 86.7 kg, it would be more cost-effective to administer the fixed, 240 mg dose when compared with the weightbased dose. Pembrolizumab is available only in a 100-mg vial; therefore, weight-based dosing may result in drug waste.
IrAEs can be seen with PD-1 inhibitors due to increased T cell activity, which is independent of dosing strategy and can affect any organ system. However, immune-mediated hypothyroidism has been commonly seen with PD-1 inhibitors. For patients with immunemediated hypothyroidism, levothyroxine can be considered for asymptomatic patients with thyroid- stimulating hormone (TSH) > 10 uIU/mL with normal thyroxine (T4), or patients with clinical primary hypothyroidism (TSH > 10 uIU/mL with low free T4 and clinical symptoms). Additionally, since hypothyroidism usually follows immunotherapy induced thyrotoxicosis, thyroid function tests should be monitored and levothyroxine initiated if TSH is > 10 uIU/mL for these patients.10,11
Hypothyroidism also can be graded according to the National Cancer Institute (NCI) Common Terminology Criteria for Adverse Events. Hypothyroidism is considered grade 1 when hypothyroidism is demonstrated through clinical or diagnostic observations only and the patient is asymptomatic and no intervention needed. Grade 2 occurs when the patient is symptomatic and limits instrumental activities of daily living (ADLs), prompting thyroid replacement therapy. In grade 3, patients experience severe symptoms that restrict self-care ADLs, and hospitalization is indicated. Grade 4 has life-threatening consequences, and urgent intervention is indicated. Grade 5 results in the death of the patient.12
Electronic health records (EHRs) of veterans who receive care at a VAMC are stored in CDW and available through the VA Informatics and Computing Infrastructure (VINCI), which provides access to data while ensuring veterans’ privacy and data security. This feature of the VA EHR allows for analysis of data across the VA health care system, and larger data sets can be used for retrospective chart reviews.
Using reports from CDW, the primary objective of this study was to describe the dosing strategy used for PD-1 inhibitors, and the primary safety outcome was to determine the incidence of immune-mediated hypothyroidism. The secondary objective was to estimate potential cost-savings opportunities using a combination of PD-1 inhibitor dosing strategies.
Methods
This was a retrospective study including data stored in CDW. The study was approved by the Durham VA Health Care System Institutional Review Board and VINCI/Data Access request tracker. Data were limited to nivolumab and pembrolizumab because they received earlier FDA approval, had multiple solid tumor indications, and 2 FDA-approved dosing strategies. The incidence of IrAEs was limited to hypothyroidism, which could be objectively verified with laboratory monitoring of thyroid function tests, including TSH, free or total T4, and triiodothyronine (T3), all of which were available in CDW data. Additionally, most patients with hypothyroidism initiate treatment with levothyroxine. Prescription refill history could also be retrieved using CDW reports.
Hypothyroidism was defined as T4 below lower limit of normal (LLN), TSH above upper limit of normal (ULN), or any increase in levothyroxine dosage. Patients were excluded if they received PD-1 inhibitor for an indication other than solid tumor treatment, such as hematologic malignancy, or if dosing did not follow weight-based or fixed-dosing strategies, such as nivolumab 1 mg/kg when used in combination with ipilimumab, or pembrolizumab 10 mg/kg. The primary endpoint was the percentage of orders for each dosing strategy, and the primary safety outcome was the incidence of immune-mediated hypothyroidism. Secondary endpoints included estimated cost savings and cost-savings opportunities through nivolumab dose rounding and incidence of levothyroxine initiation or dose change. Descriptive statistics were used for the primary and secondary endpoints.
A report in CDW identified patients who received a dose of nivolumab or pembrolizumab between January 1, 2015 and July 1, 2017 at any VAMC. The CDW report obtained weight at time of PD-1 inhibitor therapy initiation, dose of PD-1 inhibitor given, administration date of PD-1 inhibitor, and VA site. Depending on PD-1 inhibitor administered, weight in kg was multiplied by 3 mg/kg or 2 mg/kg to obtain patient’s anticipated weight-based nivolumab and pembrolizumab dose, respectively. The calculated weight-based dose, fixed dose, and administered dose were compared to infer dosing strategy used at the time of ordering. If the patient’s weight-based dose was within 10% of the fixed dose, the order was categorized as converging because the doses were too similar to determine which dosing strategy was intended.
After determination of dosing strategy, the nivolumab orders were evaluated for actual vs missed cost savings. The cost-savings evaluation included only nivolumab orders because nivolumab is available in a 40-mg, 100-mg, and 240-mg vials and, therefore, has more potential for dose-rounding opportunities with minimal drug waste compared with pembrolizumab, which is available only in a 100-mg vial. Actual cost savings included patients who weighed ≤ 73.3 kg and received nivolumab dose based on 3 mg/kg or patients who weighed ≥ 86.7 kg and received nivolumab 240 mg (fixed dose). Missed cost savings comprised patients who weighed ≤ 73.3 kg who received 240 mg nivolumab or patients who weighed ≥ 86.7 kg and received a nivolumab dose > 240 mg. The cost difference between the dose given and theoretical cost-effective dose was calculated to determine actual and potential cost savings. Converging orders were not included in the cost-savings analysis as the intended nivolumab dose could not be determined. An additional cost analysis of nivolumab orders prescribed between September 1, 2016 and July 1, 2017 was also performed because nivolumab fixed dosing was FDA-approved for most solid tumor indications in September 2016.
To determine the incidence of immunemediated hypothyroidism for patients who received a dose of a PD-1 inhibitor at a VAMC, a CDW report with thyroid function laboratory values (TSH, T4, or T3), including reference range values based on specific VA site, and levothyroxine prescriptions issued during PD-1 inhibitor therapy was obtained. A patient was considered to have experienced immune-mediated hypothyroidism if the patient’s laboratory values demonstrated T4 below the LLN, TSH above the ULN, or if the medication fill history demonstrated levothyroxine initiation or a levothyroxine dose increase.
Results
The CDW report identified 32,769 total PD-1 inhibitor orders. There were 3982 orders that did not meet inclusion criteria or inadequate data were obtained with CDW report and were excluded (Figure). The remaining 28,787 PD-1 inhibitor orders were evaluated for actual or missed cost savings. The distribution of dosing strategies can be found in Table 1.
Nivolumab accounted for 81.5% of all PD-1 inhibitor orders. Using the most cost-effective nivolumab dosing, the actual cost savings was estimated to be $8,514,300 with potential additional $5,591,250 of missed cost-savings opportunities. There were 8013 nivolumab orders written between September 1, 2016 and July 1, 2017. Cost-effective dosing was used in 4687 of these orders, which accounted for a cost savings of $5,198,570. The remaining 3326 orders had a missed cost-savings opportunity, which accounted for an additional $2,907,180 potential cost savings (Table 2).
PD-1 inhibitors were used for the treatment of 3249 unique patients. Based on abnormal thyroid function tests and levothyroxine initiation or dose increase, it is estimated that 514 (15.8%) patients experienced hypothyroidism during PD-1 inhibitor therapy. However, prior to PD-1 inhibitor therapy, 274 patients were receiving levothyroxine, suggesting baseline thyroid dysfunction. Of these patients, 152 (55.5%) patients maintained the same levothyroxine dose during PD-1 inhibitor therapy, but 91 (33.2%) required a levothyroxine dose increase. There were 187 patients who initiated levothyroxine during PD-1 inhibitor therapy (Table 3).
Discussion
Changes in FDA-approved dosing for PD-1 inhibitors allowed a combination of dosing strategies. Depending on patient weight, a weight-based or fixed-dosing strategy can be used to reduce drug cost while maintaining equivalent efficacy. This study evaluated use of dose rounding for PD-1 inhibitors within the VA health care system to identify actual and potential cost savings. To our knowledge, this is the first study to demonstrate cost savings through use of a combination of PD-1 inhibitor dosing strategies. Using CDW, researchers were able to review PD-1 dosing from all VAMCs and include a larger number of orders in a single retrospective study.
Nivolumab was the primary agent used within VAMCs. Depending on the indication, pembrolizumab requires PD-1 expression testing prior to its use in several solid tumor indications. Consequently, additional testing and patient eligibility is needed prior to use. Both PD-1 inhibitors were primarily dosed based on patient weight since this was the first FDAapproved dosing strategy. Nivolumab had more orders categorized as converging, which may be due to the therapeutic weight-based dose of 3 mg/kg for nivolumab vs 2 mg/kg for pembrolizumab. The calculated weight-based dose of nivolumab for an 80-kg patient is 240 mg, which also is the fixed dose. A 80-kg patient on pembrolizumab at 2 mg/kg would receive a 160-mg dose, whereas the fixed dose of pembrolizumab is 200 mg. Pembrolizumab is available only in a 100-mg vial, which limits opportunities for dose rounding without drug waste and could explain the higher amount of pembrolizumab orders in the fixed-dose category.
In this review of PD-1 inhibitor orders over approximately a 2.5-year study period, we identified $8,514,300 estimated cost savings with $5,591,250 estimated missed cost savings. When looking at orders administered after FDA approval for nivolumab-fixed dosing in September 2016, there was substantial cost savings of $5,198,570 with the potential for an additional $2,907,180 missed cost savings. Due to lower drug acquisition costs within the VA health care system, there may be higher cost-savings opportunities within other health care systems.
Through review of abnormal thyroid laboratory values and levothyroxine initiation or dose changes, this study estimated the incidence of hypothyroidism in patients receiving PD-1 inhibitor therapy at the VA. The incidence of primary hypothyroidism identified in this study was slightly higher at 15.8% compared with the 8.5 to 9.0% incidence reported from clinical trials.1,2 There are several reasons why the incidence of hypothyroidism appeared higher in this study. Abnormal laboratory values were not assessed for the degree of deviation from the reference range; any TSH above the ULN, T4 below the LLN, or levothyroxine dose increase was included as thyroid dysfunction in this review. There is also the potential for endogenous age-related thyroid fluctuation, and the development of hypothyroidism may not have been related to PD-1 inhibitor therapy. Within this patient population, 8.4% were receiving levothyroxine prior to PD-1 inhibitor initiation indicating baseline thyroid dysfunction, and it is unclear whether levothyroxine dose increases were due to PD-1 inhibitor or endogenous fluctuation.
Limitations
There are several limitations to acknowledge. The dosing strategy and apparent dose rounding was determined by investigator inference and may not accurately represent the intended dosing strategy. This study did not address efficacy of PD-1 inhibitor and dosing strategy; however, clinical trials have demonstrated equivalent efficacy to generate the change in FDA-approved dosing. Additionally, FDA approval for nivolumab fixed dosing was indication specific. Starting in September 2016, many solid tumor indications had fixed dosing approved, but this approval was not necessarily all encompassing.
While the use of CDW allowed for a greater number of PD-1 inhibitor orders to be included in retrospective review, there also were limitations of the CDW report. The patient weight was limited to weight at time of therapy initiation. Due to the potential for weight changes, nivolumab dosing may have seemed inappropriate to investigators, and thereby excluded. Based on data available from CDW reports, hypothyroidism could not be graded according to NCI Common Terminology Criteria for Adverse Events, and the incidence of clinically significant hypothyroidism could not be determined.
Conclusions
With increasing drug acquisition costs, particularly among antineoplastic agents, health care systems frequently seek out cost-savings opportunities. Using a combination of weightbased and fixed-dosing strategies for PD-1 inhibitors can be a mechanism to achieve costsavings. Through the identification of the dosing strategy used for PD-1 inhibitors, we were able to identify and report instances for potential cost-savings opportunities among veterans treated within VA health care system. Use of CDW allows for data from all VAMCs to be evaluated in a single retrospective chart review, which allows for the inclusion of a larger sample size. This study identified a substantial cost savings for nivolumab through a combination of weight-based and fixed-dosing strategies. Due to the novel mechanism of action, ongoing realworld evaluation of adverse events and IrAEs is warranted.
Dosing strategies with nivolumab and pembrolizumab continue to evolve. In March 2018, nivolumab 480 mg IV every 4 weeks was FDA approved and in April 2020, pembrolizumab 400 mg IV every 6 weeks was FDA approved.13,14 While the drug costs will remain the same, extended interval dosing strategies have cost avoidance such as fewer clinic appointments, resulting in decreased staffing costs and decreased patient travel. Additional studies will be needed to evaluate the cost and safety of the recently approved dosing strategies
1. OPDIVO (nivolumab) injection, for intravenous infusion. Package Insert. Princeton, NJ: Bristol-Myers Squibb Company; 2014.
2. Keytruda (pembrolizumab) injection, for intravenous infusion. Package Insert. Whitehouse Station, NJ: Merck & Co, Inc; 2016
3. Pardoll DM. The blockade of immune checkpoints in cancer immunotherapy. Nat Rev Cancer. 2012;12(4):252-264. doi:10.1038/nrc3239
4. Yao H, Wang H, Li C, Fang J-Y, Xu J. Cancer cellintrinsic PD-1 and implications in combinatorial immunotherapy. Front Immunol. 2018;9:1774. doi:10.3389/fimmu.2018.01774
5. Wang Y, Wang H, Yao H, Li C, Fang J-Y, Xu J. Regulation of PD-L1: emerging routes for targeting tumor immune evasion. Front Pharmacol. 2018;9:536. doi:10.3389/fphar.2018.00536
6. Patnaik A, Kang SP, Rasco D, et al. Phase I study of pembrolizumab (MK-3475; anti-PD-1 monocolonal antibody) in patients with advanced solid tumors. Clin Cancer Res. 2015;21(19):4286-4293. doi:10.1158/1078-0432.CCR-14-2607
7. Zhao X, Suryawanshi S, Hruska M, et al. Assessment of nivolumab benefit-risk profile of a 240-mg flat dose relative to a 3-mg/kg dosing regimen in patients with advanced tumors. Ann Oncol. 2017;28(8):2002-2008. doi:10.1093/annonc/mdx235
8. Freshwater T, Kondic A, Ahamadi M, et al. Evaluation of dosing strategy for pembrolizumab for oncology indications. J Immunother Cancer. 2017;5:43. doi:10.1186/s40425-017-0242-5
9. US Food and Drug Administration. Modification of the dosage regimen for nivolumab. Updated September 15, 2016. Accessed July 8, 2021. https://www.fda.gov/drugs /resources-information-approved-drugs/modification -dosage-regimen-nivolumab
10. Brahmer JR, Lacchetti C, Schneider BJ, et al. Management of immune-related adverse events in patients treated with immune checkpoint inhibitor therapy: American Society of Clinical Oncology Clinical Practice Guideline. J Clin Oncol. 2018;36(17):1714-1768. doi:10.1200/JCO.2017.77.6385
11. National Comprehensive Cancer Network. Clinical Practice Guidelines in Oncology: Management of immunotherapy- related toxicities. version 3.2021. Updated May 14, 2021. Accessed July 8,2021.https://www.nccn.org/professionals/physician_gls/pdf/immunotherapy.pdf
12. National Institutes of Health, National Cancer Institute. Common terminology criteria for adverse events (CTCAE) version 5.0. Updated November 17, 2017. Accessed July 8, 2021. https://ctep.cancer.gov /protocoldevelopment/electronic_applications/docs /CTCAE_v5_Quick_Reference_8.5x11.pdf
13. Zhao X, Ivaturi V, Gopalakrishnan M, Shen J, et al. A model-based exposure-response (E-R) assessment of a nivolumab (NIVO) 4-weekly dosing schedule across multiple tumor types. Abstract presented at: American Association of Cancer Research Annual Meeting 2017; April 1-5, 2017; Washington, DC. doi:10.1158/1538-7445.AM2017-CT101
14. US Food and Drug Administration approves new dosing regimen for pembrolizumab. Updated April 29, 2020. Accessed July 8, 2021. https://www.fda.gov/drugs/drug -approvals-and-databases/fda-approves-new-dosing -regimen-pembrolizumab
Due to the high cost of newer chemotherapy agents, institutions search for strategies to minimize drug cost and drug waste. Programmed death-1 (PD-1) inhibitors, nivolumab and pembrolizumab, are commonly used in the treatment of solid tumors; however, the agents cost thousands of dollars per dose. Nivolumab and pembrolizumab were initially approved using weight-based dosing, but package labeling for both agents now includes fixed dosing.1,2 A combination of these 2 dosing strategies could be used by institutions depending on individual patient’s weight to maximize cost savings, minimize drug waste, and maintain safety and efficacy of PD-1 inhibitors. Irrespective of dosing strategy, the development of immune-related adverse events (IrAEs) has been demonstrated with PD-1 inhibitors as a result of the mechanism of action.
PD-1 expression suppresses T cell activity to prevent the development of autoimmunity; however, this is also a mechanism in which tumor cells can evade the host immune system.3-5 Binding of PD-1 and programmed death-ligand 1 (PD-L1) suppresses T cell activity, whereas the inhibition of PD-1 and PD-L1 results in T cell activation.4,5 Increased T cell activity elicits the anticancer effect, but also contributes to the development of IrAEs.4,5 Hypothyroidism is one of the most common IrAEs, with a reported incidence of 9% with nivolumab therapy and 8.5% with pembrolizumab.1,2
Data from the US Department of Veterans Affairs (VA) medical centers is stored in the centralized Corporate Data Warehouse (CDW). VA researchers can obtain approval to use CDW data, which allows for large scale retrospective review of veterans who have received care at VA medical centers (VAMCs). This study aimed to describe the PD-1 inhibitor dosing used within VAMCs and identify actual and potential cost savings. Due to the frequency of immunemediated hypothyroidism and objective data that can be obtained from CDW reports, the study estimated the incidence of immune-mediated hypothyroidism within the veteran population as a safety outcome.
Background
The US Food and Drug Administration (FDA) initially approved dosing for IV nivolumab at 3 mg/kg of patient body weight every 2 weeks and for IV pembrolizumab 2 mg/kg of patient body weight every 3 weeks.1,2 Subsequent pharmacokinetic studies found that these agents have similar exposure and efficacy with fixed doses of nivolumab 240 mg IV every 2 weeks and pembrolizumab 200 mg IV every 3 weeks; in 2016, FDA labeling shifted from weight-based dosing to fixed dosing for most solid tumor indications.6-9 Depending on patient weight, a combination of weightbased and fixed dosing could be used by institutions to maximize cost-savings opportunities, minimize drug waste, and maintain clinical efficacy with PD-1 inhibitors. For example, a patient initiating nivolumab who weighs 80 kg would receive 240 mg for both weight-based (3 mg/kg x 80 kg = 240 mg) and fixed dosing; therefore, no cost-savings opportunities would be available. However, for a patient who weighs ≤ 73.3 kg, it would be more costeffective to use weight-based dosing vs the fixed dose. Since nivolumab is available in 40- mg, 100-mg, and 240-mg vials with similar unit prices, a combination of vial sizes could be used to minimize drug waste. Alternatively, for a patient who weighs ≥ 86.7 kg, it would be more cost-effective to administer the fixed, 240 mg dose when compared with the weightbased dose. Pembrolizumab is available only in a 100-mg vial; therefore, weight-based dosing may result in drug waste.
IrAEs can be seen with PD-1 inhibitors due to increased T cell activity, which is independent of dosing strategy and can affect any organ system. However, immune-mediated hypothyroidism has been commonly seen with PD-1 inhibitors. For patients with immunemediated hypothyroidism, levothyroxine can be considered for asymptomatic patients with thyroid- stimulating hormone (TSH) > 10 uIU/mL with normal thyroxine (T4), or patients with clinical primary hypothyroidism (TSH > 10 uIU/mL with low free T4 and clinical symptoms). Additionally, since hypothyroidism usually follows immunotherapy induced thyrotoxicosis, thyroid function tests should be monitored and levothyroxine initiated if TSH is > 10 uIU/mL for these patients.10,11
Hypothyroidism also can be graded according to the National Cancer Institute (NCI) Common Terminology Criteria for Adverse Events. Hypothyroidism is considered grade 1 when hypothyroidism is demonstrated through clinical or diagnostic observations only and the patient is asymptomatic and no intervention needed. Grade 2 occurs when the patient is symptomatic and limits instrumental activities of daily living (ADLs), prompting thyroid replacement therapy. In grade 3, patients experience severe symptoms that restrict self-care ADLs, and hospitalization is indicated. Grade 4 has life-threatening consequences, and urgent intervention is indicated. Grade 5 results in the death of the patient.12
Electronic health records (EHRs) of veterans who receive care at a VAMC are stored in CDW and available through the VA Informatics and Computing Infrastructure (VINCI), which provides access to data while ensuring veterans’ privacy and data security. This feature of the VA EHR allows for analysis of data across the VA health care system, and larger data sets can be used for retrospective chart reviews.
Using reports from CDW, the primary objective of this study was to describe the dosing strategy used for PD-1 inhibitors, and the primary safety outcome was to determine the incidence of immune-mediated hypothyroidism. The secondary objective was to estimate potential cost-savings opportunities using a combination of PD-1 inhibitor dosing strategies.
Methods
This was a retrospective study including data stored in CDW. The study was approved by the Durham VA Health Care System Institutional Review Board and VINCI/Data Access request tracker. Data were limited to nivolumab and pembrolizumab because they received earlier FDA approval, had multiple solid tumor indications, and 2 FDA-approved dosing strategies. The incidence of IrAEs was limited to hypothyroidism, which could be objectively verified with laboratory monitoring of thyroid function tests, including TSH, free or total T4, and triiodothyronine (T3), all of which were available in CDW data. Additionally, most patients with hypothyroidism initiate treatment with levothyroxine. Prescription refill history could also be retrieved using CDW reports.
Hypothyroidism was defined as T4 below lower limit of normal (LLN), TSH above upper limit of normal (ULN), or any increase in levothyroxine dosage. Patients were excluded if they received PD-1 inhibitor for an indication other than solid tumor treatment, such as hematologic malignancy, or if dosing did not follow weight-based or fixed-dosing strategies, such as nivolumab 1 mg/kg when used in combination with ipilimumab, or pembrolizumab 10 mg/kg. The primary endpoint was the percentage of orders for each dosing strategy, and the primary safety outcome was the incidence of immune-mediated hypothyroidism. Secondary endpoints included estimated cost savings and cost-savings opportunities through nivolumab dose rounding and incidence of levothyroxine initiation or dose change. Descriptive statistics were used for the primary and secondary endpoints.
A report in CDW identified patients who received a dose of nivolumab or pembrolizumab between January 1, 2015 and July 1, 2017 at any VAMC. The CDW report obtained weight at time of PD-1 inhibitor therapy initiation, dose of PD-1 inhibitor given, administration date of PD-1 inhibitor, and VA site. Depending on PD-1 inhibitor administered, weight in kg was multiplied by 3 mg/kg or 2 mg/kg to obtain patient’s anticipated weight-based nivolumab and pembrolizumab dose, respectively. The calculated weight-based dose, fixed dose, and administered dose were compared to infer dosing strategy used at the time of ordering. If the patient’s weight-based dose was within 10% of the fixed dose, the order was categorized as converging because the doses were too similar to determine which dosing strategy was intended.
After determination of dosing strategy, the nivolumab orders were evaluated for actual vs missed cost savings. The cost-savings evaluation included only nivolumab orders because nivolumab is available in a 40-mg, 100-mg, and 240-mg vials and, therefore, has more potential for dose-rounding opportunities with minimal drug waste compared with pembrolizumab, which is available only in a 100-mg vial. Actual cost savings included patients who weighed ≤ 73.3 kg and received nivolumab dose based on 3 mg/kg or patients who weighed ≥ 86.7 kg and received nivolumab 240 mg (fixed dose). Missed cost savings comprised patients who weighed ≤ 73.3 kg who received 240 mg nivolumab or patients who weighed ≥ 86.7 kg and received a nivolumab dose > 240 mg. The cost difference between the dose given and theoretical cost-effective dose was calculated to determine actual and potential cost savings. Converging orders were not included in the cost-savings analysis as the intended nivolumab dose could not be determined. An additional cost analysis of nivolumab orders prescribed between September 1, 2016 and July 1, 2017 was also performed because nivolumab fixed dosing was FDA-approved for most solid tumor indications in September 2016.
To determine the incidence of immunemediated hypothyroidism for patients who received a dose of a PD-1 inhibitor at a VAMC, a CDW report with thyroid function laboratory values (TSH, T4, or T3), including reference range values based on specific VA site, and levothyroxine prescriptions issued during PD-1 inhibitor therapy was obtained. A patient was considered to have experienced immune-mediated hypothyroidism if the patient’s laboratory values demonstrated T4 below the LLN, TSH above the ULN, or if the medication fill history demonstrated levothyroxine initiation or a levothyroxine dose increase.
Results
The CDW report identified 32,769 total PD-1 inhibitor orders. There were 3982 orders that did not meet inclusion criteria or inadequate data were obtained with CDW report and were excluded (Figure). The remaining 28,787 PD-1 inhibitor orders were evaluated for actual or missed cost savings. The distribution of dosing strategies can be found in Table 1.
Nivolumab accounted for 81.5% of all PD-1 inhibitor orders. Using the most cost-effective nivolumab dosing, the actual cost savings was estimated to be $8,514,300 with potential additional $5,591,250 of missed cost-savings opportunities. There were 8013 nivolumab orders written between September 1, 2016 and July 1, 2017. Cost-effective dosing was used in 4687 of these orders, which accounted for a cost savings of $5,198,570. The remaining 3326 orders had a missed cost-savings opportunity, which accounted for an additional $2,907,180 potential cost savings (Table 2).
PD-1 inhibitors were used for the treatment of 3249 unique patients. Based on abnormal thyroid function tests and levothyroxine initiation or dose increase, it is estimated that 514 (15.8%) patients experienced hypothyroidism during PD-1 inhibitor therapy. However, prior to PD-1 inhibitor therapy, 274 patients were receiving levothyroxine, suggesting baseline thyroid dysfunction. Of these patients, 152 (55.5%) patients maintained the same levothyroxine dose during PD-1 inhibitor therapy, but 91 (33.2%) required a levothyroxine dose increase. There were 187 patients who initiated levothyroxine during PD-1 inhibitor therapy (Table 3).
Discussion
Changes in FDA-approved dosing for PD-1 inhibitors allowed a combination of dosing strategies. Depending on patient weight, a weight-based or fixed-dosing strategy can be used to reduce drug cost while maintaining equivalent efficacy. This study evaluated use of dose rounding for PD-1 inhibitors within the VA health care system to identify actual and potential cost savings. To our knowledge, this is the first study to demonstrate cost savings through use of a combination of PD-1 inhibitor dosing strategies. Using CDW, researchers were able to review PD-1 dosing from all VAMCs and include a larger number of orders in a single retrospective study.
Nivolumab was the primary agent used within VAMCs. Depending on the indication, pembrolizumab requires PD-1 expression testing prior to its use in several solid tumor indications. Consequently, additional testing and patient eligibility is needed prior to use. Both PD-1 inhibitors were primarily dosed based on patient weight since this was the first FDAapproved dosing strategy. Nivolumab had more orders categorized as converging, which may be due to the therapeutic weight-based dose of 3 mg/kg for nivolumab vs 2 mg/kg for pembrolizumab. The calculated weight-based dose of nivolumab for an 80-kg patient is 240 mg, which also is the fixed dose. A 80-kg patient on pembrolizumab at 2 mg/kg would receive a 160-mg dose, whereas the fixed dose of pembrolizumab is 200 mg. Pembrolizumab is available only in a 100-mg vial, which limits opportunities for dose rounding without drug waste and could explain the higher amount of pembrolizumab orders in the fixed-dose category.
In this review of PD-1 inhibitor orders over approximately a 2.5-year study period, we identified $8,514,300 estimated cost savings with $5,591,250 estimated missed cost savings. When looking at orders administered after FDA approval for nivolumab-fixed dosing in September 2016, there was substantial cost savings of $5,198,570 with the potential for an additional $2,907,180 missed cost savings. Due to lower drug acquisition costs within the VA health care system, there may be higher cost-savings opportunities within other health care systems.
Through review of abnormal thyroid laboratory values and levothyroxine initiation or dose changes, this study estimated the incidence of hypothyroidism in patients receiving PD-1 inhibitor therapy at the VA. The incidence of primary hypothyroidism identified in this study was slightly higher at 15.8% compared with the 8.5 to 9.0% incidence reported from clinical trials.1,2 There are several reasons why the incidence of hypothyroidism appeared higher in this study. Abnormal laboratory values were not assessed for the degree of deviation from the reference range; any TSH above the ULN, T4 below the LLN, or levothyroxine dose increase was included as thyroid dysfunction in this review. There is also the potential for endogenous age-related thyroid fluctuation, and the development of hypothyroidism may not have been related to PD-1 inhibitor therapy. Within this patient population, 8.4% were receiving levothyroxine prior to PD-1 inhibitor initiation indicating baseline thyroid dysfunction, and it is unclear whether levothyroxine dose increases were due to PD-1 inhibitor or endogenous fluctuation.
Limitations
There are several limitations to acknowledge. The dosing strategy and apparent dose rounding was determined by investigator inference and may not accurately represent the intended dosing strategy. This study did not address efficacy of PD-1 inhibitor and dosing strategy; however, clinical trials have demonstrated equivalent efficacy to generate the change in FDA-approved dosing. Additionally, FDA approval for nivolumab fixed dosing was indication specific. Starting in September 2016, many solid tumor indications had fixed dosing approved, but this approval was not necessarily all encompassing.
While the use of CDW allowed for a greater number of PD-1 inhibitor orders to be included in retrospective review, there also were limitations of the CDW report. The patient weight was limited to weight at time of therapy initiation. Due to the potential for weight changes, nivolumab dosing may have seemed inappropriate to investigators, and thereby excluded. Based on data available from CDW reports, hypothyroidism could not be graded according to NCI Common Terminology Criteria for Adverse Events, and the incidence of clinically significant hypothyroidism could not be determined.
Conclusions
With increasing drug acquisition costs, particularly among antineoplastic agents, health care systems frequently seek out cost-savings opportunities. Using a combination of weightbased and fixed-dosing strategies for PD-1 inhibitors can be a mechanism to achieve costsavings. Through the identification of the dosing strategy used for PD-1 inhibitors, we were able to identify and report instances for potential cost-savings opportunities among veterans treated within VA health care system. Use of CDW allows for data from all VAMCs to be evaluated in a single retrospective chart review, which allows for the inclusion of a larger sample size. This study identified a substantial cost savings for nivolumab through a combination of weight-based and fixed-dosing strategies. Due to the novel mechanism of action, ongoing realworld evaluation of adverse events and IrAEs is warranted.
Dosing strategies with nivolumab and pembrolizumab continue to evolve. In March 2018, nivolumab 480 mg IV every 4 weeks was FDA approved and in April 2020, pembrolizumab 400 mg IV every 6 weeks was FDA approved.13,14 While the drug costs will remain the same, extended interval dosing strategies have cost avoidance such as fewer clinic appointments, resulting in decreased staffing costs and decreased patient travel. Additional studies will be needed to evaluate the cost and safety of the recently approved dosing strategies
1. OPDIVO (nivolumab) injection, for intravenous infusion. Package Insert. Princeton, NJ: Bristol-Myers Squibb Company; 2014.
2. Keytruda (pembrolizumab) injection, for intravenous infusion. Package Insert. Whitehouse Station, NJ: Merck & Co, Inc; 2016
3. Pardoll DM. The blockade of immune checkpoints in cancer immunotherapy. Nat Rev Cancer. 2012;12(4):252-264. doi:10.1038/nrc3239
4. Yao H, Wang H, Li C, Fang J-Y, Xu J. Cancer cellintrinsic PD-1 and implications in combinatorial immunotherapy. Front Immunol. 2018;9:1774. doi:10.3389/fimmu.2018.01774
5. Wang Y, Wang H, Yao H, Li C, Fang J-Y, Xu J. Regulation of PD-L1: emerging routes for targeting tumor immune evasion. Front Pharmacol. 2018;9:536. doi:10.3389/fphar.2018.00536
6. Patnaik A, Kang SP, Rasco D, et al. Phase I study of pembrolizumab (MK-3475; anti-PD-1 monocolonal antibody) in patients with advanced solid tumors. Clin Cancer Res. 2015;21(19):4286-4293. doi:10.1158/1078-0432.CCR-14-2607
7. Zhao X, Suryawanshi S, Hruska M, et al. Assessment of nivolumab benefit-risk profile of a 240-mg flat dose relative to a 3-mg/kg dosing regimen in patients with advanced tumors. Ann Oncol. 2017;28(8):2002-2008. doi:10.1093/annonc/mdx235
8. Freshwater T, Kondic A, Ahamadi M, et al. Evaluation of dosing strategy for pembrolizumab for oncology indications. J Immunother Cancer. 2017;5:43. doi:10.1186/s40425-017-0242-5
9. US Food and Drug Administration. Modification of the dosage regimen for nivolumab. Updated September 15, 2016. Accessed July 8, 2021. https://www.fda.gov/drugs /resources-information-approved-drugs/modification -dosage-regimen-nivolumab
10. Brahmer JR, Lacchetti C, Schneider BJ, et al. Management of immune-related adverse events in patients treated with immune checkpoint inhibitor therapy: American Society of Clinical Oncology Clinical Practice Guideline. J Clin Oncol. 2018;36(17):1714-1768. doi:10.1200/JCO.2017.77.6385
11. National Comprehensive Cancer Network. Clinical Practice Guidelines in Oncology: Management of immunotherapy- related toxicities. version 3.2021. Updated May 14, 2021. Accessed July 8,2021.https://www.nccn.org/professionals/physician_gls/pdf/immunotherapy.pdf
12. National Institutes of Health, National Cancer Institute. Common terminology criteria for adverse events (CTCAE) version 5.0. Updated November 17, 2017. Accessed July 8, 2021. https://ctep.cancer.gov /protocoldevelopment/electronic_applications/docs /CTCAE_v5_Quick_Reference_8.5x11.pdf
13. Zhao X, Ivaturi V, Gopalakrishnan M, Shen J, et al. A model-based exposure-response (E-R) assessment of a nivolumab (NIVO) 4-weekly dosing schedule across multiple tumor types. Abstract presented at: American Association of Cancer Research Annual Meeting 2017; April 1-5, 2017; Washington, DC. doi:10.1158/1538-7445.AM2017-CT101
14. US Food and Drug Administration approves new dosing regimen for pembrolizumab. Updated April 29, 2020. Accessed July 8, 2021. https://www.fda.gov/drugs/drug -approvals-and-databases/fda-approves-new-dosing -regimen-pembrolizumab
COVID booster may benefit active-treatment cancer patients
A COVID-19 booster shot may be beneficial for patients with cancer who are undergoing treatment, according to new findings from an Israeli case-control study.
The seropositivity rate among the patients with cancer remained high (87%) about 4 months after the patients had received the second BNT162b2 (Pfizer/BioNTech) vaccination. However, the median IgG titer in the patients and the control persons who were without cancer decreased over time. Notably, in a previous analysis that the authors conducted and in the current one, the IgG titers were statistically significantly lower in the patients with cancer as compared to control persons.
The correlation between antibody levels following vaccination and clinical protection has yet to be proven, but the accumulating evidence supports antibody response as a possible correlate of disease protection.
“Our data can’t predict if a third booster dose is necessary,” said study author Salomon M. Stemmer, MD, professor at the Institute of Oncology of Rabin Medical Center, Petah Tikva, Israel. “It does seem quite logical that a booster dose will cause an increase in IgG levels.”
The findings were published Aug. 11, 2021, in a research letter in JAMA Oncology.
In their previous study, Dr. Stemmer and colleagues compared the rates of anti–spike antibody response to the initial shot of the BNT162b2 vaccine among 102 adults with solid-tumor cancers who were undergoing treatment with that of 78 healthy control persons. They found that a high percentage of patients undergoing treatment for cancer (90%) achieved a sufficient antibody response to the BNT162b2 vaccine.
Booster endorsed
Responses to COVID-19 vaccination have varied among patients with cancer. For patients with solid tumors, responses have been good even while the patients were receiving systemic therapy. However, among patients with blood cancers, particularly those receiving immunosuppressive therapies, responses have been poor. Studies have identified factors associated with a poor response, but it has been unclear whether to recommend booster shots.
In August the Food and Drug Administration authorized a third dose of either the Pfizer or the Moderna COVID-19 vaccine for all individuals with compromised immune systems. Those eligible for a third dose include solid-organ transplant recipients, those undergoing cancer treatments, and people with autoimmune diseases that suppress their immune systems.
IgG titers lower in cancer patients
In the current analysis, the authors evaluated the anti-S response in the patients with cancer approximately 4 months after they had received the second vaccine dose. They compared the responses in those patients with the responses in a control group.
The cohort included 95 patients from the prior study and 66 control persons. The most common malignancies were gastrointestinal (26%), lung (25%), and breast (18%).
All patients were receiving systemic therapy. Chemotherapy was the most common (28%), followed by immunotherapy (21%) and combination chemotherapy/biological therapy (20%).
At a median of 123 days after the second vaccination, 83 patients with cancer (87%) and all of the control patients (100%) were seropositive for anti-S IgG antibodies. The median titer levels were significantly lower among case patients as compared with control patients (417 AU/mL [interquartile range, 136-895] vs. 1,220 AU/mL [IQR, 588-1,987]; P < .001)
There was a 3.6-fold range in median titer values across tumor types and an even wider range (8.8-fold) across the different types of treatment. The lowest titers were observed among patients who had received immunotherapy plus chemotherapy/biological therapy (median [IQR], 94.4 [49.4-191] AU/mL vs. 147 [62.8-339] AU/mL).
In an exploratory multivariable analysis, treatments with chemotherapy plus immunotherapy and immunotherapy plus biological therapy were significantly associated with lower IgG titers.
No downside for cancer patients
The Biden administration announced a plan to begin booster COVID-19 vaccinations for all American adults in September, with recommendations that the third vaccine be given at least 8 months after the second mRNA vaccine dose.
Jeremy M. Levin, DPhil, the chairman and CEO of Ovid Therapeutics, explained that, concerning boosters, “it is inconceivable that we will have all data at this stage.
“Knowledge about how boosters work and don’t work and when you should ideally have them is imperfect,” he told this news organization. “However, we can have a lot of confidence in the fact that hundreds of millions of people have received the vaccine, so we know a lot about the safety and efficacy.”
Immunocompromised adults represent less than 5% of the total population, and most of the available data on vaccination are from patients who have undergone solid-organ transplant, Dr. Levin explained. Studies have shown that their response is less robust to vaccination in comparison with adults in the general population.
“Although it is still preliminary, the strongest data come from Israel,” he said, “where they found that the booster was highly effective and doubled the number of transplant patients who developed antibodies.”
But data are not yet available in the setting of cancer. “But even though we don’t have the data yet, the answer is that no matter, the booster process is essential,” he said. “The evidence we have is that boosters raise the immune response, and it is the best data we have now.”
Martin J. Edelman, MD, chair, department of hematology/oncology, Fox Chase Cancer Center, Philadelphia, noted that the current recommendation is that patients who are immunocompromised receive a booster immediately.
At his health system, this is interpreted to include patients who have undergone the following treatments: Transplant (solid-organ and bone marrow transplant), hemodialysis, hematologic malignancy treatment, active immunosuppressive (chemotherapy, chemoimmunotherapy, and nonhormonal or single-agent immunotherapy) treatment, rheumatology treatments, and high-dose steroids.
“As for cancer patients, we are making arrangements to vaccinate patients who meet the above criteria now,” he said. “There is no known downside to receiving booster immediately. While there may be less of a response than waiting for completion of treatment, we know that patients on active therapy are frequently able to mount a response, and any response is better than none.”
Dr. Edelman added that this area is changing very rapidly. “We will modify our approach as information and guidance from appropriate organizations, such as the FDA and CDC, become available.”
Dr. Stemmer has received institutional research grants from CAN-FITE, AstraZeneca, Bioline RX, BMS, Halozyme, Clovis Oncology, CTG Pharma, Exelixis, Geicam, Incyte, Lilly, Moderna, Teva Pharmaceuticals, and Roche, and owns stocks and options in CTG Pharma, DocBoxMD, Tyrnovo, VYPE, Cytora, and CAN-FITE. Dr. Edelman has received personal fees and other compensation from Windmil, Biomarker Strategies, AstraZeneca, Takeda, GlaxoSmithKline, Apexigen, Nektar, Bristol-Myers Squibb, Armo, Bergen Bio, and Apexigen outside the submitted work. He has submitted a patent for epigenetic modifications to increase susceptibility to radiopharmaceuticals and is a paid adviser for Kanaph and Flame. Dr. Levin is chairman and CEO of Ovid Therapeutics.
A version of this article first appeared on Medscape.com.