User login
-
div[contains(@class, 'header__large-screen')]
div[contains(@class, 'read-next-article')]
div[contains(@class, 'main-prefix')]
div[contains(@class, 'nav-primary')]
nav[contains(@class, 'nav-primary')]
section[contains(@class, 'footer-nav-section-wrapper')]
footer[@id='footer']
section[contains(@class, 'nav-hidden')]
div[contains(@class, 'ce-card-content')]
nav[contains(@class, 'nav-ce-stack')]
div[contains(@class, 'view-medstat-quiz-listing-panes')]
div[contains(@class, 'pane-article-sidebar-latest-news')]
Fecal transfer could be the transplant of youth
Fecal matter may be in the fountain of youth
Yes, you read that headline correctly. New research by scientists at Quadram Institute and the University of East Anglia, both in Norwich, England, supports the claim that transferring fecal microbes might actually have some positive effects on reversing the aging process in the eyes, brain, and gut.
How do they know? Mice, of course. In the study, scientists took the gut microbes from older mice and transferred them into the younger mince. The young mice displayed inflamed signs of aging in their guts, brains, and eyes, which, we all know, decline in function as we age. What happens is a chronic inflammation of cells as we get older that can be found in the brain or gut that leads to a degenerative state over time.
When the older mice received the gut microbes from younger mice, the investigators saw the reverse: Gut, brain, and eye functionality improved. In a way, minimizing the inflammation.
There’s tons of research out there that suggests gut health is the key to a healthy life, but this study points directly to an improvement in brain and vision functionality as a result of the transfer.
Now, we’re not insinuating you get a poo transfer as you reach old age. And the shift to human studies on microbiota replacement therapy is still in the works. But this definitely is a topic to watch and could be a game changer in the age-old quest to bottle youth or at least improve quality of life as we age.
For now, the scientists did find some connections between the beneficial bacteria in the transplants and the human diet that could have similar effects, like changes in the metabolism of certain fats and vitamin that could have effects on the inflammatory cells in the eye and brain.
The more you know!
It’s not lying, it’s preemptive truth
Lying is bad. Bold statement, we know, but a true one. After all, God spent an entire commandment telling people not to do the whole bearing false witness thing, and God is generally known for not joking around. He’s a pretty serious dude.
In case you’ve been wandering around the desert for a while and haven’t had wifi, we have a bit of a misinformation problem these days. People lie all the time about a lot of things, and a lot of people believe the lies. According to new research, however, there are also a lot of people who recognize the lies but accept them anyway because they believe that the lies will become true in the future.
Imagine the following scenario: A friend gets a job he’s not qualified for because he listed a skill he doesn’t have. That’s bad, right? And the people the researchers interviewed agreed, at least initially. But when informed that our friend is planning on obtaining the skill in summer classes in the near future, the study participants became far more willing to excuse the initial lie.
A friend jumping the gun on training he doesn’t have yet is fairly innocuous as far as lying goes, but as the researchers found, this willingness to forgive lies because they could become true extends far further. For example, millions of people do not vote illegally in U.S. elections, nor do White people get approved for mortgages at rates 300% higher than minorities, but when asked to imagine scenarios in which those statements could be true, study participants were less likely to condemn the lie and prevent it from spreading further, especially if their political viewpoints aligned with the respective falsehood.
It seems, then, that while we may aspire to not tell lies, we take after another guy with magic powers who spent too much time in the desert: “What I told you was true, from a certain point of view.”
It tastes like feng shui, but it’s not
You know about biomes. You’ve read about various microbiomes. Allow us to introduce you to the envirome,
The envirome “includes all the natural and man-made elements of our environment throughout the lifespan, notably the built environment,” said Robert Schneider, dean of the College of Integrative Medicine at Maharishi International University. Located in – you guessed it – Fairfield, Iowa, and home of the Fighting Transcendentalists. MAHARISHI RULES!

[Editor’s note: You made that up, right? Well, it really is in Iowa, but they don’t seem to have an athletic program.]
In an effort to maximize the envirome’s potential to improve quality of life, Dr. Schneider and his associates systematically integrated the principles of Maharishi Vastu architecture (MVA) into a comprehensive building system. MVA is “a holistic wellness architectural system that aligns buildings with nature’s intelligence, creating balanced, orderly, and integrated living environments with the goal of improving occupants’ lives,” the university explained in a written statement.
Since “modern medicine now recognizes the powerful effects of the ‘envirome’ on health,” Dr. Schneider said in that statement, the researchers reviewed 40 years’ worth of published studies on MVA’s benefits – an analysis that appears in Global Advances in Health and Medicine.
As far as our homes are concerned, here are some of the things MVA says we should be doing:
- The headboard of a bed should be oriented to the east or south when you sleep. This will improve mental health.
- While sitting at a desk or work area, a person should face east or north to improve brain coherence.
- The main entrance of a house should face east because morning light is superior to afternoon light.
And you were worried about feng shui. Well, forget feng shui. Feng shui is for amateurs. MVA is the way to go. MVA is the GOAT. MAHARISHI RULES!
Fecal matter may be in the fountain of youth
Yes, you read that headline correctly. New research by scientists at Quadram Institute and the University of East Anglia, both in Norwich, England, supports the claim that transferring fecal microbes might actually have some positive effects on reversing the aging process in the eyes, brain, and gut.
How do they know? Mice, of course. In the study, scientists took the gut microbes from older mice and transferred them into the younger mince. The young mice displayed inflamed signs of aging in their guts, brains, and eyes, which, we all know, decline in function as we age. What happens is a chronic inflammation of cells as we get older that can be found in the brain or gut that leads to a degenerative state over time.
When the older mice received the gut microbes from younger mice, the investigators saw the reverse: Gut, brain, and eye functionality improved. In a way, minimizing the inflammation.
There’s tons of research out there that suggests gut health is the key to a healthy life, but this study points directly to an improvement in brain and vision functionality as a result of the transfer.
Now, we’re not insinuating you get a poo transfer as you reach old age. And the shift to human studies on microbiota replacement therapy is still in the works. But this definitely is a topic to watch and could be a game changer in the age-old quest to bottle youth or at least improve quality of life as we age.
For now, the scientists did find some connections between the beneficial bacteria in the transplants and the human diet that could have similar effects, like changes in the metabolism of certain fats and vitamin that could have effects on the inflammatory cells in the eye and brain.
The more you know!
It’s not lying, it’s preemptive truth
Lying is bad. Bold statement, we know, but a true one. After all, God spent an entire commandment telling people not to do the whole bearing false witness thing, and God is generally known for not joking around. He’s a pretty serious dude.
In case you’ve been wandering around the desert for a while and haven’t had wifi, we have a bit of a misinformation problem these days. People lie all the time about a lot of things, and a lot of people believe the lies. According to new research, however, there are also a lot of people who recognize the lies but accept them anyway because they believe that the lies will become true in the future.
Imagine the following scenario: A friend gets a job he’s not qualified for because he listed a skill he doesn’t have. That’s bad, right? And the people the researchers interviewed agreed, at least initially. But when informed that our friend is planning on obtaining the skill in summer classes in the near future, the study participants became far more willing to excuse the initial lie.
A friend jumping the gun on training he doesn’t have yet is fairly innocuous as far as lying goes, but as the researchers found, this willingness to forgive lies because they could become true extends far further. For example, millions of people do not vote illegally in U.S. elections, nor do White people get approved for mortgages at rates 300% higher than minorities, but when asked to imagine scenarios in which those statements could be true, study participants were less likely to condemn the lie and prevent it from spreading further, especially if their political viewpoints aligned with the respective falsehood.
It seems, then, that while we may aspire to not tell lies, we take after another guy with magic powers who spent too much time in the desert: “What I told you was true, from a certain point of view.”
It tastes like feng shui, but it’s not
You know about biomes. You’ve read about various microbiomes. Allow us to introduce you to the envirome,
The envirome “includes all the natural and man-made elements of our environment throughout the lifespan, notably the built environment,” said Robert Schneider, dean of the College of Integrative Medicine at Maharishi International University. Located in – you guessed it – Fairfield, Iowa, and home of the Fighting Transcendentalists. MAHARISHI RULES!
[Editor’s note: You made that up, right? Well, it really is in Iowa, but they don’t seem to have an athletic program.]
In an effort to maximize the envirome’s potential to improve quality of life, Dr. Schneider and his associates systematically integrated the principles of Maharishi Vastu architecture (MVA) into a comprehensive building system. MVA is “a holistic wellness architectural system that aligns buildings with nature’s intelligence, creating balanced, orderly, and integrated living environments with the goal of improving occupants’ lives,” the university explained in a written statement.
Since “modern medicine now recognizes the powerful effects of the ‘envirome’ on health,” Dr. Schneider said in that statement, the researchers reviewed 40 years’ worth of published studies on MVA’s benefits – an analysis that appears in Global Advances in Health and Medicine.
As far as our homes are concerned, here are some of the things MVA says we should be doing:
- The headboard of a bed should be oriented to the east or south when you sleep. This will improve mental health.
- While sitting at a desk or work area, a person should face east or north to improve brain coherence.
- The main entrance of a house should face east because morning light is superior to afternoon light.
And you were worried about feng shui. Well, forget feng shui. Feng shui is for amateurs. MVA is the way to go. MVA is the GOAT. MAHARISHI RULES!
Clinical chest images power up survival prediction in lung cancer
In patients with stage I lung cancer, adding noncancerous features from CT chest imaging predicts overall survival better than clinical characteristics alone, according to a paper published online in the American Journal of Roentgenology.
Modeling that incorporates noncancerous imaging features captured on chest computed tomography (CT) along with clinical features, when calculated before stereotactic body radiation therapy (SBRT) is administered, improves survival prediction, compared with modeling that relies only on clinical features, the authors report.
“The focus of the study was to look at the environment in which the cancer lives,” said senior author Florian J. Fintelmann, MD, radiologist at Massachusetts General Hospital and associate professor of radiology at Harvard Medical School, both in Boston. “This is looking at parameters like the aortic diameter, body composition – that is, the quantification and characterization of adipose tissue and muscle – coronary artery calcifications, and emphysema quantification.”
CT images are used by radiation oncologists to determine where the radiation should be delivered. “There is more information from these images that we can utilize,” he said.
Survival estimates in patients with state I lung cancer now rely on biological age, ECOG (Eastern Cooperative Oncology Group) score, and the presence of comorbidities, Dr. Fintelmann said.
This retrospective investigation involved 282 patients with a median age of 75 years. There were 168 women and 114 men. All patients had stage I lung cancer and were treated with SBRT between January 2009 and June 2017.
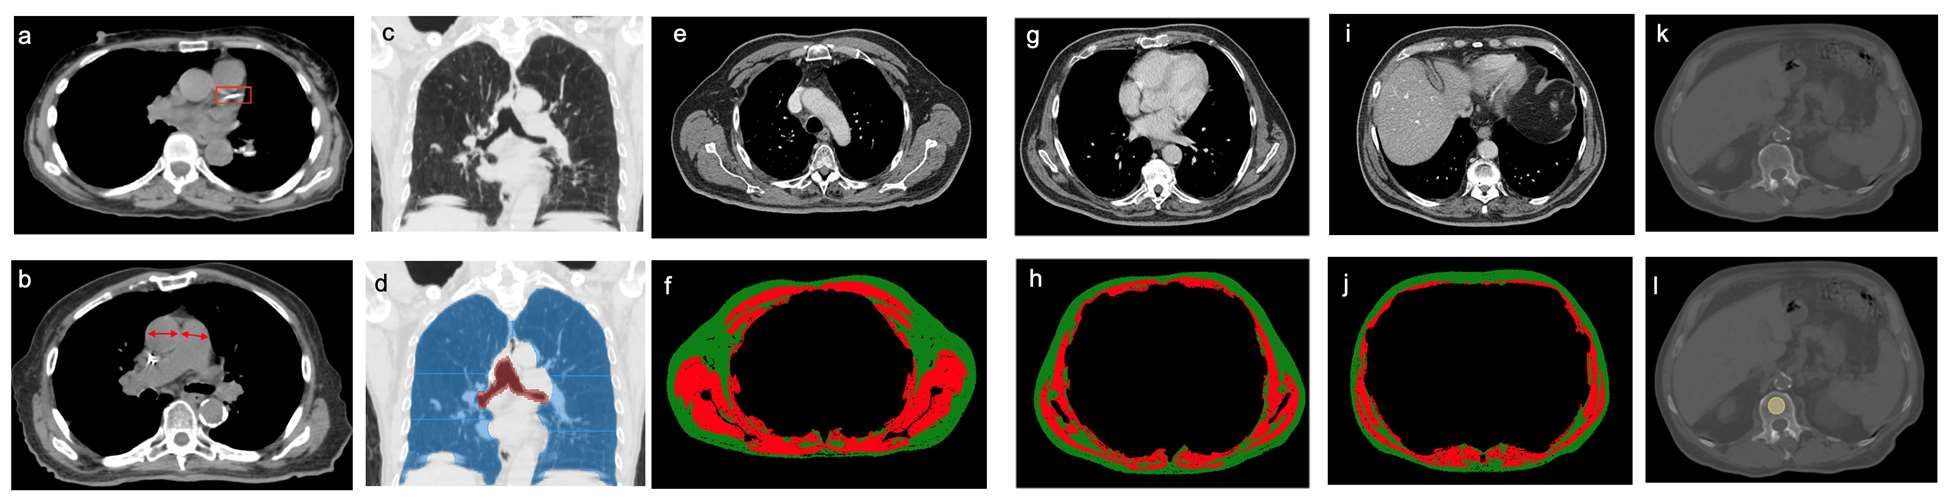
Investigators analyzed pre-treatment chest images with CT. They assessed coronary artery calcium (CAC) score (see above image), pulmonary artery (PA)-to-aorta ratio, emphysema, and several measures of body composition (skeletal muscle and adipose tissue). They developed a statistical model to link clinical and imaging features with overall survival.
An elevated CAC score (11-399: HR, 1.83 [95% confidence interval, 1.15-2.91]; ≥ 400: HR, 1.63 [95% CI, 1.01-2.63]), increased PA-to-aorta ratio (HR, 1.33 [95% CI, 1.16-1.52], per 0.1-unit increase) and decreased thoracic skeletal muscle (HR, 0.88 [95% CI, 0.79-0.98], per 10 cm2/m2 increase) were independently associated with shorter overall survival, investigators observed.
In addition, 5-year overall survival was superior for the model that included clinical and imaging features and inferior for the model restricted to only clinical features. Of all features, the one that emerged the most predictive of overall survival was PA-to-aorta ratio.
In this single-center study of stage I lung cancer patients who were undergoing SBRT, increased CAC score, increased PA-to-aorta ratio, and decreased thoracic skeletal muscle index were independently predictive of poorer overall survival.
“Our modeling shows that these imaging features add so much more [to predicting overall survival],” Dr. Fintelmann said. “The strength of this study is that we show the utility [of the model] and how it exceeds the clinical risk prediction that is currently standard of care. We think this will benefit patients in terms of being able to counsel them and better advise them on their medical decisions.”
This proof-of-concept investigation requires external validation, Dr. Fintelmann stressed. “External data for validation is the next step,” he said, noting he and co-investigators welcome data input from other investigators.
Elsie Nguyen, MD, FRCPC, FNASCI, associate professor of radiology, University of Toronto, responded by email that the study shows that imaging features supplement clinical data in predicting overall survival.
“This study demonstrates the value of extracting non–cancer related computed tomography imaging features to build a model that can better predict overall survival as compared to clinical parameters alone (such as age, performance status and co-morbidities) for stage I lung cancer patients treated with SBRT,” Dr. Nguyen wrote.
“Coronary artery calcium score, pulmonary artery-to-aorta ratio, and sarcopenia independently predicted overall survival,” she wrote. “These results are not surprising, as the prognostic value of each of these imaging features has already been established in the literature.”
Dr. Nguyen pointed out the power in the sum of these imaging features to predict overall survival.
“However, the results of this study demonstrate promising results supportive of the notion that combining clinical and imaging data points can help build a more accurate prediction model for overall survival,” she wrote. “This is analogous to the Brock University (in St. Catharines, Ontario) calculator for solitary pulmonary nodules that calculates malignancy risk based on both clinical and imaging data points. However, external validation of these study results at other centers is first required.”
Dr. Fintelmann and Dr. Nguyen have disclosed no relevant financial relationships.
A version of this article first appeared on Medscape.com.
In patients with stage I lung cancer, adding noncancerous features from CT chest imaging predicts overall survival better than clinical characteristics alone, according to a paper published online in the American Journal of Roentgenology.
Modeling that incorporates noncancerous imaging features captured on chest computed tomography (CT) along with clinical features, when calculated before stereotactic body radiation therapy (SBRT) is administered, improves survival prediction, compared with modeling that relies only on clinical features, the authors report.
“The focus of the study was to look at the environment in which the cancer lives,” said senior author Florian J. Fintelmann, MD, radiologist at Massachusetts General Hospital and associate professor of radiology at Harvard Medical School, both in Boston. “This is looking at parameters like the aortic diameter, body composition – that is, the quantification and characterization of adipose tissue and muscle – coronary artery calcifications, and emphysema quantification.”
CT images are used by radiation oncologists to determine where the radiation should be delivered. “There is more information from these images that we can utilize,” he said.
Survival estimates in patients with state I lung cancer now rely on biological age, ECOG (Eastern Cooperative Oncology Group) score, and the presence of comorbidities, Dr. Fintelmann said.
This retrospective investigation involved 282 patients with a median age of 75 years. There were 168 women and 114 men. All patients had stage I lung cancer and were treated with SBRT between January 2009 and June 2017.
Investigators analyzed pre-treatment chest images with CT. They assessed coronary artery calcium (CAC) score (see above image), pulmonary artery (PA)-to-aorta ratio, emphysema, and several measures of body composition (skeletal muscle and adipose tissue). They developed a statistical model to link clinical and imaging features with overall survival.
An elevated CAC score (11-399: HR, 1.83 [95% confidence interval, 1.15-2.91]; ≥ 400: HR, 1.63 [95% CI, 1.01-2.63]), increased PA-to-aorta ratio (HR, 1.33 [95% CI, 1.16-1.52], per 0.1-unit increase) and decreased thoracic skeletal muscle (HR, 0.88 [95% CI, 0.79-0.98], per 10 cm2/m2 increase) were independently associated with shorter overall survival, investigators observed.
In addition, 5-year overall survival was superior for the model that included clinical and imaging features and inferior for the model restricted to only clinical features. Of all features, the one that emerged the most predictive of overall survival was PA-to-aorta ratio.
In this single-center study of stage I lung cancer patients who were undergoing SBRT, increased CAC score, increased PA-to-aorta ratio, and decreased thoracic skeletal muscle index were independently predictive of poorer overall survival.
“Our modeling shows that these imaging features add so much more [to predicting overall survival],” Dr. Fintelmann said. “The strength of this study is that we show the utility [of the model] and how it exceeds the clinical risk prediction that is currently standard of care. We think this will benefit patients in terms of being able to counsel them and better advise them on their medical decisions.”
This proof-of-concept investigation requires external validation, Dr. Fintelmann stressed. “External data for validation is the next step,” he said, noting he and co-investigators welcome data input from other investigators.
Elsie Nguyen, MD, FRCPC, FNASCI, associate professor of radiology, University of Toronto, responded by email that the study shows that imaging features supplement clinical data in predicting overall survival.
“This study demonstrates the value of extracting non–cancer related computed tomography imaging features to build a model that can better predict overall survival as compared to clinical parameters alone (such as age, performance status and co-morbidities) for stage I lung cancer patients treated with SBRT,” Dr. Nguyen wrote.
“Coronary artery calcium score, pulmonary artery-to-aorta ratio, and sarcopenia independently predicted overall survival,” she wrote. “These results are not surprising, as the prognostic value of each of these imaging features has already been established in the literature.”
Dr. Nguyen pointed out the power in the sum of these imaging features to predict overall survival.
“However, the results of this study demonstrate promising results supportive of the notion that combining clinical and imaging data points can help build a more accurate prediction model for overall survival,” she wrote. “This is analogous to the Brock University (in St. Catharines, Ontario) calculator for solitary pulmonary nodules that calculates malignancy risk based on both clinical and imaging data points. However, external validation of these study results at other centers is first required.”
Dr. Fintelmann and Dr. Nguyen have disclosed no relevant financial relationships.
A version of this article first appeared on Medscape.com.
Seven hours of sleep is ideal for middle aged and older
Sleep disturbances are common in older age, and previous studies have shown associations between too much or too little sleep and increased risk of cognitive decline, but the ideal amount of sleep for preserving mental health has not been well described, according to the authors of the new paper.
In the study published in Nature Aging, the team of researchers from China and the United Kingdom reviewed data from the UK Biobank, a national database of individuals in the United Kingdom that includes cognitive assessments, mental health questionnaires, and brain imaging data, as well as genetic information.
Sleep is important for physical and psychological health, and also serves a neuroprotective function by clearing waste products from the brain, lead author Yuzhu Li of Fudan University, Shanghai, China, and colleagues wrote.
The study population included 498,277 participants, aged 38-73 years, who completed touchscreen questionnaires about sleep duration between 2006 and 2010. The average age at baseline was 56.5 years, 54% were female, and the mean sleep duration was 7.15 hours.
The researchers also reviewed brain imaging data and genetic data from 39,692 participants in 2014 to examine the relationships between sleep duration and brain structure and between sleep duration and genetic risk. In addition, 156,884 participants completed an online follow-up mental health questionnaire in 2016-2017 to assess the longitudinal impact of sleep on mental health.
Both excessive and insufficient sleep was associated with impaired cognitive performance, evidenced by the U-shaped curve found by the researchers in their data analysis, which used quadratic associations.
Specific cognitive functions including pair matching, trail making, prospective memory, and reaction time were significantly impaired with too much or too little sleep, the researchers said. “This demonstrated the positive association of both insufficient and excessive sleep duration with inferior performance on cognitive tasks.”
When the researchers analyzed the association between sleep duration and mental health, sleep duration also showed a U-shaped association with symptoms of anxiety, depression, mental distress, mania, and self-harm, while well-being showed an inverted U-shape. All associations between sleep duration and mental health were statistically significant after controlling for confounding variables (P < .001).
On further analysis (using two-line tests), the researchers determined that consistent sleep duration of approximately 7 hours per night was optimal for cognitive performance and for good mental health.
The researchers also used neuroimaging data to examine the relationship between sleep duration and brain structure. Overall, greater changes were seen in the regions of the brain involved in cognitive processing and memory.
“The most significant cortical volumes nonlinearly associated with sleep duration included the precentral cortex, the superior frontal gyrus, the lateral orbitofrontal cortex, the pars orbitalis, the frontal pole, and the middle temporal cortex,” the researchers wrote (P < .05 for all).
The association between sleep duration and cognitive function diminished among individuals older than 65 years, compared with those aged approximately 40 years, which suggests that optimal sleep duration may be more beneficial in middle age, the researchers noted. However, no similar impact of age was seen for mental health. For brain structure, the nonlinear relationship between sleep duration and cortical volumes was greatest in those aged 44-59 years, and gradually flattened with older age.
Research supports sleep discussions with patients
“Primary care physicians can use this study in their discussions with middle-aged and older patients to recommend optimal sleep duration and measures to achieve this sleep target,” Noel Deep, MD, a general internist in group practice in Antigo, Wisc., who was not involved in the study, said in an interview.

“This study is important because it demonstrated that both inadequate and excessive sleep patterns were associated with cognitive and mental health changes,” said Dr. Deep. “It supported previous observations of cognitive decline and mental health disorders being linked to disturbed sleep. But this study was unique because it provides data supporting an optimal sleep duration of 7 hours and the ill effects of both insufficient and excessive sleep duration.
“The usual thought process has been to assume that older individuals may not require as much sleep as the younger individuals, but this study supports an optimal time duration of sleep of 7 hours that benefits the older individuals. It was also interesting to note the mental health effects caused by the inadequate and excessive sleep durations,” he added.
As for additional research, “I would like to look into the quality of the sleep, in addition to the duration of sleep,” said Dr. Deep. For example, whether the excessive sleep was caused by poor quality sleep or fragmented sleep leading to the structural and subsequent cognitive decline.
Study limitations
“The current study relied on self-reporting of the sleep duration and was not observed and recorded data,” Dr. Deep noted. “It would also be beneficial to not only rely on healthy volunteers reporting the sleep duration, but also obtain sleep data from individuals with known brain disorders.”
The study findings were limited by several other factors, including the use of total sleep duration only, without other measures of sleep hygiene, the researchers noted. More research is needed to investigate the mechanisms driving the association between too much and not enough sleep and poor mental health and cognitive function.
The study was supported by the National Key R&D Program of China, the Shanghai Municipal Science and Technology Major Project, the Shanghai Center for Brain Science and Brain-Inspired Technology, the 111 Project, the National Natural Sciences Foundation of China and the Shanghai Rising Star Program.
The researchers had no financial conflicts to disclose. Dr. Deep had no financial conflicts to disclose, but serves on the editorial advisory board of Internal Medicine News.
Sleep disturbances are common in older age, and previous studies have shown associations between too much or too little sleep and increased risk of cognitive decline, but the ideal amount of sleep for preserving mental health has not been well described, according to the authors of the new paper.
In the study published in Nature Aging, the team of researchers from China and the United Kingdom reviewed data from the UK Biobank, a national database of individuals in the United Kingdom that includes cognitive assessments, mental health questionnaires, and brain imaging data, as well as genetic information.
Sleep is important for physical and psychological health, and also serves a neuroprotective function by clearing waste products from the brain, lead author Yuzhu Li of Fudan University, Shanghai, China, and colleagues wrote.
The study population included 498,277 participants, aged 38-73 years, who completed touchscreen questionnaires about sleep duration between 2006 and 2010. The average age at baseline was 56.5 years, 54% were female, and the mean sleep duration was 7.15 hours.
The researchers also reviewed brain imaging data and genetic data from 39,692 participants in 2014 to examine the relationships between sleep duration and brain structure and between sleep duration and genetic risk. In addition, 156,884 participants completed an online follow-up mental health questionnaire in 2016-2017 to assess the longitudinal impact of sleep on mental health.
Both excessive and insufficient sleep was associated with impaired cognitive performance, evidenced by the U-shaped curve found by the researchers in their data analysis, which used quadratic associations.
Specific cognitive functions including pair matching, trail making, prospective memory, and reaction time were significantly impaired with too much or too little sleep, the researchers said. “This demonstrated the positive association of both insufficient and excessive sleep duration with inferior performance on cognitive tasks.”
When the researchers analyzed the association between sleep duration and mental health, sleep duration also showed a U-shaped association with symptoms of anxiety, depression, mental distress, mania, and self-harm, while well-being showed an inverted U-shape. All associations between sleep duration and mental health were statistically significant after controlling for confounding variables (P < .001).
On further analysis (using two-line tests), the researchers determined that consistent sleep duration of approximately 7 hours per night was optimal for cognitive performance and for good mental health.
The researchers also used neuroimaging data to examine the relationship between sleep duration and brain structure. Overall, greater changes were seen in the regions of the brain involved in cognitive processing and memory.
“The most significant cortical volumes nonlinearly associated with sleep duration included the precentral cortex, the superior frontal gyrus, the lateral orbitofrontal cortex, the pars orbitalis, the frontal pole, and the middle temporal cortex,” the researchers wrote (P < .05 for all).
The association between sleep duration and cognitive function diminished among individuals older than 65 years, compared with those aged approximately 40 years, which suggests that optimal sleep duration may be more beneficial in middle age, the researchers noted. However, no similar impact of age was seen for mental health. For brain structure, the nonlinear relationship between sleep duration and cortical volumes was greatest in those aged 44-59 years, and gradually flattened with older age.
Research supports sleep discussions with patients
“Primary care physicians can use this study in their discussions with middle-aged and older patients to recommend optimal sleep duration and measures to achieve this sleep target,” Noel Deep, MD, a general internist in group practice in Antigo, Wisc., who was not involved in the study, said in an interview.
“This study is important because it demonstrated that both inadequate and excessive sleep patterns were associated with cognitive and mental health changes,” said Dr. Deep. “It supported previous observations of cognitive decline and mental health disorders being linked to disturbed sleep. But this study was unique because it provides data supporting an optimal sleep duration of 7 hours and the ill effects of both insufficient and excessive sleep duration.
“The usual thought process has been to assume that older individuals may not require as much sleep as the younger individuals, but this study supports an optimal time duration of sleep of 7 hours that benefits the older individuals. It was also interesting to note the mental health effects caused by the inadequate and excessive sleep durations,” he added.
As for additional research, “I would like to look into the quality of the sleep, in addition to the duration of sleep,” said Dr. Deep. For example, whether the excessive sleep was caused by poor quality sleep or fragmented sleep leading to the structural and subsequent cognitive decline.
Study limitations
“The current study relied on self-reporting of the sleep duration and was not observed and recorded data,” Dr. Deep noted. “It would also be beneficial to not only rely on healthy volunteers reporting the sleep duration, but also obtain sleep data from individuals with known brain disorders.”
The study findings were limited by several other factors, including the use of total sleep duration only, without other measures of sleep hygiene, the researchers noted. More research is needed to investigate the mechanisms driving the association between too much and not enough sleep and poor mental health and cognitive function.
The study was supported by the National Key R&D Program of China, the Shanghai Municipal Science and Technology Major Project, the Shanghai Center for Brain Science and Brain-Inspired Technology, the 111 Project, the National Natural Sciences Foundation of China and the Shanghai Rising Star Program.
The researchers had no financial conflicts to disclose. Dr. Deep had no financial conflicts to disclose, but serves on the editorial advisory board of Internal Medicine News.
FROM NATURE AGING
Severe COVID-19 adds 20 years of cognitive aging: Study
adding that the impairment is “equivalent to losing 10 IQ points.”
In their study, published in eClinicalMedicine, a team of scientists from the University of Cambridge and Imperial College London said there is growing evidence that COVID-19 can cause lasting cognitive and mental health problems. Patients report fatigue, “brain fog,” problems recalling words, sleep disturbances, anxiety, and even posttraumatic stress disorder months after infection.
The researchers analyzed data from 46 individuals who received critical care for COVID-19 at Addenbrooke’s Hospital between March and July 2020 (27 females, 19 males, mean age 51 years, 16 of whom had mechanical ventilation) and were recruited to the NIHR COVID-19 BioResource project.
At an average of 6 months after acute COVID-19 illness, the study participants underwent detailed computerized cognitive tests via the Cognitron platform, comprising eight tasks deployed on an iPad measuring mental function such as memory, attention, and reasoning. Also assessed were anxiety, depression, and posttraumatic stress disorder via standard mood, anxiety, and posttraumatic stress scales – specifically the Generalized Anxiety Disorder 7 (GAD-7), the Patient Health Questionnaire 9 (PHQ-9), and the PTSD Checklist for Diagnostic and Statistical Manual of Mental Disorders 5 (PCL-5). Their data were compared against 460 controls – matched for age, sex, education, and first language – and the pattern of deficits across tasks was qualitatively compared with normal age-related decline and early-stage dementia.
Less accurate and slower response times
The authors highlighted how this was the first time a “rigorous assessment and comparison” had been carried out in relation to the after-effects of severe COVID-19.
“Cognitive impairment is common to a wide range of neurological disorders, including dementia, and even routine aging, but the patterns we saw – the cognitive ‘fingerprint’ of COVID-19 – was distinct from all of these,” said David Menon, MD, division of anesthesia at the University of Cambridge, England, and the study’s senior author.
The scientists found that COVID-19 survivors were less accurate and had slower response times than the control population, and added that survivors scored particularly poorly on verbal analogical reasoning and showed slower processing speeds.
Critically, the scale of the cognitive deficits correlated with acute illness severity, but not fatigue or mental health status at the time of cognitive assessment, said the authors.
Recovery ‘at best gradual’
The effects were strongest for those with more severe acute illness, and who required mechanical ventilation, said the authors, who found that acute illness severity was “better at predicting the cognitive deficits.”
The authors pointed out how these deficits were still detectable when patients were followed up 6 months later, and that, although patients’ scores and reaction times began to improve over time, any recovery was “at best gradual” and likely to be influenced by factors such as illness severity and its neurological or psychological impacts.
“We followed some patients up as late as 10 months after their acute infection, so were able to see a very slow improvement,” Dr. Menon said. He explained how, while this improvement was not statistically significant, it was “at least heading in the right direction.”
However, he warned it is very possible that some of these individuals “will never fully recover.”
The cognitive deficits observed may be due to several factors in combination, said the authors, including inadequate oxygen or blood supply to the brain, blockage of large or small blood vessels due to clotting, and microscopic bleeds. They highlighted how the most important mechanism, however, may be “damage caused by the body’s own inflammatory response and immune system.”
Adam Hampshire, PhD, of the department of brain sciences at Imperial College London, one of the study’s authors, described how around 40,000 people have been through intensive care with COVID-19 in England alone, with many more despite having been very sick not admitted to hospital. This means there is a “large number of people out there still experiencing problems with cognition many months later,” he said. “We urgently need to look at what can be done to help these people.”
A version of this article first appeared on Univadis.
FROM ECLINICAL MEDICINE
When it’s not long, but medium COVID?
Symptom timelines surrounding COVID infection tend to center on either the immediate 5-day quarantine protocols for acute infection or the long-COVID symptoms that can last a month or potentially far longer.
People may return to work or daily routines, but something is off: What had been simple exercise regimens become onerous. Everyday tasks take more effort.
Does this ill-defined subset point to a “medium COVID?”
Farha Ikramuddin, MD, MHA, a physiatrist and rehabilitation specialist at the University of Minnesota and M Health Fairview in Minneapolis, points out there is no definition or diagnostic code or shared official understanding of a middle category for COVID.
“But am I seeing that? Absolutely,” she said in an interview.
“I have seen patients who are younger, healthier, [and] with not so many comorbidities have either persistence of symptoms or reappearance after the initial infection is done,” she said.
Some patients report they had very low infection or were nonsymptomatic and returned to their normal health fairly quickly after infection. Then a week later they began experiencing fatigue, lost appetite, loss of smell, and feeling full after a few bites, Dr. Ikramuddin said.
Part of the trouble in categorizing the space between returning to normal after a week and having symptoms for months is that organizations can’t agree on a timeline for when symptoms warrant a “long-COVID” label.
For instance, the Centers for Disease Control and Prevention defines it as 4 or more weeks after infection. The World Health Organization defines it as starting 3 months after COVID-19 symptom onset.
“I’m seeing ‘medium COVID’ – as one would call it – in younger and healthier patients. I’m also noticing that these symptoms are not severe enough to warrant stopping their job or changing their job schedules,” Dr. Ikramuddin said.
They go back to work, she said, but start noticing something is off.
“I am seeing that.”
“I discharge at least two patients a week from my clinic because they have moved on and no longer have symptoms,” Dr. Ikramuddin said.
In a story from Kaiser Health News published last month, WHYY health reporter Nina Feldman writes: “What I’ve come to think of as my ‘medium COVID’ affected my life. I couldn’t socialize much, drink, or stay up past 9:30 p.m. It took me 10 weeks to go for my first run – I’d been too afraid to try.”
She described a dinner with a friend after ending initial isolation protocols: “One glass of wine left me feeling like I’d had a whole bottle. I was bone-achingly exhausted but couldn’t sleep.”
Medical mystery
Dr. Ikramuddin notes the mechanism behind prolonged COVID-19 symptoms is still a medical mystery.
“In one scenario,” she said, “the question is being asked about whether the virus is staying dormant, similar to herpes zoster or HIV.”
“Right now, instead of getting more answers, we’re getting more questions,” Dr. Ikramuddin said.
Mouhib Naddour, MD, a pulmonary specialist with Sharp HealthCare in San Diego, said he’s seeing that it’s taking some patients who have had COVID longer to recover than it would for other viral infections.
Some patients fall between those recovering within 2-3 weeks and patients having long COVID. Those patients in the gap could be lumped into a middle-range COVID, he told this news organization.
“We try to put things into tables and boxes but it is hard with this disease,” Dr. Naddour said.
He agrees there’s no medical definition for “medium” COVID, but he said the idea should bring hope for patients to know that, if their symptoms are persisting they don’t necessarily have long COVID – and their symptoms may still disappear.
“This is an illness that may take longer to completely recover from,” he said. “The majority of patients we’re seeing in this group could be healthy young patients who get COVID, then 2-3 weeks after they test negative, still have lingering symptoms.”
Common symptoms
Some commonly reported symptoms of those with enduring illness, which often overlap with other stages of COVID, are difficulty breathing, chest tightness, dry cough, chest pain, muscle and joint pain, fatigue, difficulty sleeping, and mood swings, Dr. Naddour said.
“We need to do an extensive assessment to make sure there’s no other problem causing these symptoms,” he said.
Still, there is no set timeline for the medium-COVID range, he noted, so checking in with a primary care physician is important for people experiencing symptoms.
It’s a continuum, not a category
Fernando Carnavali, MD, coordinator for Mount Sinai’s Center for Post-COVID Care in New York, said he is not ready to recognize a separate category for a “medium” COVID.
He noted that science can’t even agree on a name for lasting post-COVID symptoms, whether it’s “long COVID” or “long-haul COVID,” “post-COVID syndrome” or “post-acute sequelae of COVID-19 (PASC ).” There’s no agreed-upon pathophysiology or biomarker.
“That creates these gaps of understanding on where we are,” Dr. Carnavali said in an interview.
He said he understands people’s need to categorize symptoms, but rather than a middle ground he sees a continuum.
It doesn’t mean what others may call COVID’s middle ground doesn’t exist, Dr. Carnavali said: “We are in the infancy of defining this. Trying to classify them may create more anxiety.”
The clinicians interviewed for this story report no relevant financial relationships.
A version of this article first appeared on Medscape.com.
New data confirm risk of Guillain-Barré with J&J COVID shot
The Janssen vaccine (Ad26.COV2.S) is a replication-incompetent adenoviral vector vaccine.
The data show no increased risk of GBS with the Pfizer (BNT162b2) or Moderna (mRNA-1273) shots – both mRNA vaccines.
“Our findings support the current guidance from U.S. health officials that preferentially recommend use of mRNA COVID-19 vaccines for primary and booster doses,” Nicola Klein, MD, PhD, with Kaiser Permanente Vaccine Study Center, Oakland, Calif., told this news organization.
“Individuals who choose to receive Janssen/J&J COVID-19 vaccine should be informed of the potential safety risks, including GBS,” Dr. Klein said.
The study was published online in JAMA Network Open.
Eleven cases
Between mid-December 2020 and mid-November 2021, roughly 15.1 million doses of COVID-19 vaccine were administered to nearly 7.9 million adults in the United States.
This includes roughly 483,000 doses of the Janssen vaccine, 8.8 million doses of the Pfizer vaccine, and 5.8 million doses of the Moderna vaccine.
The researchers confirmed 11 cases of GBS after the Janssen vaccine.
The unadjusted incidence of GBS (per 100,000 person-years) was 32.4 in the first 21 days after the Janssen vaccine – substantially higher than the expected background rate of 1 to 2 cases per 100,000 person-years.
There were 36 confirmed cases of GBS after mRNA vaccines. The unadjusted incidence in the first 21 days after mRNA vaccination was 1.3 per 100,000 person-years, similar to the overall expected background rate.
In an adjusted head-to-head comparison, GBS incidence during the 21 days after receipt of the Janssen vaccine was 20.6 times higher than the GBS incidence during the 21 days after the Pfizer or Moderna mRNA vaccines, amounting to 15.5 excess cases per million Janssen vaccine recipients.
Most cases of GBS after the Janssen vaccine occurred during the 1- to 21-day risk interval, with the period of greatest risk in the 1-14 days after vaccination.
The findings of this analysis of surveillance data of COVID-19 vaccines are “consistent with an elevated risk of GBS after primary Ad26.COV2.S vaccination,” the authors wrote.
Novel presentation?
The researchers note that nearly all individuals who developed GBS after the Janssen vaccine had facial weakness or paralysis, in addition to weakness and decreased reflexes in the limbs, suggesting that the presentation of GBS after COVID-19 adenoviral vector vaccine may be novel.
“More research is needed to determine if the presentation of GBS after adenoviral vector vaccine differs from GBS after other exposures such as Campylobacter jejuni, and to investigate the mechanism for how adenoviral vector vaccines may cause GBS,” Dr. Klein and colleagues said.
“The Vaccine Safety Datalink continues to conduct safety surveillance for all COVID-19 vaccines, including monitoring for GBS and other serious health outcomes after vaccination,” Dr. Klein said in an interview.
This study was supported by the Centers for Disease Control and Prevention. Dr. Klein reported receiving grants from Pfizer research support for a COVID vaccine clinical trial as well as other unrelated studies, grants from Merck, grants from GlaxoSmithKline, grants from Sanofi Pasteur, and grants from Protein Science (now Sanofi Pasteur) outside the submitted work.
A version of this article first appeared on Medscape.com.
FROM JAMA NETWORK OPEN
Children and COVID: New cases up for third straight week
Moderna submitted a request to the Food and Drug administration for emergency use authorization of its COVID-19 vaccine in children under the age of 6 years, according to this news organization, and Pfizer/BioNTech officially applied for authorization of a booster dose in children aged 5-11, the companies announced.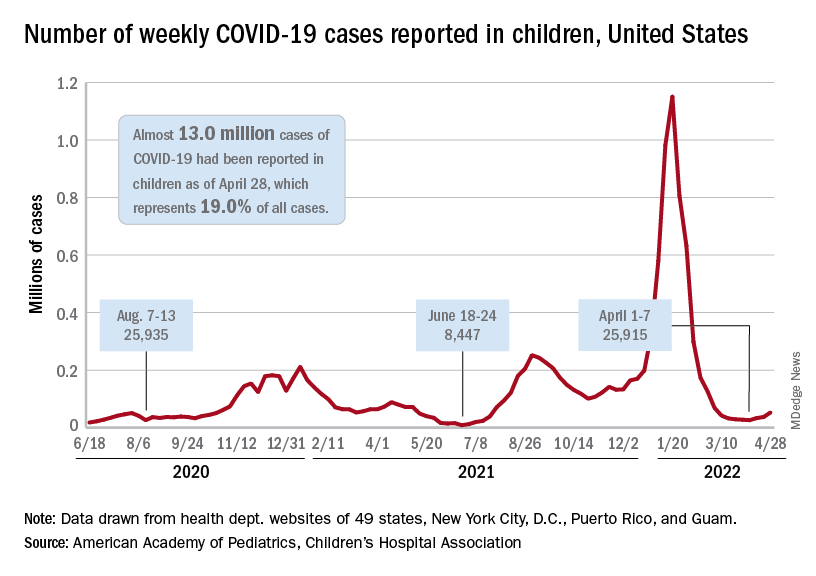
The FDA has tentatively scheduled meetings of its Vaccines and Related Biological Products Advisory Committee in June to consider the applications, saying that it “understands the urgency to authorize a vaccine for age groups who are not currently eligible for vaccination and will work diligently to complete our evaluation of the data. Should any of the submissions be completed in a timely manner and the data support a clear path forward following our evaluation, the FDA will act quickly” to convene the necessary meetings.
The need for greater access to vaccines seems to be increasing, as new pediatric COVID cases rose for the third consecutive week. April 22-28 saw over 53,000 new cases reported in children, up 43.5% from the previous week and up 105% since cases started rising again after dipping under 26,000 during the week of April 1-7, based on data from the American Academy of Pediatrics and the Children’s Hospital Association.
Hospital admissions involving diagnosed COVID also ticked up over the latter half of April, although the most recent 7-day average (April 24-30) of 112 per day was lower than the 117 reported for the previous week (April 17-23), the Centers for Disease Control and Prevention said, also noting that figures for the latest week “should be interpreted with caution.”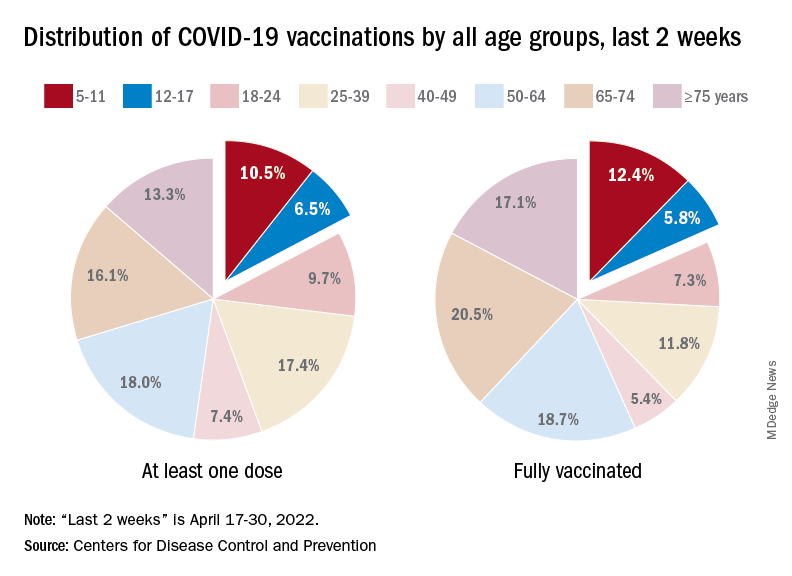
Vaccinations also were up slightly in children aged 5-11 years, with 52,000 receiving their first dose during the week of April 21-27, compared with 48,000 the week before. There was a slight dip, however, among 12- to 17-year-olds, who received 34,000 first doses during April 21-27, versus 35,000 the previous week, the AAP said in a separate report.
Cumulatively, almost 69% of all children aged 12-17 years have received at least one dose of the COVID-19 vaccine and 59% are fully vaccinated. Those aged 5-11 are well short of those figures, with just over 35% having received at least one dose and 28.5% fully vaccinated, the CDC said on its COVID Data Tracker.
A look at recent activity shows that children are not gaining on adults, who are much more likely to be vaccinated – full vaccination in those aged 50-64, for example, is 80%. During the 2 weeks from April 17-30, the 5- to 11-year-olds represented 10.5% of those who had initiated a first dose and 12.4% of those who gained full-vaccination status, both of which were well below the oldest age groups, the CDC reported.
CDC reports first human case of H5 bird flu in the U.S.
A man who worked on a commercial poultry farm in Colorado has tested positive for avian influenza A(H5) virus, better known as H5 bird flu, the CDC announced on April 28.
This is the first case of H5 bird flu in humans in the United States and only the second case in the world, the CDC said in a news release. The first case was detected last December in a man who raised birds in the United Kingdom. That man had no symptoms.
The only symptom the man in Colorado reported was fatigue, the Colorado Department of Public Health and Environment (CDPHE) reported. He has recovered and is isolating and being treated with oseltamivir, an antiviral drug.
The CDC said the man was helping kill poultry that likely had the H5N1 bird flu.
He is a state prison inmate who was working on a commercial poultry farm in Montrose County in a prerelease employment program, the CDPHE said. The flock he was working with has been euthanized, and the response team and other inmates working on the farm were given protective equipment, the CDPHE said.
“Repeat testing on the person was negative for influenza,” the department said. “Because the person was in close contact with infected poultry, the virus may have been in the person’s nose without causing infection.”
This CDC said the case does not change the risk of bird flu for the general public, which is considered low. People who work with birds should continue to take safety precautions, such as wearing gloves when handling birds and avoiding birds that appear to be dead or ill, the CDC said.
“We want to reassure Coloradans that the risk to them is low,” said Rachel Herlihy, MD, state epidemiologist with the CDPHE. “I am grateful for the seamless collaboration between CDC, Department of Corrections, Department of Agriculture, and CDPHE, as we continue to monitor this virus and protect all Coloradans.”
The federal government says the H5N1 virus has been found in commercial and backyard birds in 29 states and in wild birds in 34 states since the first cases were detected in late 2021.
The CDC says it has tracked the health of 2,500 people exposed to birds infected with H5N1 and only found one case of human infection, in Colorado.
A version of this article first appeared on WebMD.com.
FDA clears mavacamten (Camzyos) for obstructive hypertrophic cardiomyopathy
The U.S. Food and Drug Administration has approved mavacamten (Camzyos, Bristol Myers Squibb) to improve functional capacity and symptoms in adults with symptomatic New York Heart Association (NYHA) class II-III obstructive hypertrophic cardiomyopathy (oHCM).
Mavacamten is the first FDA-approved allosteric and reversible inhibitor selective for cardiac myosin that targets the underlying pathophysiology of the genetic disorder. It’s available in 2.5-mg, 5-mg, 10-mg, and 15-mg capsules.
“The approval of Camzyos represents a significant milestone for appropriate symptomatic obstructive HCM patients and their families, who have long awaited a new treatment option for this chronic and progressive disease,” Anjali T. Owens, MD, medical director of the Center for Inherited Cardiac Disease and assistant professor of medicine, University of Pennsylvania, Philadelphia, said in a news release.
‘Revolutionary’ change
The approval of mavacamten was based on data from the pivotal EXPLORER-HCM and EXPLORER-LTE (long-term extension) trial of adults with symptomatic NYHA class II-III oHCM.
In EXPLORER-HCM, treatment with mavacamten over 30 weeks led to significant improvement in exercise capacity, left ventricular outflow tract (LVOT) obstruction, NYHA functional class, and health status, as reported by this news organization.
The safety and efficacy findings seen at the end of the blinded, randomized, initial 30-week phase of EXPLORER-LTE were maintained in patients who continued treatment for a median of about 62 weeks.
Mavacamten represents “an almost revolutionary change” for the treatment of oHCM, Maya E. Guglin, MD, professor of clinical medicine and an advanced heart failure physician at Indiana University, Indianapolis, said during a press briefing earlier this month at the American College of Cardiology 2022 Scientific Session earlier this month.
“Until now, there was no good medical treatment for symptomatic oHCM. This will change the landscape, and without question it will change guidelines for treating oHCM,” Dr. Guglin said.
The product information for mavacamten includes a boxed warning citing a risk for heart failure.
Echocardiogram assessments of left ventricular ejection fraction (LVEF) are required before and during treatment.
Starting mavacamten in patients with LVEF below 55% is not recommended and the drug should be interrupted if LVEF falls below 50% at any visit or if the patient experiences heart failure symptoms or worsening clinical status.
Concomitant use of mavacamten with certain cytochrome P450 inhibitors or discontinuation of certain cytochrome P450 inducers can increase the risk for heart failure attributable to systolic dysfunction. Therefore, its use is contraindicated in patients using moderate to strong CYP2C19 inhibitors or strong CYP3A4 inhibitors, and moderate to strong CYP2C19 inducers or moderate to strong CYP3A4 inducers.
Because of the risk for heart failure attributable to systolic dysfunction, mavacamten is only available through the Camzyos Risk Evaluation and Mitigation Strategy (REMS) Program.
Full prescribing information is available online.
A version of this article first appeared on Medscape.com.
Inappropriate antibiotic use in U.S. hospitals increased during pandemic
LISBON – During the pandemic, critical and acute care hospitals with medium and high rates of antimicrobial resistance (AMR) showed significant increases in antibiotic prescriptions and longer durations of antibiotic treatment among all hospital admissions, and also in those patients who were bacterial culture negative, according to a large U.S.-based study.
The analysis across 271 U.S. hospitals also showed that AMR rates were significantly higher for pathogens during the pandemic period, compared with the prepandemic period in patients who were tested for SARS-CoV-2, and highest in SARS-CoV-2–positive patients.
More than a third of SARS-CoV-2–positive patients who were prescribed antibiotics were bacterial culture negative.
Findings of the study were presented by Vikas Gupta, PharmD, director of medical affairs at medical technology firm Becton Dickinson, at this year’s European Congress of Clinical Microbiology & Infectious Diseases. He conducted the study jointly with Karri Bauer, PharmD, from Merck Sharp & Dohme, Kenilworth, N.J., and colleagues.
“There are differences in AMR that go beyond COVID-positive admissions,” Dr. Gupta told this news organization. “There is opportunity for improvement especially with those hospitalized patients who had a negative culture result, or no culture collected.”
“We found a higher percentage of COVID-positive admissions that were prescribed antibacterial therapy even in those having [tested negative for bacteria] or no culture result,” said Dr. Gupta. “Our data also shows that the percentage of admissions with duration of antibacterial therapy over 3 days was significantly higher in COVID-positive but culture-negative/no culture patients, compared to other groups evaluated.”
Of all admissions prescribed antibiotics during the pandemic, 57.8% of SARS-CoV-2–positive patients were prescribed antibiotics whereas 88.1% of SARS-CoV-2–positive admissions were bacterial culture negative/no culture. Overall, prepandemic, 35% of admissions were prescribed antibiotics.
Duration of antibiotic therapy in the prepandemic era was an average of 3.5 days, compared with an average of 3.8 days overall in the pandemic and 5.7 days in patients who tested positive for SARS-CoV-2. Similarly, the percentage of patients who were bacterial culture negative or had no culture and received antibiotic therapy for more than 72 hours was 17.6% in the prepandemic era, compared with 19.2% overall in the pandemic era, and 41.1% in patients who tested positive for COVID-19.
Dr. Gupta and Dr. Bauer wanted to look at all patients admitted to hospitals segmented by SARS-CoV-2 positive, negative, and not tested, to get a sense of how much antibiotic use there was and how long patients were on antibiotics. “We ultimately want to optimize and not overuse antibiotics and prescribe them for right period of time,” said Dr. Gupta.
“To date, there has been no conclusive evidence about the suggestion that the pandemic has led to increased AMR rates, so we aimed to evaluate the pandemic’s impact on AMR and antibiotic use across U.S. hospitals,” he explained.
The multicenter, retrospective cohort analysis made use of BD’s infection surveillance platform (BD HealthSight Infection Advisor with MedMined Insights) and was conducted across 271 U.S. critical access/acute care facilities, representing approximately 10%-13% of U.S. hospital admissions. It included all hospitalized patients with more than 1 day of in-patient admission. Patients were considered SARS-CoV-2 positive by polymerase chain reaction test or antigen test either 7 days or less prior to or within 14 days of admission.
Patients were categorized as hospitalized during the “prepandemic” period (July 1, 2019 through February 29, 2020) and the “pandemic” period (March 1, 2020 through Oct. 30, 2021) and were stratified based on their SARS-CoV-2 result.
Investigators included all hospital admissions with an AMR event (first positive culture for select gram-negative or gram-positive pathogens that were reported as nonsusceptible across blood, urine, respiratory, intra-abdominal, skin/wound, and other sources).
The investigators calculated AMR rates at the patient-admission level and defined per 100 admissions. Also, they further evaluated AMR rates based on community onset (defined as culture collected ≤2 days from admission) or hospital onset (>2 days from admission). Finally, AMR rates were determined according to whether they related to prepandemic or pandemic periods.
Hospitals were also categorized according to their AMR rates as low (<25%), medium (25%-75%), and high (>75%).
Overall AMR rates were lower in the pandemic period, compared with the prepandemic period. However, reported Dr.Gupta, for hospital-onset pathogens specifically, AMR rates were significantly higher overall in the pandemic period and mostly driven by admissions tested for SARS-CoV-2 (whether positive or negative).
Hospitals with high AMR rates also tended to have more SARS-CoV-2 positive admissions (6.1% in high-AMR hospitals vs. 3% in low-AMR hospitals). The highest antibiotic-prescribing rates and highest duration of antibiotic use was also seen in those hospitals with highest AMR rates.
Of the SARS-CoV-2 patients who were bacterial culture negative/no culture and were prescribed antibiotics, 36.5% were in hospitals with a high AMR rate. “Roughly one-third of patients without culture evidence of a bacterial infection were prescribed antibiotics in hospitals with a high AMR rate,” said Dr. Gupta.
The researchers wanted to tease out whether hospitals with high, moderate, or low AMR rates look different with respect to antibiotic-prescribing patterns. During the pandemic period, they found that hospitals with high and medium AMR rates experienced significant increases in antibiotic prescriptions and longer durations. Prepandemic, the overall hospital-onset AMR rate was 0.8 per 100 admissions, whereas during the pandemic this rose to 1.4 per 100 admissions in high-AMR hospitals and dropped to 0.4 in low-AMR hospitals.
SARS-CoV-2–positive admission rates were higher in facilities with medium (5.6%) and high AMR (6.1%) rates than those with low (3%) AMR rates. “We found that those with medium and high AMR rates were more likely to have COVID-positive admissions than facilities with low AMR rates,” Dr. Gupta said. “It appears as if COVID is contributing to AMR in the facilities.”
Asked for independent comment, Jason C. Gallagher, PharmD, BCPS, clinical professor at Temple University School of Pharmacy in Philadelphia, said in an interview, “It is not surprising that there was more antimicrobial resistance in patients with COVID than those without. Even though antibiotics do not work for COVID, they are often prescribed, and antibiotic use is a major risk factor for antimicrobial resistance. This is likely because clinicians are sometimes concerned about coinfections with bacteria (which are rare) and because hospitalized patients with severe COVID can acquire other infections as they are treated.”
Antibiotic stewardship programs
Antibiotic stewardship programs have been highly stressed during the pandemic, so the researchers hope their data support the need for better antibiotic stewardship practices during pandemic surges when control is more challenging.
Dr. Gupta explained that they were seeing interesting associations that can inform antimicrobial stewardship programs and teams. “We are not trying to imply causality,” he stressed.
It is a common practice for stewardship teams to evaluate the need for continuation of antibiotic therapy at 3 days, especially in patients who are culture negative or did not have a culture collected.
“Antibiotic time-out at 3 days is a recommended practice to evaluate for continuing antibiotic therapy based on the patient’s condition and culture results,” he said. “This is what made our study unique because we wanted to look at what percentage of admissions were prescribed antibiotics beyond 3 days and compare to the prepandemic period.”
Session moderator Evangelos J. Giamarellos-Bourboulis, MD, PhD, an assistant professor of internal medicine and infectious diseases, University of Athens, Greece, thanked Dr. Gupta for his “eloquent presentation” and sought to clarify whether the data “refer to antimicrobial use that was empirical or whether use was in hospitals with high AMR rates, or whether the approach was driven through microbiology?”
Dr. Gupta replied that this was why they evaluated the negative-culture and no-culture patients. “We wanted to get a measure of antibacterial use in this population too,” he said. “Definitely, there is empirical therapy as well as definitive therapy, but I think the negative and no-culture group provide a reference point where we see similar signals and trends to that of the overall population.”
An audience member also addressed a question to Dr. Gupta: “Did you look at the patient population, because in many cases, during COVID, these patients may have been more severe than in the prepandemic period?”
Dr. Gupta replied: “In our manuscript we’ve done an analysis where we adjusted for patient-level facility and regional-level factors. There are definitely differences in the patient populations but overall, these are pretty sick patients when we look at the level of severity overall.”
Dr. Gupta is an employee of and a shareholder in Becton Dickinson. Dr. Bauer is an employee of and a shareholder in Merck. Dr. Gallagher consults for many pharmaceutical companies including Merck.
Dr. Giamarellos-Bourboulis disclosed honoraria (paid to the University of Athens) from Abbott CH, Brahms Thermo Fisher GMBH Germany, GlaxoSmithKline, and Sobi; serving as a consultant for Abbott CH, Fab’nTech, InflaRx GmbH, UCB, Sobi, and Xbiotech; research grants (paid to the Hellenic Institute for the Study of Sepsis) from Abbott CH, BioMerieux France, Johnson & Johnson, MSD, Sobi, Thermo Fisher Brahms GmbH; and EU research funding: Horizon 2020 ITN European Sepsis Academy (granted to the University of Athens); Horizon 2020 ImmunoSep and RISinCOVID (granted to the Hellenic Institute for the Study of Sepsis); Horizon Health EPIC-CROWN-2 (granted to the Hellenic Institute for the Study of Sepsis).
A version of this article first appeared on Medscape.com.