User login
Pediatric, adolescent migraine treatment and prevention guidelines are updated
Two new guidelines on the treatment and prevention of migraines in children and adolescents have been released by the American Academy of Neurology and the American Headache Society.
This update to the previous guidelines released by the American Academy of Neurology in 2004 reflects the expansion in pharmacologic and nonpharmacologic approaches during the last 15 years, Andrew D. Hershey, MD, PhD, director of the division of neurology at Cincinnati Children’s Hospital and a fellow of the American Academy of Neurology, said in an interview.
“There has also been an increase in the number of randomized controlled studies, which have allowed for a more robust statement on acute and preventive treatments to be made,” said Dr. Hershey, who is also a senior author for both guidelines.
The two reports focused on separate issues: One guideline outlined the options for treatment of acute migraine, and the second guideline summarized the available studies on the effectiveness of preventive medications for migraine in children and adolescents.
The guidelines recommend a physical examination and history to establish a specific headache diagnosis and afford a treatment that provides fast and complete pain relief. Treatment should be initiated as soon as a patient realizes an attack is occurring. Patients with signs of secondary headache should be evaluated by a neurologist or a headache specialist.
Studies support the use of ibuprofen and acetaminophen for pain relief in cases of acute migraine, but only some triptans (such as almotriptan, rizatriptan, sumatriptan/naproxen, and zolmitriptan nasal spray) are approved for use in adolescents. Specifically, sumatriptan/naproxen was shown to be effective when compared with placebo in studies with adolescents, whose headache symptoms resolved within 2 hours.
It may be necessary to try more than one triptan, the guidelines noted, because patients respond differently to medications. A failure to respond to one triptan does not necessarily mean that treatment with another triptan will be unsuccessful.
The guidelines also focused on patient and family education to improve medication safety and adherence. Lifestyle modification, avoidance of migraine triggers, creating good sleep habits, and staying hydrated can help reduce migraines. While no medications improved associated symptoms of migraines such as nausea or vomiting, triptans did show a benefit in reducing phonophobia and photophobia.
Evidence for pharmacologic prevention of migraines in children and adolescents is limited, according to the guidelines. In the 15 studies included in a literature review, there was not sufficient evidence to show preventive treatments, such as divalproex, onabotulinumtoxinA, amitriptyline, nimodipine, and flunarizine, were more effective than placebo at reducing the frequency of headaches. There was some evidence to show propranolol in children and topiramate and cinnarizine in children and adolescents can reduce headache frequency. Children and adolescents who received cognitive-behavioral therapy together with amitriptyline were more likely to have reduced frequency of headaches than were those who received amitriptyline with patient education.
“The consensus conclusion was that a multidisciplinary approach that combines acute treatments, preventive treatments, and healthy habits is likely to have the best outcomes,” said Dr. Hershey.
Dr. Hershey acknowledged the many gaps between what is clinically observed and what the studies in the guidelines demonstrated.
“One of the biggest questions is how to minimize the expectation response in the controlled studies,” he said. “Additionally, we are moving toward a better recognition of the mechanism by which the various treatments work in a genetic-based disease that is polygenic in nature” with up to 38 different gene polymorphisms identified to date.
The guidelines also do not address newer treatments, such as calcitonin gene–related peptide (CGRP) antibodies, CGRP antagonists, serotonin antagonists, and devices because there are as yet no studies of their effectiveness in children and adolescents.
“They have been studied in adults, so will be prone to the expectation response; but given the large number of diverse therapies, one can hope that many of the gaps can be filled,” said Dr. Hershey.
The American Academy of Neurology provided funding for development of the guidelines and reimbursed authors who served as subcommittee members for travel expenses and in-person meetings. The authors reported personal and institutional relationships in the form of advisory board memberships, investigator appointments, speakers bureau positions, research support, grants, honorariums, consultancies, and publishing royalties for pharmaceutical companies and other organizations.
SOURCES: Oskoui M et al. Neurology. 2019 Aug 14. doi: 10.1212/WNL.0000000000008095. Oskoui M et al. Neurology. 2019 Aug 14. doi: 10.1212/WNL.0000000000008105.
FROM NEUROLOGY
Zanubrutinib may be poised to challenge ibrutinib for CLL
The Bruton tyrosine kinase (BTK) inhibitor zanubrutinib appears safe and effective for patients with B-cell malignancies, according to results from a phase 1 trial.
Among patients with chronic lymphocytic leukemia (CLL) or small lymphocytic lymphoma (SLL), the overall response rate was 96.2%, reported Constantine Si Lun Tam, MD, of Peter MacCallum Cancer Centre in Melbourne and colleagues.
“Zanubrutinib (BGB-3111) is a highly specific next-generation BTK inhibitor with favorable oral bioavailability, as shown in preclinical studies,” the investigators wrote in Blood. “Compared with ibrutinib, zanubrutinib has shown greater selectivity for BTK and fewer off-target effects in multiple in vitro enzymatic and cell-based assays.”
The current, open-label trial involved 144 patients with B-cell malignancies. To determine optimal dosing, the investigators recruited 17 patients with relapsed/refractory B-cell malignancies who had received at least one prior therapy. The dose expansion part of the study assessed responses in multiple cohorts, including patients with CLL/SLL, mantle cell lymphoma, and Waldenström macroglobulinemia. The primary endpoints were safety and tolerability, including maximum tolerated dose. Efficacy findings were also reported.
During dose escalation, no dose-limiting toxicities were observed, so the highest dose – 320 mg once daily or 160 mg twice daily – was selected for further testing.
The investigators highlighted efficacy and safety findings from 94 patients with CLL/SLL who were involved in dose expansion. Although nearly one-quarter (23.4%) were treatment-naive, the median number of prior therapies was two, and some patients had high-risk features, such as adverse cytogenetics, including 19.1% with a TP53 mutation and 23.3% with a 17p deletion. After a median follow-up of 13.7 months, 94.7% of these patients were still undergoing treatment.
Out of the initial 94 patients with CLL/SLL, 78 were evaluable for efficacy. The overall response rate was 96.2%, including two (2.6%) complete responses, 63 (80.8%) partial responses, and 10 (12.8%) partial responses with lymphocytosis. The median progression-free survival had not been reached, and the 12-month estimated progression-free survival was 100%.
In regard to safety, the most common adverse events were contusion (35.1%), upper respiratory tract infection (33.0%), cough (25.5%), diarrhea (21.3%), fatigue (19.1%), back pain (14.9%), hematuria (14.9%), headache (13.8%), nausea (13.8%), rash (12.8%), arthralgia (11.7%), muscle spasms (11.7%), and urinary tract infection (10.6%).
A number of other adverse events were reported, although these occurred in less than 10% of patients.
More than one-third of patients (36.2%) experienced grade 3 or higher adverse events, with neutropenia being most common (6.4%), followed by pneumonia , hypertension, and anemia, which each occurred in 2.1% of patients, and less commonly, back pain, nausea, urinary tract infection, purpura, cellulitis, and squamous cell carcinoma of the skin, which each occurred in 1.1% of patients.
“In this first-in-human study, zanubrutinib demonstrated encouraging activity in patients with relapsed/refractory and treatment-naive CLL/SLL, with good tolerability,” the investigators concluded. “Two ongoing randomized studies of zanubrutinib versus ibrutinib (NCT03053440 and NCT03734016) aim to determine whether consistent, continuous BTK blockade with a selective inhibitor results in fewer off-target effects and translates into improvements in disease control.”
The study was funded by BeiGene USA, which is developing the drug. The investigators reported relationships with the study sponsor, as well as Janssen, Pharmacyclics, AbbVie, and others.
SOURCE: Tam CSL et al. Blood. 2019 Jul 24. doi: 10.1182/blood.2019001160.
FROM BLOOD
Two genetic variants modify risk of Alzheimer’s disease
according to research published online August 14 in Science Translational Medicine. The variants affect cerebrospinal fluid (CSF) concentrations of a soluble form of the TREM2 protein (sTREM2), which may be involved in Alzheimer’s disease pathology. “Increasing TREM2 or activating the TREM2 signaling pathway could offer a new therapeutic approach for treating Alzheimer’s disease,” wrote the researchers.

Yuetiva Deming, PhD, of the University of Wisconsin–Madison and colleagues conducted a genome-wide association study to identify genetic modifiers of CSF sTREM2. They analyzed CSF sTREM2 levels in 813 participants in the Alzheimer’s Disease Neuroimaging Initiative (ADNI). Of this population, 172 participants had Alzheimer’s disease, 169 were cognitively normal, 183 had early mild cognitive impairment (MCI), 221 had late MCI, and 68 had significant memory concerns.
The rs1582763 single-nucleotide polymorphism (SNP) on chromosome 11 within the MS4A gene region was significantly associated with increased CSF levels of sTREM2. Conditional analyses of the MS4A locus indicated that rs6591561, a missense variant within MS4A4A, was associated with reduced CSF sTREM2. Analyzing 580 additional CSF sTREM2 samples, along with associated genetic data, from six other studies replicated these findings in an independent dataset.
Furthermore, Dr. Deming and colleagues found that rs1582763 was associated with reduced risk for Alzheimer’s disease and older age at Alzheimer’s disease onset. In addition, rs6591561 was associated with increased risk of Alzheimer’s disease and earlier onset of Alzheimer’s disease.
Subsequent analyses showed that rs1582763 modified the expression of the MS4A4A and MS4A6A genes in various tissues. This finding suggests that one or both of these genes are important for influencing the production of sTREM2, wrote Dr. Deming and colleagues. Using human macrophages as a proxy for microglia, the investigators observed that the MS4A4A and TREM2 proteins colocalized on lipid rafts at the plasma membrane. In addition, sTREM2 concentrations increased with MS4A4A overexpression, and silencing of MS4A4A reduced sTREM2 production.
These findings “provide a putative biological connection between the MS4A family, TREM2, and Alzheimer’s disease risk,” wrote the researchers. The data also suggest that MS4A4A is a potential therapeutic target in Alzheimer’s disease. Understanding the role of sTREM2 in Alzheimer’s disease will require additional research, but it may be involved in pathogenesis, wrote Dr. Deming and colleagues.
One of the study’s limitations is that the investigators included only common variants and thus could not determine the effect of genes that only harbor low-frequency or rare functional variants. Another limitation is that the data cannot support conclusions about whether other genes in the MS4A locus also modulate sTREM2, wrote Dr. Deming and colleagues.
Grants from the National Institutes of Health supported this study. The investigators disclosed consulting and other relationships with various pharmaceutical companies.
SOURCE: Deming Y et al. Sci Transl Med. 2019 Aug 14. doi: 10.1126/scitranslmed.aau2291.
according to research published online August 14 in Science Translational Medicine. The variants affect cerebrospinal fluid (CSF) concentrations of a soluble form of the TREM2 protein (sTREM2), which may be involved in Alzheimer’s disease pathology. “Increasing TREM2 or activating the TREM2 signaling pathway could offer a new therapeutic approach for treating Alzheimer’s disease,” wrote the researchers.
Yuetiva Deming, PhD, of the University of Wisconsin–Madison and colleagues conducted a genome-wide association study to identify genetic modifiers of CSF sTREM2. They analyzed CSF sTREM2 levels in 813 participants in the Alzheimer’s Disease Neuroimaging Initiative (ADNI). Of this population, 172 participants had Alzheimer’s disease, 169 were cognitively normal, 183 had early mild cognitive impairment (MCI), 221 had late MCI, and 68 had significant memory concerns.
The rs1582763 single-nucleotide polymorphism (SNP) on chromosome 11 within the MS4A gene region was significantly associated with increased CSF levels of sTREM2. Conditional analyses of the MS4A locus indicated that rs6591561, a missense variant within MS4A4A, was associated with reduced CSF sTREM2. Analyzing 580 additional CSF sTREM2 samples, along with associated genetic data, from six other studies replicated these findings in an independent dataset.
Furthermore, Dr. Deming and colleagues found that rs1582763 was associated with reduced risk for Alzheimer’s disease and older age at Alzheimer’s disease onset. In addition, rs6591561 was associated with increased risk of Alzheimer’s disease and earlier onset of Alzheimer’s disease.
Subsequent analyses showed that rs1582763 modified the expression of the MS4A4A and MS4A6A genes in various tissues. This finding suggests that one or both of these genes are important for influencing the production of sTREM2, wrote Dr. Deming and colleagues. Using human macrophages as a proxy for microglia, the investigators observed that the MS4A4A and TREM2 proteins colocalized on lipid rafts at the plasma membrane. In addition, sTREM2 concentrations increased with MS4A4A overexpression, and silencing of MS4A4A reduced sTREM2 production.
These findings “provide a putative biological connection between the MS4A family, TREM2, and Alzheimer’s disease risk,” wrote the researchers. The data also suggest that MS4A4A is a potential therapeutic target in Alzheimer’s disease. Understanding the role of sTREM2 in Alzheimer’s disease will require additional research, but it may be involved in pathogenesis, wrote Dr. Deming and colleagues.
One of the study’s limitations is that the investigators included only common variants and thus could not determine the effect of genes that only harbor low-frequency or rare functional variants. Another limitation is that the data cannot support conclusions about whether other genes in the MS4A locus also modulate sTREM2, wrote Dr. Deming and colleagues.
Grants from the National Institutes of Health supported this study. The investigators disclosed consulting and other relationships with various pharmaceutical companies.
SOURCE: Deming Y et al. Sci Transl Med. 2019 Aug 14. doi: 10.1126/scitranslmed.aau2291.
FROM SCIENCE TRANSLATIONAL MEDICINE
Key clinical point: Two variants of MS4A are associated with the risk of Alzheimer’s disease.
Major finding: The rs1582763 SNP is associated with reduced risk for Alzheimer’s disease, and rs6591561 is associated with increased risk of Alzheimer’s disease.
Study details: A genome-wide association study of 813 participants in the Alzheimer’s Disease Neuroimaging Initiative.
Disclosures: Grants from the National Institutes of Health supported this study. The investigators disclosed consulting and other relationships with various pharmaceutical companies.
Source: Deming Y et al. Sci Transl Med. 2019 Aug 14. doi: 10.1126/scitranslmed.aau2291.
Serum neurofilament light chain level may indicate MS disease activity
according to an investigation published online August 12 in JAMA Neurology. Furthermore, changes in sNfL levels are associated with disability worsening, and sNfL levels may be influenced by treatment. These data support the potential of sNfL as an objective surrogate of ongoing MS disease activity, according to the researchers.
Neuronal and axonal loss increase levels of NfL in cerebrospinal fluid (CSF) in patients with MS. Previous research indicated that sNfL levels are correlated with CSF levels of NfL and are associated with clinical and imaging measures of disease activity. For the purpose of repeated sampling, collecting blood from patients would be more practical than performing lumbar punctures, said the investigators. No long-term studies of sNfL concentrations and their associations with MS disease outcomes had been performed, however.
Ester Cantó, PhD, of the University of California, San Francisco (UCSF), and colleagues examined data from the prospective Expression, Proteomics, Imaging, Clinical (EPIC) study to assess sNfL as a biomarker of MS disease activity and progression. The ongoing EPIC study is being conducted at UCSF. Dr. Cantó and colleagues analyzed data collected from July 1, 2004, through August 31, 2017, for 607 patients with MS. Participants underwent clinical examinations and serum sample collections annually for 5 years, then at various time points for as long as 12 years. The median follow-up duration was 10 years. The researchers measured sNfL levels with a sensitive single-molecule array platform and compared them with clinical and MRI variables using univariable and multivariable analyses. Dr. Cantó and colleagues chose disability progression, defined as clinically significant worsening on the Expanded Disability Status Scale (EDSS) score, and brain fraction atrophy as their primary outcomes.
The population’s mean age was 42.5 years. About 70% of participants were women, and all were of non-Hispanic European descent. At baseline, sNfL levels were significantly associated with EDSS score, MS subtype, and treatment status.
Dr. Cantó and colleagues found a significant interaction between EDSS worsening and change in levels of sNfL over time. Baseline sNfL levels were associated with approximately 11.6% of the variance in participants’ brain fraction atrophy at year 10. When the investigators controlled for sex, age, and disease duration, they found that baseline sNfL levels were associated with 18% of the variance in brain fraction atrophy at year 10. After 5 years’ follow-up, active treatment was associated with lower levels of sNfL. High-efficacy treatments were associated with greater decreases in sNfL levels, compared with platform therapies.
More frequent sample acquisition could provide greater detail about changes in sNfL levels, wrote Dr. Cantó and colleagues. They acknowledged that their study had insufficient power for the researchers to assess the outcomes of individual MS therapies. Other limitations included the lack of data on NfL stability and the lack of a group of healthy controls.
“For an individual patient, the biomarker prognostic power of sNfL level for clinical and MRI outcomes was limited,” said the investigators. “Further prospective studies are necessary to assess the assay’s utility for decision making in individual patients.”
The National Institutes of Health and the U.S. National MS Society supported the study. Several of the investigators received compensation from Novartis, which provided funds for the reagents needed for the single-molecule array assay.
SOURCE: Cantó E et al. JAMA Neurol. 2019 Aug. 12. doi: 10.1001/jamaneurol.2019.2137.
FROM JAMA NEUROLOGY
Key clinical point: Serum neurofilament light chain level has potential as a surrogate of ongoing MS disease activity.
Major finding: Serum neurofilament light chain level is associated with brain fraction atrophy.
Study details: An ongoing, prospective, observational study of 607 patients with MS.
Disclosures: The National Institutes of Health and the U.S. National MS Society supported the study. Several of the investigators received compensation from Novartis, which provided funds for the reagents needed for the single-molecule array assay.
Source: Cantó E et al. JAMA Neurol. 2019 Aug 12. doi: 10.1001/jamaneurol.2019.2137.
Fatal Drug-Resistant Invasive Pulmonary Aspergillus fumigatus in a 56-Year-Old Immunosuppressed Man (FULL)
Historically, aspergillosis in patients with hematopoietic stem cell transplantation (HSCT) has carried a high mortality rate. However, recent data demonstrate a dramatic improvement in outcomes for patients with HSCT: 90-day survival increased from 22% before 2000 to 45% over the past 15 years.1 Improved outcomes coincide with changes in transplant immunosuppression practices, use of cross-sectional imaging for early disease identification, galactomannan screening, and the development of novel treatment options.
Voriconazole is an azole drug that blocks the synthesis of ergosterol, a vital component of the cellular membrane of fungi. Voriconazole was approved in 2002 after a clinical trial demonstrated an improvement in 50% of patients with invasive aspergillosis in the voriconazole arm vs 30% in the amphotericin B arm at 12 weeks.2 Amphotericin B is a polyene antifungal drug that binds with ergosterol, creating leaks in the cell membrane that lead to cellular demise. Voriconazole quickly became the first-line therapy for invasive aspergillosis and is recommended by both the Infectious Disease Society of American (IDSA) and the European Conference on Infections in Leukemia.3
Case Presentation
A 55-year-old man with high-risk chronic myelogenous leukemia (CML) underwent a 10 of 10 human leukocyte antigen allele and antigen-matched peripheral blood allogeneic HSCT with a myeloablative-conditioning regimen of busulfan and cyclophosphamide, along with prophylactic voriconazole, sulfamethoxazole/trimethoprim, and acyclovir. After successful engraftment (without significant neutropenia), his posttransplant course was complicated by grade 2 graft vs host disease (GVHD) of the skin, eyes, and liver, which responded well to steroids and tacrolimus. Voriconazole was continued for 5 months until immunosuppression was minimized (tacrolimus 1 mg twice daily). Two months later, the patient’s GVHD worsened, necessitating treatment at an outside hospital with high-dose prednisone (2 mg/kg/d) and cyclosporine (300 mg twice daily). Voriconazole prophylaxis was not reinitiated at that time.
One year later, at a routine follow-up appointment, the patient endorsed several weeks of malaise, weight loss, and nonproductive cough. The patient’s immunosuppression recently had been reduced to 1 mg/kg/d of prednisone and 100 mg of cyclosporine twice daily. A chest X-ray demonstrated multiple pulmonary nodules; follow-up chest computed tomography (CT) confirmed multiple nodular infiltrates with surrounding ground-glass opacities suspicious with a fungal infection (Figure 1). 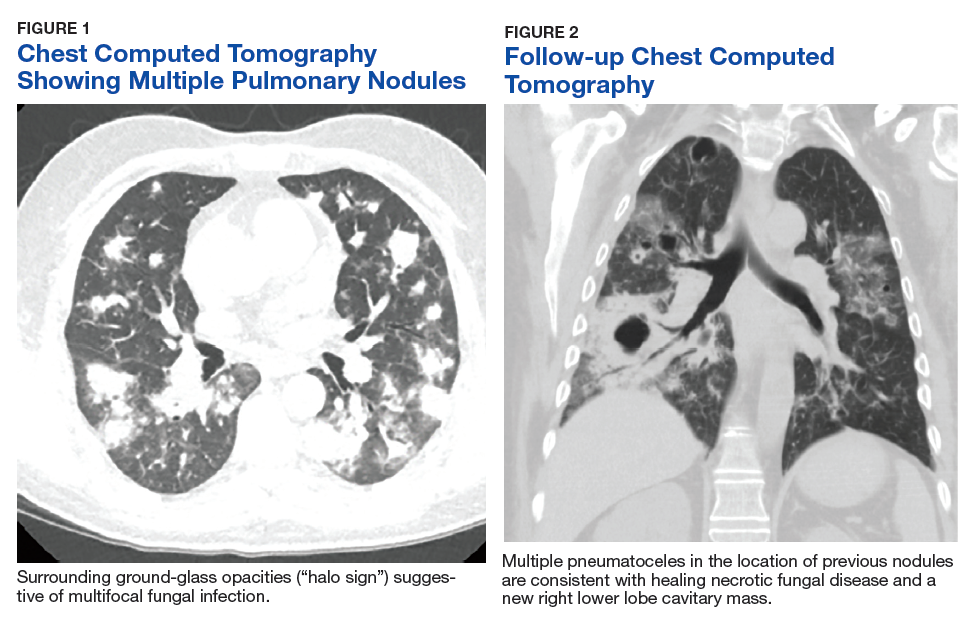
Treatment with oral voriconazole (300 mg twice daily) was initiated for probable pulmonary aspergillosis. Cyclosporine (150 mg twice daily) and prednisone (1 mg/kg/d) were continued throughout treatment out of concern for hepatic GVHD. The patient’s symptoms improved over the next 10 days, and follow-up chest imaging demonstrated improvement.
Two weeks after initiation of voriconazole treatment, the patient developed a new productive cough and dyspnea, associated with fevers and chills. Repeat imaging revealed right lower-lobe pneumonia. The serum voriconazole trough level was checked and was 3.1 mg/L, suggesting therapeutic dosing. The patient subsequently developed acute respiratory distress syndrome and required intubation and mechanical ventilation. Repeat BAL sampling demonstrated multidrug-resistant Escherichia coli, a BAL galactomannan level of 2.0 ODI, and negative fungal cultures. The patient’s hospital course was complicated by profound hypoxemia, requiring prone positioning and neuromuscular blockade. He was treated with meropenem and voriconazole. His immunosuppression was reduced, but he rapidly developed acute liver injury from hepatic GVHD that resolved after reinitiation of cyclosporine and prednisone at 0.75 mg/kg/d.
The patient improved over the next 3 weeks and was successfully extubated. Repeat chest CT imaging demonstrated numerous pneumatoceles in the location of previous nodules, consistent with healing necrotic fungal disease, and a new right lower-lobe cavitary mass (Figure 2). Two days after transferring out of the intensive care unit, the patient again developed hypoxemia and fevers to 39° C. Bronchoscopy with BAL of the right lower lobe revealed positive A fumigatus and Rhizopus sp polymerase chain reaction (PCR) assays, although fungal cultures were positive only for A fumigatus. Liposomal amphotericin B (5 mg/kg) was added to voriconazole therapy to treat mucormycosis and to provide a second active agent against A fumigatus.
Unfortunately, the patient’s clinical status continued to deteriorate with signs of progressive respiratory failure and infection despite empiric, broad-spectrum antibiotics and dual antifungal therapy. His serum voriconazole level continued to be therapeutic at 1.9 mg/L. The patient declined reintubation and invasive mechanical ventilation, and he ultimately transitioned to comfort measures and died with his family at the bedside.
Autopsy demonstrated widely disseminated Aspergillus infection as the cause of death, with evidence of myocardial, neural, and vascular invasion of A fumigatus (Figures 3 and 4). 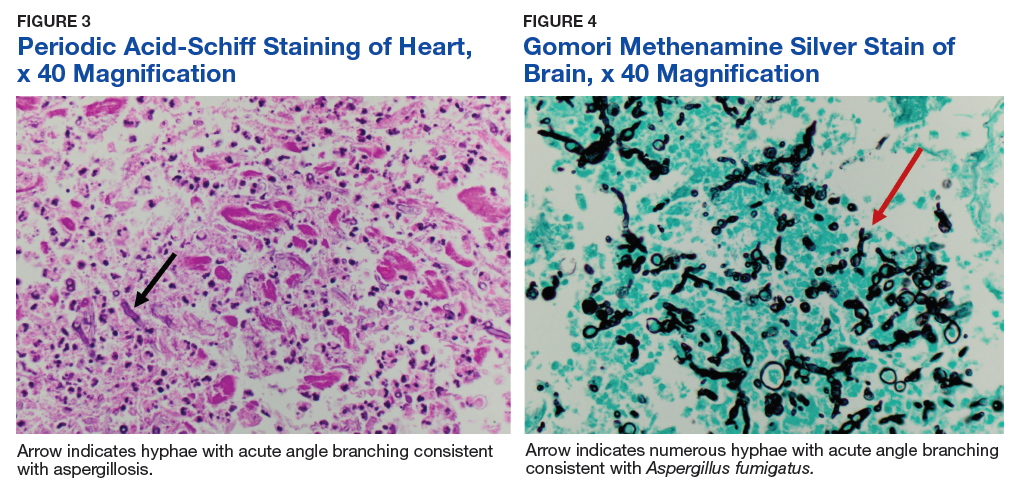
Discussion
This case of fatal, progressive, invasive, pulmonary aspergillosis demonstrates several important factors in the treatment of patients with this disease. Treatment failure usually relates to any of 4 possible factors: host immune status, severity or burden of disease, appropriate dosing of antifungal agents, and drug resistance. This patient’s immune system was heavily suppressed for a prolonged period. Attempts at reducing immunosuppression to the minimal required dosage to prevent a GVHD flare were unsuccessful and became an unmodifiable risk factor, a major contributor to his demise.
The risks of continuous high-dose immunosuppression in steroid-refractory GVHD is well understood and has been previously demonstrated to have up to 50% 4-year nonrelapse mortality, mainly due to overwhelming bacterial, viral, and fungal infections.4 All attempts should be made to cease or reduce immunosuppression in the setting of a severe infection, although this is sometimes impossible as in this case.
The patient’s disease burden was significant as evidenced by the bilateral, multifocal pulmonary nodules seen on chest imaging and the disseminated disease found at postmortem examination. His initial improvement in symptoms with voriconazole and the evolution of his images (with many of his initial pulmonary nodules becoming pneumatoceles) suggested a temporary positive immune response. The authors believe that the Rhizopus in his sputum represents noninvasive colonization of one of his pneumatoceles, because postmortem examination failed to reveal Rhizopus at any other location.
Voriconazole has excellent pulmonary and central nervous system penetration: In this patient serum levels were well within the therapeutic range. His peculiar drug resistance pattern (sensitivity to azoles and resistance to amphotericin) is unusual. Azole resistance in leukemia and patients with HSCT is more common than is amphotericin resistance, with current estimates of azole resistance close to 5%, ranging between 1% and 30%.5,6 Widespread use of antifungal prophylaxis with azoles likely selects for azole resistance.6
Despite this concern of azole resistance, current IDSA guidelines recommend against routine susceptibility testing of Aspergillus to azole therapy because of the current lack of consensus between the European Committee on Antibiotic Susceptibility Testing and Clinical and Laboratory Standards Institute on break points for resistance patterns.3,7 This is an area of emerging research, and proposed cut points for declaration of resistance do exist in the literature even if not globally agreed on.8
Combination antifungal therapy is an option for treatment in cases of possible drug resistance. Nonetheless, a recent randomized, double-blind, placebo-controlled, multicenter trial comparing voriconazole monotherapy with the combination of voriconazole and anidulafungin failed to demonstrate an overall mortality benefit in the primary analysis, although secondary analysis showed a mortality benefit with combination therapy in patients at highest risk for death.9
Despite the lack of unified standards with susceptibility testing, it may be reasonable to perform such tests in patients with demonstrating progressive disease. In this patient’s case, amphotericin B was added to treat the Rhizopus species found in his sputum, and while not the combination studied in the previously mentioned study, the drug should have provided an additional active agent for Aspergillus should this patient have had azole resistance.
Surprisingly, subsequent testing demonstrated the Aspergillus species to be resistant to amphotericin B. De novo amphotericin B-resistant A fumigates is extremely rare, with an expected incidence of 1% or less.10 The authors believe the patient may have demonstrated induction of amphotericin-B resistance through activation of fungal stress pathways by prior treatment with voriconazole. This has been demonstrated in vitro and should be considered should combination salvage therapy be required for the treatment of a refractory Aspergillus infection especially if patients have received prior treatment with voriconazole.11
Conclusion
This fatal case of invasive pulmonary aspergillosis illustrates the importance of considering the 4 main causes of treatment failure in an infection. Although the patient had a high burden of disease with a rare resistance pattern, he was treated with appropriate and well-dosed therapy. Ultimately, his unmodifiable immunosuppression was likely the driving factor leading to treatment failure and death. The indication for and number of bone marrow transplants continues to increase, thus exposure to and treatment of invasive fungal infections will increase accordingly. As such, providers should ensure that all causes of treatment failure are considered and addressed.
1. Upton A, Kirby KA, Carpenter P, Boeckh M, Marr KA. Invasive aspergillosis following hematopoietic cell transplantation: outcomes and prognostic factors associated with mortality. Clin Infect Dis. 2007;44(4):531-540.
2. Herbrecht R, Denning DW, Patterson TF, et al; Invasive Fungal Infections Group of the European Organisation for Research and Treatment of Cancer and the Global Aspergillus Study Group. Voriconazole versus amphotericin B for primary therapy of invasive aspergillosis. N Engl J Med. 2002;347(6):408-415.
3. Patterson TF, Thompson GR III, Denning DW, et al. Practice guidelines for the diagnosis and management of aspergillosis: 2016 update by the Infectious Disease Society of America. Clin Infect Dis. 2016;63(4):e1-e60.
4. García-Cadenas I, Rivera I, Martino R, et al. Patterns of infection and infection-related mortality in patients with steroid-refractory acute graft versus host disease. Bone Marrow Transplant. 2017;52(1):107-113.
5. Vermeulen E, Maertens J, De Bel A, et al. Nationwide surveillance of azole resistance in Aspergillus diseases. Antimicrob Agents Chemother. 2015;59(8):4569-4576.
6. Wiederhold NP, Patterson TF. Emergence of azole resistance in Aspergillus. Semin Respir Crit Care Med. 2015;36(5):673-680.
7. Cuenca-Estrella M, Moore CB, Barchiesi F, et al; AFST Subcommittee of the European Committee on Antimicrobial Susceptibility Testing. Multicenter evaluation of the reproducibility of the proposed antifungal susceptibility testing method for fermentative yeasts of the Antifungal Susceptibility Testing Subcommittee of the European Committee on Antimicrobial Susceptibility Testing (AFST-EUCAST). Clin Microbiol Infect. 2003;9(6):467-474.
8. Pfaller MA, Diekema DJ, Ghannoum MA, et al; Clinical and Laboratory Standards Institute Antifungal Testing Subcommittee. Wild-type MIC distribution and epidemiological cutoff values for Aspergillus fumigatus and three triazoles as determined by Clinical and Laboratory Standards Institute for broth microdilution methods. J Clin Microbiol. 2009;47(10):3142-3146.
9. Marr KA, Schlamm HT, Herbrecht R, et al. Combination antifungal therapy for invasive aspergillosis: a randomized trial. Ann Intern Med. 2015;162(2):81-89.
10. Tashiro M, Izumikawa K, Minematsu A, et al. Antifungal susceptibilities of Aspergillus fumigatus clinical isolates obtained in Nagasaki, Japan. Antimicrob Agents Chemother. 2012;56(1):584-587.
11. Rajendran R, Mowat E, Jones B, Williams C, Ramage G. Prior in vitro exposure to voriconazole confers resistance to amphotericin B in Aspergillus fumigatus biofilms. Int J Antimicrob Agents. 2015;46(3):342-345.
Historically, aspergillosis in patients with hematopoietic stem cell transplantation (HSCT) has carried a high mortality rate. However, recent data demonstrate a dramatic improvement in outcomes for patients with HSCT: 90-day survival increased from 22% before 2000 to 45% over the past 15 years.1 Improved outcomes coincide with changes in transplant immunosuppression practices, use of cross-sectional imaging for early disease identification, galactomannan screening, and the development of novel treatment options.
Voriconazole is an azole drug that blocks the synthesis of ergosterol, a vital component of the cellular membrane of fungi. Voriconazole was approved in 2002 after a clinical trial demonstrated an improvement in 50% of patients with invasive aspergillosis in the voriconazole arm vs 30% in the amphotericin B arm at 12 weeks.2 Amphotericin B is a polyene antifungal drug that binds with ergosterol, creating leaks in the cell membrane that lead to cellular demise. Voriconazole quickly became the first-line therapy for invasive aspergillosis and is recommended by both the Infectious Disease Society of American (IDSA) and the European Conference on Infections in Leukemia.3
Case Presentation
A 55-year-old man with high-risk chronic myelogenous leukemia (CML) underwent a 10 of 10 human leukocyte antigen allele and antigen-matched peripheral blood allogeneic HSCT with a myeloablative-conditioning regimen of busulfan and cyclophosphamide, along with prophylactic voriconazole, sulfamethoxazole/trimethoprim, and acyclovir. After successful engraftment (without significant neutropenia), his posttransplant course was complicated by grade 2 graft vs host disease (GVHD) of the skin, eyes, and liver, which responded well to steroids and tacrolimus. Voriconazole was continued for 5 months until immunosuppression was minimized (tacrolimus 1 mg twice daily). Two months later, the patient’s GVHD worsened, necessitating treatment at an outside hospital with high-dose prednisone (2 mg/kg/d) and cyclosporine (300 mg twice daily). Voriconazole prophylaxis was not reinitiated at that time.
One year later, at a routine follow-up appointment, the patient endorsed several weeks of malaise, weight loss, and nonproductive cough. The patient’s immunosuppression recently had been reduced to 1 mg/kg/d of prednisone and 100 mg of cyclosporine twice daily. A chest X-ray demonstrated multiple pulmonary nodules; follow-up chest computed tomography (CT) confirmed multiple nodular infiltrates with surrounding ground-glass opacities suspicious with a fungal infection (Figure 1).
Treatment with oral voriconazole (300 mg twice daily) was initiated for probable pulmonary aspergillosis. Cyclosporine (150 mg twice daily) and prednisone (1 mg/kg/d) were continued throughout treatment out of concern for hepatic GVHD. The patient’s symptoms improved over the next 10 days, and follow-up chest imaging demonstrated improvement.
Two weeks after initiation of voriconazole treatment, the patient developed a new productive cough and dyspnea, associated with fevers and chills. Repeat imaging revealed right lower-lobe pneumonia. The serum voriconazole trough level was checked and was 3.1 mg/L, suggesting therapeutic dosing. The patient subsequently developed acute respiratory distress syndrome and required intubation and mechanical ventilation. Repeat BAL sampling demonstrated multidrug-resistant Escherichia coli, a BAL galactomannan level of 2.0 ODI, and negative fungal cultures. The patient’s hospital course was complicated by profound hypoxemia, requiring prone positioning and neuromuscular blockade. He was treated with meropenem and voriconazole. His immunosuppression was reduced, but he rapidly developed acute liver injury from hepatic GVHD that resolved after reinitiation of cyclosporine and prednisone at 0.75 mg/kg/d.
The patient improved over the next 3 weeks and was successfully extubated. Repeat chest CT imaging demonstrated numerous pneumatoceles in the location of previous nodules, consistent with healing necrotic fungal disease, and a new right lower-lobe cavitary mass (Figure 2). Two days after transferring out of the intensive care unit, the patient again developed hypoxemia and fevers to 39° C. Bronchoscopy with BAL of the right lower lobe revealed positive A fumigatus and Rhizopus sp polymerase chain reaction (PCR) assays, although fungal cultures were positive only for A fumigatus. Liposomal amphotericin B (5 mg/kg) was added to voriconazole therapy to treat mucormycosis and to provide a second active agent against A fumigatus.
Unfortunately, the patient’s clinical status continued to deteriorate with signs of progressive respiratory failure and infection despite empiric, broad-spectrum antibiotics and dual antifungal therapy. His serum voriconazole level continued to be therapeutic at 1.9 mg/L. The patient declined reintubation and invasive mechanical ventilation, and he ultimately transitioned to comfort measures and died with his family at the bedside.
Autopsy demonstrated widely disseminated Aspergillus infection as the cause of death, with evidence of myocardial, neural, and vascular invasion of A fumigatus (Figures 3 and 4).
Discussion
This case of fatal, progressive, invasive, pulmonary aspergillosis demonstrates several important factors in the treatment of patients with this disease. Treatment failure usually relates to any of 4 possible factors: host immune status, severity or burden of disease, appropriate dosing of antifungal agents, and drug resistance. This patient’s immune system was heavily suppressed for a prolonged period. Attempts at reducing immunosuppression to the minimal required dosage to prevent a GVHD flare were unsuccessful and became an unmodifiable risk factor, a major contributor to his demise.
The risks of continuous high-dose immunosuppression in steroid-refractory GVHD is well understood and has been previously demonstrated to have up to 50% 4-year nonrelapse mortality, mainly due to overwhelming bacterial, viral, and fungal infections.4 All attempts should be made to cease or reduce immunosuppression in the setting of a severe infection, although this is sometimes impossible as in this case.
The patient’s disease burden was significant as evidenced by the bilateral, multifocal pulmonary nodules seen on chest imaging and the disseminated disease found at postmortem examination. His initial improvement in symptoms with voriconazole and the evolution of his images (with many of his initial pulmonary nodules becoming pneumatoceles) suggested a temporary positive immune response. The authors believe that the Rhizopus in his sputum represents noninvasive colonization of one of his pneumatoceles, because postmortem examination failed to reveal Rhizopus at any other location.
Voriconazole has excellent pulmonary and central nervous system penetration: In this patient serum levels were well within the therapeutic range. His peculiar drug resistance pattern (sensitivity to azoles and resistance to amphotericin) is unusual. Azole resistance in leukemia and patients with HSCT is more common than is amphotericin resistance, with current estimates of azole resistance close to 5%, ranging between 1% and 30%.5,6 Widespread use of antifungal prophylaxis with azoles likely selects for azole resistance.6
Despite this concern of azole resistance, current IDSA guidelines recommend against routine susceptibility testing of Aspergillus to azole therapy because of the current lack of consensus between the European Committee on Antibiotic Susceptibility Testing and Clinical and Laboratory Standards Institute on break points for resistance patterns.3,7 This is an area of emerging research, and proposed cut points for declaration of resistance do exist in the literature even if not globally agreed on.8
Combination antifungal therapy is an option for treatment in cases of possible drug resistance. Nonetheless, a recent randomized, double-blind, placebo-controlled, multicenter trial comparing voriconazole monotherapy with the combination of voriconazole and anidulafungin failed to demonstrate an overall mortality benefit in the primary analysis, although secondary analysis showed a mortality benefit with combination therapy in patients at highest risk for death.9
Despite the lack of unified standards with susceptibility testing, it may be reasonable to perform such tests in patients with demonstrating progressive disease. In this patient’s case, amphotericin B was added to treat the Rhizopus species found in his sputum, and while not the combination studied in the previously mentioned study, the drug should have provided an additional active agent for Aspergillus should this patient have had azole resistance.
Surprisingly, subsequent testing demonstrated the Aspergillus species to be resistant to amphotericin B. De novo amphotericin B-resistant A fumigates is extremely rare, with an expected incidence of 1% or less.10 The authors believe the patient may have demonstrated induction of amphotericin-B resistance through activation of fungal stress pathways by prior treatment with voriconazole. This has been demonstrated in vitro and should be considered should combination salvage therapy be required for the treatment of a refractory Aspergillus infection especially if patients have received prior treatment with voriconazole.11
Conclusion
This fatal case of invasive pulmonary aspergillosis illustrates the importance of considering the 4 main causes of treatment failure in an infection. Although the patient had a high burden of disease with a rare resistance pattern, he was treated with appropriate and well-dosed therapy. Ultimately, his unmodifiable immunosuppression was likely the driving factor leading to treatment failure and death. The indication for and number of bone marrow transplants continues to increase, thus exposure to and treatment of invasive fungal infections will increase accordingly. As such, providers should ensure that all causes of treatment failure are considered and addressed.
1. Upton A, Kirby KA, Carpenter P, Boeckh M, Marr KA. Invasive aspergillosis following hematopoietic cell transplantation: outcomes and prognostic factors associated with mortality. Clin Infect Dis. 2007;44(4):531-540.
2. Herbrecht R, Denning DW, Patterson TF, et al; Invasive Fungal Infections Group of the European Organisation for Research and Treatment of Cancer and the Global Aspergillus Study Group. Voriconazole versus amphotericin B for primary therapy of invasive aspergillosis. N Engl J Med. 2002;347(6):408-415.
3. Patterson TF, Thompson GR III, Denning DW, et al. Practice guidelines for the diagnosis and management of aspergillosis: 2016 update by the Infectious Disease Society of America. Clin Infect Dis. 2016;63(4):e1-e60.
4. García-Cadenas I, Rivera I, Martino R, et al. Patterns of infection and infection-related mortality in patients with steroid-refractory acute graft versus host disease. Bone Marrow Transplant. 2017;52(1):107-113.
5. Vermeulen E, Maertens J, De Bel A, et al. Nationwide surveillance of azole resistance in Aspergillus diseases. Antimicrob Agents Chemother. 2015;59(8):4569-4576.
6. Wiederhold NP, Patterson TF. Emergence of azole resistance in Aspergillus. Semin Respir Crit Care Med. 2015;36(5):673-680.
7. Cuenca-Estrella M, Moore CB, Barchiesi F, et al; AFST Subcommittee of the European Committee on Antimicrobial Susceptibility Testing. Multicenter evaluation of the reproducibility of the proposed antifungal susceptibility testing method for fermentative yeasts of the Antifungal Susceptibility Testing Subcommittee of the European Committee on Antimicrobial Susceptibility Testing (AFST-EUCAST). Clin Microbiol Infect. 2003;9(6):467-474.
8. Pfaller MA, Diekema DJ, Ghannoum MA, et al; Clinical and Laboratory Standards Institute Antifungal Testing Subcommittee. Wild-type MIC distribution and epidemiological cutoff values for Aspergillus fumigatus and three triazoles as determined by Clinical and Laboratory Standards Institute for broth microdilution methods. J Clin Microbiol. 2009;47(10):3142-3146.
9. Marr KA, Schlamm HT, Herbrecht R, et al. Combination antifungal therapy for invasive aspergillosis: a randomized trial. Ann Intern Med. 2015;162(2):81-89.
10. Tashiro M, Izumikawa K, Minematsu A, et al. Antifungal susceptibilities of Aspergillus fumigatus clinical isolates obtained in Nagasaki, Japan. Antimicrob Agents Chemother. 2012;56(1):584-587.
11. Rajendran R, Mowat E, Jones B, Williams C, Ramage G. Prior in vitro exposure to voriconazole confers resistance to amphotericin B in Aspergillus fumigatus biofilms. Int J Antimicrob Agents. 2015;46(3):342-345.
Interview with Andrew Pachner, MD, about the molecular processes of multiple sclerosis
Andrew R. Pachner, MD is the Murray B. Bornstein professor of neurology at Geisel School of Medicine at Dartmouth and director of the Multiple Sclerosis Center at Dartmouth-Hitchcock Medical Center. We spoke to Dr. Pachner about his research into the molecular processes of multiple sclerosis (MS) and the potential impact on patient management.

What do we know about the molecular processes behind relapsing-remitting and progressive MS?
DR. PACHNER: The progress--in terms of molecules--has not been rapid in the field of MS. The only molecular biomarker we use in practice is oligoclonal bands or other measures of immunoglobulin production in the nervous system, and that biomarker was described in 1942. So, it has been a long time since we have seen a relevant molecule that we can use clinically.
But there has been a lot of progress in the general field of neuroinflammation. MS is one of a large number of diseases that results in neuroinflammation and demyelination.
One thing we have learned over time is that there are many different subtypes of MS. They probably have some shared molecular processes, but they also are likely to have divergent molecular processes.
Over the past 5 to 10 years, researchers have been interested in trying to dissect some of the molecular aspects of MS to identify biomarkers that can, in turn, differentiate subtypes of MS. This will help to identify different ways of treating MS that are optimal for individual patients. It is clear that each patient is quite different and unlikely to be standardized in the way they respond to treatment.
The degree to which relapsing-remitting and progressive MS are differentiated on the molecular level is dependent on how much influence there is of the immune system in the periphery. When MS first starts in a patient, the brain has either no or a very primitive immune system, and then over time it changes, and it becomes much more immune-oriented and populated by immune cells and molecules. So, there’s a trend over time of the central nervous system becoming increasingly populated by immune cells and able to make immune molecules.
What has your recent research on murine models representing these disease patterns shown?
DR. PACHNER: Even though in humans there is a continuum from relapsing remitting to progressive, it is not like they are completely separate. Frequently in the middle of relapsing-remitting disease there is some progression over time.
In mouse models, we like things to be very clear and separate. We try to make things as simple as possible because of the complexity of the nervous and immune systems.
The simple model for the relapsing-remitting disease is experimental autoimmune encephalomyelitis (EAE), the most commonly studied model of neuroinflammation.
For the progressive form of MS, we use the Theiler’s virus model, which is a type of virus called the picornavirus that is injected into the brain of mice resulting in a slowly progressive, chronic viral infection that looks very much like progressive MS.
In EAE, the disease is induced by presenting an antigen to the peripheral immune system, allowing cells from the peripheral immune system to enter into the central nervous system. It is a manifestation of inflammation and the immune response is in the periphery. In the Theiler’s model, it is a localized process within the central nervous system because the virus is injected directly into the brain.
We found that in EAE the pattern is very much dominated by what happens in the periphery and the injury is very transient. There are cells that enter the nervous system that cause inflammation and damage, but there are also processes that downregulate those cells and processes and eventually the animal improves--similar to an MS attack.
By contrast, in the Theiler’s model there is progressive injury that is dominated by two molecular processes in the central nervous system that we do not see in relapsing-remitting MS or in EAE, and that is the activation of Type 1 interferons and also a very pronounced immunoglobulin production along with all the molecules that help support plasma cells making immunoglobulin.
These are two different animal models that provide us insight into how the central nervous system can be injured in the course of neuroinflammation and they look to be very different in how they manifest themselves, both in the periphery and in the central nervous system.
How may these new findings impact the future management and treatment of MS?
DR. PACHNER: When I see a patient with MS, I tell them that we absolutely need to focus on your own disease and how it responds, rather than taking too much guidance from MS as a whole. Because each patient with MS is different.
One of the things that we have tried to do is to identify molecular markers that might help us in management and treatment. As an example, we have learned that some patients who present with their first episode of MS do very poorly. These patients have many more attacks and/or have very aggressive progression in terms of their disability so that they potentially could be in a wheelchair within a few years. Other patients have what we call a benign variant MS. These patients may have an initial episode that is not that different than the other patient, but this type of patient may not have anything else for the rest of their life.
We would like to have some differentiation of those two types of patients. In the first example you can try to be very aggressive and minimize the neuroinflammation with powerful immune-suppressing drugs that have a high risk of causing side effects, such as cancer or opportunistic infections, but on the other hand may have a high benefit in preventing future inflammatory events and progressive injury. But that would not be the correct treatment choice for the second patient example.
It would be nice to tailor treatment to a predictive biomarker. That is something we have been working very hard on. Based on some of the animal models, we have identified a molecular signature of inflammatory MS that is very predictive of future events and we are hoping that that will help us differentiate patients. In other words, not just treat every MS patient the same, but identify whether they need a very powerful immunosuppressant drug, or a mildly immunosuppressant drug, or no treatment at all.
If you have a patient who has one attack and never has any other problem with their MS, then they do not need to be on any treatment. Unfortunately, we do not have predictive value at this point for any molecule or any other attribute of the patient at this point in time. We are trying to remedy that.
That is one very practical aspect of our work in trying to understand the biology of the disease better--identifying molecules that are associated with future damage and inflammation and using those in a predictive manner in patients to guide treatment.
Another important aspect is the attempt to understand the biology of neuroinflammation and how it causes both demyelination and progressive injury to neurons.
References:
Pachner AR, DiSano K, Royce DB, Gilli F. Clinical utility of a molecular signature in inflammatory demyelinating diseases. Neurol Neuroimmunol Neuroinflamm.2019;6(1):e520.
Andrew R. Pachner, MD is the Murray B. Bornstein professor of neurology at Geisel School of Medicine at Dartmouth and director of the Multiple Sclerosis Center at Dartmouth-Hitchcock Medical Center. We spoke to Dr. Pachner about his research into the molecular processes of multiple sclerosis (MS) and the potential impact on patient management.
What do we know about the molecular processes behind relapsing-remitting and progressive MS?
DR. PACHNER: The progress--in terms of molecules--has not been rapid in the field of MS. The only molecular biomarker we use in practice is oligoclonal bands or other measures of immunoglobulin production in the nervous system, and that biomarker was described in 1942. So, it has been a long time since we have seen a relevant molecule that we can use clinically.
But there has been a lot of progress in the general field of neuroinflammation. MS is one of a large number of diseases that results in neuroinflammation and demyelination.
One thing we have learned over time is that there are many different subtypes of MS. They probably have some shared molecular processes, but they also are likely to have divergent molecular processes.
Over the past 5 to 10 years, researchers have been interested in trying to dissect some of the molecular aspects of MS to identify biomarkers that can, in turn, differentiate subtypes of MS. This will help to identify different ways of treating MS that are optimal for individual patients. It is clear that each patient is quite different and unlikely to be standardized in the way they respond to treatment.
The degree to which relapsing-remitting and progressive MS are differentiated on the molecular level is dependent on how much influence there is of the immune system in the periphery. When MS first starts in a patient, the brain has either no or a very primitive immune system, and then over time it changes, and it becomes much more immune-oriented and populated by immune cells and molecules. So, there’s a trend over time of the central nervous system becoming increasingly populated by immune cells and able to make immune molecules.
What has your recent research on murine models representing these disease patterns shown?
DR. PACHNER: Even though in humans there is a continuum from relapsing remitting to progressive, it is not like they are completely separate. Frequently in the middle of relapsing-remitting disease there is some progression over time.
In mouse models, we like things to be very clear and separate. We try to make things as simple as possible because of the complexity of the nervous and immune systems.
The simple model for the relapsing-remitting disease is experimental autoimmune encephalomyelitis (EAE), the most commonly studied model of neuroinflammation.
For the progressive form of MS, we use the Theiler’s virus model, which is a type of virus called the picornavirus that is injected into the brain of mice resulting in a slowly progressive, chronic viral infection that looks very much like progressive MS.
In EAE, the disease is induced by presenting an antigen to the peripheral immune system, allowing cells from the peripheral immune system to enter into the central nervous system. It is a manifestation of inflammation and the immune response is in the periphery. In the Theiler’s model, it is a localized process within the central nervous system because the virus is injected directly into the brain.
We found that in EAE the pattern is very much dominated by what happens in the periphery and the injury is very transient. There are cells that enter the nervous system that cause inflammation and damage, but there are also processes that downregulate those cells and processes and eventually the animal improves--similar to an MS attack.
By contrast, in the Theiler’s model there is progressive injury that is dominated by two molecular processes in the central nervous system that we do not see in relapsing-remitting MS or in EAE, and that is the activation of Type 1 interferons and also a very pronounced immunoglobulin production along with all the molecules that help support plasma cells making immunoglobulin.
These are two different animal models that provide us insight into how the central nervous system can be injured in the course of neuroinflammation and they look to be very different in how they manifest themselves, both in the periphery and in the central nervous system.
How may these new findings impact the future management and treatment of MS?
DR. PACHNER: When I see a patient with MS, I tell them that we absolutely need to focus on your own disease and how it responds, rather than taking too much guidance from MS as a whole. Because each patient with MS is different.
One of the things that we have tried to do is to identify molecular markers that might help us in management and treatment. As an example, we have learned that some patients who present with their first episode of MS do very poorly. These patients have many more attacks and/or have very aggressive progression in terms of their disability so that they potentially could be in a wheelchair within a few years. Other patients have what we call a benign variant MS. These patients may have an initial episode that is not that different than the other patient, but this type of patient may not have anything else for the rest of their life.
We would like to have some differentiation of those two types of patients. In the first example you can try to be very aggressive and minimize the neuroinflammation with powerful immune-suppressing drugs that have a high risk of causing side effects, such as cancer or opportunistic infections, but on the other hand may have a high benefit in preventing future inflammatory events and progressive injury. But that would not be the correct treatment choice for the second patient example.
It would be nice to tailor treatment to a predictive biomarker. That is something we have been working very hard on. Based on some of the animal models, we have identified a molecular signature of inflammatory MS that is very predictive of future events and we are hoping that that will help us differentiate patients. In other words, not just treat every MS patient the same, but identify whether they need a very powerful immunosuppressant drug, or a mildly immunosuppressant drug, or no treatment at all.
If you have a patient who has one attack and never has any other problem with their MS, then they do not need to be on any treatment. Unfortunately, we do not have predictive value at this point for any molecule or any other attribute of the patient at this point in time. We are trying to remedy that.
That is one very practical aspect of our work in trying to understand the biology of the disease better--identifying molecules that are associated with future damage and inflammation and using those in a predictive manner in patients to guide treatment.
Another important aspect is the attempt to understand the biology of neuroinflammation and how it causes both demyelination and progressive injury to neurons.
References:
Pachner AR, DiSano K, Royce DB, Gilli F. Clinical utility of a molecular signature in inflammatory demyelinating diseases. Neurol Neuroimmunol Neuroinflamm.2019;6(1):e520.

Ibrutinib/rituximab effective, safe as frontline treatment for older patients with MCL
LUGANO, SWITZERLAND – The chemotherapy-free combination of ibrutinib (Imbruvica) and rituximab is highly effective as frontline therapy for older, transplant-ineligible patients with nonblastoid mantle cell lymphoma, according to investigators.

In a phase 2 study of patients with a median age of 71 years, 38 of 41 patients (93%) had an objective response, and the regimen was both safe and easy to administer, reported Preetesh Jain, MD, PhD, of the University of Texas MD Anderson Cancer Center in Houston.
“The adverse event profile was generally favorable, with specific monitoring recommended for patients with cardiovascular comorbidities and a history of atrial fibrillation,” he said at the International Conference on Malignant Lymphoma.
The investigators enrolled 48 patients aged 65 years and older with previously untreated mantle cell lymphoma (MCL), of whom 41 were evaluable for the primary endpoints of overall response rate (ORR) and safety. The patients had good performance status and normal organ function, with the largest tumor size less than 10 cm. Patients with atrial fibrillation could participate, if the fibrillation was controlled. Patients with Ki-67 protein levels of 50% or greater and blastoid/pleomorphic histology were excluded.
Patients were treated with ibrutinib 560 mg orally daily for each 28-day cycle, with therapy continued until disease progression, or until therapy was stopped for any other reason. Patients also received intravenous rituximab 375 mg/m2 on days 1, 8, 15 and 22, plus or minus one day for cycle 1, on day 1 of cycles 3-8, and on day 1 of every other cycle for up to 2 years.
Of the 41 patients evaluable for response, 26 (64%) had a complete response (CR) and 12 (29%) had a partial response. Three additional patients had stable disease, for an objective response rate of 93%.
Of 34 patients with PET scans, all had negative scans. Of 37 patients evaluable for minimal residual disease (MRD) by flow cytometry, 21 (58%) were MRD negative.
Patients with low or intermediate Mantle Cell Lymphoma International Prognostic Index (MIPI) scores had a higher ORR (100% vs. 89% for patients with high MIPI scores), and patients with low Ki-67 levels had a higher response rate than that of patients with KI-67 of 30% or greater (80% vs. 87%).
Neither median 3-year progression-free survival nor median 3-year overall survival have been reached, with respective 3-year rates of 87% and 95%.
Four patients experienced disease progression at 4, 10, 13 and 33 months of treatment. Three of these patients had disease that had transformed to blastoid/pleomorphic variant, two had Ki-67 of 30% or greater, one had mutations in TP53, and one had FAT1 and SF3B1 mutations.
Two patients died after ibrutinib therapy, one who had discontinued therapy because of bleeding, and the other who died on treatment at 13 months from transformed disease. Both of these patients had high Ki-67 levels.
Grade 3 or 4 hematological adverse events were neutropenia in four patients, and thrombocytopenia in two patients. There were no cases of grade 3 or 4 anemia.
Grade 3 or 4 nonhematological adverse events were fatigue, myalgia, and atrial fibrillation in seven patients each, diarrhea in six patients, and petechiae/bleeding in three patients.
Patients will continue to be followed for late adverse events, secondary cancers, and relapses, and further studies on clonal evolution, mutation profiling, and MRD are ongoing and will be reported at a later date, Dr. Jain said.
The National Cancer Institute supported the study. Dr. Jain reported having no financial disclosures.
SOURCE: Jain P et al. 15-ICML. Abstract 011.
LUGANO, SWITZERLAND – The chemotherapy-free combination of ibrutinib (Imbruvica) and rituximab is highly effective as frontline therapy for older, transplant-ineligible patients with nonblastoid mantle cell lymphoma, according to investigators.
In a phase 2 study of patients with a median age of 71 years, 38 of 41 patients (93%) had an objective response, and the regimen was both safe and easy to administer, reported Preetesh Jain, MD, PhD, of the University of Texas MD Anderson Cancer Center in Houston.
“The adverse event profile was generally favorable, with specific monitoring recommended for patients with cardiovascular comorbidities and a history of atrial fibrillation,” he said at the International Conference on Malignant Lymphoma.
The investigators enrolled 48 patients aged 65 years and older with previously untreated mantle cell lymphoma (MCL), of whom 41 were evaluable for the primary endpoints of overall response rate (ORR) and safety. The patients had good performance status and normal organ function, with the largest tumor size less than 10 cm. Patients with atrial fibrillation could participate, if the fibrillation was controlled. Patients with Ki-67 protein levels of 50% or greater and blastoid/pleomorphic histology were excluded.
Patients were treated with ibrutinib 560 mg orally daily for each 28-day cycle, with therapy continued until disease progression, or until therapy was stopped for any other reason. Patients also received intravenous rituximab 375 mg/m2 on days 1, 8, 15 and 22, plus or minus one day for cycle 1, on day 1 of cycles 3-8, and on day 1 of every other cycle for up to 2 years.
Of the 41 patients evaluable for response, 26 (64%) had a complete response (CR) and 12 (29%) had a partial response. Three additional patients had stable disease, for an objective response rate of 93%.
Of 34 patients with PET scans, all had negative scans. Of 37 patients evaluable for minimal residual disease (MRD) by flow cytometry, 21 (58%) were MRD negative.
Patients with low or intermediate Mantle Cell Lymphoma International Prognostic Index (MIPI) scores had a higher ORR (100% vs. 89% for patients with high MIPI scores), and patients with low Ki-67 levels had a higher response rate than that of patients with KI-67 of 30% or greater (80% vs. 87%).
Neither median 3-year progression-free survival nor median 3-year overall survival have been reached, with respective 3-year rates of 87% and 95%.
Four patients experienced disease progression at 4, 10, 13 and 33 months of treatment. Three of these patients had disease that had transformed to blastoid/pleomorphic variant, two had Ki-67 of 30% or greater, one had mutations in TP53, and one had FAT1 and SF3B1 mutations.
Two patients died after ibrutinib therapy, one who had discontinued therapy because of bleeding, and the other who died on treatment at 13 months from transformed disease. Both of these patients had high Ki-67 levels.
Grade 3 or 4 hematological adverse events were neutropenia in four patients, and thrombocytopenia in two patients. There were no cases of grade 3 or 4 anemia.
Grade 3 or 4 nonhematological adverse events were fatigue, myalgia, and atrial fibrillation in seven patients each, diarrhea in six patients, and petechiae/bleeding in three patients.
Patients will continue to be followed for late adverse events, secondary cancers, and relapses, and further studies on clonal evolution, mutation profiling, and MRD are ongoing and will be reported at a later date, Dr. Jain said.
The National Cancer Institute supported the study. Dr. Jain reported having no financial disclosures.
SOURCE: Jain P et al. 15-ICML. Abstract 011.
REPORTING FROM 15-ICML
Treatment Facility: An Important Prognostic Factor for Dedifferentiated Liposarcoma Survival (FULL)
Approximately 17% to 25% of all softtissue sarcomas (STS) are liposarcomas, making liposarcoma the most common type of STS.1 The 2013 World Health Organization (WHO) classification separates liposarcoma into 4 histologic subtypes: atypical lipomatous tumor/well-differentiated (ALT/ WDLPS), dedifferentiated (DDLPS), myxoid, and pleomorphic.2 Each subtype has unique histology, morphology, and natural history. WDLPS and DDLPS are the most common histologic subtypes, comprising approximately 50% of all sarcomas that arise in the retroperitoneum.3 DDLPS represents 18% of all liposarcomas, making it the second most common subtype of liposarcoma.4
In 1979, DDLPS was first characterized.5 Most (90%) cases of DDLPS present de novo, whereas the other 10% transform from preexisting low-grade WDLPS.2 DDLPSs are formed by an amplification of 12q14-15 involving the MDM2 gene.4 These malignancies most commonly present in the retroperitoneum as a large painless mass, consisting of both fatty and nonfatty components.2 Primary site has been previously reported as a major prognostic factor for DDLPSs, with retroperitoneal DDLPSs demonstrating the worst prognosis.6 DDLPSs have a high risk of local recurrence, with some reports estimating recurrence rates approaching 40%.2 Overall mortality at 5 years for DDLPS is estimated to be between 30% and 40%.4
Previous literature has determined that median income, race, health insurance, and facility type are related to survival outcomes for patients with DDLPS.7-9 When comparing the most common types of cancers, residents of poorer US counties consistently had a higher risk of mortality than residents in affluent US counties, and all racial minorities showed worse survival outcomes when compared with white patients.7 Differences in survival outcomes have been reported in patients attending different treatment facilities for other cancers including pancreatic cancers, glioblastomas, and oral cancers, with multiple studies concluding that academic and research programs are associated with the longest survival outcomes.10-12 For many cancers, insurance status has been shown to be a significant prognostic factor, with private insurance typically resulting in the best prognosis.8,9
The goal of this retrospective study was to assess the prognostic effects of socioeconomic variables on the overall survival (OS) probabilities in a large cohort of DDLPS patients in order to inform clinicians about a potentially at-risk population.
Method
The National Cancer Database (NCDB) was created by the Commission on Cancer (CoC) of the American College of Surgeons and the American Cancer Society. The NCDB is the largest cancer database in the US and includes data on almost 70% of US patients with cancer. CoC-accredited cancer programs add data on patients with cancer to the NCDB. The authors accessed the NCDB data through the use of the NCDB Participant Use File program.
Patients’ data from 2004 through 2015 were abstracted. Only patients with the International Classification of Diseases for Oncology histology code 8858, corresponding to DDLPS, were analyzed. Patients with other comorbid malignant tumors were excluded to accurately capture the true survival rates for DDLPS. Variables analyzed included age, sex, race, insurance status, treatment facility type, median household income by zip code, and percentage of adults in the patient’s zip code with no high school (HS) education.
Median survival, 5- and 10-year OS probabilities, and Kaplan-Meier survival curves were calculated for multiple variables, specifically race, insurance status, treatment facility type, median family income, and percentage of adults without a HS degree. Both 5- and 10-year OS probabilities were determined by race with the patients separated into white, African American, Asian, American Indian/Alaska Native (AI/AN), and Asian Indian or Pakistani groups. Our study categorized Chinese, Japanese, Filipino, Hmong, Korean, Vietnamese, Thai, Guamanian, Asian not otherwise specified, and other Asian ethnicity patients together into one collective Asian group. Insurance status was classified into Medicare, Medicaid, other government insurance, and private insurance groups. Other government insurance consisted of US Department of Veterans Affairs, Indian Health Service, Public Health Service, and other government health care programs. Further analysis could not be performed into the distribution of the other government insurance variable.
Facility types were divided into 4 groups: community, comprehensive community, academic/ research, and integrated network cancer treatment facilities. Median income quartiles and the percentage of adults with no high school degree were estimated by comparison of the patient’s zip code with US Census Bureau data. Median household income was separated into 4 groups, including lowest level of household income (< $38,000), low level of household income ($38,000 to $47,999), moderate level of household income ($48,000 to $62,999), and highest level of household income (≥ $63,000). The percentages of adults with no high school degree were divided into 4 groups: lowest level of HS education (≥ 21% ), low level of HS education (13.0% to 20.9%), moderate level of HS education (7.0% to 12.9%), and highest level of HS education (≤ 7%). The 5- and 10-year survival probabilities were calculated using the number of months between the date of diagnosis and the date of death or last known contact.
Continuous variables are presented as median and interquartile range (IQR) whereas categorical variables are presented as frequencies and proportion. IBM SPSS version 25.0 was used to produce Kaplan-Meier survival curves and descriptive statistics. This study used Kaplan- Meier survival tables and log-rank tests to analyze both the 5- and 10-year OS rates for the 5 variables listed above. This study also used a multivariable Cox regression model that accommodated the correlative nature of outcomes within facilities to study the association of the treatment facility type and other socioeconomic factors, while controlling for age, race (which was collapsed into 3 categories), sex, primary site, tumor stage, and treatment approaches. The proportional hazards assumption was individually checked for all pertinent variables. Any patient records that were missing data were excluded from the multivariable Cox regression model, which was analyzed with SAS version 9.4 (Cary, NC). P < 0.05 was used to indicate statistical significance for all analyses.
Results
Table 1 provides descriptive analysis for demographic characteristics of the 3573 patients including age, sex, and race. The median age at diagnosis was 64 years. There were 1073 more men (65%) than women (35%) in this analysis. Whites were the predominant racial category, comprising 87.7% of the patient population, followed by African Americans (6.5%) and Asians (2.5%).
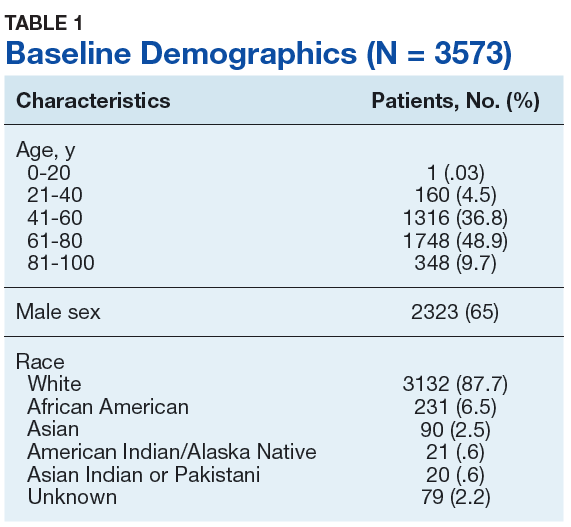
Socioeconomic Variables
The largest proportion of the patient population (45.5%) had private insurance (Table 2). Medicare came in a close second covering almost 42.2% of the population, followed by Medicaid (5.0%), uninsured (2.8%), and other government insurance (1.5%). About half (53.7%) of the patients were treated at academic or research facilities, while the fewest number of patients (5.2%) underwent treatment at community cancer facilities. The largest percentage (36.6%) of patients lived in zip codes with the highest level of median household income, while 26.0% and 22.3% had moderate and low levels of income, respectively. About 14% of patients lived within an area of the lowest level of income. Similarly, almost 15% of patients lived in an area of lowest level of HS education. The greatest percentage of the patient population (34.5%) lived in a zip code with moderate level of HS education. Surgery was the most common treatment modality with 90.8% of the cohort undergoing surgery, while 35.4% and 16.5% were treated with radiation and chemotherapy, respectively (some patients received more than one type of treatment modality).
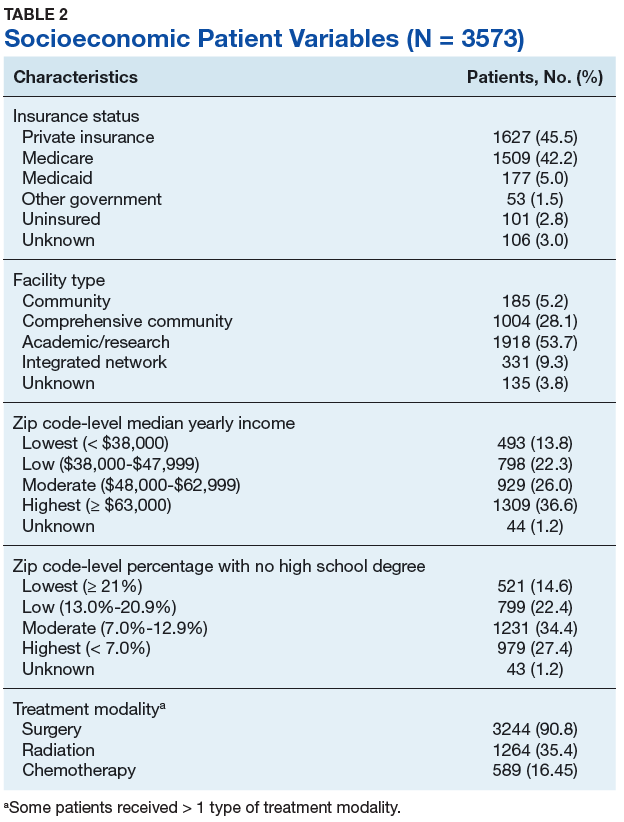
Survival Data
Survival data were available for 3112 patients. Kaplan-Meier survival curves were used to analyze OS according to insurance status, racial background, treatment facility type, median family income, and percentage of adults with no high school education. Overall 5- and 10- year OS probabilities were 51.5% and 34.8%, respectively, while the median OS (SD) was 63.57 (2.8) months (Table 3).
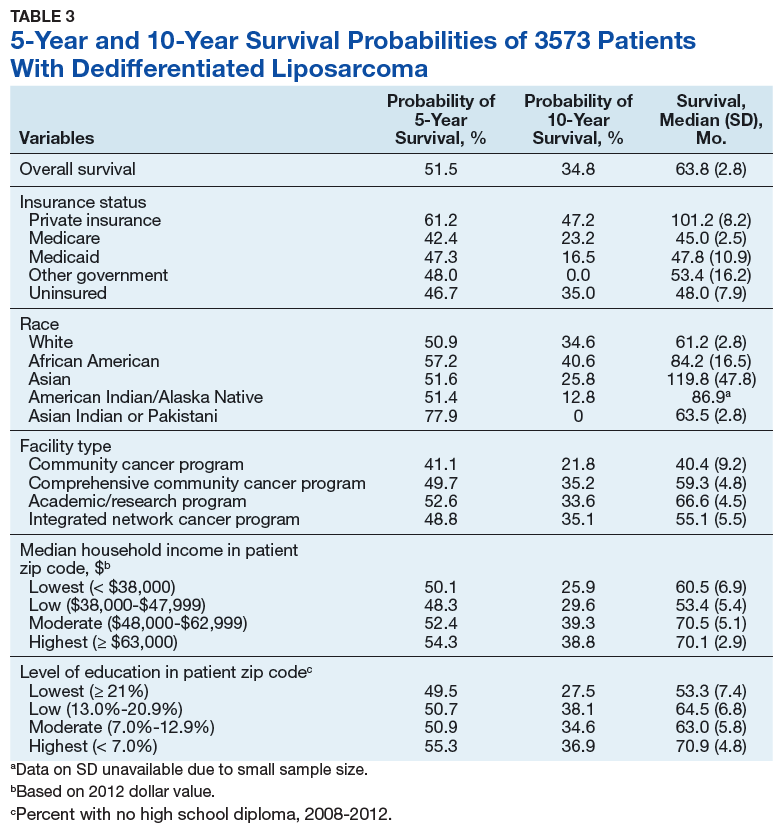
Private insurance showed significantly higher 5- and 10-year OS probabilities and median OS: 5-year OS was 61.2%, 10-year OS was 47.2%, and median survival (SD) was 101.2 (8.2) months compared with that of all other insurance groups (Medicare, Medicaid, other government insurance, and uninsured) (Figure 1). These other insurance types were fairly similar in their 5-year and median OS, but surprisingly, patients with no insurance had the second longest 10-year OS. The difference between the 5-year OS probabilities of private insurance compared with an average of the other insurances was 15.1%, which had almost doubled to 28.5% at 10 years, with a median OS difference of almost 5 years (56 months; data not shown).
Using the Kaplan-Meier survival curve, Asian Indians had the longest 5-year OS probability of 77.9% and African Americans had the longest 10-year OS probability of 40.6%. However, Asians as a group demonstrated the longest median (SD) OS outcome with 119.8 (47.8) months (Figure 2).
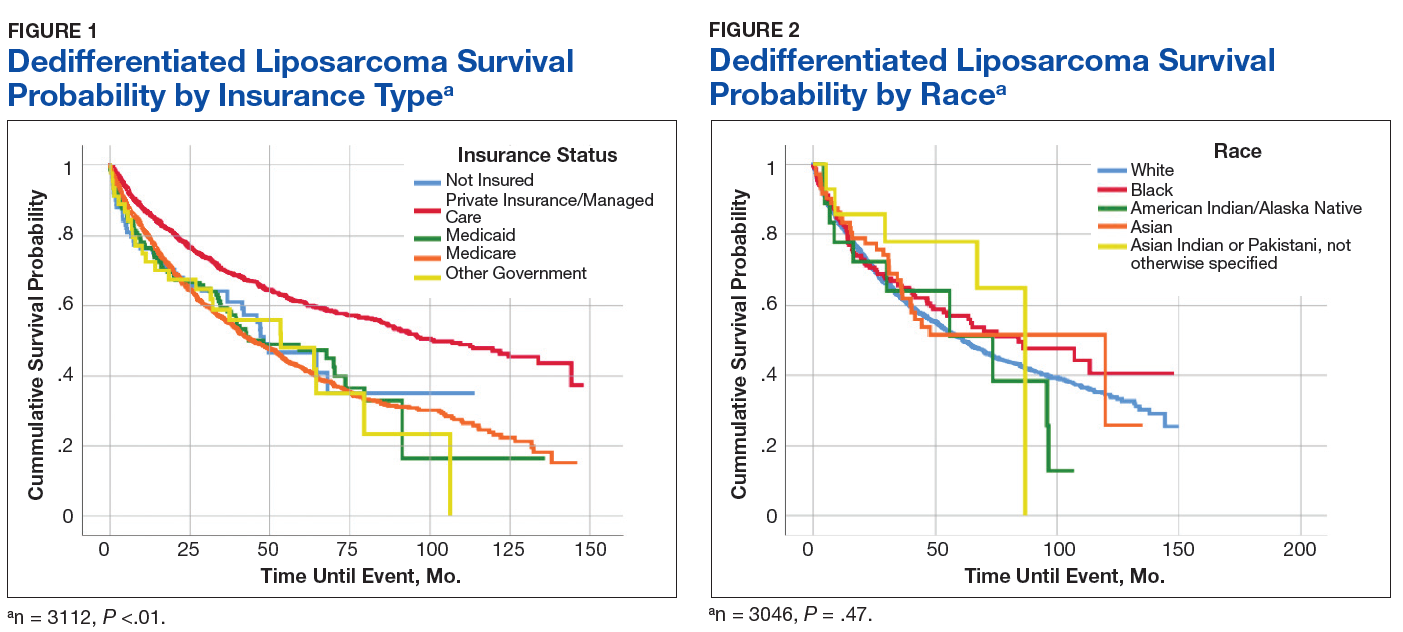
Overall, academic/research programs had the longest median OS and 5-year OS probability (SD) of 66.6 (4.5) months and 52.6%, respectively (Figure 3). Comprehensive community cancer programs and integrated network cancer programs had nearly identical 10-year OS rates (35.2% vs 35.1%, respectively). Community cancer programs had the worst 5- and 10-year OS probabilities (41.1% and 21.8%, respectively).
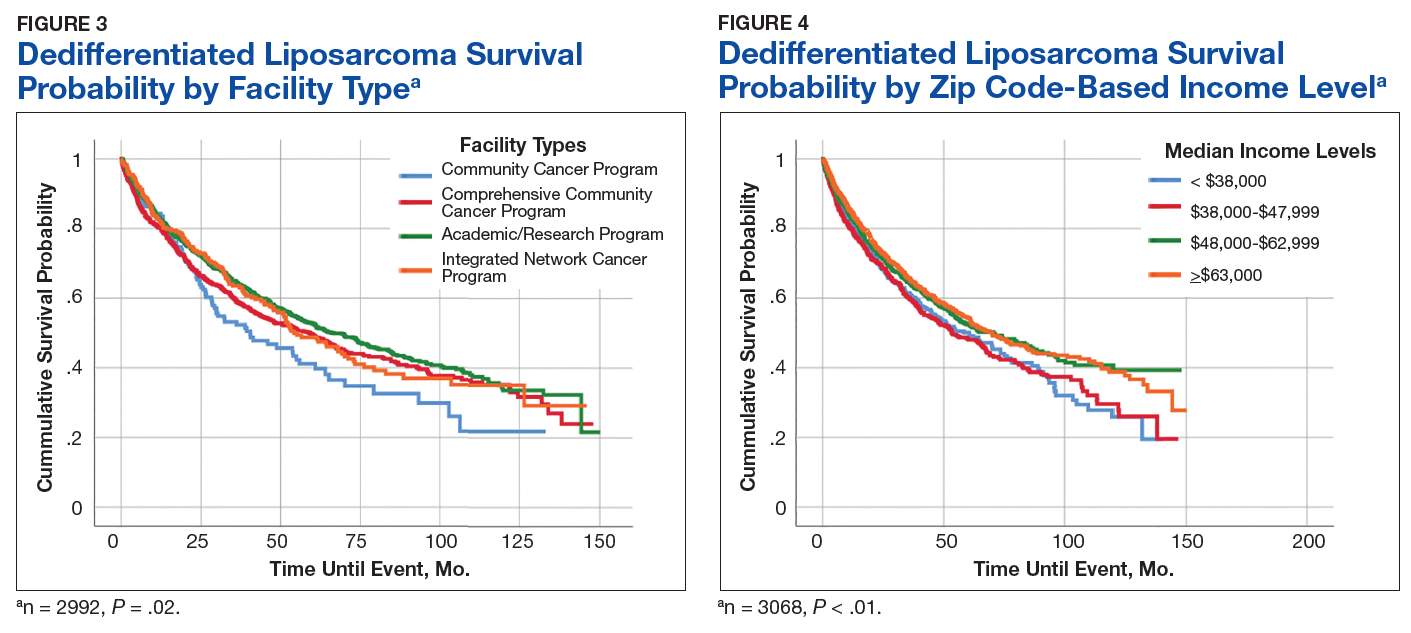
The top 2 income quartiles combined to demonstrate the longest median, 5-year, and 10-year OS probabilities and were very similar. Patients living in a zip code with the highest income level had the longest 5-year OS rates of 54.3%, while patients living in zip codes with a moderate income level had the longest 10-year OS at 39.3% and the longest median OS of about 71 months. Patients with the lowest level of median household income had the worst 5-year OS rates (48.3%) and a median (SD) OS of 53.4 (5.4) months (Figure 4).
A Kaplan-Meier curve for percentage of adults without a HS degree is displayed in Figure 5. Zip codes with the highest level of education had the longest 5-year OS rates and median (SD) OS of 55.3% and 70.9 (4.8) months, respectively. The longest 10-year OS outcomes at 38.1% were found in patients who lived in areas of low-education levels. The worst 5- and 10- year OS outcomes and median OS were found in the least educated zip codes.
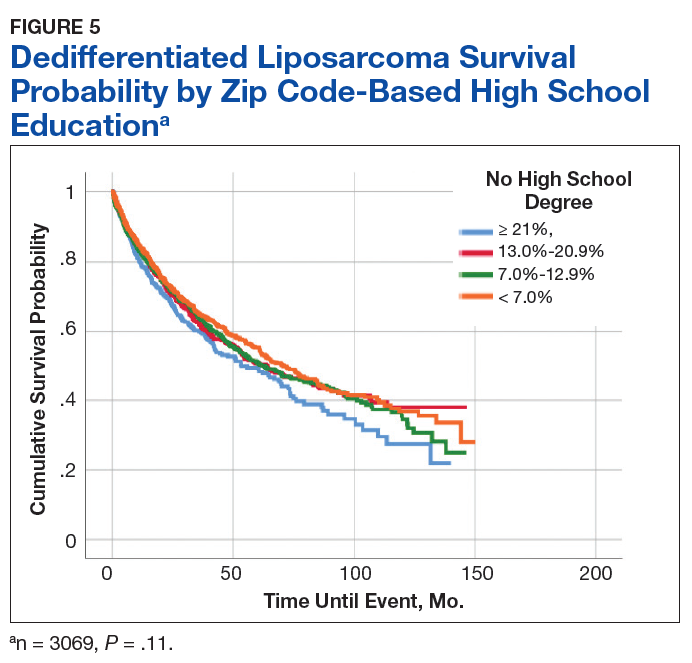
Results from the Cox regression model of OS are displayed in Table 4. Race and ethnicity, zip code-level median household income, and zip code-level education were not associated with OS. Patients with no insurance had an increased risk of death (hazard ratio [HR], 1.84; 95% CI, 1.17-2.88; P < .01) when compared with patients with private insurance. Patients with other government insurance also had an increased risk of death (HR, 2.12; 95% CI, 1.27-3.54; P < .01) when compared with patients with private insurance while controlling for all other variables. Patients with Medicare had a decreased risk of death when compared with patients with other government insurance and no insurance (HR, 0.53; 95% CI, 0.31-0.92; P = .02 and HR, 0.62; 95% CI, 0.38-0.99; P = .05, respectively). Patients treated at academic centers had better OS when compared with patients treated at comprehensive treatment centers (HR, 0.77; 95% CI, 0.65-0.92;P < .01) and community treatment centers (HR, 0.62; 95% CI, 0.44-0.86; P < .01).
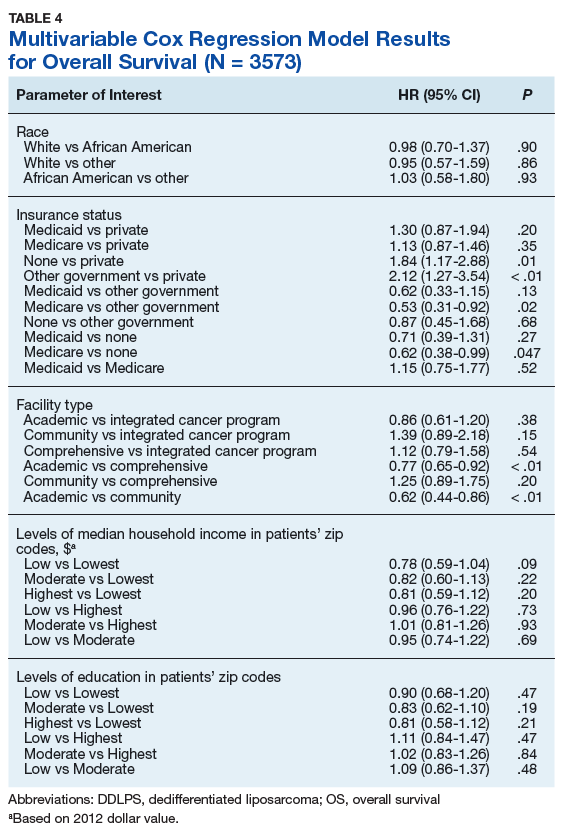
Discussion
This study is the largest study to date that specifically studies the type of treatment facilities and socioeconomic factors, including insurance status, race, income, and education, and how they affect survival of DDLPS. The overall 5- and 10-year OS probabilities for DDLPS in this study were 51.5% and 34.8%, respectively, with median OS of 63.6 months. These results were more encouraging than previous reports, which found a 5-year survival probability of 36.5% and a median OS of 45 months.13,14
The largest age grouping was aged 61 to 80 years (48.9% of the cohort), and the median age at diagnosis was 64 years. DDLPSs most typically present between the ages of 50 and 70 years.15 Our cohort was 65% male. Previous studies have indicated that DDLPSs affect the sexes equally; however, another study showed a similar male predominance (68.8%) at the MD Anderson Cancer Center in Houston, Texas.13,16
In our study, approximately 88% of patients were white, 6.5% were African American, and 2.5% were Asian, which differed from a previous study of 84 patients that had a 78.6% white, 4.8% Asian, and 1.2% African American patient population.14
Asian Indian or Pakistani patients had the best 5-year OS probability at 77.9%, followed by African American (57.2%), Asian (51.6%), AI/AN (51.4%), and white patients (50.9%). This trend had disappeared by 10 years and Asian, AI/AN, African American, and Asian Indian or Pakistani groups all demonstrated longer median OS than did white patients. In fact, Asian patients had the longest median OS at 119.8 months, which was almost double that of white patients with the lowest median OS of 61.2 months. This finding is contrary to previous studies, which reported that racial minorities typically had worse OS outcomes when compared with white patients in different types of cancer.7,17 Notably, these findings were not statistically significant in our current study in the log-rank or multivariable analyses.
Private insurance was the most common form of insurance followed in decreasing order by Medicare, Medicaid, uninsured, and other government insurance. About 42% of the cohort had Medicare, which is a federally funded US insurance program designated for patients aged ≥ 65 years and certain younger patients with disabilities.
Patients with private insurance demonstrated the longest OS, essentially twice the median OS of all other insured groups at 101 months. Medicare had the worst 5-year OS probability and median OS of all groups. A previous study of 77 patients with DDLPS reported that patients aged > 65 years had reduced OS.13 Medicare patients in this study were older, with a mean and median age at DDLPS diagnosis of 71 and 72 years, respectively, while private insurance had a mean and median age at diagnosis of 56 and 57 years, respectively. Medicare inherently covers older patients and this age difference could account for the decrease in overall survival.
Improved OS for privately insured patients was most notable compared with the uninsured or patients with other government insurance. Uninsured patients had an 83.7% increased risk of mortality when compared with patients with private insurance. When compared with patients with private insurance, patients with other government insurance had an 111.5% increased risk of mortality. Comparing patients with Medicare vs patients with no insurance or other government insurance, there was a decreased risk of mortality of 38.5% and 46.6%, respectively. This decreased OS in patients with other government insurance could be related to the choice of treatment facility, because only 31% of the patients with other government insurance went to academic or research centers when compared with the 58.4% and 50.8% of patients with private and Medicare insurance treated there (data not shown). Such centers often have access to more advanced technology and protocols that may not be available at other treatment facilities.
A little more than half of the patients in the cohort went to an academic or research center for treatment (53.7%); comprehensive community cancer programs were the second most common treatment facility at 28%. Patients treated at academic or research centers demonstrated the best outcomes with a 5-year OS of 52.6%, followed in decreasing order by comprehensive community cancer programs (49.7%), integrated network cancer programs (48.8%), and community cancer programs (41.1%). In our patient cocohort, patients treated at an academic/research center had slightly decreased 10-year OS rates compared with those patients treated at a comprehensive community cancer program, although the median OS for the academic/research centers were still the highest of all treatment facilities.
Treatment options varied significantly by facility, and the number of patients treated surgically followed a similar trend, with 92% undergoing surgery as the primary treatment at academic or research programs compared with 89% at comprehensive cancer programs and 82.7% at community cancer programs (data not shown). Another potential explaination for differing OS outcomes across facilities is the surgical margin outcome. Surgeries performed at community cancer programs or comprehensive cancer programs resulted with no residual tumor in 36% and 40% of cases, respectively, whereas cases performed at academic or research programs resulted with no residual tumor in 47% of cases (data not shown). Regardless, multivariate analysis demonstrated a marked decrease in the chance of mortality when comparing treatment received at academic facility centers with that received at comprehensive cancer centers (22.9%) and community cancer centers (38.3%) (data not shown).
A recent study demonstrated improved outcomes for patients with retroperitoneal or extremity STS treated at high-volume treatment centers.18 Patients treated at high-volume centers were found to have an 8% decreased risk of death compared with patients treated at low-volume centers. Notably, they found highvolume academic centers demonstrated the strongest improvement in survival, while highvolume community centers showed decreased survival.18 Similarly, we found that patients treated at academic/research institutions had improved 5-year OS and greater median OS than did patients treated at community cancer programs or comprehensive community cancer programs.
The top 2 income quartiles (≥ $48,000) combined to demonstrate the longest median, 5-year, and 10-year OS and were fairly similar between the quartiles. Patients living in zip codes with a median income of $38,000 to $47,999 had the worst 5-year OS and median OS. The log-rank analysis showed statistical evidence of differences in survival associated with income, but within the context of the multivariable analysis, there was no remaining evidence of a difference.
The longest 5-year OS outcomes were seen in patients living in zip codes with the highest level of education (55.3%). However, the difference in OS was not statistically significant using either the log-rank analysis or multivariate analysis.
Limitations
This study has certain inherent limitations in using a retrospective design and a large database such as the NCDB. Many different pathologists at CoC-accredited cancer programs perform the pathology that contributes to the data in the NCDB. There was no pathological review of these findings, which could potentially introduce error into the findings of this study. With the NCDB, potential selection bias is possible because patients in the database are added only from CoC-accredited cancer programs. This risk is minimized because NCDB contains data on most newly diagnosed cancer patients in the US. Further potential risks, which are unable to be controlled for, include potential interobserver error and data that may be incompletely, improperly, or inaccurately recorded from the patients’ charts. Without patient-specific information regarding income and education, it is challenging to utilize zip codes to estimate socioeconomic status and educational level. Even though a patient may live in a zip code identified with specific economic and educational characteristics, that patient may not share those characteristics. Furthermore, patients with Medicare tend to be older than patients with other forms of insurance, which limits the significance of comparisons across insurance groups. A future SEER (Surveillance, Epidemiology, and End Results) program study to confirm this study’s results and the effects of socioeconomic variables on DDLPS would be an excellent followup study.
Conclusion
This study used a large cohort of patients with DDLPS to study the effects of treatment facility, insurance status, and socioeconomic variables on survival outcomes. Although insurance status, median household income, and treatment facility were associated with differences in median OS and 5- and 10-year OS probabilities, evidence for a difference remained for only insurance status and facility type within the context of a multivariable analysis irrespective of age, race, sex, insurance status, education, and median income. Patients with private insurance and Medicaid had a decreased risk of mortality compared with other government insurance and no insurance. Patients receiving treatment at academic research programs had the highest median and 5-year OS of 66.6 months and 52.6%, respectively. Patients receiving treatment at academic centers had improved survival outcomes with a decrease in mortality of 23% and 38% compared to comprehensive or community cancer programs.
1. Dodd LG. Update on liposarcoma: a review for cytopathologists. Diagn Cytopathol. 2012;40(12):1122-1131.
2. Mangham D. World Health Organisation classification of tumours: pathology and genetics of tumours of soft tissue and bone. J Bone Joint Surg Am. 2004;86(3):466.
3. Dalal KM, Kattan MW, Antonescu CR, Brennan MF, Singer S. Subtype specific prognostic nomogram for patients with primary liposarcoma of the retroperitoneum, extremity, or trunk. Ann Surg. 2006;244(3):381-391.
4. Coindre JM, Pédeutour F, Aurias A. Well-differentiated and dedifferentiated liposarcomas. Virchows Arch. 2010;456(2):167-179.
5. Evans HL. Liposarcoma: a study of 55 cases with a reassessment of its classification. Am J Surg Pathol. 1979;3(6):507-523.
6. Henricks WH, Chu YC, Goldblum JR, Weiss SW. Dedifferentiated liposarcoma: a clinicopathological analysis of 155 cases with a proposal for an expanded definition of dedifferentiation. Am J Surg Pathol. 1997;21(3):271-281.
7. Ward E, Jemal A, Cokkinides V, et al. Cancer disparities by race/ethnicity and socioeconomic status. CA Cancer J Clin. 2004;54(2):78-93.
8. Halpern MT, Ward EM, Pavluck AL, Schrag NM, Bian J, Chen AY. Association of insurance status and ethnicity with cancer stage at diagnosis for 12 cancer sites: a retrospective analysis. Lancet Oncol. 2008;9(3):222-231.
9. Niu X, Roche LM, Pawlish KS, Henry KA. Cancer survival disparities by health insurance status. Cancer Med. 2013;2(3):403-411.
10. Hauser A, Dutta SW, Showalter TN, Sheehan JP, Grover S, Trifiletti DM. Impact of academic facility type and volume on post-surgical outcomes following diagnosis of glioblastoma. J Clin Neurosci. 2018;47:103-110.
11. Chu Q, Medeiros K, Zhou M, et al. Effect of facility type on outcome following pancreatectomy for pancreatic adenocarcinoma: analysis of the National Cancer Data Base [Abstract FP26-02]. HPB (Oxford). 2016;18(suppl 1):E81-E82.
12. Rubin SJ, Cohen MB, Kirke DN, Qureshi MM, Truong MT, Jalisi S. Comparison of facility type outcomes for oral cavity cancer: analysis of the National Cancer Database. Laryngoscope. 2017;127(11):2551-2557.
13. Lahat G, Anaya DA, Wang X, Tuvin D, Lev D, Pollock RE. Resectable well-differentiated versus dedifferentiated liposarcomas: two different diseases possibly requiring different treatment approaches. Ann Surg Oncol. 2008;15(6):1585-1593.
14. Livingston JA, Bugano D, Barbo A, et al. Role of chemotherapy in dedifferentiated liposarcoma of the retroperitoneum: defining the benefit and challenges of the standard. Sci Rep. 2017;7(1):11836.
15. Brennan MF, Antonescu CR, Alektiar KM, Maki RG. Management of Soft Tissue Sarcoma. 2nd ed. New York, NY: Springer; 2016.
16. Goldblum JR, Folpe AL, Weiss SW. Enzinger and Weiss’s Soft Tissue Tumors. 6th ed. Philadelphia, PA: Saunders; 2014.
17. White A, Djenaba J, Rim SH, Johnson CJ, Coleman MP, Allemani C. Colon cancer survival in the United States by race and stage (2001‐2009): findings from the CONCORD‐2 study. Cancer. 2017;123 (suppl 24):5014-5036.
18. Murphy JD, Padwal J, Guss ZD, Okamoto K, Sardar R. Impact of hospital volume on patterns of care and outcomes in soft tissue sarcoma [ASCO Abstract e23550]. J Clin Oncol. 2018;36(suppl 15):e23550
Approximately 17% to 25% of all softtissue sarcomas (STS) are liposarcomas, making liposarcoma the most common type of STS.1 The 2013 World Health Organization (WHO) classification separates liposarcoma into 4 histologic subtypes: atypical lipomatous tumor/well-differentiated (ALT/ WDLPS), dedifferentiated (DDLPS), myxoid, and pleomorphic.2 Each subtype has unique histology, morphology, and natural history. WDLPS and DDLPS are the most common histologic subtypes, comprising approximately 50% of all sarcomas that arise in the retroperitoneum.3 DDLPS represents 18% of all liposarcomas, making it the second most common subtype of liposarcoma.4
In 1979, DDLPS was first characterized.5 Most (90%) cases of DDLPS present de novo, whereas the other 10% transform from preexisting low-grade WDLPS.2 DDLPSs are formed by an amplification of 12q14-15 involving the MDM2 gene.4 These malignancies most commonly present in the retroperitoneum as a large painless mass, consisting of both fatty and nonfatty components.2 Primary site has been previously reported as a major prognostic factor for DDLPSs, with retroperitoneal DDLPSs demonstrating the worst prognosis.6 DDLPSs have a high risk of local recurrence, with some reports estimating recurrence rates approaching 40%.2 Overall mortality at 5 years for DDLPS is estimated to be between 30% and 40%.4
Previous literature has determined that median income, race, health insurance, and facility type are related to survival outcomes for patients with DDLPS.7-9 When comparing the most common types of cancers, residents of poorer US counties consistently had a higher risk of mortality than residents in affluent US counties, and all racial minorities showed worse survival outcomes when compared with white patients.7 Differences in survival outcomes have been reported in patients attending different treatment facilities for other cancers including pancreatic cancers, glioblastomas, and oral cancers, with multiple studies concluding that academic and research programs are associated with the longest survival outcomes.10-12 For many cancers, insurance status has been shown to be a significant prognostic factor, with private insurance typically resulting in the best prognosis.8,9
The goal of this retrospective study was to assess the prognostic effects of socioeconomic variables on the overall survival (OS) probabilities in a large cohort of DDLPS patients in order to inform clinicians about a potentially at-risk population.
Method
The National Cancer Database (NCDB) was created by the Commission on Cancer (CoC) of the American College of Surgeons and the American Cancer Society. The NCDB is the largest cancer database in the US and includes data on almost 70% of US patients with cancer. CoC-accredited cancer programs add data on patients with cancer to the NCDB. The authors accessed the NCDB data through the use of the NCDB Participant Use File program.
Patients’ data from 2004 through 2015 were abstracted. Only patients with the International Classification of Diseases for Oncology histology code 8858, corresponding to DDLPS, were analyzed. Patients with other comorbid malignant tumors were excluded to accurately capture the true survival rates for DDLPS. Variables analyzed included age, sex, race, insurance status, treatment facility type, median household income by zip code, and percentage of adults in the patient’s zip code with no high school (HS) education.
Median survival, 5- and 10-year OS probabilities, and Kaplan-Meier survival curves were calculated for multiple variables, specifically race, insurance status, treatment facility type, median family income, and percentage of adults without a HS degree. Both 5- and 10-year OS probabilities were determined by race with the patients separated into white, African American, Asian, American Indian/Alaska Native (AI/AN), and Asian Indian or Pakistani groups. Our study categorized Chinese, Japanese, Filipino, Hmong, Korean, Vietnamese, Thai, Guamanian, Asian not otherwise specified, and other Asian ethnicity patients together into one collective Asian group. Insurance status was classified into Medicare, Medicaid, other government insurance, and private insurance groups. Other government insurance consisted of US Department of Veterans Affairs, Indian Health Service, Public Health Service, and other government health care programs. Further analysis could not be performed into the distribution of the other government insurance variable.
Facility types were divided into 4 groups: community, comprehensive community, academic/ research, and integrated network cancer treatment facilities. Median income quartiles and the percentage of adults with no high school degree were estimated by comparison of the patient’s zip code with US Census Bureau data. Median household income was separated into 4 groups, including lowest level of household income (< $38,000), low level of household income ($38,000 to $47,999), moderate level of household income ($48,000 to $62,999), and highest level of household income (≥ $63,000). The percentages of adults with no high school degree were divided into 4 groups: lowest level of HS education (≥ 21% ), low level of HS education (13.0% to 20.9%), moderate level of HS education (7.0% to 12.9%), and highest level of HS education (≤ 7%). The 5- and 10-year survival probabilities were calculated using the number of months between the date of diagnosis and the date of death or last known contact.
Continuous variables are presented as median and interquartile range (IQR) whereas categorical variables are presented as frequencies and proportion. IBM SPSS version 25.0 was used to produce Kaplan-Meier survival curves and descriptive statistics. This study used Kaplan- Meier survival tables and log-rank tests to analyze both the 5- and 10-year OS rates for the 5 variables listed above. This study also used a multivariable Cox regression model that accommodated the correlative nature of outcomes within facilities to study the association of the treatment facility type and other socioeconomic factors, while controlling for age, race (which was collapsed into 3 categories), sex, primary site, tumor stage, and treatment approaches. The proportional hazards assumption was individually checked for all pertinent variables. Any patient records that were missing data were excluded from the multivariable Cox regression model, which was analyzed with SAS version 9.4 (Cary, NC). P < 0.05 was used to indicate statistical significance for all analyses.
Results
Table 1 provides descriptive analysis for demographic characteristics of the 3573 patients including age, sex, and race. The median age at diagnosis was 64 years. There were 1073 more men (65%) than women (35%) in this analysis. Whites were the predominant racial category, comprising 87.7% of the patient population, followed by African Americans (6.5%) and Asians (2.5%).
Socioeconomic Variables
The largest proportion of the patient population (45.5%) had private insurance (Table 2). Medicare came in a close second covering almost 42.2% of the population, followed by Medicaid (5.0%), uninsured (2.8%), and other government insurance (1.5%). About half (53.7%) of the patients were treated at academic or research facilities, while the fewest number of patients (5.2%) underwent treatment at community cancer facilities. The largest percentage (36.6%) of patients lived in zip codes with the highest level of median household income, while 26.0% and 22.3% had moderate and low levels of income, respectively. About 14% of patients lived within an area of the lowest level of income. Similarly, almost 15% of patients lived in an area of lowest level of HS education. The greatest percentage of the patient population (34.5%) lived in a zip code with moderate level of HS education. Surgery was the most common treatment modality with 90.8% of the cohort undergoing surgery, while 35.4% and 16.5% were treated with radiation and chemotherapy, respectively (some patients received more than one type of treatment modality).
Survival Data
Survival data were available for 3112 patients. Kaplan-Meier survival curves were used to analyze OS according to insurance status, racial background, treatment facility type, median family income, and percentage of adults with no high school education. Overall 5- and 10- year OS probabilities were 51.5% and 34.8%, respectively, while the median OS (SD) was 63.57 (2.8) months (Table 3).
Private insurance showed significantly higher 5- and 10-year OS probabilities and median OS: 5-year OS was 61.2%, 10-year OS was 47.2%, and median survival (SD) was 101.2 (8.2) months compared with that of all other insurance groups (Medicare, Medicaid, other government insurance, and uninsured) (Figure 1). These other insurance types were fairly similar in their 5-year and median OS, but surprisingly, patients with no insurance had the second longest 10-year OS. The difference between the 5-year OS probabilities of private insurance compared with an average of the other insurances was 15.1%, which had almost doubled to 28.5% at 10 years, with a median OS difference of almost 5 years (56 months; data not shown).
Using the Kaplan-Meier survival curve, Asian Indians had the longest 5-year OS probability of 77.9% and African Americans had the longest 10-year OS probability of 40.6%. However, Asians as a group demonstrated the longest median (SD) OS outcome with 119.8 (47.8) months (Figure 2).
Overall, academic/research programs had the longest median OS and 5-year OS probability (SD) of 66.6 (4.5) months and 52.6%, respectively (Figure 3). Comprehensive community cancer programs and integrated network cancer programs had nearly identical 10-year OS rates (35.2% vs 35.1%, respectively). Community cancer programs had the worst 5- and 10-year OS probabilities (41.1% and 21.8%, respectively).
The top 2 income quartiles combined to demonstrate the longest median, 5-year, and 10-year OS probabilities and were very similar. Patients living in a zip code with the highest income level had the longest 5-year OS rates of 54.3%, while patients living in zip codes with a moderate income level had the longest 10-year OS at 39.3% and the longest median OS of about 71 months. Patients with the lowest level of median household income had the worst 5-year OS rates (48.3%) and a median (SD) OS of 53.4 (5.4) months (Figure 4).
A Kaplan-Meier curve for percentage of adults without a HS degree is displayed in Figure 5. Zip codes with the highest level of education had the longest 5-year OS rates and median (SD) OS of 55.3% and 70.9 (4.8) months, respectively. The longest 10-year OS outcomes at 38.1% were found in patients who lived in areas of low-education levels. The worst 5- and 10- year OS outcomes and median OS were found in the least educated zip codes.
Results from the Cox regression model of OS are displayed in Table 4. Race and ethnicity, zip code-level median household income, and zip code-level education were not associated with OS. Patients with no insurance had an increased risk of death (hazard ratio [HR], 1.84; 95% CI, 1.17-2.88; P < .01) when compared with patients with private insurance. Patients with other government insurance also had an increased risk of death (HR, 2.12; 95% CI, 1.27-3.54; P < .01) when compared with patients with private insurance while controlling for all other variables. Patients with Medicare had a decreased risk of death when compared with patients with other government insurance and no insurance (HR, 0.53; 95% CI, 0.31-0.92; P = .02 and HR, 0.62; 95% CI, 0.38-0.99; P = .05, respectively). Patients treated at academic centers had better OS when compared with patients treated at comprehensive treatment centers (HR, 0.77; 95% CI, 0.65-0.92;P < .01) and community treatment centers (HR, 0.62; 95% CI, 0.44-0.86; P < .01).
Discussion
This study is the largest study to date that specifically studies the type of treatment facilities and socioeconomic factors, including insurance status, race, income, and education, and how they affect survival of DDLPS. The overall 5- and 10-year OS probabilities for DDLPS in this study were 51.5% and 34.8%, respectively, with median OS of 63.6 months. These results were more encouraging than previous reports, which found a 5-year survival probability of 36.5% and a median OS of 45 months.13,14
The largest age grouping was aged 61 to 80 years (48.9% of the cohort), and the median age at diagnosis was 64 years. DDLPSs most typically present between the ages of 50 and 70 years.15 Our cohort was 65% male. Previous studies have indicated that DDLPSs affect the sexes equally; however, another study showed a similar male predominance (68.8%) at the MD Anderson Cancer Center in Houston, Texas.13,16
In our study, approximately 88% of patients were white, 6.5% were African American, and 2.5% were Asian, which differed from a previous study of 84 patients that had a 78.6% white, 4.8% Asian, and 1.2% African American patient population.14
Asian Indian or Pakistani patients had the best 5-year OS probability at 77.9%, followed by African American (57.2%), Asian (51.6%), AI/AN (51.4%), and white patients (50.9%). This trend had disappeared by 10 years and Asian, AI/AN, African American, and Asian Indian or Pakistani groups all demonstrated longer median OS than did white patients. In fact, Asian patients had the longest median OS at 119.8 months, which was almost double that of white patients with the lowest median OS of 61.2 months. This finding is contrary to previous studies, which reported that racial minorities typically had worse OS outcomes when compared with white patients in different types of cancer.7,17 Notably, these findings were not statistically significant in our current study in the log-rank or multivariable analyses.
Private insurance was the most common form of insurance followed in decreasing order by Medicare, Medicaid, uninsured, and other government insurance. About 42% of the cohort had Medicare, which is a federally funded US insurance program designated for patients aged ≥ 65 years and certain younger patients with disabilities.
Patients with private insurance demonstrated the longest OS, essentially twice the median OS of all other insured groups at 101 months. Medicare had the worst 5-year OS probability and median OS of all groups. A previous study of 77 patients with DDLPS reported that patients aged > 65 years had reduced OS.13 Medicare patients in this study were older, with a mean and median age at DDLPS diagnosis of 71 and 72 years, respectively, while private insurance had a mean and median age at diagnosis of 56 and 57 years, respectively. Medicare inherently covers older patients and this age difference could account for the decrease in overall survival.
Improved OS for privately insured patients was most notable compared with the uninsured or patients with other government insurance. Uninsured patients had an 83.7% increased risk of mortality when compared with patients with private insurance. When compared with patients with private insurance, patients with other government insurance had an 111.5% increased risk of mortality. Comparing patients with Medicare vs patients with no insurance or other government insurance, there was a decreased risk of mortality of 38.5% and 46.6%, respectively. This decreased OS in patients with other government insurance could be related to the choice of treatment facility, because only 31% of the patients with other government insurance went to academic or research centers when compared with the 58.4% and 50.8% of patients with private and Medicare insurance treated there (data not shown). Such centers often have access to more advanced technology and protocols that may not be available at other treatment facilities.
A little more than half of the patients in the cohort went to an academic or research center for treatment (53.7%); comprehensive community cancer programs were the second most common treatment facility at 28%. Patients treated at academic or research centers demonstrated the best outcomes with a 5-year OS of 52.6%, followed in decreasing order by comprehensive community cancer programs (49.7%), integrated network cancer programs (48.8%), and community cancer programs (41.1%). In our patient cocohort, patients treated at an academic/research center had slightly decreased 10-year OS rates compared with those patients treated at a comprehensive community cancer program, although the median OS for the academic/research centers were still the highest of all treatment facilities.
Treatment options varied significantly by facility, and the number of patients treated surgically followed a similar trend, with 92% undergoing surgery as the primary treatment at academic or research programs compared with 89% at comprehensive cancer programs and 82.7% at community cancer programs (data not shown). Another potential explaination for differing OS outcomes across facilities is the surgical margin outcome. Surgeries performed at community cancer programs or comprehensive cancer programs resulted with no residual tumor in 36% and 40% of cases, respectively, whereas cases performed at academic or research programs resulted with no residual tumor in 47% of cases (data not shown). Regardless, multivariate analysis demonstrated a marked decrease in the chance of mortality when comparing treatment received at academic facility centers with that received at comprehensive cancer centers (22.9%) and community cancer centers (38.3%) (data not shown).
A recent study demonstrated improved outcomes for patients with retroperitoneal or extremity STS treated at high-volume treatment centers.18 Patients treated at high-volume centers were found to have an 8% decreased risk of death compared with patients treated at low-volume centers. Notably, they found highvolume academic centers demonstrated the strongest improvement in survival, while highvolume community centers showed decreased survival.18 Similarly, we found that patients treated at academic/research institutions had improved 5-year OS and greater median OS than did patients treated at community cancer programs or comprehensive community cancer programs.
The top 2 income quartiles (≥ $48,000) combined to demonstrate the longest median, 5-year, and 10-year OS and were fairly similar between the quartiles. Patients living in zip codes with a median income of $38,000 to $47,999 had the worst 5-year OS and median OS. The log-rank analysis showed statistical evidence of differences in survival associated with income, but within the context of the multivariable analysis, there was no remaining evidence of a difference.
The longest 5-year OS outcomes were seen in patients living in zip codes with the highest level of education (55.3%). However, the difference in OS was not statistically significant using either the log-rank analysis or multivariate analysis.
Limitations
This study has certain inherent limitations in using a retrospective design and a large database such as the NCDB. Many different pathologists at CoC-accredited cancer programs perform the pathology that contributes to the data in the NCDB. There was no pathological review of these findings, which could potentially introduce error into the findings of this study. With the NCDB, potential selection bias is possible because patients in the database are added only from CoC-accredited cancer programs. This risk is minimized because NCDB contains data on most newly diagnosed cancer patients in the US. Further potential risks, which are unable to be controlled for, include potential interobserver error and data that may be incompletely, improperly, or inaccurately recorded from the patients’ charts. Without patient-specific information regarding income and education, it is challenging to utilize zip codes to estimate socioeconomic status and educational level. Even though a patient may live in a zip code identified with specific economic and educational characteristics, that patient may not share those characteristics. Furthermore, patients with Medicare tend to be older than patients with other forms of insurance, which limits the significance of comparisons across insurance groups. A future SEER (Surveillance, Epidemiology, and End Results) program study to confirm this study’s results and the effects of socioeconomic variables on DDLPS would be an excellent followup study.
Conclusion
This study used a large cohort of patients with DDLPS to study the effects of treatment facility, insurance status, and socioeconomic variables on survival outcomes. Although insurance status, median household income, and treatment facility were associated with differences in median OS and 5- and 10-year OS probabilities, evidence for a difference remained for only insurance status and facility type within the context of a multivariable analysis irrespective of age, race, sex, insurance status, education, and median income. Patients with private insurance and Medicaid had a decreased risk of mortality compared with other government insurance and no insurance. Patients receiving treatment at academic research programs had the highest median and 5-year OS of 66.6 months and 52.6%, respectively. Patients receiving treatment at academic centers had improved survival outcomes with a decrease in mortality of 23% and 38% compared to comprehensive or community cancer programs.
1. Dodd LG. Update on liposarcoma: a review for cytopathologists. Diagn Cytopathol. 2012;40(12):1122-1131.
2. Mangham D. World Health Organisation classification of tumours: pathology and genetics of tumours of soft tissue and bone. J Bone Joint Surg Am. 2004;86(3):466.
3. Dalal KM, Kattan MW, Antonescu CR, Brennan MF, Singer S. Subtype specific prognostic nomogram for patients with primary liposarcoma of the retroperitoneum, extremity, or trunk. Ann Surg. 2006;244(3):381-391.
4. Coindre JM, Pédeutour F, Aurias A. Well-differentiated and dedifferentiated liposarcomas. Virchows Arch. 2010;456(2):167-179.
5. Evans HL. Liposarcoma: a study of 55 cases with a reassessment of its classification. Am J Surg Pathol. 1979;3(6):507-523.
6. Henricks WH, Chu YC, Goldblum JR, Weiss SW. Dedifferentiated liposarcoma: a clinicopathological analysis of 155 cases with a proposal for an expanded definition of dedifferentiation. Am J Surg Pathol. 1997;21(3):271-281.
7. Ward E, Jemal A, Cokkinides V, et al. Cancer disparities by race/ethnicity and socioeconomic status. CA Cancer J Clin. 2004;54(2):78-93.
8. Halpern MT, Ward EM, Pavluck AL, Schrag NM, Bian J, Chen AY. Association of insurance status and ethnicity with cancer stage at diagnosis for 12 cancer sites: a retrospective analysis. Lancet Oncol. 2008;9(3):222-231.
9. Niu X, Roche LM, Pawlish KS, Henry KA. Cancer survival disparities by health insurance status. Cancer Med. 2013;2(3):403-411.
10. Hauser A, Dutta SW, Showalter TN, Sheehan JP, Grover S, Trifiletti DM. Impact of academic facility type and volume on post-surgical outcomes following diagnosis of glioblastoma. J Clin Neurosci. 2018;47:103-110.
11. Chu Q, Medeiros K, Zhou M, et al. Effect of facility type on outcome following pancreatectomy for pancreatic adenocarcinoma: analysis of the National Cancer Data Base [Abstract FP26-02]. HPB (Oxford). 2016;18(suppl 1):E81-E82.
12. Rubin SJ, Cohen MB, Kirke DN, Qureshi MM, Truong MT, Jalisi S. Comparison of facility type outcomes for oral cavity cancer: analysis of the National Cancer Database. Laryngoscope. 2017;127(11):2551-2557.
13. Lahat G, Anaya DA, Wang X, Tuvin D, Lev D, Pollock RE. Resectable well-differentiated versus dedifferentiated liposarcomas: two different diseases possibly requiring different treatment approaches. Ann Surg Oncol. 2008;15(6):1585-1593.
14. Livingston JA, Bugano D, Barbo A, et al. Role of chemotherapy in dedifferentiated liposarcoma of the retroperitoneum: defining the benefit and challenges of the standard. Sci Rep. 2017;7(1):11836.
15. Brennan MF, Antonescu CR, Alektiar KM, Maki RG. Management of Soft Tissue Sarcoma. 2nd ed. New York, NY: Springer; 2016.
16. Goldblum JR, Folpe AL, Weiss SW. Enzinger and Weiss’s Soft Tissue Tumors. 6th ed. Philadelphia, PA: Saunders; 2014.
17. White A, Djenaba J, Rim SH, Johnson CJ, Coleman MP, Allemani C. Colon cancer survival in the United States by race and stage (2001‐2009): findings from the CONCORD‐2 study. Cancer. 2017;123 (suppl 24):5014-5036.
18. Murphy JD, Padwal J, Guss ZD, Okamoto K, Sardar R. Impact of hospital volume on patterns of care and outcomes in soft tissue sarcoma [ASCO Abstract e23550]. J Clin Oncol. 2018;36(suppl 15):e23550
Prevalence of Cancer in Thyroid Nodules In the Veteran Population (FULL)
Thyroid nodules are identified incidentally in 4% to 10% of the general population in the US.1,2 Clinicians and patients often are concerned about potential malignancy when thyroid nodules are identified because 5% to 15% of nodules will be cancerous.1 The most common form of cancer is papillary carcinoma followed by follicular carcinoma.2 Initially, serum thyroid-stimulating hormone (TSH) levels and thyroid ultrasound are used to evaluate a thyroid nodule because both tests can reveal vital information about malignancy potential.3 Ultrasound characteristics, such as macrocalcifications, hypoechogenicity, absence of halo, increased vascularity, and irregular nodular margins, increase suspicion for malignancy and warrant further investigation.3
Ultrasound-guided fine-needle aspiration (FNA) is the modality of choice for evaluation of thyroid nodules with sensitivity and specificity > 90%.2,4 Most patients receive a definitive diagnosis with this test; however, about 25% of cases are indeterminate based on the Bethesda System and require surgical investigation.3
Currently, it is well accepted clinical practice to refer all nodules > 4 cm for surgical intervention regardless of malignancy risk factors or the mass effect of the nodule.3-6 The preference for surgery—rather than FNA—is because of the notable false negative rate with FNA in larger nodules; studies have described false negative rates for FNA close to 10%.7,8 In contrast, Megwalu recently reported a FNA false negative rate of 0%.9
The risk of malignancy associated with nodule size has been researched for many years, but studies have produced conflicting results. In this retrospective cohort study, the authors compared malignancy rates between patients with nodules ≥ 3 cm and those with nodules < 3 cm.
Methods
The authors performed a retrospective chart review of the medical records of 329 patients presenting for thyroid nodule evaluation found on physical exam or incidentally identified with imaging at the Dayton Veteran Affairs Medical Center from January 2000 to May 2016. Data collection included sex, age, race, personal history of neck radiation treatment, family history of thyroid cancer, personal history of thyroid cancer, hot nodules/Graves disease, abnormal neck lymph nodes, and serum TSH levels. The authors looked for an association between TSH level and cancer. Hot thyroid nodules are known to have low risk of malignancy.
All patients aged 18 to 99 years with a thyroid nodule evaluated with FNA were included in the study. Patients were divided into 2 groups, those with nodules ≥ 3 cm and those with nodules < 3 cm. For nodules requiring subsequent biopsies, only the initial nodule biopsy was included in our study. The 3-cm cutoff was selected based on previous studies.1,5,10 Patients who did not undergo a FNA study were excluded. Indications for surgery were positive FNA results, suspicious imaging, size of nodule, or patient preference.
Means and standard deviations are reported for continuous variables and counts and percentages for categorical variables. We used the Mann-Whitney test for comparisons involving continuous variables with 2 groups and the Kruskal-Wallis test for 4 groups. The chi-square test—corrected for continuity if necessary—was used to compare 2 categorical variables. We used multiple logistic regression to adjust for demographic and clinical variables other than nodule size that were related to malignancy. Inferences were made at the 0.05 level of significance.
Results
A total of 329 patients with thyroid nodules were identified: 236 were < 3 cm and 93 were ≥ 3 cm. The 2 groups differed on race, with more white patients in the < 3-cm nodule group (78% vs 67%, P = .036) (Table 1). 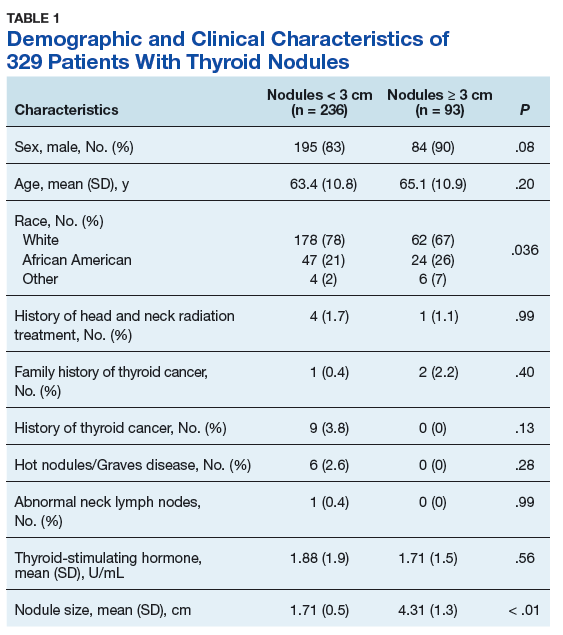
Prevalence of cancer based on FNA in nodules < 3 cm was 6.4% (95% CI, 3.6%–10.3%) and nodules ≥ 3 cm was 8.6% (95% CI, 3.8%–16.2%; P = .23) (Table 2). 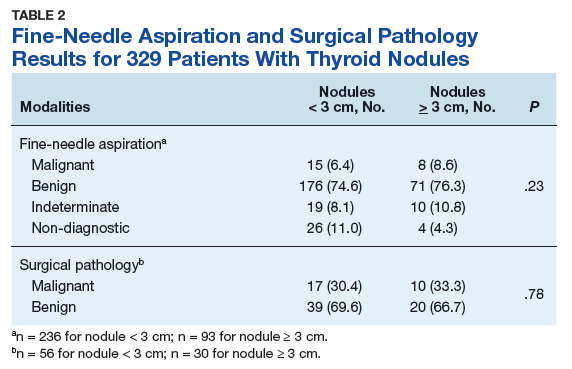
When divided into 4 subgroups, cancer using FNA was found in 35.1% of nodules < 2 cm, 21.1% of nodules 2 cm to < 3 cm, 42.1% of nodules 3 cm to 4 cm, and 18.2% of nodules > 4 cm (P = .32) (Table 3). 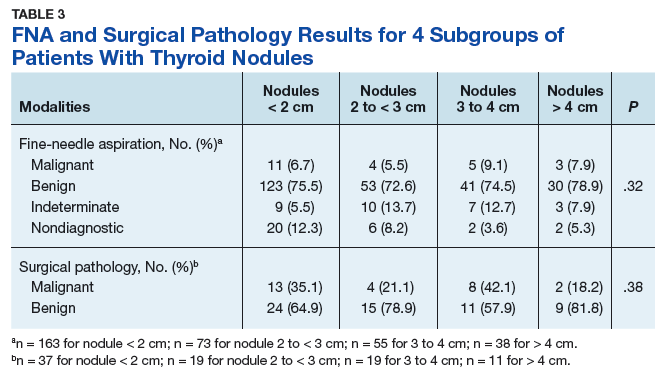
Surgical pathology results showed 17 cases of papillary carcinoma in nodules < 3 cm, whereas there were 9 cases of papillary carcinoma and 1 case of follicular carcinoma in nodules > 3 cm. When correlated with the cytology results, 10 cases were reported as benign, 11 were malignant, and 6 samples were non-diagnostic.
There were 30 nondiagnostic FNA samples: 7 patients had surgery, 19 were monitored with serial imaging, 2 were lost to follow-up, and 2 expired for other reasons. Of the 19 patients who were monitored with serial imaging, the nodules were stable and did not require repeat sampling.
Discussion
The authors found no relationship between thyroid nodule size and malignancy over a 16-year period in a veteran population, either with FNA or surgical pathology. The lack of relationship persists when adjusted for the only nonthyroid variable on which the 2 groups differed (race).
The finding of no relationship between larger thyroid nodule size and cancer is consistent with other studies. In a 10-year chart review of 695 patients at Walter Reed Army Medical Center, Burch and colleagues found a malignancy rate of 18.6% but no association between thyroid nodule size and malignancy.11 They concluded that nodules ≥ 4 cm did not increase malignancy risk. In a 3-year retrospective study of 326 patients, Mangister and colleagues reported that the malignancy rate was higher in nodules < 3 cm (48.4%) compared with nodules ≥ 3 cm (33.3%).10 This study concluded that the malignancy potential of thyroid nodules peaked at 2 cm and decreased at > 3 cm. Kamran and colleagues reported a nonlinear relationship between nodule size and malignancy with a threshold of 2 cm, beyond which there was no increased risk of malignancy.1
Conversely, in a prospective study Kuru and colleagues followed 571 patients who had undergone thyroidectomy and found that nodules ≥ 4 cm were associated with increased malignancy risk compared with nodules < 4 cm. However, with a cutoff of 3 cm there was no relationship.5 Discrepancies among studies might be because of variability in patient demographics and the prevalence of thyroid cancer in a specific institution. Although the majority of thyroid nodules are seen in females, the current study’s population was predominantly male and entirely veteran. Consequently, interpretation of these studies highlight the need to individualize clinical decision-making for each patient.
Limitations
This study has several limitations. It was conducted at a single institution with a group of veterans, which limits the ability to generalize its results to the general population. Second, data omissions are likely in retrospective chart reviews, and ensuring accuracy of data collection could be challenging. Third, all thyroid nodules found to be benign with cytology did not undergo surgical intervention to confirm the diagnosis; therefore, only 93 of 329 nodules were evaluated with the definitive diagnostic test. Therefore, selection bias was introduced into the nodule size comparisons when surgical intervention was used to measure the outcome. However, because false negative rates for FNA is low, likely few malignant nodules were missed. In addition, all patients with thyroid nodules are not referred for surgery because of potential complications.
Conclusion
This study strongly suggests there is no increased or decreased cancer risk for thyroid nodules ≥ 3 cm compared with those < 3 cm. Current clinical practice is to refer patients with larger nodules for surgical evaluation. In a large systemic review, Shin and colleagues reported higher pretest probability of malignancy in larger nodules and recommended consideration of surgical intervention for nodules > 3 cm because of false negatives and concerns for diagnostic inaccuracy with FNA.8 Although data were mixed, Shin and colleagues reported higher incidence of false negative FNA results in larger nodules.8 Given the authors’ findings and earlier conflicting results, the decision for surgical intervention cannot be made solely on nodule size and requires consideration of additional factors including FNA results, nodule characteristics, patient risk factors, and patient preference.
1. Kamran SC, Marqusee E, Kim MI, et al. Thyroid nodule size and prediction of cancer. J Clin Endocrinol Metab. 2013;98(2):564-570.
2. Haugen BR, Alexander EK, Bible KC, et al. 2015 American Thyroid Association Management guidelines for adult patients with thyroid nodules and differentiated thyroid cancer: The American Thyroid Association Guidelines Task Force on Thyroid Nodules and Differentiated Thyroid Cancer. Thyroid. 2016;26(1):1-33.
3. Popoveniuc G, Jonklaas J. Thyroid nodules. Med Clin North Am. 2012;96(2):329-349.
4. Amrikachi M, Ramzy I, Rubenfeld S, Wheeler TM. Accuracy of fine needle aspiration of thyroid. Arch Pathol Lab Med. 2001;125(4):484-488.
5. Kuru B, Gulcelik NE, Gulcelik MA, Dincer H. Predictive index for carcinoma of thyroid nodules and its integration with fine-needle aspiration cytology. Head Neck. 2009;31(7):856-866.
6. Kim JH, Kim NK, Oh YL, et al. The validity of ultrasonography-guided fine needle aspiration biopsy in thyroid nodules 4 cm or larger depends on ultrasound characteristics. Endocrinol Metab (Seoul). 2014;29(4):545-552.
7. Wharry LI, McCoy KL, Stang MT, et al. Thyroid nodules (≥4 cm): can ultrasound and cytology reliably exclude cancer? World J Surg. 2014;38(3):614-621.
8. Pinchot SN, Al-Wagih H, Schaefer S, Sippel R, Chen H. Accuracy of fine needle aspiration biopsy for predicting neoplasm or carcinoma in thyroid nodules 4 cm or larger. Arch Surg. 2009;144(7):649-655.
9. Megwalu UC. Risk of malignancy in thyroid nodules 4 cm or larger. Endocrinol Metab (Seoul). 2017;32(1):77-82.
10. Magister MJ, Chaikhoutdinov I, Schaefer E, et al. Association of thyroid nodule size and Bethesda class with rate of malignant disease. JAMA Otolaryngol Head Neck Surg. 2015;141(12):1089-1095.
11. Shrestha M, Crothers BA, Burch HB. The impact of thyroid nodule size on the risk of malignancy and accuracy of fine needle aspiration: a 10-year study from a single institution. Thyroid. 2012;22(12):1251-1256.
Thyroid nodules are identified incidentally in 4% to 10% of the general population in the US.1,2 Clinicians and patients often are concerned about potential malignancy when thyroid nodules are identified because 5% to 15% of nodules will be cancerous.1 The most common form of cancer is papillary carcinoma followed by follicular carcinoma.2 Initially, serum thyroid-stimulating hormone (TSH) levels and thyroid ultrasound are used to evaluate a thyroid nodule because both tests can reveal vital information about malignancy potential.3 Ultrasound characteristics, such as macrocalcifications, hypoechogenicity, absence of halo, increased vascularity, and irregular nodular margins, increase suspicion for malignancy and warrant further investigation.3
Ultrasound-guided fine-needle aspiration (FNA) is the modality of choice for evaluation of thyroid nodules with sensitivity and specificity > 90%.2,4 Most patients receive a definitive diagnosis with this test; however, about 25% of cases are indeterminate based on the Bethesda System and require surgical investigation.3
Currently, it is well accepted clinical practice to refer all nodules > 4 cm for surgical intervention regardless of malignancy risk factors or the mass effect of the nodule.3-6 The preference for surgery—rather than FNA—is because of the notable false negative rate with FNA in larger nodules; studies have described false negative rates for FNA close to 10%.7,8 In contrast, Megwalu recently reported a FNA false negative rate of 0%.9
The risk of malignancy associated with nodule size has been researched for many years, but studies have produced conflicting results. In this retrospective cohort study, the authors compared malignancy rates between patients with nodules ≥ 3 cm and those with nodules < 3 cm.
Methods
The authors performed a retrospective chart review of the medical records of 329 patients presenting for thyroid nodule evaluation found on physical exam or incidentally identified with imaging at the Dayton Veteran Affairs Medical Center from January 2000 to May 2016. Data collection included sex, age, race, personal history of neck radiation treatment, family history of thyroid cancer, personal history of thyroid cancer, hot nodules/Graves disease, abnormal neck lymph nodes, and serum TSH levels. The authors looked for an association between TSH level and cancer. Hot thyroid nodules are known to have low risk of malignancy.
All patients aged 18 to 99 years with a thyroid nodule evaluated with FNA were included in the study. Patients were divided into 2 groups, those with nodules ≥ 3 cm and those with nodules < 3 cm. For nodules requiring subsequent biopsies, only the initial nodule biopsy was included in our study. The 3-cm cutoff was selected based on previous studies.1,5,10 Patients who did not undergo a FNA study were excluded. Indications for surgery were positive FNA results, suspicious imaging, size of nodule, or patient preference.
Means and standard deviations are reported for continuous variables and counts and percentages for categorical variables. We used the Mann-Whitney test for comparisons involving continuous variables with 2 groups and the Kruskal-Wallis test for 4 groups. The chi-square test—corrected for continuity if necessary—was used to compare 2 categorical variables. We used multiple logistic regression to adjust for demographic and clinical variables other than nodule size that were related to malignancy. Inferences were made at the 0.05 level of significance.
Results
A total of 329 patients with thyroid nodules were identified: 236 were < 3 cm and 93 were ≥ 3 cm. The 2 groups differed on race, with more white patients in the < 3-cm nodule group (78% vs 67%, P = .036) (Table 1).
Prevalence of cancer based on FNA in nodules < 3 cm was 6.4% (95% CI, 3.6%–10.3%) and nodules ≥ 3 cm was 8.6% (95% CI, 3.8%–16.2%; P = .23) (Table 2).
When divided into 4 subgroups, cancer using FNA was found in 35.1% of nodules < 2 cm, 21.1% of nodules 2 cm to < 3 cm, 42.1% of nodules 3 cm to 4 cm, and 18.2% of nodules > 4 cm (P = .32) (Table 3).
Surgical pathology results showed 17 cases of papillary carcinoma in nodules < 3 cm, whereas there were 9 cases of papillary carcinoma and 1 case of follicular carcinoma in nodules > 3 cm. When correlated with the cytology results, 10 cases were reported as benign, 11 were malignant, and 6 samples were non-diagnostic.
There were 30 nondiagnostic FNA samples: 7 patients had surgery, 19 were monitored with serial imaging, 2 were lost to follow-up, and 2 expired for other reasons. Of the 19 patients who were monitored with serial imaging, the nodules were stable and did not require repeat sampling.
Discussion
The authors found no relationship between thyroid nodule size and malignancy over a 16-year period in a veteran population, either with FNA or surgical pathology. The lack of relationship persists when adjusted for the only nonthyroid variable on which the 2 groups differed (race).
The finding of no relationship between larger thyroid nodule size and cancer is consistent with other studies. In a 10-year chart review of 695 patients at Walter Reed Army Medical Center, Burch and colleagues found a malignancy rate of 18.6% but no association between thyroid nodule size and malignancy.11 They concluded that nodules ≥ 4 cm did not increase malignancy risk. In a 3-year retrospective study of 326 patients, Mangister and colleagues reported that the malignancy rate was higher in nodules < 3 cm (48.4%) compared with nodules ≥ 3 cm (33.3%).10 This study concluded that the malignancy potential of thyroid nodules peaked at 2 cm and decreased at > 3 cm. Kamran and colleagues reported a nonlinear relationship between nodule size and malignancy with a threshold of 2 cm, beyond which there was no increased risk of malignancy.1
Conversely, in a prospective study Kuru and colleagues followed 571 patients who had undergone thyroidectomy and found that nodules ≥ 4 cm were associated with increased malignancy risk compared with nodules < 4 cm. However, with a cutoff of 3 cm there was no relationship.5 Discrepancies among studies might be because of variability in patient demographics and the prevalence of thyroid cancer in a specific institution. Although the majority of thyroid nodules are seen in females, the current study’s population was predominantly male and entirely veteran. Consequently, interpretation of these studies highlight the need to individualize clinical decision-making for each patient.
Limitations
This study has several limitations. It was conducted at a single institution with a group of veterans, which limits the ability to generalize its results to the general population. Second, data omissions are likely in retrospective chart reviews, and ensuring accuracy of data collection could be challenging. Third, all thyroid nodules found to be benign with cytology did not undergo surgical intervention to confirm the diagnosis; therefore, only 93 of 329 nodules were evaluated with the definitive diagnostic test. Therefore, selection bias was introduced into the nodule size comparisons when surgical intervention was used to measure the outcome. However, because false negative rates for FNA is low, likely few malignant nodules were missed. In addition, all patients with thyroid nodules are not referred for surgery because of potential complications.
Conclusion
This study strongly suggests there is no increased or decreased cancer risk for thyroid nodules ≥ 3 cm compared with those < 3 cm. Current clinical practice is to refer patients with larger nodules for surgical evaluation. In a large systemic review, Shin and colleagues reported higher pretest probability of malignancy in larger nodules and recommended consideration of surgical intervention for nodules > 3 cm because of false negatives and concerns for diagnostic inaccuracy with FNA.8 Although data were mixed, Shin and colleagues reported higher incidence of false negative FNA results in larger nodules.8 Given the authors’ findings and earlier conflicting results, the decision for surgical intervention cannot be made solely on nodule size and requires consideration of additional factors including FNA results, nodule characteristics, patient risk factors, and patient preference.
1. Kamran SC, Marqusee E, Kim MI, et al. Thyroid nodule size and prediction of cancer. J Clin Endocrinol Metab. 2013;98(2):564-570.
2. Haugen BR, Alexander EK, Bible KC, et al. 2015 American Thyroid Association Management guidelines for adult patients with thyroid nodules and differentiated thyroid cancer: The American Thyroid Association Guidelines Task Force on Thyroid Nodules and Differentiated Thyroid Cancer. Thyroid. 2016;26(1):1-33.
3. Popoveniuc G, Jonklaas J. Thyroid nodules. Med Clin North Am. 2012;96(2):329-349.
4. Amrikachi M, Ramzy I, Rubenfeld S, Wheeler TM. Accuracy of fine needle aspiration of thyroid. Arch Pathol Lab Med. 2001;125(4):484-488.
5. Kuru B, Gulcelik NE, Gulcelik MA, Dincer H. Predictive index for carcinoma of thyroid nodules and its integration with fine-needle aspiration cytology. Head Neck. 2009;31(7):856-866.
6. Kim JH, Kim NK, Oh YL, et al. The validity of ultrasonography-guided fine needle aspiration biopsy in thyroid nodules 4 cm or larger depends on ultrasound characteristics. Endocrinol Metab (Seoul). 2014;29(4):545-552.
7. Wharry LI, McCoy KL, Stang MT, et al. Thyroid nodules (≥4 cm): can ultrasound and cytology reliably exclude cancer? World J Surg. 2014;38(3):614-621.
8. Pinchot SN, Al-Wagih H, Schaefer S, Sippel R, Chen H. Accuracy of fine needle aspiration biopsy for predicting neoplasm or carcinoma in thyroid nodules 4 cm or larger. Arch Surg. 2009;144(7):649-655.
9. Megwalu UC. Risk of malignancy in thyroid nodules 4 cm or larger. Endocrinol Metab (Seoul). 2017;32(1):77-82.
10. Magister MJ, Chaikhoutdinov I, Schaefer E, et al. Association of thyroid nodule size and Bethesda class with rate of malignant disease. JAMA Otolaryngol Head Neck Surg. 2015;141(12):1089-1095.
11. Shrestha M, Crothers BA, Burch HB. The impact of thyroid nodule size on the risk of malignancy and accuracy of fine needle aspiration: a 10-year study from a single institution. Thyroid. 2012;22(12):1251-1256.
Review of Radiologic Considerations in an Immunocompetent Patient With Primary Central Nervous System Lymphoma (FULL)
Central nervous system (CNS) lymphoma can be classified into 2 categories: primary CNS lymphoma (PCNSL), which includes disease limited to brain, eyes, spinal cord; and leptomeninges without coexisting or previous systemic lymphoma. Secondary CNS lymphoma (SCNSL) is essentially metastatic disease from a systemic primary site.1 The focus of this case presentation is PCNSL, with an emphasis on imaging characteristics and differential diagnosis.
The median age at diagnosis for PCNSL is 65 years, and the overall incidence has been decreasing since the mid-1990s, likely related to the increased use of highly-active antiretroviral therapy (HAART) in patients with AIDS.2,3 Although overall incidence has decreased, incidence in the elderly population has increased.4 Historically, PCNSL has been considered an AIDS-defining illness.5 These patients, among other immunocompromised patients, such as those on chronic immunosuppressive therapy, are at a higher risk for developing the malignancy.6
Clinical presentation varies because of the location of CNS involvement and may present with headache, mood or personality disturbances, or focal neurologic deficits. Seizures are less likely due to the tendency of PCNSL to spare gray matter. Initial workup generally includes a head computed tomography (CT) scan, as well as a contrast-enhanced magnetic resonance image (MRI), which may help direct clinicians to the appropriate diagnosis. However, there is significant overlap between the imaging characteristics of PCNSL and numerous other disease processes, including glioblastoma and demyelination. The imaging characteristics of PCNSL are considerably different depending on the patient’s immune status.7
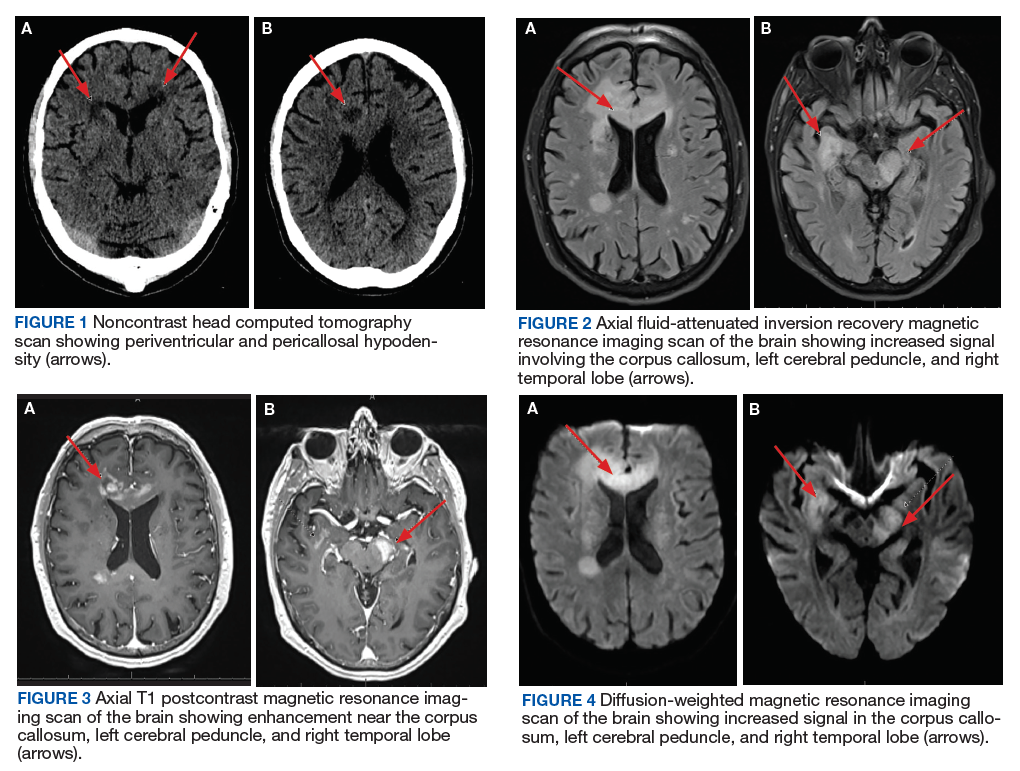
This case illustrates a rare presentation of PCNSL in an immunocompetent patient whose MRI characteristics were seemingly more consistent with those seen in patients with immunodeficiency. The main differential diagnoses and key imaging characteristics, which may help obtain accurate diagnosis, will be discussed.
Case Presentation
A 72-year-old male veteran presented with a 2-month history of subjective weakness in his upper and lower extremities progressing to multiple falls at home. He had no significant medical history other than a thymectomy at age 15 for an enlarged thymus, which per patient report, was benign. An initial laboratory test that included vitamin B12, folate, thyroid-stimulating hormone, complete blood cell count, and comprehensive metabolic panel, were unremarkable, with a white blood cell count of 8.5 K/uL. The initial neurologic evaluation did not show any focal neurologic deficits; however, during the initial hospital stay, the patient developed increasing lower extremity weakness on examination. A noncontrast CT head scan showed extensive nonspecific hypodensities within the periventricular white matter (Figure 1). A contrast-enhanced MRI showed enhancing lesions involving the corpus callosum, left cerebral peduncle, and right temporal lobe (Figures 2, 3, and 4). These lesions also exhibited significant restricted diffusion and a mild amount of surrounding vasogenic edema. The working diagnosis after the MRI included primary CNS lymphoma, multifocal glioblastoma, and tumefactive demyelinating disease. The patient was started on IV steroids and transferred for neurosurgical evaluation and biopsy at an outside hospital. The frontal lesion was biopsied, and the initial frozen section was consistent with lymphoma; a bone marrow biopsy was negative. The workup for immunodeficiency was unremarkable. Pathology revealed high-grade B-cell lymphoma, and the patient began a chemotherapy regimen.
Discussion
The workup of altered mental status, focal neurologic deficits, headaches, or other neurologic conditions often begins with a noncontrast CT scan. On CT, PCNSL generally appears isodense to hyperdense to gray matter, but appearance is variable. The often hyperdense appearance is attributable to the hypercellular nature of lymphoma. Many times, as in this case, CT may show only vague hypodensities, some of which may be associated with surrounding edema. This presentation is nonspecific and may be seen with advancing age due to changes of chronic microvascular ischemia as well as demyelination, other malignancies, and several other disease processes, both benign and malignant. After the initial CT scan, further workup requires evaluation with MRI. PCNSL exhibits restricted diffusion and variable signal intensity on T2-weighted imaging.
PCNSL is frequently centrally located within the periventricular white matter, often within the frontal lobe but can involve other lobes, the basal ganglia, brainstem, cerebellum, or less likely, the spinal canal.7 Contrary to primary CNS disease, secondary lymphoma within the CNS has been described classically as affecting a leptomeningeal (pia and arachnoid mater) distribution two-thirds of the time, with parenchymal involvement occurring in the other one-third of patients. A recent study by Malikova and colleagues found parenchymal involvement may be much more common than previously thought.1 Leptomeningeal spread of disease often involves the cranial nerves, subependymal regions, spinal cord, or spinal nerve roots. Dural involvement in primary or secondary lymphoma is rare.
PCNSL nearly always shows enhancement. Linear enhancement along perivascular spaces is highly characteristic of PCNSL. The typical appearance of PCNSL associated with immunodeficiency varies from that seen in an otherwise immunocompetent patient. Patients with immunodeficiency usually have multifocal involvement, central necrosis leading to a ring enhancement appearance, and have more propensity for spontaneous hemorrhage.7 Immunocompetent patients are less likely to present with multifocal disease and rarely show ring enhancement. Also, spontaneous hemorrhage is rare in immunocompetent patients. In our case, extensive multifocal involvement was present, whereas typically immunocompetent patients will present with a solitary homogeneously enhancing parenchymal mass.
The primary differential for PCNSL includes malignant glioma, tumefactive multiple sclerosis, metastatic disease, and in an immunocompromised patient, toxoplasmosis. The degree of associated vasogenic edema and mass effect is generally lower in PCNSL than that of malignant gliomas and metastasis. Also, PCNSL tends to spare the cerebral cortex.8
Classically, PCNSL, malignant gliomas, and demyelinating disease have been considered the main differential for lesions that cross midline and involve both cerebral hemispheres. Lymphoma generally exhibits more restricted diffusion than malignant gliomas and metastasis, attributable to the highly cellular nature of lymphoma.7 Tumefactive multiple sclerosis is associated with relatively minimal mass effect for lesion size and exhibits less restricted diffusion values when compared to high grade gliomas and PCNSL. One fairly specific finding for tumefactive demyelinating lesions is incomplete rim enhancement.9 Unfortunately, an MRI is not reliable in differentiating these entities, and biopsy is required for definitive diagnosis. Many advancing imaging modalities may help provide the correct diagnosis of PCNSL, including diffusion-weighted and apparent diffusion coefficient imaging, diffusion tensor imaging, MR spectroscopy and PET imaging.7
Conclusion
With the increasing use of HAART, the paradigm of PCNSL is shifting toward one predominantly affecting immunocompetent patients. PCNSL should be considered in any patient with multiple enhancing CNS lesions, regardless of immune status. Several key imaging characteristics may help differentiate PCNSL and other disease processes; however, at this time, biopsy is recommended for definitive diagnosis.
1. Malikova H, Burghardtova M, Koubska E, Mandys V, Kozak T, Weichet J. Secondary central nervous system lymphoma: spectrum of morphological MRI appearances. Neuropsychiatr Dis Treat. 2018;4:733-740.
2. Dolecek TA, Propp JM, Stroup NE, Kruchko C. CBTRUS statistical report: primary brain and central nervous system tumors diagnosed in the United States in 2005-2009. Neuro-Oncol. 2012;14(suppl 5):v1-v49.
3. Diamond C, Taylor TH, Aboumrad T, Anton-Culver H. Changes in acquired immunodeficiency syndrome-related non-Hodgkin lymphoma in the era of highly active antiretroviral therapy: incidence, presentation, treatment, and survival. Cancer. 2006;106(1):128-135.
4. O’Neill BP, Decker PA, Tieu C, Cerhan JR. The changing incidence of primary central nervous system lymphoma is driven primarily by the changing incidence in young and middle-aged men and differs from time trends in systemic diffuse large B-cell non-Hodgkins lymphoma. Am J Hematol. 2013;88(12):997-1000.
5. [no authors listed]. 1993 revised classification system for HIV infection and expanded surveillance case definition for AIDS among adolescents and adults. MMWR Recomm Rep. 1992;41(rr-17):1-19.
6. Maiuri F. Central nervous system lymphomas and immunodeficiency. Neurological Research. 1989;11(1):2-5.
7. Haldorsen IS, Espeland A, Larsson EM. Central nervous system lymphoma: characteristic findings on traditional and advanced imaging. AJNR Am J Neuroradiol. 2010;32(6):984-992.
8. Gómez Roselló E, Quiles Granado AM, Laguillo Sala G, Gutiérrez S. Primary central nervous system lymphoma in immunocompetent patients: spectrum of findings and differential characteristics. Radiología. 2018;60(4):280-289.
9. Mabray MC, Cohen BA, Villanueva-Meyer JE, et al. Performance of Apparent Diffusion Coefficient Values and Conventional MRI Features in Differentiating Tumefactive Demyelinating Lesions From Primary Brain Neoplasms. American Journal of Roentgenology. 2015;205(5):1075-1085.
Central nervous system (CNS) lymphoma can be classified into 2 categories: primary CNS lymphoma (PCNSL), which includes disease limited to brain, eyes, spinal cord; and leptomeninges without coexisting or previous systemic lymphoma. Secondary CNS lymphoma (SCNSL) is essentially metastatic disease from a systemic primary site.1 The focus of this case presentation is PCNSL, with an emphasis on imaging characteristics and differential diagnosis.
The median age at diagnosis for PCNSL is 65 years, and the overall incidence has been decreasing since the mid-1990s, likely related to the increased use of highly-active antiretroviral therapy (HAART) in patients with AIDS.2,3 Although overall incidence has decreased, incidence in the elderly population has increased.4 Historically, PCNSL has been considered an AIDS-defining illness.5 These patients, among other immunocompromised patients, such as those on chronic immunosuppressive therapy, are at a higher risk for developing the malignancy.6
Clinical presentation varies because of the location of CNS involvement and may present with headache, mood or personality disturbances, or focal neurologic deficits. Seizures are less likely due to the tendency of PCNSL to spare gray matter. Initial workup generally includes a head computed tomography (CT) scan, as well as a contrast-enhanced magnetic resonance image (MRI), which may help direct clinicians to the appropriate diagnosis. However, there is significant overlap between the imaging characteristics of PCNSL and numerous other disease processes, including glioblastoma and demyelination. The imaging characteristics of PCNSL are considerably different depending on the patient’s immune status.7
This case illustrates a rare presentation of PCNSL in an immunocompetent patient whose MRI characteristics were seemingly more consistent with those seen in patients with immunodeficiency. The main differential diagnoses and key imaging characteristics, which may help obtain accurate diagnosis, will be discussed.
Case Presentation
A 72-year-old male veteran presented with a 2-month history of subjective weakness in his upper and lower extremities progressing to multiple falls at home. He had no significant medical history other than a thymectomy at age 15 for an enlarged thymus, which per patient report, was benign. An initial laboratory test that included vitamin B12, folate, thyroid-stimulating hormone, complete blood cell count, and comprehensive metabolic panel, were unremarkable, with a white blood cell count of 8.5 K/uL. The initial neurologic evaluation did not show any focal neurologic deficits; however, during the initial hospital stay, the patient developed increasing lower extremity weakness on examination. A noncontrast CT head scan showed extensive nonspecific hypodensities within the periventricular white matter (Figure 1). A contrast-enhanced MRI showed enhancing lesions involving the corpus callosum, left cerebral peduncle, and right temporal lobe (Figures 2, 3, and 4). These lesions also exhibited significant restricted diffusion and a mild amount of surrounding vasogenic edema. The working diagnosis after the MRI included primary CNS lymphoma, multifocal glioblastoma, and tumefactive demyelinating disease. The patient was started on IV steroids and transferred for neurosurgical evaluation and biopsy at an outside hospital. The frontal lesion was biopsied, and the initial frozen section was consistent with lymphoma; a bone marrow biopsy was negative. The workup for immunodeficiency was unremarkable. Pathology revealed high-grade B-cell lymphoma, and the patient began a chemotherapy regimen.
Discussion
The workup of altered mental status, focal neurologic deficits, headaches, or other neurologic conditions often begins with a noncontrast CT scan. On CT, PCNSL generally appears isodense to hyperdense to gray matter, but appearance is variable. The often hyperdense appearance is attributable to the hypercellular nature of lymphoma. Many times, as in this case, CT may show only vague hypodensities, some of which may be associated with surrounding edema. This presentation is nonspecific and may be seen with advancing age due to changes of chronic microvascular ischemia as well as demyelination, other malignancies, and several other disease processes, both benign and malignant. After the initial CT scan, further workup requires evaluation with MRI. PCNSL exhibits restricted diffusion and variable signal intensity on T2-weighted imaging.
PCNSL is frequently centrally located within the periventricular white matter, often within the frontal lobe but can involve other lobes, the basal ganglia, brainstem, cerebellum, or less likely, the spinal canal.7 Contrary to primary CNS disease, secondary lymphoma within the CNS has been described classically as affecting a leptomeningeal (pia and arachnoid mater) distribution two-thirds of the time, with parenchymal involvement occurring in the other one-third of patients. A recent study by Malikova and colleagues found parenchymal involvement may be much more common than previously thought.1 Leptomeningeal spread of disease often involves the cranial nerves, subependymal regions, spinal cord, or spinal nerve roots. Dural involvement in primary or secondary lymphoma is rare.
PCNSL nearly always shows enhancement. Linear enhancement along perivascular spaces is highly characteristic of PCNSL. The typical appearance of PCNSL associated with immunodeficiency varies from that seen in an otherwise immunocompetent patient. Patients with immunodeficiency usually have multifocal involvement, central necrosis leading to a ring enhancement appearance, and have more propensity for spontaneous hemorrhage.7 Immunocompetent patients are less likely to present with multifocal disease and rarely show ring enhancement. Also, spontaneous hemorrhage is rare in immunocompetent patients. In our case, extensive multifocal involvement was present, whereas typically immunocompetent patients will present with a solitary homogeneously enhancing parenchymal mass.
The primary differential for PCNSL includes malignant glioma, tumefactive multiple sclerosis, metastatic disease, and in an immunocompromised patient, toxoplasmosis. The degree of associated vasogenic edema and mass effect is generally lower in PCNSL than that of malignant gliomas and metastasis. Also, PCNSL tends to spare the cerebral cortex.8
Classically, PCNSL, malignant gliomas, and demyelinating disease have been considered the main differential for lesions that cross midline and involve both cerebral hemispheres. Lymphoma generally exhibits more restricted diffusion than malignant gliomas and metastasis, attributable to the highly cellular nature of lymphoma.7 Tumefactive multiple sclerosis is associated with relatively minimal mass effect for lesion size and exhibits less restricted diffusion values when compared to high grade gliomas and PCNSL. One fairly specific finding for tumefactive demyelinating lesions is incomplete rim enhancement.9 Unfortunately, an MRI is not reliable in differentiating these entities, and biopsy is required for definitive diagnosis. Many advancing imaging modalities may help provide the correct diagnosis of PCNSL, including diffusion-weighted and apparent diffusion coefficient imaging, diffusion tensor imaging, MR spectroscopy and PET imaging.7
Conclusion
With the increasing use of HAART, the paradigm of PCNSL is shifting toward one predominantly affecting immunocompetent patients. PCNSL should be considered in any patient with multiple enhancing CNS lesions, regardless of immune status. Several key imaging characteristics may help differentiate PCNSL and other disease processes; however, at this time, biopsy is recommended for definitive diagnosis.
1. Malikova H, Burghardtova M, Koubska E, Mandys V, Kozak T, Weichet J. Secondary central nervous system lymphoma: spectrum of morphological MRI appearances. Neuropsychiatr Dis Treat. 2018;4:733-740.
2. Dolecek TA, Propp JM, Stroup NE, Kruchko C. CBTRUS statistical report: primary brain and central nervous system tumors diagnosed in the United States in 2005-2009. Neuro-Oncol. 2012;14(suppl 5):v1-v49.
3. Diamond C, Taylor TH, Aboumrad T, Anton-Culver H. Changes in acquired immunodeficiency syndrome-related non-Hodgkin lymphoma in the era of highly active antiretroviral therapy: incidence, presentation, treatment, and survival. Cancer. 2006;106(1):128-135.
4. O’Neill BP, Decker PA, Tieu C, Cerhan JR. The changing incidence of primary central nervous system lymphoma is driven primarily by the changing incidence in young and middle-aged men and differs from time trends in systemic diffuse large B-cell non-Hodgkins lymphoma. Am J Hematol. 2013;88(12):997-1000.
5. [no authors listed]. 1993 revised classification system for HIV infection and expanded surveillance case definition for AIDS among adolescents and adults. MMWR Recomm Rep. 1992;41(rr-17):1-19.
6. Maiuri F. Central nervous system lymphomas and immunodeficiency. Neurological Research. 1989;11(1):2-5.
7. Haldorsen IS, Espeland A, Larsson EM. Central nervous system lymphoma: characteristic findings on traditional and advanced imaging. AJNR Am J Neuroradiol. 2010;32(6):984-992.
8. Gómez Roselló E, Quiles Granado AM, Laguillo Sala G, Gutiérrez S. Primary central nervous system lymphoma in immunocompetent patients: spectrum of findings and differential characteristics. Radiología. 2018;60(4):280-289.
9. Mabray MC, Cohen BA, Villanueva-Meyer JE, et al. Performance of Apparent Diffusion Coefficient Values and Conventional MRI Features in Differentiating Tumefactive Demyelinating Lesions From Primary Brain Neoplasms. American Journal of Roentgenology. 2015;205(5):1075-1085.