User login
DIVA results similar for drug-eluting, bare-metal stents
Drug-eluting stents (DESs) and less-expensive bare-metal stents (BMSs) performed equally well in patients with failed saphenous vein grafts after coronary artery bypass graft surgery, based on an analysis of patients in the DIVA trial.
The findings run counter to those of previous clinical trials, which had found drug-eluting stents perform better than bare-metal stents in these situations. “The study results have important economic implications in countries with high DES prices, such as the USA, because they suggest that the lower-cost BMS can be used in SVG [saphenous vein graft] lesions without compromising either safety or efficacy,” lead author Emmanouil S. Brilakis, MD, PhD, of Minneapolis Heart Institute and his coauthors said in reporting the results for the DIVA trial investigators in the Lancet.
The DIVA trial was a randomized, double-blind, controlled trial done at 25 U.S. Department of Veterans Affairs centers. Researchers randomly assigned 599 patients who had previous coronary artery bypass surgery to either the DES or BMS groups, and the study reported data from 597 patients. The combined endpoint comprised cardiac death, target vessel MI, or target vessel revascularization at 12 months and then over the entire length of follow-up, which ranged from 2 to 7 years. Operators used the DES or BMS of their choice.
While BMSs are presumed to be less expensive than DESs, the study authors did not provide prices or price ranges for the stents. Dr. Brilakis and his coauthors acknowledged that the financial implications depend on local stent pricing practices.
The cost-effectiveness of using DESs vs. BMSs has been controversial, with many studies reporting that BMS are cost-effective over the long-term because of the lower incidence of revascularization and later hospitalization. These studies did not differentiate between SVG and native vessels, however. Multiple studies have reported that the overall costs, including the cost for reintervention, are lower for DESs than for BMSs in native vessels. A Wake Forest study reported the average per procedure cost was $1,846 higher for a DES but the cost was offset after 3 years by lower revascularization rates (Circ Cardiovasc Qual Outcomes. 2011. doi: 10.1161/CIRCOUTCOMES.110.960187)
A recent Korean study found the total cost of DESs was about 5% higher (Yonsei Med J. 2014 Nov;55[6]:1533-41). A French study reported BMSs resulted in a cost reduction $217 per case (Open Heart. 2016 Aug 25;3[2]:e000445). But few, if any, studies have directly compared prices hospitals pay for DESs and BMSs.
Pricing aside, Dr. Brilakis and his coauthors reported no statistical differences in terms of outcomes between the DES and BMS groups. Baseline characteristics of both groups were similar, and the vessel failure rates were 17% in the DES group and 19% in the BMS group after 12 months of follow-up. After 2-7 years, “target vessel failure occurred in approximately one in three patients, with no difference between the bare-metal and drug-eluting stents,” Dr. Brilakis and his coauthors said.
There was no significant difference in cardiac death rates – 5% for DES patients and 4% for BMS patients – or in rates of target lesion revascularization, at 9% and 8%, respectively. Postprocedure medication rates were also similar between the two groups. For example, the rates of patients on P2Y12 inhibitors were 89% for both groups at 12 months and, among those who had follow-up at 36 months, 48% for DES and 44% for BMS.
Among the limitations of the study that Dr. Brilakis and his coauthors noted was the high proportion of men in the VA population – only two women, both in the DES group, participated in the study – and the interventionists doing the index SVG intervention were not masked to the type of stent used.
Dr. Brilakis disclosed relationships with Abbott Vascular, Amgen, Asahi, Boston Scientific, Cardinal Health, CSI, Elsevier, GE Healthcare, Medicure, Medtronic, Nitiloop, InfraRedx, and Osprey.
SOURCE: Brilakis ES et al. Lancet. 2018 May 19;391(10134);1997-2007.
The predominant use of second-generation drug-eluting stents in the DIVA study may explain why the researchers found no difference in outcomes for bare metal and drug-eluting stents.
Most patients in previous trials were treated with first-generation drug-eluting stents, but second-generation drug-eluting stents perform better than their first-generation counterparts in native coronary artery disease. One might think that this finding should also apply to saphenous vein bypass graft lesions in which atherosclerosis is more aggressive and the progress of the disease much faster, yet this was not the case in DIVA, and the study authors did not provide an explanation for this finding.
One possible reason for the comparability of outcomes in the drug-eluting stents and bare metal stents groups may be that saphenous vein bypass graft lesions may be more favorably disposed to paclitaxel, commonly used in first-generation drug-eluting stents, than the drugs found in the second-generation stents. The DIVA findings may indicate that the second-generation drug-eluting stents performed worse, not that the bare metal stents performed better.
Studies of only first-generation paclitaxel-eluting stents showed a sustained benefit. Any notion that the pathophysiology of saphenous vein grafts might make them more amenable to a bare metal stent while a drug-eluting stent is better suited for native vessels is purely speculative. Further research comparing the effect of different stent types in saphenous vein bypass graft failure is warranted.
Raban V. Jeger, MD, and Sven Möbius-Winkler, MD, made these remarks in an invited commentary. Dr. Jeger is with the University Hospital Basel (Switzerland), and Dr. Möbius-Winkler is with University Hospital Jena (Germany). Dr. Jeger disclosed he is the principal investigator of the BASKET-SAVAGE trial, which received funding from Boston Scientific Germany. Dr. Möbius-Winkler had no financial relationships to disclose.
Drug-eluting stents (DESs) and less-expensive bare-metal stents (BMSs) performed equally well in patients with failed saphenous vein grafts after coronary artery bypass graft surgery, based on an analysis of patients in the DIVA trial.
The findings run counter to those of previous clinical trials, which had found drug-eluting stents perform better than bare-metal stents in these situations. “The study results have important economic implications in countries with high DES prices, such as the USA, because they suggest that the lower-cost BMS can be used in SVG [saphenous vein graft] lesions without compromising either safety or efficacy,” lead author Emmanouil S. Brilakis, MD, PhD, of Minneapolis Heart Institute and his coauthors said in reporting the results for the DIVA trial investigators in the Lancet.
The DIVA trial was a randomized, double-blind, controlled trial done at 25 U.S. Department of Veterans Affairs centers. Researchers randomly assigned 599 patients who had previous coronary artery bypass surgery to either the DES or BMS groups, and the study reported data from 597 patients. The combined endpoint comprised cardiac death, target vessel MI, or target vessel revascularization at 12 months and then over the entire length of follow-up, which ranged from 2 to 7 years. Operators used the DES or BMS of their choice.
While BMSs are presumed to be less expensive than DESs, the study authors did not provide prices or price ranges for the stents. Dr. Brilakis and his coauthors acknowledged that the financial implications depend on local stent pricing practices.
The cost-effectiveness of using DESs vs. BMSs has been controversial, with many studies reporting that BMS are cost-effective over the long-term because of the lower incidence of revascularization and later hospitalization. These studies did not differentiate between SVG and native vessels, however. Multiple studies have reported that the overall costs, including the cost for reintervention, are lower for DESs than for BMSs in native vessels. A Wake Forest study reported the average per procedure cost was $1,846 higher for a DES but the cost was offset after 3 years by lower revascularization rates (Circ Cardiovasc Qual Outcomes. 2011. doi: 10.1161/CIRCOUTCOMES.110.960187)
A recent Korean study found the total cost of DESs was about 5% higher (Yonsei Med J. 2014 Nov;55[6]:1533-41). A French study reported BMSs resulted in a cost reduction $217 per case (Open Heart. 2016 Aug 25;3[2]:e000445). But few, if any, studies have directly compared prices hospitals pay for DESs and BMSs.
Pricing aside, Dr. Brilakis and his coauthors reported no statistical differences in terms of outcomes between the DES and BMS groups. Baseline characteristics of both groups were similar, and the vessel failure rates were 17% in the DES group and 19% in the BMS group after 12 months of follow-up. After 2-7 years, “target vessel failure occurred in approximately one in three patients, with no difference between the bare-metal and drug-eluting stents,” Dr. Brilakis and his coauthors said.
There was no significant difference in cardiac death rates – 5% for DES patients and 4% for BMS patients – or in rates of target lesion revascularization, at 9% and 8%, respectively. Postprocedure medication rates were also similar between the two groups. For example, the rates of patients on P2Y12 inhibitors were 89% for both groups at 12 months and, among those who had follow-up at 36 months, 48% for DES and 44% for BMS.
Among the limitations of the study that Dr. Brilakis and his coauthors noted was the high proportion of men in the VA population – only two women, both in the DES group, participated in the study – and the interventionists doing the index SVG intervention were not masked to the type of stent used.
Dr. Brilakis disclosed relationships with Abbott Vascular, Amgen, Asahi, Boston Scientific, Cardinal Health, CSI, Elsevier, GE Healthcare, Medicure, Medtronic, Nitiloop, InfraRedx, and Osprey.
SOURCE: Brilakis ES et al. Lancet. 2018 May 19;391(10134);1997-2007.
FROM THE LANCET
Key clinical point: Drug-eluting and bare-metal stents had similar outcomes for saphenous vein bypass lesions.
Major finding: Target vessel failure was 17% for drug-eluting stents and 19% for bare metal stents.
Study details: The DIVA trial randomly assigned 599 patients with post-CABG saphenous vein bypass graft failure to drug-eluting or bare metal stents between Jan. 1, 2012, and Dec. 31, 2015.
Disclosures: Dr. Brilakis disclosed relationships with Abbott Vascular, Amgen, Asahi, Boston Scientific, Cardinal Health, CSI, Elsevier, GE Healthcare, Medicure, Medtronic, Nitiloop, InfraRedx, and Osprey.
Source: Brilakis ES et al. Lancet. 2018 May 19;391(10134);1997-2007.
Treating sleep disorders in chronic opioid users
BALTIMORE – Given the prevalence of opioid use in the general population, sleep specialists need to be alert to the effects of opioid use on sleep and the link between chronic use and sleep disorders, a pulmonologist recommended at the annual meeting of the Associated Professional Sleep Societies.

Chronic opioid use has multiple effects on sleep that render continuous positive airway pressure (CPAP) all but ineffective, said Bernardo J. Selim, MD, of Mayo Clinic, Rochester, Minn. Characteristic signs of the effects of chronic opioid use on sleep include ataxic central sleep apnea (CSA) and sustained hypoxemia, for which CPAP is generally not effective. Obtaining arterial blood gas measures in these patients is also important to rule out a hypoventilative condition, he added.
In his review of opioid-induced sleep disorders, Dr. Selim cited a small “landmark” study of 24 chronic pain patients on opioids that found 46% had sleep disordered breathing and that the risk rose with the morphine equivalent dose they were taking (J Clin Sleep Med. 2014 Aug 15; 10[8]:847-52).
A meta-analysis also found a dose-dependent relationship with the severity of CSA in patients on opioids, Dr. Selim noted (Anesth Analg. 2015 Jun;120[6]:1273-85). The prevalence of CSA was 24% in the study, which defined two risk factors for CSA severity: a morphine equivalent dose exceeding 200 mg/day and a low or normal body mass index.
Dr. Selim noted that opioids reduce respiration rate more than tidal volume and cause changes to respiratory rhythm. “[Opioids] decrease hypercapnia but increase hypoxic ventilatory response, decrease the arousal index, decrease upper-airway muscle tone, and decrease and also act on chest and abdominal wall compliance.”
Further, different opioids and injection methods can influence breathing. For example, REM and slow-wave sleep decreased across all three categories – intravenous morphine, oral morphine or methadone, and heroin use.
Sleep specialists should be aware that all opioid receptor agonists, whether legal or illegal, have respiratory side effects, Dr. Selim said. “They can present in any way, in any form – CSA, obstructive sleep apnea [OSA], ataxic breathing or sustained hypoxemia. Most of the time [respiratory side effects] present as a combination of complex respiratory patterns.”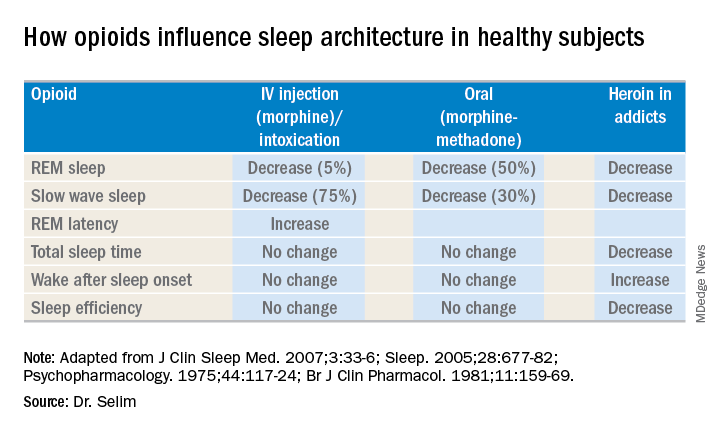
In one meta-analysis, CSA was significantly more prevalent in OSA patients on opioids than it was in nonusers, Dr. Selim said, with increased sleep apnea severity as well (J Clin Sleep Med. 2016 Apr 15;12[4]:617-25). Another study found that ataxic breathing was more frequent in non-REM sleep in chronic opioid users (odds ratio, 15.4; P = .017; J Clin Sleep Med. 2007 Aug 15;3[5]:455-61).
The key rule for treating sleep disorders in opioid-dependent patients is to change to nonopioid analgesics, Dr. Selim said. In that regard, ampakines are experimental drugs which have been shown to improve opioid-induced ventilation without loss of the analgesic effect (Clin Pharmacol Ther. 2010 Feb;87[2]:204-11). “Ampakines modulate the action of the glutamate neurotransmitter, decreasing opiate-induced respiratory depression,” Dr. Selim said. An emerging technology, adaptive servo-ventilation (ASV), has been as effective in the treatment of central and complex sleep apnea in chronic opioid users as it is in patients with congestive heart failure, Dr. Selim said (J Clin Sleep Med. 2016 May 15;12[5]:757-61). “ASV can be very effective in these patients; lower body mass index being a predictor for ASV success,” he said.
Dr. Selim reported having no financial relationships.
BALTIMORE – Given the prevalence of opioid use in the general population, sleep specialists need to be alert to the effects of opioid use on sleep and the link between chronic use and sleep disorders, a pulmonologist recommended at the annual meeting of the Associated Professional Sleep Societies.
Chronic opioid use has multiple effects on sleep that render continuous positive airway pressure (CPAP) all but ineffective, said Bernardo J. Selim, MD, of Mayo Clinic, Rochester, Minn. Characteristic signs of the effects of chronic opioid use on sleep include ataxic central sleep apnea (CSA) and sustained hypoxemia, for which CPAP is generally not effective. Obtaining arterial blood gas measures in these patients is also important to rule out a hypoventilative condition, he added.
In his review of opioid-induced sleep disorders, Dr. Selim cited a small “landmark” study of 24 chronic pain patients on opioids that found 46% had sleep disordered breathing and that the risk rose with the morphine equivalent dose they were taking (J Clin Sleep Med. 2014 Aug 15; 10[8]:847-52).
A meta-analysis also found a dose-dependent relationship with the severity of CSA in patients on opioids, Dr. Selim noted (Anesth Analg. 2015 Jun;120[6]:1273-85). The prevalence of CSA was 24% in the study, which defined two risk factors for CSA severity: a morphine equivalent dose exceeding 200 mg/day and a low or normal body mass index.
Dr. Selim noted that opioids reduce respiration rate more than tidal volume and cause changes to respiratory rhythm. “[Opioids] decrease hypercapnia but increase hypoxic ventilatory response, decrease the arousal index, decrease upper-airway muscle tone, and decrease and also act on chest and abdominal wall compliance.”
Further, different opioids and injection methods can influence breathing. For example, REM and slow-wave sleep decreased across all three categories – intravenous morphine, oral morphine or methadone, and heroin use.
Sleep specialists should be aware that all opioid receptor agonists, whether legal or illegal, have respiratory side effects, Dr. Selim said. “They can present in any way, in any form – CSA, obstructive sleep apnea [OSA], ataxic breathing or sustained hypoxemia. Most of the time [respiratory side effects] present as a combination of complex respiratory patterns.”
In one meta-analysis, CSA was significantly more prevalent in OSA patients on opioids than it was in nonusers, Dr. Selim said, with increased sleep apnea severity as well (J Clin Sleep Med. 2016 Apr 15;12[4]:617-25). Another study found that ataxic breathing was more frequent in non-REM sleep in chronic opioid users (odds ratio, 15.4; P = .017; J Clin Sleep Med. 2007 Aug 15;3[5]:455-61).
The key rule for treating sleep disorders in opioid-dependent patients is to change to nonopioid analgesics, Dr. Selim said. In that regard, ampakines are experimental drugs which have been shown to improve opioid-induced ventilation without loss of the analgesic effect (Clin Pharmacol Ther. 2010 Feb;87[2]:204-11). “Ampakines modulate the action of the glutamate neurotransmitter, decreasing opiate-induced respiratory depression,” Dr. Selim said. An emerging technology, adaptive servo-ventilation (ASV), has been as effective in the treatment of central and complex sleep apnea in chronic opioid users as it is in patients with congestive heart failure, Dr. Selim said (J Clin Sleep Med. 2016 May 15;12[5]:757-61). “ASV can be very effective in these patients; lower body mass index being a predictor for ASV success,” he said.
Dr. Selim reported having no financial relationships.
EXPERT ANALYSIS FROM SLEEP 2018
Surgical outcomes for UC worse since introduction of biologics
Since the approval of more UC patients are having multiple operations to manage their disease and their surgical outcomes tend to be worse, according to a study published in Annals of Surgery.

“Encouragingly, early randomized controlled trials demonstrated that infliximab may reduce the short-term need for surgery,” wrote Jonathan Abelson, MD, of the department of surgery, Cornell University, New York, and his coauthors. “However, even after the development and approval of several other biologic agents to treat UC, 30%-66% of patients treated with biologic agents still ultimately require surgical intervention.”
The study reviewed records of 7,070 patients with UC in a New York State Department of Health database who had colorectal surgery in two comparative time periods: 3,803 from 1995 to 2005, before biologics were available, and 3,267 from 2006 to 2013, after infliximab was approved. Dr. Abelson and coauthors said this is the first study to look at long-term surgical outcomes in a large group of patients with UC over an extended time period. Previous studies have reported conflicting results of how biologic agents for UC can impact surgical outcomes. The researchers set out to explore two hypotheses: whether staged procedures increased after 2005 and whether UC patients had worse outcomes over the past decade. The study results validated both hypotheses. Up until 2005, the proportion of patients who underwent at least three procedures after the index hospitalization was 9%; after 2006, that proportion was 14% (P less than .01).
A potential explanation for trends in postsurgery death may be higher rates of Clostridium difficile after 2005 (10.6% vs. 5.8%; P less than .01), but that was accounted for in the adjusted analysis and is probably not a major factor, the researchers said. After 2006 patients were slightly older and more likely to be on Medicare and nonwhite; they also were sicker, with 28% having two or more comorbidities vs. 10% before 2006.
The investigators offered another explanation: “It is also possible that the immunosuppressive effect of biologic agents ... predisposes patients to worse postoperative outcomes. In addition, it is possible that patients are referred for surgery too late in their disease course because of prolonged medical therapy.”
Dr. Abelson and coauthors reported having no financial relationships.
SOURCE: Abelson JS et al. Ann Surg. 2018:268;311-7.
Since the approval of more UC patients are having multiple operations to manage their disease and their surgical outcomes tend to be worse, according to a study published in Annals of Surgery.
“Encouragingly, early randomized controlled trials demonstrated that infliximab may reduce the short-term need for surgery,” wrote Jonathan Abelson, MD, of the department of surgery, Cornell University, New York, and his coauthors. “However, even after the development and approval of several other biologic agents to treat UC, 30%-66% of patients treated with biologic agents still ultimately require surgical intervention.”
The study reviewed records of 7,070 patients with UC in a New York State Department of Health database who had colorectal surgery in two comparative time periods: 3,803 from 1995 to 2005, before biologics were available, and 3,267 from 2006 to 2013, after infliximab was approved. Dr. Abelson and coauthors said this is the first study to look at long-term surgical outcomes in a large group of patients with UC over an extended time period. Previous studies have reported conflicting results of how biologic agents for UC can impact surgical outcomes. The researchers set out to explore two hypotheses: whether staged procedures increased after 2005 and whether UC patients had worse outcomes over the past decade. The study results validated both hypotheses. Up until 2005, the proportion of patients who underwent at least three procedures after the index hospitalization was 9%; after 2006, that proportion was 14% (P less than .01).
A potential explanation for trends in postsurgery death may be higher rates of Clostridium difficile after 2005 (10.6% vs. 5.8%; P less than .01), but that was accounted for in the adjusted analysis and is probably not a major factor, the researchers said. After 2006 patients were slightly older and more likely to be on Medicare and nonwhite; they also were sicker, with 28% having two or more comorbidities vs. 10% before 2006.
The investigators offered another explanation: “It is also possible that the immunosuppressive effect of biologic agents ... predisposes patients to worse postoperative outcomes. In addition, it is possible that patients are referred for surgery too late in their disease course because of prolonged medical therapy.”
Dr. Abelson and coauthors reported having no financial relationships.
SOURCE: Abelson JS et al. Ann Surg. 2018:268;311-7.
FROM ANNALS OF SURGERY
Key clinical point: Rates of multiple surgeries for ulcerative colitis have increased since biologic agents were introduced.
Major finding: Fourteen percent of patients have had multiple operations since 2006 vs. 9% before that.
Study details: A longitudinal analysis of 7,070 patients in the New York State Department of Health of Health Statewide Planning and Research Cooperative System database who had surgery for UC from 1995 to 2013.
Disclosures: Dr. Abelson and coauthors reported having no financial relationships.
Source: Abelson JS et al. Ann Surg. 2018;268:311-7.
Trauma surgeons up for emergency pediatric appendectomy
But a study of 220 children who had emergency appendectomies found only minor differences in outcomes between those operated on by a trauma surgeon and those by a pediatric surgeon.
“These results may be useful in optimizing the surgical workforce to care for a community,” said Derek B. Wall, MD, FACS, and Carlos Ortega, MD, FACS, of NorthShore University HealthSystem in Skokie, Ill. They noted that trauma surgeons in their group were asked to cover appendicitis in children aged 5-10 years because of the surgeons’ in-house availability and because of the difficulty pediatric surgeons often had in getting to the hospital in a timely fashion.
The study was done at Evanston (Ill.) Hospital, a Level 1 trauma center in the northern suburbs of Chicago. This trauma group were all board certified in general surgery, but none had received formal pediatric surgery fellowship training.
The study, published in the Journal of Trauma and Acute Surgery, evaluated appendectomies in children aged 5-10 years from January 2007 to December 2016. A total of 138 were performed by trauma surgeons, while 82 were done by pediatric surgeons. The patients operated on by trauma surgeons were more likely to be female (47% vs. 32%; P = .03), get to surgery more quickly (214 minutes from diagnosis vs. 318 minutes; P = .01), have a laparoscopic operation (70% vs. 55%; P = .04), have a shorter operation (40 minutes vs. 49 minutes; P less than .0001), and leave the hospital sooner (32 hours vs. 41 hours; P less than .0001). They were also more likely to be transferred from an outside hospital (60% vs. 37%; P less than .001) and less likely to be diagnosed without imaging (2% vs. 26%; P less than .0001). The study found no significant differences in complications.
Among the 31 patients who had perforated appendix, the difference in length of stay was even more pronounced: 4 days in the trauma surgery group (n = 21) versus 7.2 days in the pediatric surgery patients.
The investigators explained the rationale for focusing on the population aged 5-10 years: “We focused on a younger, narrower age range than that in previous studies, allowing comparison of outcomes in children of the same age and with equal rates of perforated appendicitis.” They noted that patients younger than age 5 are “well accepted as the domain of the pediatric surgeon,” while children over than 10 are more frequently managed by general surgeons.
At Evanston Hospital, pediatric surgeons had typically performed appendectomy in the targeted age group. But, “they cannot always quickly get to our hospital because of distance and city traffic,” the study authors noted. Therefore, the trauma surgeons were asked to cover for this population group.
They acknowledged the population size of the study was probably too small to identify any significant difference in complication rates between the two surgery groups, especially for patients who had had perforated appendicitis. Also, because of the study’s retrospective nature, most of the pediatric surgery cases were from an earlier period; therefore, later cases may have reflected advances in minimally invasive technology. “Perhaps surgical practice in a more recent time period contributes more to outcomes than specialty,” investigators wrote.
Dr. Wall and Dr. Ortega reported having no financial relationships.
SOURCE: Wall DB, Ortega C. J Trauma Acute Care Surg. 2018:85;118-21.
FROM THE JOURNAL OF TRAUMA AND ACUTE CARE SURGERY
Key clinical point: Trauma surgeons performed emergency pediatric appendectomy as well as pediatric surgeons did.
Major finding: Hospital stays averaged 32 and 41 hours for patients treated by trauma surgeons and pediatric surgeons, respectively.
Study details: Retrospective chart review of 220 children aged 5-10 years who had emergency appendectomy at a suburban Level 1 trauma center during 2007-2016.
Disclosures: The investigators reported having no financial relationships.
Source: Wall DB et al. J Trauma Acute Care Surg. 2018:85;118-21.
Study quantifies occupational exposure risks of EDT
For trauma patients who are in extremis, but with the high rates of HIV/hepatitis among trauma patients, one that also carries what had been an unknown exposure risk for emergency staff.

“The most important findings of this prospective, multicenter study are that occupational exposures were reported in 7.2% of EDT resuscitations and 1.6% of EDT resuscitation participants and that occupational exposure risk appears to be further mitigated with strict PPE [personal protective equipment] compliance to universal precautions,” lead author Andrew Nunn, MD, and his colleagues wrote. Dr. Nunn is a trauma surgeon with Wake Forest Baptist Health in Winston-Salem, N.C.
The researchers surveyed 1,360 emergency department (ED) personnel after they performed 305 EDTs at 16 academic and community trauma centers nationwide in 2015 and 2016. The patients who had an EDT were mostly men ranging in age from 24 to 41 years (90.5%) with penetrating injuries (77.4%) and arrived at the ED after prehospital CPR (56.7%). Twenty-two occupational exposures occurred during 22 of the EDT resuscitations, with trainees sustaining most of them (68.2%). The most common source of injury was sharps, accounting for 86.4% (scalpels, 38.9%; fractured bone, 27.8%; needles, 16.7%; and scissors, 3%).
“Occupational exposures correlated with PPE utilization, as universal precautions during EDT were more often observed in providers who did not sustain occupational exposures, compared with those sustaining exposures,” Dr. Nunn and his coauthors wrote. For example, 98% of those reporting no exposure were gloved versus 91% of those who were exposed (P greater than .05).
Dr. Nunn and his coauthors called the risk of HIV or hepatitis C virus (HCV) transmission during EDT “extraordinarily low.” Based on data from their study, they determined the risk of blood-borne pathogen transmission during an EDT resuscitation is 6 in 1 million for HIV and 1 in 10,000 for HCV, and the individual risk is 1 in 1 million and 3 in 100,000, respectively. Compliance with PPE precautions further limited exposure risk, but the study found that more than 10% of surveyed personnel did not utilize one of the four components of PPE besides gloves – eyewear, mask, gown or hat.
Most – but not all – survey responders followed up after the incidence of exposure. “[A total of] 91.7% of providers reporting their exposures also reported following up with their institution specific occupational exposure protocol,” the investigators wrote.
“Our findings have particular implications for trainees,” the study authors noted, citing the high percentage of injuries in this group. The findings emphasized the need for universal PPE compliance and enforcement by resuscitation team leaders. Nonetheless, the study found that the exposure rates during EDT are no greater than other surgical procedures.
“Regardless of the lifesaving nature of the procedure, improved universal precaution compliance with PPE is paramount and would further minimize occupational exposure risks to providers during EDT,” Dr. Nunn and his coauthors said.
Dr. Nunn and his coauthors reported having no financial relationships.
SOURCE: Nunn A et al. J Trauma Acute Care Surg. 2018:85;78-84.
For trauma patients who are in extremis, but with the high rates of HIV/hepatitis among trauma patients, one that also carries what had been an unknown exposure risk for emergency staff.
“The most important findings of this prospective, multicenter study are that occupational exposures were reported in 7.2% of EDT resuscitations and 1.6% of EDT resuscitation participants and that occupational exposure risk appears to be further mitigated with strict PPE [personal protective equipment] compliance to universal precautions,” lead author Andrew Nunn, MD, and his colleagues wrote. Dr. Nunn is a trauma surgeon with Wake Forest Baptist Health in Winston-Salem, N.C.
The researchers surveyed 1,360 emergency department (ED) personnel after they performed 305 EDTs at 16 academic and community trauma centers nationwide in 2015 and 2016. The patients who had an EDT were mostly men ranging in age from 24 to 41 years (90.5%) with penetrating injuries (77.4%) and arrived at the ED after prehospital CPR (56.7%). Twenty-two occupational exposures occurred during 22 of the EDT resuscitations, with trainees sustaining most of them (68.2%). The most common source of injury was sharps, accounting for 86.4% (scalpels, 38.9%; fractured bone, 27.8%; needles, 16.7%; and scissors, 3%).
“Occupational exposures correlated with PPE utilization, as universal precautions during EDT were more often observed in providers who did not sustain occupational exposures, compared with those sustaining exposures,” Dr. Nunn and his coauthors wrote. For example, 98% of those reporting no exposure were gloved versus 91% of those who were exposed (P greater than .05).
Dr. Nunn and his coauthors called the risk of HIV or hepatitis C virus (HCV) transmission during EDT “extraordinarily low.” Based on data from their study, they determined the risk of blood-borne pathogen transmission during an EDT resuscitation is 6 in 1 million for HIV and 1 in 10,000 for HCV, and the individual risk is 1 in 1 million and 3 in 100,000, respectively. Compliance with PPE precautions further limited exposure risk, but the study found that more than 10% of surveyed personnel did not utilize one of the four components of PPE besides gloves – eyewear, mask, gown or hat.
Most – but not all – survey responders followed up after the incidence of exposure. “[A total of] 91.7% of providers reporting their exposures also reported following up with their institution specific occupational exposure protocol,” the investigators wrote.
“Our findings have particular implications for trainees,” the study authors noted, citing the high percentage of injuries in this group. The findings emphasized the need for universal PPE compliance and enforcement by resuscitation team leaders. Nonetheless, the study found that the exposure rates during EDT are no greater than other surgical procedures.
“Regardless of the lifesaving nature of the procedure, improved universal precaution compliance with PPE is paramount and would further minimize occupational exposure risks to providers during EDT,” Dr. Nunn and his coauthors said.
Dr. Nunn and his coauthors reported having no financial relationships.
SOURCE: Nunn A et al. J Trauma Acute Care Surg. 2018:85;78-84.
FROM THE JOURNAL OF TRAUMA AND ACUTE CARE SURGERY
Key clinical point: Occupational exposure risk of emergency department thoracotomy (EDT) is low for personnel.
Major finding: Occupational exposure rate to HIV/hepatitis in trauma undergoing EDT is 7.2% for personnel.
Study details: Prospective, observational study that included 1,360 personnel surveyed after they performed 305 EDTs in 2015 and 2016.
Disclosures: Dr. Nunn and his coauthors reported having no financial relationships.
Source: Nunn A et al. J Trauma Acute Care Surg. 2018:85;78-84.
Sleep may mediate healthy behavior in children
BALTIMORE – a 6-year follow-up of children in the Infant Feeding Practices Study II determined.

However, improving health in these children is more than a matter of simply seeing that they get more sleep, said lead investigator Jill Landsbaugh Kaar, PhD, of Children’s Hospital Colorado, Aurora, in presenting the results at the annual meeting of the Associated Professional Sleep Societies. “Perhaps there’s a potential pathway linking healthy eaters and obesity in children that may be mediated through sleep duration.”
The relationship between sleep, diet, and activity level may be more cyclical, rather than linear, Dr. Kaar said. “Poor sleep is typically linked to a poor diet or low levels of physical activity, and then linked to some outcome or disease,” she said. But her research indicates that those three factors – sleep, diet and activity – are more interrelated than one being causative of the others.
Noting that one in three adults and one in six children in the United States are either overweight or obese (JAMA. 2014 Feb 26;311[8]:806-14), Dr. Kaar said, “Childhood obesity prevention has really not been effective in reducing weight or preventing or limiting weight gain.” Such programs typically focus on one health behavior when each child has a unique pattern of health behaviors that influence weight.
Dr. Kaar’s research used data collected by the Centers for Disease Control and Prevention as part of a 6-year follow-up study of women from the Infant Feeding Practices Study II. Some 1,542 women completed mailed questionnaires about their 6-year-olds’ diet, activity, screen time, sleep duration, height, and weight. The statistical analysis grouped the children into health behavior patterns of diet, activity, and screen time and used a three-step mediation regression model to examine their hypothesis.
The analysis characterized children into three health behavior pattern groups: poorest eaters (22%), healthy children (37%), and active supereaters with the highest screen time (41%). The poorest eaters were more likely to be female (58%) and obese (18%) than the other groups, but even 10% of the healthy children group were obese.

In the first model, the poorest eaters had the highest risk of obesity. In the second model, both the poorest eaters and active supereaters had shorter sleep duration than healthy children – 9.46 and 9.59 hours a night, respectively, versus 9.97 hours for healthy children – “thus telling me that sleep was really driving that relationship,” Dr. Kaar said.
“Future interventions should consider that improving health behavior patterns by targeting someone’s diet or physical activity, that you’re also targeting them to improve sleep, and then through increasing sleep you will be influencing obesity,” she said. “Interventions and research studies in general really need to measure all of those health behaviors because they’re all related; it’s not just one of them leading to obesity risk.”
The next step for her research is to branch out beyond a one-center study, Dr. Kaar said.
Dr. Kaar reported having no financial relationships. An American Heart Association Scientist Development Award provided funding for the study.
BALTIMORE – a 6-year follow-up of children in the Infant Feeding Practices Study II determined.
However, improving health in these children is more than a matter of simply seeing that they get more sleep, said lead investigator Jill Landsbaugh Kaar, PhD, of Children’s Hospital Colorado, Aurora, in presenting the results at the annual meeting of the Associated Professional Sleep Societies. “Perhaps there’s a potential pathway linking healthy eaters and obesity in children that may be mediated through sleep duration.”
The relationship between sleep, diet, and activity level may be more cyclical, rather than linear, Dr. Kaar said. “Poor sleep is typically linked to a poor diet or low levels of physical activity, and then linked to some outcome or disease,” she said. But her research indicates that those three factors – sleep, diet and activity – are more interrelated than one being causative of the others.
Noting that one in three adults and one in six children in the United States are either overweight or obese (JAMA. 2014 Feb 26;311[8]:806-14), Dr. Kaar said, “Childhood obesity prevention has really not been effective in reducing weight or preventing or limiting weight gain.” Such programs typically focus on one health behavior when each child has a unique pattern of health behaviors that influence weight.
Dr. Kaar’s research used data collected by the Centers for Disease Control and Prevention as part of a 6-year follow-up study of women from the Infant Feeding Practices Study II. Some 1,542 women completed mailed questionnaires about their 6-year-olds’ diet, activity, screen time, sleep duration, height, and weight. The statistical analysis grouped the children into health behavior patterns of diet, activity, and screen time and used a three-step mediation regression model to examine their hypothesis.
The analysis characterized children into three health behavior pattern groups: poorest eaters (22%), healthy children (37%), and active supereaters with the highest screen time (41%). The poorest eaters were more likely to be female (58%) and obese (18%) than the other groups, but even 10% of the healthy children group were obese.
In the first model, the poorest eaters had the highest risk of obesity. In the second model, both the poorest eaters and active supereaters had shorter sleep duration than healthy children – 9.46 and 9.59 hours a night, respectively, versus 9.97 hours for healthy children – “thus telling me that sleep was really driving that relationship,” Dr. Kaar said.
“Future interventions should consider that improving health behavior patterns by targeting someone’s diet or physical activity, that you’re also targeting them to improve sleep, and then through increasing sleep you will be influencing obesity,” she said. “Interventions and research studies in general really need to measure all of those health behaviors because they’re all related; it’s not just one of them leading to obesity risk.”
The next step for her research is to branch out beyond a one-center study, Dr. Kaar said.
Dr. Kaar reported having no financial relationships. An American Heart Association Scientist Development Award provided funding for the study.
REPORTING FROM SLEEP 2018
Key clinical point: Sleep may mediate how diet and activity influence weight in children.
Major finding: Healthy children had 9.97 hours of sleep per night versus 9.46 hours for poorest eaters.
Study details: A 6-year follow-up of 1,542 children in the Infant Feeding Practices Study II whose health behaviors were self-reported by mothers.
Disclosures: Dr. Kaar reported having no financial relationships. The study was funded through an American Heart Association Scientist Development Award.
Algorithm shows promise in calculating CV risk in sleep apnea patients
BALTIMORE – Researchers have developed an algorithm to calculate circulation time during sleep that may provide another tool to identify the risk of underlying cardiac vascular disease in patients with sleep apnea, one of the study’s lead investigators reported at the annual meeting of the Associated Professional Sleep Societies.
“There’s always been a question that there could be some global or untapped physiological indices that might give us some glimpse into future cardiovascular events or instantaneous cardiovascular vulnerability during sleep apnea events,” said Younghoon Kwon, MD, assistant professor of cardiovascular medicine at the University of Virginia, Charlottesville. “Circulation time that can be derived from a sleep study may be one of these novel indices. Although it has been examined in patients with heart failure with Cheyne-Stokes respiration, it has rarely been studied in patients with obstructive sleep apnea without heart failure.”

He noted that in this study, which utilized a cohort of 686 patients from the Multi-Ethnic Study of Atherosclerosis (MESA), all with an apnea-hypopnea index greater than 15, the automated algorithm the researchers developed to calculate lung-to-finger circulation was correlated highly with visual measurement.
The algorithm used randomly selected polysomnograms from the MESA cohort. It employed the airflow/nasal signal and the oxygen saturation signal, using the visually scored start and endpoint of apnea/hypopnea as a starting point. For each event, the calculation identified two key points: the endpoint of apnea/hypopnea and the endpoint of desaturation to arrive at a calculation of lung-to-finger circulation, Dr. Kwon explained.
The significance of the findings was the correlation between the visual and automated methods of calculating lung-to-finder circulation time. In a matched subgroup of 25 subjects, the correlation was around 95% (P less than .0001); in all cases, the correlation was around 69% (P less than .001). In matched cases, the average lung-to-finger circulation times were identical with visual and automated techniques: 19.5 seconds (P = .92), whereas in all cases the averages differed: 19.6 seconds for visual versus 18.6 seconds for automated (P = .42). “The results showed that the visual against the automated circulatory time measurement was very good,” Dr. Kwon said.
With this algorithm, multiple circulation time measures were automatically derived for each sleep study. Subsequently, average circulation time was derived for each study participant. The average circulation time was 19.4 seconds in the entire cohort, versus 21.0 seconds in those with apnea and 17.6 seconds in patients with hypopnea.
“Older age, male gender, and higher obstructive sleep apnea severity appeared to be independently associated with higher than average lung-to-finger circulation times,” Dr. Kwon said. “However, there was no apparent association between the obstructive event length or the severity of oxygen desaturation and the respective circulation time within subjects. Similarly, sleep positions and sleep stages do not seem to bear any association.”
One of the limitations of the study, he noted, was its assumption of the automated algorithm as the threshold and somewhat limited candidate variables. Future studies should involve more diverse cohorts with prevalent cardiovascular disease to determine the utility of the algorithm in predicting cardiovascular events, he said.
Dr. Kwon reported having no financial relationships, and the American Academy of Sleep Medicine Foundation provided study funding.
SOURCE: Kwon Y et al. SLEEP 2018, Abstract #0450.
BALTIMORE – Researchers have developed an algorithm to calculate circulation time during sleep that may provide another tool to identify the risk of underlying cardiac vascular disease in patients with sleep apnea, one of the study’s lead investigators reported at the annual meeting of the Associated Professional Sleep Societies.
“There’s always been a question that there could be some global or untapped physiological indices that might give us some glimpse into future cardiovascular events or instantaneous cardiovascular vulnerability during sleep apnea events,” said Younghoon Kwon, MD, assistant professor of cardiovascular medicine at the University of Virginia, Charlottesville. “Circulation time that can be derived from a sleep study may be one of these novel indices. Although it has been examined in patients with heart failure with Cheyne-Stokes respiration, it has rarely been studied in patients with obstructive sleep apnea without heart failure.”
He noted that in this study, which utilized a cohort of 686 patients from the Multi-Ethnic Study of Atherosclerosis (MESA), all with an apnea-hypopnea index greater than 15, the automated algorithm the researchers developed to calculate lung-to-finger circulation was correlated highly with visual measurement.
The algorithm used randomly selected polysomnograms from the MESA cohort. It employed the airflow/nasal signal and the oxygen saturation signal, using the visually scored start and endpoint of apnea/hypopnea as a starting point. For each event, the calculation identified two key points: the endpoint of apnea/hypopnea and the endpoint of desaturation to arrive at a calculation of lung-to-finger circulation, Dr. Kwon explained.
The significance of the findings was the correlation between the visual and automated methods of calculating lung-to-finder circulation time. In a matched subgroup of 25 subjects, the correlation was around 95% (P less than .0001); in all cases, the correlation was around 69% (P less than .001). In matched cases, the average lung-to-finger circulation times were identical with visual and automated techniques: 19.5 seconds (P = .92), whereas in all cases the averages differed: 19.6 seconds for visual versus 18.6 seconds for automated (P = .42). “The results showed that the visual against the automated circulatory time measurement was very good,” Dr. Kwon said.
With this algorithm, multiple circulation time measures were automatically derived for each sleep study. Subsequently, average circulation time was derived for each study participant. The average circulation time was 19.4 seconds in the entire cohort, versus 21.0 seconds in those with apnea and 17.6 seconds in patients with hypopnea.
“Older age, male gender, and higher obstructive sleep apnea severity appeared to be independently associated with higher than average lung-to-finger circulation times,” Dr. Kwon said. “However, there was no apparent association between the obstructive event length or the severity of oxygen desaturation and the respective circulation time within subjects. Similarly, sleep positions and sleep stages do not seem to bear any association.”
One of the limitations of the study, he noted, was its assumption of the automated algorithm as the threshold and somewhat limited candidate variables. Future studies should involve more diverse cohorts with prevalent cardiovascular disease to determine the utility of the algorithm in predicting cardiovascular events, he said.
Dr. Kwon reported having no financial relationships, and the American Academy of Sleep Medicine Foundation provided study funding.
SOURCE: Kwon Y et al. SLEEP 2018, Abstract #0450.
REPORTING FROM SLEEP 2018
Key clinical point: An automated algorithm to calculate sleep-study circulation times correlated with visual review.
Major finding: The correlation between visual and automated methods for calculating lung-to-finger circulation times was around 95% (P less than .0001).
Study details: A cohort of 686 participants in the Multi-Ethnic Study of Atherosclerosis.
Disclosures: Dr. Kwon reported no financial disclosures, and the American Academy of Sleep Medicine Foundation provided study funding.
Source: Kwon Y et al. SLEEP 2018, Abstract #0450.
New insights into sleep, pregnancy weight gain
BALTIMORE – Pregnant women who are overweight and obese are like the general population in that the less they sleep, the more weight they gain, particularly in the first half of pregnancy. However, unlike in the larger adult population, prolonged daily total eating time was not associated with gestational weight gain in these women, particularly early in pregnancy, according to findings from a small study presented at the Associated Professional Sleep Societies annual meeting.
Those findings point to a need to further study the , said Rachel P. Kolko, PhD, a postdoctoral scholar at the University of Pittsburgh, Western Psychiatric Institute and Clinic.
“The association with total sleep time was found to be significant, such that if you had less sleep, you had higher amounts of weight gain; we did not find a significant relation with our eating window variable,” Dr. Kolko said.
She reported on research involving 62 pregnant women, 53% of whom were overweight with a body mass index of 25-29.9 kg/m2 and 47% of whom were obese with BMI greater than 30. Forty-seven percent of the study population was nonwhite.
The research grew out of a need to identify potentially modifiable factors to curtail excessive gestational weight gain during pregnancy, she said. The study hypotheses were that both shorter total sleep time and longer total eating time would lead to higher gestational weight gain, but the study confirmed only the former as a contributing factor.

The women in the study were at 12-20 weeks of pregnancy. Gestational weight gain was calculated as the difference between self-reported prepregnancy weight and current weight. Total sleep time was based on the Pittsburgh Sleep Quality Index, and total eating time was calculated as the time difference between the day’s first meal or snack of more than 50 calories and the last, as self-reported.
Average total sleep time was 7.8 hours, with total eating time spanning 10.8 hours. On average, study participants gained 9.7 pounds through the first half of pregnancy, Dr. Kolko said. She noted that the Institute of Medicine, now known as the National Academy of Medicine, recommends that women who are overweight women gain 15-25 pounds during pregnancy and women who are obese gain 11-20 pounds (JAMA. 2017;317:2207-25). “Already about 20% of our sample has gained that amount of weight within the first half of pregnancy,” she said.
“Total sleep time was related to a higher early gestational weight in women with overweight and obesity, and it’s possible that addressing this may affect and hopefully improve women’s weight gain during early pregnancy to fit within those guidelines,” she said.
Future research should look at the entire gestational period – possibly targeting sleep patterns during pregnancy – and should expand to include women who are not overweight or obese, Dr. Kolko noted.
Dr. Kolko reported having no financial relationships to disclose.
SOURCE: Kolko RP, et al., SLEEP 2018, Abstract 0692.
BALTIMORE – Pregnant women who are overweight and obese are like the general population in that the less they sleep, the more weight they gain, particularly in the first half of pregnancy. However, unlike in the larger adult population, prolonged daily total eating time was not associated with gestational weight gain in these women, particularly early in pregnancy, according to findings from a small study presented at the Associated Professional Sleep Societies annual meeting.
Those findings point to a need to further study the , said Rachel P. Kolko, PhD, a postdoctoral scholar at the University of Pittsburgh, Western Psychiatric Institute and Clinic.
“The association with total sleep time was found to be significant, such that if you had less sleep, you had higher amounts of weight gain; we did not find a significant relation with our eating window variable,” Dr. Kolko said.
She reported on research involving 62 pregnant women, 53% of whom were overweight with a body mass index of 25-29.9 kg/m2 and 47% of whom were obese with BMI greater than 30. Forty-seven percent of the study population was nonwhite.
The research grew out of a need to identify potentially modifiable factors to curtail excessive gestational weight gain during pregnancy, she said. The study hypotheses were that both shorter total sleep time and longer total eating time would lead to higher gestational weight gain, but the study confirmed only the former as a contributing factor.
The women in the study were at 12-20 weeks of pregnancy. Gestational weight gain was calculated as the difference between self-reported prepregnancy weight and current weight. Total sleep time was based on the Pittsburgh Sleep Quality Index, and total eating time was calculated as the time difference between the day’s first meal or snack of more than 50 calories and the last, as self-reported.
Average total sleep time was 7.8 hours, with total eating time spanning 10.8 hours. On average, study participants gained 9.7 pounds through the first half of pregnancy, Dr. Kolko said. She noted that the Institute of Medicine, now known as the National Academy of Medicine, recommends that women who are overweight women gain 15-25 pounds during pregnancy and women who are obese gain 11-20 pounds (JAMA. 2017;317:2207-25). “Already about 20% of our sample has gained that amount of weight within the first half of pregnancy,” she said.
“Total sleep time was related to a higher early gestational weight in women with overweight and obesity, and it’s possible that addressing this may affect and hopefully improve women’s weight gain during early pregnancy to fit within those guidelines,” she said.
Future research should look at the entire gestational period – possibly targeting sleep patterns during pregnancy – and should expand to include women who are not overweight or obese, Dr. Kolko noted.
Dr. Kolko reported having no financial relationships to disclose.
SOURCE: Kolko RP, et al., SLEEP 2018, Abstract 0692.
REPORTING FROM SLEEP 2018
Key clinical point: In overweight/obese women, shorter sleep times are linked to early gestational weight gain.
Major finding: Overweight/obese women slept 30% less and had higher gestational weight gain in early pregnancy.
Study details: Study of 62 women between 12 and 20 weeks’ gestation with prepregnancy BMI greater than 25 kg/m2.
Disclosures: Dr. Kolko reported having no financial relationships.
Source: Kolko RP et al. SLEEP 2018, Abstract 0692.
Trial finds link between OSA, aortic diameter
BALTIMORE – Individuals with moderate to severe and thus may be at a heightened risk of cardiovascular events, according to an analysis of a national, multisite research study presented at the annual meeting of the Associated Professional Sleep Societies.
The study evaluated a subgroup of 708 patients with no history of cardiovascular disease (CVD) from the Multi-Ethnic Study of Atherosclerosis (MESA).
Dr. Kwon noted that previous studies have shown that patients with thoracic aortopathy have a high rate of obstructive sleep apnea (OSA) (Am J Respir Crit Care Med. 2003;168:1528-31), and those with OSA tend to have higher thoracic aortic size (J Am Coll Cardiol. 2008;52:885-6). “There’s also a degree of evidence suggesting that OSA is associated with high arterial stiffness, which is a marker of primary organ damage and a major cardiovascular risk that is predictive of cardiovascular disease,” Dr. Kwon said (J Intl Med Res. 2011;39:228-38). However, he also noted that some studies have found no relationship between OSA and aortic disease (Respiration. 2006;73:741-50). “The question can be raised as to whether sleep apnea may have implications” in thoracic aortic disease, he said.
Dr. Kwon’s study evaluated three groups: patients with no OSA (apnea hypopnea index [AHI] less than 5, n = 87); mild OSA (AHI 5-15, n = 215); and severe OSA (AHI greater than 15, n = 406). All patients had polysomnography as part of an ancillary study. Cardiac MRI measured these three features of aortic function and physiology (unadjusted results):
Diameter at the pulmonary artery bifurcation, which ranged from 3.13 cm in patients with no OSA to 3.37 cm in those with severe OSA (P = .0017).
Pulse wave velocity, which averaged 8.07 m/s in the no-OSA group and 9.11 m/s in the severe group (P less than .0001).
Distensibility, or aortic stiffness, which was 1.73%/mm Hg in the no-OSA group, 1.54%/mm Hg in the mild group and 1.68%/mm Hg in the severe group (P = .0141).
“There was maybe some higher pulse wave velocity across the significant OSA group,” Dr. Kwon said. “However, with aortic distensibility, there did not seem to be any significant trend.”
In the adjusted analysis of aortic diameter, “there did appear to be a small but significant difference in the significant OSA group, compared with the reference group,” Dr. Kwon said. He also noted that women with OSA typically had significantly larger aortic diameters than did non-OSA counterparts, whereas that trend was not as pronounced in men.
“Thoracic aorta size does seem to increase with OSA severity, but this has a sex-interaction component; it’s more pronounced in women,” Dr. Kwon said. He also noted a discrepancy in the results: “The functional properties of the aorta did not seem to bear a significant association with OSA severity.”
In explaining why these results differed from previous studies, Dr. Kwon said the study populations or their characteristics may be the cause, or that MRI-based measures of aortic properties have not been extensively studied before. “This is probably the first study to look at an unselected population, use a large sample size that was ethnically diverse, and use cardiac MRI technology,” he said.
Limitations he noted were the study’s cross-sectional nature and its small population of patients with enlarged thoracic aorta size, which left it underpowered to evaluate that population.
Dr. Kwon reported having no financial relationships.
SOURCE: Kwon Y et al. SLEEP 2018, Abstract #0465.
REPORTING FROM SLEEP 2018
Key clinical point: Obstructive sleep apnea severity is related to increased aortic artery size.
Major finding: Ascending aortic diameter measured 3.37 cm in patients with severe OSA vs. 3.13 cm with no OSA.
Study details: Subgroup of 708 patients with OSA but no history of cardiovascular disease from the Multi-Ethnic Study of Atherosclerosis.
Disclosures: Dr. Kwon reported having no financial relationships.
Source: Kwon Y et al. SLEEP 2018, Abstract #0465.
Investigational solriamfetol may improve multiple sleep measures
BALTIMORE – Multiple studies based on phase 3 clinical trials of the investigational drug solriamfetol have found that it may be effective for improving next-day wakefulness and work productivity in people with narcolepsy and obstructive sleep apnea, and that the drug can maintain its effect throughout the day as well as for up to 6 months, investigators reported at the annual meeting of the Associated Professional Sleep Societies.
Solriamfetol, developed by Jazz Pharmaceuticals, is the subject of a new drug application accepted by the Food and Drug Administration in March of 2018 for the treatment of excessive sleepiness due to narcolepsy or obstructive sleep apnea (OSA). Solriamfetol is a selective dopamine and norepinephrine reuptake inhibitor.
The drug was the subject of four different studies presented at SLEEP 2018 that drilled down into its effect on specific aspects of narcolepsy or OSA, or both. One study explored results in narcoleptic patients with and without cataplexy. Another study investigated the drug’s maintenance of efficacy after 6 months of treatment. A third study looked at the drug’s impact on next-day function, work productivity, and quality of life in patients with narcolepsy. And the fourth study researched how solriamfetol helped maintain wakefulness throughout the day.
Yves Dauvilliers, MD, reported that the 150- and 300-mg doses of solriamfetol were effective in improving both sleep latency, as measured with maintenance of wakefulness test (MWT), and Epworth Sleepiness Scale (ESS) scores in both cataplexic (n = 117) and noncataplexic (n = 114) narcolepsy. The objective of the study was to reevaluate the safety of solriamfetol in these narcoleptic subgroups from the phase 3 trial, said Dr. Dauvilliers, a faculty member at Centre Hospitalier Universitaire de Montpellier (France).
In patients with cataplexy, the 150-mg dose increased sleep latency from a baseline of 0 to 7.9 after a week and sustained that for 12 weeks; doubling the dose raised that to 10.3 after a week, reaching 10.7 in week 12. Gains were even more dramatic in noncataplexic patients, with the 150-mg dose improving sleep latency to 12.8 at week 1 and 11.6 at week 12, and the 300-mg dose resulting in a gain of 16.8 after a week, trailing off to 13.8 after 12 weeks, Dr. Dauvilliers said.
The study also evaluated ESS scores for three dosing levels – 75, 150, and 300 mg – plus placebo. In the group with cataplexy, ESS at week 12 improved from a baseline of 0 to –3.1, –5.6, and –6.3 for the three dosing groups, respectively, vs. –1.8 for placebo. In the noncataplexy patients with narcolepsy, the improvements in ESS at week 12 were –4.5, –5.2 and –6.4, respectively, vs. –1.5 for placebo.
“At 150 mg and 300 mg, solriamfetol seems to be very effective in treating excessive sleepiness with narcolepsy, with the same efficacy in the group with and without cataplexy – with efficacy even after just 1 week of treatment,” Dr. Dauvilliers said.
Atul Malhotra, MD, and his coresearchers investigated the long-term safety and efficacy of solriamfetol out to 42 weeks in patients with narcolepsy or OSA who completed previous clinical trials, which were 6- and 12-week trials. The study involved an open-label phase from weeks 14 to 27, a 2-week randomized withdrawal phase and then safety follow-up after week 40. In the open-label phase, ESS scores for the overall treatment group (n = 519) improved from 15.9 at baseline to 8.3 at week 40, with variation between the OSA (n = 333) and narcolepsy (n = 186) groups: from 15.2 at baseline to 6.5 at week 40 for the former and from 17.3 to 11.4 for the latter.
In the randomized withdrawal phase, ESS scores for those on solriamfetol (n = 139) migrated upward from 7.3 to 8.5 – but for the placebo group (n = 141) ESS rose from 7.8 to 12.6, a difference of 3.7 favoring the treatment group, said Dr. Malhotra, chief of pulmonary and critical care medicine and the Kenneth M. Moser Professor in the department of medicine, University of California San Diego, La Jolla. Most patients in the placebo group had worsening of symptoms based on global impression of change – 64.5% vs. 28.2% in the treatment group in the self-reported cohort, and 63.8% vs. 28.7% in the clinician-evaluated cohort.

“The open-label phase demonstrated maintenance-of-efficacy after 1 year,” Dr. Malhotra said. “The safety profile was consistent with prior placebo-controlled studies of solriamfetol. Epworth sleepiness score and adverse event data demonstrated a lack of rebound sleepiness or withdrawal after abrupt discontinuation of solriamfetol during the randomized washout phase. So the bottom line is it looks to be a durable, effective treatment without major side effects.”
Helene A. Emsellem, MD, led a study into how solriamfetol can impact daily activity in patients with narcolepsy. “Solriamfetol at 300 mg reduced activity impairment outside the workplace and, at 150 mg, reduced activity and work impairment from baseline to week 12 on the measures of functionality at work and in private life,” said Dr. Emsellem, of George Washington University Medical Center, Washington. She is medical director of the Center for Sleep & Wake Disorders, Chevy Chase, Md.
Patients on 300 mg solriamfetol (n = 43) gained an average 3.01 on the Functional Outcomes of Sleep Questionnaire short version (FOSQ-10) total score from baseline to week 12. That compares with gains of 2.57 in the 150-mg group (n = 51), 2.39 in the 75-mg group (n = 49), and 1.56 in the placebo group (n = 52, P = .05). The study looked at activity across four different measures in terms of reduced impairment, as measured by percentage reductions in the negative. The 150-mg group showed most improvement in impairment while working and overall work impairment, with changes of –22.02% and –19.77%, respectively, vs. –11.62% and –10.59% for the 300-mg dose. However, the higher dose showed greater improvement in general activity impairment: –21.17% vs. –17.84% in the 150-mg dose (P less than .05).

Notably, there was little difference across the dosing groups in improvement in work time missed, “I think mostly because there wasn’t much absenteeism to start with,” Dr. Emsellem said.
The 300-mg group also showed greater gains in physical component summary, based on answers to the 36-item Short Form Health Survey, averaging a gain of 3.29 from baseline vs. 2.65 for 150 mg, 2.54 for 75 mg, and 1.06 for placebo. However, on the mental component summary of the survey, the 300-mg group showed the smallest increase: 0.68 vs. 2.05 (150 mg), 1.55 (75 mg), and 0.78 (placebo), respectively (P less than . 05).
In reporting on the effects of solriamfetol through the day, Paula K. Schweitzer, PhD, director of research at the Sleep Medicine and Research Center at St. Luke’s Hospital, Chesterfield, Mo., noted that sustained full-day efficacy may be a limitation of other wake-promoting medications (Clin Neuropharmacol. 2003;26:252-57; Curr Med Res Opin. 2006;22:761-74). The objective of her study was to evaluate the efficacy of solriamfetol through the day over five sequential MWT trials. Her research involved two double-blind, 12-week studies in patients with either narcolepsy (n = 231) or OSA (n = 459) who were randomized to placebo or one of four doses of solriamfetol: 37.5 mg (in OSA only) and 75, 150, and 300 mg. Patients took the drug orally in the morning.
“Solriamfetol significantly increased sleep latency on all five sequential MWT trials at doses of 150 and 300 mg in the narcolepsy patients, and at doses of 75, 150, and 300 mg in the OSA patients.” Dr. Schweitzer said.

The 150- and 300-mg doses showed the greatest improvement over smaller doses and placebo in both the narcolepsy and OSA groups. In the narcolepsy patients, changes from baseline in MWT sleep latency in the first trial, at approximately 1 hour post dose, were 9.9 (150 mg), 9.9 (300 mg), and –0.6 (placebo) minutes; and in the fifth trial, approximately 9 hours post dose, were 9.3 (150 mg), 12.3 (300 mg), and 3.1 (placebo) minutes. In the OSA patients, changes from baseline in the first trial were 10.9 (150 mg), 12.5 (300 mg), and –0.4 (placebo) minutes; and in the fifth trial, changes were 8.1 (150 mg), 7.6 (300 mg), and 0.2 (placebo) minutes.
“These data demonstrate sustained efficacy over approximately 9 hours following morning dosing for solriamfetol at 150-300 mg in narcolepsy patients and 75-300 mg in OSA patients.” Dr. Schweitzer said.
She also noted that rates of insomnia through the day were less than 5% in each study population combined across dose groups.
Reporting of adverse events was similar across treatment groups in all four studies. The most common adverse event was headache, ranging from around 10% for OSA to 24.2% in patients with cataplexic narcolepsy (n = 91), followed by nausea, decreased appetite, anxiety, and nasopharyngitis. Dr. Malhotra’s study, which involved the largest population of OSA (n = 417) and narcolepsy (n = 226) patients, showed overall rates of at least one adverse event of 75.1% and 74.8%, respectively. His study also showed an overall rate of 5% for respiratory tract infection, and nine patients (1.4%) who had serious cardiovascular adverse events – two cases of atrial fibrillation, and one each of acute MI, angina pectoris, chest discomfort, chest pain, noncardiac chest pain, cerebrovascular accident, and pulmonary embolism.
Dr. Schweitzer noted that the adverse events were mild to moderate in severity, with discontinuation rates of 5% to 7% in the treatment group. Dr. Dauvilliers said the safety results were consistent with previous studies.
All four researchers reported receiving grant/research support from Jazz Pharmaceuticals, sponsor of the study.
SOURCE: Dauvilliers Y et al. Abstract 0619; Malhotra A et al. Abstract 0620; Emsellem H et al. Abstract 0621; Schweitzer PK et al. Abstract 0622. Presented at Sleep 2018.
BALTIMORE – Multiple studies based on phase 3 clinical trials of the investigational drug solriamfetol have found that it may be effective for improving next-day wakefulness and work productivity in people with narcolepsy and obstructive sleep apnea, and that the drug can maintain its effect throughout the day as well as for up to 6 months, investigators reported at the annual meeting of the Associated Professional Sleep Societies.
Solriamfetol, developed by Jazz Pharmaceuticals, is the subject of a new drug application accepted by the Food and Drug Administration in March of 2018 for the treatment of excessive sleepiness due to narcolepsy or obstructive sleep apnea (OSA). Solriamfetol is a selective dopamine and norepinephrine reuptake inhibitor.
The drug was the subject of four different studies presented at SLEEP 2018 that drilled down into its effect on specific aspects of narcolepsy or OSA, or both. One study explored results in narcoleptic patients with and without cataplexy. Another study investigated the drug’s maintenance of efficacy after 6 months of treatment. A third study looked at the drug’s impact on next-day function, work productivity, and quality of life in patients with narcolepsy. And the fourth study researched how solriamfetol helped maintain wakefulness throughout the day.
Yves Dauvilliers, MD, reported that the 150- and 300-mg doses of solriamfetol were effective in improving both sleep latency, as measured with maintenance of wakefulness test (MWT), and Epworth Sleepiness Scale (ESS) scores in both cataplexic (n = 117) and noncataplexic (n = 114) narcolepsy. The objective of the study was to reevaluate the safety of solriamfetol in these narcoleptic subgroups from the phase 3 trial, said Dr. Dauvilliers, a faculty member at Centre Hospitalier Universitaire de Montpellier (France).
In patients with cataplexy, the 150-mg dose increased sleep latency from a baseline of 0 to 7.9 after a week and sustained that for 12 weeks; doubling the dose raised that to 10.3 after a week, reaching 10.7 in week 12. Gains were even more dramatic in noncataplexic patients, with the 150-mg dose improving sleep latency to 12.8 at week 1 and 11.6 at week 12, and the 300-mg dose resulting in a gain of 16.8 after a week, trailing off to 13.8 after 12 weeks, Dr. Dauvilliers said.
The study also evaluated ESS scores for three dosing levels – 75, 150, and 300 mg – plus placebo. In the group with cataplexy, ESS at week 12 improved from a baseline of 0 to –3.1, –5.6, and –6.3 for the three dosing groups, respectively, vs. –1.8 for placebo. In the noncataplexy patients with narcolepsy, the improvements in ESS at week 12 were –4.5, –5.2 and –6.4, respectively, vs. –1.5 for placebo.
“At 150 mg and 300 mg, solriamfetol seems to be very effective in treating excessive sleepiness with narcolepsy, with the same efficacy in the group with and without cataplexy – with efficacy even after just 1 week of treatment,” Dr. Dauvilliers said.
Atul Malhotra, MD, and his coresearchers investigated the long-term safety and efficacy of solriamfetol out to 42 weeks in patients with narcolepsy or OSA who completed previous clinical trials, which were 6- and 12-week trials. The study involved an open-label phase from weeks 14 to 27, a 2-week randomized withdrawal phase and then safety follow-up after week 40. In the open-label phase, ESS scores for the overall treatment group (n = 519) improved from 15.9 at baseline to 8.3 at week 40, with variation between the OSA (n = 333) and narcolepsy (n = 186) groups: from 15.2 at baseline to 6.5 at week 40 for the former and from 17.3 to 11.4 for the latter.
In the randomized withdrawal phase, ESS scores for those on solriamfetol (n = 139) migrated upward from 7.3 to 8.5 – but for the placebo group (n = 141) ESS rose from 7.8 to 12.6, a difference of 3.7 favoring the treatment group, said Dr. Malhotra, chief of pulmonary and critical care medicine and the Kenneth M. Moser Professor in the department of medicine, University of California San Diego, La Jolla. Most patients in the placebo group had worsening of symptoms based on global impression of change – 64.5% vs. 28.2% in the treatment group in the self-reported cohort, and 63.8% vs. 28.7% in the clinician-evaluated cohort.
“The open-label phase demonstrated maintenance-of-efficacy after 1 year,” Dr. Malhotra said. “The safety profile was consistent with prior placebo-controlled studies of solriamfetol. Epworth sleepiness score and adverse event data demonstrated a lack of rebound sleepiness or withdrawal after abrupt discontinuation of solriamfetol during the randomized washout phase. So the bottom line is it looks to be a durable, effective treatment without major side effects.”
Helene A. Emsellem, MD, led a study into how solriamfetol can impact daily activity in patients with narcolepsy. “Solriamfetol at 300 mg reduced activity impairment outside the workplace and, at 150 mg, reduced activity and work impairment from baseline to week 12 on the measures of functionality at work and in private life,” said Dr. Emsellem, of George Washington University Medical Center, Washington. She is medical director of the Center for Sleep & Wake Disorders, Chevy Chase, Md.
Patients on 300 mg solriamfetol (n = 43) gained an average 3.01 on the Functional Outcomes of Sleep Questionnaire short version (FOSQ-10) total score from baseline to week 12. That compares with gains of 2.57 in the 150-mg group (n = 51), 2.39 in the 75-mg group (n = 49), and 1.56 in the placebo group (n = 52, P = .05). The study looked at activity across four different measures in terms of reduced impairment, as measured by percentage reductions in the negative. The 150-mg group showed most improvement in impairment while working and overall work impairment, with changes of –22.02% and –19.77%, respectively, vs. –11.62% and –10.59% for the 300-mg dose. However, the higher dose showed greater improvement in general activity impairment: –21.17% vs. –17.84% in the 150-mg dose (P less than .05).
Notably, there was little difference across the dosing groups in improvement in work time missed, “I think mostly because there wasn’t much absenteeism to start with,” Dr. Emsellem said.
The 300-mg group also showed greater gains in physical component summary, based on answers to the 36-item Short Form Health Survey, averaging a gain of 3.29 from baseline vs. 2.65 for 150 mg, 2.54 for 75 mg, and 1.06 for placebo. However, on the mental component summary of the survey, the 300-mg group showed the smallest increase: 0.68 vs. 2.05 (150 mg), 1.55 (75 mg), and 0.78 (placebo), respectively (P less than . 05).
In reporting on the effects of solriamfetol through the day, Paula K. Schweitzer, PhD, director of research at the Sleep Medicine and Research Center at St. Luke’s Hospital, Chesterfield, Mo., noted that sustained full-day efficacy may be a limitation of other wake-promoting medications (Clin Neuropharmacol. 2003;26:252-57; Curr Med Res Opin. 2006;22:761-74). The objective of her study was to evaluate the efficacy of solriamfetol through the day over five sequential MWT trials. Her research involved two double-blind, 12-week studies in patients with either narcolepsy (n = 231) or OSA (n = 459) who were randomized to placebo or one of four doses of solriamfetol: 37.5 mg (in OSA only) and 75, 150, and 300 mg. Patients took the drug orally in the morning.
“Solriamfetol significantly increased sleep latency on all five sequential MWT trials at doses of 150 and 300 mg in the narcolepsy patients, and at doses of 75, 150, and 300 mg in the OSA patients.” Dr. Schweitzer said.
The 150- and 300-mg doses showed the greatest improvement over smaller doses and placebo in both the narcolepsy and OSA groups. In the narcolepsy patients, changes from baseline in MWT sleep latency in the first trial, at approximately 1 hour post dose, were 9.9 (150 mg), 9.9 (300 mg), and –0.6 (placebo) minutes; and in the fifth trial, approximately 9 hours post dose, were 9.3 (150 mg), 12.3 (300 mg), and 3.1 (placebo) minutes. In the OSA patients, changes from baseline in the first trial were 10.9 (150 mg), 12.5 (300 mg), and –0.4 (placebo) minutes; and in the fifth trial, changes were 8.1 (150 mg), 7.6 (300 mg), and 0.2 (placebo) minutes.
“These data demonstrate sustained efficacy over approximately 9 hours following morning dosing for solriamfetol at 150-300 mg in narcolepsy patients and 75-300 mg in OSA patients.” Dr. Schweitzer said.
She also noted that rates of insomnia through the day were less than 5% in each study population combined across dose groups.
Reporting of adverse events was similar across treatment groups in all four studies. The most common adverse event was headache, ranging from around 10% for OSA to 24.2% in patients with cataplexic narcolepsy (n = 91), followed by nausea, decreased appetite, anxiety, and nasopharyngitis. Dr. Malhotra’s study, which involved the largest population of OSA (n = 417) and narcolepsy (n = 226) patients, showed overall rates of at least one adverse event of 75.1% and 74.8%, respectively. His study also showed an overall rate of 5% for respiratory tract infection, and nine patients (1.4%) who had serious cardiovascular adverse events – two cases of atrial fibrillation, and one each of acute MI, angina pectoris, chest discomfort, chest pain, noncardiac chest pain, cerebrovascular accident, and pulmonary embolism.
Dr. Schweitzer noted that the adverse events were mild to moderate in severity, with discontinuation rates of 5% to 7% in the treatment group. Dr. Dauvilliers said the safety results were consistent with previous studies.
All four researchers reported receiving grant/research support from Jazz Pharmaceuticals, sponsor of the study.
SOURCE: Dauvilliers Y et al. Abstract 0619; Malhotra A et al. Abstract 0620; Emsellem H et al. Abstract 0621; Schweitzer PK et al. Abstract 0622. Presented at Sleep 2018.
REPORTING FROM SLEEP 2018
Key clinical point: Solriamfetol seems effective for improving multiple measures of wakefulness in narcolepsy and obstructive sleep apnea.
Major finding: Individuals with narcolepsy in the 150-mg and 300-mg dosing groups had average increase in maintenance of wakefulness test scores of 9.9 vs. a loss of 0.6 for the placebo group.
Data source: Four studies of data from two phase 3 trials of adults with excessive sleepiness and narcolepsy or excessive sleepiness and obstructive sleep apnea, with study populations ranging in size from 231 to 643.
Disclosures: All presenters reported receiving support from Jazz Pharmaceuticals, sponsor of the studies. Dr. Dauvilliers reported being a consultant to UCB Pharma, Bioprojet, Theranexus, Flamel and Harmony Biosciences. Dr. Emsellem reported financial relationships with Vanda Pharmaceuticals, Eisai, Flamel (Avadel), Balance Therapeutics, Merck, NightBalance, Novartis, Phillips Respironics, and Harmony Biosciences. Dr. Schweitzer reported relationships with Phillips Respironics and NightBalance. Dr. Malhotra reported that ResMed provided a philanthropic donation to his institution, University of California San Diego.
Sources: Dauvilliers Y et al. Abstract 0619; Malhotra A et al. Abstract 620; Emsellem H et al. Abstract 0621; Schweitzer PK et al. Abstract 0622. Presented at Sleep 2018.