User login
Richard Franki is the associate editor who writes and creates graphs. He started with the company in 1987, when it was known as the International Medical News Group. In his years as a journalist, Richard has worked for Cap Cities/ABC, Disney, Harcourt, Elsevier, Quadrant, Frontline, and Internet Brands. In the 1990s, he was a contributor to the ill-fated Indications column, predecessor of Livin' on the MDedge.
Zika cases in pregnant women hit new weekly high
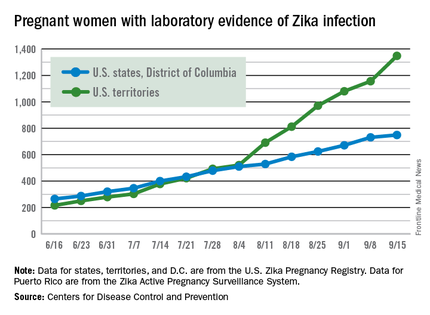
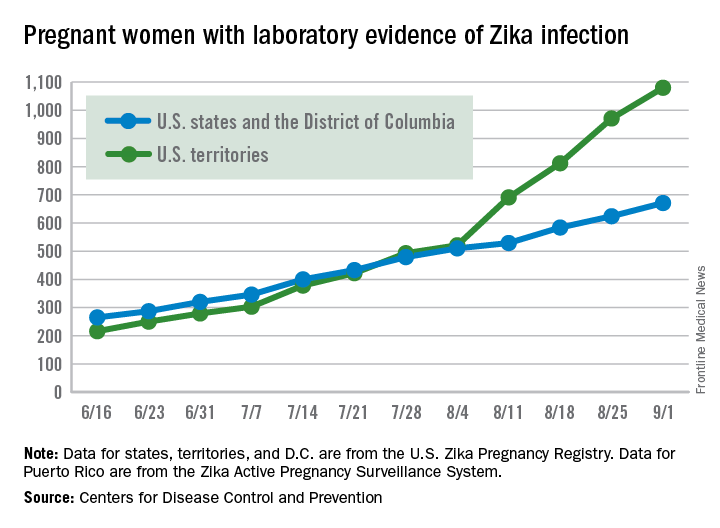
The weekly number of pregnant women in the United States with laboratory evidence of Zika virus infection topped 200 for the first time during the week ending Sept. 15, according to the Centers for Disease Control and Prevention.
With the 50 states and the District of Columbia reporting 18 new cases for the week and the U.S. territories reporting 192, there were 210 more pregnant women with Zika for the week ending Sept. 15, the CDC reported Sept. 22. The previous weekly high had been 199 for the week ending Aug. 25.
The CDC also reported two new cases of liveborn infants – both in the 50 states and D.C. – with Zika-related birth defects. No infants with Zika-related birth defects were reported in the territories for the week, and there were no new reports of pregnancy losses related to Zika. The number of pregnancy losses holds at six for the year so far, but the number of U.S. liveborn infants with Zika-related birth defects is now 21, with 20 cases in the states/D.C. and one in the territories, the CDC said. State- or territorial-level data are not being reported to protect the privacy of affected women and children.
There were 182 new cases of Zika infection reported among all Americans in the states/D.C. for the week ending Sept. 21, along with 2,083 new cases in the territories – almost all in Puerto Rico, which continues to retroactively report cases, the CDC noted Sept. 22. The U.S. total for 2015-2016 is 23,135 cases: 3,358 reported in the states/D.C. and 19,777 in the territories. Puerto Rico represents 98% of the territorial total, the CDC said.
Zika-related birth defects recorded by the CDC could include microcephaly, calcium deposits in the brain indicating possible brain damage, excess fluid in the brain cavities and surrounding the brain, absent or poorly formed brain structures, abnormal eye development, or other problems resulting from brain damage that affect nerves, muscles, and bones. The pregnancy losses encompass any miscarriage, stillbirth, and termination with evidence of birth defects.
The figures for states, territories, and D.C. reflect reporting to the U.S. Zika Pregnancy Registry; data for Puerto Rico are reported to the U.S. Zika Active Pregnancy Surveillance System.

EpiPen cost increases far exceed overall medical inflation
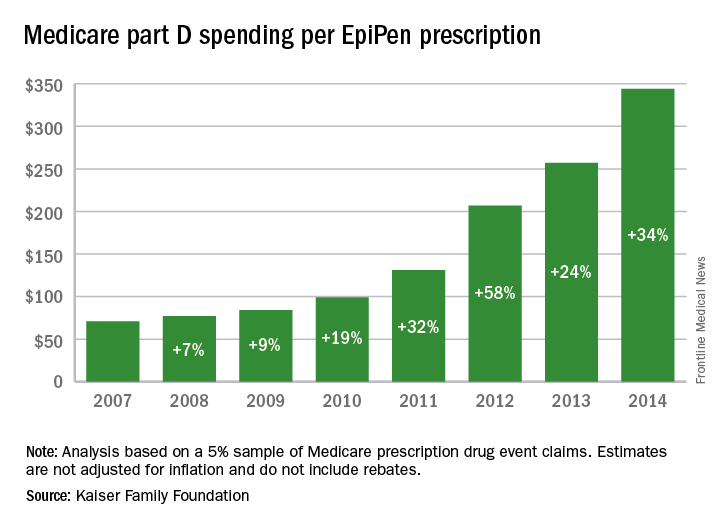
Total Medicare part D spending on EpiPen auto-injectors rose from $7.0 million in 2007 to $87.9 million in 2014 – an increase of 1,151%, according to an analysis released Sept. 20 by the Kaiser Family Foundation.
The number of EpiPen users also increased over that time, however, bringing with it a commensurate 159% rise in the number of prescriptions. Those two trends took the average cost of a single EpiPen prescription from $71 in 2007 to $344 in 2014, the Kaiser analysis showed.

That increase in cost per prescription did not fail to at least double overall medical care price inflation for each year from 2008 to 2014. In 2008, when the two trends were closest together, the EpiPen cost per prescription rose 7.4% from the year before, compared with 3.7% for overall medical spending. In 2014, Medicare part D’s cost for an EpiPen prescription rose 34% from the year before, which was 14 times higher than the 2.4% increase in total medical spending, Kaiser noted.
The analysis was based on a 5% sample of Medicare prescription drug event claims and included beneficiaries who had a least 1 month of part D coverage and one EpiPen prescription during the year. Estimates are not adjusted for inflation and do not include any possible manufacturer discounts, Kaiser said.
Total Medicare part D spending on EpiPen auto-injectors rose from $7.0 million in 2007 to $87.9 million in 2014 – an increase of 1,151%, according to an analysis released Sept. 20 by the Kaiser Family Foundation.
The number of EpiPen users also increased over that time, however, bringing with it a commensurate 159% rise in the number of prescriptions. Those two trends took the average cost of a single EpiPen prescription from $71 in 2007 to $344 in 2014, the Kaiser analysis showed.
That increase in cost per prescription did not fail to at least double overall medical care price inflation for each year from 2008 to 2014. In 2008, when the two trends were closest together, the EpiPen cost per prescription rose 7.4% from the year before, compared with 3.7% for overall medical spending. In 2014, Medicare part D’s cost for an EpiPen prescription rose 34% from the year before, which was 14 times higher than the 2.4% increase in total medical spending, Kaiser noted.
The analysis was based on a 5% sample of Medicare prescription drug event claims and included beneficiaries who had a least 1 month of part D coverage and one EpiPen prescription during the year. Estimates are not adjusted for inflation and do not include any possible manufacturer discounts, Kaiser said.
Number of Zika-infected pregnancies jumps in states/D.C.
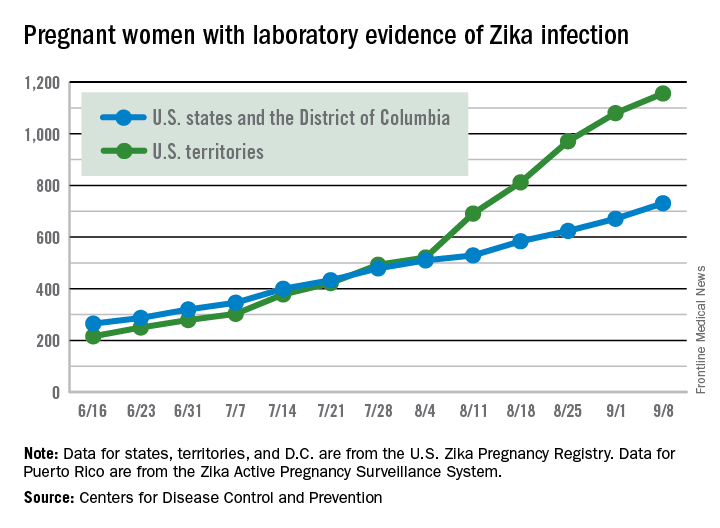
There were 60 more pregnant women in the 50 states and the District of Columbia with laboratory evidence of Zika infection for the week ending Sept. 8, according to the Centers for Disease Control and Prevention.
That is the largest weekly increase yet among that population, and it brings the total number of Zika-infected pregnant women to 731 in the 50 states and D.C. so far in 2016. The U.S. territories reported 76 new cases for the week ending Sept. 8, for a territorial total of 1,156 and a combined U.S. total of 1,887 pregnant women with Zika virus, the CDC reported Sept. 15.

For the second week in a row, a liveborn infant with Zika-related birth defects was born in the 50 states/D.C. The total is now 19 for the year: 18 in the states/D.C. and 1 in the territories. There were no new pregnancy losses with Zika-related birth defects, so the number holds at six for the year: five in the states/D.C. and one in the territories, the CDC said.
Zika-related birth defects recorded by the CDC could include microcephaly, calcium deposits in the brain indicating possible brain damage, excess fluid in the brain cavities and surrounding the brain, absent or poorly formed brain structures, abnormal eye development, or other problems resulting from brain damage that affect nerves, muscles, and bones. The pregnancy losses encompass any miscarriage, stillbirth, and termination with evidence of birth defects.
The figures for states, territories, and D.C. reflect reporting to the U.S. Zika Pregnancy Registry; data for Puerto Rico are reported to the U.S. Zika Active Pregnancy Surveillance System.
There were 60 more pregnant women in the 50 states and the District of Columbia with laboratory evidence of Zika infection for the week ending Sept. 8, according to the Centers for Disease Control and Prevention.
That is the largest weekly increase yet among that population, and it brings the total number of Zika-infected pregnant women to 731 in the 50 states and D.C. so far in 2016. The U.S. territories reported 76 new cases for the week ending Sept. 8, for a territorial total of 1,156 and a combined U.S. total of 1,887 pregnant women with Zika virus, the CDC reported Sept. 15.
For the second week in a row, a liveborn infant with Zika-related birth defects was born in the 50 states/D.C. The total is now 19 for the year: 18 in the states/D.C. and 1 in the territories. There were no new pregnancy losses with Zika-related birth defects, so the number holds at six for the year: five in the states/D.C. and one in the territories, the CDC said.
Zika-related birth defects recorded by the CDC could include microcephaly, calcium deposits in the brain indicating possible brain damage, excess fluid in the brain cavities and surrounding the brain, absent or poorly formed brain structures, abnormal eye development, or other problems resulting from brain damage that affect nerves, muscles, and bones. The pregnancy losses encompass any miscarriage, stillbirth, and termination with evidence of birth defects.
The figures for states, territories, and D.C. reflect reporting to the U.S. Zika Pregnancy Registry; data for Puerto Rico are reported to the U.S. Zika Active Pregnancy Surveillance System.
United States an expensive place for knee, hip replacement
Knee and hip replacement surgeries were more expensive in the United States than in a group of six other industrialized countries in 2014, according to a report from the International Federation of Health Plans.
The U.S. average for total hospital and physician costs was $28,184 for knee replacement and $29,067 for hip replacement. Switzerland was the next most expensive country for knee replacements at $20,132, and Australia was second for hip replacements at $19,484. Spain had the lowest average cost for both surgeries: $6,687 for knee replacement and $6,757 for hip replacement, the IFHP reported.
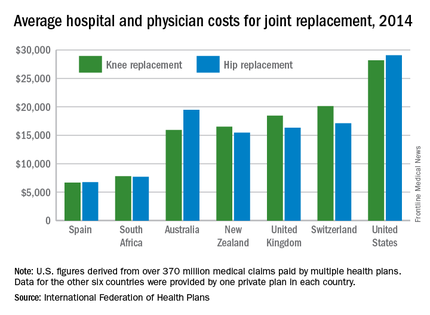
“We look at these numbers every year and it’s always a shocking demonstration of how much procedures and prescription drugs actually cost,” IFHP Chief Executive Tom Sackville said in a written statement. “There is no reason why identical procedures and products should vary in price so much across countries: it illustrates the damaging effects of an inadequately regulated health care market.”
The IFHP consists of 80 member companies in 25 countries. For the survey, costs for each country were submitted by participating member plans. Costs for the United States are derived from over 370 million employer-sponsored medical claims incurred from Jan. 1, 2014, to Dec. 31, 2014, and paid by multiple health plans. Cost data for the other six countries were provided by one private plan in each country.
Knee and hip replacement surgeries were more expensive in the United States than in a group of six other industrialized countries in 2014, according to a report from the International Federation of Health Plans.
The U.S. average for total hospital and physician costs was $28,184 for knee replacement and $29,067 for hip replacement. Switzerland was the next most expensive country for knee replacements at $20,132, and Australia was second for hip replacements at $19,484. Spain had the lowest average cost for both surgeries: $6,687 for knee replacement and $6,757 for hip replacement, the IFHP reported.
“We look at these numbers every year and it’s always a shocking demonstration of how much procedures and prescription drugs actually cost,” IFHP Chief Executive Tom Sackville said in a written statement. “There is no reason why identical procedures and products should vary in price so much across countries: it illustrates the damaging effects of an inadequately regulated health care market.”
The IFHP consists of 80 member companies in 25 countries. For the survey, costs for each country were submitted by participating member plans. Costs for the United States are derived from over 370 million employer-sponsored medical claims incurred from Jan. 1, 2014, to Dec. 31, 2014, and paid by multiple health plans. Cost data for the other six countries were provided by one private plan in each country.

A quarter of hypertensive Medicare enrollees are nonadherent
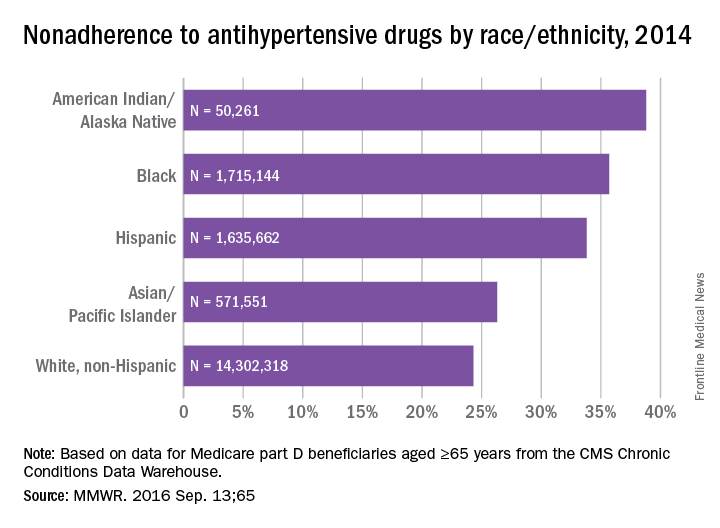
Over 26% of Medicare part D enrollees aged 65 years and over are not taking their antihypertensive drugs properly, according to a report published online Sept. 13 in MMWR.
An analysis of 2014 data showed that 4.9 million hypertensive Medicare patients were taking an incorrect dose of their medication or were not taking it at all, reported Matthew Ritchey, DPT of the Centers for Disease Control and Prevention’s division for heart disease and stroke prevention, and his associates (MMWR. 2016 Sep 13:65).

Nonadherence rates varied considerably by race and ethnicity, with American Indians/Alaska Natives the highest at 39%, followed by blacks at 36%, Hispanics at 34%, Asian/Pacific Islanders at 26%, and white non-Hispanics at 24%, the investigators noted.
The analysis included 18.5 million part D beneficiaries who filled two or more antihypertensive prescriptions in the same therapeutic class on different dates within a period of more than 90 days in 2014.
Over 26% of Medicare part D enrollees aged 65 years and over are not taking their antihypertensive drugs properly, according to a report published online Sept. 13 in MMWR.
An analysis of 2014 data showed that 4.9 million hypertensive Medicare patients were taking an incorrect dose of their medication or were not taking it at all, reported Matthew Ritchey, DPT of the Centers for Disease Control and Prevention’s division for heart disease and stroke prevention, and his associates (MMWR. 2016 Sep 13:65).
Nonadherence rates varied considerably by race and ethnicity, with American Indians/Alaska Natives the highest at 39%, followed by blacks at 36%, Hispanics at 34%, Asian/Pacific Islanders at 26%, and white non-Hispanics at 24%, the investigators noted.
The analysis included 18.5 million part D beneficiaries who filled two or more antihypertensive prescriptions in the same therapeutic class on different dates within a period of more than 90 days in 2014.
FROM MMWR
Health sector claims 4 spots among top 10 lobbyers in 2016
Four of the 10 highest-spending lobbyers for the first half of 2016 were in the health sector, with Blue Cross/Blue Shield occupying the sector’s top spot by a relatively small margin, according to the Center for Responsive Politics.
The four health-sectors concerns filled spots 3-6 in the overall top 10. Blue Cross/Blue Shield spent almost $12.1 million on lobbying in the first half of the year, putting it just ahead of the Pharmaceutical Research and Manufacturers of America (PhRMA), which spent $11.8 million. The American Medical Association was next at $11.3 million, followed by the American Hospital Association at $10.9 million, the center reported on OpenSecrets.org.

After those four, the next-highest health-sector spender was Pfizer, which put up almost $6.2 million in lobbying – good for 18th place for the first half of 2016. The health sector itself was the highest spending of the 121 ranked, taking a $266 million bite out of the total $1.6 billion lobbying pie for the year so far, according to the center’s analysis of data downloaded from the Senate Office of Public Records on Aug. 9.
The perennial leading spender on lobbying, the U.S. Chamber of Commerce, was well ahead of second place, with its $52.3 million more than doubling the $21.4 million spent by the National Association of Realtors. The two groups have finished 1-2 in lobbying spending every year since 2012, and the Chamber of Commerce has been the leading spender since 2001, data on OpenSecrets show.
Four of the 10 highest-spending lobbyers for the first half of 2016 were in the health sector, with Blue Cross/Blue Shield occupying the sector’s top spot by a relatively small margin, according to the Center for Responsive Politics.
The four health-sectors concerns filled spots 3-6 in the overall top 10. Blue Cross/Blue Shield spent almost $12.1 million on lobbying in the first half of the year, putting it just ahead of the Pharmaceutical Research and Manufacturers of America (PhRMA), which spent $11.8 million. The American Medical Association was next at $11.3 million, followed by the American Hospital Association at $10.9 million, the center reported on OpenSecrets.org.
After those four, the next-highest health-sector spender was Pfizer, which put up almost $6.2 million in lobbying – good for 18th place for the first half of 2016. The health sector itself was the highest spending of the 121 ranked, taking a $266 million bite out of the total $1.6 billion lobbying pie for the year so far, according to the center’s analysis of data downloaded from the Senate Office of Public Records on Aug. 9.
The perennial leading spender on lobbying, the U.S. Chamber of Commerce, was well ahead of second place, with its $52.3 million more than doubling the $21.4 million spent by the National Association of Realtors. The two groups have finished 1-2 in lobbying spending every year since 2012, and the Chamber of Commerce has been the leading spender since 2001, data on OpenSecrets show.

Veterans’ keratinocyte carcinoma, actinic keratosis care cost $356 million in 2012
Almost 4% of the 5.9 million veterans treated by the Veterans Health Administration in 2012 had a diagnosis of keratinocyte carcinoma (KC) or actinic keratosis (AK), and their treatment cost $356 million, according to an analysis of VHA-provided or -contracted outpatient encounters.
Treatment costs per patient for KCs, also known as nonmelanoma skin cancers, were $1,456 for basal cell carcinoma (BCC), $1,326 for squamous cell carcinoma (SCC), $1,016 for unspecified, nongenital invasive KCs, $971 for squamous cell carcinoma in situ, and $906 for genital skin cancer (not shown on graph), reported Jean Yoon, PhD, of Veterans Affairs Palo Alto Health Care System, Menlo Park, Calif., and her associates (Dermatol Surg. 2016;42:1041-7).
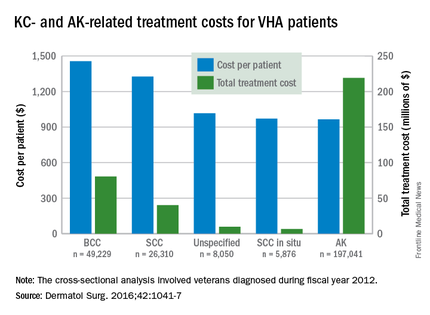
The VHA’s cost per patient for AK was relatively low – $965 per patient in 2012 – but the number of patients – 197,041 – was more than four times higher than any of the KCs. There were 49,229 veterans with BCC, 26,310 veterans with SCC, 8,050 veterans with unspecified KC, 5,876 veterans with SCC in situ, and 512 veterans with genital skin cancer, according to the analysis of administrative data on outpatient care and prescription drugs provided or paid by the VHA in fiscal year 2012. The total number of patients was 227,601, as some patients had more than one of the study diagnoses.
As a result of the high number of patients, actinic keratosis care totaled $219 million, compared with $80 million for BCC, $40 million for SCC, $9.6 million for nonspecified KC, $6.6 million for SCC in situ, and $582,000 for genital skin cancer, the investigators wrote.
The study was supported by a grant from the Department of Veterans Affairs. One of Dr. Yoon’s associates served as a consultant to several companies, but the remaining investigators had no conflicts to report.
Almost 4% of the 5.9 million veterans treated by the Veterans Health Administration in 2012 had a diagnosis of keratinocyte carcinoma (KC) or actinic keratosis (AK), and their treatment cost $356 million, according to an analysis of VHA-provided or -contracted outpatient encounters.
Treatment costs per patient for KCs, also known as nonmelanoma skin cancers, were $1,456 for basal cell carcinoma (BCC), $1,326 for squamous cell carcinoma (SCC), $1,016 for unspecified, nongenital invasive KCs, $971 for squamous cell carcinoma in situ, and $906 for genital skin cancer (not shown on graph), reported Jean Yoon, PhD, of Veterans Affairs Palo Alto Health Care System, Menlo Park, Calif., and her associates (Dermatol Surg. 2016;42:1041-7).
The VHA’s cost per patient for AK was relatively low – $965 per patient in 2012 – but the number of patients – 197,041 – was more than four times higher than any of the KCs. There were 49,229 veterans with BCC, 26,310 veterans with SCC, 8,050 veterans with unspecified KC, 5,876 veterans with SCC in situ, and 512 veterans with genital skin cancer, according to the analysis of administrative data on outpatient care and prescription drugs provided or paid by the VHA in fiscal year 2012. The total number of patients was 227,601, as some patients had more than one of the study diagnoses.
As a result of the high number of patients, actinic keratosis care totaled $219 million, compared with $80 million for BCC, $40 million for SCC, $9.6 million for nonspecified KC, $6.6 million for SCC in situ, and $582,000 for genital skin cancer, the investigators wrote.
The study was supported by a grant from the Department of Veterans Affairs. One of Dr. Yoon’s associates served as a consultant to several companies, but the remaining investigators had no conflicts to report.
FROM DERMATOLOGIC SURGERY

New anticancer drugs linked to increased costs, life expectancy
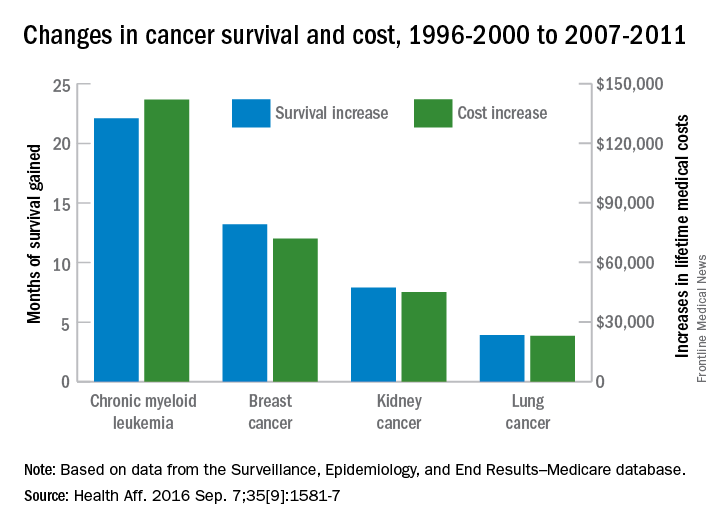
New anticancer drugs are often expensive and have been accompanied by large increases in the cost of medical treatment, but they also are associated with gains in life expectancy, according to an analysis of Medicare data published online.
Investigators looked at four different types of cancer – breast, kidney, lung, and chronic myeloid leukemia (CML) – over two time periods: 1996-2000 and 2007-2011. Patients treated for CML during 2007-2011 had the largest increases in both average lifetime medical cost ($142,000) and months of life gained (22.1) over those treated during 1996-2000, reported David H. Howard, PhD, of Emory University, Atlanta, and his associates.

Breast cancer patients had the next-largest increases: 13.2 months of life expectancy and $72,000 in lifetime medical cost for those who received physician-administered intravenous drugs. For breast cancer patients who received only oral drugs, the increases were 2 months of life and $9,000 in lifetime cost, they noted.
Patients with kidney cancer had an average life-expectancy increase of 7.9 months and a cost increase of $45,000, but those estimates don’t fully reflect the effect of several oral drugs that were introduced after 2007 but did not come into widespread use during the entire study period, Dr. Howard and his associates noted (Health Aff. 2016 Sep 7;35[9]:1581-7).
Lung cancer patients experienced the smallest changes between the two time periods, with an increase in life expectancy of 3.9 months for those who received physician-administered anticancer drugs and a lifetime medical cost increase of $23,000. Patients with lung cancer who did not receive such drugs had increases of 0.7 months of life expectancy and $4,000 in lifetime medical costs.
The researchers used data from the Surveillance, Epidemiology, and End Results–Medicare database, and all costs are adjusted to 2012 dollars. Data collection was supported by the California Department of Health and funding for the study was provided by Pfizer. Three of Dr. Howard’s five coinvestigators are Pfizer employees.
New anticancer drugs are often expensive and have been accompanied by large increases in the cost of medical treatment, but they also are associated with gains in life expectancy, according to an analysis of Medicare data published online.
Investigators looked at four different types of cancer – breast, kidney, lung, and chronic myeloid leukemia (CML) – over two time periods: 1996-2000 and 2007-2011. Patients treated for CML during 2007-2011 had the largest increases in both average lifetime medical cost ($142,000) and months of life gained (22.1) over those treated during 1996-2000, reported David H. Howard, PhD, of Emory University, Atlanta, and his associates.
Breast cancer patients had the next-largest increases: 13.2 months of life expectancy and $72,000 in lifetime medical cost for those who received physician-administered intravenous drugs. For breast cancer patients who received only oral drugs, the increases were 2 months of life and $9,000 in lifetime cost, they noted.
Patients with kidney cancer had an average life-expectancy increase of 7.9 months and a cost increase of $45,000, but those estimates don’t fully reflect the effect of several oral drugs that were introduced after 2007 but did not come into widespread use during the entire study period, Dr. Howard and his associates noted (Health Aff. 2016 Sep 7;35[9]:1581-7).
Lung cancer patients experienced the smallest changes between the two time periods, with an increase in life expectancy of 3.9 months for those who received physician-administered anticancer drugs and a lifetime medical cost increase of $23,000. Patients with lung cancer who did not receive such drugs had increases of 0.7 months of life expectancy and $4,000 in lifetime medical costs.
The researchers used data from the Surveillance, Epidemiology, and End Results–Medicare database, and all costs are adjusted to 2012 dollars. Data collection was supported by the California Department of Health and funding for the study was provided by Pfizer. Three of Dr. Howard’s five coinvestigators are Pfizer employees.
FROM HEALTH AFFAIRS
Another infant with Zika-related birth defect born in the United States
The first new case of a live-born infant with Zika virus–related birth defects in almost a month was reported during the week ending Sept. 1, bringing the U.S. total to 18 so far, according to the Centers for Disease Control and Prevention.
The infant was born in one of the 50 states or the District of Columbia and is the first case of a Zika-related birth defect reported since the week ending Aug. 4. The CDC is not reporting state- or territorial-level data to protect the privacy of affected women and children. There were no new Zika-related pregnancy losses for the week of Sept. 1, so the total remains at six for the states, D.C., and the territories, the CDC reported Sept. 8.
The number of pregnant women with any laboratory evidence of Zika infection increased by 156 during the week ending Sept. 1: 47 new cases in the states/D.C. and 109 new cases in the territories. The total number of pregnant women with Zika for 2016 is now 1,751, the CDC said.
For 2015-2016, there have been 18,833 cases reported in the entire U.S. population: 2,964 in the states/D.C. (all but 44 were travel associated) and 15,869 in the territories. All but 60 cases in the territories were locally acquired, and 98% have occurred in Puerto Rico, the CDC also reported Sept. 8.
The figures for states, territories, and D.C. reflect reporting to the U.S. Zika Pregnancy Registry; data for Puerto Rico are reported to the U.S. Zika Active Pregnancy Surveillance System.
Zika-related birth defects recorded by the CDC could include microcephaly, calcium deposits in the brain indicating possible brain damage, excess fluid in the brain cavities and surrounding the brain, absent or poorly formed brain structures, abnormal eye development, or other problems resulting from brain damage that affect nerves, muscles, and bones. The pregnancy losses encompass any miscarriage, stillbirth, and termination with evidence of birth defects.

Another 199 pregnant women with Zika
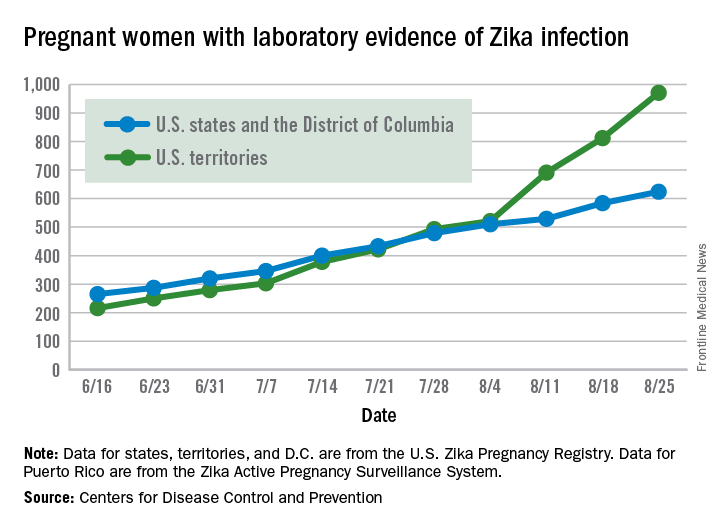
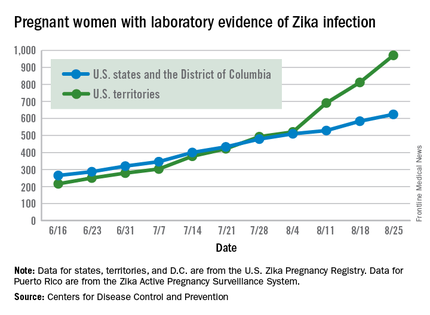
Zika virus shows no signs of slowing down, as the number of pregnant women with laboratory evidence of possible infection in the United States and its territories took its largest jump yet during the week ending Aug. 25, according to the Centers for Disease Control and Prevention.
There were 199 new cases of Zika that week: 159 in the U.S. territories and 40 in the 50 states and the District of Columbia. The previous high had been 189 for the week ending Aug. 11. Cases in pregnant women for 2016 so far number 971 in the territories and 624 in the states and D.C. – a total of 1,595, the CDC reported Sept. 1.
The number of poor outcomes among pregnant women with Zika virus infection did not change for the week ending Aug. 25. The number of live-born infants with Zika-related birth defects remained at 17 – 16 in the states/D.C. and 1 in the territories – and the number of pregnancy losses with birth defects was still 6 – 5 in the states/D.C. and 1 in the territories, the CDC said. State- or territorial-level data are not being reported to protect the privacy of affected women and children.
Among the entire U.S. population, 16,832 cases of Zika have been reported to the CDC Arboviral Disease Branch in 2015-2016, with 5,304 reported for the week ending Aug. 31 (Puerto Rico retroactively reported 5,000 cases that had been identified between June 4 and Aug. 6). The states/D.C. account for 2,722 of total cases, and the territories have reported 14,110 cases, of which Puerto Rico accounts for 13,791, the CDC noted.
The figures for states, territories, and D.C. reflect reporting to the U.S. Zika Pregnancy Registry; data for Puerto Rico are reported to the U.S. Zika Active Pregnancy Surveillance System.
Zika-related birth defects recorded by the CDC could include microcephaly, calcium deposits in the brain indicating possible brain damage, excess fluid in the brain cavities and surrounding the brain, absent or poorly formed brain structures, abnormal eye development, or other problems resulting from brain damage that affect nerves, muscles, and bones. The pregnancy losses encompass any miscarriage, stillbirth, and termination with evidence of birth defects.