User login
Getting the hypertension Dx right: Patient positioning matters
ABSTRACT
Purpose This study evaluated the effect of patient positioning on the diagnosis of hypertension in a clinic setting and the importance of following guidelines for measuring blood pressure (BP).
Methods In the trial part of this study, we recorded BP measurements by an aneroid sphygmomanometer with patients seated first on an examination table, a commonly observed practice, and second in the standard seated position as defined by the American Heart Association. Two measurements were obtained in each position for 204 patients, and we determined the difference between the average readings in the 2 positions. Factored into the comparison was an estimation of inherent variance of the device and observer achieved by repeated measurements on a healthy individual.
Results This investigation included an initial observational study of 25 regional primary care offices, the results of which showed frequent lack of adherence with accepted guidelines in patient positioning during BP measurement. The overall systolic and diastolic BPs were more than 2 mm Hg lower in the standard seated position compared with the examination table position (P<.001). Noncompliance with the position guideline resulted in misclassification of 15 patients (7.4%) as prehypertensive, when, in fact, they were normotensive. Misclassification of hypertension occurred in 12 patients (5.9%), when, in fact, they were normotensive. Logistic regression using relevant clinical factors did not identify those individuals who were misclassified.
Conclusion This study underscores the importance of patient positioning on BP determinations in order to accurately diagnose hypertension.
The high prevalence of hypertension and its burden of disease in the United States and worldwide are well known.1 Hypertension is a major risk factor for coronary heart disease, congestive heart failure, ischemic and hemorrhagic stroke, chronic kidney disease, and peripheral arterial disease.2 Among all risk factors, hypertension ranked first worldwide in disability-adjusted life-years.3 However, misclassification of an individual’s blood pressure (BP) as prehypertension or hypertension also confers significant health and financial burdens due to unnecessary medical encounters, testing, and treatment, and to increased cost of insurance coverage and out-of-pocket expenses. A correct assessment of BP in the outpatient setting depends on accurate measurement technique.
The diagnosis of hypertension is based on indirect measurement of BP using in-office, ambulatory, or home monitoring. Although office BP measurement is less than ideal, it is used most often to diagnose and monitor hypertension. Furthermore, most published trials of treatment recommendations are based on office BP measurements.4
Automated oscillometric and aneroid sphygmomanometers are common BP measurement devices. Proper technique is particularly important with the aneroid sphygmomanometer to obtain consistent and accurate results.5 Good training and an ability to hear the Korotkoff sounds are crucial.
Expert consensus groups such as the American Heart Association (AHA) publish recommendations for proper technique in reliably measuring BP,6-8 and they emphasize the importance of patient positioning during BP measurement. The individual should be seated comfortably in a chair with both arms and back supported, legs uncrossed, and feet flat on the floor. We’ll refer to this as the “standard position.” Although the proper technique for measuring BP has been widely advocated, a recent literature review for the US Preventive Services Task Force concluded that surprisingly few studies are available on the diagnostic accuracy of office BP practices.9
One paper evaluated the effect of leg crossing on accuracy of BP measurement. No subjects were reclassified as hypertensive, but the study lacked statistical rigor.10 Another study found variable BP readings regardless of body position.11
The purpose of our study was to compare BP measurement in 2 positions: the standard position described above, and the examination table position in which the patient is seated on the edge of the table with back, arms, and feet unsupported.
METHODS
We conducted our literature search across several scientific and medical literature databases, including PubMed, ScienceDirect, and CINAHL. Only English-language articles were reviewed.
We followed the BP measurement guidelines of the AHA. Prior to beginning the study, we provided instructions in proper BP measurement technique to the nurses who would obtain the data. The minimum sample size of patients needed to identify a difference of at least 2 mm Hg was 26, as estimated by power analysis. This was calculated using an alpha of .05 and a beta of .13.
The study population consisted of patients presenting consecutively to a teaching family medicine center. Adult patients, ages 18 and older, were informed about the study and invited to participate. Those who agreed were asked to read and sign an informed consent approved by a regional institutional review board for human subjects. We excluded patients who declined participation for any reason, who were in severe pain or distress that may have prevented them from completing the protocol, or who had limited mobility that could interfere with climbing onto the examination table. Patients considered for the study totaled 250, 28 of whom were ineligible. Another 18 patients declined participation, leaving 204 who completed the protocol.
Before testing began, we estimated the standard deviation of each aneroid sphygmomanometer and the assigned observer by repeatedly measuring the BP of a healthy normotensive individual sitting in the standard position. We obtained 46 measurements over 2 days to avoid subject and operator fatigue. Standard deviation for systolic BP was 3.6 mm Hg; for diastolic it was 3.8 mm Hg.
During testing, nurses recorded BP for each patient twice in the examination table position and twice in the standard position. They entered data into an Excel workbook for subsequent analysis. All examination rooms were equipped with newly purchased aneroid sphygmomanometers, and the appropriate cuff size was selected for each patient. Patients were instructed to remain quiet during the measurements. Patients sat first on the edge of the examination table. After a 5-minute rest, BP was measured twice in the same arm. Measurements were separated by 1 to 2 minutes. Patients then sat in the chair and rested another 2 minutes before BP was again measured twice in the same arm. The arms and back were supported in the chair and the stethoscope placed at heart level.
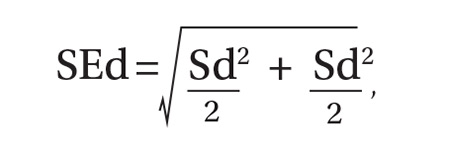
As per protocol, we obtained 4 BP readings on each patient and calculated the difference between the average systolic and diastolic BP values from the 2 positions. The standard error of the mean of this difference was determined using the equation, where Sd is the standard deviation of the aneroid sphygmomanometer and observer.12 A one-sided, 95% confidence upper bound for the standard error of the difference is 1.65 × SEd. We compared patient-specific differences against this upper bound to identify significant systolic and diastolic BP changes due to positioning. If the patient’s BP difference exceeded the upper bound, it was attributed to the positional change and not to variation inherent to the sphygmomanometer and observer.
As an example, consider a patient whose average systolic BP readings from the examination-table and standard positions, respectively, were 128 mm Hg and 120 mm Hg. Assuming an SEd of 3.55 and an upper bound of 5.86, the observed 8 mm Hg difference in average systolic BPs would be considered significant. The amount of random variation from the sphygmomanometer and observer would not be expected to exceed 5.86 mm Hg.
In accordance with accepted standards, prehypertension was defined as a BP between 120-139/80-89 mm Hg, and hypertension was defined as a BP ≥140/90 mm Hg.4 BP below 120/80 mm Hg was considered normal. We calculated each patient’s average systolic and diastolic BP values in the 2 positions and thereby classified the individual as normotensive, prehypertensive, or hypertensive. We regarded as misclassified any patient whose BP showed significant lowering between the examination-table and standard positions resulting in a change of classification from prehypertensive or hypertensive to normotensive. For example, a patient with an examination-table position average reading of 126/85 mm Hg and a standard position average reading of 118/78 mm Hg would have been misclassified as prehypertensive.
We reviewed charts and gathered data, including subject age, sex, obesity (defined as a body mass index of ≥30 kg/m2), and history of diabetes, hypertension, or smoking. Other than age, all data were binary. We performed logistic regression analysis using the Excel Add-in Real Statistics Resource Pack software (Release 4.3)13 to determine if these factors could predict significant lowering of BP due to positional change.
Our associated observational study. We also conducted a separate observational study of 25 regional primary care offices to evaluate compliance with the AHA guidelines for measuring BP. The office nurses taking measurements were not informed of the study’s purpose to prevent deviation from their common practice.
Data on 9 guideline criteria were collected to assess supervision of patients before and during measurements, including having the patient sit in a chair in quiet and comfortable surroundings with arms and back supported and feet on the ground. We also noted the type of BP measuring device used. Additionally, observers assessed the technique of the individuals using a manual device, including cuff placement and deflation rate. The observations were conducted during a clinic visit by a medical student knowledgeable in the AHA guidelines for measuring BP by automated oscillometric or aneroid sphygmomanometric devices. We conducted the study over a 2-week period in the second quarter of 2016.
RESULTS
Power analysis performed prior to the study showed that a minimum of 26 patients would be needed to predict a 2 mm Hg difference between BPs obtained in the 2 positions. Of the 204 patients used in the logistic regression analysis, 78 were men and 126 were women. Ages ranged from 18 to 101 years, yielding a mean of 54. One-hundred sixteen had previously received a diagnosis of hypertension, 39 had diabetes, 92 were obese, 22 were current smokers, and 68 were former smokers.
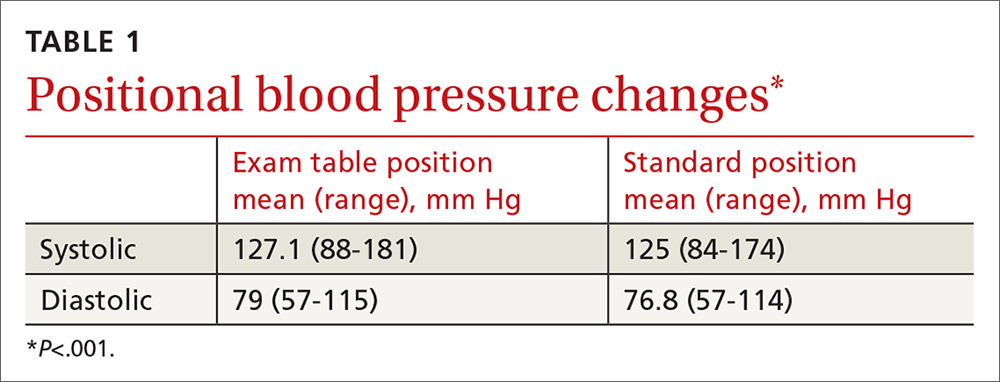
TABLE 1 shows the means and ranges of systolic and diastolic BP for both study positions. With this study population, mean BP recorded in the examination-table position decreased in the standard position by 2.1 and 2.2 mm Hg for systolic and diastolic BP, respectively (P<.001).
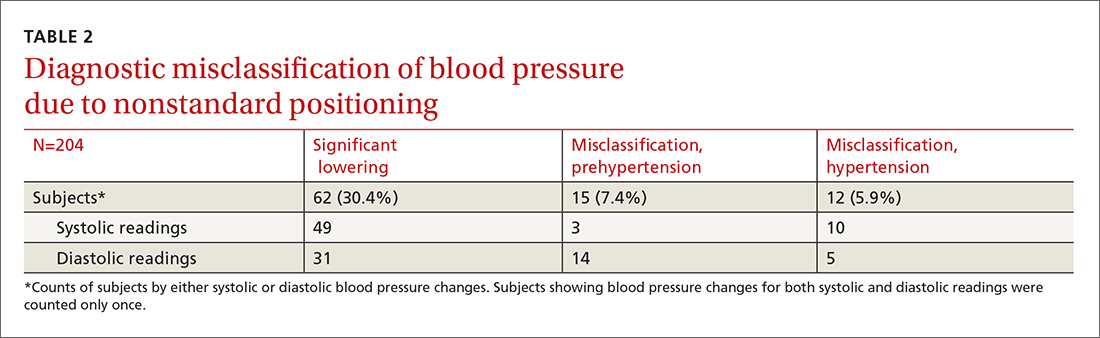
Significant BP lowering—as defined by a one-sided 95% confidence upper bound for the standard error of differences between study positions—was determined to be 5.86 and 6.22 mm Hg for systolic and diastolic pressures, respectively. Significant lowering of BP and misclassification due to positioning are summarized in TABLE 2. Significant lowering of mean systolic or diastolic BP with positional change from table to chair occurred in 62 subjects (30.4%). Misclassification of prehypertension occurred in 7.4% of subjects, and misclassification of hypertension occurred in 5.9%.
Logistic regression using patient age, sex, obesity, and history of diabetes, hypertension, and smoking as independent factors did not predict significant BP lowering with positional change.
Our observational study revealed that proper positioning in a chair was followed in only 10 of the 25 offices. In the remaining offices, patients were seated on the examination table. A 5-minute rest period before measuring BP was allowed in only 10 of the 25 offices. An automated oscillometric device was used in only 2 of the 25 offices.
DISCUSSION
In this study, 27 subjects (13.2%) were misclassified as prehypertensive or hypertensive as a result of deviating from the standard position in obtaining BP. Although the standard position is universally recommended, the guideline is not always followed in clinical practice.14
One study by Villegas et al found that 60% of physicians and nurses working in a major hospital were measuring BP inaccurately.15 In our initial observational study, 60% of primary care practices visited did not adhere to the recommended patient positioning. These medical offices are located in the community surrounding our facility and are operated by the same health care organization. The misclassification of prehypertension and hypertension observed in our prospective comparison of BP recordings in table and chair positions is, therefore, likely to occur to some degree at these practices, as well.
Similar diagnostic misclassifications have been reported in other medical settings. In a published survey of 114 medical offices, McKay and coworkers noted frequent inconsistencies with published guidelines in measuring BP.16
Common clinical demographic data obtained during this study showed no association with the positional BP change. Increased muscle tension due to lack of body support while sitting on the edge of the examination table could be the cause of elevated BP for this subgroup of individuals. Measuring muscle tension of the arms and back while seated on an exam table and chair was beyond the scope of this study.
In clinical practice, different types of BP measuring devices are used. Calibration and quality control of these devices is often lacking.17 Before starting our study, we determined the statistical variance of the aneroid sphygmomanometers and found it to approximate the manufacturer’s precision specification. Guidelines recommend using the mean of 2 BP readings as representing the patient’s BP for a given clinic visit. Additional readings are recommended if there is more than a 5 mm Hg difference between the initial 2 readings.4
In our study, we used sampling statistics of the BP readings and clinical guideline BP ranges in making diagnostic determinations. The inability to identify those patients whose BP will be affected by positional change highlights the importance of following standard BP measurement guidelines for all patients.
Study limitations. Positional change in BP from examination table to chair lacks a comparison to BP changes in positioning from chair to table. If similar BP changes in the reverse sequence were to be observed, this would add support to the hypothesis that muscle tension of the unsupported body is a cause of BP elevation in certain individuals. We believe, however, that the sequence of BP measurements (from table to chair) did not have a significant impact because all patients were allowed to rest in each position before the BP was measured. The BP was therefore measured in a steady-state in both positions.
Additionally, BP measurement by aneroid sphygmomanometry is highly dependent on observer skill and hearing ability. Furthermore, a disproportionate number of BP measurements recorded in the study ended in zero, suggesting terminal digit bias by the observer. These sources of error may be avoided using an automated oscillometric measuring device.18 Automated devices also allow for repeated independent measurements that minimize the white-coat effect. However, there are also limitations to the accuracy of oscillometric equipment. This is especially true when recording BP in the elderly, a group whose stiff arterial walls may cause erroneous measurements.19
Guideline justification. Nonadherence to standard positioning when measuring BP leads to certain individuals being misclassified as prehypertensive or hypertensive. Misclassification in turn leads to unnecessary medical encounters, testing, and treatment. Misdiagnosis is also likely to increase the cost of an individual’s insurance coverage and out-of-pocket health care expenses.
CORRESPONDENCE
Roy N. Morcos, MD, St. Elizabeth Family Medicine Residency Program, 8423 Market Street, Suite 101, Boardman, Ohio 44512; [email protected].
1. Kearney PM, Whelton M, Reynolds K, et al. Global burden of hypertension: analysis of worldwide data. Lancet. 2005;365:217-223.
2. Lim SS, Vos T, Flaxman AD, et al. A comparative risk assessment of burden of disease and injury attributable to 67 risk factors and risk factor clusters in 21 regions, 1990-2010: a systematic analysis for the Global Burden of Disease Study 2010. Lancet. 2012;380:2224-2260.
3. Murray CJ, Lopez AD. Measuring the global burden of disease. New Engl J Med. 2013;369:448-457.
4. Chobanian AV, Bakris GL, Black HR, et al. The Seventh Report of the Joint National Committee on Prevention, Detection, Evaluation, and Treatment of High Blood Pressure: the JNC 7 report. JAMA. 2003;289:2560-2572.
5. Bailey RH, Bauer JH. A review of common errors in the indirect measurement of blood pressure. Sphygmomanometry. Arch Intern Med. 1993;153:2741-2748.
6. Padwal RS, Hemmelgarn BR, McAlister FA, et al. The 2007 Canadian Hypertension Education Program recommendations for the management of hypertension: part 1- blood pressure measurement, diagnosis and assessment of risk. Can J Cardiol. 2007;23:529-538.
7. Campbell NR, Chockalingam A, Fodor JG, et al. Accurate, reproducible measurement of blood pressure. CMAJ. 1990;143:19-24.
8. Pickering TG, Hall JE, Appel LJ, et al. Recommendations for blood pressure measurement in humans: an AHA scientific statement from the Council on High Blood Pressure Research Professional and Public Education Subcommittee. J Clin Hypertens. 2005;7:102-109.
9. Piper MA, Evans CV, Burda BU, et al. Diagnostic and predictive accuracy of blood pressure screening methods with consideration of rescreening intervals: a systematic review for the U.S. Preventive Services Task Force. Ann Intern Med. 2015;162:192-204.
10. Peters GL, Binder SK, Campbell NR. The effect of crossing legs on blood pressure: a randomized single-blind cross-over study. Blood Press Monit. 1999;4:97-101.
11. Cicolini G, Pizzi C, Palma E, et al. Differences in blood pressure by body position (supine, Fowler’s, and sitting) in hypertensive subjects. Am J Hypertens. 2011;24:1073-1079.
12. Daniel WW, Cross CL. Biostatistics: A Foundation for Analysis in the Health Sciences (10th Edition). Hoboken, NJ: John Wiley & Sons; 2013.
13. Zaiontz C. Real statistics using Excel. Available at: http://www.real-statistics.com/. Accessed February 20, 2018.
14. Burgess SE, MacLaughlin EJ, Smith PA, et al. Blood pressure rising: differences between current clinical and recommended measurement techniques. J Am Soc Hypertens. 2011;5:484-488.
15. Villegas I, Arias IC, Botero A, et al. Evaluation of the technique used by health-care workers for taking blood pressure. Hypertension. 1995;26:1204-1206.
16. McKay DW, Campbell NR, Parab LS, et al. Clinical assessment of blood pressure. J Hum Hypertens. 1990;4:639-645.
17. Jones DW, Appel LJ, Sheps SG, et al. Measuring blood pressure accurately: new and persistent challenges. JAMA. 2003;289:1027-1030.
18. Leung AA, Nerenberg K, Daskalopoulou SS, et al. Hypertension Canada’s 2016 Canadian Hypertension Education Program Guidelines for Blood Pressure Measurement, Diagnosis, Assessment of Risk, Prevention, and Treatment of Hypertension. Can J Cardiol. 2016;32:569-588.
19. Raamat R, Talts J, Jagomägi K, et al. Errors of oscillometric blood pressure measurement as predicted by simulation. Blood Press Monit. 2011;16:238-245.
ABSTRACT
Purpose This study evaluated the effect of patient positioning on the diagnosis of hypertension in a clinic setting and the importance of following guidelines for measuring blood pressure (BP).
Methods In the trial part of this study, we recorded BP measurements by an aneroid sphygmomanometer with patients seated first on an examination table, a commonly observed practice, and second in the standard seated position as defined by the American Heart Association. Two measurements were obtained in each position for 204 patients, and we determined the difference between the average readings in the 2 positions. Factored into the comparison was an estimation of inherent variance of the device and observer achieved by repeated measurements on a healthy individual.
Results This investigation included an initial observational study of 25 regional primary care offices, the results of which showed frequent lack of adherence with accepted guidelines in patient positioning during BP measurement. The overall systolic and diastolic BPs were more than 2 mm Hg lower in the standard seated position compared with the examination table position (P<.001). Noncompliance with the position guideline resulted in misclassification of 15 patients (7.4%) as prehypertensive, when, in fact, they were normotensive. Misclassification of hypertension occurred in 12 patients (5.9%), when, in fact, they were normotensive. Logistic regression using relevant clinical factors did not identify those individuals who were misclassified.
Conclusion This study underscores the importance of patient positioning on BP determinations in order to accurately diagnose hypertension.
The high prevalence of hypertension and its burden of disease in the United States and worldwide are well known.1 Hypertension is a major risk factor for coronary heart disease, congestive heart failure, ischemic and hemorrhagic stroke, chronic kidney disease, and peripheral arterial disease.2 Among all risk factors, hypertension ranked first worldwide in disability-adjusted life-years.3 However, misclassification of an individual’s blood pressure (BP) as prehypertension or hypertension also confers significant health and financial burdens due to unnecessary medical encounters, testing, and treatment, and to increased cost of insurance coverage and out-of-pocket expenses. A correct assessment of BP in the outpatient setting depends on accurate measurement technique.
The diagnosis of hypertension is based on indirect measurement of BP using in-office, ambulatory, or home monitoring. Although office BP measurement is less than ideal, it is used most often to diagnose and monitor hypertension. Furthermore, most published trials of treatment recommendations are based on office BP measurements.4
Automated oscillometric and aneroid sphygmomanometers are common BP measurement devices. Proper technique is particularly important with the aneroid sphygmomanometer to obtain consistent and accurate results.5 Good training and an ability to hear the Korotkoff sounds are crucial.
Expert consensus groups such as the American Heart Association (AHA) publish recommendations for proper technique in reliably measuring BP,6-8 and they emphasize the importance of patient positioning during BP measurement. The individual should be seated comfortably in a chair with both arms and back supported, legs uncrossed, and feet flat on the floor. We’ll refer to this as the “standard position.” Although the proper technique for measuring BP has been widely advocated, a recent literature review for the US Preventive Services Task Force concluded that surprisingly few studies are available on the diagnostic accuracy of office BP practices.9
One paper evaluated the effect of leg crossing on accuracy of BP measurement. No subjects were reclassified as hypertensive, but the study lacked statistical rigor.10 Another study found variable BP readings regardless of body position.11
The purpose of our study was to compare BP measurement in 2 positions: the standard position described above, and the examination table position in which the patient is seated on the edge of the table with back, arms, and feet unsupported.
METHODS
We conducted our literature search across several scientific and medical literature databases, including PubMed, ScienceDirect, and CINAHL. Only English-language articles were reviewed.
We followed the BP measurement guidelines of the AHA. Prior to beginning the study, we provided instructions in proper BP measurement technique to the nurses who would obtain the data. The minimum sample size of patients needed to identify a difference of at least 2 mm Hg was 26, as estimated by power analysis. This was calculated using an alpha of .05 and a beta of .13.
The study population consisted of patients presenting consecutively to a teaching family medicine center. Adult patients, ages 18 and older, were informed about the study and invited to participate. Those who agreed were asked to read and sign an informed consent approved by a regional institutional review board for human subjects. We excluded patients who declined participation for any reason, who were in severe pain or distress that may have prevented them from completing the protocol, or who had limited mobility that could interfere with climbing onto the examination table. Patients considered for the study totaled 250, 28 of whom were ineligible. Another 18 patients declined participation, leaving 204 who completed the protocol.
Before testing began, we estimated the standard deviation of each aneroid sphygmomanometer and the assigned observer by repeatedly measuring the BP of a healthy normotensive individual sitting in the standard position. We obtained 46 measurements over 2 days to avoid subject and operator fatigue. Standard deviation for systolic BP was 3.6 mm Hg; for diastolic it was 3.8 mm Hg.
During testing, nurses recorded BP for each patient twice in the examination table position and twice in the standard position. They entered data into an Excel workbook for subsequent analysis. All examination rooms were equipped with newly purchased aneroid sphygmomanometers, and the appropriate cuff size was selected for each patient. Patients were instructed to remain quiet during the measurements. Patients sat first on the edge of the examination table. After a 5-minute rest, BP was measured twice in the same arm. Measurements were separated by 1 to 2 minutes. Patients then sat in the chair and rested another 2 minutes before BP was again measured twice in the same arm. The arms and back were supported in the chair and the stethoscope placed at heart level.
As per protocol, we obtained 4 BP readings on each patient and calculated the difference between the average systolic and diastolic BP values from the 2 positions. The standard error of the mean of this difference was determined using the equation, where Sd is the standard deviation of the aneroid sphygmomanometer and observer.12 A one-sided, 95% confidence upper bound for the standard error of the difference is 1.65 × SEd. We compared patient-specific differences against this upper bound to identify significant systolic and diastolic BP changes due to positioning. If the patient’s BP difference exceeded the upper bound, it was attributed to the positional change and not to variation inherent to the sphygmomanometer and observer.
As an example, consider a patient whose average systolic BP readings from the examination-table and standard positions, respectively, were 128 mm Hg and 120 mm Hg. Assuming an SEd of 3.55 and an upper bound of 5.86, the observed 8 mm Hg difference in average systolic BPs would be considered significant. The amount of random variation from the sphygmomanometer and observer would not be expected to exceed 5.86 mm Hg.
In accordance with accepted standards, prehypertension was defined as a BP between 120-139/80-89 mm Hg, and hypertension was defined as a BP ≥140/90 mm Hg.4 BP below 120/80 mm Hg was considered normal. We calculated each patient’s average systolic and diastolic BP values in the 2 positions and thereby classified the individual as normotensive, prehypertensive, or hypertensive. We regarded as misclassified any patient whose BP showed significant lowering between the examination-table and standard positions resulting in a change of classification from prehypertensive or hypertensive to normotensive. For example, a patient with an examination-table position average reading of 126/85 mm Hg and a standard position average reading of 118/78 mm Hg would have been misclassified as prehypertensive.
We reviewed charts and gathered data, including subject age, sex, obesity (defined as a body mass index of ≥30 kg/m2), and history of diabetes, hypertension, or smoking. Other than age, all data were binary. We performed logistic regression analysis using the Excel Add-in Real Statistics Resource Pack software (Release 4.3)13 to determine if these factors could predict significant lowering of BP due to positional change.
Our associated observational study. We also conducted a separate observational study of 25 regional primary care offices to evaluate compliance with the AHA guidelines for measuring BP. The office nurses taking measurements were not informed of the study’s purpose to prevent deviation from their common practice.
Data on 9 guideline criteria were collected to assess supervision of patients before and during measurements, including having the patient sit in a chair in quiet and comfortable surroundings with arms and back supported and feet on the ground. We also noted the type of BP measuring device used. Additionally, observers assessed the technique of the individuals using a manual device, including cuff placement and deflation rate. The observations were conducted during a clinic visit by a medical student knowledgeable in the AHA guidelines for measuring BP by automated oscillometric or aneroid sphygmomanometric devices. We conducted the study over a 2-week period in the second quarter of 2016.
RESULTS
Power analysis performed prior to the study showed that a minimum of 26 patients would be needed to predict a 2 mm Hg difference between BPs obtained in the 2 positions. Of the 204 patients used in the logistic regression analysis, 78 were men and 126 were women. Ages ranged from 18 to 101 years, yielding a mean of 54. One-hundred sixteen had previously received a diagnosis of hypertension, 39 had diabetes, 92 were obese, 22 were current smokers, and 68 were former smokers.
TABLE 1 shows the means and ranges of systolic and diastolic BP for both study positions. With this study population, mean BP recorded in the examination-table position decreased in the standard position by 2.1 and 2.2 mm Hg for systolic and diastolic BP, respectively (P<.001).
Significant BP lowering—as defined by a one-sided 95% confidence upper bound for the standard error of differences between study positions—was determined to be 5.86 and 6.22 mm Hg for systolic and diastolic pressures, respectively. Significant lowering of BP and misclassification due to positioning are summarized in TABLE 2. Significant lowering of mean systolic or diastolic BP with positional change from table to chair occurred in 62 subjects (30.4%). Misclassification of prehypertension occurred in 7.4% of subjects, and misclassification of hypertension occurred in 5.9%.
Logistic regression using patient age, sex, obesity, and history of diabetes, hypertension, and smoking as independent factors did not predict significant BP lowering with positional change.
Our observational study revealed that proper positioning in a chair was followed in only 10 of the 25 offices. In the remaining offices, patients were seated on the examination table. A 5-minute rest period before measuring BP was allowed in only 10 of the 25 offices. An automated oscillometric device was used in only 2 of the 25 offices.
DISCUSSION
In this study, 27 subjects (13.2%) were misclassified as prehypertensive or hypertensive as a result of deviating from the standard position in obtaining BP. Although the standard position is universally recommended, the guideline is not always followed in clinical practice.14
One study by Villegas et al found that 60% of physicians and nurses working in a major hospital were measuring BP inaccurately.15 In our initial observational study, 60% of primary care practices visited did not adhere to the recommended patient positioning. These medical offices are located in the community surrounding our facility and are operated by the same health care organization. The misclassification of prehypertension and hypertension observed in our prospective comparison of BP recordings in table and chair positions is, therefore, likely to occur to some degree at these practices, as well.
Similar diagnostic misclassifications have been reported in other medical settings. In a published survey of 114 medical offices, McKay and coworkers noted frequent inconsistencies with published guidelines in measuring BP.16
Common clinical demographic data obtained during this study showed no association with the positional BP change. Increased muscle tension due to lack of body support while sitting on the edge of the examination table could be the cause of elevated BP for this subgroup of individuals. Measuring muscle tension of the arms and back while seated on an exam table and chair was beyond the scope of this study.
In clinical practice, different types of BP measuring devices are used. Calibration and quality control of these devices is often lacking.17 Before starting our study, we determined the statistical variance of the aneroid sphygmomanometers and found it to approximate the manufacturer’s precision specification. Guidelines recommend using the mean of 2 BP readings as representing the patient’s BP for a given clinic visit. Additional readings are recommended if there is more than a 5 mm Hg difference between the initial 2 readings.4
In our study, we used sampling statistics of the BP readings and clinical guideline BP ranges in making diagnostic determinations. The inability to identify those patients whose BP will be affected by positional change highlights the importance of following standard BP measurement guidelines for all patients.
Study limitations. Positional change in BP from examination table to chair lacks a comparison to BP changes in positioning from chair to table. If similar BP changes in the reverse sequence were to be observed, this would add support to the hypothesis that muscle tension of the unsupported body is a cause of BP elevation in certain individuals. We believe, however, that the sequence of BP measurements (from table to chair) did not have a significant impact because all patients were allowed to rest in each position before the BP was measured. The BP was therefore measured in a steady-state in both positions.
Additionally, BP measurement by aneroid sphygmomanometry is highly dependent on observer skill and hearing ability. Furthermore, a disproportionate number of BP measurements recorded in the study ended in zero, suggesting terminal digit bias by the observer. These sources of error may be avoided using an automated oscillometric measuring device.18 Automated devices also allow for repeated independent measurements that minimize the white-coat effect. However, there are also limitations to the accuracy of oscillometric equipment. This is especially true when recording BP in the elderly, a group whose stiff arterial walls may cause erroneous measurements.19
Guideline justification. Nonadherence to standard positioning when measuring BP leads to certain individuals being misclassified as prehypertensive or hypertensive. Misclassification in turn leads to unnecessary medical encounters, testing, and treatment. Misdiagnosis is also likely to increase the cost of an individual’s insurance coverage and out-of-pocket health care expenses.
CORRESPONDENCE
Roy N. Morcos, MD, St. Elizabeth Family Medicine Residency Program, 8423 Market Street, Suite 101, Boardman, Ohio 44512; [email protected].
1. Kearney PM, Whelton M, Reynolds K, et al. Global burden of hypertension: analysis of worldwide data. Lancet. 2005;365:217-223.
2. Lim SS, Vos T, Flaxman AD, et al. A comparative risk assessment of burden of disease and injury attributable to 67 risk factors and risk factor clusters in 21 regions, 1990-2010: a systematic analysis for the Global Burden of Disease Study 2010. Lancet. 2012;380:2224-2260.
3. Murray CJ, Lopez AD. Measuring the global burden of disease. New Engl J Med. 2013;369:448-457.
4. Chobanian AV, Bakris GL, Black HR, et al. The Seventh Report of the Joint National Committee on Prevention, Detection, Evaluation, and Treatment of High Blood Pressure: the JNC 7 report. JAMA. 2003;289:2560-2572.
5. Bailey RH, Bauer JH. A review of common errors in the indirect measurement of blood pressure. Sphygmomanometry. Arch Intern Med. 1993;153:2741-2748.
6. Padwal RS, Hemmelgarn BR, McAlister FA, et al. The 2007 Canadian Hypertension Education Program recommendations for the management of hypertension: part 1- blood pressure measurement, diagnosis and assessment of risk. Can J Cardiol. 2007;23:529-538.
7. Campbell NR, Chockalingam A, Fodor JG, et al. Accurate, reproducible measurement of blood pressure. CMAJ. 1990;143:19-24.
8. Pickering TG, Hall JE, Appel LJ, et al. Recommendations for blood pressure measurement in humans: an AHA scientific statement from the Council on High Blood Pressure Research Professional and Public Education Subcommittee. J Clin Hypertens. 2005;7:102-109.
9. Piper MA, Evans CV, Burda BU, et al. Diagnostic and predictive accuracy of blood pressure screening methods with consideration of rescreening intervals: a systematic review for the U.S. Preventive Services Task Force. Ann Intern Med. 2015;162:192-204.
10. Peters GL, Binder SK, Campbell NR. The effect of crossing legs on blood pressure: a randomized single-blind cross-over study. Blood Press Monit. 1999;4:97-101.
11. Cicolini G, Pizzi C, Palma E, et al. Differences in blood pressure by body position (supine, Fowler’s, and sitting) in hypertensive subjects. Am J Hypertens. 2011;24:1073-1079.
12. Daniel WW, Cross CL. Biostatistics: A Foundation for Analysis in the Health Sciences (10th Edition). Hoboken, NJ: John Wiley & Sons; 2013.
13. Zaiontz C. Real statistics using Excel. Available at: http://www.real-statistics.com/. Accessed February 20, 2018.
14. Burgess SE, MacLaughlin EJ, Smith PA, et al. Blood pressure rising: differences between current clinical and recommended measurement techniques. J Am Soc Hypertens. 2011;5:484-488.
15. Villegas I, Arias IC, Botero A, et al. Evaluation of the technique used by health-care workers for taking blood pressure. Hypertension. 1995;26:1204-1206.
16. McKay DW, Campbell NR, Parab LS, et al. Clinical assessment of blood pressure. J Hum Hypertens. 1990;4:639-645.
17. Jones DW, Appel LJ, Sheps SG, et al. Measuring blood pressure accurately: new and persistent challenges. JAMA. 2003;289:1027-1030.
18. Leung AA, Nerenberg K, Daskalopoulou SS, et al. Hypertension Canada’s 2016 Canadian Hypertension Education Program Guidelines for Blood Pressure Measurement, Diagnosis, Assessment of Risk, Prevention, and Treatment of Hypertension. Can J Cardiol. 2016;32:569-588.
19. Raamat R, Talts J, Jagomägi K, et al. Errors of oscillometric blood pressure measurement as predicted by simulation. Blood Press Monit. 2011;16:238-245.