User login
Influenza Season Hospitalization Trends in Israel: A Multi-Year Comparative Analysis 2005/2006 Through 2012/2013
Influenza-associated morbidity poses a significant hospital burden.1 A study from the United States estimated that seasonal influenza is responsible for 3.1 million hospitalization days per year.2
Assessment of hospital burden during influenza seasons presents a challenge due to several possible factors, such as inaccurate recording of diagnosis3 and incomplete age group data. Although great emphasis has historically been placed on older age groups, a study from England and Wales showed that the number of hospitalizations and deaths resulting from influenza was significantly higher in children as compared with adults.4 Moreover, excess visits to emergency departments in New York City because of fever and respiratory morbidity during influenza seasons were found mostly among school-age children, whereas in adults, the surplus was small to nonexistent.5
Studies examining influenza-related hospitalizations evaluated numbers and rates of hospitalization.6-11 However, information regarding length of hospitalizations, hospitalizations during the influenza season that were not influenza related, or comparisons between influenza seasons and summer seasons is scarce. These determinants are of great importance for hospital preparedness towards influenza seasons. The aim of the current study was to estimate excess hospitalizations and length of hospitalization during influenza seasons, as compared with the summer, in different age groups and selected diagnoses in Israel.
METHODS
Data Sources
Hospitalization data of internal medicine and pediatric departments in 28 acute care hospitals in Israel between 2005 and 2013 were obtained from the National Hospital Discharges Database managed by the Health Information Division (HID) in the Israel Ministry of Health (MOH). The information included number of discharges (including in-hospital deaths), number of hospitalization days, and the mean length of stay (LOS) per discharge for all diagnoses and for primary or secondary diagnoses of respiratory/cardiovascular disease (ICD9 390-519) and influenza/pneumonia (ICD9 480-487).
Bed occupancy rates for internal medicine and pediatric departments were based on the National Patient Flow Database managed by the HID.
The 2009-2010 pandemic influenza season was excluded from analysis due to different morbidity patterns and timing (April 2009 until August 2010) as compared with seasonal influenza.
Data Classification
Hospitalizations data were analyzed for all ages, for specific age groups (the first year of life [0], ages 1-4, 5-14, 15-24, 25-34, 35-44, 45-54, 55-64, 65-74, 75-84, and 85 years and older), for all diagnoses, and for primary or secondary discharge diagnosis of respiratory/cardiovascular disease (ICD9 390-519) and influenza/pneumonia (ICD9 480-487).
Duration of Influenza Season
The beginning and the end of the influenza season were determined by the National Influenza surveillance program, which includes on average 22 community sentinel clinics, throughout Israel, each influenza season. These clinics send nose-throat samples from a convenience sample of patients with influenza-like illness (ILI), from week 40 of each year until the end of the influenza season in the subsequent year. These samples are analyzed for the presence of influenza virus by real-time reverse transcription polymerase chain reaction (RT-PCR) at the Central Virology Laboratory of Israel. Based on influenza virus detection in nose-throat samples from patients with ILI attending the community sentinel clinics, we determined the first and last month of each influenza season. The first month in which positive influenza samples were identified in sequence was defined as the first month of the season. The month in which the sequence of positive influenza samples stopped was defined as the last month of the season.
The 2009-2010 pandemic influenza season was excluded from analysis due to different morbidity patterns and timing (April 2009 until August 2010) as compared with seasonal influenza.
Data Analysis
Rates. Rates of monthly hospitalizations and monthly hospitalization days were calculated per 100,000 residents for all ages and for the specific age groups. Estimated average population sizes in different years for all ages and for specific age groups were obtained from the Central Bureau of Statistics (http://www.cbs.gov.il/reader/shnaton/templ_shnaton.html?num_tab=st02_01&CYear=2014). Monthly LOS was not converted to rates.
Hospitalizations. Mean monthly rate of hospitalizations during influenza and summer seasons was calculated by dividing the sum of hospital discharge rates during influenza/summer seasons of the entire evaluation period (2005/2006 to 2012/2013) by the number of influenza/summer activity months of that period.
Hospitalization Days. The measure “hospitalization days” refers to the hospitalization days of all patients who were discharged during influenza seasons. Mean monthly rate of hospitalization days during the influenza season and summer season was calculated using the procedure described for monthly mean rate of hospitalizations.
Length of Stay. The measure “length of stay” refers to the number of days that individual patients stayed in the hospital during an admission in the evaluated seasons.
Mean monthly LOS during the influenza and summer seasons for all patients (in both internal medicine and pediatric departments) and by age group was calculated by dividing the sum of monthly LOS during influenza seasons/summer season of the entire evaluation period (2005/2006 to 2012/2013 except for the 2009/2010 season) by the number of influenza/summer activity months of that period.
LOS for each specific month of the evaluation period for a single patient was calculated by dividing the number of hospitalization days of all patients that were discharged that month (stratified by age group) by the number of discharges in the same month.
Bed Occupancy. Bed occupancy rates for internal medicine and pediatric departments of the seasons evaluated were computed as a weighted rate based on the hospitalization days and licensed inpatient beds for the period of each influenza and summer season. The calculation took into account the number of days of each month and was based on the monthly reporting of hospital inpatient days in these departments and on the number of inpatient beds according to standard license documents issued by the MOH for each hospital.
Difference Between Influenza and Summer Seasons. Differences in mean monthly rates of hospitalizations, mean monthly rate of hospitalization days, and LOS during influenza seasons and the preceding summer were calculated as absolute numbers per month and as a percentage. The difference between bed occupancy during the influenza seasons and the preceding summers was expressed in percentage. Differences were computed for all diagnoses and for ICD9 480-487 and 390-519.
Statistical Analysis
Mean and standard deviation for monthly hospitalization rates, rates of monthly hospitalization days, and for LOS were calculated for all the influenza and summer seasons that were evaluated. Differences and statistical significance for these parameters were evaluated using a two-tailed Wilcoxon-Mann-Whitney test adjusted for ties, with 95% confidence interval for mean locations. The null hypothesis of the Wilcoxon test used was that the mean ranks of the influenza and summer season observations were equal.
Mean of bed occupancy percentage was calculated for influenza and summer seasons, with the difference and statistical significance being evaluated using a χ2 test. P value of < 0.05 was considered statistically significant. SAS Version 9.1 and R program version 3.3.1 software were used for analysis.
RESULTS
Influenza Seasons
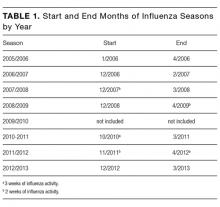
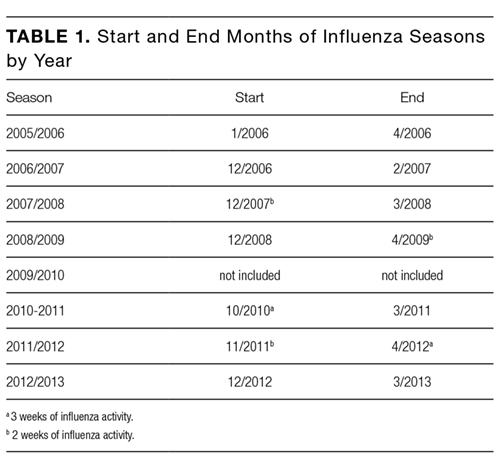
The length of influenza seasons varied, with the shortest season lasting 3 months (2006-2007) and the longest season lasting six months (2010-2011 and 2011-2012; Table 1). Of the 14 first and last months of the 7 influenza seasons, 9 had influenza activity throughout the month, 2 had 3 weeks of influenza activity, and 3 had 2 weeks of influenza activity (Table 1).
Hospitalizations
A total of 452,209 hospital discharges occurred in pediatric and internal medicine departments during the influenza seasons that were evaluated. The mean monthly rate of hospitalizations (as defined in M
The mean monthly rate of hospitalizations for all ages due to the diagnosis of respiratory/cardiovascular diseases and influenza/pneumonia was 18.6% and 60.8% higher, respectively, during influenza seasons compared with the preceding summers (panels B and C in Figure). These differences were statistically significant (panels B and C in Figure; Supplementary Table 1).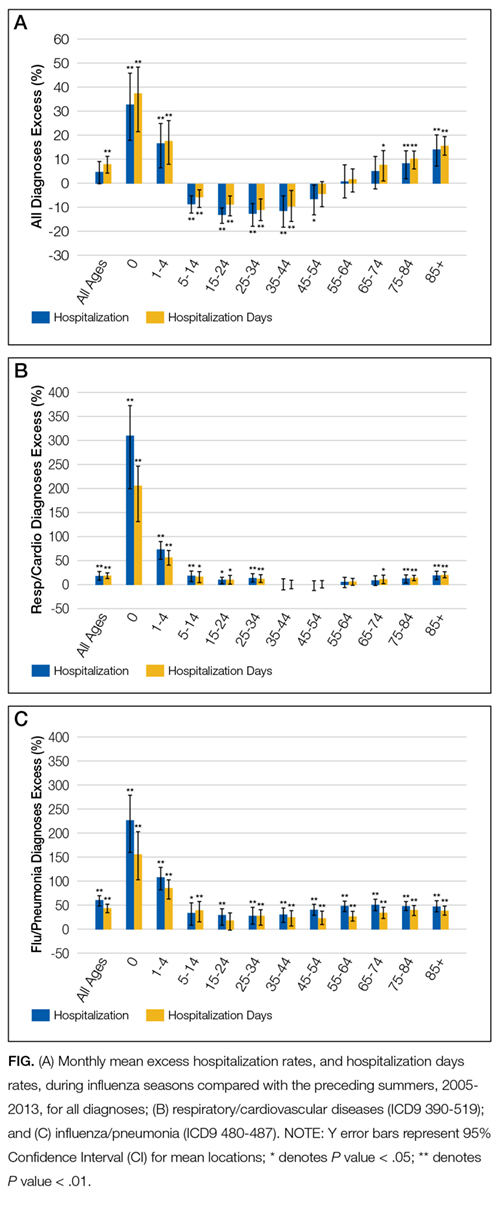
The increase in mean monthly hospitalization rates for patients with a diagnosis of respiratory/cardiovascular diseases and pneumonia/influenza was highest among infants <1 year and children aged 1-4 years (panels B and C in Figure; Supplementary Table 1). Increases were also observed among other age groups. However, they were more modest and reached statistical significance for respiratory/cardiovascular diseases in the age groups of ≤34 years and ≥75 years (panel B in Figure; Supplementary Table 1). The increases in mean monthly hospitalization rates for pneumonia/influenza were statistically significant in all age groups and were greater than 40% among adults ≥55 years (panel C in Figure; Supplementary Table 1).
Statistically significant decreases in mean monthly hospitalization rates during influenza seasons were observed for all diagnoses in the 5-54 age groups (panel A in Figure; Supplementary Table 1). Decreases were not seen for the diagnoses of respiratory/cardiovascular diseases or pneumonia/influenza (panels B and C in Figure; Supplementary Table 1).
Hospitalization Days
The mean monthly rate of hospitalization days per 100,000 residents showed a similar trend to that of the hospitalization rates (panels A, B, and C in Figure; Supplementary Table 2), with the most prominent increases observed among infants and children <5 years and adults ≥65 years.
The mean monthly rate of hospitalization days per 100,000 during influenza seasons for all ages due to all diagnoses was 8% higher (P < 0.001) as compared with the summer seasons (panel A in Figure; Supplementary Table 2). Statistically significant increases were also found among patients diagnosed with respiratory/cardiovascular diseases and for influenza/pneumonia (panels B and C in Figure; Supplementary Table 2).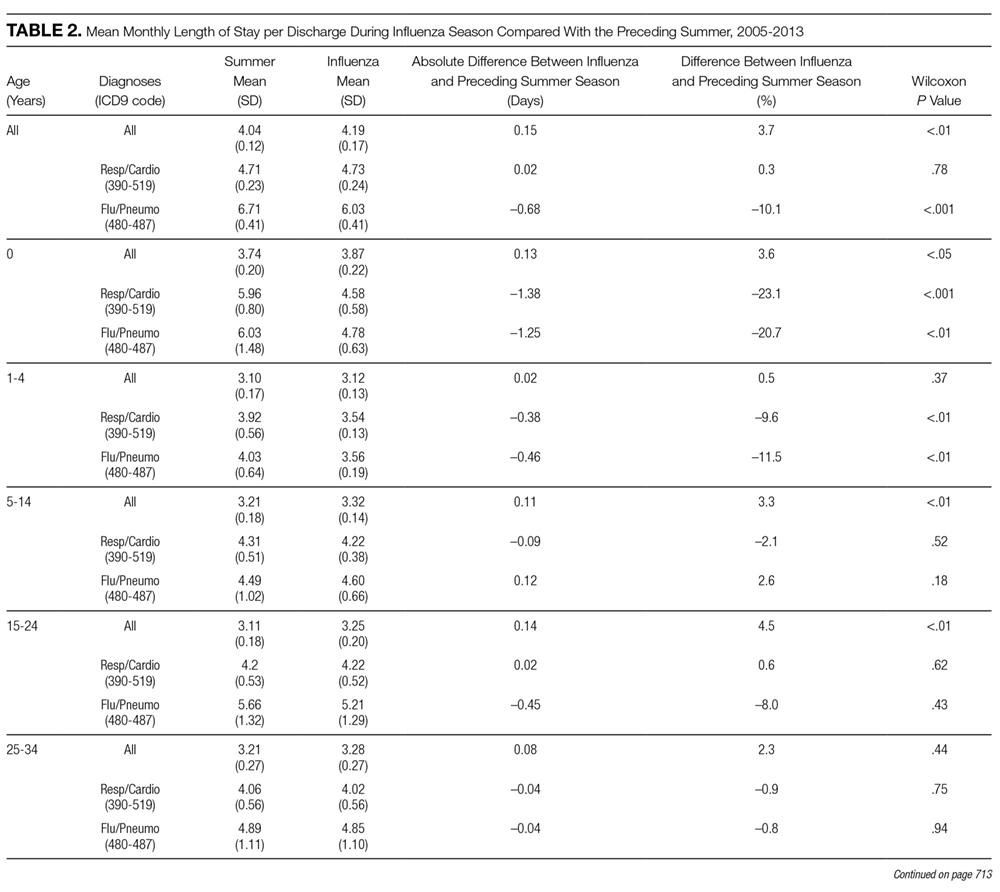
Children <5 years of age showed the largest increases during the influenza season as compared with the summer, with an up to 155.9% increase in the mean monthly rate of hospitalization days due to influenza/pneumonia (panel C in Figure; Supplementary Table 2), and an up to 206.6% increase for respiratory/cardiovascular diseases in infants <1 year of age (panel B in Figure; Supplementary Table 2). In adults, the largest increases were observed among those ≥75 years; the rates for influenza/pneumonia increased by about 40% (panel C in Figure; Supplementary Table 2), and the rates for respiratory/cardiovascular diseases increased by 14.8%-20.7% as compared with the summer months (panel B in Figure; Supplementary Table 2).
Statistically significant decreases in monthly mean rate of hospitalization days during influenza seasons were observed for all diagnoses in the 5-54 age groups (panel A in Figure; Supplementary Table 2). Decreases were not seen for the diagnoses of respiratory/cardiovascular diseases or influenza/pneumonia (panels B and C in Figure; Supplementary Table 2).
Hospital Length of Stay
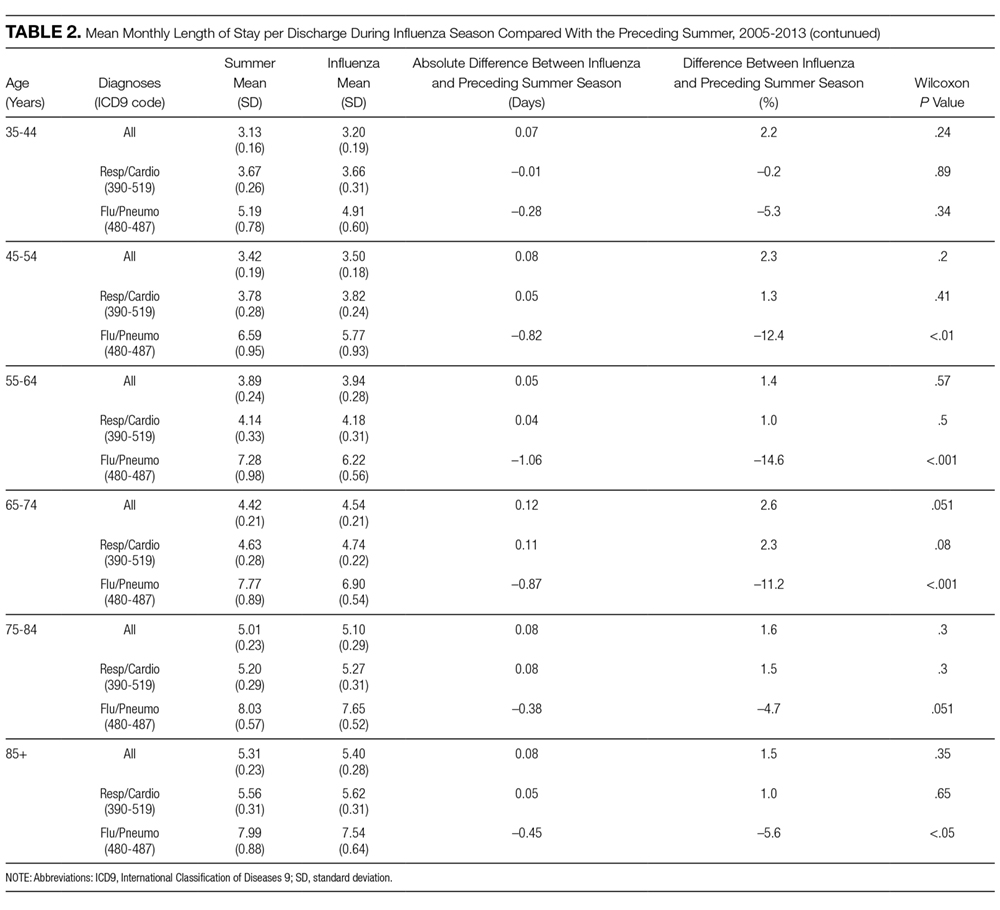
The longest mean monthly LOS due to all diagnoses (for both influenza and summer seasons) was observed in adults ≥65 years of age (Table 2). The longest mean monthly LOS due to influenza/pneumonia (for both influenza and summer seasons) was observed in adults ≥55 years or older, and for the diagnosis of respiratory/cardiovascular diseases, infants <1 year and adults ≥55 years had the longest LOS.
The differences between influenza and summer seasons in mean monthly LOS were mostly small or not observed in any of the diagnostic categories examined. The mean monthly LOS due to a diagnosis of influenza/pneumonia was shorter during the influenza seasons than summer seasons in most age groups. These differences were statistically significant in children <5 years and adults ≥45 years (Table 2).
The mean LOS due to respiratory/cardiovascular diseases was significantly shorter during influenza seasons than summer seasons in children under 5.
Bed Occupancy
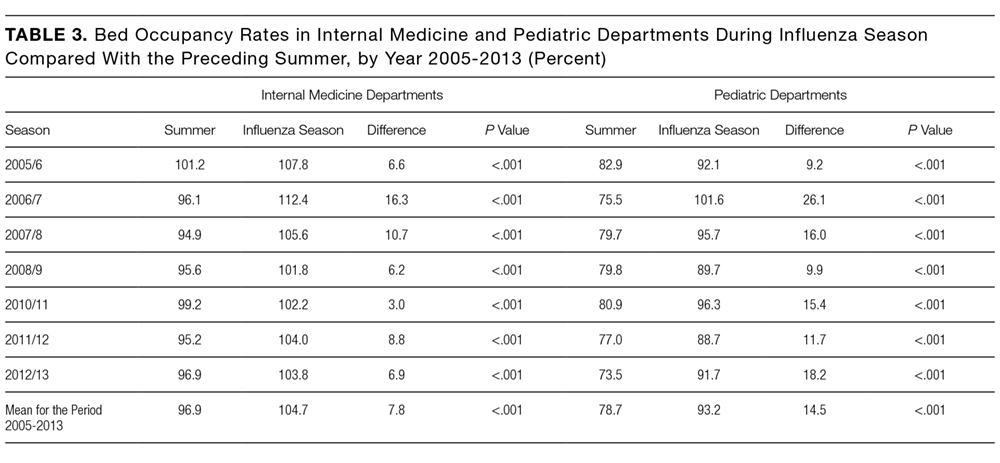
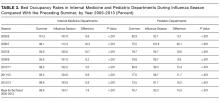
Mean bed occupancy was significantly higher during influenza seasons compared with the preceding summer seasons, both in internal medicine and pediatric departments (Table 3). The differences were higher in pediatric departments as compared with internal medicine departments for most years evaluated.
DISCUSSION
Our study demonstrates trends of excess hospitalizations during influenza as compared with summer seasons and identifies patient groups that contribute mostly to changes in hospital burden between these seasons.
Overall, the present study demonstrates differences between influenza and summer seasons for all measures tested: hospitalizations, hospitalization days, LOS, and bed occupancy. These differences were due primarily to excess number of hospitalizations and hospitalization days, rather than to longer LOS.
Our results concerning hospitalizations for all diagnoses are consistent with a United States report showing about 5% more hospitalizations following emergency department visits during winter compared with summer.12
The increase in hospitalizations and total hospitalization days in older age groups reflects the probability of severe diseases in a population with multiple comorbidities, and is consistent with a 90% influenza-related mortality due to respiratory and cardiovascular diseases reported in patients 65 and older.13 The increase in hospitalization and total hospitalization days in the age groups <5 years during influenza seasons are consistent with studies showing that the risk of children to contract influenza is higher than that of adults surrounding them. In this regard, outbreak investigations during the 2009 influenza pandemic showed that influenza attack rates in children were higher than those of adults.14
Nationwide studies from Singapore and Taiwan also showed more hospitalizations related to influenza in young children and older adults.15,16
The increase in hospitalization days for all patients should be interpreted while taking into account the mean monthly LOS per patient (Table 2). In most age groups, a small decrease in the mean LOS for individual patients with the diagnosis of influenza/pneumonia was observed (Table 2). This decrease may suggest a need to shorten hospitalization slightly in order to accommodate new patients. Similarly, the decrease in hospitalization rates from all diagnoses during influenza seasons in the 5-54 years age groups (Figure) may stem, at least in part, from the shortage of available hospital beds due to patient overload. Additional study is required to further explore these decreases and their possible effects on morbidity and mortality.
Influenza vaccine guidelines in Israel following the 2009 influenza pandemic recommend influenza vaccination for all individuals age 6 months and older. However, influenza vaccination in Israel has remained low. Specifically, vaccination rates among children below the age of 5 years have been approximately 21%, as compared with 60%-65% in adults 65 years and over.17 Given the low rate of vaccination in children, we believe that there would be minimal or no difference in hospitalization of children under the age of 5 years, between the pre- and postpandemic years. Israel has started a school-based influenza vaccination program for the 2016-2017 influenza season in an effort to increase childhood influenza vaccination. It would be important to see if the expansion and continuation of the program would have an effect on influenza season hospitalizations.
Our study has several advantages. To the best of our knowledge, it is the first study examining differences in hospital burden between influenza and summer seasons on a national level. As such, it constitutes one of the largest studies on the subject. In addition, our study relies on original data, rather than estimates. Analysis of specific months of each year in which influenza virus circulates provides a targeted analysis of influenza seasons, rather than the entire winter season. The comparison with summer months is of great importance for preparatory plans by health systems, as it takes into account the degree of variation between the seasons. The analysis of 6 influenza seasons in our study intended to take into account season-to-season disease variability. Such variability among influenza seasons has been described previously due to changes in the virus itself, the population immune status, and the weather.18
We used several diagnosis categories to evaluate different aspects of hospital burden. Although the category of “all diagnoses” provided a broad assessment of hospital burden, influenza/pneumonia or pulmonary/cardiovascular disease constituted a more specific measure of influenza-associated burden.
Evaluating LOS added to the accuracy of hospital burden estimates, and our age-group analysis highlighted the specific age groups responsible for changes in hospital burden. Thus, the use of several measures to assess influenza season morbidity provides a comprehensive picture of the hospitalization dynamics between influenza and summer seasons. In this regard, the trends observed in our study for hospitalizations and total hospitalization days correspond to those observed in bed occupancy, especially for hospitalization rates due to all causes.
Our study has several limitations. We did not rely on laboratory diagnosis of influenza to determine burden. Because obtaining specimens for viral detection is usually based on individual clinical judgement, and patients hospitalized with influenza-related complications can often test negative for the virus due to time elapsed from disease onset, relying on a laboratory-based analysis may lead to underestimation of hospital burden. On the other hand, it is possible that patients with morbidity not specifically related to influenza were included in our analysis. Respiratory syncytial virus (RSV), for example, can also cause respiratory illness during the fall and winter.19 However, in Israel, RSV epidemic usually occurs before the influenza epidemic.17,20 Thus, it is expected that only a small percentage of hospital admissions due to RSV would occur during the influenza season. Another limitation of our study relates to the small number of months in the beginning and end of influenza seasons in which influenza activity was recorded only during part of the month. Thus, hospital burden may have been underestimated during these “incomplete” months. Future studies using time series analysis methods will contribute to a more accurate estimation of such differences, as well as account for variability in influenza activity.
Our results clearly highlight the issues that challenge hospitals in Israel, and possibly other countries, during influenza seasons, such as the most affected age groups and the shortening of hospital stay. Thus, our findings are most relevant for hospital preparedness towards influenza seasons, particularly in terms of the need for additional hospital beds and personnel.
Acknowledgment
We would like to thank Anneke ifrah for English language editing
Disclosure
All authors report no conflict of interest relevant to this article. No financial support was provided relevant to this article.
1. Bromberg M, Kaufman Z, Mandelboim M, et al. [Clinical and virological surveillance of influenza in Israel--implementation during pandemic influenza]. Harefuah. 2009;148(9):577-582, 659. PubMed
2. Molinari NA, Ortega-Sanchez IR, Messonnier ML, et al. The annual impact of seasonal influenza in the US: measuring disease burden and costs. Vaccine. 2007;25(27):5086-5096. Epub 2007/06/05. doi: 10.1016/j.vaccine.2007.03.046. PubMed
3. De Pascale G, Bittner EA. Influenza-associated critical illness: estimating the burden and the burden of estimation. Crit Care Med. 2014;42(11):2441-2442. Epub 2014/10/17. doi: 10.1097/ccm.0000000000000589. PubMed
4. Pitman RJ, Melegaro A, Gelb D, Siddiqui MR, Gay NJ, Edmunds WJ. Assessing the burden of influenza and other respiratory infections in England and Wales. J Infect. 2007;54(6):530-538. Epub 2006/11/14. doi: 10.1016/j.jinf.2006.09.017. PubMed
5. Olson DR, Heffernan RT, Paladini M, Konty K, Weiss D, Mostashari F. Monitoring the impact of influenza by age: emergency department fever and respiratory complaint surveillance in New York City. PLoS Med. 2007;4(8):e247. doi: 10.1371/journal.pmed.0040247. PubMed
6. Sheu SM, Tsai CF, Yang HY, Pai HW, Chen SC. Comparison of age-specific hospitalization during pandemic and seasonal influenza periods from 2009 to 2012 in Taiwan: a nationwide population-based study. BMC Infect Dis. 2016;16:88. doi: 10.1186/s12879-016-1438-x. PubMed
7. Goldstein E, Greene SK, Olson DR, Hanage WP, Lipsitch M. Estimating the hospitalization burden associated with influenza and respiratory syncytial virus in New York City, 2003-2011. Influenza Other Respir Viruses. 2015;9(5):225-233. doi: 10.1111/irv.12325. PubMed
8. Matias G, Taylor RJ, Haguinet F, Schuck-Paim C, Lustig RL, Fleming DM. Modelling estimates of age-specific influenza-related hospitalisation and mortality in the United Kingdom. BMC Public Health. 2016;16:481. doi: 10.1186/s12889-016-3128-4. PubMed
9. Reed C, Chaves SS, Daily Kirley P, et al. Estimating influenza disease burden from population-based surveillance data in the United States. PLoS One. 2015;10(3):e0118369. doi: 10.1371/journal.pone.0118369. PubMed
10. Hirve S, Krishnan A, Dawood FS, et al. Incidence of influenza-associated hospitalization in rural communities in western and northern India, 2010-2012: a multi-site population-based study. J Infect. 2015;70(2):160-170. doi: 10.1016/j.jinf.2014.08.015. PubMed
11. Chaves SS, Perez A, Farley MM, et al. The burden of influenza hospitalizations in infants from 2003 to 2012, United States. Pediatr Infect Dis J. 2014;33(9):912-919. doi: 10.1097/inf.0000000000000321. PubMed
12. Pitts SR, Niska RW, Xu J, Burt CW. National Hospital Ambulatory Medical Care Survey: 2006 emergency department summary. Natl Health Stat Report. 2008;(7):1-38. PubMed
13. Linhart Y, Shohat T, Bromberg M, Mendelson E, Dictiar R, Green MS. Excess mortality from seasonal influenza is negligible below the age of 50 in Israel: implications for vaccine policy. Infection. 2011;39(5):399-404. doi: 10.1007/s15010-011-0153-1. PubMed
14. Glatman-Freedman A, Portelli I, Jacobs SK, et al. Attack rates assessment of the 2009 pandemic H1N1 influenza A in children and their contacts: a systematic review and meta-analysis. PLoS One. 2012;7(11):e50228. doi: 10.1371/journal.pone.0050228. PubMed
15. Ang LW, Lim C, Lee VJ, et al. Influenza-associated hospitalizations, Singapore, 2004-2008 and 2010-2012. Emerg Infect Dis. 2014;20(10). doi: 10.3201/eid2010.131768. PubMed
16. Sheu SM, Tsai CF, Yang HY, Pai HW, Chen SC. Comparison of age-specific hospitalization during pandemic and seasonal influenza periods from 2009 to 2012 in Taiwan: a nationwide population-based study. BMC Infect Dis. 2016;16(1):88. doi: 10.1186/s12879-016-1438-x. PubMed
17. Israel Center for Disease Control. Summary Report - The 2015/2016 Influenza Season. https://www.health.gov.il/PublicationsFiles/flu2015-2016e.pdf. Accessed July 18, 2017.
18. Yaari R, Katriel G, Huppert A, Axelsen JB, Stone L. Modelling seasonal influenza: the role of weather and punctuated antigenic drift. J R Soc Interface. 2013;10(84):20130298. doi: 10.1098/rsif.2013.0298. PubMed
19. Hirsh S, Hindiyeh M, Kolet L, et al. Epidemiological changes of respiratory syncytial virus (RSV) infections in Israel. PLoS One. 2014;9(3):e90515. doi: 10.1371/journal.pone.0090515. PubMed
20. Miguez A, Iftimi A, Montes F. Temporal association between the influenza virus and respiratory syncytial virus (RSV): RSV as a predictor of seasonal influenza. Epidemiol Infect. 2016;144(12):2621-32. doi: 10.1017/s095026881600090x. PubMed
Influenza-associated morbidity poses a significant hospital burden.1 A study from the United States estimated that seasonal influenza is responsible for 3.1 million hospitalization days per year.2
Assessment of hospital burden during influenza seasons presents a challenge due to several possible factors, such as inaccurate recording of diagnosis3 and incomplete age group data. Although great emphasis has historically been placed on older age groups, a study from England and Wales showed that the number of hospitalizations and deaths resulting from influenza was significantly higher in children as compared with adults.4 Moreover, excess visits to emergency departments in New York City because of fever and respiratory morbidity during influenza seasons were found mostly among school-age children, whereas in adults, the surplus was small to nonexistent.5
Studies examining influenza-related hospitalizations evaluated numbers and rates of hospitalization.6-11 However, information regarding length of hospitalizations, hospitalizations during the influenza season that were not influenza related, or comparisons between influenza seasons and summer seasons is scarce. These determinants are of great importance for hospital preparedness towards influenza seasons. The aim of the current study was to estimate excess hospitalizations and length of hospitalization during influenza seasons, as compared with the summer, in different age groups and selected diagnoses in Israel.
METHODS
Data Sources
Hospitalization data of internal medicine and pediatric departments in 28 acute care hospitals in Israel between 2005 and 2013 were obtained from the National Hospital Discharges Database managed by the Health Information Division (HID) in the Israel Ministry of Health (MOH). The information included number of discharges (including in-hospital deaths), number of hospitalization days, and the mean length of stay (LOS) per discharge for all diagnoses and for primary or secondary diagnoses of respiratory/cardiovascular disease (ICD9 390-519) and influenza/pneumonia (ICD9 480-487).
Bed occupancy rates for internal medicine and pediatric departments were based on the National Patient Flow Database managed by the HID.
The 2009-2010 pandemic influenza season was excluded from analysis due to different morbidity patterns and timing (April 2009 until August 2010) as compared with seasonal influenza.
Data Classification
Hospitalizations data were analyzed for all ages, for specific age groups (the first year of life [0], ages 1-4, 5-14, 15-24, 25-34, 35-44, 45-54, 55-64, 65-74, 75-84, and 85 years and older), for all diagnoses, and for primary or secondary discharge diagnosis of respiratory/cardiovascular disease (ICD9 390-519) and influenza/pneumonia (ICD9 480-487).
Duration of Influenza Season
The beginning and the end of the influenza season were determined by the National Influenza surveillance program, which includes on average 22 community sentinel clinics, throughout Israel, each influenza season. These clinics send nose-throat samples from a convenience sample of patients with influenza-like illness (ILI), from week 40 of each year until the end of the influenza season in the subsequent year. These samples are analyzed for the presence of influenza virus by real-time reverse transcription polymerase chain reaction (RT-PCR) at the Central Virology Laboratory of Israel. Based on influenza virus detection in nose-throat samples from patients with ILI attending the community sentinel clinics, we determined the first and last month of each influenza season. The first month in which positive influenza samples were identified in sequence was defined as the first month of the season. The month in which the sequence of positive influenza samples stopped was defined as the last month of the season.
The 2009-2010 pandemic influenza season was excluded from analysis due to different morbidity patterns and timing (April 2009 until August 2010) as compared with seasonal influenza.
Data Analysis
Rates. Rates of monthly hospitalizations and monthly hospitalization days were calculated per 100,000 residents for all ages and for the specific age groups. Estimated average population sizes in different years for all ages and for specific age groups were obtained from the Central Bureau of Statistics (http://www.cbs.gov.il/reader/shnaton/templ_shnaton.html?num_tab=st02_01&CYear=2014). Monthly LOS was not converted to rates.
Hospitalizations. Mean monthly rate of hospitalizations during influenza and summer seasons was calculated by dividing the sum of hospital discharge rates during influenza/summer seasons of the entire evaluation period (2005/2006 to 2012/2013) by the number of influenza/summer activity months of that period.
Hospitalization Days. The measure “hospitalization days” refers to the hospitalization days of all patients who were discharged during influenza seasons. Mean monthly rate of hospitalization days during the influenza season and summer season was calculated using the procedure described for monthly mean rate of hospitalizations.
Length of Stay. The measure “length of stay” refers to the number of days that individual patients stayed in the hospital during an admission in the evaluated seasons.
Mean monthly LOS during the influenza and summer seasons for all patients (in both internal medicine and pediatric departments) and by age group was calculated by dividing the sum of monthly LOS during influenza seasons/summer season of the entire evaluation period (2005/2006 to 2012/2013 except for the 2009/2010 season) by the number of influenza/summer activity months of that period.
LOS for each specific month of the evaluation period for a single patient was calculated by dividing the number of hospitalization days of all patients that were discharged that month (stratified by age group) by the number of discharges in the same month.
Bed Occupancy. Bed occupancy rates for internal medicine and pediatric departments of the seasons evaluated were computed as a weighted rate based on the hospitalization days and licensed inpatient beds for the period of each influenza and summer season. The calculation took into account the number of days of each month and was based on the monthly reporting of hospital inpatient days in these departments and on the number of inpatient beds according to standard license documents issued by the MOH for each hospital.
Difference Between Influenza and Summer Seasons. Differences in mean monthly rates of hospitalizations, mean monthly rate of hospitalization days, and LOS during influenza seasons and the preceding summer were calculated as absolute numbers per month and as a percentage. The difference between bed occupancy during the influenza seasons and the preceding summers was expressed in percentage. Differences were computed for all diagnoses and for ICD9 480-487 and 390-519.
Statistical Analysis
Mean and standard deviation for monthly hospitalization rates, rates of monthly hospitalization days, and for LOS were calculated for all the influenza and summer seasons that were evaluated. Differences and statistical significance for these parameters were evaluated using a two-tailed Wilcoxon-Mann-Whitney test adjusted for ties, with 95% confidence interval for mean locations. The null hypothesis of the Wilcoxon test used was that the mean ranks of the influenza and summer season observations were equal.
Mean of bed occupancy percentage was calculated for influenza and summer seasons, with the difference and statistical significance being evaluated using a χ2 test. P value of < 0.05 was considered statistically significant. SAS Version 9.1 and R program version 3.3.1 software were used for analysis.
RESULTS
Influenza Seasons
The length of influenza seasons varied, with the shortest season lasting 3 months (2006-2007) and the longest season lasting six months (2010-2011 and 2011-2012; Table 1). Of the 14 first and last months of the 7 influenza seasons, 9 had influenza activity throughout the month, 2 had 3 weeks of influenza activity, and 3 had 2 weeks of influenza activity (Table 1).
Hospitalizations
A total of 452,209 hospital discharges occurred in pediatric and internal medicine departments during the influenza seasons that were evaluated. The mean monthly rate of hospitalizations (as defined in M
The mean monthly rate of hospitalizations for all ages due to the diagnosis of respiratory/cardiovascular diseases and influenza/pneumonia was 18.6% and 60.8% higher, respectively, during influenza seasons compared with the preceding summers (panels B and C in Figure). These differences were statistically significant (panels B and C in Figure; Supplementary Table 1).
The increase in mean monthly hospitalization rates for patients with a diagnosis of respiratory/cardiovascular diseases and pneumonia/influenza was highest among infants <1 year and children aged 1-4 years (panels B and C in Figure; Supplementary Table 1). Increases were also observed among other age groups. However, they were more modest and reached statistical significance for respiratory/cardiovascular diseases in the age groups of ≤34 years and ≥75 years (panel B in Figure; Supplementary Table 1). The increases in mean monthly hospitalization rates for pneumonia/influenza were statistically significant in all age groups and were greater than 40% among adults ≥55 years (panel C in Figure; Supplementary Table 1).
Statistically significant decreases in mean monthly hospitalization rates during influenza seasons were observed for all diagnoses in the 5-54 age groups (panel A in Figure; Supplementary Table 1). Decreases were not seen for the diagnoses of respiratory/cardiovascular diseases or pneumonia/influenza (panels B and C in Figure; Supplementary Table 1).
Hospitalization Days
The mean monthly rate of hospitalization days per 100,000 residents showed a similar trend to that of the hospitalization rates (panels A, B, and C in Figure; Supplementary Table 2), with the most prominent increases observed among infants and children <5 years and adults ≥65 years.
The mean monthly rate of hospitalization days per 100,000 during influenza seasons for all ages due to all diagnoses was 8% higher (P < 0.001) as compared with the summer seasons (panel A in Figure; Supplementary Table 2). Statistically significant increases were also found among patients diagnosed with respiratory/cardiovascular diseases and for influenza/pneumonia (panels B and C in Figure; Supplementary Table 2).
Children <5 years of age showed the largest increases during the influenza season as compared with the summer, with an up to 155.9% increase in the mean monthly rate of hospitalization days due to influenza/pneumonia (panel C in Figure; Supplementary Table 2), and an up to 206.6% increase for respiratory/cardiovascular diseases in infants <1 year of age (panel B in Figure; Supplementary Table 2). In adults, the largest increases were observed among those ≥75 years; the rates for influenza/pneumonia increased by about 40% (panel C in Figure; Supplementary Table 2), and the rates for respiratory/cardiovascular diseases increased by 14.8%-20.7% as compared with the summer months (panel B in Figure; Supplementary Table 2).
Statistically significant decreases in monthly mean rate of hospitalization days during influenza seasons were observed for all diagnoses in the 5-54 age groups (panel A in Figure; Supplementary Table 2). Decreases were not seen for the diagnoses of respiratory/cardiovascular diseases or influenza/pneumonia (panels B and C in Figure; Supplementary Table 2).
Hospital Length of Stay
The longest mean monthly LOS due to all diagnoses (for both influenza and summer seasons) was observed in adults ≥65 years of age (Table 2). The longest mean monthly LOS due to influenza/pneumonia (for both influenza and summer seasons) was observed in adults ≥55 years or older, and for the diagnosis of respiratory/cardiovascular diseases, infants <1 year and adults ≥55 years had the longest LOS.
The differences between influenza and summer seasons in mean monthly LOS were mostly small or not observed in any of the diagnostic categories examined. The mean monthly LOS due to a diagnosis of influenza/pneumonia was shorter during the influenza seasons than summer seasons in most age groups. These differences were statistically significant in children <5 years and adults ≥45 years (Table 2).
The mean LOS due to respiratory/cardiovascular diseases was significantly shorter during influenza seasons than summer seasons in children under 5.
Bed Occupancy
Mean bed occupancy was significantly higher during influenza seasons compared with the preceding summer seasons, both in internal medicine and pediatric departments (Table 3). The differences were higher in pediatric departments as compared with internal medicine departments for most years evaluated.
DISCUSSION
Our study demonstrates trends of excess hospitalizations during influenza as compared with summer seasons and identifies patient groups that contribute mostly to changes in hospital burden between these seasons.
Overall, the present study demonstrates differences between influenza and summer seasons for all measures tested: hospitalizations, hospitalization days, LOS, and bed occupancy. These differences were due primarily to excess number of hospitalizations and hospitalization days, rather than to longer LOS.
Our results concerning hospitalizations for all diagnoses are consistent with a United States report showing about 5% more hospitalizations following emergency department visits during winter compared with summer.12
The increase in hospitalizations and total hospitalization days in older age groups reflects the probability of severe diseases in a population with multiple comorbidities, and is consistent with a 90% influenza-related mortality due to respiratory and cardiovascular diseases reported in patients 65 and older.13 The increase in hospitalization and total hospitalization days in the age groups <5 years during influenza seasons are consistent with studies showing that the risk of children to contract influenza is higher than that of adults surrounding them. In this regard, outbreak investigations during the 2009 influenza pandemic showed that influenza attack rates in children were higher than those of adults.14
Nationwide studies from Singapore and Taiwan also showed more hospitalizations related to influenza in young children and older adults.15,16
The increase in hospitalization days for all patients should be interpreted while taking into account the mean monthly LOS per patient (Table 2). In most age groups, a small decrease in the mean LOS for individual patients with the diagnosis of influenza/pneumonia was observed (Table 2). This decrease may suggest a need to shorten hospitalization slightly in order to accommodate new patients. Similarly, the decrease in hospitalization rates from all diagnoses during influenza seasons in the 5-54 years age groups (Figure) may stem, at least in part, from the shortage of available hospital beds due to patient overload. Additional study is required to further explore these decreases and their possible effects on morbidity and mortality.
Influenza vaccine guidelines in Israel following the 2009 influenza pandemic recommend influenza vaccination for all individuals age 6 months and older. However, influenza vaccination in Israel has remained low. Specifically, vaccination rates among children below the age of 5 years have been approximately 21%, as compared with 60%-65% in adults 65 years and over.17 Given the low rate of vaccination in children, we believe that there would be minimal or no difference in hospitalization of children under the age of 5 years, between the pre- and postpandemic years. Israel has started a school-based influenza vaccination program for the 2016-2017 influenza season in an effort to increase childhood influenza vaccination. It would be important to see if the expansion and continuation of the program would have an effect on influenza season hospitalizations.
Our study has several advantages. To the best of our knowledge, it is the first study examining differences in hospital burden between influenza and summer seasons on a national level. As such, it constitutes one of the largest studies on the subject. In addition, our study relies on original data, rather than estimates. Analysis of specific months of each year in which influenza virus circulates provides a targeted analysis of influenza seasons, rather than the entire winter season. The comparison with summer months is of great importance for preparatory plans by health systems, as it takes into account the degree of variation between the seasons. The analysis of 6 influenza seasons in our study intended to take into account season-to-season disease variability. Such variability among influenza seasons has been described previously due to changes in the virus itself, the population immune status, and the weather.18
We used several diagnosis categories to evaluate different aspects of hospital burden. Although the category of “all diagnoses” provided a broad assessment of hospital burden, influenza/pneumonia or pulmonary/cardiovascular disease constituted a more specific measure of influenza-associated burden.
Evaluating LOS added to the accuracy of hospital burden estimates, and our age-group analysis highlighted the specific age groups responsible for changes in hospital burden. Thus, the use of several measures to assess influenza season morbidity provides a comprehensive picture of the hospitalization dynamics between influenza and summer seasons. In this regard, the trends observed in our study for hospitalizations and total hospitalization days correspond to those observed in bed occupancy, especially for hospitalization rates due to all causes.
Our study has several limitations. We did not rely on laboratory diagnosis of influenza to determine burden. Because obtaining specimens for viral detection is usually based on individual clinical judgement, and patients hospitalized with influenza-related complications can often test negative for the virus due to time elapsed from disease onset, relying on a laboratory-based analysis may lead to underestimation of hospital burden. On the other hand, it is possible that patients with morbidity not specifically related to influenza were included in our analysis. Respiratory syncytial virus (RSV), for example, can also cause respiratory illness during the fall and winter.19 However, in Israel, RSV epidemic usually occurs before the influenza epidemic.17,20 Thus, it is expected that only a small percentage of hospital admissions due to RSV would occur during the influenza season. Another limitation of our study relates to the small number of months in the beginning and end of influenza seasons in which influenza activity was recorded only during part of the month. Thus, hospital burden may have been underestimated during these “incomplete” months. Future studies using time series analysis methods will contribute to a more accurate estimation of such differences, as well as account for variability in influenza activity.
Our results clearly highlight the issues that challenge hospitals in Israel, and possibly other countries, during influenza seasons, such as the most affected age groups and the shortening of hospital stay. Thus, our findings are most relevant for hospital preparedness towards influenza seasons, particularly in terms of the need for additional hospital beds and personnel.
Acknowledgment
We would like to thank Anneke ifrah for English language editing
Disclosure
All authors report no conflict of interest relevant to this article. No financial support was provided relevant to this article.
1. Bromberg M, Kaufman Z, Mandelboim M, et al. [Clinical and virological surveillance of influenza in Israel--implementation during pandemic influenza]. Harefuah. 2009;148(9):577-582, 659. PubMed
2. Molinari NA, Ortega-Sanchez IR, Messonnier ML, et al. The annual impact of seasonal influenza in the US: measuring disease burden and costs. Vaccine. 2007;25(27):5086-5096. Epub 2007/06/05. doi: 10.1016/j.vaccine.2007.03.046. PubMed
3. De Pascale G, Bittner EA. Influenza-associated critical illness: estimating the burden and the burden of estimation. Crit Care Med. 2014;42(11):2441-2442. Epub 2014/10/17. doi: 10.1097/ccm.0000000000000589. PubMed
4. Pitman RJ, Melegaro A, Gelb D, Siddiqui MR, Gay NJ, Edmunds WJ. Assessing the burden of influenza and other respiratory infections in England and Wales. J Infect. 2007;54(6):530-538. Epub 2006/11/14. doi: 10.1016/j.jinf.2006.09.017. PubMed
5. Olson DR, Heffernan RT, Paladini M, Konty K, Weiss D, Mostashari F. Monitoring the impact of influenza by age: emergency department fever and respiratory complaint surveillance in New York City. PLoS Med. 2007;4(8):e247. doi: 10.1371/journal.pmed.0040247. PubMed
6. Sheu SM, Tsai CF, Yang HY, Pai HW, Chen SC. Comparison of age-specific hospitalization during pandemic and seasonal influenza periods from 2009 to 2012 in Taiwan: a nationwide population-based study. BMC Infect Dis. 2016;16:88. doi: 10.1186/s12879-016-1438-x. PubMed
7. Goldstein E, Greene SK, Olson DR, Hanage WP, Lipsitch M. Estimating the hospitalization burden associated with influenza and respiratory syncytial virus in New York City, 2003-2011. Influenza Other Respir Viruses. 2015;9(5):225-233. doi: 10.1111/irv.12325. PubMed
8. Matias G, Taylor RJ, Haguinet F, Schuck-Paim C, Lustig RL, Fleming DM. Modelling estimates of age-specific influenza-related hospitalisation and mortality in the United Kingdom. BMC Public Health. 2016;16:481. doi: 10.1186/s12889-016-3128-4. PubMed
9. Reed C, Chaves SS, Daily Kirley P, et al. Estimating influenza disease burden from population-based surveillance data in the United States. PLoS One. 2015;10(3):e0118369. doi: 10.1371/journal.pone.0118369. PubMed
10. Hirve S, Krishnan A, Dawood FS, et al. Incidence of influenza-associated hospitalization in rural communities in western and northern India, 2010-2012: a multi-site population-based study. J Infect. 2015;70(2):160-170. doi: 10.1016/j.jinf.2014.08.015. PubMed
11. Chaves SS, Perez A, Farley MM, et al. The burden of influenza hospitalizations in infants from 2003 to 2012, United States. Pediatr Infect Dis J. 2014;33(9):912-919. doi: 10.1097/inf.0000000000000321. PubMed
12. Pitts SR, Niska RW, Xu J, Burt CW. National Hospital Ambulatory Medical Care Survey: 2006 emergency department summary. Natl Health Stat Report. 2008;(7):1-38. PubMed
13. Linhart Y, Shohat T, Bromberg M, Mendelson E, Dictiar R, Green MS. Excess mortality from seasonal influenza is negligible below the age of 50 in Israel: implications for vaccine policy. Infection. 2011;39(5):399-404. doi: 10.1007/s15010-011-0153-1. PubMed
14. Glatman-Freedman A, Portelli I, Jacobs SK, et al. Attack rates assessment of the 2009 pandemic H1N1 influenza A in children and their contacts: a systematic review and meta-analysis. PLoS One. 2012;7(11):e50228. doi: 10.1371/journal.pone.0050228. PubMed
15. Ang LW, Lim C, Lee VJ, et al. Influenza-associated hospitalizations, Singapore, 2004-2008 and 2010-2012. Emerg Infect Dis. 2014;20(10). doi: 10.3201/eid2010.131768. PubMed
16. Sheu SM, Tsai CF, Yang HY, Pai HW, Chen SC. Comparison of age-specific hospitalization during pandemic and seasonal influenza periods from 2009 to 2012 in Taiwan: a nationwide population-based study. BMC Infect Dis. 2016;16(1):88. doi: 10.1186/s12879-016-1438-x. PubMed
17. Israel Center for Disease Control. Summary Report - The 2015/2016 Influenza Season. https://www.health.gov.il/PublicationsFiles/flu2015-2016e.pdf. Accessed July 18, 2017.
18. Yaari R, Katriel G, Huppert A, Axelsen JB, Stone L. Modelling seasonal influenza: the role of weather and punctuated antigenic drift. J R Soc Interface. 2013;10(84):20130298. doi: 10.1098/rsif.2013.0298. PubMed
19. Hirsh S, Hindiyeh M, Kolet L, et al. Epidemiological changes of respiratory syncytial virus (RSV) infections in Israel. PLoS One. 2014;9(3):e90515. doi: 10.1371/journal.pone.0090515. PubMed
20. Miguez A, Iftimi A, Montes F. Temporal association between the influenza virus and respiratory syncytial virus (RSV): RSV as a predictor of seasonal influenza. Epidemiol Infect. 2016;144(12):2621-32. doi: 10.1017/s095026881600090x. PubMed
© 2017 Society of Hospital Medicine