User login
Community Care Radiation Oncology Cost Calculations for a VA Medical Center
Community Care Radiation Oncology Cost Calculations for a VA Medical Center
William Kissick’s description of health care’s iron triangle in 1994 still resonates. Access, quality, and cost will always come at the expense of the others.1 In 2018, Congress passed the VA MISSION Act, allowing patients to pursue community care options for extended waits (> 28 days) or longer distance drive times of > 60 minutes for specialty care services, such as radiation oncology. According to Albanese et al, the VA MISSION Act sought to address gaps in care for veterans living in rural and underserved areas.2 The Veterans Health Administration (VHA) continues to increase community care spending, with a 13.8% increase in fiscal year 2024 and an expected cost of > $40 billion for 2025.3 One could argue this pays for access for remote patients and quality when services are unavailable, making it a direct application of the iron triangle.
The VA MISSION Act also bolstered the expansion of existing community care department staff to expediently facilitate and coordinate care and payments.2 Cost management and monitoring have become critical in predicting future staff requirements, maintaining functionality, and ensuring patients receive optimal care. The VHA purchases care through partner networks and defines these bundled health care services as standard episodes of care (SEOCs), which are “clinically related health care services for a specific unique illness or medical condition… over a defined period of time.”4 Medicare publishes its rates quarterly, and outpatient procedure pricing is readily available online.5 Along these same lines, the US Department of Veterans Affairs (VA) publishes a current list of available procedures and associated Current Procedure Technology (CPT) codes that are covered under its VA fee schedule for community care.
Unique challenges persist when using this system to accurately account for radiation oncology expenditures. This study was based on the current practices at the Richard L. Roudebush VA Medical Center (RLRVAMC), a large 1a hospital. A detailed analysis reveals the contemporaneous cost of radiation oncology cancer care from October 1, 2021, through February 1, 2024, highlights the challenges in SEOC definition and duration, communication issues between RLRVAMC and purchase partners, inconsistencies in billing, erroneous payments, and difficulty of cost categorization.
METHODS
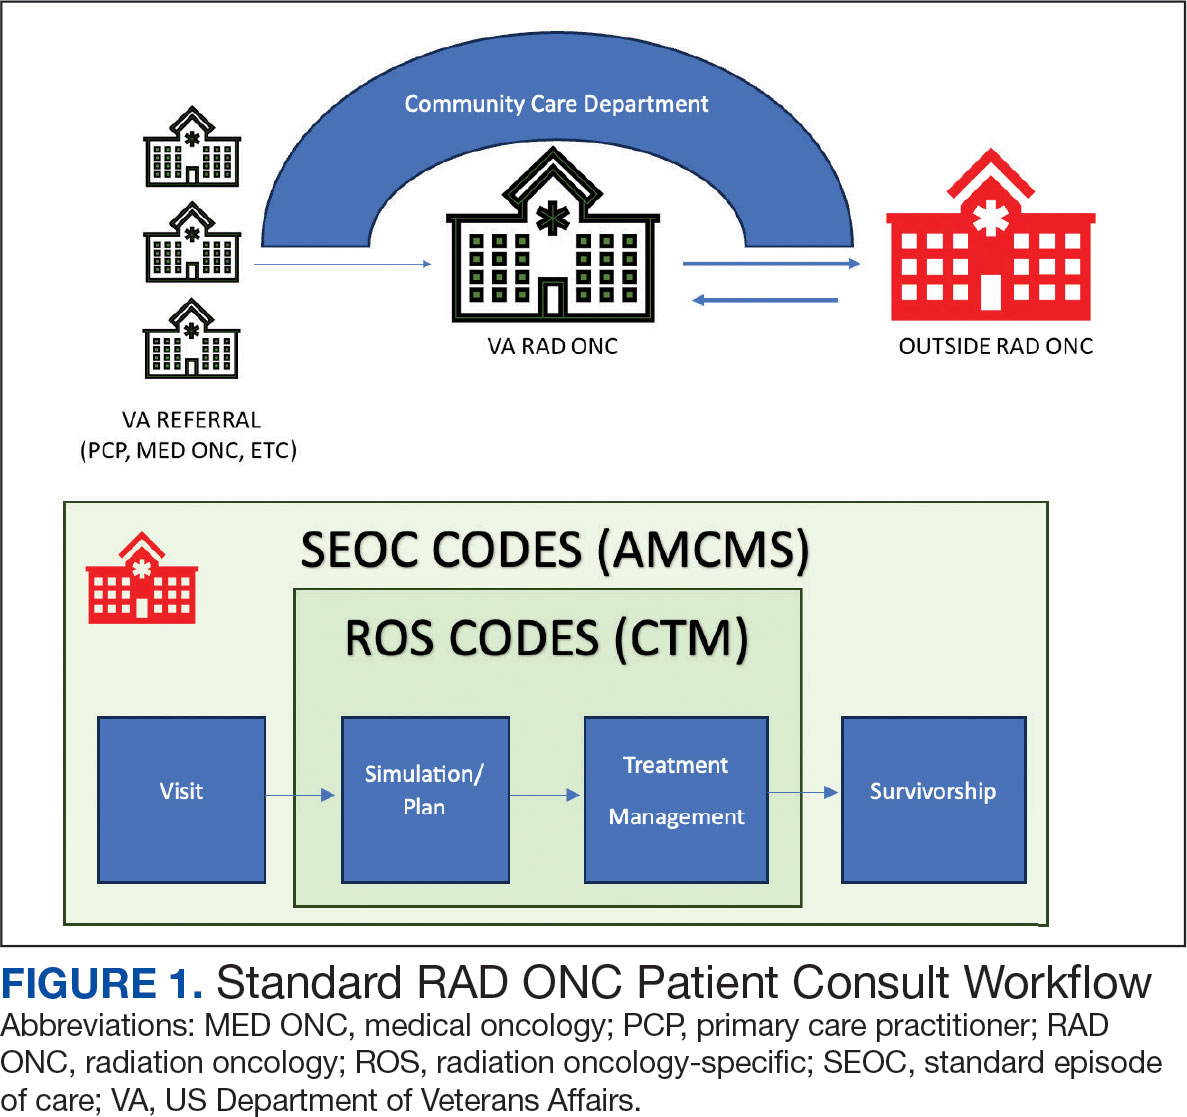
Community care radiation oncology-related costs were examined from October 1, 2021, to February 1, 2024 for RLRVAMC, 6 months prior to billing data extraction. Figure 1 shows a simple radiation oncology patient pathway with consultation or visit, simulation and planning, and treatment, with codes used to check billing. It illustrates the expected relationships between the VHA (radiation oncology, primary, and specialty care) and community care (clinicians and radiation oncology treatment sites).
VHA standard operating procedures for a patient requesting community-based radiation oncology care require a board-certified radiation oncologist at RLRVAMC to review and approve the outside care request. Community care radiation oncology consultation data were accessed from the VA Corporate Data Warehouse (CDW) using Pyramid Analytics (V25.2). Nurses, physicians, and community care staff can add comments, forward consultations to other services, and mark them as complete or discontinued, when appropriate. Consultations not completed within 91 days are automatically discontinued. All community care requests from 2018 through 2024 were extracted; analysis began April 1, 2021, 6 months prior to the cost evaluation date of October 1, 2021.
An approved consultation is reviewed for eligibility by a nurse in the community care department and assigned an authorization number (a VA prefix followed by 12 digits). Billing codes are approved and organized by the community care networks, and all procedure codes should be captured and labeled under this number. The VAMC Community Care department obtains initial correspondence from the treating clinicians. Subsequent records from the treating radiation oncologist are expected to be scanned into the electronic health record and made accessible via the VA Joint Legacy Viewer (JLV) and Computerized Patient Record System (CPRS).
Radiation Oncology SEOC
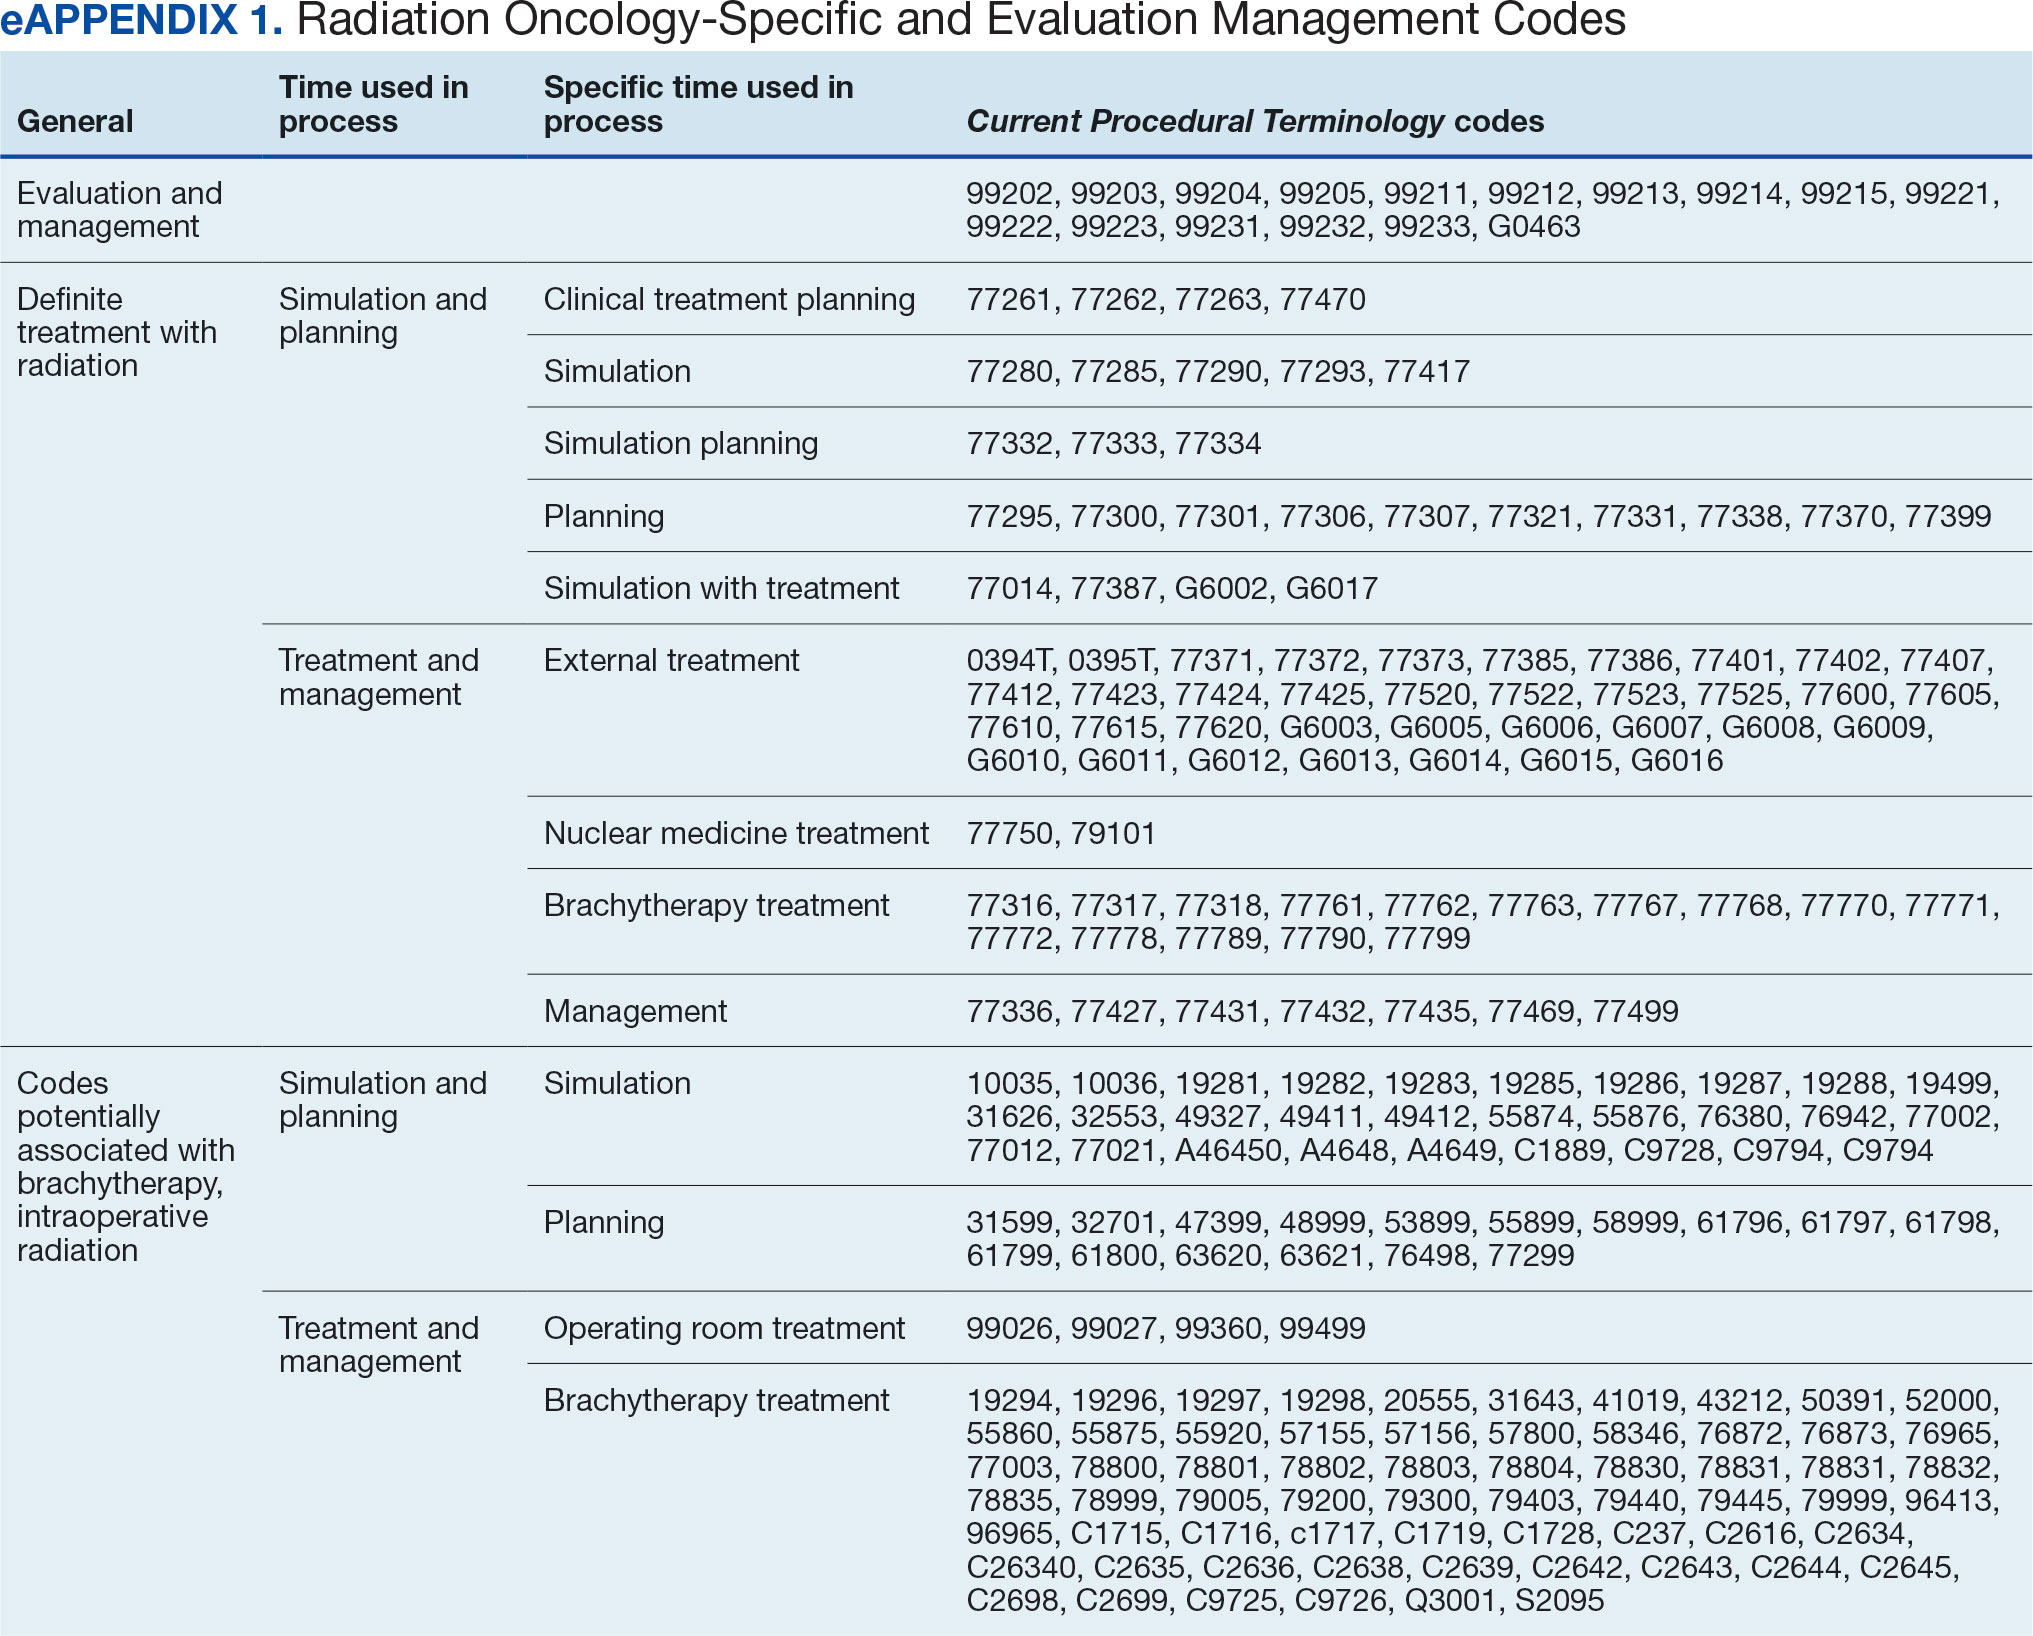
The start date of the radiation oncology SEOC is determined by the community care nurse based on guidance established by the VA. It can be manually backdated or delayed, but current practice is to start at first visit or procedure code entry after approval from the VAMC Radiation Oncology department. Approved CPT codes from SEOC versions between October 1, 2021, and February 1, 2024, are in eAppendix 1 (available at doi:10.12788/fp.0585). These generally include 10 types of encounters, about 115 different laboratory tests, 115 imaging studies, 25 simulation and planning procedures, and 115 radiation treatment codes. The radiation oncology SEOCs during the study period had an approval duration of 180 days. Advanced Medical Cost Management Solutions software (AMCMS) is the VHA data analytics platform for community care medical service costs. AMCMS includes all individual CPT codes billed by specific radiation oncology SEOC versions. Data are refreshed monthly, and all charges were extracted on September 12, 2024, > 6 months after the final evaluated service date to allow for complete billing returns.6
Radiation Oncology-Specific Costs
The VA Close to Me (CTM) program was used to find 84 specific radiation oncology CPT codes, nearly all within the 77.XXX or G6.XXX series, which included all radiation oncology-specific (ROS) codes (except visits accrued during consultation and return appointments). ROS costs are those that could not be performed by any other service and include procedures related to radiation oncology simulation, treatment planning, treatment delivery (with or without image guidance), and physician or physicist management. All ROS costs should be included in a patient’s radiation oncology SEOC. Other costs that may accompany operating room or brachytherapy administration did not follow a 77.XXX or G6.XXX pattern but were included in total radiation therapy operating costs.
Data obtained from AMCMS and CTM included patient name and identifier; CPT billed amount; CPT paid amount; dates of service; number of claims; International Classification of Diseases, Tenth Revision (ICD) diagnosis; and VA authorization numbers. Only CTM listed code modifiers. Only items categorized as paid were included in the analysis. Charges associated with discontinued consultations that had accrued costs also were included. Codes that were not directly related to ROS were separately characterized as other and further subcategorized.
Deep Dive Categorization
All scanned documents tagged to the community consultation were accessed and evaluated for completeness by a radiation oncologist (RS). The presence or absence of consultation notes and treatment summaries was evaluated based on necessity (ie, not needed for continuation of care or treatment was not given). In the absence of a specific completion summary or follow-up note detailing the treatment modality, number of fractions, and treatment sites, available documentation, including clinical notes and billing information, was used. Radical or curative therapies were identified as courses expected to eradicate disease, including stereotactic ablative radiotherapy to the brain, lung, liver, and other organs. Palliative therapies included whole-brain radiotherapy or other low-dose treatments. If the patient received the intended course, this was categorized as full. If incomplete, it was considered partial.
Billing Deviations
The complete document review allowed for close evaluation of paid therapy and identification of gaps in billing (eg, charges not found in extracted data that should have occurred) for external beam radiotherapy patients. Conversely, extra charges, such as an additional weekly treatment management charge (CPT code 77427), would be noted. Patients were expected to have the number of treatments specified in the summary, a clinical treatment planning code, and weekly treatment management notes from physicians and physicists every 5 fractions. Consultations and follow-up visits were expected to have 1 visit code; CPT codes 99205 and 99215, respectively, were used to estimate costs in their absence.
Costs were based on Medicare rates as of January 1 of the year in which they were accrued. 7-10 Duplicates were charges with the same code, date, billed quantity, and paid amounts for a given patient. These would always be considered erroneous. Medicare treatment costs for procedures such as intensity modulated radiotherapy (CPT code 77385 or 77386) are available on the Medicare website. When reviewing locality deviations for 77427, there was a maximum of 33% increase in Medicare rates. Therefore, for treatment codes, one would expect the range to be at least the Medicare rate and maximally 33% higher. These rates are negotiated with insurance companies, but this range was used for the purpose of reviewing and adjusting large data sets.
RESULTS
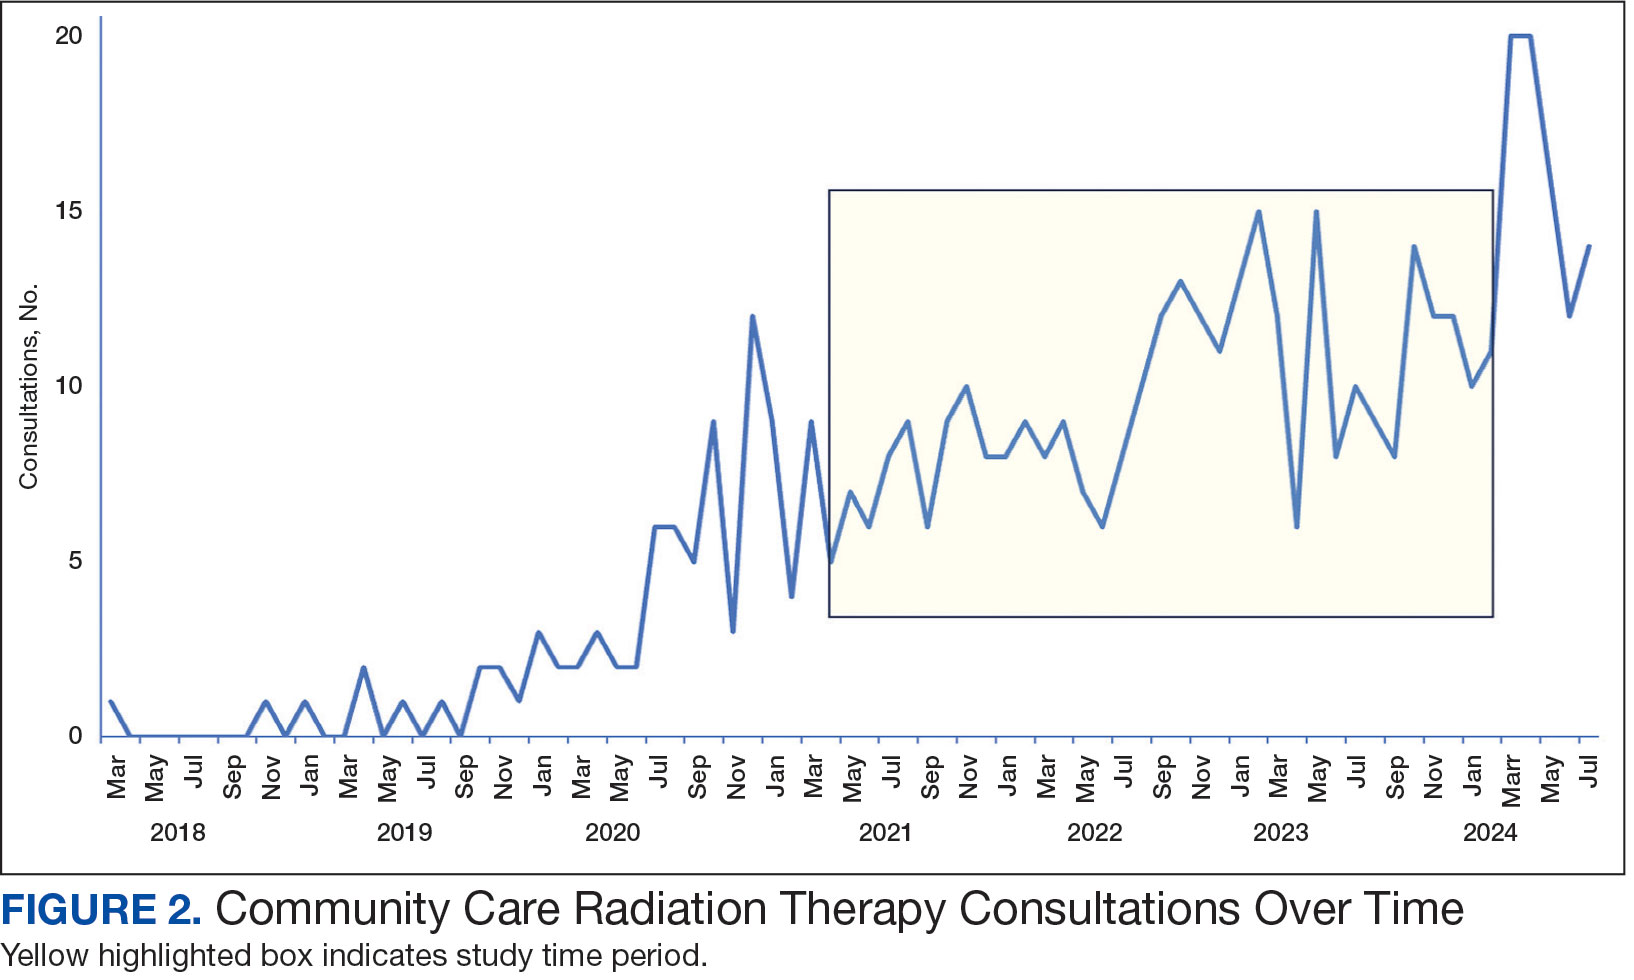
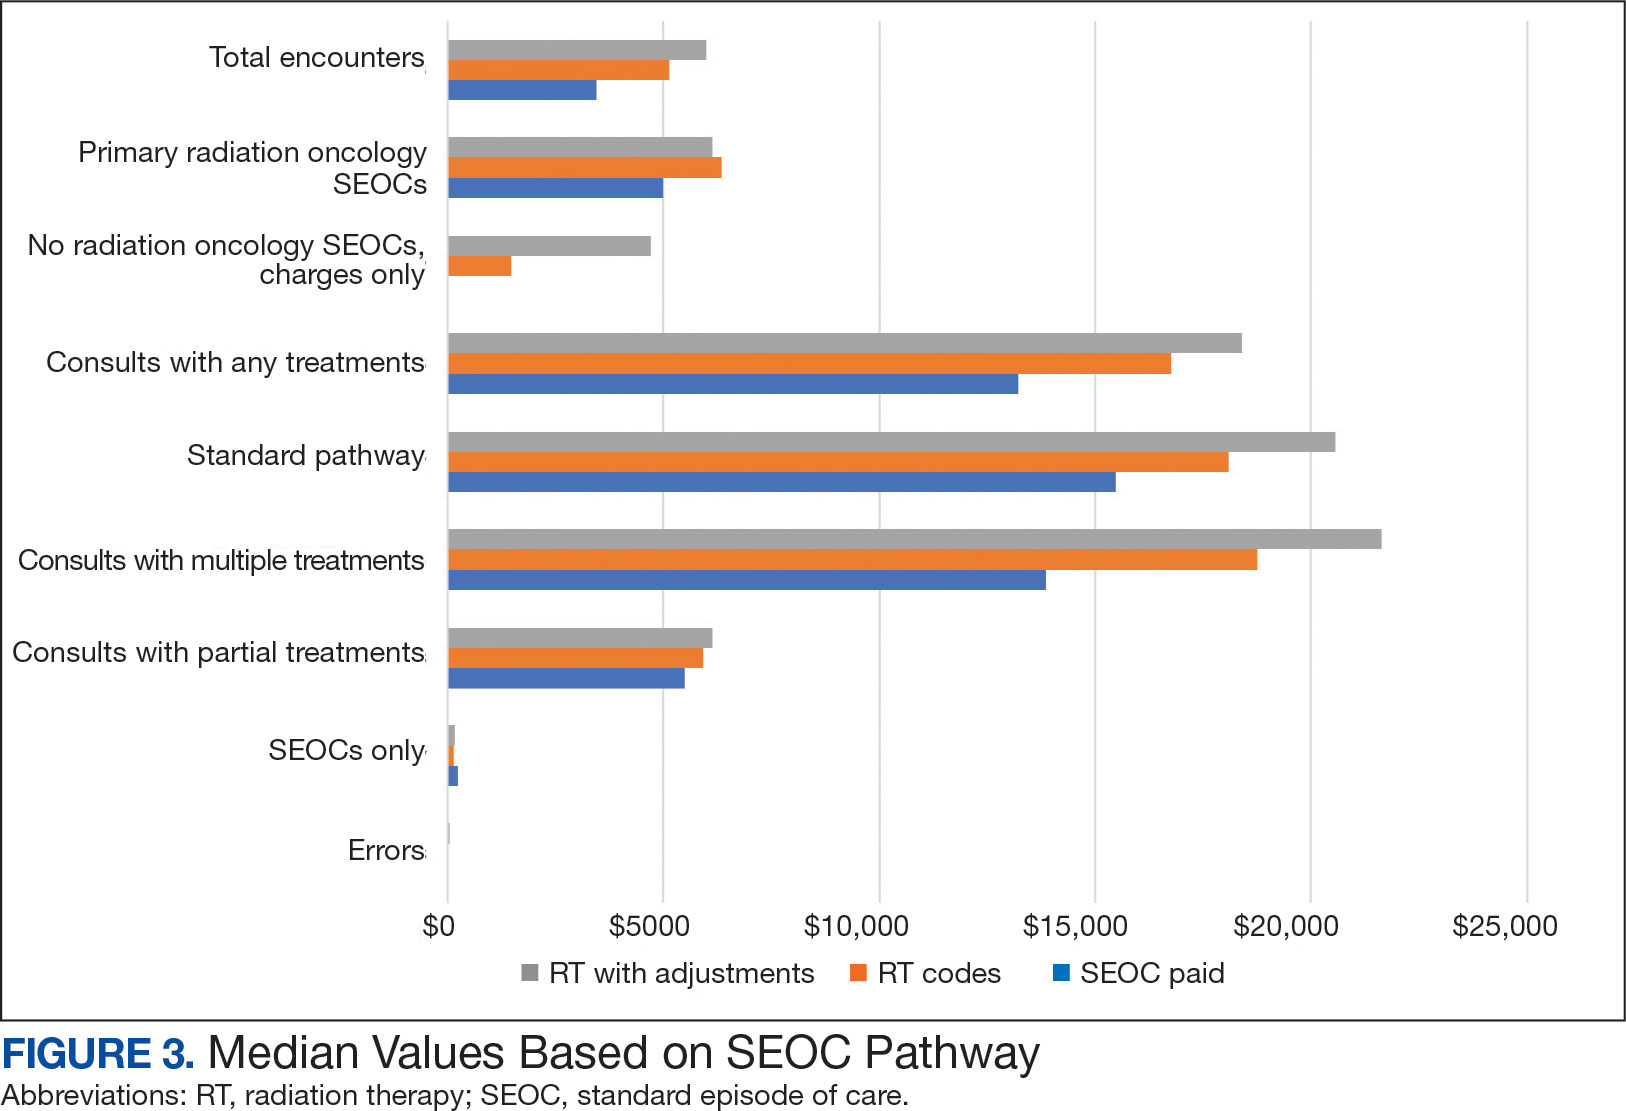
Since 2018, > 500 community care consults have been placed by radiation oncology for treatment in the community, with more following implementation of the VA MISSION Act. Use of radiation oncology community care services annually increased during the study period for this facility (Table 1, Figure 2). Of the 325 community care consults placed from October 1, 2021, to February 1, 2024, 248 radiation oncology SEOCs were recorded with charges for 181 patients (range, 1-5 SEOCs). Long drive time was the rationale for > 97% of patients directed to community care (Supplemental materials, available at doi:10.12788/fp.0585). Based on AMCMS data, $22.2 million was billed and $2.7 million was paid (20%) for 8747 CPT codes. Each community care interval cost the VA a median (range) of $5000 ($8-$168,000 (Figure 3).
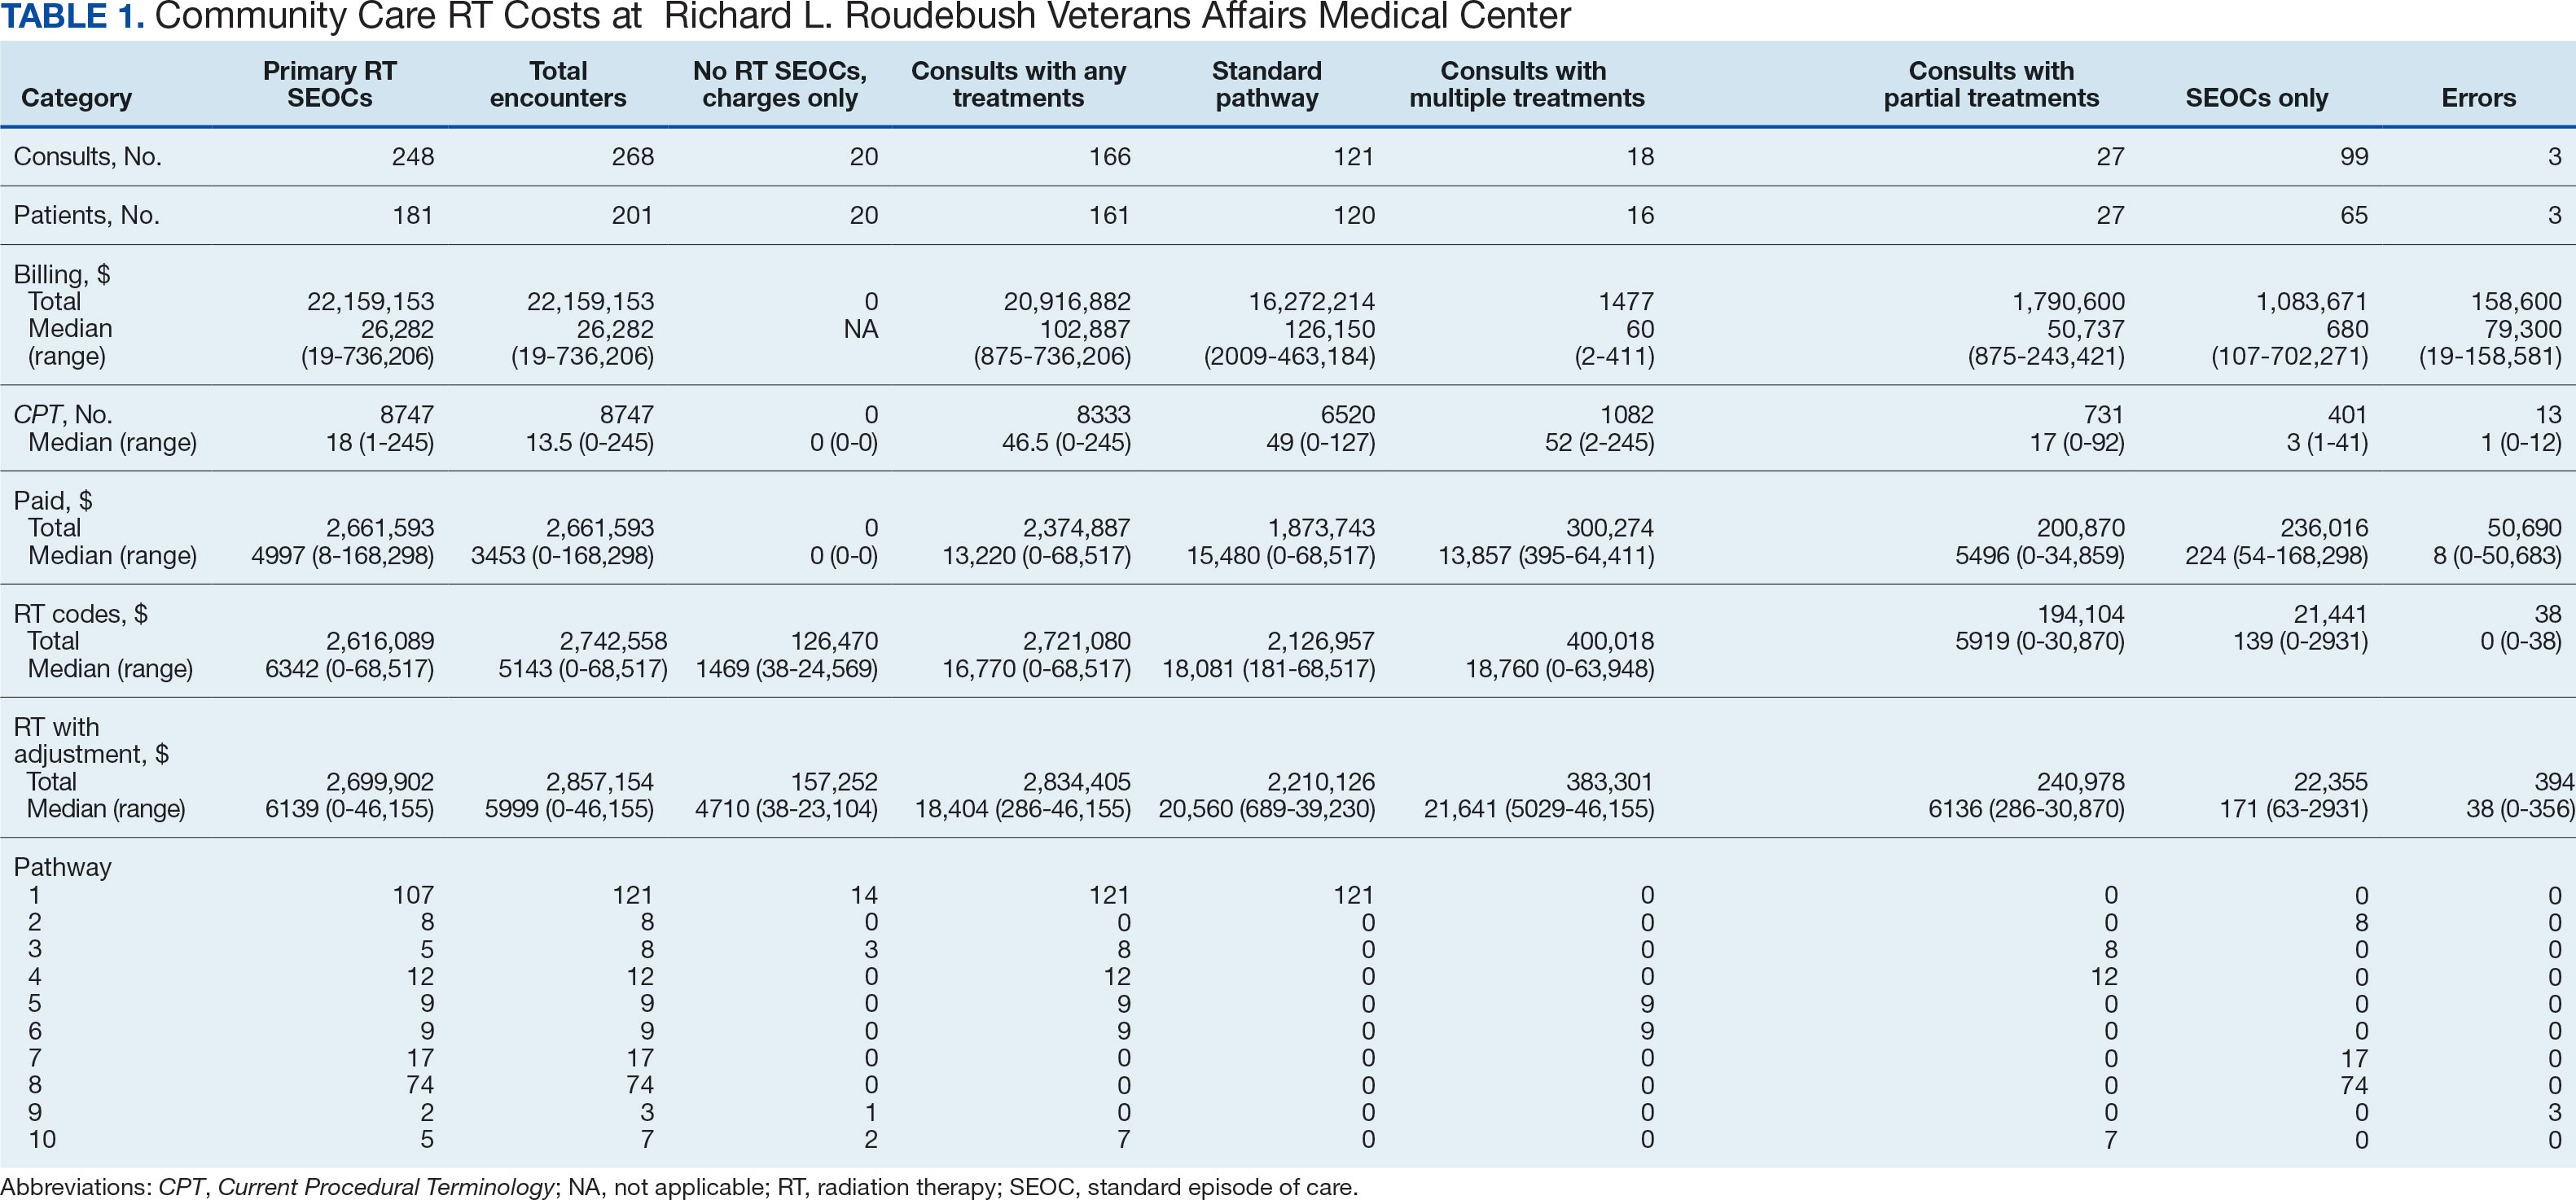
After reviewing ROS charges extracted from CTM, 20 additional patients had radiation oncology charges but did not have a radiation oncology SEOC for 268 episodes of care for 201 unique patients. In addition to the 20 patients who did not have a SEOC, 42 nonradiation oncology SEOCs contained 1148 radiation oncology codes, corresponding to almost $500,000 paid. Additional charges of about $416,000, which included biologic agents (eg, durvalumab, nivolumab), procedures (eg, mastectomies), and ambulance rides were inappropriately added to radiation oncology SEOCs.
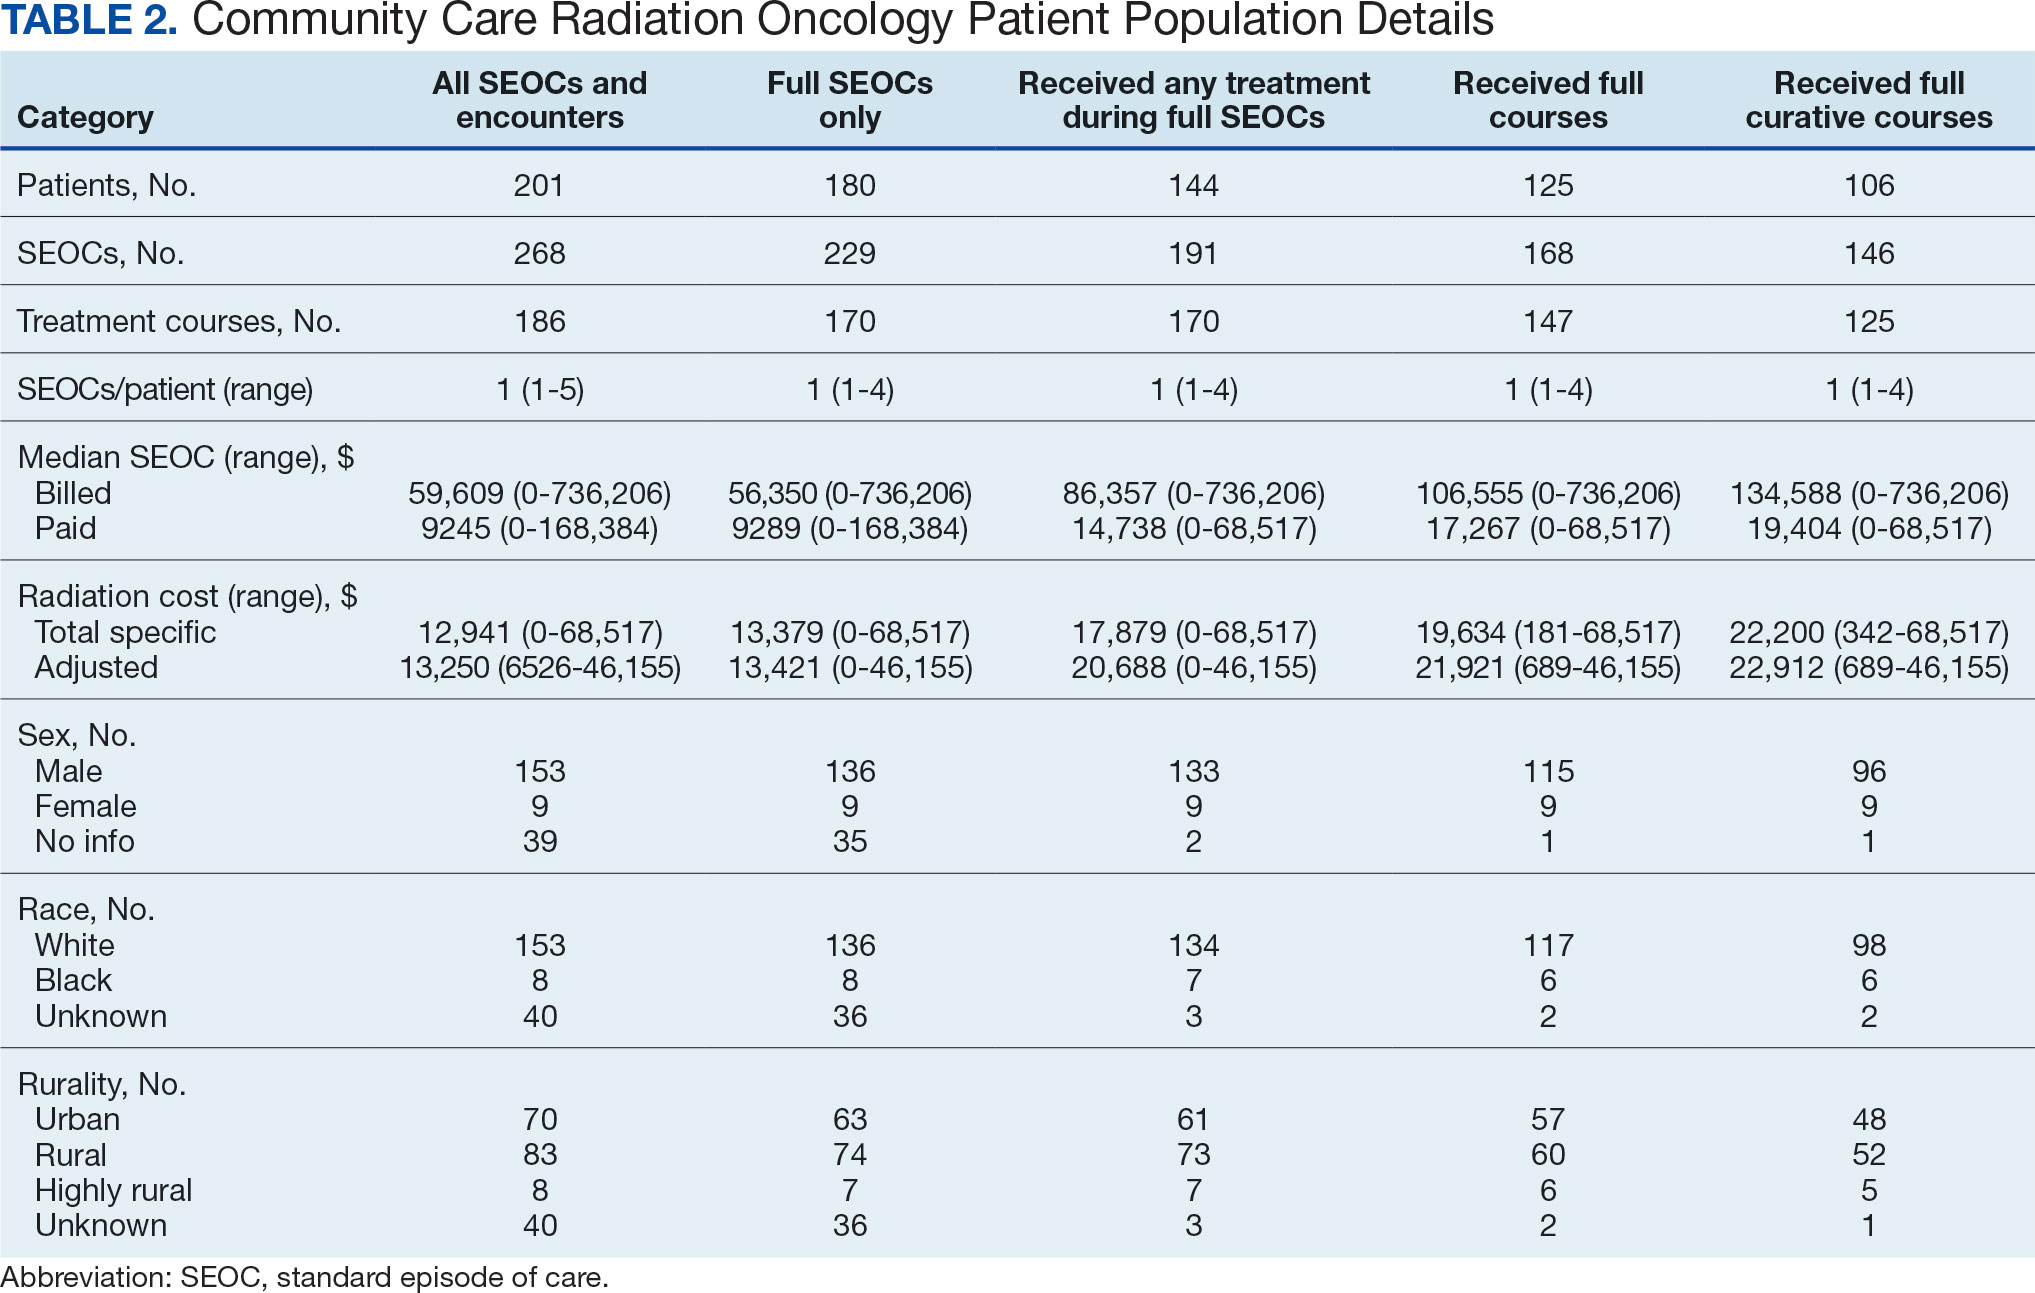
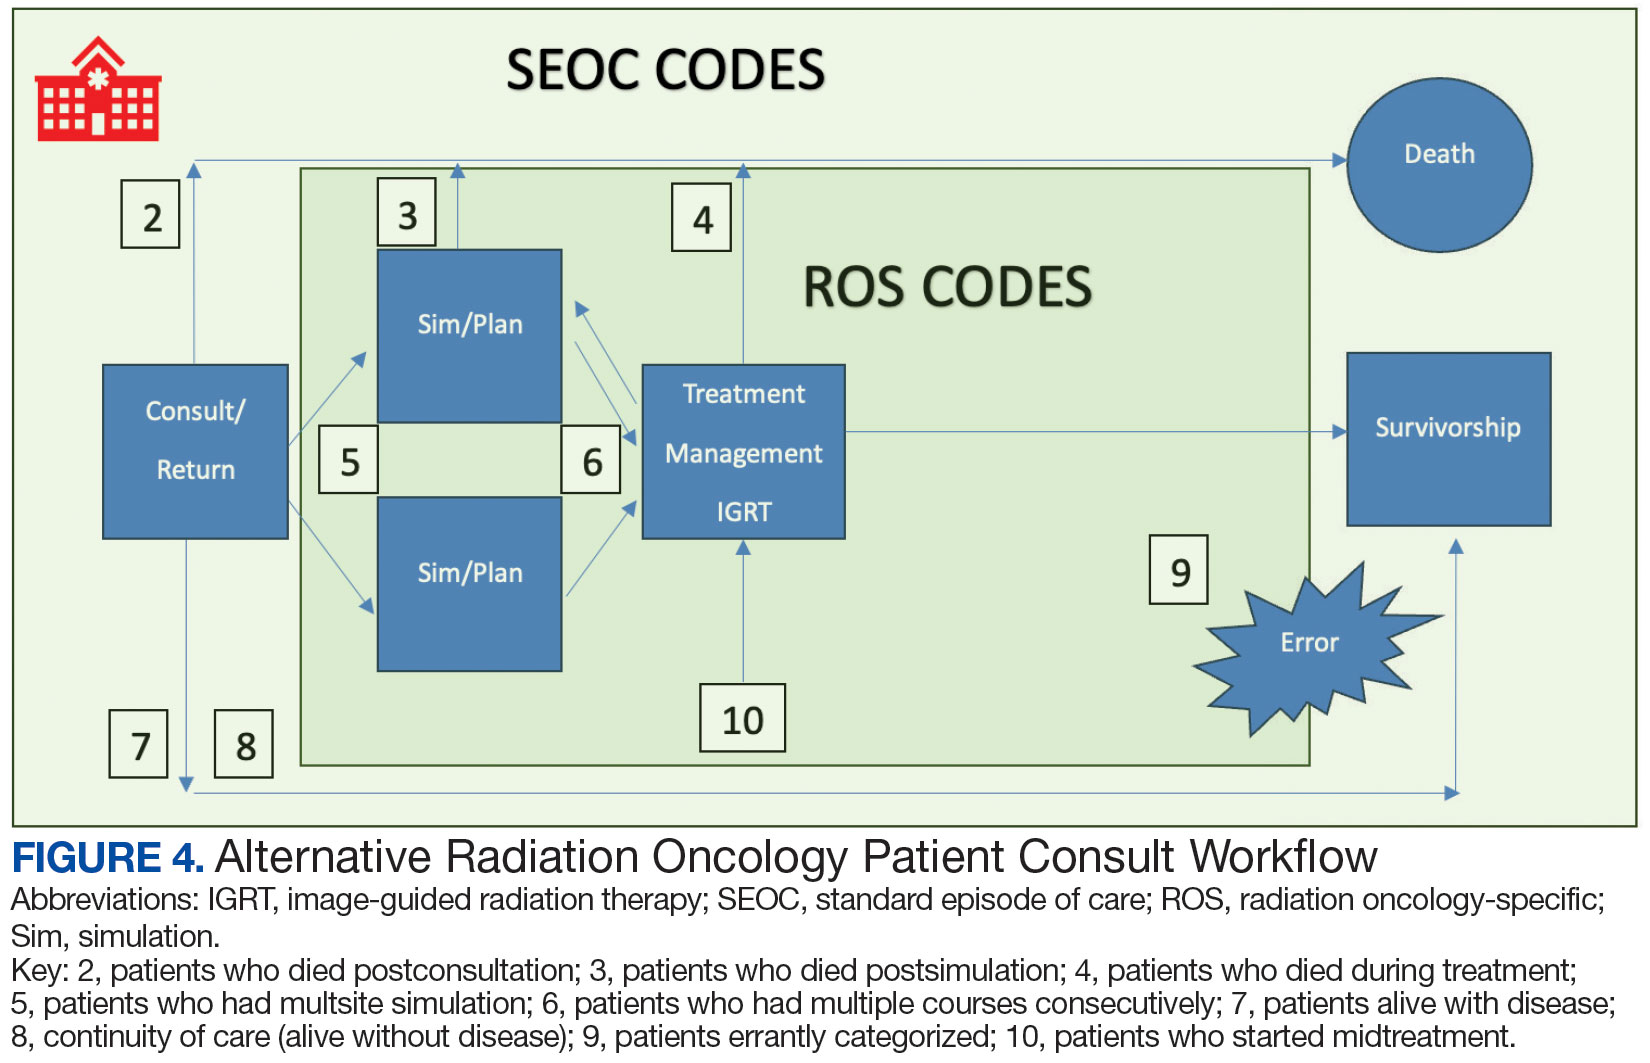
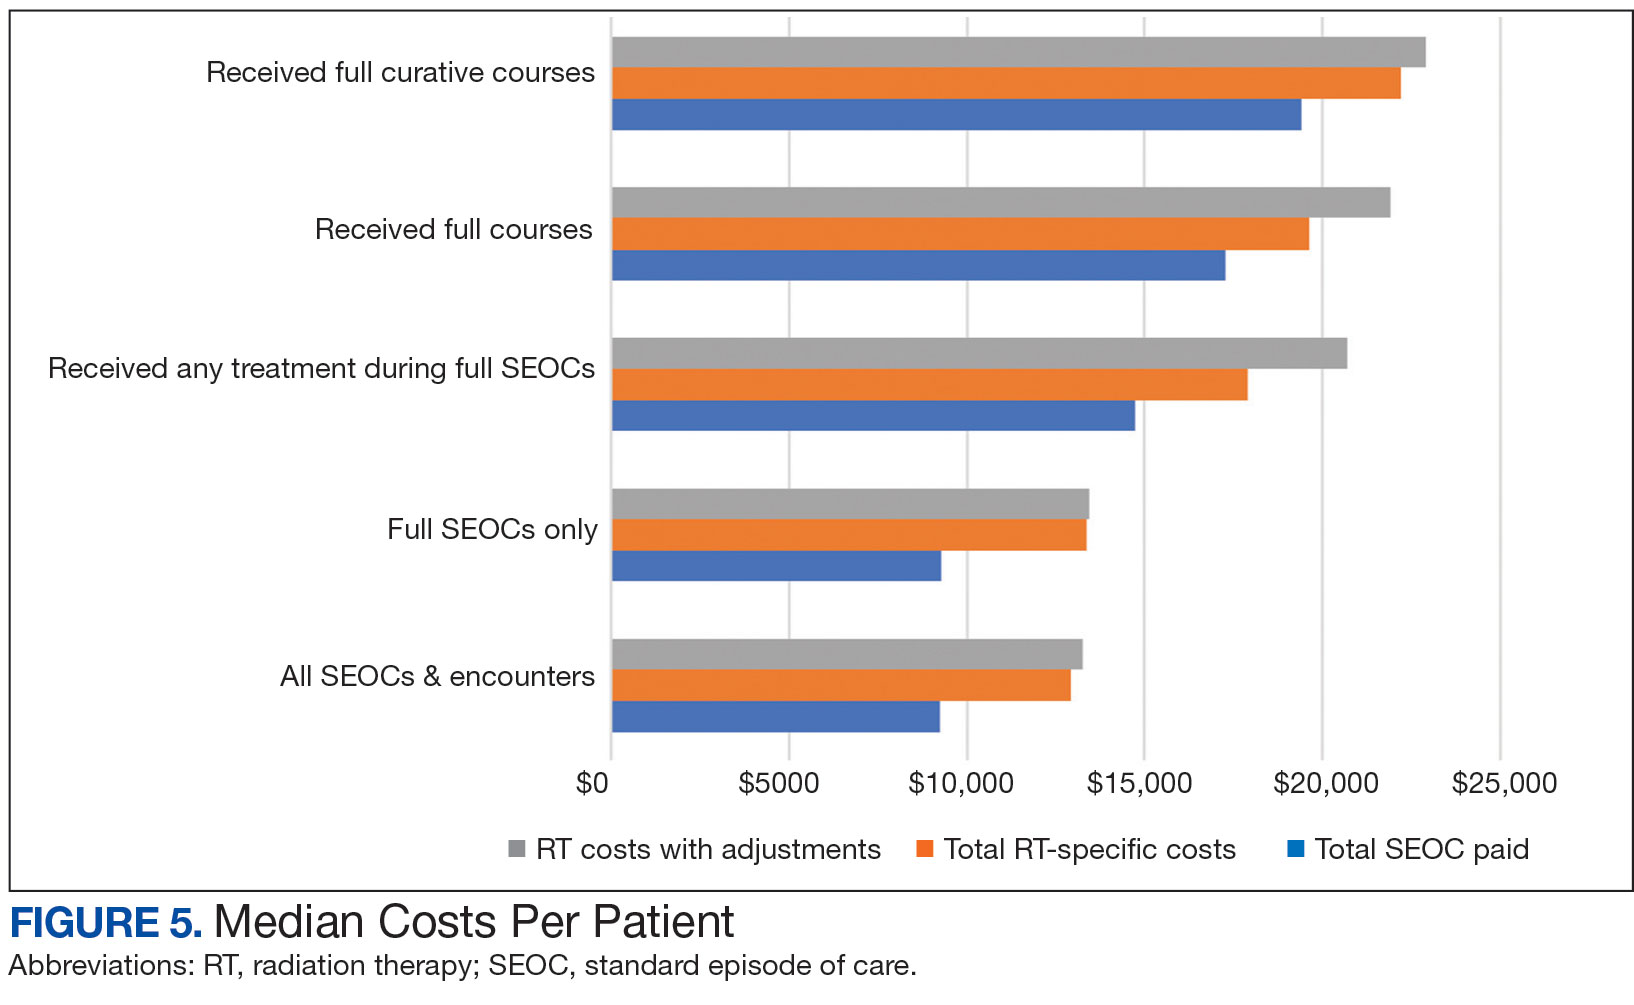
While 77% of consultations were scanned into CPRS and JLV, only 54% of completion summaries were available with an estimated $115,000 in additional costs. The total adjusted costs was about $2.9 million. Almost 37% of SEOCs were for visits only. For the 166 SEOCs where patients received any radiation treatment or planning, the median cost was $18,000. Differences in SEOC pathways are shown in Figure 4. One hundred twenty-one SEOCs (45%) followed the standard pathway, with median SEOC costs of $15,500; when corrected for radiation-specific costs, the median cost increased to $18,000. When adjusted for billing irregularities, the median cost was $20,600. Ninety-nine SEOCs (37%) were for consultation/ follow-up visits only, with a median cost of $220. When omitting shared scans and nonradiation therapy costs and correcting for billing gaps, the median cost decreased to $170. A median of $9200 was paid per patient, with $12,900 for radiation therapy-specific costs and $13,300 adjusted for billing deviations. Narrowing to the 106 patients who received full, radical courses, the median SEOC, ROS, and adjusted radiation therapy costs increased to $19,400, $22,200, and $22,900, respectively (Table 2, Figure 5). Seventy-one SEOCs (26%) had already seen a radiation oncologist before the VA radiation oncology department was aware, and 49 SEOCs (18%) had retroactive approvals (Supplemental materials available at doi:10.12788/fp.0585).
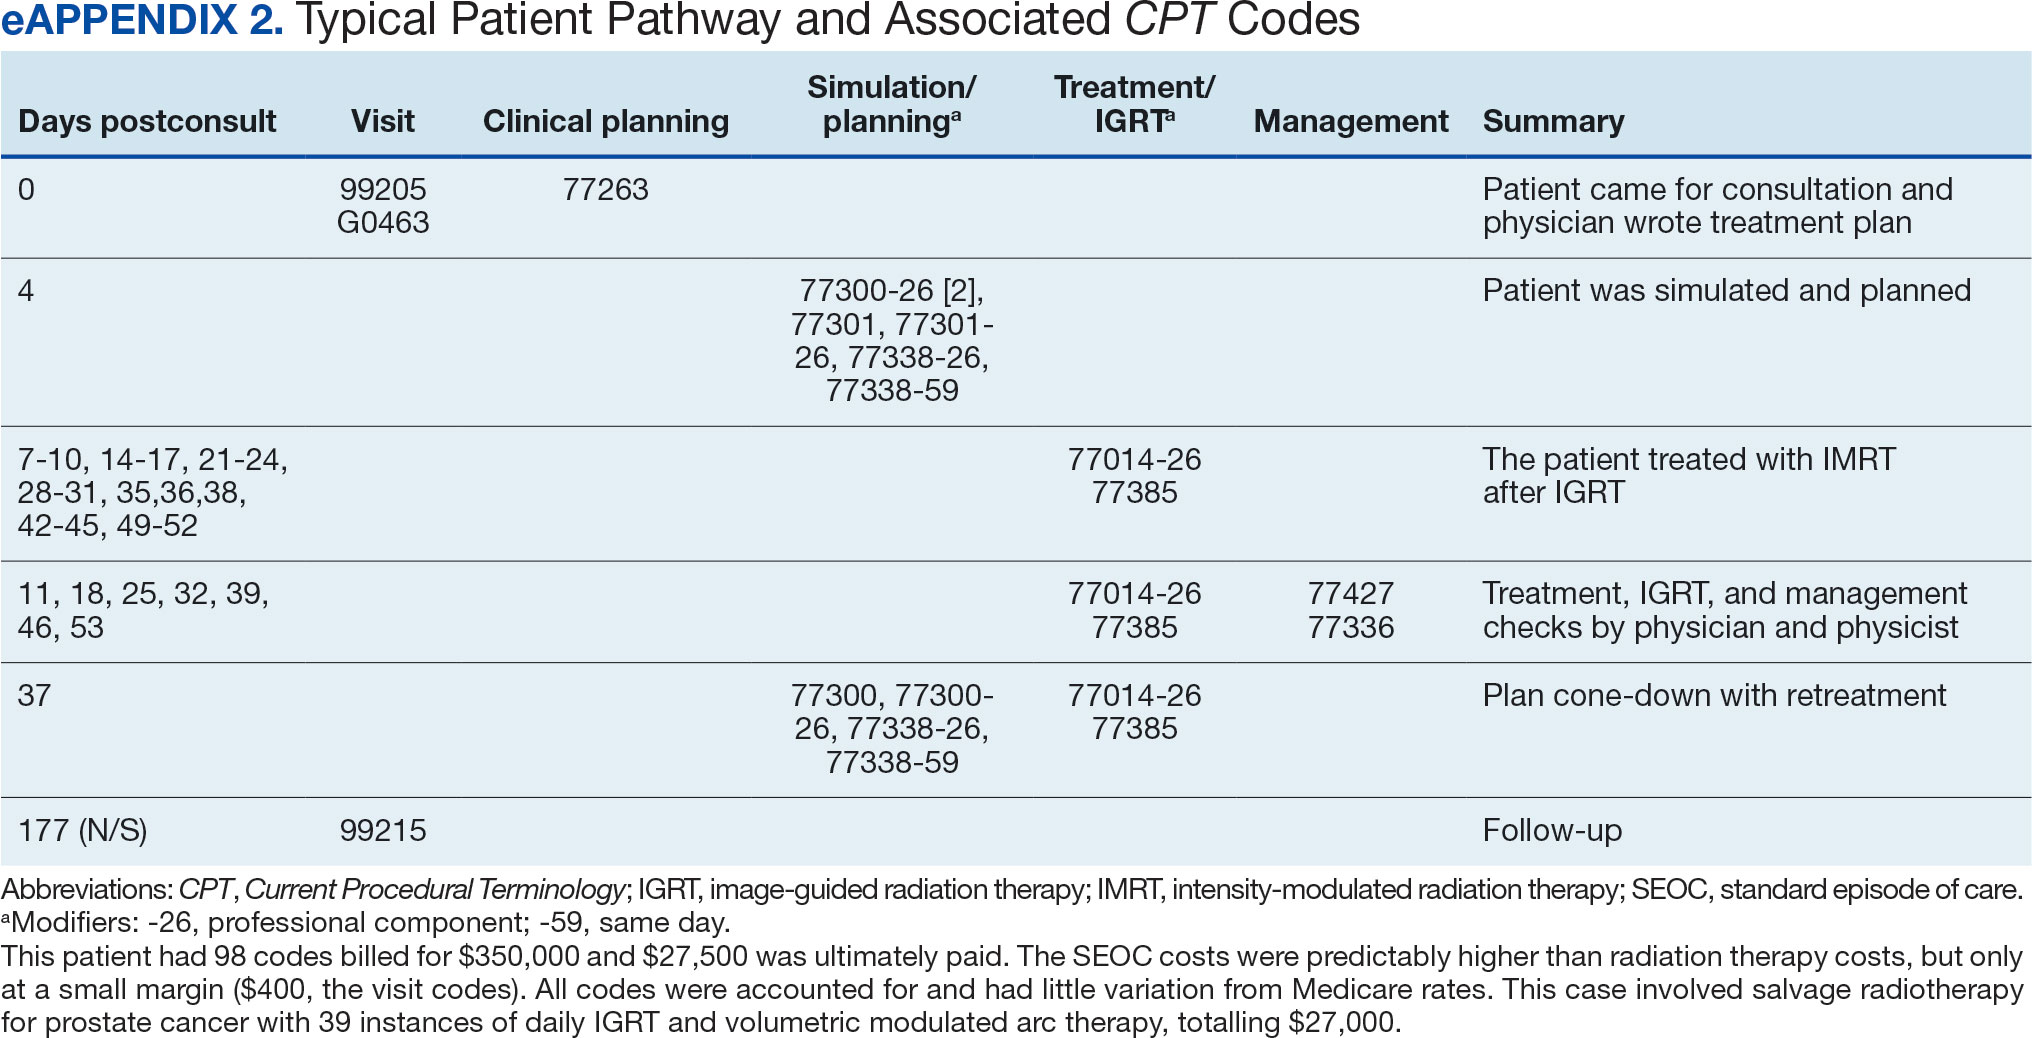
Every consultation charge was reviewed. A typical patient following the standard pathway (eAppendix 2, available at doi:10.12788/ fp.0585) exhibited a predictable pattern of consultation payment, simulation and planning, multiple radiation treatments interspersed with treatment management visits and a cone-down phase, and finishing with a follow-up visit. A less predictable case with excess CPT codes, gaps in charges, and an additional unexpected palliative course is shown in eAppendix 3 (available at doi:10.12788/fp.0585). Gaps occurred in 42% of SEOCs with missed bills costing as much as $12,000. For example, a patient with lung cancer had a treatment summary note for lung cancer after completion that showed the patient received 30 fractions of 2 Gy, a typical course. Only 10 treatment codes and 3 of 6 weekly treatment management codes were available. There was a gap of 20 volumetric modulated arc therapy treatments, 3 physics weekly status checks, 3 physician managements notes, and a computed tomography simulation charge.

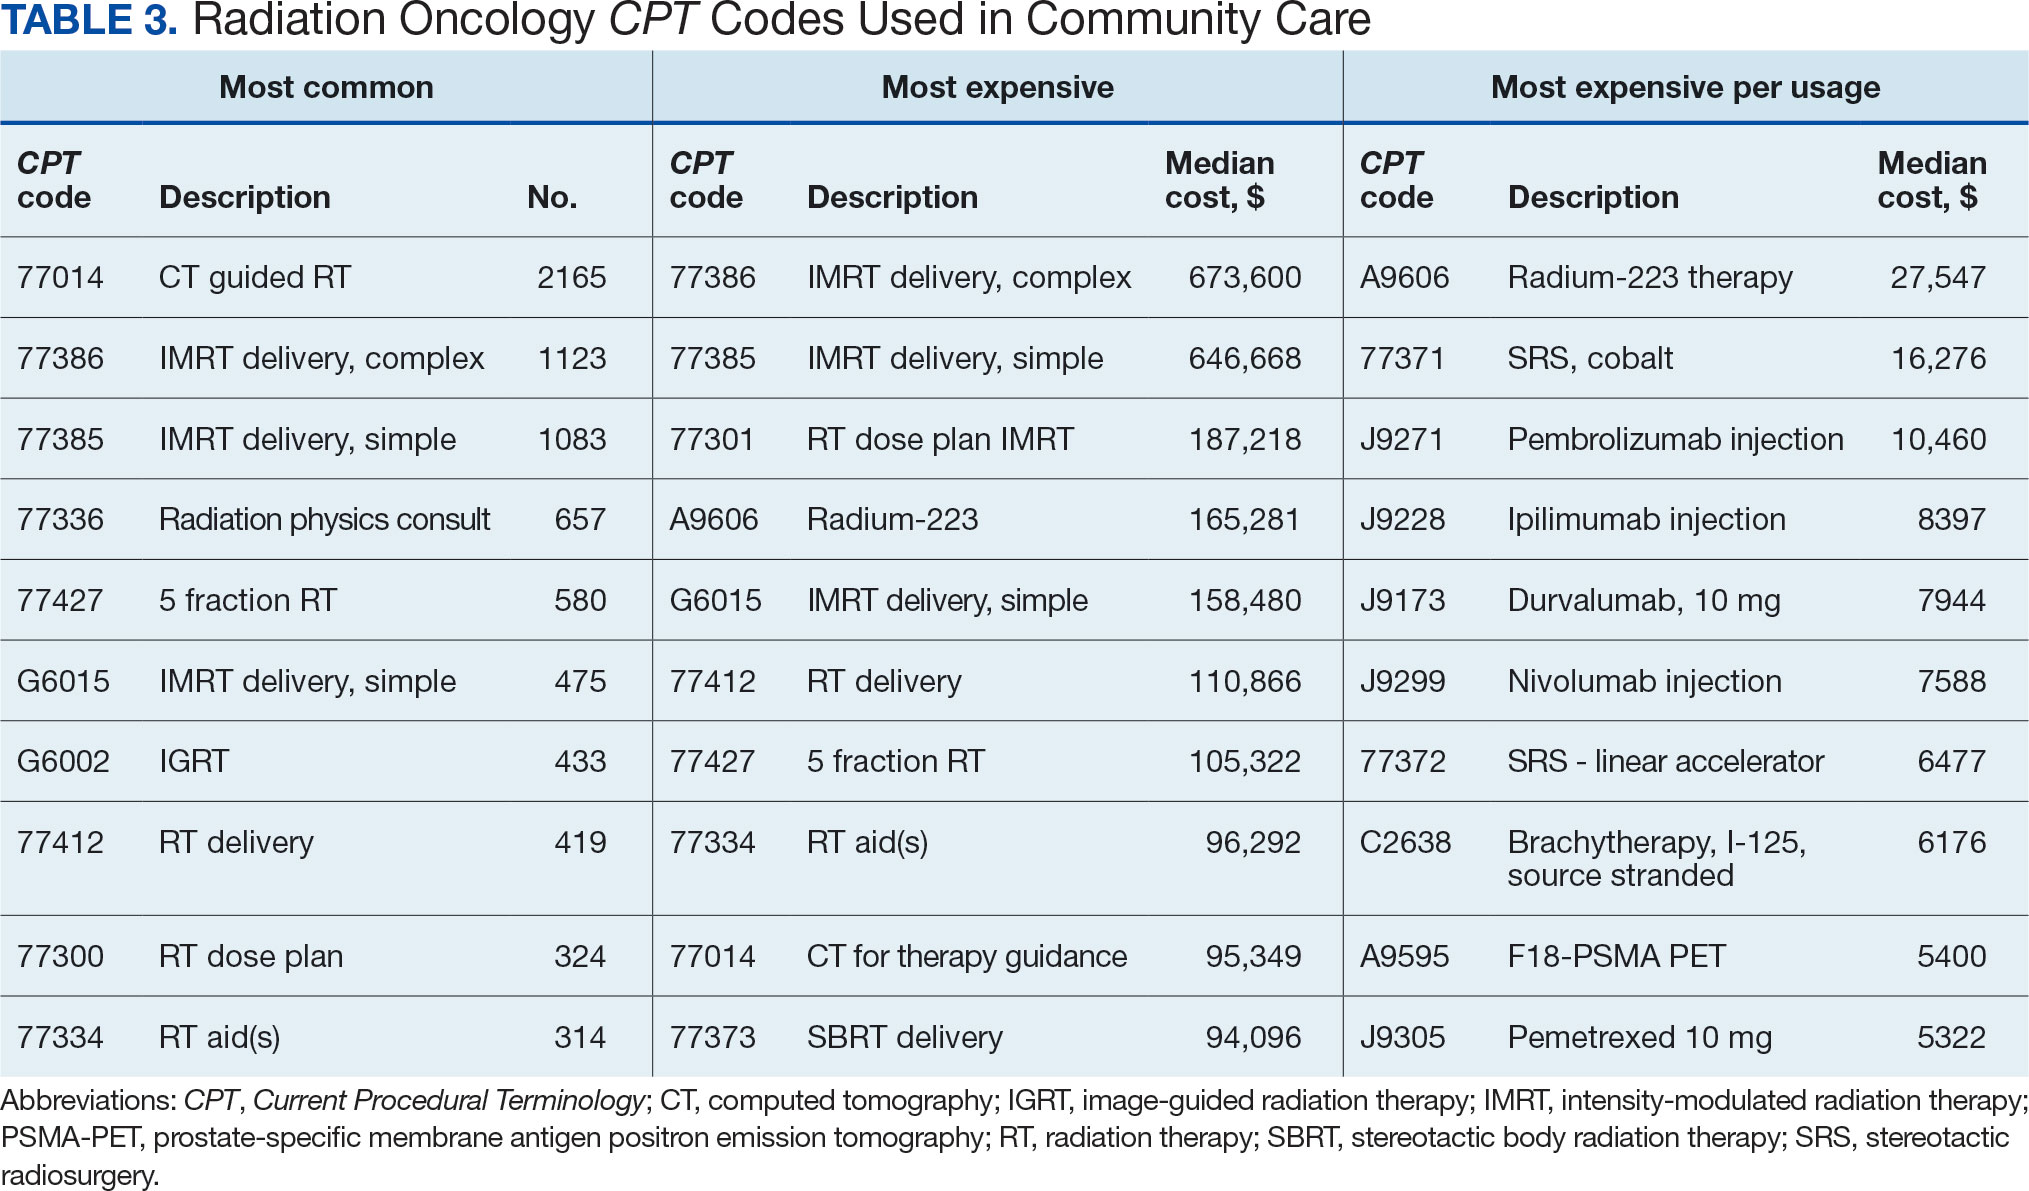
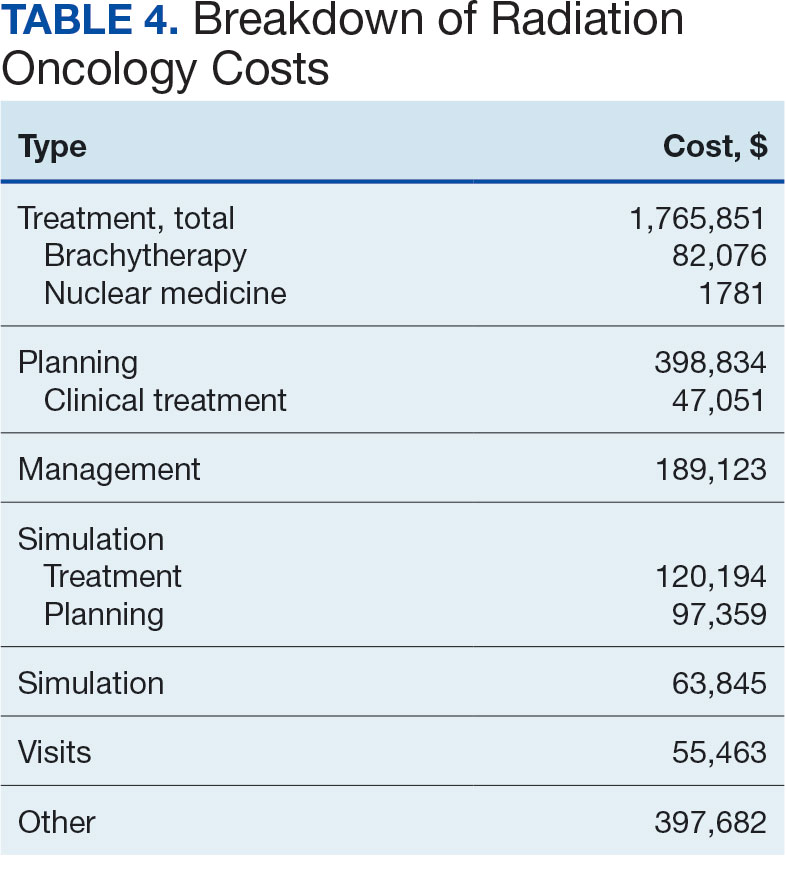
Between AMCMS and CTM, 10,005 CPT codes were evaluated; 1255 (12.5%) were unique to AMCMS (either related to the radiation oncology course, such as Evaluation and Management CPT codes or “other” unrelated codes) while 1158 (11.6%) were unique to CTM. Of the 7592 CPT codes shared between AMCMS and CTM, there was a discrepancy in 135 (1.8%); all were duplicates (CTM showed double payment while AMCMS showed $0 paid). The total CPT code costs came to $3.2 million with $560,000 unique to SEOCs and $500,000 unique to CTM. Treatment codes were the most common (33%) as shown in Table 3 and accounted for 55% of the cost ($1.8 million). About 700 CPT codes were considered “other,” typically for biologic therapeutic agents (Table 4 and eAppendix 4, available at doi:10.12788/fp.0585).

DISCUSSION
The current method of reporting radiation oncology costs used by VA is insufficient and misleading. Better data are needed to summarize purchased care costs to guide decisions about community care at the VA. Investigations into whether the extra costs for quality care (ie, expensive capital equipment, specialized staff, mandatory accreditations) are worthwhile if omitted at other facilities patients choose for their health care needs. No study has defined specialty care-specific costs by evaluating billing receipts from the CDW to answer the question. Kenamond et al highlight the need for radiation oncology for rural patients.11 Drive time was cited as the reason for community care referral for 97% of veterans, many of whom lived in rural locations. Of patients with rurality information who enrolled in community care, 57% came from rural or highly rural counties, and this ratio held for those who received full curative therapies. An executive administrator relying on AMCMS reports would see a median SEOC cost of $5000, but without ROS knowledge in coding, the administrator would miss many additional costs. For example, 2 patients who each had 5 SEOCs during the evaluated period, incurred a total cost of only $1800.
Additionally, an administrator could include miscategorized costs with significant ramifications. The 2 most expensive SEOCs were not typical radiation oncology treatments. A patient undergoing radium-223 dichloride therapy incurred charges exceeding $165,000, contributing disproportionately to the overall median cost analysis; this would normally be administered by the nuclear medicine department. Immunotherapy and chemotherapy are uniformly overseen by medical oncology services, but drug administration codes were still found in radiation oncology SEOCs. A patient (whose SEOC was discontinued but accrued charges) had an electrocardiogram interpretation for $8 as the SEOC cost; 3 other SEOCs continued to incur costs after being discontinued. There were 24 empty SEOCs for patients that had consults to the community, and 2 had notes stating treatment had been delivered yet there was no ROS costs or SEOC costs. Of the 268 encounters, 43% had some sort of billing irregularities (ie, missing treatment costs) that would be unlikely for a private practice to omit; it would be much more likely that the CDW miscategorized the payment despite confirmation of the 2 retrieval systems.
It would be inadvisable to make staffing decisions or forecast costs based on current SEOC reports without specialized curation. A simple yet effective improvement to the cost attribution process would be to restrict the analysis to encounters containing primary radiation treatment codes. This targeted approach allows more accurate identification of patients actively receiving radiation oncology treatment, while excluding those seen solely for consultations or follow-up visits. Implementing this refinement leads to a substantial increase in the median payment—from $5000 to $13,000—without requiring additional coding or data processing, thereby enhancing the accuracy of cost estimates with minimal effort.
Clarifying radiation oncology service costs requires addressing the time frame and services included, given laxity and interpretation of the SEOCs. VA community care departments have streamlined the reimbursement process at the expense of medical cost organization and accuracy; 86% of VA practitioners reported that ≥ 1 potential community health care partners had refused to work with the VA because of payment delays.12 Payments are contingent on correspondence from outside practices for community work. For radiation oncology, this includes the consultation but also critical radiation-related details of treatment, which were omitted nearly half the time. SEOC approval forms have many costly laboratory tests, imaging, and procedures that have little to do with radiation oncology cancer treatments but may be used in the workup and staging process; this creates noise when calculating radiation oncology fiscal cost.
The presumption that an episode of care equates to a completed radiation therapy course is incorrect; this occurs less than half of the time. An episode often refers to a return visit, or conversely, multiple treatment courses. As the patients’ medical homes are their VHA primary care practitioners, it would be particularly challenging to care for the patients without full treatment information, especially if adverse effects from therapy were to arise. As a tertiary specialty, radiation oncology does not seek out patients and are sent consultations from medical oncology, surgical, and medical oncologic specialties. Timesensitive processes such as workup, staging, and diagnosis often occur in parallel. This analysis revealed that patients see outside radiation oncologists prior to the VA. There are ≥ 100 patients who had radiation oncology codes without a radiation oncology SEOC or community care consultation, and in many cases, the consultation was placed after the patient was seen.
Given the lack of uniformity and standardization of patient traffic, the typical and expected pathways were insufficient to find the costs. Too many opportunities for errors and incorrect categorization of costs meant a different method would be necessary. Starting at the inception of the community care consult, only 1 diagnosis code can be entered. For patients with multiple diagnoses, one would not be able to tell what was treated without chart access. Radiation oncology consults come from primary and specialty care practitioners and nurses throughout the VA. Oftentimes, the referral would be solicited by the community radiation oncology clinic, diagnosing community specialty (ie, urology for a patient with prostate cancer), or indirectly from the patient through primary care. Many cases were retroactively approved as the veteran had already been consulted by the community care radiation oncologist. If the patient is drive-time eligible, it would be unlikely that they would leave and choose to return to the VA. There is no way for a facility VA service chief or administrator to mitigate VA community costs of care, especially as shown by the miscategorization of several codes. Database challenges exacerbate the issue: 1 patient changed her first and last name during this time frame, and 2 patients had the same name but different social security numbers. In order to strictly find costs between 2 discrete timepoints, 39 (15%) SEOCs were split and incomplete, and 6 SEOCs contained charges for 2 different patients. This was corrected, and all inadvertent charges were cancelled. Only 1 ICD code is allowed per community care consultation, so an investigation is required to find costs for patients with multiple sites of disease. Additionally, 5 of the patients marked for drive time were actually patients who received Gamma Knife and brachytherapy, services not available at the VA.
Hanks et al first attempted to calculate cost of radiation oncology services. External beam prostate cancer radiotherapy at 3 suburban California centers cost $6750 ($20,503 inflation adjusted) per patient before October 1984 and $5600 ($17,010 inflation adjusted) afterwards.13 According to the American Society for Radiation Oncology, Advocacy Radiation Oncology Case Rate Program Curative radiation courses should cost $20,000 to $30,000 and palliative courses should cost $10,000 to $15,000. These costs are consistent with totals demonstrated in this analysis and similar to the inflation-adjusted Hanks et al figures. Preliminary findings suggest that radiation treatment constituted more than half of the total expenditures, with a notable $4 million increase in adjusted cost compared to the Medicare rates, indicating significant variation. Direct comparisons with Medicaid or commercial payer rates remain unexplored.
Future Directions
During the study period, 201 patients received 186 courses of radiation therapy in the community, while 1014 patients were treated in-house for a total of 833 courses. A forthcoming analysis will directly compare the cost of in-house care with that of communitybased treatment, specifically breaking down expenditure differences by diagnosis. Future research should investigate strategies to align reimbursement with quality metrics, including the potential role of tertiary accreditation in incentivizing high-value care. Additional work is also warranted to assess patient out-ofpocket expenses across care settings and to benchmark VA reimbursement against Medicare, Medicaid, and private insurance rates. In any case, with the increasing possibility of fewer fractions for treatments such as stereotactic radiotherapy or palliative care therapy, there is a clear financial incentive to treat as frequently as allowed despite equal clinical outcomes.
CONCLUSIONS
Veterans increasingly choose to receive care closer to home if the option is available. In the VA iron triangle, cost comes at the expense of access but quantifying this has proved elusive in the cost accounting model currently used at the VA.1 The inclusion of all charges loosely associated with SEOCs significantly impairs the ability to conduct meaningful cost analyses. The current VA methodology not only introduces substantial noise into the data but also leads to a marked underestimation of the true cost of care delivered in community settings. Such misrepresentation risks driving policy decisions that could inappropriately reduce or eliminate in-house radiation oncology services. Categorizing costs effectively in the VA could assist in making managerial and administrative decisions and would prevent damaging service lines based on misleading or incorrect data. A system which differentiates between patients who have received any treatment codes vs those who have not would increase accuracy.
- Kissick W. Medicine’s Dilemmas: Infinite Needs Versus Finite Resources. 1st ed. Yale University Press; 1994.
- Albanese AP, Bope ET, Sanders KM, Bowman M. The VA MISSION Act of 2018: a potential game changer for rural GME expansion and veteran health care. J Rural Health. 2020;36(1):133-136. doi:10.1111/jrh.12360
- Office of Management and Budget (US). Budget of the United States Government, Fiscal Year 2025. Washington, DC: US Government Publishing Office; 2024. Available from: US Department of Veterans Affairs FY 2025 Budget Submission: Budget in Brief.
- US Department of Veterans Affairs. Veteran care claims. Accessed April 3, 2025. https://www.va.gov/COMMUNITYCARE/revenue-ops/Veteran-Care-Claims.asp
- US Centers for Medicare and Medicaid Services. Accessed April 3, 2025. Procedure price lookup https://www.medicare.gov/procedure-price-lookup
- US Department of Veterans Affairs. WellHive -Enterprise. Accessed April 3, 2025. https://department.va.gov/privacy/wp-content/uploads/sites/5/2023/05/FY23WellHiveEnterprisePIA.pdf
- US Centers for Medicare and Medicaid Services. RVU21a physician fee schedule, January 2021 release. Accessed April 3, 2025. https://www.cms.gov/medicaremedicare-fee-service-paymentphysicianfeeschedpfs-relative-value-files/rvu21a
- US Centers for Medicare and Medicaid Services. RVU22a physician fee schedule, January 2022 release. Accessed April 3, 2025. https://www.cms.gov/medicaremedicare-fee-service-paymentphysicianfeeschedpfs-relative-value-files/rvu22a
- US Centers for Medicare and Medicaid Services. RVU23a physician fee schedule, January 2023 release. Accessed April 3, 2025. https://www.cms.gov/medicare/medicare-fee-service-payment/physicianfeesched/pfs-relative-value-files/rvu23a
- US Centers for Medicare and Medicaid Services. RVU23a Medicare Physician Fee Schedule rates effective January 1, 2024, through March 8, 2024. Accessed on April 3, 2025. https://www.cms.gov/medicare/payment/fee-schedules/physician/pfs-relative-value-files/rvu24a
- Kenamond MC, Mourad WF, Randall ME, Kaushal A. No oncology patient left behind: challenges and solutions in rural radiation oncology. Lancet Reg Health Am. 2022;13:100289. doi:10.1016/j.lana.2022.100289
- Mattocks KM, Kroll-Desrosiers A, Kinney R, Elwy AR, Cunningham KJ, Mengeling MA. Understanding VA’s use of and relationships with community care providers under the MISSION Act. Med Care. 2021;59(Suppl 3):S252-S258. doi:10.1097/MLR.0000000000001545
- Hanks GE, Dunlap K. A comparison of the cost of various treatment methods for early cancer of the prostate. Int J Radiat Oncol Biol Phys. 1986;12(10):1879-1881. doi:10.1016/0360-3016(86)90334-2
- American Society of Radiation Oncology. Radiation oncology case rate program (ROCR). Accessed April 3, 2025. https://www.astro.org/advocacy/key-issues-8f3e5a3b76643265ee93287d79c4fc40/rocr
William Kissick’s description of health care’s iron triangle in 1994 still resonates. Access, quality, and cost will always come at the expense of the others.1 In 2018, Congress passed the VA MISSION Act, allowing patients to pursue community care options for extended waits (> 28 days) or longer distance drive times of > 60 minutes for specialty care services, such as radiation oncology. According to Albanese et al, the VA MISSION Act sought to address gaps in care for veterans living in rural and underserved areas.2 The Veterans Health Administration (VHA) continues to increase community care spending, with a 13.8% increase in fiscal year 2024 and an expected cost of > $40 billion for 2025.3 One could argue this pays for access for remote patients and quality when services are unavailable, making it a direct application of the iron triangle.
The VA MISSION Act also bolstered the expansion of existing community care department staff to expediently facilitate and coordinate care and payments.2 Cost management and monitoring have become critical in predicting future staff requirements, maintaining functionality, and ensuring patients receive optimal care. The VHA purchases care through partner networks and defines these bundled health care services as standard episodes of care (SEOCs), which are “clinically related health care services for a specific unique illness or medical condition… over a defined period of time.”4 Medicare publishes its rates quarterly, and outpatient procedure pricing is readily available online.5 Along these same lines, the US Department of Veterans Affairs (VA) publishes a current list of available procedures and associated Current Procedure Technology (CPT) codes that are covered under its VA fee schedule for community care.
Unique challenges persist when using this system to accurately account for radiation oncology expenditures. This study was based on the current practices at the Richard L. Roudebush VA Medical Center (RLRVAMC), a large 1a hospital. A detailed analysis reveals the contemporaneous cost of radiation oncology cancer care from October 1, 2021, through February 1, 2024, highlights the challenges in SEOC definition and duration, communication issues between RLRVAMC and purchase partners, inconsistencies in billing, erroneous payments, and difficulty of cost categorization.
METHODS
Community care radiation oncology-related costs were examined from October 1, 2021, to February 1, 2024 for RLRVAMC, 6 months prior to billing data extraction. Figure 1 shows a simple radiation oncology patient pathway with consultation or visit, simulation and planning, and treatment, with codes used to check billing. It illustrates the expected relationships between the VHA (radiation oncology, primary, and specialty care) and community care (clinicians and radiation oncology treatment sites).
VHA standard operating procedures for a patient requesting community-based radiation oncology care require a board-certified radiation oncologist at RLRVAMC to review and approve the outside care request. Community care radiation oncology consultation data were accessed from the VA Corporate Data Warehouse (CDW) using Pyramid Analytics (V25.2). Nurses, physicians, and community care staff can add comments, forward consultations to other services, and mark them as complete or discontinued, when appropriate. Consultations not completed within 91 days are automatically discontinued. All community care requests from 2018 through 2024 were extracted; analysis began April 1, 2021, 6 months prior to the cost evaluation date of October 1, 2021.
An approved consultation is reviewed for eligibility by a nurse in the community care department and assigned an authorization number (a VA prefix followed by 12 digits). Billing codes are approved and organized by the community care networks, and all procedure codes should be captured and labeled under this number. The VAMC Community Care department obtains initial correspondence from the treating clinicians. Subsequent records from the treating radiation oncologist are expected to be scanned into the electronic health record and made accessible via the VA Joint Legacy Viewer (JLV) and Computerized Patient Record System (CPRS).
Radiation Oncology SEOC
The start date of the radiation oncology SEOC is determined by the community care nurse based on guidance established by the VA. It can be manually backdated or delayed, but current practice is to start at first visit or procedure code entry after approval from the VAMC Radiation Oncology department. Approved CPT codes from SEOC versions between October 1, 2021, and February 1, 2024, are in eAppendix 1 (available at doi:10.12788/fp.0585). These generally include 10 types of encounters, about 115 different laboratory tests, 115 imaging studies, 25 simulation and planning procedures, and 115 radiation treatment codes. The radiation oncology SEOCs during the study period had an approval duration of 180 days. Advanced Medical Cost Management Solutions software (AMCMS) is the VHA data analytics platform for community care medical service costs. AMCMS includes all individual CPT codes billed by specific radiation oncology SEOC versions. Data are refreshed monthly, and all charges were extracted on September 12, 2024, > 6 months after the final evaluated service date to allow for complete billing returns.6
Radiation Oncology-Specific Costs
The VA Close to Me (CTM) program was used to find 84 specific radiation oncology CPT codes, nearly all within the 77.XXX or G6.XXX series, which included all radiation oncology-specific (ROS) codes (except visits accrued during consultation and return appointments). ROS costs are those that could not be performed by any other service and include procedures related to radiation oncology simulation, treatment planning, treatment delivery (with or without image guidance), and physician or physicist management. All ROS costs should be included in a patient’s radiation oncology SEOC. Other costs that may accompany operating room or brachytherapy administration did not follow a 77.XXX or G6.XXX pattern but were included in total radiation therapy operating costs.
Data obtained from AMCMS and CTM included patient name and identifier; CPT billed amount; CPT paid amount; dates of service; number of claims; International Classification of Diseases, Tenth Revision (ICD) diagnosis; and VA authorization numbers. Only CTM listed code modifiers. Only items categorized as paid were included in the analysis. Charges associated with discontinued consultations that had accrued costs also were included. Codes that were not directly related to ROS were separately characterized as other and further subcategorized.
Deep Dive Categorization
All scanned documents tagged to the community consultation were accessed and evaluated for completeness by a radiation oncologist (RS). The presence or absence of consultation notes and treatment summaries was evaluated based on necessity (ie, not needed for continuation of care or treatment was not given). In the absence of a specific completion summary or follow-up note detailing the treatment modality, number of fractions, and treatment sites, available documentation, including clinical notes and billing information, was used. Radical or curative therapies were identified as courses expected to eradicate disease, including stereotactic ablative radiotherapy to the brain, lung, liver, and other organs. Palliative therapies included whole-brain radiotherapy or other low-dose treatments. If the patient received the intended course, this was categorized as full. If incomplete, it was considered partial.
Billing Deviations
The complete document review allowed for close evaluation of paid therapy and identification of gaps in billing (eg, charges not found in extracted data that should have occurred) for external beam radiotherapy patients. Conversely, extra charges, such as an additional weekly treatment management charge (CPT code 77427), would be noted. Patients were expected to have the number of treatments specified in the summary, a clinical treatment planning code, and weekly treatment management notes from physicians and physicists every 5 fractions. Consultations and follow-up visits were expected to have 1 visit code; CPT codes 99205 and 99215, respectively, were used to estimate costs in their absence.
Costs were based on Medicare rates as of January 1 of the year in which they were accrued. 7-10 Duplicates were charges with the same code, date, billed quantity, and paid amounts for a given patient. These would always be considered erroneous. Medicare treatment costs for procedures such as intensity modulated radiotherapy (CPT code 77385 or 77386) are available on the Medicare website. When reviewing locality deviations for 77427, there was a maximum of 33% increase in Medicare rates. Therefore, for treatment codes, one would expect the range to be at least the Medicare rate and maximally 33% higher. These rates are negotiated with insurance companies, but this range was used for the purpose of reviewing and adjusting large data sets.
RESULTS
Since 2018, > 500 community care consults have been placed by radiation oncology for treatment in the community, with more following implementation of the VA MISSION Act. Use of radiation oncology community care services annually increased during the study period for this facility (Table 1, Figure 2). Of the 325 community care consults placed from October 1, 2021, to February 1, 2024, 248 radiation oncology SEOCs were recorded with charges for 181 patients (range, 1-5 SEOCs). Long drive time was the rationale for > 97% of patients directed to community care (Supplemental materials, available at doi:10.12788/fp.0585). Based on AMCMS data, $22.2 million was billed and $2.7 million was paid (20%) for 8747 CPT codes. Each community care interval cost the VA a median (range) of $5000 ($8-$168,000 (Figure 3).
After reviewing ROS charges extracted from CTM, 20 additional patients had radiation oncology charges but did not have a radiation oncology SEOC for 268 episodes of care for 201 unique patients. In addition to the 20 patients who did not have a SEOC, 42 nonradiation oncology SEOCs contained 1148 radiation oncology codes, corresponding to almost $500,000 paid. Additional charges of about $416,000, which included biologic agents (eg, durvalumab, nivolumab), procedures (eg, mastectomies), and ambulance rides were inappropriately added to radiation oncology SEOCs.
While 77% of consultations were scanned into CPRS and JLV, only 54% of completion summaries were available with an estimated $115,000 in additional costs. The total adjusted costs was about $2.9 million. Almost 37% of SEOCs were for visits only. For the 166 SEOCs where patients received any radiation treatment or planning, the median cost was $18,000. Differences in SEOC pathways are shown in Figure 4. One hundred twenty-one SEOCs (45%) followed the standard pathway, with median SEOC costs of $15,500; when corrected for radiation-specific costs, the median cost increased to $18,000. When adjusted for billing irregularities, the median cost was $20,600. Ninety-nine SEOCs (37%) were for consultation/ follow-up visits only, with a median cost of $220. When omitting shared scans and nonradiation therapy costs and correcting for billing gaps, the median cost decreased to $170. A median of $9200 was paid per patient, with $12,900 for radiation therapy-specific costs and $13,300 adjusted for billing deviations. Narrowing to the 106 patients who received full, radical courses, the median SEOC, ROS, and adjusted radiation therapy costs increased to $19,400, $22,200, and $22,900, respectively (Table 2, Figure 5). Seventy-one SEOCs (26%) had already seen a radiation oncologist before the VA radiation oncology department was aware, and 49 SEOCs (18%) had retroactive approvals (Supplemental materials available at doi:10.12788/fp.0585).
Every consultation charge was reviewed. A typical patient following the standard pathway (eAppendix 2, available at doi:10.12788/ fp.0585) exhibited a predictable pattern of consultation payment, simulation and planning, multiple radiation treatments interspersed with treatment management visits and a cone-down phase, and finishing with a follow-up visit. A less predictable case with excess CPT codes, gaps in charges, and an additional unexpected palliative course is shown in eAppendix 3 (available at doi:10.12788/fp.0585). Gaps occurred in 42% of SEOCs with missed bills costing as much as $12,000. For example, a patient with lung cancer had a treatment summary note for lung cancer after completion that showed the patient received 30 fractions of 2 Gy, a typical course. Only 10 treatment codes and 3 of 6 weekly treatment management codes were available. There was a gap of 20 volumetric modulated arc therapy treatments, 3 physics weekly status checks, 3 physician managements notes, and a computed tomography simulation charge.
Between AMCMS and CTM, 10,005 CPT codes were evaluated; 1255 (12.5%) were unique to AMCMS (either related to the radiation oncology course, such as Evaluation and Management CPT codes or “other” unrelated codes) while 1158 (11.6%) were unique to CTM. Of the 7592 CPT codes shared between AMCMS and CTM, there was a discrepancy in 135 (1.8%); all were duplicates (CTM showed double payment while AMCMS showed $0 paid). The total CPT code costs came to $3.2 million with $560,000 unique to SEOCs and $500,000 unique to CTM. Treatment codes were the most common (33%) as shown in Table 3 and accounted for 55% of the cost ($1.8 million). About 700 CPT codes were considered “other,” typically for biologic therapeutic agents (Table 4 and eAppendix 4, available at doi:10.12788/fp.0585).
DISCUSSION
The current method of reporting radiation oncology costs used by VA is insufficient and misleading. Better data are needed to summarize purchased care costs to guide decisions about community care at the VA. Investigations into whether the extra costs for quality care (ie, expensive capital equipment, specialized staff, mandatory accreditations) are worthwhile if omitted at other facilities patients choose for their health care needs. No study has defined specialty care-specific costs by evaluating billing receipts from the CDW to answer the question. Kenamond et al highlight the need for radiation oncology for rural patients.11 Drive time was cited as the reason for community care referral for 97% of veterans, many of whom lived in rural locations. Of patients with rurality information who enrolled in community care, 57% came from rural or highly rural counties, and this ratio held for those who received full curative therapies. An executive administrator relying on AMCMS reports would see a median SEOC cost of $5000, but without ROS knowledge in coding, the administrator would miss many additional costs. For example, 2 patients who each had 5 SEOCs during the evaluated period, incurred a total cost of only $1800.
Additionally, an administrator could include miscategorized costs with significant ramifications. The 2 most expensive SEOCs were not typical radiation oncology treatments. A patient undergoing radium-223 dichloride therapy incurred charges exceeding $165,000, contributing disproportionately to the overall median cost analysis; this would normally be administered by the nuclear medicine department. Immunotherapy and chemotherapy are uniformly overseen by medical oncology services, but drug administration codes were still found in radiation oncology SEOCs. A patient (whose SEOC was discontinued but accrued charges) had an electrocardiogram interpretation for $8 as the SEOC cost; 3 other SEOCs continued to incur costs after being discontinued. There were 24 empty SEOCs for patients that had consults to the community, and 2 had notes stating treatment had been delivered yet there was no ROS costs or SEOC costs. Of the 268 encounters, 43% had some sort of billing irregularities (ie, missing treatment costs) that would be unlikely for a private practice to omit; it would be much more likely that the CDW miscategorized the payment despite confirmation of the 2 retrieval systems.
It would be inadvisable to make staffing decisions or forecast costs based on current SEOC reports without specialized curation. A simple yet effective improvement to the cost attribution process would be to restrict the analysis to encounters containing primary radiation treatment codes. This targeted approach allows more accurate identification of patients actively receiving radiation oncology treatment, while excluding those seen solely for consultations or follow-up visits. Implementing this refinement leads to a substantial increase in the median payment—from $5000 to $13,000—without requiring additional coding or data processing, thereby enhancing the accuracy of cost estimates with minimal effort.
Clarifying radiation oncology service costs requires addressing the time frame and services included, given laxity and interpretation of the SEOCs. VA community care departments have streamlined the reimbursement process at the expense of medical cost organization and accuracy; 86% of VA practitioners reported that ≥ 1 potential community health care partners had refused to work with the VA because of payment delays.12 Payments are contingent on correspondence from outside practices for community work. For radiation oncology, this includes the consultation but also critical radiation-related details of treatment, which were omitted nearly half the time. SEOC approval forms have many costly laboratory tests, imaging, and procedures that have little to do with radiation oncology cancer treatments but may be used in the workup and staging process; this creates noise when calculating radiation oncology fiscal cost.
The presumption that an episode of care equates to a completed radiation therapy course is incorrect; this occurs less than half of the time. An episode often refers to a return visit, or conversely, multiple treatment courses. As the patients’ medical homes are their VHA primary care practitioners, it would be particularly challenging to care for the patients without full treatment information, especially if adverse effects from therapy were to arise. As a tertiary specialty, radiation oncology does not seek out patients and are sent consultations from medical oncology, surgical, and medical oncologic specialties. Timesensitive processes such as workup, staging, and diagnosis often occur in parallel. This analysis revealed that patients see outside radiation oncologists prior to the VA. There are ≥ 100 patients who had radiation oncology codes without a radiation oncology SEOC or community care consultation, and in many cases, the consultation was placed after the patient was seen.
Given the lack of uniformity and standardization of patient traffic, the typical and expected pathways were insufficient to find the costs. Too many opportunities for errors and incorrect categorization of costs meant a different method would be necessary. Starting at the inception of the community care consult, only 1 diagnosis code can be entered. For patients with multiple diagnoses, one would not be able to tell what was treated without chart access. Radiation oncology consults come from primary and specialty care practitioners and nurses throughout the VA. Oftentimes, the referral would be solicited by the community radiation oncology clinic, diagnosing community specialty (ie, urology for a patient with prostate cancer), or indirectly from the patient through primary care. Many cases were retroactively approved as the veteran had already been consulted by the community care radiation oncologist. If the patient is drive-time eligible, it would be unlikely that they would leave and choose to return to the VA. There is no way for a facility VA service chief or administrator to mitigate VA community costs of care, especially as shown by the miscategorization of several codes. Database challenges exacerbate the issue: 1 patient changed her first and last name during this time frame, and 2 patients had the same name but different social security numbers. In order to strictly find costs between 2 discrete timepoints, 39 (15%) SEOCs were split and incomplete, and 6 SEOCs contained charges for 2 different patients. This was corrected, and all inadvertent charges were cancelled. Only 1 ICD code is allowed per community care consultation, so an investigation is required to find costs for patients with multiple sites of disease. Additionally, 5 of the patients marked for drive time were actually patients who received Gamma Knife and brachytherapy, services not available at the VA.
Hanks et al first attempted to calculate cost of radiation oncology services. External beam prostate cancer radiotherapy at 3 suburban California centers cost $6750 ($20,503 inflation adjusted) per patient before October 1984 and $5600 ($17,010 inflation adjusted) afterwards.13 According to the American Society for Radiation Oncology, Advocacy Radiation Oncology Case Rate Program Curative radiation courses should cost $20,000 to $30,000 and palliative courses should cost $10,000 to $15,000. These costs are consistent with totals demonstrated in this analysis and similar to the inflation-adjusted Hanks et al figures. Preliminary findings suggest that radiation treatment constituted more than half of the total expenditures, with a notable $4 million increase in adjusted cost compared to the Medicare rates, indicating significant variation. Direct comparisons with Medicaid or commercial payer rates remain unexplored.
Future Directions
During the study period, 201 patients received 186 courses of radiation therapy in the community, while 1014 patients were treated in-house for a total of 833 courses. A forthcoming analysis will directly compare the cost of in-house care with that of communitybased treatment, specifically breaking down expenditure differences by diagnosis. Future research should investigate strategies to align reimbursement with quality metrics, including the potential role of tertiary accreditation in incentivizing high-value care. Additional work is also warranted to assess patient out-ofpocket expenses across care settings and to benchmark VA reimbursement against Medicare, Medicaid, and private insurance rates. In any case, with the increasing possibility of fewer fractions for treatments such as stereotactic radiotherapy or palliative care therapy, there is a clear financial incentive to treat as frequently as allowed despite equal clinical outcomes.
CONCLUSIONS
Veterans increasingly choose to receive care closer to home if the option is available. In the VA iron triangle, cost comes at the expense of access but quantifying this has proved elusive in the cost accounting model currently used at the VA.1 The inclusion of all charges loosely associated with SEOCs significantly impairs the ability to conduct meaningful cost analyses. The current VA methodology not only introduces substantial noise into the data but also leads to a marked underestimation of the true cost of care delivered in community settings. Such misrepresentation risks driving policy decisions that could inappropriately reduce or eliminate in-house radiation oncology services. Categorizing costs effectively in the VA could assist in making managerial and administrative decisions and would prevent damaging service lines based on misleading or incorrect data. A system which differentiates between patients who have received any treatment codes vs those who have not would increase accuracy.
- Kissick W. Medicine’s Dilemmas: Infinite Needs Versus Finite Resources. 1st ed. Yale University Press; 1994.
- Albanese AP, Bope ET, Sanders KM, Bowman M. The VA MISSION Act of 2018: a potential game changer for rural GME expansion and veteran health care. J Rural Health. 2020;36(1):133-136. doi:10.1111/jrh.12360
- Office of Management and Budget (US). Budget of the United States Government, Fiscal Year 2025. Washington, DC: US Government Publishing Office; 2024. Available from: US Department of Veterans Affairs FY 2025 Budget Submission: Budget in Brief.
- US Department of Veterans Affairs. Veteran care claims. Accessed April 3, 2025. https://www.va.gov/COMMUNITYCARE/revenue-ops/Veteran-Care-Claims.asp
- US Centers for Medicare and Medicaid Services. Accessed April 3, 2025. Procedure price lookup https://www.medicare.gov/procedure-price-lookup
- US Department of Veterans Affairs. WellHive -Enterprise. Accessed April 3, 2025. https://department.va.gov/privacy/wp-content/uploads/sites/5/2023/05/FY23WellHiveEnterprisePIA.pdf
- US Centers for Medicare and Medicaid Services. RVU21a physician fee schedule, January 2021 release. Accessed April 3, 2025. https://www.cms.gov/medicaremedicare-fee-service-paymentphysicianfeeschedpfs-relative-value-files/rvu21a
- US Centers for Medicare and Medicaid Services. RVU22a physician fee schedule, January 2022 release. Accessed April 3, 2025. https://www.cms.gov/medicaremedicare-fee-service-paymentphysicianfeeschedpfs-relative-value-files/rvu22a
- US Centers for Medicare and Medicaid Services. RVU23a physician fee schedule, January 2023 release. Accessed April 3, 2025. https://www.cms.gov/medicare/medicare-fee-service-payment/physicianfeesched/pfs-relative-value-files/rvu23a
- US Centers for Medicare and Medicaid Services. RVU23a Medicare Physician Fee Schedule rates effective January 1, 2024, through March 8, 2024. Accessed on April 3, 2025. https://www.cms.gov/medicare/payment/fee-schedules/physician/pfs-relative-value-files/rvu24a
- Kenamond MC, Mourad WF, Randall ME, Kaushal A. No oncology patient left behind: challenges and solutions in rural radiation oncology. Lancet Reg Health Am. 2022;13:100289. doi:10.1016/j.lana.2022.100289
- Mattocks KM, Kroll-Desrosiers A, Kinney R, Elwy AR, Cunningham KJ, Mengeling MA. Understanding VA’s use of and relationships with community care providers under the MISSION Act. Med Care. 2021;59(Suppl 3):S252-S258. doi:10.1097/MLR.0000000000001545
- Hanks GE, Dunlap K. A comparison of the cost of various treatment methods for early cancer of the prostate. Int J Radiat Oncol Biol Phys. 1986;12(10):1879-1881. doi:10.1016/0360-3016(86)90334-2
- American Society of Radiation Oncology. Radiation oncology case rate program (ROCR). Accessed April 3, 2025. https://www.astro.org/advocacy/key-issues-8f3e5a3b76643265ee93287d79c4fc40/rocr
Community Care Radiation Oncology Cost Calculations for a VA Medical Center
Community Care Radiation Oncology Cost Calculations for a VA Medical Center
Contralateral Constrictor Dose Predicts Swallowing Function After Radiation for Head and Neck Cancer
Radiation therapy can cause long-term dysphagia that seriously affects quality of life for survivors of head and neck cancer. 1-3 Numerous studies have linked pharyngeal constrictor dose to long-term dysphagia, but conclusions about the dose distribution that can be safely tolerated have been inconsistent. For example, a group from the Netherlands found that the mean dose to the superior pharyngeal constrictor muscle and the supraglottic larynx were each predictive of dysphagia. 4 A subsequent Vanderbilt study refuted these findings, reporting that these structures were not predictive but that dose to the inferior pharyngeal constrictor muscle was. 5 Other studies have connected late dysphagia with dose to the middle pharyngeal constrictor muscle, total larynx, oral cavity, contralateral submandibular gland, contralateral parotid gland, or a combination of these structures. 6-14 NRG Oncology trials commonly evaluate dose to the “uninvolved pharynx,” which is the total pharyngeal constrictor muscle volume minus the planning target volume (PTV) for the lowest dose target volume. NRG head and neck trials 3, 4, 5, 6, 8, and 9 all use uninvolved pharynx mean dose ≤ 45 Gy as a constraint to judge radiation plan quality.
Differences in methodology or patient population may explain the inconsistency of prior studies on dosimetric predictors of dysphagia, but it is possible that these studies did not evaluate the optimal metric for dysphagia. This study evaluates a novel organ at risk, the contralateral pharyngeal constrictor muscle, to determine whether dose to this structure is predictive of late swallowing function. The study also compares a constraint based on this structure to the NRG uninvolved pharynx constraint mentioned earlier.
Methods
This study is a retrospective review of patients treated at the Richard L. Roudebush Veterans Affairs (VA) Medical Center in Indianapolis, Indiana. Patients were identified by searching the VA Cancer Registry for patients treated for head and neck squamous cell carcinoma between September 1, 2016, and August 30, 2019. Eligible sites included cancers of the nasopharynx, oropharynx, hypopharynx, larynx and oral cavity, as well as head and neck cancer of an unknown primary site. Only patients treated with primary radiation with concurrent systemic therapy were included. Patients were excluded if they had prior surgery or radiation to the head and neck.
The pharyngeal constrictor muscles were contoured per the techniques described by Bhide and colleagues.11 The contralateral constrictor was defined as the half of the constrictor volume contralateral to the primary site. For midline tumors, the side of the neck with a lower volume of lymph node metastases was judged to be the contralateral side.

One-year dysphagia was defined as having a gastronomy tube (G-tube) in place or an abnormal modified barium swallow (MBS) ≥ 12 months after the completion of radiation. At the study institution, MBS is not routinely done after therapy but is ordered if a patient or clinician has concerns about swallowing function. MBS was considered abnormal if there was laryngeal penetration that reached the level of the glottis or was not ejected from the larynx.
Results
The VA Cancer Registry identified 113 patients treated for head and neck cancer during the study period. Of these, 55 patients met the inclusion criteria. No patients were lost to follow-up. The median follow-up was 29 months. The median age was 67 years (range, 41-83) (Table 1). 
All patients were treated with intensity-modulated radiotherapy. Patients treated with a sequential boost had an initial dose of 54 Gy and/or 50 Gy, followed by a boost to a total of 70 Gy at 2 Gy per fraction. Patients treated with a simultaneous integrated boost (SIB) technique received 70.0 Gy in 33 fractions, with elective volumes treated to 54.5 Gy in 33 fractions. Both patients with nasopharyngeal cancer were treated with SIB plans and had an intermediate dose volume of 59.4 Gy.
Systemic therapy was weekly cisplatin in 41 patients (75%) and cetuximab in 14 (25%). Twenty percent of patients receiving cisplatin switched to an alternative agent during treatment, most commonly carboplatin.
Forty-nine patients (89%) had a G-tube placed before starting radiation. G-tubes were in place for an interval of 0 to 47 months (mean, 8.6); 12 (22%) had a G-tube > 12 months. After completion of radiation, 18 patients (33%) had an abnormal MBS. These were done 1 to 50 months (mean, 14.8) after completion of radiation. Abnormal MBS occurred ≥ 12 months after radiation in 9 patients, 5 of whom had their G-tube in place for less than a year.
Forty-six patients (84%) survived more than 1 year and could be evaluated for late swallowing function. One-year dysphagia was seen in 17 (37%) of these patients. Recurrence was seen in 20 patients (36%), with locoregional recurrence in 12 (60%) of these cases. Recurrence occurred at a range of 0 to 15 months (mean, 5.6). Neither recurrence (P = .69) nor locoregional recurrence (P = .11) was associated with increased dysphagia at 1 year.
In patients who could be evaluated for long-term swallowing function, contralateral constrictor V60 ranged from 0% to 100% (median, 51%). V60 was < 40% in 18 patients (39%). With V60 < 40%, there was a 6% rate of 1-year dysphagia compared with 57% for V60 ≥ 40% (P < .001).
Patients with contralateral constrictor V60 < 40 and V60 ≥ 40 both had a mean age of 65 years. χ2 analysis did not show a difference in T stage or systemic treatment but did show that patients with V60 < 40% were more likely to have N1 disease (P = .01), and less likely to have N2 disease (P = .01) compared with patients with V60 ≥ 40%. The difference in 1-year dysphagia between N0 to N1 patients (27%) and N2 to N3 patients (46%) was not statistically significant (P = .19).
In patients who could be evaluated for long-term swallowing function, the uninvolved pharynx volume median of the total constrictor volume was 32% (range, < 1%-62%). The uninvolved pharynx mean dose ranged from 28 to 68 Gy (median, 45). When the uninvolved pharynx mean dose was < 45 Gy, 1-year dysphagia was 22% compared with 52% with a dose ≥ 45 Gy (P = .03). 
Air cavity editing was performed in 27 patients (49%). One-year survival was 93% with air cavity editing, and 75% without, which was not statistically significant. Locoregional recurrence occurred in 3 patients (11%) with air cavity editing, and 9 (32%) without, which was not statistically significant. In patients surviving at least 1 year, contralateral constrictor V60 averaged 33% with editing and 62% without editing (P < .001). One-year dysphagia was 12% with air cavity editing and 67% without editing (P < .001).
An SIB technique was done in 26 patients (47%). One-year survival was 85% (n = 22) with SIB and 83% (n = 24) with sequential boost, which was not statistically significant. Locoregional recurrence occurred in 19% with SIB, and 32% with sequential boost, which was not statistically significant. For SIB patients alive at 1 year, the median contralateral V60 was 28%, compared with 66% for patients treated with sequential technique. Seventeen patients (77%) with SIB had V60 < 40%. Nineteen (86%) of SIB plans also had air cavity editing. One patient (5%) with SIB had dysphagia at 1 year compared with 16 (67%) sequential patients (P < .001).
Discussion
This is the first study to link contralateral constrictor dose to long-term dysphagia in patients treated with radiation for head and neck cancer. Editing the boost volume off air cavities was associated with lower contralateral constrictor V60 and with less long-term dysphagia. This may indicate that optimizing plans to meet a contralateral constrictor constraint can reduce rates of long-term dysphagia.
The most useful clinical predictors are those that identify a patient at low risk for toxicity. These constraints are useful because they reassure physicians that treatments will have a favorable risk/benefit ratio while identifying plans that may need modification before starting treatment.
The contralateral constrictor outperformed the uninvolved pharynx in identifying patients at low risk for long-term dysphagia. This difference could not be overcome by decreasing the threshold of the pharynx constraint, as 17% of patients with dysphagia had a mean dose of < 40 Gy to the uninvolved pharynx, which was not statistically significant. An advantage of contralateral constrictor is that it is independent of PTV size. The uninvolved pharynx structure depends on the PTV contour, so it may obscure a connection between PTV size and dysphagia.
In the context of a clinical trial, only measuring dose to the uninvolved pharynx may allow more plans to meet constraints, but even in NRG trials, physicians have some control over target volumes. For example, NRG HN009, a national trial for patients with head and neck cancer, recommends editing the CTV_7000 (clinical target volume treated to 70 Gy) off air cavities but does not define how much the volume should be cropped or specify protocol violations if the volume is not cropped.15 Furthermore, constraints used in clinical trials are often adopted for use outside the trial, where physicians have extensive control over target volumes.
The broad range of uninvolved pharynx volume relative to total constrictor volume confounds predictions using this variable. For example, according to the NRG constraint, a patient with an uninvolved pharynx mean dose of 44 Gy will have a low risk of dysphagia even if this structure is only 1% of the total constrictor. The contralateral constrictor is always about 50% of the total constrictor volume, which means that predictions using this structure will not be confounded by the same variation in volume size.
Figure 2 shows a representative patient who met the NRG uninvolved pharynx constraint but developed long-term dysphagia. 
Pharyngoesophageal stricture is a common cause of dysphagia after intensity-modulated radiotherapy for head and neck cancer.16 Radiation has been shown to decrease pharyngeal function in patients with head and neck cancer.17 Sparing one side of the pharynx may allow for better pharyngeal compliance throughout the length of the pharynx, possibly decreasing the rate of pharyngoesophageal stricture. Additionally, constraining the contralateral constrictor may preserve strength on this side, allowing it to compensate for weakness on the side of the primary cancer. An exercise sometimes used for dysphagia involves head rotation toward the affected side during swallowing. This technique has been shown to cause food to move to the unaffected side.18 Sparing the contralateral constrictor may help such techniques work better in patients with head and neck cancer.
Few studies have commented specifically on dose to swallowing structures contralateral to the primary tumor. Two studies have proposed contralateral submandibular gland constraints for dysphagia (not xerostomia), but neither measured the dose to the contralateral constrictor muscle.9,10 Although the contralateral submandibular dose may correlate with dose to the constrictor on that side, the submandibular gland may have a less direct impact on swallowing than the constrictor muscle, and its limited dimensions may make constraints based on the gland less robust for cancers outside the oropharynx.
Another study reported improved quality of life in patients who were not treated with elective contralateral retropharyngeal radiation.19 Although it is likely that doses to the contralateral constrictor were lower in patients who did not receive elective radiation to this area, this study did not measure or constrain doses to the contralateral constrictors.
Limitations
This study is limited by its single institution, retrospective design, small sample size, and by all patients being male. The high correlation between air cavity editing and the use of SIB makes it impossible to assess the impact of each technique individually. Patients with contralateral constrictor V60 < 40% were less likely to have N2 disease, but N2 to N3 disease did not predict higher 1-year dysphagia, so the difference in N-category cannot fully explain the difference in 1-year dysphagia. It is possible that unreported factors, such as CTV, may contribute significantly to swallowing function. Nevertheless, within the study population, contralateral constrictor dose was able to identify a group with a low rate of long-term dysphagia.
Conclusions
Contralateral constrictor dose is a promising predictor of late dysphagia for patients with head and neck cancer treated with radiation with concurrent systemic therapy. Contralateral constrictor V60 < 40% was able to identify a group of patients with a low rate of 1-year dysphagia in this single-center retrospective study. The correlation between air cavity editing and contralateral constrictor V60 suggests that contralateral constrictor dose may depend partly on technique. Further studies are needed to see if the contralateral constrictor dose can be used to predict long-term dysphagia prospectively and in other patient populations.
1. Langendijk JA, Doornaert P, Verdonck-de Leeuw IM, et al. Impact of late treatment-related toxicity on quality of life among patients with head and neck cancer treated with radiotherapy. J Clin Oncol. 2008;26(22):3770-3776. doi:10.1200/JCO.2007.14.6647
2. Nguyen NP, Frank C, Moltz CC, et al. Impact of dysphagia on quality of life after treatment of head-and-neck cancer. Int J Radiat Oncol Biol Phys. 2005;61(3):772-778. doi:10.1016/j.ijrobp.2004.06.017
3. Ramaekers BLT, Joore MA, Grutters JPC, et al. The impact of late treatment-toxicity on generic health-related quality of life in head and neck cancer patients after radiotherapy. Oral Oncol. 2011;47(8):768-774. doi:10.1016/j.oraloncology.2011.05.012
4. Christianen MEMC, Schilstra C, Beetz I, et al. Predictive modelling for swallowing dysfunction after primary (chemo)radiation: results of a prospective observational study. Radiother Oncol. 2012;105(1):107-114. doi:10.1016/j.radonc.2011.08.009
5. Vlachich G, Spratt DE, Diaz R, et al. Dose to inferior pharyngeal conctrictor predicts prolonged gastrostomy tube dependence with concurrent intensity-modulated radiation therapy and chemotherapy for locally-advanced head and neck cancer. Radiother Oncol. 2014;110(3):435-440. doi:10.1016/j.radonc.2013.12.007
6. Mogadas S, Busch CJ, Pflug Cet al. Influence of radiation dose to pharyngeal constrictor muscles on late dysphagia and quality of life in patients with locally advanced oropharyngeal carcinoma. Strahlenther Onkol. 2020;196(6):522-529. doi:10.1007/s00066-019-01572-0
7. Caglar HB, Tishler RB, Othus M, et al. Dose to larynx predicts of swallowing complications after intensity-modulated radiotherapy. Int J Radiat Oncol Biol Phys. 2008;72(4):1110-1118. doi:10.1016/j.ijrobp.2008.02.048
8. Schwartz DL, Hutcheson K, Barringer D, et al. Candidate dosimetric predictors of long-term swallowing dysfunction after oropharyngeal intensity-modulated radiotherapy. Int J Radiat Oncol Biol Phys. 2010;78(5):1356-1365. doi:10.1016/j.ijrobp.2009.10.002
9. Gensheimer MF, Nyflot M, Laramore GE, Laio JL, Parvathaneni U. Contribution of submandibular gland and swallowing structure sparing to post-radiation therapy peg dependence in oropharynx cancer patients treated with split-neck IMRT technique. Radiat Oncol. 2015;11(1):1-7. doi:10.1186/s13014-016-0726-3
10. Hedström J, Tuomi L, Finizia C, Olsson C. Identifying organs at risk for radiation-induced late dysphagia in head and neck cancer patients. Clin Transl Radiat Oncol. 2019;19:87-95. doi:10.1016/j.ctro.2019.08.005
11. Bhide SA, Gulliford S, Kazi R, et al. Correlation between dose to the pharyngeal constrictors and patient quality of life and late dysphagia following chemo-IMRT for head and neck cancer. Radiother Oncol. 2009;93(3):539-544. doi:10.1016/j.radonc.2009.09.017
12. Caudell JJ, Schaner PE, Desmond RA, Meredith RF, Spencer SA, Bonner JA. Dosimetric factors associated with long-term dysphagia after definitive radiotherapy for squamous cell carcinoma of the head and neck. Int J Radiat Oncol Biol Phys. 2010;76(2):403-409. doi:10.1016/j.ijrobp.2009.02.017
13. Levendag PC, Teguh DN, Voet P, et al. Dysphagia disorders in patients with cancer of the oropharynx are significantly affected by the radiation therapy dose to the superior and middle constrictor muscle: a dose-effect relationship. Radiother Oncol. 2007;85(1):64-73. doi:10.1016/j.radonc.2007.07.009
14. Eisbruch A, Schwartz M, Rasch C, et al. Dysphagia and aspiration after chemoradiotherapy for head-and-neck cancer: which anatomic structures are affected and can they be spared by IMRT? Int J Radiat Oncol Biol Phys. 2004;60(5):1425-1439. doi:10.1016/j.ijrobp.2004.05.050
15. Harari PM; NRG Oncology. Comparing high-dose cisplatin every three weeks to low-dose cisplatin weekly when combined with radiation for patients with advanced head and neck cancer. ClinicalTrials.gov identifier: NCT05050162. Updated November 25, 2022. Accessed December 7, 2022. https://clinicaltrials.gov/ct2/show/NCT05050162
16. Wang JJ, Goldsmith TA, Holman AS, Cianchetti M, Chan AW. Pharyngoesophageal stricture after treatment for head and neck cancer. Head Neck. 2011;34(7):967-973. doi:10.1002/hed.21842
17. Kendall KA, McKenzie SW, Leonard RJ, Jones CU. Timing of swallowing events after single-modality treatment of head and neck carcinoma with radiotherapy. Ann Otol Rhinol Laryngol. 2000;109(8, pt 1):767-775. doi:10.1177/000348940010900812
18. Ohmae Y, Ogura M, Kitahara S. Effects of head rotation on pharyngeal function during normal swallow. Ann Otol Rhinol Laryngol. 1998;107(4):344-348. doi:10.1177/000348949810700414
19. Spencer CR, Gay HA, Haughey BH, et al. Eliminating radiotherapy to the contralateral retropharyngeal and high level II lymph nodes in head and neck squamous cell carcinoma is safe and improves quality of life. Cancer. 2014;120(24):3994-4002. doi:10.1002/cncr.28938
Radiation therapy can cause long-term dysphagia that seriously affects quality of life for survivors of head and neck cancer. 1-3 Numerous studies have linked pharyngeal constrictor dose to long-term dysphagia, but conclusions about the dose distribution that can be safely tolerated have been inconsistent. For example, a group from the Netherlands found that the mean dose to the superior pharyngeal constrictor muscle and the supraglottic larynx were each predictive of dysphagia. 4 A subsequent Vanderbilt study refuted these findings, reporting that these structures were not predictive but that dose to the inferior pharyngeal constrictor muscle was. 5 Other studies have connected late dysphagia with dose to the middle pharyngeal constrictor muscle, total larynx, oral cavity, contralateral submandibular gland, contralateral parotid gland, or a combination of these structures. 6-14 NRG Oncology trials commonly evaluate dose to the “uninvolved pharynx,” which is the total pharyngeal constrictor muscle volume minus the planning target volume (PTV) for the lowest dose target volume. NRG head and neck trials 3, 4, 5, 6, 8, and 9 all use uninvolved pharynx mean dose ≤ 45 Gy as a constraint to judge radiation plan quality.
Differences in methodology or patient population may explain the inconsistency of prior studies on dosimetric predictors of dysphagia, but it is possible that these studies did not evaluate the optimal metric for dysphagia. This study evaluates a novel organ at risk, the contralateral pharyngeal constrictor muscle, to determine whether dose to this structure is predictive of late swallowing function. The study also compares a constraint based on this structure to the NRG uninvolved pharynx constraint mentioned earlier.
Methods
This study is a retrospective review of patients treated at the Richard L. Roudebush Veterans Affairs (VA) Medical Center in Indianapolis, Indiana. Patients were identified by searching the VA Cancer Registry for patients treated for head and neck squamous cell carcinoma between September 1, 2016, and August 30, 2019. Eligible sites included cancers of the nasopharynx, oropharynx, hypopharynx, larynx and oral cavity, as well as head and neck cancer of an unknown primary site. Only patients treated with primary radiation with concurrent systemic therapy were included. Patients were excluded if they had prior surgery or radiation to the head and neck.
The pharyngeal constrictor muscles were contoured per the techniques described by Bhide and colleagues.11 The contralateral constrictor was defined as the half of the constrictor volume contralateral to the primary site. For midline tumors, the side of the neck with a lower volume of lymph node metastases was judged to be the contralateral side.
One-year dysphagia was defined as having a gastronomy tube (G-tube) in place or an abnormal modified barium swallow (MBS) ≥ 12 months after the completion of radiation. At the study institution, MBS is not routinely done after therapy but is ordered if a patient or clinician has concerns about swallowing function. MBS was considered abnormal if there was laryngeal penetration that reached the level of the glottis or was not ejected from the larynx.
Results
The VA Cancer Registry identified 113 patients treated for head and neck cancer during the study period. Of these, 55 patients met the inclusion criteria. No patients were lost to follow-up. The median follow-up was 29 months. The median age was 67 years (range, 41-83) (Table 1).
All patients were treated with intensity-modulated radiotherapy. Patients treated with a sequential boost had an initial dose of 54 Gy and/or 50 Gy, followed by a boost to a total of 70 Gy at 2 Gy per fraction. Patients treated with a simultaneous integrated boost (SIB) technique received 70.0 Gy in 33 fractions, with elective volumes treated to 54.5 Gy in 33 fractions. Both patients with nasopharyngeal cancer were treated with SIB plans and had an intermediate dose volume of 59.4 Gy.
Systemic therapy was weekly cisplatin in 41 patients (75%) and cetuximab in 14 (25%). Twenty percent of patients receiving cisplatin switched to an alternative agent during treatment, most commonly carboplatin.
Forty-nine patients (89%) had a G-tube placed before starting radiation. G-tubes were in place for an interval of 0 to 47 months (mean, 8.6); 12 (22%) had a G-tube > 12 months. After completion of radiation, 18 patients (33%) had an abnormal MBS. These were done 1 to 50 months (mean, 14.8) after completion of radiation. Abnormal MBS occurred ≥ 12 months after radiation in 9 patients, 5 of whom had their G-tube in place for less than a year.
Forty-six patients (84%) survived more than 1 year and could be evaluated for late swallowing function. One-year dysphagia was seen in 17 (37%) of these patients. Recurrence was seen in 20 patients (36%), with locoregional recurrence in 12 (60%) of these cases. Recurrence occurred at a range of 0 to 15 months (mean, 5.6). Neither recurrence (P = .69) nor locoregional recurrence (P = .11) was associated with increased dysphagia at 1 year.
In patients who could be evaluated for long-term swallowing function, contralateral constrictor V60 ranged from 0% to 100% (median, 51%). V60 was < 40% in 18 patients (39%). With V60 < 40%, there was a 6% rate of 1-year dysphagia compared with 57% for V60 ≥ 40% (P < .001).
Patients with contralateral constrictor V60 < 40 and V60 ≥ 40 both had a mean age of 65 years. χ2 analysis did not show a difference in T stage or systemic treatment but did show that patients with V60 < 40% were more likely to have N1 disease (P = .01), and less likely to have N2 disease (P = .01) compared with patients with V60 ≥ 40%. The difference in 1-year dysphagia between N0 to N1 patients (27%) and N2 to N3 patients (46%) was not statistically significant (P = .19).
In patients who could be evaluated for long-term swallowing function, the uninvolved pharynx volume median of the total constrictor volume was 32% (range, < 1%-62%). The uninvolved pharynx mean dose ranged from 28 to 68 Gy (median, 45). When the uninvolved pharynx mean dose was < 45 Gy, 1-year dysphagia was 22% compared with 52% with a dose ≥ 45 Gy (P = .03).
Air cavity editing was performed in 27 patients (49%). One-year survival was 93% with air cavity editing, and 75% without, which was not statistically significant. Locoregional recurrence occurred in 3 patients (11%) with air cavity editing, and 9 (32%) without, which was not statistically significant. In patients surviving at least 1 year, contralateral constrictor V60 averaged 33% with editing and 62% without editing (P < .001). One-year dysphagia was 12% with air cavity editing and 67% without editing (P < .001).
An SIB technique was done in 26 patients (47%). One-year survival was 85% (n = 22) with SIB and 83% (n = 24) with sequential boost, which was not statistically significant. Locoregional recurrence occurred in 19% with SIB, and 32% with sequential boost, which was not statistically significant. For SIB patients alive at 1 year, the median contralateral V60 was 28%, compared with 66% for patients treated with sequential technique. Seventeen patients (77%) with SIB had V60 < 40%. Nineteen (86%) of SIB plans also had air cavity editing. One patient (5%) with SIB had dysphagia at 1 year compared with 16 (67%) sequential patients (P < .001).
Discussion
This is the first study to link contralateral constrictor dose to long-term dysphagia in patients treated with radiation for head and neck cancer. Editing the boost volume off air cavities was associated with lower contralateral constrictor V60 and with less long-term dysphagia. This may indicate that optimizing plans to meet a contralateral constrictor constraint can reduce rates of long-term dysphagia.
The most useful clinical predictors are those that identify a patient at low risk for toxicity. These constraints are useful because they reassure physicians that treatments will have a favorable risk/benefit ratio while identifying plans that may need modification before starting treatment.
The contralateral constrictor outperformed the uninvolved pharynx in identifying patients at low risk for long-term dysphagia. This difference could not be overcome by decreasing the threshold of the pharynx constraint, as 17% of patients with dysphagia had a mean dose of < 40 Gy to the uninvolved pharynx, which was not statistically significant. An advantage of contralateral constrictor is that it is independent of PTV size. The uninvolved pharynx structure depends on the PTV contour, so it may obscure a connection between PTV size and dysphagia.
In the context of a clinical trial, only measuring dose to the uninvolved pharynx may allow more plans to meet constraints, but even in NRG trials, physicians have some control over target volumes. For example, NRG HN009, a national trial for patients with head and neck cancer, recommends editing the CTV_7000 (clinical target volume treated to 70 Gy) off air cavities but does not define how much the volume should be cropped or specify protocol violations if the volume is not cropped.15 Furthermore, constraints used in clinical trials are often adopted for use outside the trial, where physicians have extensive control over target volumes.
The broad range of uninvolved pharynx volume relative to total constrictor volume confounds predictions using this variable. For example, according to the NRG constraint, a patient with an uninvolved pharynx mean dose of 44 Gy will have a low risk of dysphagia even if this structure is only 1% of the total constrictor. The contralateral constrictor is always about 50% of the total constrictor volume, which means that predictions using this structure will not be confounded by the same variation in volume size.
Figure 2 shows a representative patient who met the NRG uninvolved pharynx constraint but developed long-term dysphagia.
Pharyngoesophageal stricture is a common cause of dysphagia after intensity-modulated radiotherapy for head and neck cancer.16 Radiation has been shown to decrease pharyngeal function in patients with head and neck cancer.17 Sparing one side of the pharynx may allow for better pharyngeal compliance throughout the length of the pharynx, possibly decreasing the rate of pharyngoesophageal stricture. Additionally, constraining the contralateral constrictor may preserve strength on this side, allowing it to compensate for weakness on the side of the primary cancer. An exercise sometimes used for dysphagia involves head rotation toward the affected side during swallowing. This technique has been shown to cause food to move to the unaffected side.18 Sparing the contralateral constrictor may help such techniques work better in patients with head and neck cancer.
Few studies have commented specifically on dose to swallowing structures contralateral to the primary tumor. Two studies have proposed contralateral submandibular gland constraints for dysphagia (not xerostomia), but neither measured the dose to the contralateral constrictor muscle.9,10 Although the contralateral submandibular dose may correlate with dose to the constrictor on that side, the submandibular gland may have a less direct impact on swallowing than the constrictor muscle, and its limited dimensions may make constraints based on the gland less robust for cancers outside the oropharynx.
Another study reported improved quality of life in patients who were not treated with elective contralateral retropharyngeal radiation.19 Although it is likely that doses to the contralateral constrictor were lower in patients who did not receive elective radiation to this area, this study did not measure or constrain doses to the contralateral constrictors.
Limitations
This study is limited by its single institution, retrospective design, small sample size, and by all patients being male. The high correlation between air cavity editing and the use of SIB makes it impossible to assess the impact of each technique individually. Patients with contralateral constrictor V60 < 40% were less likely to have N2 disease, but N2 to N3 disease did not predict higher 1-year dysphagia, so the difference in N-category cannot fully explain the difference in 1-year dysphagia. It is possible that unreported factors, such as CTV, may contribute significantly to swallowing function. Nevertheless, within the study population, contralateral constrictor dose was able to identify a group with a low rate of long-term dysphagia.
Conclusions
Contralateral constrictor dose is a promising predictor of late dysphagia for patients with head and neck cancer treated with radiation with concurrent systemic therapy. Contralateral constrictor V60 < 40% was able to identify a group of patients with a low rate of 1-year dysphagia in this single-center retrospective study. The correlation between air cavity editing and contralateral constrictor V60 suggests that contralateral constrictor dose may depend partly on technique. Further studies are needed to see if the contralateral constrictor dose can be used to predict long-term dysphagia prospectively and in other patient populations.
1. Langendijk JA, Doornaert P, Verdonck-de Leeuw IM, et al. Impact of late treatment-related toxicity on quality of life among patients with head and neck cancer treated with radiotherapy. J Clin Oncol. 2008;26(22):3770-3776. doi:10.1200/JCO.2007.14.6647
2. Nguyen NP, Frank C, Moltz CC, et al. Impact of dysphagia on quality of life after treatment of head-and-neck cancer. Int J Radiat Oncol Biol Phys. 2005;61(3):772-778. doi:10.1016/j.ijrobp.2004.06.017
3. Ramaekers BLT, Joore MA, Grutters JPC, et al. The impact of late treatment-toxicity on generic health-related quality of life in head and neck cancer patients after radiotherapy. Oral Oncol. 2011;47(8):768-774. doi:10.1016/j.oraloncology.2011.05.012
4. Christianen MEMC, Schilstra C, Beetz I, et al. Predictive modelling for swallowing dysfunction after primary (chemo)radiation: results of a prospective observational study. Radiother Oncol. 2012;105(1):107-114. doi:10.1016/j.radonc.2011.08.009
5. Vlachich G, Spratt DE, Diaz R, et al. Dose to inferior pharyngeal conctrictor predicts prolonged gastrostomy tube dependence with concurrent intensity-modulated radiation therapy and chemotherapy for locally-advanced head and neck cancer. Radiother Oncol. 2014;110(3):435-440. doi:10.1016/j.radonc.2013.12.007
6. Mogadas S, Busch CJ, Pflug Cet al. Influence of radiation dose to pharyngeal constrictor muscles on late dysphagia and quality of life in patients with locally advanced oropharyngeal carcinoma. Strahlenther Onkol. 2020;196(6):522-529. doi:10.1007/s00066-019-01572-0
7. Caglar HB, Tishler RB, Othus M, et al. Dose to larynx predicts of swallowing complications after intensity-modulated radiotherapy. Int J Radiat Oncol Biol Phys. 2008;72(4):1110-1118. doi:10.1016/j.ijrobp.2008.02.048
8. Schwartz DL, Hutcheson K, Barringer D, et al. Candidate dosimetric predictors of long-term swallowing dysfunction after oropharyngeal intensity-modulated radiotherapy. Int J Radiat Oncol Biol Phys. 2010;78(5):1356-1365. doi:10.1016/j.ijrobp.2009.10.002
9. Gensheimer MF, Nyflot M, Laramore GE, Laio JL, Parvathaneni U. Contribution of submandibular gland and swallowing structure sparing to post-radiation therapy peg dependence in oropharynx cancer patients treated with split-neck IMRT technique. Radiat Oncol. 2015;11(1):1-7. doi:10.1186/s13014-016-0726-3
10. Hedström J, Tuomi L, Finizia C, Olsson C. Identifying organs at risk for radiation-induced late dysphagia in head and neck cancer patients. Clin Transl Radiat Oncol. 2019;19:87-95. doi:10.1016/j.ctro.2019.08.005
11. Bhide SA, Gulliford S, Kazi R, et al. Correlation between dose to the pharyngeal constrictors and patient quality of life and late dysphagia following chemo-IMRT for head and neck cancer. Radiother Oncol. 2009;93(3):539-544. doi:10.1016/j.radonc.2009.09.017
12. Caudell JJ, Schaner PE, Desmond RA, Meredith RF, Spencer SA, Bonner JA. Dosimetric factors associated with long-term dysphagia after definitive radiotherapy for squamous cell carcinoma of the head and neck. Int J Radiat Oncol Biol Phys. 2010;76(2):403-409. doi:10.1016/j.ijrobp.2009.02.017
13. Levendag PC, Teguh DN, Voet P, et al. Dysphagia disorders in patients with cancer of the oropharynx are significantly affected by the radiation therapy dose to the superior and middle constrictor muscle: a dose-effect relationship. Radiother Oncol. 2007;85(1):64-73. doi:10.1016/j.radonc.2007.07.009
14. Eisbruch A, Schwartz M, Rasch C, et al. Dysphagia and aspiration after chemoradiotherapy for head-and-neck cancer: which anatomic structures are affected and can they be spared by IMRT? Int J Radiat Oncol Biol Phys. 2004;60(5):1425-1439. doi:10.1016/j.ijrobp.2004.05.050
15. Harari PM; NRG Oncology. Comparing high-dose cisplatin every three weeks to low-dose cisplatin weekly when combined with radiation for patients with advanced head and neck cancer. ClinicalTrials.gov identifier: NCT05050162. Updated November 25, 2022. Accessed December 7, 2022. https://clinicaltrials.gov/ct2/show/NCT05050162
16. Wang JJ, Goldsmith TA, Holman AS, Cianchetti M, Chan AW. Pharyngoesophageal stricture after treatment for head and neck cancer. Head Neck. 2011;34(7):967-973. doi:10.1002/hed.21842
17. Kendall KA, McKenzie SW, Leonard RJ, Jones CU. Timing of swallowing events after single-modality treatment of head and neck carcinoma with radiotherapy. Ann Otol Rhinol Laryngol. 2000;109(8, pt 1):767-775. doi:10.1177/000348940010900812
18. Ohmae Y, Ogura M, Kitahara S. Effects of head rotation on pharyngeal function during normal swallow. Ann Otol Rhinol Laryngol. 1998;107(4):344-348. doi:10.1177/000348949810700414
19. Spencer CR, Gay HA, Haughey BH, et al. Eliminating radiotherapy to the contralateral retropharyngeal and high level II lymph nodes in head and neck squamous cell carcinoma is safe and improves quality of life. Cancer. 2014;120(24):3994-4002. doi:10.1002/cncr.28938
Contralateral Constrictor Dose Predicts Swallowing Function After Radiation for Head and Neck Cancer
Radiation therapy can cause long-term dysphagia that seriously affects quality of life for survivors of head and neck (H&N) cancer.1-3 Numerous studies have linked pharyngeal constrictor dose to long-term dysphagia, but conclusions about the dose distribution that can be safely tolerated have been inconsistent. For example, a group from the Netherlands found that the mean dose to the superior pharyngeal constrictor muscle and the supraglottic larynx were each predictive of dysphagia.4 A subsequent Vanderbilt study refuted these findings, reporting that these structures were not predictive but that dose to the inferior pharyngeal constrictor muscle was.5 Other studies have connected late dysphagia with dose to the middle pharyngeal constrictor muscle, total larynx, oral cavity, contralateral submandibular gland, contralateral parotid gland, or a combination of these structures.6-14 NRG Oncology trials commonly evaluate dose to the “uninvolved pharynx,” which is the total pharyngeal constrictor muscle volume minus the planning target volume for the lowest dose target volume. NRG H&N trials 3, 4, 5, 6, 8, and 9 all use uninvolved pharynx mean dose ≤ 45 Gy as a constraint to judge radiation plan quality.
Differences in methodology or patient population may explain the inconsistency of prior studies on dosimetric predictors of dysphagia, but it is possible that these studies did not evaluate the optimal metric for dysphagia. This study evaluates a novel organ at risk, the contralateral pharyngeal constrictor muscle, to determine whether dose to this structure is predictive of late swallowing function. The study also compares a constraint based on this structure to the NRG uninvolved pharynx constraint mentioned earlier.
Methods
This study is a retrospective review of patients treated at the Richard L. Roudebush Veterans Affairs (VA) Medical Center in Indianapolis, Indiana. Patients were identified by searching the VA Cancer Registry for patients treated for H&N squamous cell carcinoma between September 1, 2016, and August 30, 2019. Eligible sites included cancers of the nasopharynx, oropharynx, hypopharynx, larynx and oral cavity, as well as H&N cancer of an unknown primary site. Only patients treated with primary radiation with concurrent systemic therapy were included. Patients were excluded if they had prior surgery or radiation to the H&N.
The pharyngeal constrictor muscles were contoured per the techniques described by Bhide and colleagues.11 The contralateral constrictor was defined as the half of the constrictor volume contralateral to the primary site. For midline tumors, the side of the neck with a lower volume of lymph node metastases was judged to be the contralateral side. 
One-year dysphagia was defined as having a gastronomy tube (G-tube) in place or an abnormal modified barium swallow (MBS) ≥ 12 months after the completion of radiation. At the study institution, MBS is not routinely done after therapy but is ordered if a patient or clinician has concerns about swallowing function. MBS was considered abnormal if there was laryngeal penetration that reached the level of the glottis or was not ejected from the larynx.
Results
The VA Cancer Registry identified 113 patients treated for H&N cancer during the study period. Of these, 55 patients met the inclusion criteria. No patients were lost to follow-up. The median follow-up was 29 months. The median age was 67 years (range, 41-83) (Table 1). 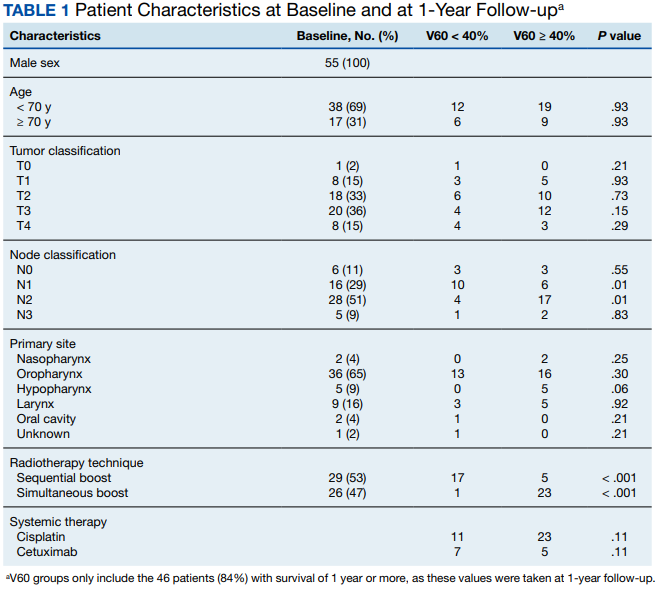
All patients were treated with intensity-modulated radiotherapy (IMRT). Patients treated with a sequential boost had an initial dose of 54 Gy and/or 50 Gy, followed by a boost to a total of 70 Gy at 2 Gy per fraction. Patients treated with a simultaneous integrated boost (SIB) technique received 69.96 Gy in 33 fractions, with elective volumes treated to 54.45 Gy in 33 fractions. Both patients with nasopharyngeal cancer were treated with SIB plans and had an intermediate dose volume of 59.4 Gy.
Systemic therapy was weekly cisplatin in 41 patients (75%) and cetuximab in 14 (25%). Twenty percent of patients receiving cisplatin switched to an alternative agent during treatment, most commonly carboplatin.
Forty-nine patients (89%) had a G-tube placed before starting radiation. G-tubes were in place for an interval of 0 to 47 months (mean, 8.6); 12 (22%) had a G-tube > 12 months. After completion of radiation, 18 patients (33%) had an abnormal MBS. These were done 1 to 50 months (mean, 14.8) after completion of radiation. Abnormal MBS occurred ≥ 12 months after radiation in 9 patients, 5 of whom had their G-tube in place for less than a year.
Forty-six patients (84%) survived more than 1 year and could be evaluated for late swallowing function. One-year dysphagia was seen in 17 (37%) of these patients. Recurrence was seen in 20 patients (36%), with locoregional recurrence in 12 (60%) of these cases. Recurrence occurred at a range of 0 to 15 months (mean, 5.6). Neither recurrence (P = .69) nor locoregional recurrence (P = .11) was associated with increased 1-year dysphagia.
In patients who could be evaluated for long-term swallowing function, contralateral constrictor V60 ranged from 0% to 100% (median, 51%). V60 was < 40% in 18 patients (39%). With V60 < 40%, there was a 6% rate of 1-year dysphagia compared with 57% for V60 ≥ 40% (P < .001).
Patients with contralateral constrictor V60 < 40 and V60 ≥ 40 both had a mean age of 65 years. χ2 analysis did not show a difference in T stage or systemic treatment but did show that patients with V60 < 40% were more likely to have N1 disease (P = .01), and less likely to have N2 disease (P = .01) compared with patients with V60 ≥ 40%. The difference in 1-year dysphagia between N0 to N1 patients (27%) and N2 to N3 patients (46%) was not statistically significant (P = .19).
In patients who could be evaluated for long-term swallowing function, the uninvolved pharynx volume median of the total constrictor volume was 32% (range, < 1%-62%). The uninvolved pharynx mean dose ranged from 28 to 68 Gy (median, 45). When the uninvolved pharynx mean dose was < 45 Gy, 1-year dysphagia was 22% compared with 52% with a dose ≥ 45 Gy (P = .03).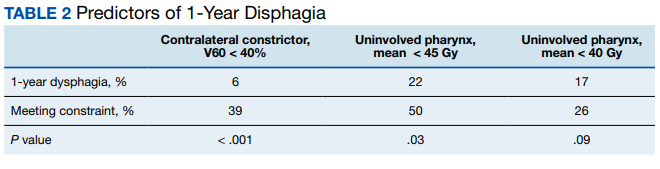
Air cavity editing was performed in 27 patients (49%). One-year survival was 93% with air cavity editing, and 75% without, which was not statistically significant. Locoregional recurrence occurred in 3 patients (11%) with air cavity editing, and 9 (32%) without, which was not statistically significant. In patients surviving at least 1 year, contralateral constrictor V60 averaged 33% with editing and 62% without editing (P < .001). One-year dysphagia was 12% with air cavity editing and 67% without editing (P < .001).
An SIB technique was done in 26 patients (47%). One-year survival was 85% (n = 22) with SIB and 83% (n = 24) with sequential boost, which was not statistically significant. Locoregional recurrence occurred in 19% with SIB, and 32% with sequential boost, which was not statistically significant. For SIB patients alive at 1 year, the median contralateral V60 was 28%, compared with 66% for patients treated with sequential technique. Seventeen patients (77%) with SIB had V60 < 40%. Nineteen (86%) of SIB plans also had air cavity editing. One patient (5%) with SIB had dysphagia at 1 year, compared with 16 (67%) sequential patients (P < .001).
Discussion
This is the first study to link contralateral constrictor dose to long-term dysphagia in patients treated with radiation for H&N cancer. Editing the boost volume off air cavities was associated with lower contralateral constrictor V60 and with less long-term dysphagia. This may indicate that optimizing plans to meet a contralateral constrictor constraint can reduce rates of long-term dysphagia.
The most useful clinical predictors are those that identify a patient at low risk for toxicity. These constraints are useful because they reassure physicians that treatments will have a favorable risk/benefit ratio while identifying plans that may need modification before starting treatment.
The contralateral constrictor outperformed the uninvolved pharynx in identifying patients at low risk for long-term dysphagia. This difference could not be overcome by decreasing the threshold of the pharynx constraint, as 17% of patients with dysphagia had a mean dose of < 40 Gy to the uninvolved pharynx, which was not statistically significant.
An advantage of contralateral constrictor is that it is independent of planning target volume (PTV) size. The uninvolved pharynx structure depends on the PTV contour, so it may obscure a connection between PTV size and dysphagia.
In the context of a clinical trial, only measuring dose to the uninvolved pharynx may allow more plans to meet constraints, but even in NRG trials, physicians have some control over target volumes. For example, NRG HN009, a national trial for patients with H&N cancer, recommends editing the CTV_7000 (clinical target volume treated to 70 Gy) off air cavities but does not define how much the volume should be cropped or specify protocol violations if the volume is not cropped.15 Furthermore, constraints used in clinical trials are often adopted for use outside the trial, where physicians have extensive control over target volumes.
The broad range of uninvolved pharynx volume relative to total constrictor volume confounds predictions using this variable. For example, according to the NRG constraint, a patient with an uninvolved pharynx mean dose of 44 Gy will have a low risk of dysphagia even if this structure is only 1% of the total constrictor. The contralateral constrictor is always about 50% of the total constrictor volume, which means that predictions using this structure will not be confounded by the same variation in volume size.
Figure 2 shows a representative patient who met the NRG uninvolved pharynx constraint but developed long-term dysphagia. 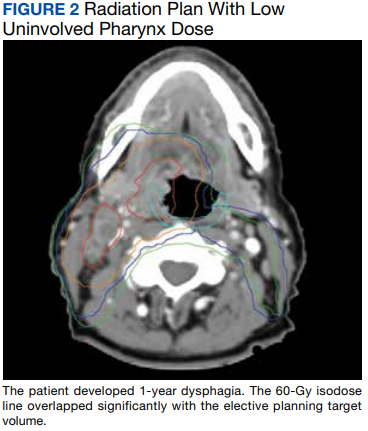
Pharyngoesophageal stricture is a common cause of dysphagia after IMRT for H&N cancer.16 Radiation has been shown to decrease pharyngeal function in patients with H&N cancer.17 Sparing one side of the pharynx may allow for better pharyngeal compliance throughout the length of the pharynx, possibly decreasing the rate of pharyngoesophageal stricture. Additionally, constraining the contralateral constrictor may preserve strength on this side, allowing it to compensate for weakness on the side of the primary cancer. An exercise sometimes used for dysphagia involves head rotation toward the affected side during swallowing. This technique has been shown to cause food to move to the unaffected side.18 Sparing the contralateral constrictor may help such techniques work better in patients with H&N cancer.
Few studies have commented specifically on dose to swallowing structures contralateral to the primary tumor. Two studies have proposed contralateral submandibular gland constraints for dysphagia (not xerostomia), but neither measured the dose to the contralateral constrictor muscle.9,10 Although the contralateral submandibular dose may correlate with dose to the constrictor on that side, the submandibular gland may have a less direct impact on swallowing than the constrictor muscle, and its limited dimensions may make constraints based on the gland less robust for cancers outside the oropharynx.
Another study reported improved quality of life in patients who were not treated with elective contralateral retropharyngeal radiation.19 Although it is likely that doses to the contralateral constrictor were lower in patients who did not receive elective radiation to this area, this study did not measure or constrain doses to the contralateral constrictors.
Limitations
This study is limited by its single institution, retrospective design, small sample size, and by all patients being male. The high correlation between air cavity editing and the use of SIB makes it impossible to assess the impact of each technique individually. Patients with contralateral constrictor V60 < 40% were less likely to have N2 disease, but N2 to N3 disease did not predict higher 1-year dysphagia, so the difference in N-category cannot fully explain the difference in 1-year dysphagia. It is possible that unreported factors, such as CTV, may contribute significantly to swallowing function. Nevertheless, within the study population, contralateral constrictor dose was able to identify a group with a low rate of long-term dysphagia.
Conclusions
Contralateral constrictor dose is a promising predictor of late dysphagia for patients with H&N cancer treated with radiation with concurrent systemic therapy. Contralateral constrictor V60 < 40% was able to identify a group of patients with a low rate of 1-year dysphagia in this single-center retrospective study. The correlation between air cavity editing and contralateral constrictor V60 suggests that contralateral constrictor dose may depend partly on technique. Further studies are needed to see if the contralateral constrictor dose can be used to predict long-term dysphagia prospectively and in other patient populations.
1. Langendijk JA, Doornaert P, Verdonck-de Leeuw IM, et al. Impact of late treatment-related toxicity on quality of life among patients with head and neck cancer treated with radiotherapy. J Clin Oncol. 2008;26(22):3770-3776. doi:10.1200/JCO.2007.14.6647
2. Nguyen NP, Frank C, Moltz CC, et al. Impact of dysphagia on quality of life after treatment of head-and-neck cancer. Int J Radiat Oncol Biol Phys. 2005;61(3):772-778. doi:10.1016/j.ijrobp.2004.06.017
3. Ramaekers BLT, Joore MA, Grutters JPC, et al. The impact of late treatment-toxicity on generic health-related quality of life in head and neck cancer patients after radiotherapy. Oral Oncol. 2011;47(8):768-774. doi:10.1016/j.oraloncology.2011.05.012
4. Christianen MEMC, Schilstra C, Beetz I, et al. Predictive modelling for swallowing dysfunction after primary (chemo)radiation: results of a prospective observational study. Radiother Oncol. 2012;105(1):107-114. doi:10.1016/j.radonc.2011.08.009
5. Vlachich G, Spratt DE, Diaz R, et al. Dose to inferior pharyngeal conctrictor predicts prolonged gastrostomy tube dependence with concurrent intensity-modulated radiation therapy and chemotherapy for locally-advanced head and neck cancer. Radiother Oncol. 2014;110(3):435-440. doi:10.1016/j.radonc.2013.12.007
6. Mogadas S, Busch CJ, Pflug Cet al. Influence of radiation dose to pharyngeal constrictor muscles on late dysphagia and quality of life in patients with locally advanced oropharyngeal carcinoma. Strahlenther Onkol. 2020;196(6):522-529. doi:10.1007/s00066-019-01572-0
7. Caglar HB, Tishler RB, Othus M, et al. Dose to larynx predicts of swallowing complications after intensity-modulated radiotherapy. Int J Radiat Oncol Biol Phys. 2008;72(4):1110-1118. doi:10.1016/j.ijrobp.2008.02.048
8. Schwartz DL, Hutcheson K, Barringer D, et al. Candidate dosimetric predictors of long-term swallowing dysfunction after oropharyngeal intensity-modulated radiotherapy. Int J Radiat Oncol Biol Phys. 2010;78(5):1356-1365. doi:10.1016/j.ijrobp.2009.10.002
9. Gensheimer MF, Nyflot M, Laramore GE, Laio JL, Parvathaneni U. Contribution of submandibular gland and swallowing structure sparing to post-radiation therapy peg dependence in oropharynx cancer patients treated with split-neck IMRT technique. Radiat Oncol. 2015;11(1):1-7. doi:10.1186/s13014-016-0726-3
10. Hedström J, Tuomi L, Finizia C, Olsson C. Identifying organs at risk for radiation-induced late dysphagia in head and neck cancer patients. Clin Transl Radiat Oncol. 2019;19:87-95. doi:10.1016/j.ctro.2019.08.005
11. Bhide SA, Gulliford S, Kazi R, et al. Correlation between dose to the pharyngeal constrictors and patient quality of life and late dysphagia following chemo-IMRT for head and neck cancer. Radiother Oncol. 2009;93(3):539-544. doi:10.1016/j.radonc.2009.09.017
12. Caudell JJ, Schaner PE, Desmond RA, Meredith RF, Spencer SA, Bonner JA. Dosimetric factors associated with long-term dysphagia after definitive radiotherapy for squamous cell carcinoma of the head and neck. Int J Radiat Oncol Biol Phys. 2010;76(2):403-409. doi:10.1016/j.ijrobp.2009.02.017
13. Levendag PC, Teguh DN, Voet P, et al. Dysphagia disorders in patients with cancer of the oropharynx are significantly affected by the radiation therapy dose to the superior and middle constrictor muscle: a dose-effect relationship. Radiother Oncol. 2007;85(1):64-73. doi:10.1016/j.radonc.2007.07.009
14. Eisbruch A, Schwartz M, Rasch C, et al. Dysphagia and aspiration after chemoradiotherapy for head-and-neck cancer: which anatomic structures are affected and can they be spared by IMRT? Int J Radiat Oncol Biol Phys. 2004;60(5):1425-1439. doi:10.1016/j.ijrobp.2004.05.050
15. Harari PM; NRG Oncology. Comparing high-dose cisplatin every three weeks to low-dose cisplatin weekly when combined with radiation for patients with advanced head and neck cancer. ClinicalTrials.gov identifier: NCT05050162. Updated November 25, 2022. Accessed December 7, 2022. https://clinicaltrials.gov/ct2/show/NCT05050162
16. Wang JJ, Goldsmith TA, Holman AS, Cianchetti M, Chan AW. Pharyngoesophageal stricture after treatment for head and neck cancer. Head Neck. 2011;34(7):967-973. doi:10.1002/hed.21842
17. Kendall KA, McKenzie SW, Leonard RJ, Jones CU. Timing of swallowing events after single-modality treatment of head and neck carcinoma with radiotherapy. Ann Otol Rhinol Laryngol. 2000;109(8, pt 1):767-775. doi:10.1177/000348940010900812
18. Ohmae Y, Ogura M, Kitahara S. Effects of head rotation on pharyngeal function during normal swallow. Ann Otol Rhinol Laryngol. 1998;107(4):344-348. doi:10.1177/000348949810700414
19. Spencer CR, Gay HA, Haughey BH, et al. Eliminating radiotherapy to the contralateral retropharyngeal and high level II lymph nodes in head and neck squamous cell carcinoma is safe and improves quality of life. Cancer. 2014;120(24):3994-4002. doi:10.1002/cncr.28938
Radiation therapy can cause long-term dysphagia that seriously affects quality of life for survivors of head and neck (H&N) cancer.1-3 Numerous studies have linked pharyngeal constrictor dose to long-term dysphagia, but conclusions about the dose distribution that can be safely tolerated have been inconsistent. For example, a group from the Netherlands found that the mean dose to the superior pharyngeal constrictor muscle and the supraglottic larynx were each predictive of dysphagia.4 A subsequent Vanderbilt study refuted these findings, reporting that these structures were not predictive but that dose to the inferior pharyngeal constrictor muscle was.5 Other studies have connected late dysphagia with dose to the middle pharyngeal constrictor muscle, total larynx, oral cavity, contralateral submandibular gland, contralateral parotid gland, or a combination of these structures.6-14 NRG Oncology trials commonly evaluate dose to the “uninvolved pharynx,” which is the total pharyngeal constrictor muscle volume minus the planning target volume for the lowest dose target volume. NRG H&N trials 3, 4, 5, 6, 8, and 9 all use uninvolved pharynx mean dose ≤ 45 Gy as a constraint to judge radiation plan quality.
Differences in methodology or patient population may explain the inconsistency of prior studies on dosimetric predictors of dysphagia, but it is possible that these studies did not evaluate the optimal metric for dysphagia. This study evaluates a novel organ at risk, the contralateral pharyngeal constrictor muscle, to determine whether dose to this structure is predictive of late swallowing function. The study also compares a constraint based on this structure to the NRG uninvolved pharynx constraint mentioned earlier.
Methods
This study is a retrospective review of patients treated at the Richard L. Roudebush Veterans Affairs (VA) Medical Center in Indianapolis, Indiana. Patients were identified by searching the VA Cancer Registry for patients treated for H&N squamous cell carcinoma between September 1, 2016, and August 30, 2019. Eligible sites included cancers of the nasopharynx, oropharynx, hypopharynx, larynx and oral cavity, as well as H&N cancer of an unknown primary site. Only patients treated with primary radiation with concurrent systemic therapy were included. Patients were excluded if they had prior surgery or radiation to the H&N.
The pharyngeal constrictor muscles were contoured per the techniques described by Bhide and colleagues.11 The contralateral constrictor was defined as the half of the constrictor volume contralateral to the primary site. For midline tumors, the side of the neck with a lower volume of lymph node metastases was judged to be the contralateral side.
One-year dysphagia was defined as having a gastronomy tube (G-tube) in place or an abnormal modified barium swallow (MBS) ≥ 12 months after the completion of radiation. At the study institution, MBS is not routinely done after therapy but is ordered if a patient or clinician has concerns about swallowing function. MBS was considered abnormal if there was laryngeal penetration that reached the level of the glottis or was not ejected from the larynx.
Results
The VA Cancer Registry identified 113 patients treated for H&N cancer during the study period. Of these, 55 patients met the inclusion criteria. No patients were lost to follow-up. The median follow-up was 29 months. The median age was 67 years (range, 41-83) (Table 1).
All patients were treated with intensity-modulated radiotherapy (IMRT). Patients treated with a sequential boost had an initial dose of 54 Gy and/or 50 Gy, followed by a boost to a total of 70 Gy at 2 Gy per fraction. Patients treated with a simultaneous integrated boost (SIB) technique received 69.96 Gy in 33 fractions, with elective volumes treated to 54.45 Gy in 33 fractions. Both patients with nasopharyngeal cancer were treated with SIB plans and had an intermediate dose volume of 59.4 Gy.
Systemic therapy was weekly cisplatin in 41 patients (75%) and cetuximab in 14 (25%). Twenty percent of patients receiving cisplatin switched to an alternative agent during treatment, most commonly carboplatin.
Forty-nine patients (89%) had a G-tube placed before starting radiation. G-tubes were in place for an interval of 0 to 47 months (mean, 8.6); 12 (22%) had a G-tube > 12 months. After completion of radiation, 18 patients (33%) had an abnormal MBS. These were done 1 to 50 months (mean, 14.8) after completion of radiation. Abnormal MBS occurred ≥ 12 months after radiation in 9 patients, 5 of whom had their G-tube in place for less than a year.
Forty-six patients (84%) survived more than 1 year and could be evaluated for late swallowing function. One-year dysphagia was seen in 17 (37%) of these patients. Recurrence was seen in 20 patients (36%), with locoregional recurrence in 12 (60%) of these cases. Recurrence occurred at a range of 0 to 15 months (mean, 5.6). Neither recurrence (P = .69) nor locoregional recurrence (P = .11) was associated with increased 1-year dysphagia.
In patients who could be evaluated for long-term swallowing function, contralateral constrictor V60 ranged from 0% to 100% (median, 51%). V60 was < 40% in 18 patients (39%). With V60 < 40%, there was a 6% rate of 1-year dysphagia compared with 57% for V60 ≥ 40% (P < .001).
Patients with contralateral constrictor V60 < 40 and V60 ≥ 40 both had a mean age of 65 years. χ2 analysis did not show a difference in T stage or systemic treatment but did show that patients with V60 < 40% were more likely to have N1 disease (P = .01), and less likely to have N2 disease (P = .01) compared with patients with V60 ≥ 40%. The difference in 1-year dysphagia between N0 to N1 patients (27%) and N2 to N3 patients (46%) was not statistically significant (P = .19).
In patients who could be evaluated for long-term swallowing function, the uninvolved pharynx volume median of the total constrictor volume was 32% (range, < 1%-62%). The uninvolved pharynx mean dose ranged from 28 to 68 Gy (median, 45). When the uninvolved pharynx mean dose was < 45 Gy, 1-year dysphagia was 22% compared with 52% with a dose ≥ 45 Gy (P = .03).
Air cavity editing was performed in 27 patients (49%). One-year survival was 93% with air cavity editing, and 75% without, which was not statistically significant. Locoregional recurrence occurred in 3 patients (11%) with air cavity editing, and 9 (32%) without, which was not statistically significant. In patients surviving at least 1 year, contralateral constrictor V60 averaged 33% with editing and 62% without editing (P < .001). One-year dysphagia was 12% with air cavity editing and 67% without editing (P < .001).
An SIB technique was done in 26 patients (47%). One-year survival was 85% (n = 22) with SIB and 83% (n = 24) with sequential boost, which was not statistically significant. Locoregional recurrence occurred in 19% with SIB, and 32% with sequential boost, which was not statistically significant. For SIB patients alive at 1 year, the median contralateral V60 was 28%, compared with 66% for patients treated with sequential technique. Seventeen patients (77%) with SIB had V60 < 40%. Nineteen (86%) of SIB plans also had air cavity editing. One patient (5%) with SIB had dysphagia at 1 year, compared with 16 (67%) sequential patients (P < .001).
Discussion
This is the first study to link contralateral constrictor dose to long-term dysphagia in patients treated with radiation for H&N cancer. Editing the boost volume off air cavities was associated with lower contralateral constrictor V60 and with less long-term dysphagia. This may indicate that optimizing plans to meet a contralateral constrictor constraint can reduce rates of long-term dysphagia.
The most useful clinical predictors are those that identify a patient at low risk for toxicity. These constraints are useful because they reassure physicians that treatments will have a favorable risk/benefit ratio while identifying plans that may need modification before starting treatment.
The contralateral constrictor outperformed the uninvolved pharynx in identifying patients at low risk for long-term dysphagia. This difference could not be overcome by decreasing the threshold of the pharynx constraint, as 17% of patients with dysphagia had a mean dose of < 40 Gy to the uninvolved pharynx, which was not statistically significant.
An advantage of contralateral constrictor is that it is independent of planning target volume (PTV) size. The uninvolved pharynx structure depends on the PTV contour, so it may obscure a connection between PTV size and dysphagia.
In the context of a clinical trial, only measuring dose to the uninvolved pharynx may allow more plans to meet constraints, but even in NRG trials, physicians have some control over target volumes. For example, NRG HN009, a national trial for patients with H&N cancer, recommends editing the CTV_7000 (clinical target volume treated to 70 Gy) off air cavities but does not define how much the volume should be cropped or specify protocol violations if the volume is not cropped.15 Furthermore, constraints used in clinical trials are often adopted for use outside the trial, where physicians have extensive control over target volumes.
The broad range of uninvolved pharynx volume relative to total constrictor volume confounds predictions using this variable. For example, according to the NRG constraint, a patient with an uninvolved pharynx mean dose of 44 Gy will have a low risk of dysphagia even if this structure is only 1% of the total constrictor. The contralateral constrictor is always about 50% of the total constrictor volume, which means that predictions using this structure will not be confounded by the same variation in volume size.
Figure 2 shows a representative patient who met the NRG uninvolved pharynx constraint but developed long-term dysphagia.
Pharyngoesophageal stricture is a common cause of dysphagia after IMRT for H&N cancer.16 Radiation has been shown to decrease pharyngeal function in patients with H&N cancer.17 Sparing one side of the pharynx may allow for better pharyngeal compliance throughout the length of the pharynx, possibly decreasing the rate of pharyngoesophageal stricture. Additionally, constraining the contralateral constrictor may preserve strength on this side, allowing it to compensate for weakness on the side of the primary cancer. An exercise sometimes used for dysphagia involves head rotation toward the affected side during swallowing. This technique has been shown to cause food to move to the unaffected side.18 Sparing the contralateral constrictor may help such techniques work better in patients with H&N cancer.
Few studies have commented specifically on dose to swallowing structures contralateral to the primary tumor. Two studies have proposed contralateral submandibular gland constraints for dysphagia (not xerostomia), but neither measured the dose to the contralateral constrictor muscle.9,10 Although the contralateral submandibular dose may correlate with dose to the constrictor on that side, the submandibular gland may have a less direct impact on swallowing than the constrictor muscle, and its limited dimensions may make constraints based on the gland less robust for cancers outside the oropharynx.
Another study reported improved quality of life in patients who were not treated with elective contralateral retropharyngeal radiation.19 Although it is likely that doses to the contralateral constrictor were lower in patients who did not receive elective radiation to this area, this study did not measure or constrain doses to the contralateral constrictors.
Limitations
This study is limited by its single institution, retrospective design, small sample size, and by all patients being male. The high correlation between air cavity editing and the use of SIB makes it impossible to assess the impact of each technique individually. Patients with contralateral constrictor V60 < 40% were less likely to have N2 disease, but N2 to N3 disease did not predict higher 1-year dysphagia, so the difference in N-category cannot fully explain the difference in 1-year dysphagia. It is possible that unreported factors, such as CTV, may contribute significantly to swallowing function. Nevertheless, within the study population, contralateral constrictor dose was able to identify a group with a low rate of long-term dysphagia.
Conclusions
Contralateral constrictor dose is a promising predictor of late dysphagia for patients with H&N cancer treated with radiation with concurrent systemic therapy. Contralateral constrictor V60 < 40% was able to identify a group of patients with a low rate of 1-year dysphagia in this single-center retrospective study. The correlation between air cavity editing and contralateral constrictor V60 suggests that contralateral constrictor dose may depend partly on technique. Further studies are needed to see if the contralateral constrictor dose can be used to predict long-term dysphagia prospectively and in other patient populations.
1. Langendijk JA, Doornaert P, Verdonck-de Leeuw IM, et al. Impact of late treatment-related toxicity on quality of life among patients with head and neck cancer treated with radiotherapy. J Clin Oncol. 2008;26(22):3770-3776. doi:10.1200/JCO.2007.14.6647
2. Nguyen NP, Frank C, Moltz CC, et al. Impact of dysphagia on quality of life after treatment of head-and-neck cancer. Int J Radiat Oncol Biol Phys. 2005;61(3):772-778. doi:10.1016/j.ijrobp.2004.06.017
3. Ramaekers BLT, Joore MA, Grutters JPC, et al. The impact of late treatment-toxicity on generic health-related quality of life in head and neck cancer patients after radiotherapy. Oral Oncol. 2011;47(8):768-774. doi:10.1016/j.oraloncology.2011.05.012
4. Christianen MEMC, Schilstra C, Beetz I, et al. Predictive modelling for swallowing dysfunction after primary (chemo)radiation: results of a prospective observational study. Radiother Oncol. 2012;105(1):107-114. doi:10.1016/j.radonc.2011.08.009
5. Vlachich G, Spratt DE, Diaz R, et al. Dose to inferior pharyngeal conctrictor predicts prolonged gastrostomy tube dependence with concurrent intensity-modulated radiation therapy and chemotherapy for locally-advanced head and neck cancer. Radiother Oncol. 2014;110(3):435-440. doi:10.1016/j.radonc.2013.12.007
6. Mogadas S, Busch CJ, Pflug Cet al. Influence of radiation dose to pharyngeal constrictor muscles on late dysphagia and quality of life in patients with locally advanced oropharyngeal carcinoma. Strahlenther Onkol. 2020;196(6):522-529. doi:10.1007/s00066-019-01572-0
7. Caglar HB, Tishler RB, Othus M, et al. Dose to larynx predicts of swallowing complications after intensity-modulated radiotherapy. Int J Radiat Oncol Biol Phys. 2008;72(4):1110-1118. doi:10.1016/j.ijrobp.2008.02.048
8. Schwartz DL, Hutcheson K, Barringer D, et al. Candidate dosimetric predictors of long-term swallowing dysfunction after oropharyngeal intensity-modulated radiotherapy. Int J Radiat Oncol Biol Phys. 2010;78(5):1356-1365. doi:10.1016/j.ijrobp.2009.10.002
9. Gensheimer MF, Nyflot M, Laramore GE, Laio JL, Parvathaneni U. Contribution of submandibular gland and swallowing structure sparing to post-radiation therapy peg dependence in oropharynx cancer patients treated with split-neck IMRT technique. Radiat Oncol. 2015;11(1):1-7. doi:10.1186/s13014-016-0726-3
10. Hedström J, Tuomi L, Finizia C, Olsson C. Identifying organs at risk for radiation-induced late dysphagia in head and neck cancer patients. Clin Transl Radiat Oncol. 2019;19:87-95. doi:10.1016/j.ctro.2019.08.005
11. Bhide SA, Gulliford S, Kazi R, et al. Correlation between dose to the pharyngeal constrictors and patient quality of life and late dysphagia following chemo-IMRT for head and neck cancer. Radiother Oncol. 2009;93(3):539-544. doi:10.1016/j.radonc.2009.09.017
12. Caudell JJ, Schaner PE, Desmond RA, Meredith RF, Spencer SA, Bonner JA. Dosimetric factors associated with long-term dysphagia after definitive radiotherapy for squamous cell carcinoma of the head and neck. Int J Radiat Oncol Biol Phys. 2010;76(2):403-409. doi:10.1016/j.ijrobp.2009.02.017
13. Levendag PC, Teguh DN, Voet P, et al. Dysphagia disorders in patients with cancer of the oropharynx are significantly affected by the radiation therapy dose to the superior and middle constrictor muscle: a dose-effect relationship. Radiother Oncol. 2007;85(1):64-73. doi:10.1016/j.radonc.2007.07.009
14. Eisbruch A, Schwartz M, Rasch C, et al. Dysphagia and aspiration after chemoradiotherapy for head-and-neck cancer: which anatomic structures are affected and can they be spared by IMRT? Int J Radiat Oncol Biol Phys. 2004;60(5):1425-1439. doi:10.1016/j.ijrobp.2004.05.050
15. Harari PM; NRG Oncology. Comparing high-dose cisplatin every three weeks to low-dose cisplatin weekly when combined with radiation for patients with advanced head and neck cancer. ClinicalTrials.gov identifier: NCT05050162. Updated November 25, 2022. Accessed December 7, 2022. https://clinicaltrials.gov/ct2/show/NCT05050162
16. Wang JJ, Goldsmith TA, Holman AS, Cianchetti M, Chan AW. Pharyngoesophageal stricture after treatment for head and neck cancer. Head Neck. 2011;34(7):967-973. doi:10.1002/hed.21842
17. Kendall KA, McKenzie SW, Leonard RJ, Jones CU. Timing of swallowing events after single-modality treatment of head and neck carcinoma with radiotherapy. Ann Otol Rhinol Laryngol. 2000;109(8, pt 1):767-775. doi:10.1177/000348940010900812
18. Ohmae Y, Ogura M, Kitahara S. Effects of head rotation on pharyngeal function during normal swallow. Ann Otol Rhinol Laryngol. 1998;107(4):344-348. doi:10.1177/000348949810700414
19. Spencer CR, Gay HA, Haughey BH, et al. Eliminating radiotherapy to the contralateral retropharyngeal and high level II lymph nodes in head and neck squamous cell carcinoma is safe and improves quality of life. Cancer. 2014;120(24):3994-4002. doi:10.1002/cncr.28938