User login
Weekend Botox training: Shortcut to cash or risky business?
This transcript has been edited for clarity.
Dr. Patel: A friend recently joked with me and said, “I wish you were a dermatologist so you could hook me up with Botox and fillers.” Well, little does this friend know that I could be a certified cosmetic injector just after a weekend course. Botox parties, here I come?
I can’t blame any health care professional for having a side hustle. People are burned out, want to supplement their income, or scale back clinical hours. According to one Medscape survey, almost 40% of physicians do have some form of a side hustle, whether it is consulting, speaking engagements, being an expert witness, or moonlighting. I know plenty of doctors and nurses who have taken on Botox injecting as a way to make some extra cash.
Now, going back to me and smoothing out wrinkles. I’m a pediatric hospitalist. I’ve never injected an aesthetic product in anyone’s face. When it comes to sharp objects and faces, I’ve sewn lacerations and drained abscesses. In my world, when we talk about botulinum toxin, we’re usually talking about botulism or the therapeutic treatment of migraines and muscle spasms – pathology.
The National Laser Institute has a 2-day Botox and dermal filler training. “Our 2-day Botox and filler course will also teach you how to build a practice and capitalize on the enormous Botox and dermal filler market that exists in the United States.” That’s a lot to cover in 2 days. They even have lunch breaks.
Just from a quick search, I even found an online video course for $1,500. For an additional fee, you can have a live, hands-on component. There are so many trainings out there, including one that’s only 8 hours long, offered by Empire Medical. I also went and spoke with an employee at Empire Medical who told me that because I’m an MD, if I do the course, I can use my certificate and go directly to a manufacturer, buy Botox, and start injecting right away.
Now, is this training actually sufficient for me to go and get good results while minimizing adverse effects like brow ptosis, dry eyes, and asymmetry? I have no idea. According to a review from the Journal of Cosmetic Dermatology, it’s crucial to understand anatomic landmarks, muscle function, baseline asymmetry, potential migration of the toxin, and site-specific precautions.
Okay, that sounds really intimidating, but people still do it. I saw a Business Insider article about a hospitalist who took a 2-day Botox course and then, to her credit, she trained under supervision for an additional 6 months. She then started hosting Botox parties and each time was making $3,500 to upwards of $20,000.
Let’s do some quick mental math. If I were to go online and buy Botox for $3-$6 a unit and then charge patients $15 a unit, and then I consider that in areas like the forehead or in between the eyes – I read that could take 25-50 units – and I repeat this for multiple patients, I can make a few thousand dollars. Well, I may have to adjust my prices according to the market, obviously, because I did see some Groupons advertising $10 per unit.
Who can get in on some Botox cosmetic cash action? Well, physicians can right away. For other health care professionals, it depends on the state. For example, in California, dentists cannot get Botox solely for cosmetic purposes, whereas in Arizona, they can. Generally speaking, NPs and PAs require some type of physician oversight or supervision, but again, it depends on the state.
Oh, and fun fact: Connecticut outright banned Botox parties and said that Botox must be performed “in a medical spa or licensed health care facility and by a Connecticut-licensed health care provider within his or her scope of practice.”
It definitely worries me that someone could go online or go overseas, buy Botox, claim to be a health care professional, and literally commit fraud. I found stories out there such as a couple in San Jose who are giving out Botox from their home without a license. They got arrested. Also, a woman in Alabama who lied about being a licensed dermatologist and did the same, or another woman in Los Angeles who got arrested after selling counterfeit Botox to undercover law enforcement. Surely, there are plenty more cases out there like this.
I asked Dr. Jacqueline Watchmaker, a board-certified dermatologist at U.S. Dermatology Partners in Arizona who has an expertise in cosmetic procedures, what she thought about the booming med spa industry and what, if any, regulatory changes she wanted to see.
Jacqueline Watchmaker, MD: I do think the fact that people can just go to a 1- or 2-day injection course and inject filler and Botox is concerning. I think the lack of regulation surrounding this topic is also very concerning.
There’s so much that goes into being a skilled injector. It’s an intricate knowledge of facial anatomy, which takes weeks, if not months, to really master. There’s actually injection technique, which can be very complex depending on the part of the face that you’re injecting. Even more important, it’s how to prevent complications, but also how to deal with complications if they do occur. There’s no way that these weekend injection courses are able to cover those topics in a thorough and satisfactory manner.
I see complications from med spas all the time, and I think it’s people going to injectors who are not skilled. They don’t know their anatomy, they don’t know the appropriate filler to use, and then heaven forbid there is a complication, they don’t know how to manage the complication – and then those patients get sent to me.
I think patients sometimes forget that these cosmetic procedures are true medical procedures. You need sterile technique. Again, you need to know the anatomy. It can look easy on social media, but there’s a large amount of thought behind it. I think there needs to be more regulation around this topic.
Dr. Patel: In one study, out of 400 people who received a cosmetic procedure, 50 reported an adverse event, such as discoloration or burns, and these adverse events were more likely to occur if a nonphysician was doing the procedure. Granted, this was a small study. You can’t make a generalization out of it, but this does add to the argument that there needs to be more regulation and oversight.
Let’s be real. The cosmetic injection side hustle is alive and well, but I’m good. I’m not going there. Maybe there should be some more quality control. At Botox parties, do people even ask if their injectors are certified or where they bought their vials?
You might be thinking that this isn’t a big deal because it’s just Botox. Let me ask you all a question: If you or your family member were going to go get Botox or another cosmetic injection, would it still not be a big deal?
Dr. Patel is a pediatric hospitalist, television producer, media contributor, and digital health enthusiast. He splits his time between New York City and San Francisco, as he is on faculty at Columbia University/Morgan Stanley Children’s Hospital and UCSF Benioff Children’s Hospital. He reported conflicts of interest with Medumo.
A version of this article first appeared on Medscape.com.
The four questions you should ask about sexual health
This transcript has been edited for clarity.
When I went to med school, we were taught to take a sexual history. Do you smoke? Do you drink? Do you do drugs? Do you have sex? Men, women, or both? And that was it. We’re telling patients that sex is a vice, something that is dangerous and that you should feel bad about. But sex is how we’re all here and how we even continue as a species. We must get comfortable as doctors talking to our patients about sexual medicine.
What if we move away from sex being in the vice category – the part of the social history that’s the bad stuff you shouldn’t be doing? Maybe we should bring it into the review of systems.
As a very basic first step, I like to ask patients four things. As a sexual medicine doctor, I deal with these four things: libido, arousal, orgasm, and pain.
Why are these important? These are the things our patients really care about; 2.3 of every 1,000 people got divorced in 2021.
Libido. Women who have distressing low sexual desire have sex on average two and a half times per month. We call this mercy sex or duty sex. I don’t know what the half time per month looks like, but people genuinely care about desire and their doctors don’t really know that.
We have a biopsychosocial toolbox to help our patients. Let me give you an example: Antidepressants can have sexual side effects. Could there be medications in our toolbox that can help our patients? Of course there can, and there are. What about education or talk therapy? We should be asking our patients what they care about and why they care about it so we can help them achieve their quality-of-life goals.
Arousal. What about arousal? Did you know that erections are a marker of cardiovascular disease in men? We know this to be true for men, and I’m certain the research would be no different for women. We know that there are many biological causes for decrease in arousal, including sleep apnea, diabetes, hypertension, and smoking. I can convince a lot of men to quit smoking because I tell them it’s bad for their penis. We have to understand what our patients care about and then advise them on why we think we can help improve these issues.
Orgasm. How about orgasm? Have you ever been asked whether you can orgasm? Have you ever been asked whether you have questions about orgasm? About 15%-20% of women report having an orgasm disorder, and we rarely talk about this in an exam room. I’ve certainly never been asked, and everybody knows what I do for a living. Not to mention all the men that I and my colleagues see who have really distressing premature ejaculation or delayed orgasm. This is pathophysiology at its finest and most complex. It is so interesting, and we have so much to learn and understand about orgasm in general.
Pain. Finally, ask about pain. It seems obvious that we should be asking our patients about their pain, which includes pelvic pain, but oftentimes we avoid talking about private parts. Pain affects not just our patients, but also their partners and their families, when our patients can’t sit without discomfort, if they can’t go and perform the daily activities that bring them joy and belonging. We have to really work with our toolbox in a biopsychosocial manner to help our patients. I often use the incredible rehabilitation specialists called pelvic floor physical therapists.
Remember, we’re talking about libido, arousal, orgasm, and pain. Sex is important to us as a species. It’s important to our patients. Ask nonjudgmental and open-ended questions. You actually may be the only doctor to ever do so.
Dr. Rubin is an assistant clinical professor, department of urology, Georgetown University, Washington. She reported conflicts of interest with Sprout, Maternal Medical, Absorption Pharmaceuticals, GSK, and Endo.
A version of this article first appeared on Medscape.com.
New and emerging options for treating recurrent C. difficile
This transcript has been edited for clarity.
Clostridioides difficile is a toxin-based infection that takes up residence in the colon due to disturbed normal bowel flora, usually after antibiotics.
Recurrent C. difficile can happen in up to a quarter of patients who receive oral vancomycin as a treatment for their infection. It can also occur with treatment with the newer agent, fidaxomicin, although possibly in fewer patients. In general, relapses are indeed common.
When I trained at Johns Hopkins under John Bartlett, he took the approach that after the second – and always after the third – relapse, an extended course of oral therapy with vancomycin could help get patients out of trouble. He used the so-called extended pulse method, where patients would take the drug for approximately 4-6 weeks and gradually reduce the dose.
This approach can also be done with fidaxomicin. However, I’m not sure it works much better than vancomycin, and there are often hurdles to using fidaxomicin because of insurers not approving it because of the expense.
What other therapies are there?
There is bezlotoxumab, which is a human monoclonal antibody targeting C. difficile toxin B. I’ve used it a few times. It is given as a one-time infusion, and there are challenges regarding cost, the logistics of setting up the infusion, and insurance approval.
Fecal microbiota transplant
In recent years, fecal microbiota transplants (FMT) have received a lot of attention as a different avenue of treatment that could lower the potential for relapses, with success rates usually around 80%-90%. However, in the past few years, there have been some serious safety signals because of possible transmission of dangerous pathogens, often with drug resistance, with FMT.
I’m therefore pleased to say that newer fecal microbiota products are coming in fast and furious. I thought I’d spend a few minutes speaking about these.
OpenBiome, an organization dedicated to microbiome research, offers an investigational product from screened donors that has not received Food and Drug Administration approval. It’s been around for some time. It can be used in either upper or lower GI applications, and the organization cites about an 84% success rate using this product.
There are also two new FDA-approved products I think are worth knowing about. They’ve just been approved recently and we’re a little uncertain of where they’re going to end up in the treatment landscape.
The first is from Ferring, and it goes by fecal microbiota, live-jslm (Rebyota). This is a product from qualified and screened donors, the main component of which is Bacteroides, which is given as a single dose by enema.
The company did a phase 3 trial with a Bayesian primary analysis, which I think convinced the FDA to approve this product. The success rate in people with multiple relapses was 70.6%, compared with 57.5% with placebo. The estimated treatment effect was 13.1%. Of those who did respond, over 90% were kept free of relapse over a 6-month period.
The other product, also FDA approved, is from Seres. It was previously called SER-109, and is now called fecal microbiota spores, live-brpk (Vowst). Unlike the previous product, this is orally administered, with patients taking four capsules daily for 3 days. Again, these donor-derived firmicutes have been appropriately screened and are free of potential pathogens.
The phase 3 randomized clinical trial results were published in the New England Journal of Medicine. They showed that 12% of those taking this product had a relapse, compared with 40% of those taking placebo, which is about the range we tend to see in people who have had multiple relapses. The safety profile was similar to placebo.
So, how will people use these treatments?
I think the FDA imprimatur will be attractive to people, but the products, I believe, will be priced fairly expensively, in the under $10,000 range. The first (Rebyota) is a rectal infusion; it is a one-and-done treatment but creates logistical issues. Interestingly, it could be a billable procedure for infectious disease clinicians. The ease of oral administration for Vowst, no doubt, will be very appealing. Both of these are given after completing a course of treatment with vancomycin or fidaxomicin so as not to interfere with the microbiome product.
I’ll also briefly mention a paper published in JAMA on yet another microbiome product, called VE303. This product was based on eight commensal strains of Clostridia and was given orally in a phase 2 trial. Interestingly, this worked about the same as the oral product that is already FDA approved. The study showed a recurrence rate of 13.8% in the high-dose group, compared with 45.5% in the placebo group.
I think this is exciting. And, of course, there is the expense.
But anything that can be done to help improve these patients is welcome, as once they get into the multiple-relapse phase, it is challenging to turn around. These commercialized products will hopefully become a bit more mainstream. Certainly, we’ll see how these will be utilized in the coming months and over the next few years.
Dr. Auwaerter is Clinical Director, Division of Infectious Diseases, Johns Hopkins University, Baltimore. He reported conflicts of interest with Gilead, Shionogi, and Medscape.
A version of this article first appeared on Medscape.com.
Navigating NAFLD: Unveiling the approach to mitigate the impact of NAFLD
Burden of NAFLD in the U.S.
NAFLD is a manifestation of systemic metabolic abnormalities, including insulin resistance, dyslipidemia, central obesity, and hypertension. In this short review, we summarize data on the burden of NAFLD in the U.S. and its prognostic determinants and review what clinical and public health approaches may be needed to mitigating its impact.
Epidemiology of NAFLD
Worldwide, the prevalence of NAFLD is estimated at 6% to 35%, with biopsy-based studies reporting NASH in 3% to 5%.1 U.S. estimates for the prevalence of NAFLD range from 10% to 46%.2 In our own analysis of the National Health and Nutrition Examination Survey (NHANES) data, transient elastography-detected steatosis was found in 36%, which projected to a minimum of 73 million American adults.3
NAFLD represents a spectrum of disorders ranging from simple steatosis to nonalcoholic steatohepatitis (NASH), the latter leading, in some cases, to progressive hepatic fibrosis and cirrhosis.4 Out of a large number of subjects with NAFLD, the proportions of NASH patients that develop severe liver problems such as end-stage liver disease (ESLD) or hepatocellular carcinoma (HCC) are progressively smaller. For example, we recently reported that less than 2,000 liver-related deaths are attributable to NAFLD in the U.S. per annum, which corresponds to a crude case fatality rate of < 0.005% per year.5
According to the Centers for Disease Control and Prevention (CDC), there have been substantial increases in liver-related deaths over the last 2 decades. Mortality from liver disease including hepatobiliary cancers more than doubled from 41,966 deaths (including 15,321 women and 26,645 men) in 2000 to 85,884 deaths (33,000 women and 52,884 men) in 2020. The proportion of deaths specifically attributed to NAFLD among liver-related deaths was miniscule in 2000, accounting for 1.1% in women and 0.7% in men. By 2020, the proportions increased several folds in both sexes (7.4% in women and 2.7% in men).6 Moreover, it is likely that a substantial portion of deaths from chronic liver disease from unknown causes (“cryptogenic”) are likely end-stage NAFLD, making these figures underestimates of the true impact of NAFLD in the U.S.
From a comparative epidemiologic perspective, there are significant racial and ethnic and socioeconomic disparities in NAFLD prevalence, wherein Hispanic persons and individuals experiencing food insecurity – independent of poverty status, education level, race and ethnicity – are disproportionately more affected by NAFLD.7,8 Furthermore, these disparities persist when examining long-term complications of NAFLD, such as developing HCC.
Prognosis in NAFLD: NASH versus fibrosis
Given the enormous prevalence and increasing public health burden of NAFLD, systematic interventions to mitigate its impact are urgently needed. Clearly, patients who already have developed advanced liver disease need to be directed to specialty care so the disease progression may be halted and complications of ESLD may be prevented or managed. On the other hand, in order to mitigate the future impact of ESLD, prompt identification of at-risk patients and proactive interventions to improve liver health are needed.

In the assessment of disease progression, prior data have shown that the presence of NASH and increasing stages of liver fibrosis are important predictors of disease progression. Fibrosis is a component of NASH, while NASH is thought to be a prerequisite for fibrosis. In a prospective, multicenter follow-up study of NAFLD evaluated by liver biopsies (n = 1,773), over a median follow-up of 4 years, 37 (2%) developed hepatic decompensation, while 47 (3%) died from any cause, which included ESLD (n = 12), cardiovascular complications (n = 4), and malignancies (n = 12), including HCC (n = 9).9 It is not entirely surprising that advanced fibrosis and cirrhosis was highly associated with the development of hepatic decompensation. In their multivariable analysis, patients with F3-4 had a 13.8-fold (95% confidence interval [CI]: 4.6, 41.0) increase in the hazard of reaching a MELD score of 15 compared to those with F0-2. In addition, all-cause mortality was 17.2-fold (95% CI: 5.2, 56.6) higher with F3-4 compared to F0-2.
These data have been borne out by a larger body of literature on the topic. In a recent meta-analysis assessing the relation between liver fibrosis and future mortality, which included 17,301 subjects with NAFLD, patients with at least stage 2 fibrosis experience a significantly increased risk of liver-related and overall mortality, a trend that accelerates at higher fibrosis stages.10 These point to liver fibrosis as the singular determinant of long-term prognosis, in comparison, for example, with the diagnosis of NASH. Hagström conducted a retrospective cohort study of patients with biopsy-proven NAFLD in Sweden. When fibrosis stage and histological diagnosis of NASH were considered together, NASH did not have an impact on overall mortality (hazard ratio [HR] = 0.83, P = .29) or liver morbidity (HR = 0.62, P = .25).11
On an individual level, factors that affect fibrosis progression are not as well studied. It is commonly believed that demographic factors (e.g., age, sex and race), genetic polymorphisms (e.g., PNPLA3, TM6SF2), clinical comorbidities (e.g., obesity, DM, and sleep apnea), and environmental factors (e.g., smoking) may accelerate fibrosis and disease outcomes, although prospective data are sparse to estimate the extent these individual variables affect progression.12 Recent guidelines remain silent about whether and how these data may be incorporated in screening for NAFLD in the population.
Assessment of liver fibrosis
The traditional means to detect liver fibrosis is liver histology, which also assesses steatosis, individual components of NASH and, often importantly, other concomitant liver pathology. In reality, however, liver biopsies have several limitations including the risk of complications, patient discomfort, economic costs, and sampling variability. Increasingly, “noninvasive” methods have been used to estimate liver fibrosis in patients with NAFLD. Liver elastography estimates the physical stiffness of the organ, which may be measured by MRI or ultrasound. Among ultrasound-based technologies, vibration-controlled transient elastography (VCTE) is more widely accepted and affordable although it may not be as accurate as MR elastography.13
In general, these elastographic tests are not readily accessible to most physicians outside hepatology specialty practices. Instead, blood test-based markers have been developed and widely recommended as the initial modality to assess liver fibrosis. Figure 1 represents a partial list of blood test-based markers. Traditionally, FIB-4 and NFS have been considered the most widely recommended by society guidelines. The AGA Pathway for evaluation of patients with NAFLD recommends first to apply the FIB-4 score and, in patients considered to be at intermediate risk of fibrosis for advanced fibrosis (stage 3 or 4, FIB-4 = 1.3-2.67), to assess liver stiffness by VCTE.14
More recently, the accumulating natural history data have highlighted the inflection in the risk of future outcomes coinciding with F2 and therapeutic trials that target patients with “at risk NASH,” thus more attention has been paid to the identification of patients with stage 2 (or higher). The steatosis-associated fibrosis estimator (SAFE) was developed for this specific purpose. The score has been validated in multiple data sets, in all of which SAFE outperformed FIB-4 and NFS (Figure 1). When the score was applied to assess overall survival in participants of the NHANES, patients with NAFLD deemed to be high risk (SAFE > 100) had significantly lower survival (37% Kaplan-Meier survival at 20 years), compared to those with intermediate (SAFE 0-100, 61% survival) and low (SAFE < 0, 86% survival). In comparison, the 20-year survival of subjects without NAFLD survival was 79%.15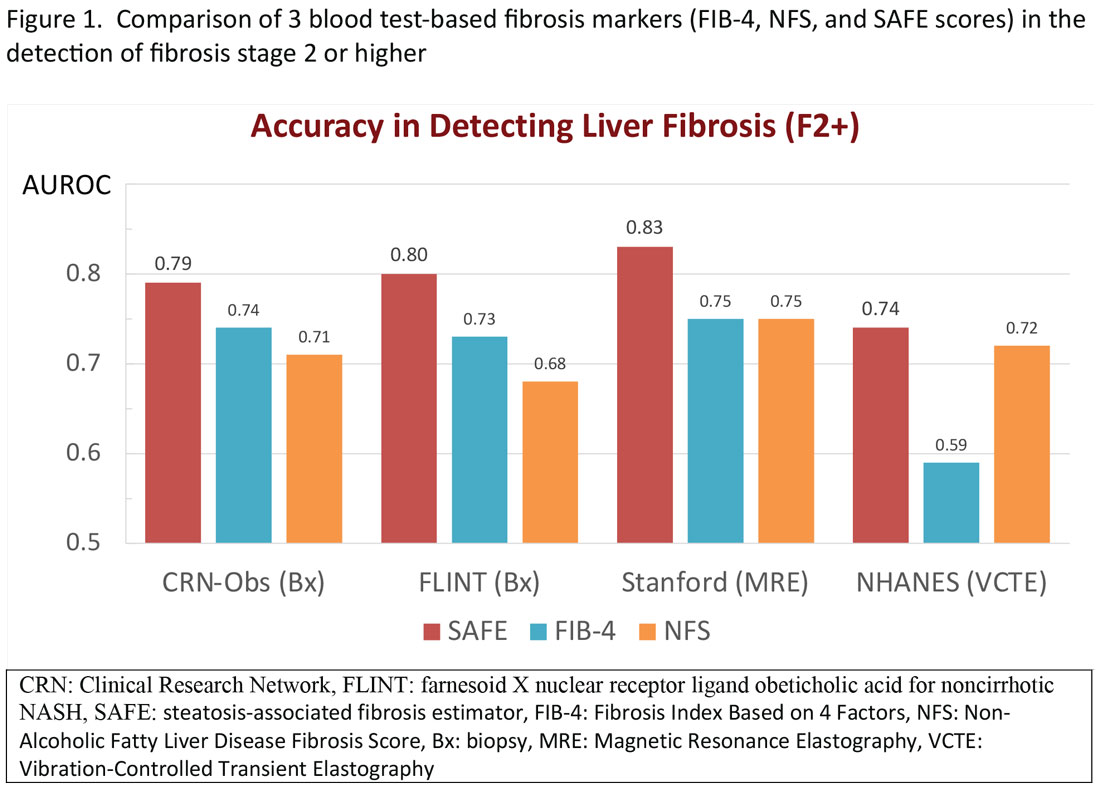
Regardless of the modality for initial stratification, it is widely accepted that mechanical elastography constitutes the next step in prognosticating the patient. In the AGA Pathway, liver stiffness of < 8 kPa is considered low risk, which corresponds in most analysis with lack of stage 2 fibrosis, whereas stiffness of > 12 kPa may be indicative of stage 3 or 4. These recommendations are consistent with those from the latest Baveno Consensus Conference (“Baveno 7”). Figure 2 expands on the so-called “rule of 5” from the consensus document and correlates liver stiffness (by VCTE) with progression of liver fibrosis as well as clinical presentation. For example, liver stiffness < 15 kPa is associated with a low risk of clinically significant portal hypertension (CSPH). Similarly, in patients with a normal platelet count (>150,000/mm3) and liver stiffness < 20 kPa, the probability of gastroesophageal varices is sufficiently low that a screening endoscopy may be avoided. On the other hand, liver stiffness > 25 kPa is associated with increasing risk of decompensated cirrhosis and portal hypertension.16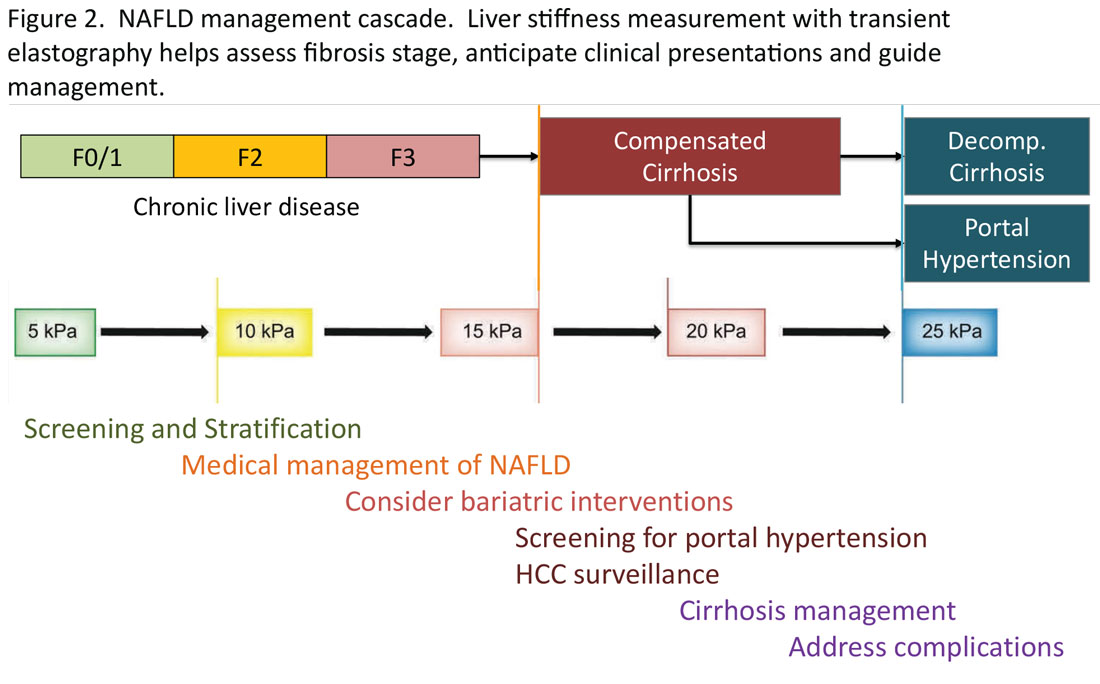
Partnership between primary care and specialty
The insights expressed in Figure 2 can be utilized to guide management decisions. In patients without evidence of liver fibrosis, emphasis may primarily be on screening, stratification and management of metabolic syndrome. For patients with evidence of incipient liver fibrosis, medical management of NAFLD needs to be implemented including lifestyle changes and pharmacological interventions as appropriate. For patients unresponsive to medical therapy, an endoscopic or surgical bariatric procedure should be considered. Management of patients with evidence of cirrhosis includes screening for portal hypertension, surveillance for HCC, medical management of cirrhosis, and finally, in suitable cases, referral for liver transplant evaluation. The reader is referred to the latest treatment guidelines for detailed discussion of these individual management modalities [ref, AGA and AASLD guidelines].14,17
Given the spectrum of management modalities needed to successfully manage patients with NAFLD, it is unrealistic to expect that hepatologists and gastroenterologists are able to manage the large number of patients with NAFLD. In general, clinical activities on the left side of the figure are in the domain of primary care providers, whereas management of patients with progressive liver fibrosis is conducted by the specialist. An important aspect of the overall management of these patients is risk management in terms of the metabolic syndrome, including cardiovascular risk reduction and diabetes management, as appropriate. Many patients with NAFLD are burdened with several comorbidities and likely to benefit from a multidisciplinary team consisting of primary care, endocrinology, preventive cardiology, pharmacy, nutrition/dietetics, social services, and addiction specialists, as well as hepatology and gastroenterology. Prospective, high-quality data to define these teams and their function are yet to be generated.
Conclusion
NAFLD is an important and increasing public health concern in the U.S. Once diagnosed, assessing liver fibrosis and evaluating the presence of the components of metabolic syndrome in these patients, constitute the key components in the care in terms of risk stratification, medical management, and referral decisions. Noninvasive tests have been increasingly utilized including liver stiffness measurements and various blood test-based indicators. For patients in specialty GI/hepatology care, transient elastography is a widely accepted tool, with which standardized recommendations may be made for screening, stratification, and medical and surgical interventions in patients with NAFLD.
Mai Sedki, MD, MPH, is a doctoral candidate at the University of California, San Francisco. W. Ray Kim, MD, is professor of medicine (gastroenterology and hepatology) at Stanford (Calif.) University. Address correspondence to: [email protected]. The authors disclosed no conflicts of interest. Twitter: @SedkiMD and @WRayKimMD.
References
1. Younossi ZM et al. Epidemiology of chronic liver diseases in the USA in the past three decades. Gut. 2020 Mar;69(3):564-8.
2. Lazo M et al. Prevalence of nonalcoholic fatty liver disease in the United States: the Third National Health and Nutrition Examination Survey, 1988-1994. Am J Epidemiol. 2013 Jul 1;178(1):38-45.
3. Kim D et al. Association between noninvasive fibrosis markers and mortality among adults with nonalcoholic fatty liver disease in the United States. Hepatology. 2013 Apr;57:1357-65.
4. Angulo P. Nonalcoholic fatty liver disease. N Engl J Med. 2002 Apr 18;346:1221-31.
5. Kim D et al. Changing trends in etiology-based annual mortality from chronic liver disease, from 2007 through 2016. Gastroenterology. 2018;155(4):1154-63.e3.
6. FastStats. Chronic Liver Disease and Cirrhosis. Centers for Disease Control and Prevention.
7. Rich NE et al. Racial and ethnic disparities in nonalcoholic fatty liver disease prevalence, severity, and outcomes in the United States: A systematic review and meta-analysis. Clin Gastroenterol Hepatol. 2018;16(2):198-210. e2.
8. Coleman-Jensen A et al. Household food security in the United States in 2020 (ERR-298). Washington, DC: U.S. Department of Agriculture; Sep 2021.
9. Sanyal AJ et al. Prospective study of outcomes in adults with nonalcoholic fatty liver disease. N Engl J Med. 2021 Oct 21;385(17):1559-69.
10. Ng CH et al. Mortality outcomes by fibrosis stage in nonalcoholic fatty liver disease: A systematic review and meta-analysis. Clin Gastroenterol Hepatol. 2023 Apr;21(4):931-9.e5.
11. Hagström H et al. Fibrosis stage but not NASH predicts mortality and time to development of severe liver disease in biopsy-proven NAFLD. J Hepatol. 2017;67(6):1265-73.
12. Rinella ME et al. AASLD Practice Guidance on the clinical assessment and management of nonalcoholic fatty liver disease. Hepatology. 2023 May 1;77(5):1797-835.
13. Singh S et al. Diagnostic performance of magnetic resonance elastography in staging liver fibrosis: A systematic review and meta-analysis of individual participant data. Clin Gastroenterol Hepatol. 2015 Mar;13(3):440-51.e6.
14. Kanwal F et al. Clinical Care Pathway for the risk stratification and management of patients with nonalcoholic fatty liver disease. Gastroenterology. 2021 Nov;161(5):1657-69.
15. Sripongpun P et al. The steatosis-associated fibrosis estimator (SAFE) score: A tool to detect low-risk NAFLD in primary care. .
16. de Franchis R et al. Baveno VII: Renewing consensus in portal hypertension. J Hepatol. 2022 Apr;76(4):959-74.
17. Rinella ME et al. AASLD Practice Guidance on the clinical assessment and management of nonalcoholic fatty liver disease. Hepatology. 2023 May 1;77(5):1797-835.
Burden of NAFLD in the U.S.
NAFLD is a manifestation of systemic metabolic abnormalities, including insulin resistance, dyslipidemia, central obesity, and hypertension. In this short review, we summarize data on the burden of NAFLD in the U.S. and its prognostic determinants and review what clinical and public health approaches may be needed to mitigating its impact.
Epidemiology of NAFLD
Worldwide, the prevalence of NAFLD is estimated at 6% to 35%, with biopsy-based studies reporting NASH in 3% to 5%.1 U.S. estimates for the prevalence of NAFLD range from 10% to 46%.2 In our own analysis of the National Health and Nutrition Examination Survey (NHANES) data, transient elastography-detected steatosis was found in 36%, which projected to a minimum of 73 million American adults.3
NAFLD represents a spectrum of disorders ranging from simple steatosis to nonalcoholic steatohepatitis (NASH), the latter leading, in some cases, to progressive hepatic fibrosis and cirrhosis.4 Out of a large number of subjects with NAFLD, the proportions of NASH patients that develop severe liver problems such as end-stage liver disease (ESLD) or hepatocellular carcinoma (HCC) are progressively smaller. For example, we recently reported that less than 2,000 liver-related deaths are attributable to NAFLD in the U.S. per annum, which corresponds to a crude case fatality rate of < 0.005% per year.5
According to the Centers for Disease Control and Prevention (CDC), there have been substantial increases in liver-related deaths over the last 2 decades. Mortality from liver disease including hepatobiliary cancers more than doubled from 41,966 deaths (including 15,321 women and 26,645 men) in 2000 to 85,884 deaths (33,000 women and 52,884 men) in 2020. The proportion of deaths specifically attributed to NAFLD among liver-related deaths was miniscule in 2000, accounting for 1.1% in women and 0.7% in men. By 2020, the proportions increased several folds in both sexes (7.4% in women and 2.7% in men).6 Moreover, it is likely that a substantial portion of deaths from chronic liver disease from unknown causes (“cryptogenic”) are likely end-stage NAFLD, making these figures underestimates of the true impact of NAFLD in the U.S.
From a comparative epidemiologic perspective, there are significant racial and ethnic and socioeconomic disparities in NAFLD prevalence, wherein Hispanic persons and individuals experiencing food insecurity – independent of poverty status, education level, race and ethnicity – are disproportionately more affected by NAFLD.7,8 Furthermore, these disparities persist when examining long-term complications of NAFLD, such as developing HCC.
Prognosis in NAFLD: NASH versus fibrosis
Given the enormous prevalence and increasing public health burden of NAFLD, systematic interventions to mitigate its impact are urgently needed. Clearly, patients who already have developed advanced liver disease need to be directed to specialty care so the disease progression may be halted and complications of ESLD may be prevented or managed. On the other hand, in order to mitigate the future impact of ESLD, prompt identification of at-risk patients and proactive interventions to improve liver health are needed.
In the assessment of disease progression, prior data have shown that the presence of NASH and increasing stages of liver fibrosis are important predictors of disease progression. Fibrosis is a component of NASH, while NASH is thought to be a prerequisite for fibrosis. In a prospective, multicenter follow-up study of NAFLD evaluated by liver biopsies (n = 1,773), over a median follow-up of 4 years, 37 (2%) developed hepatic decompensation, while 47 (3%) died from any cause, which included ESLD (n = 12), cardiovascular complications (n = 4), and malignancies (n = 12), including HCC (n = 9).9 It is not entirely surprising that advanced fibrosis and cirrhosis was highly associated with the development of hepatic decompensation. In their multivariable analysis, patients with F3-4 had a 13.8-fold (95% confidence interval [CI]: 4.6, 41.0) increase in the hazard of reaching a MELD score of 15 compared to those with F0-2. In addition, all-cause mortality was 17.2-fold (95% CI: 5.2, 56.6) higher with F3-4 compared to F0-2.
These data have been borne out by a larger body of literature on the topic. In a recent meta-analysis assessing the relation between liver fibrosis and future mortality, which included 17,301 subjects with NAFLD, patients with at least stage 2 fibrosis experience a significantly increased risk of liver-related and overall mortality, a trend that accelerates at higher fibrosis stages.10 These point to liver fibrosis as the singular determinant of long-term prognosis, in comparison, for example, with the diagnosis of NASH. Hagström conducted a retrospective cohort study of patients with biopsy-proven NAFLD in Sweden. When fibrosis stage and histological diagnosis of NASH were considered together, NASH did not have an impact on overall mortality (hazard ratio [HR] = 0.83, P = .29) or liver morbidity (HR = 0.62, P = .25).11
On an individual level, factors that affect fibrosis progression are not as well studied. It is commonly believed that demographic factors (e.g., age, sex and race), genetic polymorphisms (e.g., PNPLA3, TM6SF2), clinical comorbidities (e.g., obesity, DM, and sleep apnea), and environmental factors (e.g., smoking) may accelerate fibrosis and disease outcomes, although prospective data are sparse to estimate the extent these individual variables affect progression.12 Recent guidelines remain silent about whether and how these data may be incorporated in screening for NAFLD in the population.
Assessment of liver fibrosis
The traditional means to detect liver fibrosis is liver histology, which also assesses steatosis, individual components of NASH and, often importantly, other concomitant liver pathology. In reality, however, liver biopsies have several limitations including the risk of complications, patient discomfort, economic costs, and sampling variability. Increasingly, “noninvasive” methods have been used to estimate liver fibrosis in patients with NAFLD. Liver elastography estimates the physical stiffness of the organ, which may be measured by MRI or ultrasound. Among ultrasound-based technologies, vibration-controlled transient elastography (VCTE) is more widely accepted and affordable although it may not be as accurate as MR elastography.13
In general, these elastographic tests are not readily accessible to most physicians outside hepatology specialty practices. Instead, blood test-based markers have been developed and widely recommended as the initial modality to assess liver fibrosis. Figure 1 represents a partial list of blood test-based markers. Traditionally, FIB-4 and NFS have been considered the most widely recommended by society guidelines. The AGA Pathway for evaluation of patients with NAFLD recommends first to apply the FIB-4 score and, in patients considered to be at intermediate risk of fibrosis for advanced fibrosis (stage 3 or 4, FIB-4 = 1.3-2.67), to assess liver stiffness by VCTE.14
More recently, the accumulating natural history data have highlighted the inflection in the risk of future outcomes coinciding with F2 and therapeutic trials that target patients with “at risk NASH,” thus more attention has been paid to the identification of patients with stage 2 (or higher). The steatosis-associated fibrosis estimator (SAFE) was developed for this specific purpose. The score has been validated in multiple data sets, in all of which SAFE outperformed FIB-4 and NFS (Figure 1). When the score was applied to assess overall survival in participants of the NHANES, patients with NAFLD deemed to be high risk (SAFE > 100) had significantly lower survival (37% Kaplan-Meier survival at 20 years), compared to those with intermediate (SAFE 0-100, 61% survival) and low (SAFE < 0, 86% survival). In comparison, the 20-year survival of subjects without NAFLD survival was 79%.15
Regardless of the modality for initial stratification, it is widely accepted that mechanical elastography constitutes the next step in prognosticating the patient. In the AGA Pathway, liver stiffness of < 8 kPa is considered low risk, which corresponds in most analysis with lack of stage 2 fibrosis, whereas stiffness of > 12 kPa may be indicative of stage 3 or 4. These recommendations are consistent with those from the latest Baveno Consensus Conference (“Baveno 7”). Figure 2 expands on the so-called “rule of 5” from the consensus document and correlates liver stiffness (by VCTE) with progression of liver fibrosis as well as clinical presentation. For example, liver stiffness < 15 kPa is associated with a low risk of clinically significant portal hypertension (CSPH). Similarly, in patients with a normal platelet count (>150,000/mm3) and liver stiffness < 20 kPa, the probability of gastroesophageal varices is sufficiently low that a screening endoscopy may be avoided. On the other hand, liver stiffness > 25 kPa is associated with increasing risk of decompensated cirrhosis and portal hypertension.16
Partnership between primary care and specialty
The insights expressed in Figure 2 can be utilized to guide management decisions. In patients without evidence of liver fibrosis, emphasis may primarily be on screening, stratification and management of metabolic syndrome. For patients with evidence of incipient liver fibrosis, medical management of NAFLD needs to be implemented including lifestyle changes and pharmacological interventions as appropriate. For patients unresponsive to medical therapy, an endoscopic or surgical bariatric procedure should be considered. Management of patients with evidence of cirrhosis includes screening for portal hypertension, surveillance for HCC, medical management of cirrhosis, and finally, in suitable cases, referral for liver transplant evaluation. The reader is referred to the latest treatment guidelines for detailed discussion of these individual management modalities [ref, AGA and AASLD guidelines].14,17
Given the spectrum of management modalities needed to successfully manage patients with NAFLD, it is unrealistic to expect that hepatologists and gastroenterologists are able to manage the large number of patients with NAFLD. In general, clinical activities on the left side of the figure are in the domain of primary care providers, whereas management of patients with progressive liver fibrosis is conducted by the specialist. An important aspect of the overall management of these patients is risk management in terms of the metabolic syndrome, including cardiovascular risk reduction and diabetes management, as appropriate. Many patients with NAFLD are burdened with several comorbidities and likely to benefit from a multidisciplinary team consisting of primary care, endocrinology, preventive cardiology, pharmacy, nutrition/dietetics, social services, and addiction specialists, as well as hepatology and gastroenterology. Prospective, high-quality data to define these teams and their function are yet to be generated.
Conclusion
NAFLD is an important and increasing public health concern in the U.S. Once diagnosed, assessing liver fibrosis and evaluating the presence of the components of metabolic syndrome in these patients, constitute the key components in the care in terms of risk stratification, medical management, and referral decisions. Noninvasive tests have been increasingly utilized including liver stiffness measurements and various blood test-based indicators. For patients in specialty GI/hepatology care, transient elastography is a widely accepted tool, with which standardized recommendations may be made for screening, stratification, and medical and surgical interventions in patients with NAFLD.
Mai Sedki, MD, MPH, is a doctoral candidate at the University of California, San Francisco. W. Ray Kim, MD, is professor of medicine (gastroenterology and hepatology) at Stanford (Calif.) University. Address correspondence to: [email protected]. The authors disclosed no conflicts of interest. Twitter: @SedkiMD and @WRayKimMD.
References
1. Younossi ZM et al. Epidemiology of chronic liver diseases in the USA in the past three decades. Gut. 2020 Mar;69(3):564-8.
2. Lazo M et al. Prevalence of nonalcoholic fatty liver disease in the United States: the Third National Health and Nutrition Examination Survey, 1988-1994. Am J Epidemiol. 2013 Jul 1;178(1):38-45.
3. Kim D et al. Association between noninvasive fibrosis markers and mortality among adults with nonalcoholic fatty liver disease in the United States. Hepatology. 2013 Apr;57:1357-65.
4. Angulo P. Nonalcoholic fatty liver disease. N Engl J Med. 2002 Apr 18;346:1221-31.
5. Kim D et al. Changing trends in etiology-based annual mortality from chronic liver disease, from 2007 through 2016. Gastroenterology. 2018;155(4):1154-63.e3.
6. FastStats. Chronic Liver Disease and Cirrhosis. Centers for Disease Control and Prevention.
7. Rich NE et al. Racial and ethnic disparities in nonalcoholic fatty liver disease prevalence, severity, and outcomes in the United States: A systematic review and meta-analysis. Clin Gastroenterol Hepatol. 2018;16(2):198-210. e2.
8. Coleman-Jensen A et al. Household food security in the United States in 2020 (ERR-298). Washington, DC: U.S. Department of Agriculture; Sep 2021.
9. Sanyal AJ et al. Prospective study of outcomes in adults with nonalcoholic fatty liver disease. N Engl J Med. 2021 Oct 21;385(17):1559-69.
10. Ng CH et al. Mortality outcomes by fibrosis stage in nonalcoholic fatty liver disease: A systematic review and meta-analysis. Clin Gastroenterol Hepatol. 2023 Apr;21(4):931-9.e5.
11. Hagström H et al. Fibrosis stage but not NASH predicts mortality and time to development of severe liver disease in biopsy-proven NAFLD. J Hepatol. 2017;67(6):1265-73.
12. Rinella ME et al. AASLD Practice Guidance on the clinical assessment and management of nonalcoholic fatty liver disease. Hepatology. 2023 May 1;77(5):1797-835.
13. Singh S et al. Diagnostic performance of magnetic resonance elastography in staging liver fibrosis: A systematic review and meta-analysis of individual participant data. Clin Gastroenterol Hepatol. 2015 Mar;13(3):440-51.e6.
14. Kanwal F et al. Clinical Care Pathway for the risk stratification and management of patients with nonalcoholic fatty liver disease. Gastroenterology. 2021 Nov;161(5):1657-69.
15. Sripongpun P et al. The steatosis-associated fibrosis estimator (SAFE) score: A tool to detect low-risk NAFLD in primary care. .
16. de Franchis R et al. Baveno VII: Renewing consensus in portal hypertension. J Hepatol. 2022 Apr;76(4):959-74.
17. Rinella ME et al. AASLD Practice Guidance on the clinical assessment and management of nonalcoholic fatty liver disease. Hepatology. 2023 May 1;77(5):1797-835.
Ensuring trustworthy health AI
in health care.
It was a thought-provoking discussion of how to ethically and equitably design and regulate these exciting new technologies to maximize their potential to achieve meaningful improvements in health for our patients while avoiding unintended consequences.

Indeed, one of the vexing challenges in this space is the fact that many AI algorithms and resulting tools are proprietary, impeding the ability to achieve the level of transparency necessary to understand data inputs, outputs, and outcomes, and assess for potential algorithmic bias.
This is an area that remains largely unregulated, with a lack of common standards to guide responsible design, development, and adoption of these tools. This is something that is top of mind for federal regulatory agencies, including the Food and Drug Administration, which in September 2022, announced plans to expand its regulation of AI-powered clinical decision support tools as medical devices.
There are also attempts underway to harmonize standards and reporting for health AI and educate end-users on how to evaluate these technologies to drive their responsible adoption. For example, the Coalition for Health AI, a community of academic health systems, organizations, and expert practitioners of AI and data science, recently released its Blueprint for Trustworthy AI Implementation Guidance and Assurance for Healthcare in April 2023. This is a topic we will surely hear more about in the coming years, and one I encourage you to read about in greater depth as it is truly eye-opening.
In this month’s issue of GI & Hepatology News, we update you on a new fatty liver disease nomenclature (including several new acronyms) that will be critical to incorporate into your clinical practice moving forward. In a new recurring article reprinted from Gastro Hep Advances, we highlight important Pearls from the Pros from hepatologists Dr. Lawrence Friedman and Dr. Paul Martin on the management of incidental hepatic steatosis. Our August Member Spotlight features Orlando-based gastroenterologist Dr. Mariam Naveed, who shares her passion for medical education and experience starting a new GI fellowship program.
We hope you enjoy these and all the stories featured in our August issue.
Megan A. Adams, MD, JD, MSc
Editor-in-Chief
in health care.
It was a thought-provoking discussion of how to ethically and equitably design and regulate these exciting new technologies to maximize their potential to achieve meaningful improvements in health for our patients while avoiding unintended consequences.
Indeed, one of the vexing challenges in this space is the fact that many AI algorithms and resulting tools are proprietary, impeding the ability to achieve the level of transparency necessary to understand data inputs, outputs, and outcomes, and assess for potential algorithmic bias.
This is an area that remains largely unregulated, with a lack of common standards to guide responsible design, development, and adoption of these tools. This is something that is top of mind for federal regulatory agencies, including the Food and Drug Administration, which in September 2022, announced plans to expand its regulation of AI-powered clinical decision support tools as medical devices.
There are also attempts underway to harmonize standards and reporting for health AI and educate end-users on how to evaluate these technologies to drive their responsible adoption. For example, the Coalition for Health AI, a community of academic health systems, organizations, and expert practitioners of AI and data science, recently released its Blueprint for Trustworthy AI Implementation Guidance and Assurance for Healthcare in April 2023. This is a topic we will surely hear more about in the coming years, and one I encourage you to read about in greater depth as it is truly eye-opening.
In this month’s issue of GI & Hepatology News, we update you on a new fatty liver disease nomenclature (including several new acronyms) that will be critical to incorporate into your clinical practice moving forward. In a new recurring article reprinted from Gastro Hep Advances, we highlight important Pearls from the Pros from hepatologists Dr. Lawrence Friedman and Dr. Paul Martin on the management of incidental hepatic steatosis. Our August Member Spotlight features Orlando-based gastroenterologist Dr. Mariam Naveed, who shares her passion for medical education and experience starting a new GI fellowship program.
We hope you enjoy these and all the stories featured in our August issue.
Megan A. Adams, MD, JD, MSc
Editor-in-Chief
Transitions and growth
Dear friends,
This fall, I will also be starting my first position out of fellowship. I look forward to many opportunities and challenges to come.

This month in In Focus, Dr. Mai Sedki and Dr. W. Ray Kim unpack the nuances of assessing and risk-stratifying patients with nonalcoholic fatty liver disease by using non-invasive testing in daily practice. Beyond daily practice, it is important to know where our field is advancing to offer patients more options. In Short Clinical Reviews, Dr. Aileen Bui and Dr. James Buxbaum review how the field of endohepatology is expanding into endoscopic ultrasound–guided liver biopsies, portal pressure measurements, and interventions of gastric varices.
In our Early Career feature, Dr. Corlan Eboh, Dr. Victoria Jaeger, and Dr. Dawn Sears describe how gastroenterologists are uniquely positioned for burnout and what can be done to prevent and treat it, particularly among new and transitioning gastroenterologists. In post-COVID era, practices have experienced an increase in portal messages and other non-face-to-face patient care, which may be contributing burnout.
In our Finance section this month, Dr. Luis Nieto and Dr. Jami Kinnucan review the types of patient encounters and billing options to optimize your compensation for time spent.
In Private Practice Perspectives, Dr. David Ramsey discusses why he joined a private practice and how understanding your own goals and values can guide you to a good fit in different practice models. Lastly, Dr. Dan Kroch describes his unique journey in becoming a third-space endoscopist without an advanced fellowship year and why dedicated training is the future of advanced endoscopic resection and third-space endoscopy.
If you are interested in contributing or have ideas for future TNG topics, please contact me ([email protected]), or Jillian Schweitzer ([email protected]), managing editor of TNG.
Until next time, I leave you with a historical fun fact: The first endoscopic retrograde cholangiopancreatography (ERCP) was first performed by an obstetrician, Dr. William McCune in 1968, and achieved by taping an external accessory channel to a duodenoscope.
Yours truly,
Judy A Trieu, MD, MPH
Editor-in-Chief
Advanced Endoscopy Fellow
Division of Gastroenterology & Hepatology
University of North Carolina at Chapel Hill
Dear friends,
This fall, I will also be starting my first position out of fellowship. I look forward to many opportunities and challenges to come.
This month in In Focus, Dr. Mai Sedki and Dr. W. Ray Kim unpack the nuances of assessing and risk-stratifying patients with nonalcoholic fatty liver disease by using non-invasive testing in daily practice. Beyond daily practice, it is important to know where our field is advancing to offer patients more options. In Short Clinical Reviews, Dr. Aileen Bui and Dr. James Buxbaum review how the field of endohepatology is expanding into endoscopic ultrasound–guided liver biopsies, portal pressure measurements, and interventions of gastric varices.
In our Early Career feature, Dr. Corlan Eboh, Dr. Victoria Jaeger, and Dr. Dawn Sears describe how gastroenterologists are uniquely positioned for burnout and what can be done to prevent and treat it, particularly among new and transitioning gastroenterologists. In post-COVID era, practices have experienced an increase in portal messages and other non-face-to-face patient care, which may be contributing burnout.
In our Finance section this month, Dr. Luis Nieto and Dr. Jami Kinnucan review the types of patient encounters and billing options to optimize your compensation for time spent.
In Private Practice Perspectives, Dr. David Ramsey discusses why he joined a private practice and how understanding your own goals and values can guide you to a good fit in different practice models. Lastly, Dr. Dan Kroch describes his unique journey in becoming a third-space endoscopist without an advanced fellowship year and why dedicated training is the future of advanced endoscopic resection and third-space endoscopy.
If you are interested in contributing or have ideas for future TNG topics, please contact me ([email protected]), or Jillian Schweitzer ([email protected]), managing editor of TNG.
Until next time, I leave you with a historical fun fact: The first endoscopic retrograde cholangiopancreatography (ERCP) was first performed by an obstetrician, Dr. William McCune in 1968, and achieved by taping an external accessory channel to a duodenoscope.
Yours truly,
Judy A Trieu, MD, MPH
Editor-in-Chief
Advanced Endoscopy Fellow
Division of Gastroenterology & Hepatology
University of North Carolina at Chapel Hill
Sick humor
This past June, during the search for the Titan submersible, and since then, we’ve had a not-entirely-unexpected development: Sick humor.
There was a lot of it. The Subway owner who got reprimanded for putting “Our subs don’t implode” on his sign was minor league compared with other things circulating on the Internet. One example that was sent to me showed the late Stockton Rush, OceanGate’s co-owner, as the new spokesman for Cap’n Crunch.

Of course, this is nothing new. People have made jokes about awful situations since to the dawn of civilization.
Why do we do this?
Humor is a remarkably human trait. There’s evidence other mammals have it, but not to the extent we do. We’ve created a multitude of forms that vary between cultures. But there isn’t a civilization or culture on Earth that doesn’t have humor.
Why we developed it I’ll leave to others, though I assume a key part is that it strengthens bonds between people, helping them stick together in the groups that keep society moving forward.
Sick humor is part of this, though having grown up watching Monty Python and reading National Lampoon magazine I’m certainly guilty of enjoying it. To this day I think “Eating Raoul” is one of the greatest comedies ever.
It’s also pretty common in medicine. I’ve been involved in plenty of hospital situations that were quite unfunny, yet there are always jokes about it flying as we work.
I assume it’s a defense mechanism. Helping us cope with a bad situation as we do our best to deal with it. Using humor to put a block between the obvious realization that someday this could happen to us. To help psychologically shield us from something tragic.
Years ago I was trying to describe the plot of “Eating Raoul” and said “if you read about this sort of crime spree in a newspaper you’d be horrified. But the way it’s handled in the movie it’s hysterical.” Perhaps that’s as close to understanding sick humor as I’ll ever get. It makes the unfunny funny.
Perhaps the better phrase is the more generic “it’s human nature.”
Whether or not it’s funny depends on the person. There were plenty of people horrified by the Subway sign, enough that the owner had to change it. But there were also those who admitted they found it tasteless, but still got a laugh out of it. I’m sure the families of those lost on the Titan were justifiably upset, but the closer you get to a personal tragedy the more serious it is.
There’s a fine line, as National Lampoon put it, between funny and sick. But it’s also part of who we are.
Dr. Block has a solo neurology practice in Scottsdale, Ariz.
This past June, during the search for the Titan submersible, and since then, we’ve had a not-entirely-unexpected development: Sick humor.
There was a lot of it. The Subway owner who got reprimanded for putting “Our subs don’t implode” on his sign was minor league compared with other things circulating on the Internet. One example that was sent to me showed the late Stockton Rush, OceanGate’s co-owner, as the new spokesman for Cap’n Crunch.
Of course, this is nothing new. People have made jokes about awful situations since to the dawn of civilization.
Why do we do this?
Humor is a remarkably human trait. There’s evidence other mammals have it, but not to the extent we do. We’ve created a multitude of forms that vary between cultures. But there isn’t a civilization or culture on Earth that doesn’t have humor.
Why we developed it I’ll leave to others, though I assume a key part is that it strengthens bonds between people, helping them stick together in the groups that keep society moving forward.
Sick humor is part of this, though having grown up watching Monty Python and reading National Lampoon magazine I’m certainly guilty of enjoying it. To this day I think “Eating Raoul” is one of the greatest comedies ever.
It’s also pretty common in medicine. I’ve been involved in plenty of hospital situations that were quite unfunny, yet there are always jokes about it flying as we work.
I assume it’s a defense mechanism. Helping us cope with a bad situation as we do our best to deal with it. Using humor to put a block between the obvious realization that someday this could happen to us. To help psychologically shield us from something tragic.
Years ago I was trying to describe the plot of “Eating Raoul” and said “if you read about this sort of crime spree in a newspaper you’d be horrified. But the way it’s handled in the movie it’s hysterical.” Perhaps that’s as close to understanding sick humor as I’ll ever get. It makes the unfunny funny.
Perhaps the better phrase is the more generic “it’s human nature.”
Whether or not it’s funny depends on the person. There were plenty of people horrified by the Subway sign, enough that the owner had to change it. But there were also those who admitted they found it tasteless, but still got a laugh out of it. I’m sure the families of those lost on the Titan were justifiably upset, but the closer you get to a personal tragedy the more serious it is.
There’s a fine line, as National Lampoon put it, between funny and sick. But it’s also part of who we are.
Dr. Block has a solo neurology practice in Scottsdale, Ariz.
Pain mismanagement by the numbers
Despite my best efforts to cultivate acquaintances across a broader age group, my social circle still has the somewhat musty odor of septuagenarians. We try to talk about things beyond the weather and grandchildren but pain scenarios surface with unfortunate frequency. Arthritic joints ache, body parts wear out or become diseased and have to be removed or replaced. That stuff can hurt.
There are two pain-related themes that seem to crop up more frequently than you might expect. The first is the unfortunate side effects of opioid medication – most often gastric distress and vomiting, then of course there’s constipation. They seem so common that a good many of my acquaintances just plain refuse to take opioids when they have been prescribed postoperatively because of their vivid memories of the consequences or horror stories friends have told.

The second theme is the general annoyance with the damn “Please rate your pain from one to ten” request issued by every well-intentioned nurse. Do you mean the pain I am having right now, this second, or last night, or the average over the last day and a half? Or should I be comparing it with when I gave birth 70 years ago, or when I stubbed my toe getting out of the shower last week? And then what are you going to do with my guesstimated number?
It may surprise some of you that 40 years ago there wasn’t a pain scale fetish. But a few observant health care professionals realized that many of our patients were suffering because we weren’t adequately managing their pain. In postoperative situations this was slowing recovery and effecting outcomes. Like good pseudoscientists, they realized that we should first quantify the pain and the notion that no pain should go unrated came into being. Nor should pain go untreated, which is too frequently interpreted as meaning unmedicated.
For example a systematic review of 61 studies of juvenile idiopathic arthritis (JIA) published in the journal Pediatric Rheumatology found that there was positive relationship between pain and a child’s belief that pain causes harm, disability, and lack of control. Not surprisingly, stress was also associated with pain intensity.
It is a long paper and touches on numerous other associations of varying degrees of strength between parental, social, and other external factors. But, in general, they were not as consistent as those related to a child’s beliefs.
Before, or at least at the same time, we treat a patient’s pain, we should learn more about that patient – his or her concerns, beliefs, and stressors. You and I may have exactly the same hernia operation, but if you have a better understanding of why you are going to feel uncomfortable after the surgery, and understand that not every pain is the result of a complication, I suspect you are more likely to complain of less pain.
The recent JIA study doesn’t claim to suggest therapeutic methods. However, one wonders what the result would be if we could somehow alter a patient’s belief system so that he or she no longer sees pain as always harmful, nor does the patient see himself or herself as powerless to do anything about the pain. To do this experiment we must follow up our robotic request to “rate your pain” with a dialogue in which we learn more about the patient. Which means probing believes, fears, and stressors.
You can tell me this exercise would be unrealistic and time consuming. But I bet in the long run it will save time. Even if it doesn’t it is the better way to manage pain.
Dr. Wilkoff practiced primary care pediatrics in Brunswick, Maine, for nearly 40 years. He has authored several books on behavioral pediatrics, including “How to Say No to Your Toddler.” Other than a Littman stethoscope he accepted as a first-year medical student in 1966, Dr. Wilkoff reports having nothing to disclose. Email him at [email protected].
Despite my best efforts to cultivate acquaintances across a broader age group, my social circle still has the somewhat musty odor of septuagenarians. We try to talk about things beyond the weather and grandchildren but pain scenarios surface with unfortunate frequency. Arthritic joints ache, body parts wear out or become diseased and have to be removed or replaced. That stuff can hurt.
There are two pain-related themes that seem to crop up more frequently than you might expect. The first is the unfortunate side effects of opioid medication – most often gastric distress and vomiting, then of course there’s constipation. They seem so common that a good many of my acquaintances just plain refuse to take opioids when they have been prescribed postoperatively because of their vivid memories of the consequences or horror stories friends have told.
The second theme is the general annoyance with the damn “Please rate your pain from one to ten” request issued by every well-intentioned nurse. Do you mean the pain I am having right now, this second, or last night, or the average over the last day and a half? Or should I be comparing it with when I gave birth 70 years ago, or when I stubbed my toe getting out of the shower last week? And then what are you going to do with my guesstimated number?
It may surprise some of you that 40 years ago there wasn’t a pain scale fetish. But a few observant health care professionals realized that many of our patients were suffering because we weren’t adequately managing their pain. In postoperative situations this was slowing recovery and effecting outcomes. Like good pseudoscientists, they realized that we should first quantify the pain and the notion that no pain should go unrated came into being. Nor should pain go untreated, which is too frequently interpreted as meaning unmedicated.
For example a systematic review of 61 studies of juvenile idiopathic arthritis (JIA) published in the journal Pediatric Rheumatology found that there was positive relationship between pain and a child’s belief that pain causes harm, disability, and lack of control. Not surprisingly, stress was also associated with pain intensity.
It is a long paper and touches on numerous other associations of varying degrees of strength between parental, social, and other external factors. But, in general, they were not as consistent as those related to a child’s beliefs.
Before, or at least at the same time, we treat a patient’s pain, we should learn more about that patient – his or her concerns, beliefs, and stressors. You and I may have exactly the same hernia operation, but if you have a better understanding of why you are going to feel uncomfortable after the surgery, and understand that not every pain is the result of a complication, I suspect you are more likely to complain of less pain.
The recent JIA study doesn’t claim to suggest therapeutic methods. However, one wonders what the result would be if we could somehow alter a patient’s belief system so that he or she no longer sees pain as always harmful, nor does the patient see himself or herself as powerless to do anything about the pain. To do this experiment we must follow up our robotic request to “rate your pain” with a dialogue in which we learn more about the patient. Which means probing believes, fears, and stressors.
You can tell me this exercise would be unrealistic and time consuming. But I bet in the long run it will save time. Even if it doesn’t it is the better way to manage pain.
Dr. Wilkoff practiced primary care pediatrics in Brunswick, Maine, for nearly 40 years. He has authored several books on behavioral pediatrics, including “How to Say No to Your Toddler.” Other than a Littman stethoscope he accepted as a first-year medical student in 1966, Dr. Wilkoff reports having nothing to disclose. Email him at [email protected].
Plant-based or animal-based diet: Which is better?
This transcript has been edited for clarity.
Dr. Jain: I’m Akshay Jain, an endocrinologist in Vancouver. This is Dr. Christopher Gardner, a nutritional scientist at Stanford. He is the author of many publications, including the widely cited SWAP-MEAT study. He was also a presenter at the American Diabetes Association conference in San Diego in 2023.
We’ll be talking about his work and the presentation that he did classifying different kinds of diets as well as the pluses and minuses of a plant-based diet versus an animal-based diet. Welcome, Dr Gardner.
Dr. Gardner: Glad to be here.
Dr. Jain: Let’s get right into this. There’s obviously been a large amount of talk, both in the lay media and in the scientific literature, on plant-based diets versus animal-based diets.
Dr. Gardner: I think this is one of those false dichotomies. It’s really not all one or all the other. Two of my favorite sayings are “with what” and “instead of what.” You may be thinking, I’m really going to go for animal based. I know it’s low carb. I have diabetes. I know animal foods have few carbs in them.
That’s true. But think of some of the more and the less healthy animal foods. Yogurt is a great choice for an animal food. Fish is a great choice for an animal food with omega-3s. Chicken McNuggets, not so much.
Then, you switch to the plant side and say: “I’ve heard all these people talking about a whole-food, plant-based diet. That sounds great. I’m thinking broccoli and chickpeas.”
I know there’s somebody out there saying: “I just had a Coke. Isn’t that plant based? I just had a pastry. Isn’t that full of plants?” It doesn’t really take much to think about this, but it’s not as dichotomous as animal versus plant.
Dr. Jain: There is, obviously, a good understanding regarding what actually constitutes the diet. Initially, people were saying that animal-based diets are really bad from a cardiovascular perspective. But now, some studies are suggesting that it may not be true. What’s your take on that?
Dr. Gardner: Again, if you think “with what” or “instead of what,” microbiome is a super-hot topic. That’s really fiber and fermented food, which are only plants. Saturated fat, despite all the controversy, raises your blood cholesterol. It’s more prevalent in animal foods than in plant foods.
Are there any great nutrients in animal foods? Sure. There’s calcium in dairy products for osteoporosis. There’s iron. Actually, people can get too much iron, which can be a pro-oxidant in levels that are too high.
The American Heart Association, in particular, which I’m very involved with, came out with new guidelines in 2021. It was very plant focused. The top of the list was vegetables, fruits, whole grains, and protein. When it came to protein, it was mostly from lentils, beans, and grains.
Dr. Jain: That’s good to know. Let’s talk about protein. We often hear about how somebody on a plant-based diet only can never have all the essential amino acids and the amount of protein that one needs. Whether it’s for general everyday individuals or even more so for athletes or bodybuilders, you cannot get enough good-quality protein from a plant-based diet.
Is there any truth to that? If not, what would you suggest for everyday individuals on a plant-based diet?
Dr. Gardner: This one drives me nuts. Please stop obsessing about protein. This isn’t a very scientific answer, but go watch the documentary Game Changers, which is all about vegan athletes. There are some pretty hokey things in that film that are very unscientific.
Let’s go back to basics, since we only have a couple of minutes together. It is a myth that plants don’t have all the amino acids, including all nine essential amino acids. I have several YouTube rants about this if anybody wants to search “Gardner Stanford protein.” All plant foods have all nine essential amino acids and all 20 amino acids.
There is a modest difference. Grains tend to be a little low in lysine, and beans tend to be a little low in methionine. Part of this has to do with how much of a difference is a little low. If you go to protein requirements that were written up in 2005 by the Institute of Medicine, you’ll see that the estimated average requirement for adults is 0.66 g/kg of body weight.
If we recommended the estimated average requirement for everyone, and everyone got it, by definition, half the population would be deficient. We have recommended daily allowances. The recommended daily allowances include two standard deviations above the estimated average requirement. Why would we do that? It’s a population approach.
If that’s the goal and everybody got it, you’d actually still have the tail of the normal distribution that would be deficient, which would be about 2.5%. The flip side of that argument is how many would exceed their requirement? That’s 97.5% of the population who would exceed their requirement if they got the recommended daily allowance.
The recommended daily allowance translates to about 45 g of protein per day for women and about 55 g of protein per day for men. Today, men and women in the United States get 80 g, 90 g, and 100 g of protein per day. What I hear them say is: “I’m not sure if I need the recommended daily allowance. I feel like I’m extra special or I’m above the curve and I want to make sure I’m getting enough.”
The recommended daily allowance already has a safety buffer in it. It was designed that way.
Let’s flip to athletes just for a second. Athletes want to be more muscular and make sure they’re supporting their activity. Americans get 1.2-1.5 g of protein per kg of body weight per day, which is almost double.
Athletes don’t eat as many calories as the average American does. If they’re working out to be muscular, they’re not eating 2,000 or 2,500 calories per day. I have a Rose Bowl football player teaching assistant from a Human Nutrition class at Stanford. He logged what he was eating for his football workouts. He was eating 5,000 calories per day. He was getting 250 g of protein per day, without any supplements or shakes.
I really do think this whole protein thing is a myth. As long as you get a reasonable amount of variety in your diet, there is no problem meeting your protein needs. Vegetarians? Absolutely no problem because they’re getting dairy and some eggs and things. Even vegans are likely fine. They would have to pay a little more attention to this, but I know many very strong, healthy vegans.
Dr. Jain: This is so helpful, Dr Gardner. I know that many clinicians, including myself, will find this very helpful, including when we talk to our patients and counsel them on their requirements. Thanks for sharing that.
Final question for you. We know people who are on either side of the extreme: either completely plant based or completely animal based. For a majority of us that have some kind of a happy medium, what would your suggestions be as far as the macronutrient distribution that you would recommend from a mixed animal- and plant-based diet? What would be the ideal recommendations here?
Dr. Gardner: We did a huge weight loss study with people with prediabetes. It was as low in carbs as people could go and as low in fat as people could go. That didn’t end up being the ketogenic level or the low-fat, vegan level. That ended up being much more moderate.
We found that people were successful either on low carb or low fat. Interestingly, on both diets, protein was very similar. Let’s not get into that since we just did a lot of protein. The key was a healthy low carb or a healthy low fat. I actually think we have a lot of wiggle room there. Let me build on what you said just a moment ago.
I really don’t think you need to be vegan to be healthy. We prefer the term whole food, plant based. If you’re getting 70% or 80% of your food from plants, you’re fine. If you really want to get the last 5%, 10%, or 15% all from plants, the additional benefit is not going to be large. You might want to do that for the environment or animal rights and welfare, but from a health perspective, a whole-food, plant-based diet leaves room for some yogurt, fish, and maybe some eggs for breakfast instead of those silly high-carb breakfasts that most Americans eat.
I will say that animal foods have no fiber. Given what a hot topic the microbiome is these days, the higher and higher you get in animal food, it’s going to be really hard to get antioxidants, most of which are in plants, and very hard to get enough fiber, which is good for the microbiome.
That’s why I tend to follow along the lines of a whole-food, plant-based diet that leaves some room for meat and animal-sourced foods, which you could leave out and be fine. I wouldn’t go in the opposite direction to the all-animal side.
Dr. Jain: That was awesome. Thank you so much, Dr Gardner. Final pearl of wisdom here. When clinicians like us see patients with diabetes, what should be the final take-home message that we can counsel our patients about?
Dr. Gardner: That’s a great question. I don’t think it’s really so much animal or plants; it’s actually type of carbohydrate. There’s a great paper out of JAMA in 2019 or 2020 by Shan and colleagues. They looked at the proportion of calories from proteins, carbs, and fats over about 20 years, and they looked at the subtypes.
Very interestingly, protein from animal foods is about 10% of calories; from plants, about 5%; mono-, poly-, and saturated fats are all about 10% of calories; and high-quality carbohydrates are about 10% of calories. What’s left is 40% of calories from crappy carbohydrates. We eat so many calories from added sugars and refined grains, and those are plant-based. Added sugars and refined grains are plant-based.
In terms of a lower-carbohydrate diet, there is an immense amount of room for cutting back on that 40%. What would you do with that? Would you eat more animal food? Would you eat more plant food? This is where I think we have a large amount of wiggle room. If the patients could get rid of all or most of that 40%, they could pick some eggs, yogurt, fish, and some high-fat foods. They could pick avocados, nuts, seeds, and olive oil or they could have more broccoli, chickpeas, tempeh, and tofu.
There really is a large amount of wiggle room. The key – can we please get rid of the elephant in the room, which is plant food – is all that added sugar and refined grain.
Dr. Jain is an endocrinologist and clinical instructor University of British Columbia, Vancouver. Dr. Gardner is a professor of medicine at Stanford (Calif.) University. Dr. Jain reported numerous conflicts of interest with various companies; Dr. Gardner reported receiving research funding from Beyond Meat.
A version of this article first appeared on Medscape.com.
What AI can see in CT scans that humans can’t
This transcript has been edited for clarity.
If a picture is worth a thousand words, then a CT scan of the chest might as well be Atlas Shrugged. When you think of the sheer information content in one of those scans, it becomes immediately clear that our usual method of CT scan interpretation must be leaving a lot on the table. After all, we can go through all that information and come out with simply “normal” and call it a day.
Of course, radiologists can glean a lot from a CT scan, but they are trained to look for abnormalities. They can find pneumonia, emboli, fractures, and pneumothoraces, but the presence or absence of life-threatening abnormalities is still just a fraction of the data contained within a CT scan.
Pulling out more data from those images – data that may not indicate disease per se, but nevertheless tell us something important about patients and their risks – might just fall to those entities that are primed to take a bunch of data and interpret it in new ways: artificial intelligence (AI).
I’m thinking about AI and CT scans this week thanks to this study, appearing in the journal Radiology, from Kaiwen Xu and colleagues at Vanderbilt.
In a previous study, the team had developed an AI algorithm to take chest CT images and convert that data into information about body composition: skeletal muscle mass, fat mass, muscle lipid content – that sort of thing.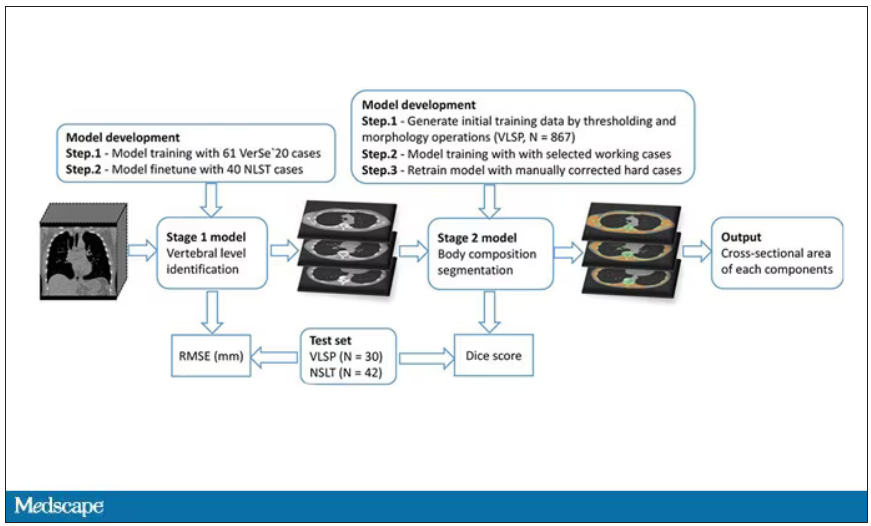
While the radiologists are busy looking for cancer or pneumonia, the AI can create a body composition report – two results from one data stream.
Here’s an example of a report generated from a CT scan from the authors’ GitHub page.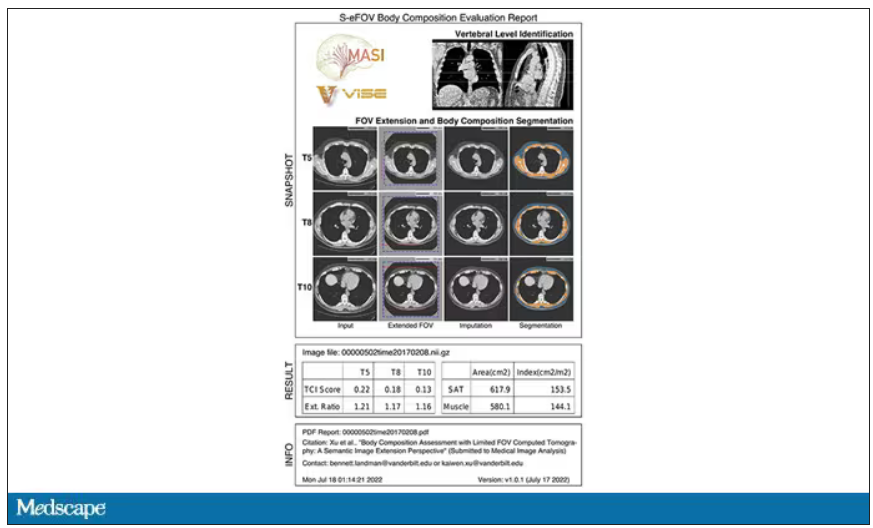
The cool thing here is that this is a clinically collected CT scan of the chest, not a special protocol designed to assess body composition. In fact, this comes from the low-dose lung cancer screening trial dataset.
As you may know, the U.S. Preventive Services Task Force recommends low-dose CT screening of the chest every year for those aged 50-80 with at least a 20 pack-year smoking history. These CT scans form an incredible dataset, actually, as they are all collected with nearly the same parameters. Obviously, the important thing to look for in these CT scans is whether there is early lung cancer. But the new paper asks, as long as we can get information about body composition from these scans, why don’t we? Can it help to risk-stratify these patients?
They took 20,768 individuals with CT scans done as part of the low-dose lung cancer screening trial and passed their scans through their automated data pipeline.
One cool feature here: Depending on body size, sometimes the edges of people in CT scans are not visible. That’s not a big deal for lung-cancer screening as long as you can see both lungs. But it does matter for assessment of muscle and body fat because that stuff lives on the edges of the thoracic cavity. The authors’ data pipeline actually accounts for this, extrapolating what the missing pieces look like from what is able to be seen. It’s quite clever.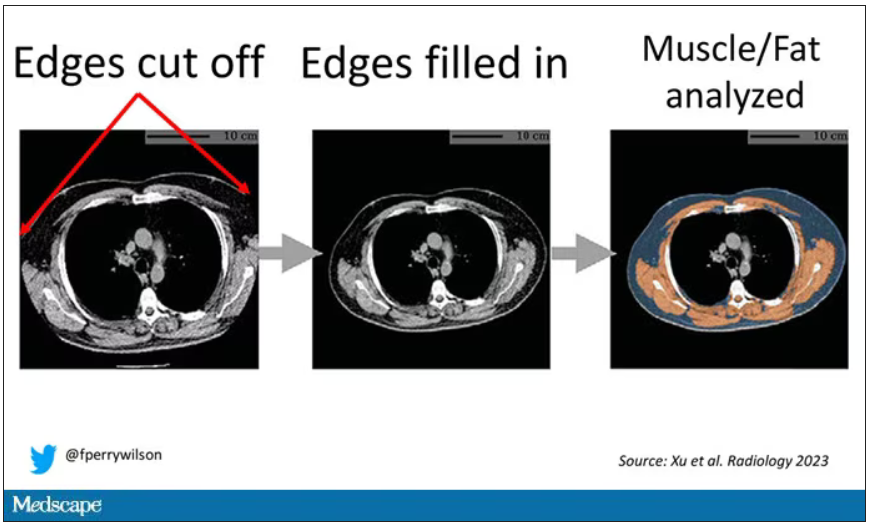
On to some results. Would knowledge about the patient’s body composition help predict their ultimate outcome?
It would. And the best single predictor found was skeletal muscle attenuation – lower levels of skeletal muscle attenuation mean more fat infiltrating the muscle – so lower is worse here. You can see from these all-cause mortality curves that lower levels were associated with substantially worse life expectancy.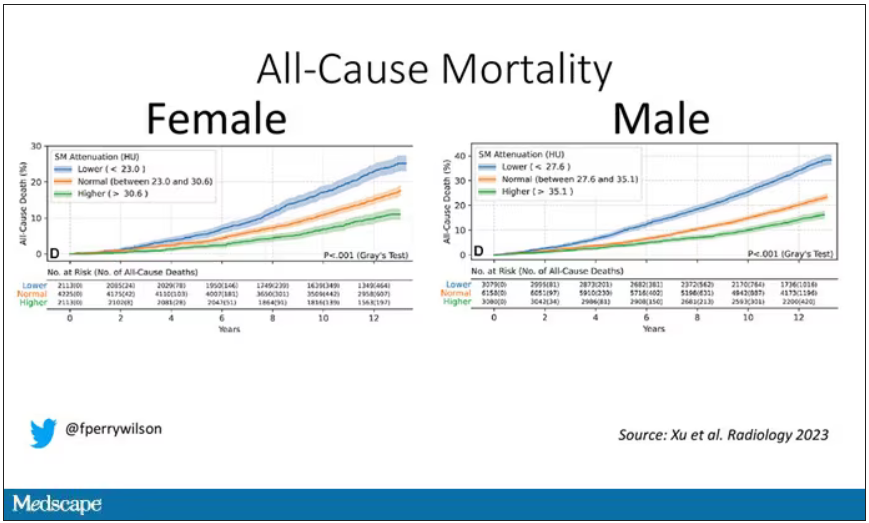
It’s worth noting that these are unadjusted curves. While AI prediction from CT images is very cool, we might be able to make similar predictions knowing, for example, the age of the patient. To account for this, the authors adjusted the findings for age, diabetes, heart disease, stroke, and coronary calcium score (also calculated from those same CT scans). Even after adjustment, skeletal muscle attenuation was significantly associated with all-cause mortality, cardiovascular mortality, and lung-cancer mortality – but not lung cancer incidence.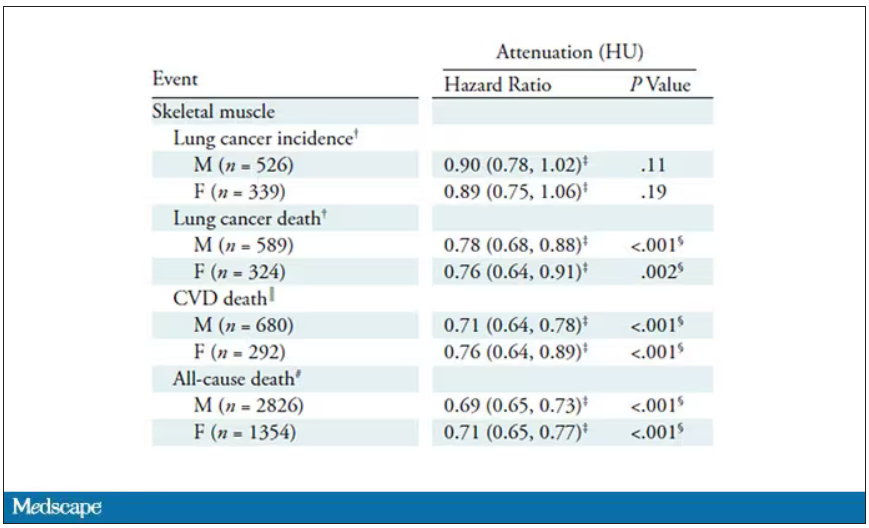
Those results tell us that there is likely a physiologic significance to skeletal muscle attenuation, and they provide a great proof-of-concept that automated data extraction techniques can be applied broadly to routinely collected radiology images.
That said, it’s one thing to show that something is physiologically relevant. In terms of actually predicting outcomes, adding this information to a model that contains just those clinical factors like age and diabetes doesn’t actually improve things very much. We measure this with something called the concordance index. This tells us the probability, given two individuals, of how often we can identify the person who has the outcome of interest sooner – if at all. (You can probably guess that the worst possible score is thus 0.5 and the best is 1.) A model without the AI data gives a concordance index for all-cause mortality of 0.71 or 0.72, depending on sex. Adding in the body composition data bumps that up only by a percent or so.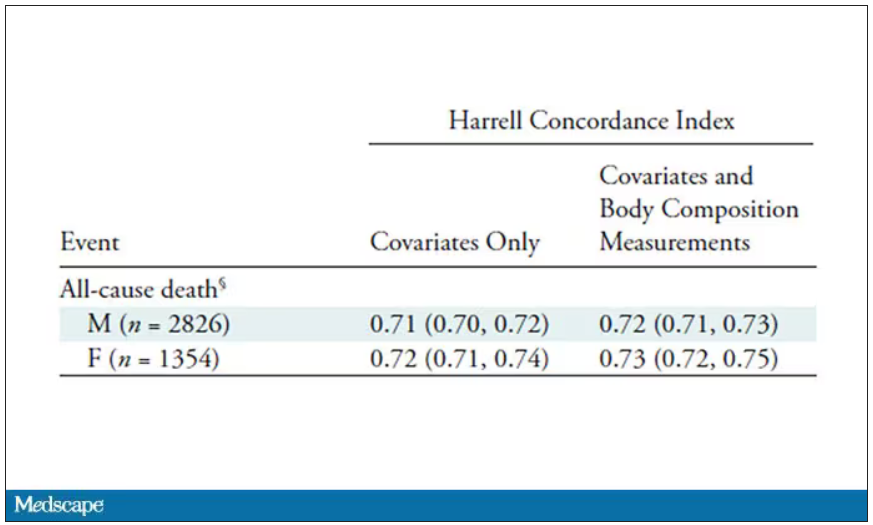
This honestly feels a bit like a missed opportunity to me. The authors pass the imaging data through an AI to get body composition data and then see how that predicts death.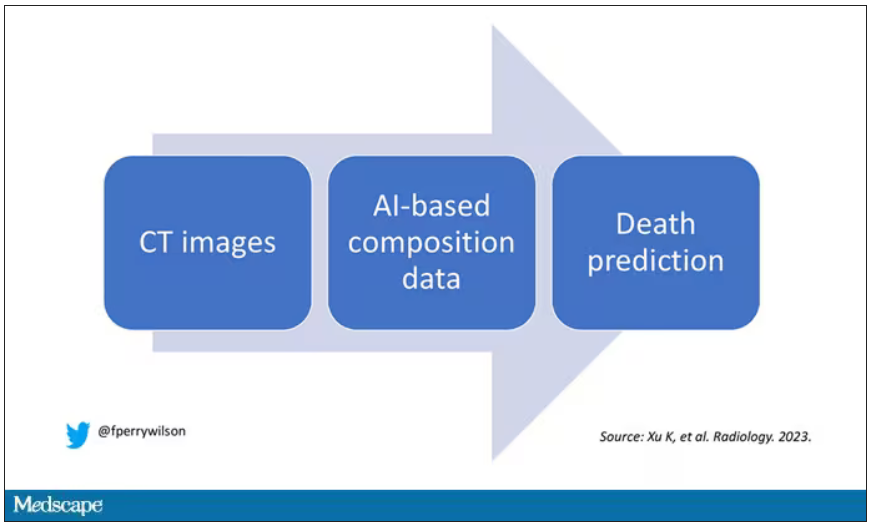
Why not skip the middleman? Train a model using the imaging data to predict death directly, using whatever signal the AI chooses: body composition, lung size, rib thickness – whatever.
I’d be very curious to see how that model might improve our ability to predict these outcomes. In the end, this is a space where AI can make some massive gains – not by trying to do radiologists’ jobs better than radiologists, but by extracting information that radiologists aren’t looking for in the first place.
F. Perry Wilson, MD, MSCE, is associate professor of medicine and public health and director of Yale’s Clinical and Translational Research Accelerator in New Haven, Conn. He reported no conflicts of interest.
A version of this article first appeared on Medscape.com.