User login
The American Journal of Orthopedics is an Index Medicus publication that is valued by orthopedic surgeons for its peer-reviewed, practice-oriented clinical information. Most articles are written by specialists at leading teaching institutions and help incorporate the latest technology into everyday practice.
Spontaneous Osteonecrosis of Knee After Arthroscopy Is Not Necessarily Related to the Procedure
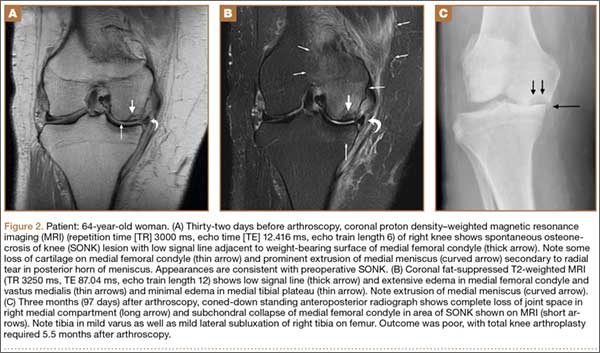
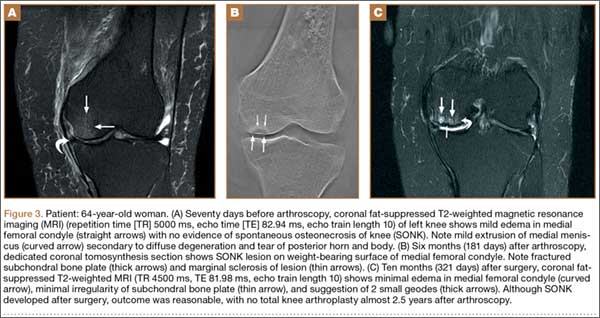
The term spontaneous osteonecrosis of the knee was first used by Ahlbäck1 in 1968. This term, and the acronym SONK (sometimes SPONK2), has subsequently been used by other authors to refer to an apparent osteonecrosis of the knee, most commonly occurring within the medial femoral condyle. SONK typically occurs in older women who usually do not have the typical osteonecrosis risk factors, such as steroid use, sickle-cell anemia, and excessive alcohol intake. Furthermore, the radiologic appearance of SONK differs from the typical avascular necrosis findings seen with radiography and magnetic resonance imaging (MRI). In particular, on MRI, the abnormality of SONK does not have the typical serpiginous margin of bone infarction, or the double-line sign indicating both sclerosis and granulation tissue.3 SONK is normally seen as a line of signal intensity on T1- and T2-weighted sequences; this line is adjacent to or parallels the subchondral bone with an adjacent area of extensive edema.
There is dispute over the cause of SONK. Yamamoto and Bullough4 proposed the lesion is in part a subchondral insufficiency fracture and staged it into 4 parts. Histologic findings suggest at least some SONK lesions are subchondral insufficiency fractures.5 Brahme and colleagues6 were the first to describe SONK occurring after arthroscopy, and others have documented this finding. The condition has also been referred to as osteonecrosis in the postoperative knee.7-13 An association of postoperative SONK with cartilage loss and meniscal tear has been proposed.7-13
We reviewed the clinical, radiologic, and MRI findings in 11 patients with evidence of postarthroscopy SONK to try to identify any risk factors that might predispose them to poor outcomes. Our study population consisted of 11 patients (12 knees) with SONK; 6 of the knees had the lesion before knee arthroscopy, and the other 6 developed the lesion after arthroscopy. We also considered MRI findings in a group of 11 age- and sex-matched patients who underwent knee arthroscopy and did not have or develop SONK. We reviewed the preoperative MRI findings of both groups for meniscal tear, meniscal extrusion, and cartilage loss. We had 2 hypotheses. First, patients with preoperative MRI findings of SONK would have articular cartilage changes, posterior root degeneration, and meniscal extrusion similar to those of patients who developed SONK after arthroscopy. Second, an age- and sex-matched group of patients who underwent arthroscopy and did not develop SONK would be similar in articular cartilage changes, posterior root degeneration or tear, and meniscal extrusion.
Materials and Methods
With institutional review board approval and waived informed consent, we reviewed all imaging studies, particularly the radiographs and MRI studies, of 11 patients (12 knees) who either had SONK before arthroscopy or developed it after arthroscopy. In all these cases, arthroscopy was performed to alleviate mechanical symptoms associated with meniscal tear.
On subsequent review by a musculoskeletal radiologist, 6 patients with SONK had an identifiable lesion before surgery. All patients’ symptoms had not improved with an earlier trial of conservative management. All preoperative and postoperative radiologic and MRI findings were reviewed. The patient group was assembled by writing to all the orthopedic surgeons who performed arthroscopy at our institution and asking for SONK cases seen in their practices. All but 2 cases were performed by a surgeon who treated a predominantly older, less active population. Clinical notes were reviewed for outcomes, and the musculoskeletal radiologist reviewed all radiologic studies. The 4 men and 7 women in the SONK group (1 woman had bilateral knee lesions) ranged in age from 43 to 74 years (mean, 63.8 years), and the 4 men and 7 women in the control group were age-matched to 43 to 75 years (mean, 63.6 years). The controls were chosen from a pool of patients who underwent knee arthroscopy at our institution.
MRI was performed using General Electric 1-T, 1.5-T, or 3-T magnets (GE Healthcare, Milwaukee, Wisconsin) or using Philips 1.5-T or open 0.7-T magnets (Philips Healthcare, Andover, Massachusetts). Imaging included sagittal and coronal proton density–weighted sequences and coronal and axial fat-suppressed T2-weighted sequences. SONK was diagnosed when a low signal line adjacent to the subchondral bone plate on the femoral or tibial condyles was present with an adjacent area of bone marrow edema in the respective condyle or when there was depression of the subchondral bone plate with adjacent edema. The MRI studies were reviewed for lesion location, and medial meniscus and lateral meniscus were reviewed for tear. Type of meniscal tear (horizontal cleavage, radial, complex degenerative) was documented, as was meniscal extrusion. The meniscus was regarded as extruded if the body extended more than 3 mm from the joint margin. Cartilage in the medial and lateral compartment was reviewed according to a modified Noyes scale listing 0 as normal, 1 as internal changes only, 2A as 1% to 49% cartilage loss, 2B as 50% to 90% loss of articular cartilage, 3A as 100% articular cartilage loss with subchondral bone plate intact, and 3B as 100% articular cartilage loss with ulcerated subchondral bone plate.14 Osteoarthritic severity was similarly classified using the Kellgren-Lawrence scale,15 where grade 0 is normal; grade 1 is unlikely to have narrowing of the joint space but potentially has osteophytic lipping; grade 2 has both definite narrowing of the joint space and osteophytes; grade 3 has narrowing of the joint space and multiple osteophytes, some sclerosis, and possible deformity of bone contour; and grade 4 has marked narrowing of the joint space, large osteophytes, severe sclerosis, and definite deformity of bone contour. Follow-up clinical notes and radiologic studies were reviewed in the assessment of patient outcomes.
All statistical analyses were performed with SAS 9.2 software (SAS Institute, Cary, North Carolina). Age data were evaluated with the Shapiro-Wilk test and graphical displays and were found to violate normality assumptions, so they are presented as medians and ranges; other variables are presented as count and column percentages. The Wilcoxon rank sum test was used to compare the 2 groups’ age distributions. Fisher exact tests were used to compare proportions between the 2 groups for the other variables. Statistical significance was set at P < .05.
Results
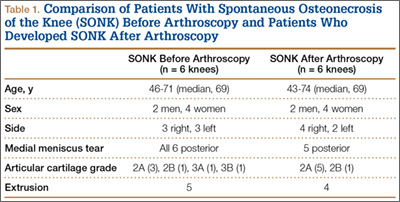
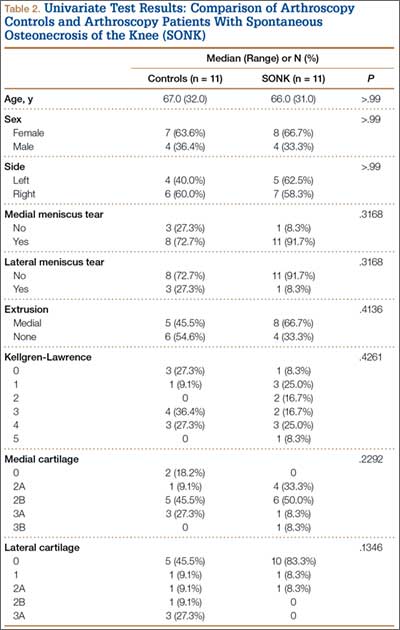
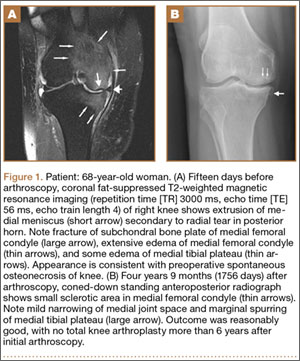
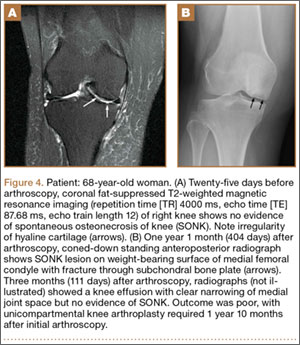
Table 1 lists the demographics and imaging characteristics of the 11 patients—6 had SONK before arthroscopy and 6 developed it after arthroscopy. Comparison of the 11 patients with SONK and the 11 controls is summarized with P values in Table 2. Representative cases that either presented before surgery or developed after surgery are shown in Figures 1 to 4. There were 6 prearthroscopy lesions and 6 postarthroscopy lesions—all 12 in the medial femoral condyle. Eleven of the 12 knees had a medial meniscal tear, and 1 knee had both medial and lateral meniscal tears. In 8 of the 12 knees, the lateral meniscus was normal; in 2 knees, it had mild degeneration; and, in 1 knee, it had a complex tear. Assessment of hyaline cartilage revealed medial cartilage loss ranging from 2A to 3B (median, 2B) in the patients with SONK, and lateral cartilage loss ranging from 0 to 2A (median, 0). At surgery, all knees had a partial medial meniscectomy, and 6 had a partial lateral meniscectomy. Ten of the 12 knees had chondroplasty, 9 patellar and 5 of the medial femoral condyle. Only 4 of the 11 patients with follow-up of more than 1 year went on to joint replacement. Six of the 12 had follow-up of more than 2 years. Of the 6 patients without an identifiable SONK lesion on MRI before arthroscopy, 4 had mild to moderate knee pain 0.5, 2.4, 3.5, and 4 years after surgery. For the other 2 patients, knee replacement was performed 1.5 and 1.8 years after surgery. Of the 6 patients with prearthroscopy SONK, 4 had mild to moderate knee pain 1.5, 3.7, 6.5, and 6.8 years after surgery; the other 2 had knee replacement 0.5 and 1.8 years after surgery. Articular cartilage degeneration and meniscal extrusion were similar (Table 1). In the control group, there was only 1 knee replacement, at 3 years, and the other 11 were functioning 2.6 to 5 years later. The longer follow-up resulted from selection of appropriate controls from the same year. Of the 6 SONK lesions found on preoperative MRI, 3 were read by the interpreting radiologist before surgery as possible SONK lesions, 2 were read as insufficiency fractures, and 1 was read as a possible insufficiency fracture.
Discussion
SONK is well described as a complication of arthroscopic knee surgery. However, this condition more commonly appears spontaneously in a population that has not had surgery. It has become clear that the term SONK may be misleading.16 In a recent series of postoperative subchondral fractures reported by MacDessi and colleagues,5 the average age of patients included in their study was 64 years. Pathologic analysis revealed subchondral fracture with callus formation in all cases. Only 2 knees had evidence of osteonecrosis, which appeared to be secondary to the fracture. Based on these findings, the authors concluded that “further investigation into the etiology of this condition is warranted.” A prominent association with medial meniscal tear has been noted, with the medial femoral condyle predominantly affected. As already mentioned, SONK differs from classical avascular necrosis on several points, including lack of the typical avascular osteonecrosis risk factors and absence of the serpiginous margin and double-line sign seen with typical bone infarction. In addition, the SONK lesions seen on radiographs and MRIs of the knee typically are in the medial femoral condyle and are very different from the typical area of infarction seen in patients with known risk factors for secondary osteonecrosis.
The cause of SONK is not known. Of more importance from a medicolegal standpoint is that these lesions are not necessarily related to arthroscopy.17 Interestingly, Pape and colleagues17 noted that some of the lesions they studied may have been present before surgery, which is what we found in 6 (50%) of the SONK knees in our study. Our data thus support the proposition that some SONK lesions are present before arthroscopy, and some cases of so-called postarthroscopy SONK may in fact have been progressing before surgery.
Our data also reinforce the importance of radiologist–orthopedic surgeon communication regarding the presence of SONK. We emphasize the importance of communicating the MRI findings clearly, whether the lesion is called SONK, SPONK, or insufficiency fracture. The orthopedic surgeons in our series may have been unaware of the presence of these lesions before arthroscopic meniscectomy, given the wide variety of terms being used in radiologic reports.
The natural history of spontaneous osteonecrosis of the medial tibial plateau has also been studied.18 There were 3 outcome patterns—acute extensive collapse of the medial tibial plateau, rapid progression to varying degrees of osteoarthritis, and complete resolution. It has been shown that resolution of SONK can occur in the early stages of the disease, within several months, but often the changes progress to bone destruction and articular cartilage collapse.19
In our series of patients, there was a female predominance, and mean age was 64 years. We investigated cartilage loss, meniscal tear, and meniscal extrusion to see if we could predict outcomes in patients who had the lesion before arthroscopy and if we could predict who might be at risk for developing the lesion after arthroscopy. Type of surgical procedure was also reviewed. For the sake of simplicity, we divided the follow-up patients into 2 groups: those managed with conservative treatment, which we deemed a reasonable outcome, and those who subsequently required knee joint replacement, which we deemed a poor outcome. As seen from our representative cases, both groups had patients with cartilage loss, meniscal tear, and meniscal extrusion to varying degrees. There were no risk factors pointing to a reasonable or poor outcome. In the group of patients with prearthroscopy lesions, we found the same problem. We were unable to identify a risk factor that might suggest a poor rather than a reasonable outcome. We must also emphasize that, in our review of patient charts, we could find no other causes for osteonecrosis. In particular, arthroscopic causes of acute chondral loss (eg, thermal wash, laser, bupivacaine pain pumps, epinephrine in irrigant) were not identified.
This study consisted of a series of cases managed at our institution over the past 8 years. Our data and this study had several limitations:
We may have been unable to identify other SONK cases that belonged in the group from our institution. In addition, we had only 11 patients for comparison with patients without SONK. Likewise, there were only 6 knees each in the prearthroscopy and postarthroscopy SONK groups. We also used images obtained from 1-T, 1.5-T, and 3-T closed MRI devices and one 0.7-T open device. These were, however, at the same institution.
Timing of our imaging was not uniform. In particular, in 3 of the patients who developed SONK after arthroscopy, preoperative MRI studies were performed quite some time before surgery. However, in these patients, more recent preoperative radiographs did not show any evidence of lesions. It can also be seen that postarthroscopy follow-up of patients varied. It is possible that, on longer follow-up, some of the cases we classified as having a reasonable outcome may have gone on to require total knee arthroplasty. One could argue that, in the patient who developed SONK within 1 year after surgery (Figure 4), the lesion was not related to the surgery. However, this patient’s radiographs 3 months after surgery did not show the SONK lesion but clearly showed prominent medial joint space narrowing—a new finding.
Only 1 musculoskeletal radiologist evaluated the radiographs, MRIs, and tomosynthesis (similar to computed tomography) studies for this investigation.
This lesion is not common, thus giving us a small group to analyze.
Despite our data limitations and the retrospective nature of this study, we compiled a reasonably representative sample of surgical SONK patients that matches other samples reported in the literature. Unfortunately, we could not identify any risk factors pointing to the likelihood of developing SONK or any risk factors pointing to either a reasonable or a poor prognosis in these patients. The etiology of the lesion remains an enigma. Our finding 6 cases of prearthroscopy lesions that did not necessarily result in a poor outcome, combined with our inability to identify any risk factors for SONK, points to the lack of a causal relationship with arthroscopy.
1. Ahlbäck S. Osteoarthritis of the knee. A radiographic investigation. Acta Radiol Diagn. 1968;(suppl 277):7-72.
2. Juréus J, Lindstrand A, Geijer M, Robertsson O, Tägil M. The natural course of spontaneous osteonecrosis of the knee (SPONK): a 1- to 27-year follow-up of 40 patients. Acta Orthop. 2013;84(4):410-414.
3. Zurlo JV. The double-line sign. Radiology. 1999;212(2):541-542.
4. Yamamoto T, Bullough PG. Spontaneous osteonecrosis of the knee: the result of subchondral insufficiency fracture. J Bone Joint Surg Am. 2000;82(6):858-866.
5. MacDessi SJ, Brophy RH, Bullough PG, Windsor RE, Sculco TP. Subchondral fracture following arthroscopic knee surgery. A series of eight cases. J Bone Joint Surg Am. 2008;90(5):1007-1012.
6. Brahme SK, Fox JM, Ferkel RD, Friedman MJ, Flannigan BD, Resnick DL. Osteonecrosis of the knee after arthroscopic surgery: diagnosis with MR imaging. Radiology. 1991;178(3):851-853.
7. Faletti C, Robba T, de Petro P. Postmeniscectomy osteonecrosis. Arthroscopy. 2002;18(1):91-94.
8. Johnson TC, Evans JA, Gilley JA, DeLee JC. Osteonecrosis of the knee after arthroscopic surgery for meniscal tears and chondral lesions. Arthroscopy. 2000;16(3):254-261.
9. al-Kaar M, Garcia J, Fritschy D, Bonvin JC. Aseptic osteonecrosis of the femoral condyle after meniscectomy by the arthroscopic approach. J Radiol. 1997;78(4):283-288.
10. DeFalco RA, Ricci AR, Balduini FC. Osteonecrosis of the knee after arthroscopic meniscectomy and chondroplasty: a case report and literature review. Am J Sports Med. 2003;31(6):1013-1016.
11. Kusayama T. Idiopathic osteonecrosis of the femoral condyle after meniscectomy. Tokai J Exp Clin Med. 2003;28(4):145-150.
12. Prues-Latour V, Bonvin JC, Fritschy D. Nine cases of osteonecrosis in elderly patients following arthroscopic meniscectomy. Knee Surg Sports Traumatol Arthrosc. 1998;6(3):142-147.
13. Santori N, Condello V, Adriani E, Mariani PP. Osteonecrosis after arthroscopic medial meniscectomy. Arthroscopy. 1995;11(2):220-224.
14. Noyes FR, Stabler CL. A system for grading articular cartilage lesions at arthroscopy. Am J Sports Med. 1989;17(4):505-513.
15. Kellgren JH, Lawrence JS. Radiological assessment of osteo-arthrosis. Ann Rheum Dis. 1957;16(4):494-502.
16. Kidwai AS, Hemphill SD, Griffiths HJ. Radiologic case study. Spontaneous osteonecrosis of the knee reclassified as insufficiency fracture. Orthopedics. 2005;28(3):236, 333-236.
17. Pape D, Lorbach O, Anagnostakos K, Kohn D. Osteonecrosis in the postarthroscopic knee. Orthopade. 2008;37(11):1099-1107.
18. Satku K, Kumar VP, Chacha PB. Stress fractures around the knee in elderly patients. A cause of acute pain in the knee. J Bone Joint Surg Am. 1990;72(6):918-922.
19. Soucacos PN, Xenakis TH, Beris AE, Soucacos PK, Georgoulis A. Idiopathic osteonecrosis of the medial femoral condyle. Classification and treatment. Clin Orthop. 1997;(341):82-89.
The term spontaneous osteonecrosis of the knee was first used by Ahlbäck1 in 1968. This term, and the acronym SONK (sometimes SPONK2), has subsequently been used by other authors to refer to an apparent osteonecrosis of the knee, most commonly occurring within the medial femoral condyle. SONK typically occurs in older women who usually do not have the typical osteonecrosis risk factors, such as steroid use, sickle-cell anemia, and excessive alcohol intake. Furthermore, the radiologic appearance of SONK differs from the typical avascular necrosis findings seen with radiography and magnetic resonance imaging (MRI). In particular, on MRI, the abnormality of SONK does not have the typical serpiginous margin of bone infarction, or the double-line sign indicating both sclerosis and granulation tissue.3 SONK is normally seen as a line of signal intensity on T1- and T2-weighted sequences; this line is adjacent to or parallels the subchondral bone with an adjacent area of extensive edema.
There is dispute over the cause of SONK. Yamamoto and Bullough4 proposed the lesion is in part a subchondral insufficiency fracture and staged it into 4 parts. Histologic findings suggest at least some SONK lesions are subchondral insufficiency fractures.5 Brahme and colleagues6 were the first to describe SONK occurring after arthroscopy, and others have documented this finding. The condition has also been referred to as osteonecrosis in the postoperative knee.7-13 An association of postoperative SONK with cartilage loss and meniscal tear has been proposed.7-13
We reviewed the clinical, radiologic, and MRI findings in 11 patients with evidence of postarthroscopy SONK to try to identify any risk factors that might predispose them to poor outcomes. Our study population consisted of 11 patients (12 knees) with SONK; 6 of the knees had the lesion before knee arthroscopy, and the other 6 developed the lesion after arthroscopy. We also considered MRI findings in a group of 11 age- and sex-matched patients who underwent knee arthroscopy and did not have or develop SONK. We reviewed the preoperative MRI findings of both groups for meniscal tear, meniscal extrusion, and cartilage loss. We had 2 hypotheses. First, patients with preoperative MRI findings of SONK would have articular cartilage changes, posterior root degeneration, and meniscal extrusion similar to those of patients who developed SONK after arthroscopy. Second, an age- and sex-matched group of patients who underwent arthroscopy and did not develop SONK would be similar in articular cartilage changes, posterior root degeneration or tear, and meniscal extrusion.
Materials and Methods
With institutional review board approval and waived informed consent, we reviewed all imaging studies, particularly the radiographs and MRI studies, of 11 patients (12 knees) who either had SONK before arthroscopy or developed it after arthroscopy. In all these cases, arthroscopy was performed to alleviate mechanical symptoms associated with meniscal tear.
On subsequent review by a musculoskeletal radiologist, 6 patients with SONK had an identifiable lesion before surgery. All patients’ symptoms had not improved with an earlier trial of conservative management. All preoperative and postoperative radiologic and MRI findings were reviewed. The patient group was assembled by writing to all the orthopedic surgeons who performed arthroscopy at our institution and asking for SONK cases seen in their practices. All but 2 cases were performed by a surgeon who treated a predominantly older, less active population. Clinical notes were reviewed for outcomes, and the musculoskeletal radiologist reviewed all radiologic studies. The 4 men and 7 women in the SONK group (1 woman had bilateral knee lesions) ranged in age from 43 to 74 years (mean, 63.8 years), and the 4 men and 7 women in the control group were age-matched to 43 to 75 years (mean, 63.6 years). The controls were chosen from a pool of patients who underwent knee arthroscopy at our institution.
MRI was performed using General Electric 1-T, 1.5-T, or 3-T magnets (GE Healthcare, Milwaukee, Wisconsin) or using Philips 1.5-T or open 0.7-T magnets (Philips Healthcare, Andover, Massachusetts). Imaging included sagittal and coronal proton density–weighted sequences and coronal and axial fat-suppressed T2-weighted sequences. SONK was diagnosed when a low signal line adjacent to the subchondral bone plate on the femoral or tibial condyles was present with an adjacent area of bone marrow edema in the respective condyle or when there was depression of the subchondral bone plate with adjacent edema. The MRI studies were reviewed for lesion location, and medial meniscus and lateral meniscus were reviewed for tear. Type of meniscal tear (horizontal cleavage, radial, complex degenerative) was documented, as was meniscal extrusion. The meniscus was regarded as extruded if the body extended more than 3 mm from the joint margin. Cartilage in the medial and lateral compartment was reviewed according to a modified Noyes scale listing 0 as normal, 1 as internal changes only, 2A as 1% to 49% cartilage loss, 2B as 50% to 90% loss of articular cartilage, 3A as 100% articular cartilage loss with subchondral bone plate intact, and 3B as 100% articular cartilage loss with ulcerated subchondral bone plate.14 Osteoarthritic severity was similarly classified using the Kellgren-Lawrence scale,15 where grade 0 is normal; grade 1 is unlikely to have narrowing of the joint space but potentially has osteophytic lipping; grade 2 has both definite narrowing of the joint space and osteophytes; grade 3 has narrowing of the joint space and multiple osteophytes, some sclerosis, and possible deformity of bone contour; and grade 4 has marked narrowing of the joint space, large osteophytes, severe sclerosis, and definite deformity of bone contour. Follow-up clinical notes and radiologic studies were reviewed in the assessment of patient outcomes.
All statistical analyses were performed with SAS 9.2 software (SAS Institute, Cary, North Carolina). Age data were evaluated with the Shapiro-Wilk test and graphical displays and were found to violate normality assumptions, so they are presented as medians and ranges; other variables are presented as count and column percentages. The Wilcoxon rank sum test was used to compare the 2 groups’ age distributions. Fisher exact tests were used to compare proportions between the 2 groups for the other variables. Statistical significance was set at P < .05.
Results
Table 1 lists the demographics and imaging characteristics of the 11 patients—6 had SONK before arthroscopy and 6 developed it after arthroscopy. Comparison of the 11 patients with SONK and the 11 controls is summarized with P values in Table 2. Representative cases that either presented before surgery or developed after surgery are shown in Figures 1 to 4. There were 6 prearthroscopy lesions and 6 postarthroscopy lesions—all 12 in the medial femoral condyle. Eleven of the 12 knees had a medial meniscal tear, and 1 knee had both medial and lateral meniscal tears. In 8 of the 12 knees, the lateral meniscus was normal; in 2 knees, it had mild degeneration; and, in 1 knee, it had a complex tear. Assessment of hyaline cartilage revealed medial cartilage loss ranging from 2A to 3B (median, 2B) in the patients with SONK, and lateral cartilage loss ranging from 0 to 2A (median, 0). At surgery, all knees had a partial medial meniscectomy, and 6 had a partial lateral meniscectomy. Ten of the 12 knees had chondroplasty, 9 patellar and 5 of the medial femoral condyle. Only 4 of the 11 patients with follow-up of more than 1 year went on to joint replacement. Six of the 12 had follow-up of more than 2 years. Of the 6 patients without an identifiable SONK lesion on MRI before arthroscopy, 4 had mild to moderate knee pain 0.5, 2.4, 3.5, and 4 years after surgery. For the other 2 patients, knee replacement was performed 1.5 and 1.8 years after surgery. Of the 6 patients with prearthroscopy SONK, 4 had mild to moderate knee pain 1.5, 3.7, 6.5, and 6.8 years after surgery; the other 2 had knee replacement 0.5 and 1.8 years after surgery. Articular cartilage degeneration and meniscal extrusion were similar (Table 1). In the control group, there was only 1 knee replacement, at 3 years, and the other 11 were functioning 2.6 to 5 years later. The longer follow-up resulted from selection of appropriate controls from the same year. Of the 6 SONK lesions found on preoperative MRI, 3 were read by the interpreting radiologist before surgery as possible SONK lesions, 2 were read as insufficiency fractures, and 1 was read as a possible insufficiency fracture.
Discussion
SONK is well described as a complication of arthroscopic knee surgery. However, this condition more commonly appears spontaneously in a population that has not had surgery. It has become clear that the term SONK may be misleading.16 In a recent series of postoperative subchondral fractures reported by MacDessi and colleagues,5 the average age of patients included in their study was 64 years. Pathologic analysis revealed subchondral fracture with callus formation in all cases. Only 2 knees had evidence of osteonecrosis, which appeared to be secondary to the fracture. Based on these findings, the authors concluded that “further investigation into the etiology of this condition is warranted.” A prominent association with medial meniscal tear has been noted, with the medial femoral condyle predominantly affected. As already mentioned, SONK differs from classical avascular necrosis on several points, including lack of the typical avascular osteonecrosis risk factors and absence of the serpiginous margin and double-line sign seen with typical bone infarction. In addition, the SONK lesions seen on radiographs and MRIs of the knee typically are in the medial femoral condyle and are very different from the typical area of infarction seen in patients with known risk factors for secondary osteonecrosis.
The cause of SONK is not known. Of more importance from a medicolegal standpoint is that these lesions are not necessarily related to arthroscopy.17 Interestingly, Pape and colleagues17 noted that some of the lesions they studied may have been present before surgery, which is what we found in 6 (50%) of the SONK knees in our study. Our data thus support the proposition that some SONK lesions are present before arthroscopy, and some cases of so-called postarthroscopy SONK may in fact have been progressing before surgery.
Our data also reinforce the importance of radiologist–orthopedic surgeon communication regarding the presence of SONK. We emphasize the importance of communicating the MRI findings clearly, whether the lesion is called SONK, SPONK, or insufficiency fracture. The orthopedic surgeons in our series may have been unaware of the presence of these lesions before arthroscopic meniscectomy, given the wide variety of terms being used in radiologic reports.
The natural history of spontaneous osteonecrosis of the medial tibial plateau has also been studied.18 There were 3 outcome patterns—acute extensive collapse of the medial tibial plateau, rapid progression to varying degrees of osteoarthritis, and complete resolution. It has been shown that resolution of SONK can occur in the early stages of the disease, within several months, but often the changes progress to bone destruction and articular cartilage collapse.19
In our series of patients, there was a female predominance, and mean age was 64 years. We investigated cartilage loss, meniscal tear, and meniscal extrusion to see if we could predict outcomes in patients who had the lesion before arthroscopy and if we could predict who might be at risk for developing the lesion after arthroscopy. Type of surgical procedure was also reviewed. For the sake of simplicity, we divided the follow-up patients into 2 groups: those managed with conservative treatment, which we deemed a reasonable outcome, and those who subsequently required knee joint replacement, which we deemed a poor outcome. As seen from our representative cases, both groups had patients with cartilage loss, meniscal tear, and meniscal extrusion to varying degrees. There were no risk factors pointing to a reasonable or poor outcome. In the group of patients with prearthroscopy lesions, we found the same problem. We were unable to identify a risk factor that might suggest a poor rather than a reasonable outcome. We must also emphasize that, in our review of patient charts, we could find no other causes for osteonecrosis. In particular, arthroscopic causes of acute chondral loss (eg, thermal wash, laser, bupivacaine pain pumps, epinephrine in irrigant) were not identified.
This study consisted of a series of cases managed at our institution over the past 8 years. Our data and this study had several limitations:
We may have been unable to identify other SONK cases that belonged in the group from our institution. In addition, we had only 11 patients for comparison with patients without SONK. Likewise, there were only 6 knees each in the prearthroscopy and postarthroscopy SONK groups. We also used images obtained from 1-T, 1.5-T, and 3-T closed MRI devices and one 0.7-T open device. These were, however, at the same institution.
Timing of our imaging was not uniform. In particular, in 3 of the patients who developed SONK after arthroscopy, preoperative MRI studies were performed quite some time before surgery. However, in these patients, more recent preoperative radiographs did not show any evidence of lesions. It can also be seen that postarthroscopy follow-up of patients varied. It is possible that, on longer follow-up, some of the cases we classified as having a reasonable outcome may have gone on to require total knee arthroplasty. One could argue that, in the patient who developed SONK within 1 year after surgery (Figure 4), the lesion was not related to the surgery. However, this patient’s radiographs 3 months after surgery did not show the SONK lesion but clearly showed prominent medial joint space narrowing—a new finding.
Only 1 musculoskeletal radiologist evaluated the radiographs, MRIs, and tomosynthesis (similar to computed tomography) studies for this investigation.
This lesion is not common, thus giving us a small group to analyze.
Despite our data limitations and the retrospective nature of this study, we compiled a reasonably representative sample of surgical SONK patients that matches other samples reported in the literature. Unfortunately, we could not identify any risk factors pointing to the likelihood of developing SONK or any risk factors pointing to either a reasonable or a poor prognosis in these patients. The etiology of the lesion remains an enigma. Our finding 6 cases of prearthroscopy lesions that did not necessarily result in a poor outcome, combined with our inability to identify any risk factors for SONK, points to the lack of a causal relationship with arthroscopy.
1. Ahlbäck S. Osteoarthritis of the knee. A radiographic investigation. Acta Radiol Diagn. 1968;(suppl 277):7-72.
2. Juréus J, Lindstrand A, Geijer M, Robertsson O, Tägil M. The natural course of spontaneous osteonecrosis of the knee (SPONK): a 1- to 27-year follow-up of 40 patients. Acta Orthop. 2013;84(4):410-414.
3. Zurlo JV. The double-line sign. Radiology. 1999;212(2):541-542.
4. Yamamoto T, Bullough PG. Spontaneous osteonecrosis of the knee: the result of subchondral insufficiency fracture. J Bone Joint Surg Am. 2000;82(6):858-866.
5. MacDessi SJ, Brophy RH, Bullough PG, Windsor RE, Sculco TP. Subchondral fracture following arthroscopic knee surgery. A series of eight cases. J Bone Joint Surg Am. 2008;90(5):1007-1012.
6. Brahme SK, Fox JM, Ferkel RD, Friedman MJ, Flannigan BD, Resnick DL. Osteonecrosis of the knee after arthroscopic surgery: diagnosis with MR imaging. Radiology. 1991;178(3):851-853.
7. Faletti C, Robba T, de Petro P. Postmeniscectomy osteonecrosis. Arthroscopy. 2002;18(1):91-94.
8. Johnson TC, Evans JA, Gilley JA, DeLee JC. Osteonecrosis of the knee after arthroscopic surgery for meniscal tears and chondral lesions. Arthroscopy. 2000;16(3):254-261.
9. al-Kaar M, Garcia J, Fritschy D, Bonvin JC. Aseptic osteonecrosis of the femoral condyle after meniscectomy by the arthroscopic approach. J Radiol. 1997;78(4):283-288.
10. DeFalco RA, Ricci AR, Balduini FC. Osteonecrosis of the knee after arthroscopic meniscectomy and chondroplasty: a case report and literature review. Am J Sports Med. 2003;31(6):1013-1016.
11. Kusayama T. Idiopathic osteonecrosis of the femoral condyle after meniscectomy. Tokai J Exp Clin Med. 2003;28(4):145-150.
12. Prues-Latour V, Bonvin JC, Fritschy D. Nine cases of osteonecrosis in elderly patients following arthroscopic meniscectomy. Knee Surg Sports Traumatol Arthrosc. 1998;6(3):142-147.
13. Santori N, Condello V, Adriani E, Mariani PP. Osteonecrosis after arthroscopic medial meniscectomy. Arthroscopy. 1995;11(2):220-224.
14. Noyes FR, Stabler CL. A system for grading articular cartilage lesions at arthroscopy. Am J Sports Med. 1989;17(4):505-513.
15. Kellgren JH, Lawrence JS. Radiological assessment of osteo-arthrosis. Ann Rheum Dis. 1957;16(4):494-502.
16. Kidwai AS, Hemphill SD, Griffiths HJ. Radiologic case study. Spontaneous osteonecrosis of the knee reclassified as insufficiency fracture. Orthopedics. 2005;28(3):236, 333-236.
17. Pape D, Lorbach O, Anagnostakos K, Kohn D. Osteonecrosis in the postarthroscopic knee. Orthopade. 2008;37(11):1099-1107.
18. Satku K, Kumar VP, Chacha PB. Stress fractures around the knee in elderly patients. A cause of acute pain in the knee. J Bone Joint Surg Am. 1990;72(6):918-922.
19. Soucacos PN, Xenakis TH, Beris AE, Soucacos PK, Georgoulis A. Idiopathic osteonecrosis of the medial femoral condyle. Classification and treatment. Clin Orthop. 1997;(341):82-89.
Incidence and Injury Types in Motorcycle Collisions Involving Deer in Western New York
The combination of urban sprawl and a large deer population has caused deer–motor vehicle collisions to become a major concern over the past few decades. According to State Farm Insurance industry data, New York State drivers in 2010-2011 had a 1 in 149.5 likelihood of colliding with a deer over the year, compared with a national average of 1 in 183.4.1 Reports from the Midwest have highlighted the frequency and severity of this type of accident.2-4 Frequent performance of orthopedic procedures in this subset of trauma patients prompted a local review to determine the frequency and severity of injuries. This series differs from the Midwest studies in the existence of a universal helmet law for all motorcyclists and passengers in New York State. Other studies looking at this type of accident were performed in states, including Minnesota and Wisconsin, that require helmets only for riders younger than 18 years or persons with an instructional permit.5
The Erie County Medical Center (ECMC) is a level I trauma center located in Buffalo, New York, and serves much of western New York, as well as part of northwestern Pennsylvania and, occasionally, southern Ontario, Canada. Because the ECMC receives almost all major trauma cases in the region, we had sufficient records to explore the incidence and the severity of deer–motorcycle accidents in these regions. In addition to adding to the limited data analyzing crash outcomes, we also looked at the numbers and proportions of motorcycle accidents attributable to deer and compared these with results from studies from different geographical regions. Because the number of registered motorcycles in Erie Country is among the highest in New York State, and because of the increased severity of motorcycle–deer collisions relative to other motor vehicle–deer collisions, this issue has both safety and financial considerations.
Materials and Methods
A retrospective review of records from ECMC was performed to capture all records from motorcycle accidents from May 2007 through June 2011. The population was identified to include only motorcycle accidents that were caused by collision with deer.
Injury severity was standardized using the Injury Severity Score (ISS), and the level of consciousness on arrival was standardized using the Glasgow Coma Scale (GCS). Chart abstraction included patient age, identification of the patient as driver or passenger of the motorcycle, use of helmet, time of year, types of injuries, length of hospital stay, and whether the patient lost consciousness. Patient age was also abstracted for the entire initial screen of all motorcycle accidents regardless of mechanism.
Statistical analysis was done using SPSS (IBM SPSS Statistics for Windows, Version 19.0; IBM Corp., Armonk, New York). Continuous data were analyzed using the appropriate descriptive statistics. Comparisons were made using Student t test, and a 0.05 level of significance was accepted.
Results
The initial screening of the trauma database returned 487 patients who had been involved in a motorcycle accident; of these, 39 patients were in an accident that involved a deer. According to one medical record, the spouse of a patient was a passenger who was dead at the scene, although there was no separate medical record for this person; this person was included in our data. Therefore, our total study population numbered 40 patients involved in 36 accidents, with 36 drivers and 4 passengers; 35 were men and 5 were women, with the women accounting for all 4 passengers and 1 driver. The mean (SD) patient age for deer–motorcycle collisions was 48.9 (8.9) years (range, 21-64 years). This was significantly higher than the mean (SD) age for all motorcycle accidents from the ECMC trauma database, which was 41.9 (13.9) years (range, 17-79 years) (P < .002).
The majority of accidents (31; 86%) with deer occurred during the months of May through September, with the most occurring in June (11; 31%). There was only 1 (3%) in October, 3 (8%) in November, and 1 (3%) in January. The number of collisions per year averaged 9.75, with a range of 8 to 12 from 2007-2010. (The year 2011 was omitted because data were collected before the year was complete). The presence or absence of helmet use was recorded in 22 cases. Of these, 21 patients had been wearing a helmet (95%), and only 1 patient was unhelmeted. Among all riders involved in motorcycle accidents from the trauma database, the presence or absence of a helmet was recorded in 271 cases. Of these, 262 (97%) were wearing a helmet. The average length of hospital stay was 6 days, with 6 patients having stays that were 10 days or longer, and the longest stay was 31 days. Thirty-three medical records noted whether the patient described loss of consciousness after the accident; of these, 14 (42%) claimed loss of consciousness and the remaining 19 (58%) denied any loss of consciousness after the accident. The mean (SD) ISS for deer–motorcycle collisions was 17.1 (9.8), and the mean (SD) GCS was 14.3 (2.5).
Chest, orthopedic, and head injuries were the most common injuries seen in deer–motorcycle collisions (Table). Head injuries, including the 1 patient who was confirmed to not have been wearing a helmet, accounted for 15.0% of the total injuries. This patient also had a longer length of stay at 19 days than the average of 6 days. Rib fractures were the most common injury, occurring in 20 (50%) patients. The 1 recorded fatality was the passenger of a patient who was dead at the scene.
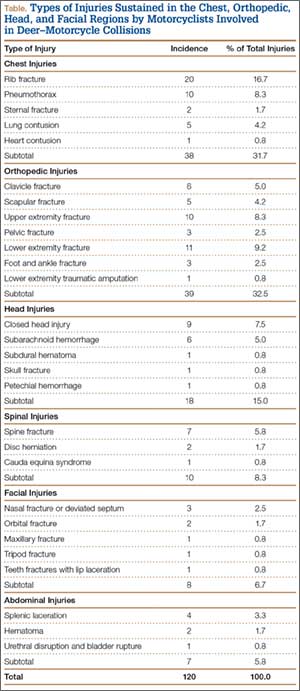
Twenty-five (62.5%) patients in this series had injuries that are traditionally treated by orthopedic trauma surgeons, including scapular, clavicle, pelvic, and extremity fractures. Upper and lower extremity injuries occurred 10 (8.3%) and 15 (12.5%) times respectively, with the lower extremity injuries including long bone fractures, foot and ankle fractures, and 1 lower extremity traumatic amputation. Fourteen (35%) patients underwent one or more orthopedic surgical procedures.
Discussion
Although animal–vehicle collisions have been described in the literature, comparatively little data are available for the subset of animal–motorcycle accidents. This is an important gap considering that fatalities in collisions with animals were 6 times more likely to be persons riding motorcycles, although animal collisions are more common with other vehicles.6
Smoot and colleagues2 also reported that motorcycle collisions with deer tend to result in a higher injury severity than collisions of other vehicles with deer. According to reports for Midwestern regions, motorcycle-versus-deer accidents are a significant problem, causing a large number of serious injuries as well as creating the financial burden of vehicle damage and medical costs.2,3 However, the overall data are limited, and there is not much detailed information available for western New York.
Because of the large number of motorcyclists in New York State, it is important to consider accident data in this subset of the population. In 2010, 340,260 motorcycles were registered in New York State, with Erie County having the second highest number (21,745) of motorcycles registered.7 These numbers increased to 345,820 and 22,183 motorcycles, respectively, in 2011.8 In that year, the number of police-reported motorcycle accidents in New York decreased to 4855 from 5047 accidents in 2010, although both numbers are increased from 4647 accidents in 2009.9-11 Despite the decrease in total police-reported motorcycle accidents from 2010 to 2011, the trend in motorcycle accidents involving an animal’s action has steadily increased from 313 (6.7%) in 2009 to 335 (6.6%) in 2010 to 401 (8.3%) in 2011.9-11 Although these data from the New York State Department of Motor Vehicles are not further broken down by animal species, it can be reasonably surmised that most of these are caused by deer. This inference is supported by data from Bramati and colleagues4 showing that 81% of animal–vehicle collisions involved deer, as well as by the Wildlife-Vehicle Collision Reduction Study that showed deer were involved in 54.4% of animal–vehicle collisions in California and more than 90% of animal–vehicle collisions in Illinois and Minnesota.4,12 These studies predominantly comprised collisions involving animals capable of causing substantial property damage on impact, such as deer or larger animals. This, along with the evidence of higher ISS seen in motorcyclists in deer-related traffic injuries,2 supports the intuitive thought that motorcyclists are at increased risk for injury and fatality relative to other motor vehicles involved in accidents.
Williams and Wells13 reviewed 147 fatal wildlife–vehicle fatalities from 9 regions and found that the 2 most common fatalities were the motorcycle driver or passenger after striking an animal or an object. Jones14 also reported that the most common fatal wildlife–vehicle crashes involved motorcycles, as did fatal-accident reporting system data in the Wildlife-Vehicle Collision Reduction Study, which confirmed that approximately 30% of fatal crashes with animals involved motorcycles.12
Interestingly, the age of patients involved in motorcycle–deer collisions tends to be higher than that of patients involved in other motorcycle accidents. The numbers in our study reflect results in other study populations that suggest motorcycle riders who collide with deer are generally older than riders in other accidents who are more likely to be younger.4 One explanation is that younger riders may drive faster and more recklessly than older and experienced riders, resulting in an increased number of accidents unrelated to deer. Another consideration places younger drivers less commonly on roads where wildlife crashes more often occur (ie, roads that are rural, 2-lane).
Helmet use, when reported, was very high in our study population, most likely as a result of New York State’s mandatory helmet law for motorcyclists. Our data showed that more than 95% of patients whose charts documented helmet usage were wearing helmets at the time of the collision, compared with a Wisconsin study showing that only 29% of patients were wearing helmets.3 This may explain the proportion of head injuries in our study being 15.0% compared with the 29.5% in the Wisconsin study.3 Although both datasets involved a limited number of patients, the results suggest that mandatory helmet laws are effective in preventing head injuries. Also, the only patient in our study who was confirmed to have not been wearing a helmet had a much longer length of hospital stay than the average patient (19 vs 6 days). William and Wells13 found that 65% of motorcyclists killed in collisions with animals were not wearing helmets, and they believed that many of these fatalities could have been prevented with helmet use. Again, these limited data suggest the effectiveness of mandatory helmet use.
Two other factors, season and time of day, are important to consider in motorcycle collisions with deer. According to our data, 86% of these collisions occur in the warmer months, May through September, peaking in June. This is similar to findings from the Wisconsin study showing June and July as the peak months for deer–motorcycle collisions and a study in Minnesota where 61% of these crashes occurred in the summer months.2,3 These data most likely indicate increased motorcycle traffic in favorable weather conditions. Although time of accident could not be determined through our retrospective review, multiple studies have shown that the majority of collisions with deer tend to be between dusk and dawn. Smoot and colleagues2 found that 56% of vehicle collisions with deer occurred between 5 pm and midnight, with 80% between 5 pm and 6 am.2 Similarly, Nelson and colleagues3 found that 54.5% of collisions happened in a 4-hour period, from 6 pm to 10 pm. These data indicate that motorcycle operators should be especially vigilant in the morning and evening hours when deer may be more active.
Other than driver awareness and vigilance, prevention efforts can involve wildlife fencing, alert systems, and deer-culling programs. Fences are used extensively, most commonly on larger thoroughfares, and have been shown effective in reducing wildlife vehicle crashes by 80% to 90%.12 Animal detection systems using sensors to detect large wildlife approaching the roadway can activate warning signs to alert approaching drivers. Such systems have been installed in more than 30 locations in North America and Europe with variable effectiveness.12 However, there are typically no standards or guidelines for the collection of data about wildlife–vehicle crashes. Data are collected inconsistently and often haphazardly, and methods vary between states and agencies. Some transportation agencies do not collect this type of data at all. Without reliable, consistent data, it is difficult to identify road sections where mitigation methods may be required, to select appropriate mitigation measures, or to evaluate whether that effort is making a difference.
Culling systems for deer populations are frequently discussed, often in suburban as well as rural settings. Recreational hunting ordinances, higher limits on the number of females a hunter can bag, and occasional use of professional shooters can be applicable in less rural areas. Their effectiveness is debatable and tends to be time-limited.
Conclusion
This study highlights the fairly common occurrence and relative severity of deer–motorcycle crashes in an upstate New York setting, approximating published series from the Midwest. Helmet laws may lower rates of head injury in motorcycle–wildlife crashes. Finally, there are no fender benders when the chosen vehicle sports no fenders, so motorcyclists need to be especially vigilant in order to avoid collisions with deer and other wildlife.
1. Likelihood of collision with deer (amended 2010-2011). State Farm website. https://static1.st8fm.com/en_US/content_pages/1/pdf/us/likelihood-of-collision-2011.pdf. Accessed April 29, 2015.
2. Smoot DL, Zielinski MD, Cullinane DC, Jenkins DH, Schiller HJ, Sawyer MD. Patterns in deer-related traffic injuries over a decade: the Mayo Clinic experience. Scand J Trauma Resusc Emerg Med. 2010;18:46.
3. Nelson RS, Gustafson PT, Szlabick RE. Motorcycle collisions involving white-tailed deer in central and northern Wisconsin: a rural trauma center experience. J Trauma. 2006;60(6):1297-1300.
4. Bramati PS, Heinert LF, Narloch LB, Hostetter J, Finkielman JD. Animal-related motorcycle collisions in North Dakota. Wilderness Environ Med. 2012;23(1):65-69.
5. Save lives, save money – how does your state measure up. Injury Prevention & Control: Motor Vehicle Safety. Centers for Disease Control and Prevention website. http://www.cdc.gov/motorvehiclesafety/mc/states/index.html. Updated June 13, 2012. Accessed April 23, 2015.
6. Langley RL, Higgins SA, Herrin KB. Risk factors associated with fatal animal-vehicle collisions in the United States, 1995-2004. Wilderness Environ Med. 2006;17(4):229-239.
7. Vehicle registrations in force – 2010. Archives of Statistical Summaries. New York State Department of Motor Vehicles website. http://dmv.ny.gov/statistic/regin10.pdf. Accessed May 11, 2015.
8. Vehicle registrations in force – 2011. Archives of Statistical Summaries. New York State Department of Motor Vehicles website. http://dmv.ny.gov/statistic/regin11.pdf. Accessed May 11, 2015.
9. Summary of motorcycle crashes – 2011. Archives of Statistical Summaries. New York State Department of Motor Vehicles website. http://dmv.ny.gov/statistic/2011MotorcycleCrashSummary.pdf. Accessed April 23, 2015.
10. Summary of motorcycle accidents – 2010. Archives of Statistical Summaries. New York State Department of Motor Vehicles website. dmv.ny.gov/statistic/2010MotorcycleAccSummary.pdf. Accessed April 23, 2015.
11. Summary of motorcycle accidents – 2009. Archives of Statistical Summaries. New York State Department of Motor Vehicles website. dmv.ny.gov/statistic/2009MotorcycleSummary.pdf. Accessed April 23, 2015.
12. Huijser MP, McGowen P, Fuller J, et al; Federal Highway Administration. Wildlife-Vehicle Collision Reduction Study: Report to Congress. Report no. FHWA-HRT-08-034. Washington, DC: US Department of Transportation, Federal Highway Administration; 2008. http://www.fhwa.dot.gov/publications/research/safety/08034/08034.pdf. Accessed April 23, 2015.
13. Williams AF, Wells JK. Characteristics of vehicle-animal crashes in which vehicle occupants are killed. Traffic Inj Prev. 2005;6(1):56-59.
14. Jones M. Deer-vehicle crash injuries, fatalities reach all-time high in Wisconsin. Milwaukee Journal Sentinel. April 14, 2000:1B-2B.
The combination of urban sprawl and a large deer population has caused deer–motor vehicle collisions to become a major concern over the past few decades. According to State Farm Insurance industry data, New York State drivers in 2010-2011 had a 1 in 149.5 likelihood of colliding with a deer over the year, compared with a national average of 1 in 183.4.1 Reports from the Midwest have highlighted the frequency and severity of this type of accident.2-4 Frequent performance of orthopedic procedures in this subset of trauma patients prompted a local review to determine the frequency and severity of injuries. This series differs from the Midwest studies in the existence of a universal helmet law for all motorcyclists and passengers in New York State. Other studies looking at this type of accident were performed in states, including Minnesota and Wisconsin, that require helmets only for riders younger than 18 years or persons with an instructional permit.5
The Erie County Medical Center (ECMC) is a level I trauma center located in Buffalo, New York, and serves much of western New York, as well as part of northwestern Pennsylvania and, occasionally, southern Ontario, Canada. Because the ECMC receives almost all major trauma cases in the region, we had sufficient records to explore the incidence and the severity of deer–motorcycle accidents in these regions. In addition to adding to the limited data analyzing crash outcomes, we also looked at the numbers and proportions of motorcycle accidents attributable to deer and compared these with results from studies from different geographical regions. Because the number of registered motorcycles in Erie Country is among the highest in New York State, and because of the increased severity of motorcycle–deer collisions relative to other motor vehicle–deer collisions, this issue has both safety and financial considerations.
Materials and Methods
A retrospective review of records from ECMC was performed to capture all records from motorcycle accidents from May 2007 through June 2011. The population was identified to include only motorcycle accidents that were caused by collision with deer.
Injury severity was standardized using the Injury Severity Score (ISS), and the level of consciousness on arrival was standardized using the Glasgow Coma Scale (GCS). Chart abstraction included patient age, identification of the patient as driver or passenger of the motorcycle, use of helmet, time of year, types of injuries, length of hospital stay, and whether the patient lost consciousness. Patient age was also abstracted for the entire initial screen of all motorcycle accidents regardless of mechanism.
Statistical analysis was done using SPSS (IBM SPSS Statistics for Windows, Version 19.0; IBM Corp., Armonk, New York). Continuous data were analyzed using the appropriate descriptive statistics. Comparisons were made using Student t test, and a 0.05 level of significance was accepted.
Results
The initial screening of the trauma database returned 487 patients who had been involved in a motorcycle accident; of these, 39 patients were in an accident that involved a deer. According to one medical record, the spouse of a patient was a passenger who was dead at the scene, although there was no separate medical record for this person; this person was included in our data. Therefore, our total study population numbered 40 patients involved in 36 accidents, with 36 drivers and 4 passengers; 35 were men and 5 were women, with the women accounting for all 4 passengers and 1 driver. The mean (SD) patient age for deer–motorcycle collisions was 48.9 (8.9) years (range, 21-64 years). This was significantly higher than the mean (SD) age for all motorcycle accidents from the ECMC trauma database, which was 41.9 (13.9) years (range, 17-79 years) (P < .002).
The majority of accidents (31; 86%) with deer occurred during the months of May through September, with the most occurring in June (11; 31%). There was only 1 (3%) in October, 3 (8%) in November, and 1 (3%) in January. The number of collisions per year averaged 9.75, with a range of 8 to 12 from 2007-2010. (The year 2011 was omitted because data were collected before the year was complete). The presence or absence of helmet use was recorded in 22 cases. Of these, 21 patients had been wearing a helmet (95%), and only 1 patient was unhelmeted. Among all riders involved in motorcycle accidents from the trauma database, the presence or absence of a helmet was recorded in 271 cases. Of these, 262 (97%) were wearing a helmet. The average length of hospital stay was 6 days, with 6 patients having stays that were 10 days or longer, and the longest stay was 31 days. Thirty-three medical records noted whether the patient described loss of consciousness after the accident; of these, 14 (42%) claimed loss of consciousness and the remaining 19 (58%) denied any loss of consciousness after the accident. The mean (SD) ISS for deer–motorcycle collisions was 17.1 (9.8), and the mean (SD) GCS was 14.3 (2.5).
Chest, orthopedic, and head injuries were the most common injuries seen in deer–motorcycle collisions (Table). Head injuries, including the 1 patient who was confirmed to not have been wearing a helmet, accounted for 15.0% of the total injuries. This patient also had a longer length of stay at 19 days than the average of 6 days. Rib fractures were the most common injury, occurring in 20 (50%) patients. The 1 recorded fatality was the passenger of a patient who was dead at the scene.
Twenty-five (62.5%) patients in this series had injuries that are traditionally treated by orthopedic trauma surgeons, including scapular, clavicle, pelvic, and extremity fractures. Upper and lower extremity injuries occurred 10 (8.3%) and 15 (12.5%) times respectively, with the lower extremity injuries including long bone fractures, foot and ankle fractures, and 1 lower extremity traumatic amputation. Fourteen (35%) patients underwent one or more orthopedic surgical procedures.
Discussion
Although animal–vehicle collisions have been described in the literature, comparatively little data are available for the subset of animal–motorcycle accidents. This is an important gap considering that fatalities in collisions with animals were 6 times more likely to be persons riding motorcycles, although animal collisions are more common with other vehicles.6
Smoot and colleagues2 also reported that motorcycle collisions with deer tend to result in a higher injury severity than collisions of other vehicles with deer. According to reports for Midwestern regions, motorcycle-versus-deer accidents are a significant problem, causing a large number of serious injuries as well as creating the financial burden of vehicle damage and medical costs.2,3 However, the overall data are limited, and there is not much detailed information available for western New York.
Because of the large number of motorcyclists in New York State, it is important to consider accident data in this subset of the population. In 2010, 340,260 motorcycles were registered in New York State, with Erie County having the second highest number (21,745) of motorcycles registered.7 These numbers increased to 345,820 and 22,183 motorcycles, respectively, in 2011.8 In that year, the number of police-reported motorcycle accidents in New York decreased to 4855 from 5047 accidents in 2010, although both numbers are increased from 4647 accidents in 2009.9-11 Despite the decrease in total police-reported motorcycle accidents from 2010 to 2011, the trend in motorcycle accidents involving an animal’s action has steadily increased from 313 (6.7%) in 2009 to 335 (6.6%) in 2010 to 401 (8.3%) in 2011.9-11 Although these data from the New York State Department of Motor Vehicles are not further broken down by animal species, it can be reasonably surmised that most of these are caused by deer. This inference is supported by data from Bramati and colleagues4 showing that 81% of animal–vehicle collisions involved deer, as well as by the Wildlife-Vehicle Collision Reduction Study that showed deer were involved in 54.4% of animal–vehicle collisions in California and more than 90% of animal–vehicle collisions in Illinois and Minnesota.4,12 These studies predominantly comprised collisions involving animals capable of causing substantial property damage on impact, such as deer or larger animals. This, along with the evidence of higher ISS seen in motorcyclists in deer-related traffic injuries,2 supports the intuitive thought that motorcyclists are at increased risk for injury and fatality relative to other motor vehicles involved in accidents.
Williams and Wells13 reviewed 147 fatal wildlife–vehicle fatalities from 9 regions and found that the 2 most common fatalities were the motorcycle driver or passenger after striking an animal or an object. Jones14 also reported that the most common fatal wildlife–vehicle crashes involved motorcycles, as did fatal-accident reporting system data in the Wildlife-Vehicle Collision Reduction Study, which confirmed that approximately 30% of fatal crashes with animals involved motorcycles.12
Interestingly, the age of patients involved in motorcycle–deer collisions tends to be higher than that of patients involved in other motorcycle accidents. The numbers in our study reflect results in other study populations that suggest motorcycle riders who collide with deer are generally older than riders in other accidents who are more likely to be younger.4 One explanation is that younger riders may drive faster and more recklessly than older and experienced riders, resulting in an increased number of accidents unrelated to deer. Another consideration places younger drivers less commonly on roads where wildlife crashes more often occur (ie, roads that are rural, 2-lane).
Helmet use, when reported, was very high in our study population, most likely as a result of New York State’s mandatory helmet law for motorcyclists. Our data showed that more than 95% of patients whose charts documented helmet usage were wearing helmets at the time of the collision, compared with a Wisconsin study showing that only 29% of patients were wearing helmets.3 This may explain the proportion of head injuries in our study being 15.0% compared with the 29.5% in the Wisconsin study.3 Although both datasets involved a limited number of patients, the results suggest that mandatory helmet laws are effective in preventing head injuries. Also, the only patient in our study who was confirmed to have not been wearing a helmet had a much longer length of hospital stay than the average patient (19 vs 6 days). William and Wells13 found that 65% of motorcyclists killed in collisions with animals were not wearing helmets, and they believed that many of these fatalities could have been prevented with helmet use. Again, these limited data suggest the effectiveness of mandatory helmet use.
Two other factors, season and time of day, are important to consider in motorcycle collisions with deer. According to our data, 86% of these collisions occur in the warmer months, May through September, peaking in June. This is similar to findings from the Wisconsin study showing June and July as the peak months for deer–motorcycle collisions and a study in Minnesota where 61% of these crashes occurred in the summer months.2,3 These data most likely indicate increased motorcycle traffic in favorable weather conditions. Although time of accident could not be determined through our retrospective review, multiple studies have shown that the majority of collisions with deer tend to be between dusk and dawn. Smoot and colleagues2 found that 56% of vehicle collisions with deer occurred between 5 pm and midnight, with 80% between 5 pm and 6 am.2 Similarly, Nelson and colleagues3 found that 54.5% of collisions happened in a 4-hour period, from 6 pm to 10 pm. These data indicate that motorcycle operators should be especially vigilant in the morning and evening hours when deer may be more active.
Other than driver awareness and vigilance, prevention efforts can involve wildlife fencing, alert systems, and deer-culling programs. Fences are used extensively, most commonly on larger thoroughfares, and have been shown effective in reducing wildlife vehicle crashes by 80% to 90%.12 Animal detection systems using sensors to detect large wildlife approaching the roadway can activate warning signs to alert approaching drivers. Such systems have been installed in more than 30 locations in North America and Europe with variable effectiveness.12 However, there are typically no standards or guidelines for the collection of data about wildlife–vehicle crashes. Data are collected inconsistently and often haphazardly, and methods vary between states and agencies. Some transportation agencies do not collect this type of data at all. Without reliable, consistent data, it is difficult to identify road sections where mitigation methods may be required, to select appropriate mitigation measures, or to evaluate whether that effort is making a difference.
Culling systems for deer populations are frequently discussed, often in suburban as well as rural settings. Recreational hunting ordinances, higher limits on the number of females a hunter can bag, and occasional use of professional shooters can be applicable in less rural areas. Their effectiveness is debatable and tends to be time-limited.
Conclusion
This study highlights the fairly common occurrence and relative severity of deer–motorcycle crashes in an upstate New York setting, approximating published series from the Midwest. Helmet laws may lower rates of head injury in motorcycle–wildlife crashes. Finally, there are no fender benders when the chosen vehicle sports no fenders, so motorcyclists need to be especially vigilant in order to avoid collisions with deer and other wildlife.
1. Likelihood of collision with deer (amended 2010-2011). State Farm website. https://static1.st8fm.com/en_US/content_pages/1/pdf/us/likelihood-of-collision-2011.pdf. Accessed April 29, 2015.
2. Smoot DL, Zielinski MD, Cullinane DC, Jenkins DH, Schiller HJ, Sawyer MD. Patterns in deer-related traffic injuries over a decade: the Mayo Clinic experience. Scand J Trauma Resusc Emerg Med. 2010;18:46.
3. Nelson RS, Gustafson PT, Szlabick RE. Motorcycle collisions involving white-tailed deer in central and northern Wisconsin: a rural trauma center experience. J Trauma. 2006;60(6):1297-1300.
4. Bramati PS, Heinert LF, Narloch LB, Hostetter J, Finkielman JD. Animal-related motorcycle collisions in North Dakota. Wilderness Environ Med. 2012;23(1):65-69.
5. Save lives, save money – how does your state measure up. Injury Prevention & Control: Motor Vehicle Safety. Centers for Disease Control and Prevention website. http://www.cdc.gov/motorvehiclesafety/mc/states/index.html. Updated June 13, 2012. Accessed April 23, 2015.
6. Langley RL, Higgins SA, Herrin KB. Risk factors associated with fatal animal-vehicle collisions in the United States, 1995-2004. Wilderness Environ Med. 2006;17(4):229-239.
7. Vehicle registrations in force – 2010. Archives of Statistical Summaries. New York State Department of Motor Vehicles website. http://dmv.ny.gov/statistic/regin10.pdf. Accessed May 11, 2015.
8. Vehicle registrations in force – 2011. Archives of Statistical Summaries. New York State Department of Motor Vehicles website. http://dmv.ny.gov/statistic/regin11.pdf. Accessed May 11, 2015.
9. Summary of motorcycle crashes – 2011. Archives of Statistical Summaries. New York State Department of Motor Vehicles website. http://dmv.ny.gov/statistic/2011MotorcycleCrashSummary.pdf. Accessed April 23, 2015.
10. Summary of motorcycle accidents – 2010. Archives of Statistical Summaries. New York State Department of Motor Vehicles website. dmv.ny.gov/statistic/2010MotorcycleAccSummary.pdf. Accessed April 23, 2015.
11. Summary of motorcycle accidents – 2009. Archives of Statistical Summaries. New York State Department of Motor Vehicles website. dmv.ny.gov/statistic/2009MotorcycleSummary.pdf. Accessed April 23, 2015.
12. Huijser MP, McGowen P, Fuller J, et al; Federal Highway Administration. Wildlife-Vehicle Collision Reduction Study: Report to Congress. Report no. FHWA-HRT-08-034. Washington, DC: US Department of Transportation, Federal Highway Administration; 2008. http://www.fhwa.dot.gov/publications/research/safety/08034/08034.pdf. Accessed April 23, 2015.
13. Williams AF, Wells JK. Characteristics of vehicle-animal crashes in which vehicle occupants are killed. Traffic Inj Prev. 2005;6(1):56-59.
14. Jones M. Deer-vehicle crash injuries, fatalities reach all-time high in Wisconsin. Milwaukee Journal Sentinel. April 14, 2000:1B-2B.
Mortality Rates Associated With Odontoid and Subaxial Cervical Spine Fractures
Mortality rate is an important indicator of the severity of traumatic injuries, and these values have been described for different orthopedic injuries and fractures. Studies have identified 3 distinct trends in patient survival when compared with the age- and sex-matched uninjured population:
1. Hip fractures bring about a transient increase in mortality relative to age-matched controls that normalizes after a few months to 1 year.1-10
2. Thoracic and lumbar compression fractures are associated with an ongoing, lifelong increase in mortality rate relative to age-matched controls without an initial marked upswing.11-15
3. Certain injuries such as isolated rib or wrist fractures do not adversely affect survival relative to age-matched controls.12,16-18
Understanding the mortality patterns after these injuries can help guide management and even facilitate the development of appropriate treatment algorithms.19-21 While studies have examined mortality in specific odontoid fracture types,22 such mortality trends have not been broadly established in persons with cervical spine fractures.
Cervical spine fractures are common: 60% of spine fractures localize to this region,23-26 and this equates to 2% to 3% of all blunt-trauma patients.27,28 These injuries can lead to devastating consequences, including neurologic compromise, permanent disability, and death.29-31
Studies have estimated that up to 20% of cervical fractures involve the odontoid process.23-26 These injuries are more common among the elderly population because of their greater prevalence of osteoporosis and likelihood of falling.32 Because of demographic similarities to those of the hip fracture population, a survival analysis of all odontoid fractures is particularly interesting. Published odontoid mortality rates vary significantly, with reports ranging from 13% to 44%.22,33-35 Unfortunately, these studies largely evaluated survival rates specific to an individual treatment modality, such as nonoperative compared with operative, or specific to certain odontoid fracture types (eg, type II). Additionally, studies have generally only considered survivorship during initial hospitalization, have been specific to a constrained age group, or have been based solely on inpatient records that do not permit the longer-term follow-up critical to determining the effect of odontoid fractures on overall mortality.36-39
Likewise, mortality rates after fractures of the subaxial spine (ie, the motion segments between C3 and C7) have yet to be established. In 1 study, the mortality risk of a cohort of elderly patients with cervical fractures appeared to be elevated for the first 6 to 12 months after the traumatic event.40 However, the sample size was too small to examine mortality beyond 1 year.
In this context, the purpose of the current study was to determine the mortality rates at several time points (3 months, 1 year, and 2 years) of patients 50 years or older (start of the second mode of the bimodal age distribution of odontoid fractures41-44) with fractures of the odontoid and subaxial cervical spine. A secondary purpose of this study was to compare survival rates of these 2 cohorts relative to each other and to the general population.
Materials and Methods
Identification of Cervical Fractures and Collection of Demographic Information
This protocol was approved by the human investigation committee of our institution. Every computed tomography (CT) scan of the cervical spine performed in the emergency department (ED) of an academic hospital between November 27, 1997, and December 31, 2006, was identified. Since the threshold for obtaining a CT scan of a patient with suspected cervical spine trauma is relatively low, it was assumed that virtually all acute cervical spine fractures during this time period would be successfully identified through this approach.
Radiology reports for all identified CT scans were reviewed for any findings consistent with acute fractures and/or dislocations of the cervical spine (Figure 1). Every study noted to be positive or equivocal for cervical trauma was directly visualized, including those that did not specifically mention the presence or absence of an injury. Scans with no signs of acute trauma or that showed fractures caused by a pathologic process or penetrating mechanism (eg, metastatic lesions or gunshot wounds) were omitted from this series. Finally, relevant demographic information, such as the medical record number, age, gender, and date of study, was recorded for every subject in this group.
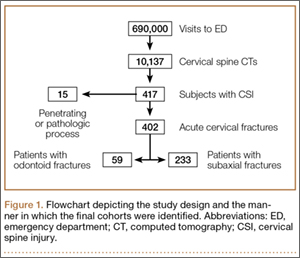
Fracture Classification
Next, the level and the type of cervical injury were documented for each patient. Fractures were segregated according to their involvement with the odontoid or the subaxial vertebrae.
Odontoid fractures were categorized into type I (limited to the tip), type II (across the base of the process) and type III (through the base with extension into the C2 vertebral body).45,46 Since many systems for classifying subaxial cervical spine trauma require a subjective inference of the injury mechanism, which is difficult to ascertain from imaging studies alone, all of these fractures were pooled together.
A preliminary survey of the data indicated that the odontoid fractures appeared to exhibit a bimodal age distribution, with the beginning of the second cluster occurring around age 50 years (Figure 2). As noted above, this has been shown in previous studies.41-44 As a consequence, the mortalities of those older than 50 years became the focus of this study. To control for comorbid conditions, mechanism of injury, and to allow for more direct comparison with the odontoid fractures in this study, the same age demarcation was used for subaxial cervical fractures.
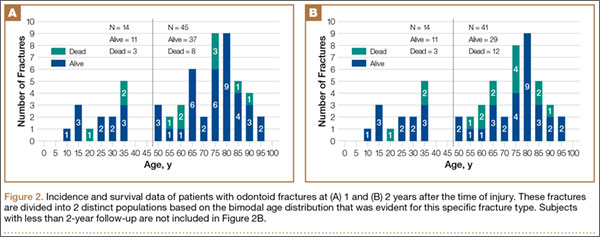
Mortality Data
The mortality status of every patient diagnosed with an acute cervical injury at our institution between November 27, 1997, and December 31, 2006, was determined by referencing the National Death Index (NDI). The NDI is a computerized database of death records maintained by the National Center for Health Statistics (NCHS). The time window for the current study was selected because we had access to NDI information only through 2007 at the time of this study. Social Security numbers (SSNs), which were available for approximately half of the subjects, were used to search the NDI catalog. For individuals whose SSNs were unavailable, patient names and birthdates were considered to be sufficient to confirm a true match. Our center’s medical records of this cohort were also examined to verify whether any had died during their initial hospitalizations and to substantiate the NDI data. Finally, patient deaths were categorized as trauma (eg, motor vehicle accident, fall from a height) or medical comorbidity (eg, diabetes mellitus, cancer, congestive heart failure), based on information in the NDI listing.
Age- and Sex-Matched Controls
Age- and sex-matched controls were determined from the Wide-ranging Online Data for Epidemiologic Research (WONDER) application distributed by the Centers for Disease Control and Prevention (http://wonder.cdc.gov). Composite mortality data from the state in which the study was performed was obtained for the years between 1999 and 2007, and this information was further stratified according to gender and age to estimate the mortality rates and construct survival curves for each group. Controls were used to establish a standardized mortality ratio (SMR) for subjects 50 years and older, a value that compares the number of observed deaths with the figure expected for matched populations from the general population.
Statistical Methods
Statistical analyses were performed by using both SAS 9.2 (SAS Institute Inc., Cary, North Carolina) and R (version 2.9; www.r-project.org, Auckland, New Zealand). Relevant comparisons were planned, and all tests were 2-sided. The Wilcoxon rank sum test was applied to compare the survival times of patients with odontoid fractures with different documented causes of death, and Pearson χ2 test was used to compare the age distributions of odontoid and subaxial fractures. Survival rates at 3 months, 1 year, and 2 years were estimated from Kaplan-Meier curves. The relative survival of these cohorts was compared by completing a 2-sample log-rank test. In addition, a 1-sample log-rank test was implemented to compare the mortality from either odontoid or subaxial cervical spine fractures with that of the age- and gender-matched general population. Statistical significance was defined as a 2-sided α error of less than 0.05 (P < .05).
Results
Fifty-nine patients were diagnosed with odontoid fractures (28 men, 31 women), and 233 patients were diagnosed with subaxial cervical spine fractures (168 men, 65 women).
Odontoid Fracture Patients
Odontoid fracture patients exhibited a distinct bimodal age distribution (Figure 2). In the younger population, there were 14 subjects, 3 of whom died within days of the injury (mean, 12 days; 78.6% survival). At 2-year follow-up, there were no further deaths. The fractures that caused death were high-energy injuries, and only early deaths occurred in these cases.
Because of the significant bimodal age distribution, it was believed these cohorts could not be directly compared. As a result, the remaining analysis focused on the older age group. In the older population mode (50 years and older) were 45 patients with odontoid fractures. Of the 12 subjects who died after odontoid fracture, 5 were assigned a trauma code as the cause of death, while a medical comorbidity code was assigned for the remaining 7. Mean survival time of those who died secondary to trauma was significantly shorter than the medical comorbidity group (P = .025).
In the cohort of subjects older than 50 years, 3-month, 1-year, and 2-year survival rates were 84.4%, 82.2%, and 72.9%, respectively. Figure 2 shows the 1- and 2-year follow-up data by age group.
Analysis was performed relative to gender. Of male patients (n = 22), the 3-month, 1-year, and 2-year survival rates were 72.7%, 72.7%, and 62.7%, respectively. Among women (n = 23), the 3-month, 1-year, and 2-year survival rates were 95.7%, 91.3%, and 82.6%, respectively.
Figure 3 shows the Kaplan-Meier survival curves of the older patients with odontoid fractures. A comparison of the curves for each gender showed no significant disparities between the male and female survival (Figure 3A, P = .124). Compared with age-matched male counterparts, the survival of male subjects with odontoid fractures was significantly worse (Figure 3B, P < .001). Men experienced an initial acute decline in survival, with the remainder of the survival curve matching that of the general male population. In contrast, odontoid fractures did not adversely affect female survival compared with the matched population (Figure 3C, P = .568).
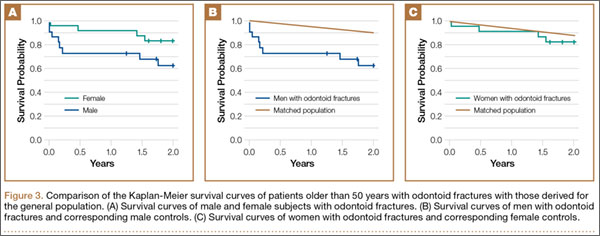
The 2-year SMR of 2.98 for men showed that odontoid fractures led to greater mortality compared with a sex- and age-matched population. This means that men older than 50 years who sustained an odontoid fracture had nearly 3 times the mortality rate after 2 years compared with a normal, matched population; this increase is attributed to the 3-month time point that subsequently normalized. The female rate was 1.33 times that of a matched population, a difference that is not statistically significant.
Subaxial Fracture Patients
Of the 91 patients older than 50 years with subaxial fractures, 3-month, 1-year, and 2-year survival rates were 87.9%, 85.7%, and 85.7%, respectively. Figure 4 shows the 1- and 2-year follow-up data by age group.
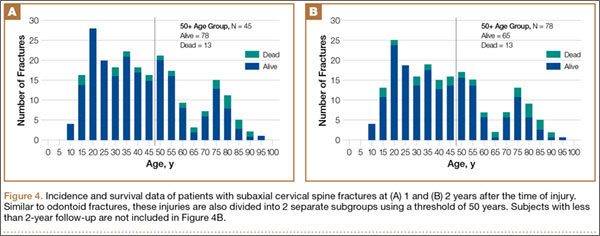
Gender-specific analysis was performed. For men (n = 58), the 3-month, 1-year, and 2-year survival rates were 87.9%, 84.5%, and 84.5%, respectively. Among women (n = 33), 4 deaths were recorded at all time points (87.9% survival).
Figure 5 shows Kaplan-Meier survival curves for the older population with subaxial fractures. A comparison of the curves between genders again showed no significant differences between male and female survival (P = .683, Figure 5A). Compared with age- and gender-matched counterparts, men showed decreased relative survival (P < .0001, Figure 5B), whereas subaxial fractures did not decrease female survival (P = .554, Figure 5C).
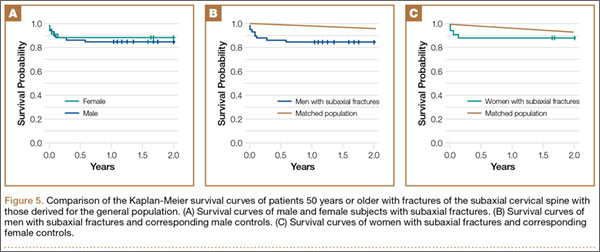
The 2-year SMR of 2.90 for men showed higher mortality rates relative to sex- and age-matched controls. Men who were both 50 years old and sustained a subaxial fracture were 2.9 times as likely to die within 2 years of follow-up compared with their counterparts. Similar to odontoid fractures, this increase occurred by the 3-month time point and subsequently normalized. The female rate, which was 1.34 times that of the uninjured population, was not statistically significant.
Comparison of Odontoid and Subaxial Fracture Patients
The survival of subaxial injuries was not significantly different from that of odontoid fractures (P = .113, Figure 6A). When analyzed by gender and controlled for age, the rates in both male (P = .347, Figure 6B) and female (P = .643, Figure 6C) patients did not differ between fracture types.
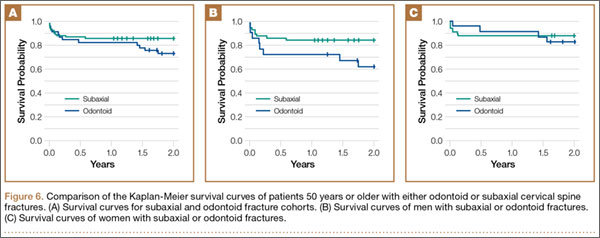
Discussion
The US population is aging rapidly, with the demographic older than 65 years predicted to more than double in size between 2010 and 2050.47 As our elderly population grows, the incidence of age-related injuries will rise accordingly. An understanding of mortality risks associated with different fractures will not only assist practitioners in advising patients regarding prognosis but may also lead to improvements in clinical care.19,48-50 While we know cervical spine trauma is associated with significant morbidity,29-31 little is known about associated moderate-term mortality rates that can be compared with other known injury patterns, such as hip fractures or osteoporotic compression fractures.
An interesting finding of the present study is the bimodal age distribution of the 59 odontoid fractures (Figure 2). The 14 patients younger than 50 years included 3 individuals who died, all within days of their presentation from severe multisystem trauma. This is consistent with the determination that high-energy forces are required to fracture the odontoid process in younger individuals.38,45,46,51,52 Given the severity of their nonspinal injuries, the cause of death was likely not primarily related to their odontoid fractures. Also in line with previous studies, the majority (76%) of odontoid fractures were documented in subjects older than 50 years.32,53,54 Within our cohort older than 50 years, the deaths appear to be spread evenly across age groups and do not seem to be skewed by the oldest portion of the population (Figure 2).
Our gender-specific analyses revealed that older men with odontoid injuries exhibited higher mortality compared with an age-matched male cohort, with 6 of the 8 deaths occurring within 3 months. However, after this exaggerated decline in survival, the rate normalized towards general population mortality rates (Figure 3B). As in the younger cohort, these earlier deaths were largely attributable to multisystem trauma, whereas medical comorbidities were implicated in those who died later. In contrast, the Kaplan-Meier curve of older women with odontoid fractures closely approximates that of age-matched women at every time point (Figure 3C), indicating that these injuries do not decrease survival as they do in their male counterparts.
When comparing the survival of older patients with subaxial cervical spine fractures with that of gender- and age-matched controls, the mortality rates of women were, once again, essentially equivalent. However, the survival of older men was significantly compromised by these injuries. In men, 7 of the 9 deaths were within 3 months, with the remaining 2 deaths occurring within 7 months. Nevertheless, beyond this initial period of elevated mortality, the survival curve again stabilized and paralleled that of the general population. As with odontoid fractures, there was no sustained increase in the mortality of male patients who lived at least 3 months after injury.
The mortality rates of odontoid and subaxial fractures were also compared in the older population. When controlled for age, there was no difference in mortality rates between these 2 groups. When individually analyzed in both men and women, the mortality rates of both fracture types matched those of the general population at all time points.
It is useful to contextualize our findings alongside the mortality of older individuals with other fracture types. Based on our results, we believe that the survival curves of geriatric men with odontoid or subaxial cervical spine fractures most closely resemble the characteristic pattern seen in hip fractures. Hip fractures have shown an early spike in mortality by as much as 8% to 49% in the first 6 to 12 months that returns to baseline after 1 year.1-10 This presumably reflects the natural history of these injuries in response to appropriate therapeutic interventions. Interestingly, the male mortality rates for both odontoid and subaxial cervical spine fractures in this study are largely analogous to those reported by various hip fracture surveys.1,5,55-58 In contrast, similar to prior studies of rib or wrist fractures, older women with these cervical spine fractures did not show a survival decrease after their injuries.12,16-18
While the reasons underlying the differential effects of cervical fractures on the mortality of men and women have not been established, one explanation is that the female geriatric population is relatively more osteoporotic; thus, cervical injuries may occur after lower-energy forces, leading to less severe associated trauma that could otherwise decrease survival. Another explanation is that men are more likely to be involved in high-energy accidents,59,60 thus decreasing their overall survival after injury.
This investigation is not without limitations. Our primary concern is the determination of survival. The NDI maintained by the NCHS is an extremely reliable tool regularly employed by epidemiologists to collect mortality data. However, it is possible that deaths may have been missed. We believe this number would be small, because the NDI database provided multiple probable matches that were carefully compared with supplemental personal information. It is also possible that deaths that were not appropriately registered with the NDI are not represented in this series. Another limitation lies in the determination of controls. As with any case–control study, the patients sustaining these odontoid fractures may differ in some significant way from the average population. A final limitation is that a small portion of patients in the study have only 1-year follow-up, because patient data was collected through 2006, although access to NDI data ended in 2007.
Conclusion
Our results indicate that the survival of older men with either odontoid or subaxial cervical spine fractures shares many of the same mortality characteristics as hip fractures, with diminished survival in the first 3 months that normalizes to the survival rate of the age-matched population. Interestingly, and perhaps because of disparate rates of osteoporosis and traumatic forces, the mortality rates in the female cohort were similar to that of the age-matched general population at all time points. These trends were nearly identical for both odontoid and subaxial cervical fractures.
1. Gennarelli TA, Champion HR, Sacco WJ, Copes WS, Alves WM. Mortality of patients with head injury and extracranial injury treated in trauma centers. J Trauma. 1989;29(9):1193-1201; discussion 1201-1202.
2. George GH, Patel S. Secondary prevention of hip fracture. Rheumatology (Oxford). 2000;39(4):346-349.
3. Gerrelts BD, Petersen EU, Mabry J, Petersen SR. Delayed diagnosis of cervical spine injuries. J Trauma. 1991;31(12):1622-1626.
4. Giannoudis PV, Mehta SS, Tsiridis E. Incidence and outcome of whiplash injury after multiple trauma. Spine. 2007;32(7):776-781.
5. Goldberg W, Mueller C, Panacek E, et al. Distribution and patterns of blunt traumatic cervical spine injury. Ann Emerg Med. 2001;38(1):17-21.
6. Grauer JN, Shafi B, Hilibrand AS, et al. Proposal of a modified, treatment-oriented classification of odontoid fractures. Spine J. 2005;5(2):123-129.
7. Greene KA, Dickman CA, Marciano FF, Drabier JB, Hadley MN, Sonntag VK. Acute axis fractures. Analysis of management and outcome in 340 consecutive cases. Spine. 1997;22(16):1843-1852.
8. Gulli B, Templeman D. Compartment syndrome of the lower extremity. Orthop Clin North Am. 1994;25(4):677-684.
9. Guthkelch AN, Fleischer AS. Patterns of cervical spine injury and their associated lesions. West J Med. 1987;147(4):428-431.
10. Hackl W, Hausberger K, Sailer R, Ulmer H, Gassner R. Prevalence of cervical spine injuries in patients with facial trauma. Oral Surg Oral Med Oral Pathol Oral Radiol Endod. 2001;92(4):370-376.
11. Doruk H, Mas MR, Yildiz C, Sonmez A, Kyrdemir V. The effect of the timing of hip fracture surgery on the activity of daily living and mortality in elderly. Arch Gerontol Geriatr. 2004;39(2):179-185.
12. Garabige V, Giraud P, De Rycke Y, et al. [Impact of nutrition management in patients with head and neck cancers treated with irradiation: is the nutritional intervention useful?]. Cancer Radiother. 2007;11(3):111-116.
13. Garbuz DS, Leitch K, Wright JG. The treatment of supracondylar fractures in children with an absent radial pulse. J Pediatr Orthop. 1996;16(5):594-596.
14. Henderson RL, Reid DC, Saboe LA. Multiple noncontiguous spine fractures. Spine. 1991;16(2):128-131.
15. Henrikson B. Supracondylar fracture of the humerus in children. A late review of end-results with special reference to the cause of deformity, disability and complications. Acta Chir Scand Suppl. 1966;369:1-72.
16. De Boeck H, De Smet P, Penders W, De Rydt D. Supracondylar elbow fractures with impaction of the medial condyle in children. J Pediatr Orthop. 1995;15(4):444-448.
17. Gelberman RH, Panagis JS, Taleisnik J, Baumgaertner M. The arterial anatomy of the human carpus. Part I: The extraosseous vascularity. J Hand Surg Am. 1983;8(4):367-375.
18. Hu J, Liao Q, Long W. Diagnosis and treatment of multiple-level noncontiguous spinal fractures. Zhongguo Xiu Fu Chong Jian Wai Ke Za Zhi. 2005;19(6):424-426.
19. Eleraky MA, Theodore N, Adams M, Rekate HL, Sonntag VK. Pediatric cervical spine injuries: report of 102 cases and review of the literature. J Neurosurg. 2000;92(1 suppl):12-17.
20. Ioannidis G, Papaioannou A, Hopman WM, et al. Relation between fractures and mortality: results from the Canadian Multicentre Osteoporosis Study. CMAJ. 2009;181(5):265-271.
21. Husby J, Sorensen KH. Fracture of the odontoid process of the axis. Acta Orthop Scand. 1974;45(2):182-192.
22. Schoenfeld AJ, Bono CM, Reichmann WM, et al. Type II odontoid fractures of the cervical spine: do treatment type and medical comorbidities affect mortality in elderly patients? Spine. 2011;36(11):879-885.
23. Ensrud KE, Thompson DE, Cauley JA, et al. Prevalent vertebral deformities predict mortality and hospitalization in older women with low bone mass. Fracture Intervention Trial Research Group. J Am Geriatr Soc. 2000;48(3):241-249.
24. Fassett DR, Dailey AT, Vaccaro AR. Vertebral artery injuries associated with cervical spine injuries: a review of the literature. J Spinal Disord Tech. 2008;21(4):252-258.
25. Ippolito E, Caterini R, Scola E. Supracondylar fractures of the humerus in children. Analysis at maturity of fifty-three patients treated conservatively. J Bone Joint Surg Am. 1986;68(3):333-344.
26. Spence KF Jr, Decker S, Sell KW. Bursting atlantal fracture associated with rupture of the transverse ligament. J Bone Joint Surg Am. 1970;52(3):543-549.
27. Irwin ZN, Arthur M, Mullins RJ, Hart RA. Variations in injury patterns, treatment, and outcome for spinal fracture and paralysis in adult versus geriatric patients. Spine. 2004;29(7):796-802.
28. Ismail AA, O’Neill TW, Cooper C, et al. Mortality associated with vertebral deformity in men and women: results from the European Prospective Osteoporosis Study (EPOS). Osteoporos Int. 1998;8(3):291-297.
29. Iyengar SR, Hoffinger SA, Townsend DR. Early versus delayed reduction and pinning of type III displaced supracondylar fractures of the humerus in children: a comparative study. J Orthop Trauma. 1999;13(1):51-55.
30. Jackson AP, Haak MH, Khan N, Meyer PR. Cervical spine injuries in the elderly: acute postoperative mortality. Spine. 2005;30(13):1524-1527.
31. Jacobsen SJ, Goldberg J, Miles TP, Brody JA, Stiers W, Rimm AA. Race and sex differences in mortality following fracture of the hip. Am J Public Health. 1992;82(8):1147-1150.
32. Fisher ES, Baron JA, Malenka DJ, et al. Hip fracture incidence and mortality in New England. Epidemiology. 1991;2(2):116-122.
33. Chapman J, Smith JS, Kopjar B, et al. The AOSpine North America Geriatric Odontoid Fracture Mortality Study: a retrospective review of mortality outcomes for operative versus nonoperative treatment of 322 patients with long-term follow-up. Spine. 2013;38:1098-1104.
34. Denault A, Bains I, Moghadam K, Hu RW, Swamy G. Evaluation of mortality following an odontoid fracture in the octogenarian population. J Bone Joint Surg Br. 2011;93(Supp IV):585.
35. Molinari WJ III, Molinari RW, Khera OA, Gruhn WL. Functional outcomes, morbidity, mortality, and fracture healing in 58 consecutive patients with geriatric odontoid fracture treated with cervical collar or posterior fusion. Global Spine J. 2013;3(1):21-32.
36. Hanigan WC, Powell FC, Elwood PW, Henderson JP. Odontoid fractures in elderly patients. J Neurosurg. 1993;78(1):32-35.
37. Korres DS, Boscainos PJ, Papagelopoulos PJ, Psycharis I, Goudelis G, Nikolopoulos K. Multiple level noncontiguous fractures of the spine. Clin Orthop. 2003;411:95-102.
38. Leet AI, Frisancho J, Ebramzadeh E. Delayed treatment of type 3 supracondylar humerus fractures in children. J Pediatr Orthop. 2002;22(2):203-207.
39. Leone A, Cerase A, Colosimo C, Lauro L, Puca A, Marano P. Occipital condylar fractures: a review. Radiology. 2000;216(3):635-644.
40. Lyles KW, Colón-Emeric CS, Magaziner JS, et al; HORIZON Recurrent Fracture Trial. Zoledronic acid and clinical fractures and mortality after hip fracture. N Engl J Med. 2007;357(18):1799-1809.
41. Müller EJ, Wick M, Russe O, Muhr G. Management of odontoid fractures in the elderly. Eur Spine J. 1999;8(5):360-365.
42. Pepin JW, Bourne RB, Hawkins RJ. Odontoid fractures, with special reference to the elderly patient. Clin Orthop. 1985;193:178-183.
43. Ryan MD, Henderson JJ. The epidemiology of fractures and fracture-dislocations of the cervical spine. Injury. 1992;23(1):38-40.
44. Butler JS, Dolan RT, Burbridge M, et al. The long-term functional outcome of type II odontoid fractures managed non-operatively. Eur Spine J. 2010;19(10):1635-1642.
45. Levine AM, Edwards CC. The management of traumatic spondylolisthesis of the axis. J Bone Joint Surg Am. 1985;67(2):217-226.
46. Lowery DW, Wald MM, Browne BJ, Tigges S, Hoffman JR, Mover WR; NEXUS Group. Epidemiology of cervical spine injury victims. Ann Emerg Med. 2001;38(1):12-16.
47. Jacobsen LA, Kent M, Lee M, Mather M. America’s aging population. Popul Bull. 2011;66(1):1-16. http://www.prb.org/pdf11/aging-in-america.pdf. Published February 2011. Accessed April 22, 2015.
48. Holly LT, Kelly DF, Counelis GJ, Blinman T, McArthur DL, Cryer HG. Cervical spine trauma associated with moderate and severe head injury: incidence, risk factors, and injury characteristics. J Neurosurg. 2002;96(3 suppl):285-291.
49. Holmes JF, Akkinepalli R. Computed tomography versus plain radiography to screen for cervical spine injury: a meta-analysis. J Trauma. 2005;58(5):902-905.
50. Hove LM. Epidemiology of scaphoid fractures in Bergen, Norway. Scand J Plast Reconstr Surg Hand Surg. 1999;33(4):423-426.
51. Lu-Yao G, Baron Ja, Barrett Ja, Fisher Es. Treatment and survival among elderly Americans with hip fractures: a population-based study. Am J Public Health. 1994;84(8):1287-1291.
52. Lu-Yao GL, Keller RB, Littenberg B, Wennberg JE. Outcomes after displaced fractures of the femoral neck. A meta-analysis of one hundred and six published reports. J Bone Joint Surg Am. 1994;76(1):15-25.
53. Kado DM, Browner WS, Palermo L, Nevitt MC, Genant HK, Cummings SR. Vertebral fractures and mortality in older women: a prospective study. Study of Osteoporotic Fractures Research Group. Arch Intern Med. 1999;159(11):1215-1220.
54. Levine AM, Edwards CC. Fractures of the atlas. J Bone Joint Surg Am. 1991;73(5):680-691.
55. Maak TG, Grauer JN. The contemporary treatment of odontoid injuries. Spine. 2006;31(11 Suppl):S53-S60; discussion S61.
56. Magaziner J, Fredman L, Hawkes W, et al. Changes in functional status attributable to hip fracture: a comparison of hip fracture patients to community-dwelling aged. Am J Epidemiol. 2003;157(11):1023-1031.
57. Magaziner J, Hawkes W, Hebel JR, et al. Recovery from hip fracture in eight areas of function. J Gerontol A Biol Sci Med Sci. 2000;55(9):M498-M507.
58. Malham GM, Ackland HM, Jones R, Williamson OD, Varma DK. Occipital condyle fractures: incidence and clinical follow-up at a level 1 trauma centre. Emerg Radiol. 2009;16(4):291-297.
59. Probst C, Zelle B, Panzica M, et al. Clinical re-examination 10 or more years after polytrauma: is there a gender related difference? J Trauma. 2010;68(3):706-711.
60. Holbrook TL, Hoyt DB, Anderson JP. The importance of gender on outcome after major trauma: functional and psychologic outcomes in women versus men. J Trauma. 2001;50(2):270-273.
Mortality rate is an important indicator of the severity of traumatic injuries, and these values have been described for different orthopedic injuries and fractures. Studies have identified 3 distinct trends in patient survival when compared with the age- and sex-matched uninjured population:
1. Hip fractures bring about a transient increase in mortality relative to age-matched controls that normalizes after a few months to 1 year.1-10
2. Thoracic and lumbar compression fractures are associated with an ongoing, lifelong increase in mortality rate relative to age-matched controls without an initial marked upswing.11-15
3. Certain injuries such as isolated rib or wrist fractures do not adversely affect survival relative to age-matched controls.12,16-18
Understanding the mortality patterns after these injuries can help guide management and even facilitate the development of appropriate treatment algorithms.19-21 While studies have examined mortality in specific odontoid fracture types,22 such mortality trends have not been broadly established in persons with cervical spine fractures.
Cervical spine fractures are common: 60% of spine fractures localize to this region,23-26 and this equates to 2% to 3% of all blunt-trauma patients.27,28 These injuries can lead to devastating consequences, including neurologic compromise, permanent disability, and death.29-31
Studies have estimated that up to 20% of cervical fractures involve the odontoid process.23-26 These injuries are more common among the elderly population because of their greater prevalence of osteoporosis and likelihood of falling.32 Because of demographic similarities to those of the hip fracture population, a survival analysis of all odontoid fractures is particularly interesting. Published odontoid mortality rates vary significantly, with reports ranging from 13% to 44%.22,33-35 Unfortunately, these studies largely evaluated survival rates specific to an individual treatment modality, such as nonoperative compared with operative, or specific to certain odontoid fracture types (eg, type II). Additionally, studies have generally only considered survivorship during initial hospitalization, have been specific to a constrained age group, or have been based solely on inpatient records that do not permit the longer-term follow-up critical to determining the effect of odontoid fractures on overall mortality.36-39
Likewise, mortality rates after fractures of the subaxial spine (ie, the motion segments between C3 and C7) have yet to be established. In 1 study, the mortality risk of a cohort of elderly patients with cervical fractures appeared to be elevated for the first 6 to 12 months after the traumatic event.40 However, the sample size was too small to examine mortality beyond 1 year.
In this context, the purpose of the current study was to determine the mortality rates at several time points (3 months, 1 year, and 2 years) of patients 50 years or older (start of the second mode of the bimodal age distribution of odontoid fractures41-44) with fractures of the odontoid and subaxial cervical spine. A secondary purpose of this study was to compare survival rates of these 2 cohorts relative to each other and to the general population.
Materials and Methods
Identification of Cervical Fractures and Collection of Demographic Information
This protocol was approved by the human investigation committee of our institution. Every computed tomography (CT) scan of the cervical spine performed in the emergency department (ED) of an academic hospital between November 27, 1997, and December 31, 2006, was identified. Since the threshold for obtaining a CT scan of a patient with suspected cervical spine trauma is relatively low, it was assumed that virtually all acute cervical spine fractures during this time period would be successfully identified through this approach.
Radiology reports for all identified CT scans were reviewed for any findings consistent with acute fractures and/or dislocations of the cervical spine (Figure 1). Every study noted to be positive or equivocal for cervical trauma was directly visualized, including those that did not specifically mention the presence or absence of an injury. Scans with no signs of acute trauma or that showed fractures caused by a pathologic process or penetrating mechanism (eg, metastatic lesions or gunshot wounds) were omitted from this series. Finally, relevant demographic information, such as the medical record number, age, gender, and date of study, was recorded for every subject in this group.
Fracture Classification
Next, the level and the type of cervical injury were documented for each patient. Fractures were segregated according to their involvement with the odontoid or the subaxial vertebrae.
Odontoid fractures were categorized into type I (limited to the tip), type II (across the base of the process) and type III (through the base with extension into the C2 vertebral body).45,46 Since many systems for classifying subaxial cervical spine trauma require a subjective inference of the injury mechanism, which is difficult to ascertain from imaging studies alone, all of these fractures were pooled together.
A preliminary survey of the data indicated that the odontoid fractures appeared to exhibit a bimodal age distribution, with the beginning of the second cluster occurring around age 50 years (Figure 2). As noted above, this has been shown in previous studies.41-44 As a consequence, the mortalities of those older than 50 years became the focus of this study. To control for comorbid conditions, mechanism of injury, and to allow for more direct comparison with the odontoid fractures in this study, the same age demarcation was used for subaxial cervical fractures.
Mortality Data
The mortality status of every patient diagnosed with an acute cervical injury at our institution between November 27, 1997, and December 31, 2006, was determined by referencing the National Death Index (NDI). The NDI is a computerized database of death records maintained by the National Center for Health Statistics (NCHS). The time window for the current study was selected because we had access to NDI information only through 2007 at the time of this study. Social Security numbers (SSNs), which were available for approximately half of the subjects, were used to search the NDI catalog. For individuals whose SSNs were unavailable, patient names and birthdates were considered to be sufficient to confirm a true match. Our center’s medical records of this cohort were also examined to verify whether any had died during their initial hospitalizations and to substantiate the NDI data. Finally, patient deaths were categorized as trauma (eg, motor vehicle accident, fall from a height) or medical comorbidity (eg, diabetes mellitus, cancer, congestive heart failure), based on information in the NDI listing.
Age- and Sex-Matched Controls
Age- and sex-matched controls were determined from the Wide-ranging Online Data for Epidemiologic Research (WONDER) application distributed by the Centers for Disease Control and Prevention (http://wonder.cdc.gov). Composite mortality data from the state in which the study was performed was obtained for the years between 1999 and 2007, and this information was further stratified according to gender and age to estimate the mortality rates and construct survival curves for each group. Controls were used to establish a standardized mortality ratio (SMR) for subjects 50 years and older, a value that compares the number of observed deaths with the figure expected for matched populations from the general population.
Statistical Methods
Statistical analyses were performed by using both SAS 9.2 (SAS Institute Inc., Cary, North Carolina) and R (version 2.9; www.r-project.org, Auckland, New Zealand). Relevant comparisons were planned, and all tests were 2-sided. The Wilcoxon rank sum test was applied to compare the survival times of patients with odontoid fractures with different documented causes of death, and Pearson χ2 test was used to compare the age distributions of odontoid and subaxial fractures. Survival rates at 3 months, 1 year, and 2 years were estimated from Kaplan-Meier curves. The relative survival of these cohorts was compared by completing a 2-sample log-rank test. In addition, a 1-sample log-rank test was implemented to compare the mortality from either odontoid or subaxial cervical spine fractures with that of the age- and gender-matched general population. Statistical significance was defined as a 2-sided α error of less than 0.05 (P < .05).
Results
Fifty-nine patients were diagnosed with odontoid fractures (28 men, 31 women), and 233 patients were diagnosed with subaxial cervical spine fractures (168 men, 65 women).
Odontoid Fracture Patients
Odontoid fracture patients exhibited a distinct bimodal age distribution (Figure 2). In the younger population, there were 14 subjects, 3 of whom died within days of the injury (mean, 12 days; 78.6% survival). At 2-year follow-up, there were no further deaths. The fractures that caused death were high-energy injuries, and only early deaths occurred in these cases.
Because of the significant bimodal age distribution, it was believed these cohorts could not be directly compared. As a result, the remaining analysis focused on the older age group. In the older population mode (50 years and older) were 45 patients with odontoid fractures. Of the 12 subjects who died after odontoid fracture, 5 were assigned a trauma code as the cause of death, while a medical comorbidity code was assigned for the remaining 7. Mean survival time of those who died secondary to trauma was significantly shorter than the medical comorbidity group (P = .025).
In the cohort of subjects older than 50 years, 3-month, 1-year, and 2-year survival rates were 84.4%, 82.2%, and 72.9%, respectively. Figure 2 shows the 1- and 2-year follow-up data by age group.
Analysis was performed relative to gender. Of male patients (n = 22), the 3-month, 1-year, and 2-year survival rates were 72.7%, 72.7%, and 62.7%, respectively. Among women (n = 23), the 3-month, 1-year, and 2-year survival rates were 95.7%, 91.3%, and 82.6%, respectively.
Figure 3 shows the Kaplan-Meier survival curves of the older patients with odontoid fractures. A comparison of the curves for each gender showed no significant disparities between the male and female survival (Figure 3A, P = .124). Compared with age-matched male counterparts, the survival of male subjects with odontoid fractures was significantly worse (Figure 3B, P < .001). Men experienced an initial acute decline in survival, with the remainder of the survival curve matching that of the general male population. In contrast, odontoid fractures did not adversely affect female survival compared with the matched population (Figure 3C, P = .568).
The 2-year SMR of 2.98 for men showed that odontoid fractures led to greater mortality compared with a sex- and age-matched population. This means that men older than 50 years who sustained an odontoid fracture had nearly 3 times the mortality rate after 2 years compared with a normal, matched population; this increase is attributed to the 3-month time point that subsequently normalized. The female rate was 1.33 times that of a matched population, a difference that is not statistically significant.
Subaxial Fracture Patients
Of the 91 patients older than 50 years with subaxial fractures, 3-month, 1-year, and 2-year survival rates were 87.9%, 85.7%, and 85.7%, respectively. Figure 4 shows the 1- and 2-year follow-up data by age group.
Gender-specific analysis was performed. For men (n = 58), the 3-month, 1-year, and 2-year survival rates were 87.9%, 84.5%, and 84.5%, respectively. Among women (n = 33), 4 deaths were recorded at all time points (87.9% survival).
Figure 5 shows Kaplan-Meier survival curves for the older population with subaxial fractures. A comparison of the curves between genders again showed no significant differences between male and female survival (P = .683, Figure 5A). Compared with age- and gender-matched counterparts, men showed decreased relative survival (P < .0001, Figure 5B), whereas subaxial fractures did not decrease female survival (P = .554, Figure 5C).
The 2-year SMR of 2.90 for men showed higher mortality rates relative to sex- and age-matched controls. Men who were both 50 years old and sustained a subaxial fracture were 2.9 times as likely to die within 2 years of follow-up compared with their counterparts. Similar to odontoid fractures, this increase occurred by the 3-month time point and subsequently normalized. The female rate, which was 1.34 times that of the uninjured population, was not statistically significant.
Comparison of Odontoid and Subaxial Fracture Patients
The survival of subaxial injuries was not significantly different from that of odontoid fractures (P = .113, Figure 6A). When analyzed by gender and controlled for age, the rates in both male (P = .347, Figure 6B) and female (P = .643, Figure 6C) patients did not differ between fracture types.
Discussion
The US population is aging rapidly, with the demographic older than 65 years predicted to more than double in size between 2010 and 2050.47 As our elderly population grows, the incidence of age-related injuries will rise accordingly. An understanding of mortality risks associated with different fractures will not only assist practitioners in advising patients regarding prognosis but may also lead to improvements in clinical care.19,48-50 While we know cervical spine trauma is associated with significant morbidity,29-31 little is known about associated moderate-term mortality rates that can be compared with other known injury patterns, such as hip fractures or osteoporotic compression fractures.
An interesting finding of the present study is the bimodal age distribution of the 59 odontoid fractures (Figure 2). The 14 patients younger than 50 years included 3 individuals who died, all within days of their presentation from severe multisystem trauma. This is consistent with the determination that high-energy forces are required to fracture the odontoid process in younger individuals.38,45,46,51,52 Given the severity of their nonspinal injuries, the cause of death was likely not primarily related to their odontoid fractures. Also in line with previous studies, the majority (76%) of odontoid fractures were documented in subjects older than 50 years.32,53,54 Within our cohort older than 50 years, the deaths appear to be spread evenly across age groups and do not seem to be skewed by the oldest portion of the population (Figure 2).
Our gender-specific analyses revealed that older men with odontoid injuries exhibited higher mortality compared with an age-matched male cohort, with 6 of the 8 deaths occurring within 3 months. However, after this exaggerated decline in survival, the rate normalized towards general population mortality rates (Figure 3B). As in the younger cohort, these earlier deaths were largely attributable to multisystem trauma, whereas medical comorbidities were implicated in those who died later. In contrast, the Kaplan-Meier curve of older women with odontoid fractures closely approximates that of age-matched women at every time point (Figure 3C), indicating that these injuries do not decrease survival as they do in their male counterparts.
When comparing the survival of older patients with subaxial cervical spine fractures with that of gender- and age-matched controls, the mortality rates of women were, once again, essentially equivalent. However, the survival of older men was significantly compromised by these injuries. In men, 7 of the 9 deaths were within 3 months, with the remaining 2 deaths occurring within 7 months. Nevertheless, beyond this initial period of elevated mortality, the survival curve again stabilized and paralleled that of the general population. As with odontoid fractures, there was no sustained increase in the mortality of male patients who lived at least 3 months after injury.
The mortality rates of odontoid and subaxial fractures were also compared in the older population. When controlled for age, there was no difference in mortality rates between these 2 groups. When individually analyzed in both men and women, the mortality rates of both fracture types matched those of the general population at all time points.
It is useful to contextualize our findings alongside the mortality of older individuals with other fracture types. Based on our results, we believe that the survival curves of geriatric men with odontoid or subaxial cervical spine fractures most closely resemble the characteristic pattern seen in hip fractures. Hip fractures have shown an early spike in mortality by as much as 8% to 49% in the first 6 to 12 months that returns to baseline after 1 year.1-10 This presumably reflects the natural history of these injuries in response to appropriate therapeutic interventions. Interestingly, the male mortality rates for both odontoid and subaxial cervical spine fractures in this study are largely analogous to those reported by various hip fracture surveys.1,5,55-58 In contrast, similar to prior studies of rib or wrist fractures, older women with these cervical spine fractures did not show a survival decrease after their injuries.12,16-18
While the reasons underlying the differential effects of cervical fractures on the mortality of men and women have not been established, one explanation is that the female geriatric population is relatively more osteoporotic; thus, cervical injuries may occur after lower-energy forces, leading to less severe associated trauma that could otherwise decrease survival. Another explanation is that men are more likely to be involved in high-energy accidents,59,60 thus decreasing their overall survival after injury.
This investigation is not without limitations. Our primary concern is the determination of survival. The NDI maintained by the NCHS is an extremely reliable tool regularly employed by epidemiologists to collect mortality data. However, it is possible that deaths may have been missed. We believe this number would be small, because the NDI database provided multiple probable matches that were carefully compared with supplemental personal information. It is also possible that deaths that were not appropriately registered with the NDI are not represented in this series. Another limitation lies in the determination of controls. As with any case–control study, the patients sustaining these odontoid fractures may differ in some significant way from the average population. A final limitation is that a small portion of patients in the study have only 1-year follow-up, because patient data was collected through 2006, although access to NDI data ended in 2007.
Conclusion
Our results indicate that the survival of older men with either odontoid or subaxial cervical spine fractures shares many of the same mortality characteristics as hip fractures, with diminished survival in the first 3 months that normalizes to the survival rate of the age-matched population. Interestingly, and perhaps because of disparate rates of osteoporosis and traumatic forces, the mortality rates in the female cohort were similar to that of the age-matched general population at all time points. These trends were nearly identical for both odontoid and subaxial cervical fractures.
1. Gennarelli TA, Champion HR, Sacco WJ, Copes WS, Alves WM. Mortality of patients with head injury and extracranial injury treated in trauma centers. J Trauma. 1989;29(9):1193-1201; discussion 1201-1202.
2. George GH, Patel S. Secondary prevention of hip fracture. Rheumatology (Oxford). 2000;39(4):346-349.
3. Gerrelts BD, Petersen EU, Mabry J, Petersen SR. Delayed diagnosis of cervical spine injuries. J Trauma. 1991;31(12):1622-1626.
4. Giannoudis PV, Mehta SS, Tsiridis E. Incidence and outcome of whiplash injury after multiple trauma. Spine. 2007;32(7):776-781.
5. Goldberg W, Mueller C, Panacek E, et al. Distribution and patterns of blunt traumatic cervical spine injury. Ann Emerg Med. 2001;38(1):17-21.
6. Grauer JN, Shafi B, Hilibrand AS, et al. Proposal of a modified, treatment-oriented classification of odontoid fractures. Spine J. 2005;5(2):123-129.
7. Greene KA, Dickman CA, Marciano FF, Drabier JB, Hadley MN, Sonntag VK. Acute axis fractures. Analysis of management and outcome in 340 consecutive cases. Spine. 1997;22(16):1843-1852.
8. Gulli B, Templeman D. Compartment syndrome of the lower extremity. Orthop Clin North Am. 1994;25(4):677-684.
9. Guthkelch AN, Fleischer AS. Patterns of cervical spine injury and their associated lesions. West J Med. 1987;147(4):428-431.
10. Hackl W, Hausberger K, Sailer R, Ulmer H, Gassner R. Prevalence of cervical spine injuries in patients with facial trauma. Oral Surg Oral Med Oral Pathol Oral Radiol Endod. 2001;92(4):370-376.
11. Doruk H, Mas MR, Yildiz C, Sonmez A, Kyrdemir V. The effect of the timing of hip fracture surgery on the activity of daily living and mortality in elderly. Arch Gerontol Geriatr. 2004;39(2):179-185.
12. Garabige V, Giraud P, De Rycke Y, et al. [Impact of nutrition management in patients with head and neck cancers treated with irradiation: is the nutritional intervention useful?]. Cancer Radiother. 2007;11(3):111-116.
13. Garbuz DS, Leitch K, Wright JG. The treatment of supracondylar fractures in children with an absent radial pulse. J Pediatr Orthop. 1996;16(5):594-596.
14. Henderson RL, Reid DC, Saboe LA. Multiple noncontiguous spine fractures. Spine. 1991;16(2):128-131.
15. Henrikson B. Supracondylar fracture of the humerus in children. A late review of end-results with special reference to the cause of deformity, disability and complications. Acta Chir Scand Suppl. 1966;369:1-72.
16. De Boeck H, De Smet P, Penders W, De Rydt D. Supracondylar elbow fractures with impaction of the medial condyle in children. J Pediatr Orthop. 1995;15(4):444-448.
17. Gelberman RH, Panagis JS, Taleisnik J, Baumgaertner M. The arterial anatomy of the human carpus. Part I: The extraosseous vascularity. J Hand Surg Am. 1983;8(4):367-375.
18. Hu J, Liao Q, Long W. Diagnosis and treatment of multiple-level noncontiguous spinal fractures. Zhongguo Xiu Fu Chong Jian Wai Ke Za Zhi. 2005;19(6):424-426.
19. Eleraky MA, Theodore N, Adams M, Rekate HL, Sonntag VK. Pediatric cervical spine injuries: report of 102 cases and review of the literature. J Neurosurg. 2000;92(1 suppl):12-17.
20. Ioannidis G, Papaioannou A, Hopman WM, et al. Relation between fractures and mortality: results from the Canadian Multicentre Osteoporosis Study. CMAJ. 2009;181(5):265-271.
21. Husby J, Sorensen KH. Fracture of the odontoid process of the axis. Acta Orthop Scand. 1974;45(2):182-192.
22. Schoenfeld AJ, Bono CM, Reichmann WM, et al. Type II odontoid fractures of the cervical spine: do treatment type and medical comorbidities affect mortality in elderly patients? Spine. 2011;36(11):879-885.
23. Ensrud KE, Thompson DE, Cauley JA, et al. Prevalent vertebral deformities predict mortality and hospitalization in older women with low bone mass. Fracture Intervention Trial Research Group. J Am Geriatr Soc. 2000;48(3):241-249.
24. Fassett DR, Dailey AT, Vaccaro AR. Vertebral artery injuries associated with cervical spine injuries: a review of the literature. J Spinal Disord Tech. 2008;21(4):252-258.
25. Ippolito E, Caterini R, Scola E. Supracondylar fractures of the humerus in children. Analysis at maturity of fifty-three patients treated conservatively. J Bone Joint Surg Am. 1986;68(3):333-344.
26. Spence KF Jr, Decker S, Sell KW. Bursting atlantal fracture associated with rupture of the transverse ligament. J Bone Joint Surg Am. 1970;52(3):543-549.
27. Irwin ZN, Arthur M, Mullins RJ, Hart RA. Variations in injury patterns, treatment, and outcome for spinal fracture and paralysis in adult versus geriatric patients. Spine. 2004;29(7):796-802.
28. Ismail AA, O’Neill TW, Cooper C, et al. Mortality associated with vertebral deformity in men and women: results from the European Prospective Osteoporosis Study (EPOS). Osteoporos Int. 1998;8(3):291-297.
29. Iyengar SR, Hoffinger SA, Townsend DR. Early versus delayed reduction and pinning of type III displaced supracondylar fractures of the humerus in children: a comparative study. J Orthop Trauma. 1999;13(1):51-55.
30. Jackson AP, Haak MH, Khan N, Meyer PR. Cervical spine injuries in the elderly: acute postoperative mortality. Spine. 2005;30(13):1524-1527.
31. Jacobsen SJ, Goldberg J, Miles TP, Brody JA, Stiers W, Rimm AA. Race and sex differences in mortality following fracture of the hip. Am J Public Health. 1992;82(8):1147-1150.
32. Fisher ES, Baron JA, Malenka DJ, et al. Hip fracture incidence and mortality in New England. Epidemiology. 1991;2(2):116-122.
33. Chapman J, Smith JS, Kopjar B, et al. The AOSpine North America Geriatric Odontoid Fracture Mortality Study: a retrospective review of mortality outcomes for operative versus nonoperative treatment of 322 patients with long-term follow-up. Spine. 2013;38:1098-1104.
34. Denault A, Bains I, Moghadam K, Hu RW, Swamy G. Evaluation of mortality following an odontoid fracture in the octogenarian population. J Bone Joint Surg Br. 2011;93(Supp IV):585.
35. Molinari WJ III, Molinari RW, Khera OA, Gruhn WL. Functional outcomes, morbidity, mortality, and fracture healing in 58 consecutive patients with geriatric odontoid fracture treated with cervical collar or posterior fusion. Global Spine J. 2013;3(1):21-32.
36. Hanigan WC, Powell FC, Elwood PW, Henderson JP. Odontoid fractures in elderly patients. J Neurosurg. 1993;78(1):32-35.
37. Korres DS, Boscainos PJ, Papagelopoulos PJ, Psycharis I, Goudelis G, Nikolopoulos K. Multiple level noncontiguous fractures of the spine. Clin Orthop. 2003;411:95-102.
38. Leet AI, Frisancho J, Ebramzadeh E. Delayed treatment of type 3 supracondylar humerus fractures in children. J Pediatr Orthop. 2002;22(2):203-207.
39. Leone A, Cerase A, Colosimo C, Lauro L, Puca A, Marano P. Occipital condylar fractures: a review. Radiology. 2000;216(3):635-644.
40. Lyles KW, Colón-Emeric CS, Magaziner JS, et al; HORIZON Recurrent Fracture Trial. Zoledronic acid and clinical fractures and mortality after hip fracture. N Engl J Med. 2007;357(18):1799-1809.
41. Müller EJ, Wick M, Russe O, Muhr G. Management of odontoid fractures in the elderly. Eur Spine J. 1999;8(5):360-365.
42. Pepin JW, Bourne RB, Hawkins RJ. Odontoid fractures, with special reference to the elderly patient. Clin Orthop. 1985;193:178-183.
43. Ryan MD, Henderson JJ. The epidemiology of fractures and fracture-dislocations of the cervical spine. Injury. 1992;23(1):38-40.
44. Butler JS, Dolan RT, Burbridge M, et al. The long-term functional outcome of type II odontoid fractures managed non-operatively. Eur Spine J. 2010;19(10):1635-1642.
45. Levine AM, Edwards CC. The management of traumatic spondylolisthesis of the axis. J Bone Joint Surg Am. 1985;67(2):217-226.
46. Lowery DW, Wald MM, Browne BJ, Tigges S, Hoffman JR, Mover WR; NEXUS Group. Epidemiology of cervical spine injury victims. Ann Emerg Med. 2001;38(1):12-16.
47. Jacobsen LA, Kent M, Lee M, Mather M. America’s aging population. Popul Bull. 2011;66(1):1-16. http://www.prb.org/pdf11/aging-in-america.pdf. Published February 2011. Accessed April 22, 2015.
48. Holly LT, Kelly DF, Counelis GJ, Blinman T, McArthur DL, Cryer HG. Cervical spine trauma associated with moderate and severe head injury: incidence, risk factors, and injury characteristics. J Neurosurg. 2002;96(3 suppl):285-291.
49. Holmes JF, Akkinepalli R. Computed tomography versus plain radiography to screen for cervical spine injury: a meta-analysis. J Trauma. 2005;58(5):902-905.
50. Hove LM. Epidemiology of scaphoid fractures in Bergen, Norway. Scand J Plast Reconstr Surg Hand Surg. 1999;33(4):423-426.
51. Lu-Yao G, Baron Ja, Barrett Ja, Fisher Es. Treatment and survival among elderly Americans with hip fractures: a population-based study. Am J Public Health. 1994;84(8):1287-1291.
52. Lu-Yao GL, Keller RB, Littenberg B, Wennberg JE. Outcomes after displaced fractures of the femoral neck. A meta-analysis of one hundred and six published reports. J Bone Joint Surg Am. 1994;76(1):15-25.
53. Kado DM, Browner WS, Palermo L, Nevitt MC, Genant HK, Cummings SR. Vertebral fractures and mortality in older women: a prospective study. Study of Osteoporotic Fractures Research Group. Arch Intern Med. 1999;159(11):1215-1220.
54. Levine AM, Edwards CC. Fractures of the atlas. J Bone Joint Surg Am. 1991;73(5):680-691.
55. Maak TG, Grauer JN. The contemporary treatment of odontoid injuries. Spine. 2006;31(11 Suppl):S53-S60; discussion S61.
56. Magaziner J, Fredman L, Hawkes W, et al. Changes in functional status attributable to hip fracture: a comparison of hip fracture patients to community-dwelling aged. Am J Epidemiol. 2003;157(11):1023-1031.
57. Magaziner J, Hawkes W, Hebel JR, et al. Recovery from hip fracture in eight areas of function. J Gerontol A Biol Sci Med Sci. 2000;55(9):M498-M507.
58. Malham GM, Ackland HM, Jones R, Williamson OD, Varma DK. Occipital condyle fractures: incidence and clinical follow-up at a level 1 trauma centre. Emerg Radiol. 2009;16(4):291-297.
59. Probst C, Zelle B, Panzica M, et al. Clinical re-examination 10 or more years after polytrauma: is there a gender related difference? J Trauma. 2010;68(3):706-711.
60. Holbrook TL, Hoyt DB, Anderson JP. The importance of gender on outcome after major trauma: functional and psychologic outcomes in women versus men. J Trauma. 2001;50(2):270-273.
Is Life Expectancy Different for Patients Beginning Osteoporosis Treatment?
A new trial has found that life expectancy of newly diagnosed and treated osteoporosis patients is in excess of 15 years in women younger than 75, and in men younger than 60, according to a study published online ahead of print May 21 in Journal of Bone and Mineral Research.
“How best to treat patients with osteoporosis is a really simple issue when it comes to beginning treatment, but deciding how long to treat for is really very challenging,” said lead author Bo Abrahamsen, MD, PhD, Professor and Consultant Endocrinologist at Glostrup Hospital in Copenhagen.

Researchers conducted an observational study in Danish national registries tracking prescriptions for osteoporosis drugs, comorbid conditions, and deaths. Investigators included 58,637 patients and 225,084 age- and gender-matched control subjects. Information on deaths until the end of 2013 was retrieved, providing a follow-up period of 10 to 17 years.
In men younger than 80 and women younger than 60, the relative risk of dying declined from being strongly increased in the first year to a stable but elevated level in subsequent years. In women older than 65 through 70, there was only a small elevation in risk in the first year of treatment followed by lower than background mortality.
The residual life expectancy of a 50-year-old man beginning osteoporosis treatment was estimated to be 18.2 years; for a 75-year-old man it was 7.5 years. Estimates in women were 26.4 years and 13.5 years for the same age groups, respectively.
According to the researchers, their findings show an excess mortality in men and in women below age 70 who are treated for osteoporosis, compared with the background population. This excess risk, they said, is more pronounced in the first few years on treatment. The average life expectancy of osteoporosis patients is in excess of 15 years in women below the age of 75 and in men below the age of 60, highlighting the importance of developing tools for long-term management.
“The present study shows that most of the patients we treat have a long life expectancy. Therefore it is absolutely vital that we are not complacent but develop evidence-based strategies for the long-term management of osteoporosis,” stated Dr. Abrahamsen.
Suggested Reading
Abrahamsen B, Osmond C, Cooper C. Life expectancy in patients treated for osteoporosis: observational cohort study using national Danish prescription data. J Bone Miner Res. 2015 May 21. [Epub ahead of print]
A new trial has found that life expectancy of newly diagnosed and treated osteoporosis patients is in excess of 15 years in women younger than 75, and in men younger than 60, according to a study published online ahead of print May 21 in Journal of Bone and Mineral Research.
“How best to treat patients with osteoporosis is a really simple issue when it comes to beginning treatment, but deciding how long to treat for is really very challenging,” said lead author Bo Abrahamsen, MD, PhD, Professor and Consultant Endocrinologist at Glostrup Hospital in Copenhagen.
Researchers conducted an observational study in Danish national registries tracking prescriptions for osteoporosis drugs, comorbid conditions, and deaths. Investigators included 58,637 patients and 225,084 age- and gender-matched control subjects. Information on deaths until the end of 2013 was retrieved, providing a follow-up period of 10 to 17 years.
In men younger than 80 and women younger than 60, the relative risk of dying declined from being strongly increased in the first year to a stable but elevated level in subsequent years. In women older than 65 through 70, there was only a small elevation in risk in the first year of treatment followed by lower than background mortality.
The residual life expectancy of a 50-year-old man beginning osteoporosis treatment was estimated to be 18.2 years; for a 75-year-old man it was 7.5 years. Estimates in women were 26.4 years and 13.5 years for the same age groups, respectively.
According to the researchers, their findings show an excess mortality in men and in women below age 70 who are treated for osteoporosis, compared with the background population. This excess risk, they said, is more pronounced in the first few years on treatment. The average life expectancy of osteoporosis patients is in excess of 15 years in women below the age of 75 and in men below the age of 60, highlighting the importance of developing tools for long-term management.
“The present study shows that most of the patients we treat have a long life expectancy. Therefore it is absolutely vital that we are not complacent but develop evidence-based strategies for the long-term management of osteoporosis,” stated Dr. Abrahamsen.
Suggested Reading
Abrahamsen B, Osmond C, Cooper C. Life expectancy in patients treated for osteoporosis: observational cohort study using national Danish prescription data. J Bone Miner Res. 2015 May 21. [Epub ahead of print]
Suggested Reading
Abrahamsen B, Osmond C, Cooper C. Life expectancy in patients treated for osteoporosis: observational cohort study using national Danish prescription data. J Bone Miner Res. 2015 May 21. [Epub ahead of print]

Co-Management Arrangements in Orthopedic Surgery
In the post–Affordable Care Act landscape of American health care, an explosion of alternative payment methods and other creative initiatives has occurred as patients, providers, and payers all seek higher-quality care at lower costs.1 These factors impact every level of the health care system, from large academic medical institutions in major cities to small single hospitals in rural community settings.2 Co-management arrangements are among the many innovative organizational structures that have arisen with the goals of efficiency and quality. For many reasons, a co-management arrangement has specific applicability and appeal in orthopedic surgery, and the popularity of this form of physician–hospital alignment is growing.3
Definition
In health care, and particularly even within orthopedic surgery, the term co-management can have multiple definitions. It can refer to shared responsibility for patient care across service lines—such as the “co-management” by both hospitalists and orthopedic surgeons of elderly patients with multiple chronic medical comorbidities as well as an acute hip fracture or a total knee replacement.4-7 In academic settings, it may refer to the delegation of duties from attending professors to residents in co-managing patients.
In the realm of health care business and finance, however, the term co-management arrangement (CMA) refers to the shared responsibility for a hospital service line by the hospital administration and the physicians involved in that service line. While the basic concept is not necessarily a new one, it is growing in popularity and expanding in scope, creative application, and effectiveness within the current post-reform environment.8 This model of clinical and financial integration has been implemented in multiple different medical subspecialties, from cardiology and oncology to gastroenterology and vision care.9,10 As applied to orthopedic surgery, CMAs create a situation in which orthopedic surgeons participate intimately in the management of the entire musculoskeletal service line, including inpatient and outpatient services. Orthopedics was identified as 1 of the top 3 specialties for clinical CMAs (after cardiology and imaging) in a recent survey of more than 258 hospital executives.11 Because orthopedic surgery represents an extremely profitable service line for most hospitals, it becomes an ideal target for optimization under a CMA because even relatively small percentage increases in efficiency or profitability can pay relatively large dividends for the hospital.12
Under a CMA, the physicians are compensated for their time and efforts, and they provide services across clinical and nonclinical areas. Because orthopedic surgeons are most familiar with the details of their specialty and the unique needs of their patients, they are the best suited to make decisions, both clinical and nonclinical, that impact the provision of that care. The details of individual CMAs will vary based on specific situational factors, but the common goal of improved patient care and greater economic efficiency drive the underlying theme of shared responsibility and physician–hospital alignment.13
A CMA is different from some other recent innovative forms of organizational or financial structure. A CMA is not the same as direct employment14,15 or “pay-for-performance,”16 because both of these methods of physician–hospital alignment lack the incentivized structure of a CMA. While a CMA is similar to a “gainsharing” arrangement because both hospitals and physicians benefit, it has a very different legal structure.17 A CMA also resembles a joint venture, but it differs in its goal of a focus on management roles.18 Bundled-pricing arrangements tend to focus on the end-price of an “episode of care” rather than the system that provides it.19 While CMAs may be more involved than many other forms of organizational structure, a CMA does not have the level of complexity and interaction required for a formal accountable care organization (ACO).20
Principles of Co-Management Arrangements
Because countless variances exist across the country within local and regional orthopedic markets, no single prescription for success exists to guide co-management arrangements for every potential situation.21,22 Several basic principles, however, should characterize any attempted CMA. Without a foundation in these principles, the CMA may risk suboptimal performance or overt failure.
Focus on the Patient
The most basic shared concern of the 2 parties of a CMA (surgeons and hospitals) is the patient. While each side may have different strengths and varying methods of reaching clinical and financial goals, they should be able to agree on the fundamental idea of patient-centered care. Indeed, the patient experience has become a popular buzzword in many areas of medicine,23 and it particularly applies as a foundational principle of CMAs. A focus on the patient does not directly guarantee success, because there are numerous other details and features of a productive CMA. Failure to focus on the patient, however, will lead to problems.
Evidence-Based Decision-Making
As the information age progresses, clinical, operational, and financial decisions are all best made based on data. Over the last 10 years, evidence-based medicine (EBM) has become the norm in orthopedic surgery for the evaluation of techniques, implants, medications, and other treatment options.24 This data-based clinical concept parallels the development of its cousin on the administrative side, evidence-based management.25 Both forms of “EBM” focus on using a synthesis of the best available data to inform decision-making to maximize outcomes. In a CMA, evidence-based decision-making should pervade all aspects of the endeavor.
Physician Leadership
Co-management arrangements cannot succeed with involvement and input exclusively from hospital officials. Physicians must not only participate in these arrangements, but they must take the key leadership roles.26 Physicians can learn relevant skills in business administration much quicker and easier than administrators can gain clinical skill and experience. Therefore, effective CMAs should have appropriately qualified physicians in essential leadership positions whenever possible.27,28
Appropriate Physician Compensation
While physicians may benefit from CMAs in many intangible economic ways, such as increased volume or increased time efficiency, the process of creating and operating a CMA does not inherently generate any revenue for the physicians involved. Indeed, the primary raw materials that an orthopedic surgeon possesses are time and expertise. Investment of an orthopedist’s time and expertise represents utilization of a considerably valuable resource that demands commensurate compensation.29 Hospitals can save exponentially more money through a robust CMA than they might spend for the surgeon’s time and efforts to create it,23 and they should expect returns commensurate with the amount invested.30 Stated simply, the CMA will not work unless physicians are compensated to make it work.
While appropriate compensation for time and effort may seem an obvious and basic element of success for any endeavor, the determination of such compensation for a CMA is fraught with difficulty and danger.3 The primary concern is the calculation of “fair market value” or “commercial reasonableness” of the management services provided by the orthopedic surgeon to the hospital.23,31-33 Any amount perceived as too low may discourage surgeon participation. On the other hand, amounts that exceed fair market value may constitute remuneration that can result in severe federal legal penalties. Any compensation agreement must comply with provisions of the Stark laws and the federal Anti-Kickback Statute, as well as the Civil Monetary Penalties Statute, the more recent Sunshine Act, and other laws.34-37
Consequently, creation of a well-designed compensation plan is thus one of the most critical principles of a CMA.38 Physician compensation for participation in a CMA should focus on 2 major areas—a base payment for time spent in design and management of the arrangement, and a bonus payment for reaching certain predefined quality and efficiency goals through the arrangement.3,22,27,32,34,39 As mentioned above, physicians must, at a minimum, receive fair compensation for their time and efforts. In addition, creation of incentives through a clearly defined, performance-based reward structure can further drive surgeons’ motivation for dedicated effort and creativity.9 It is critical to note that a CMA differs from a gainsharing arrangement because physicians usually do not share a percentage of actual hospital savings under a CMA.31 A gainsharing arrangement, however, usually involves physicians receiving a defined percentage of any real dollar savings created for the hospital through the relationship.17
Transparency
Transparency is a common feature of any business relationship in which 2 distinct entities must work together to achieve a mutual goal. Co-management arrangements are no exception to this rule; multiple experts have identified transparency and trust as foundational elements for success.30,40 To ensure transparency without compromising patient confidentiality, trade secrets, or other valuable restricted information from unnecessary or potentially dangerous exposure, participants in the CMA should develop a transparency plan in the early stages of the relationship. This plan should expressly state exactly what information is to be shared, when, with whom, and in what manner. By balancing information sharing with information security, CMA participants can more comfortably communicate and develop trust.
Reasonable and Modifiable Goals
While the overarching raison d’être of a CMA is to increase efficiency and improve quality, these worthy purposes must be broken down into specific, measurable goals that are unique to each arrangement. These goals should be aggressive enough to make an impact, but they should also be reasonably achievable within a designated period. In many cases, these goals will reflect or follow the regulatory stipulations of various governing bodies, such as the Centers for Medicare and Medicaid Services (CMS) or The Joint Commission.31 Because these entities may frequently change or update their rules (and even their own institutional names!), the CMA must also have a structure that can rapidly respond to alterations in the regulatory landscape.31 The goals should be modifiable and amendable on an as-needed basis with an appropriate vote of the CMA stakeholders, rather than renewable only when the arrangement’s term ends. Without such situational responsiveness, the rapidly undulating world of health care may render the CMA’s goals either laughably low or impossibly high.
Accountability
A CMA must incorporate the concept of accountability throughout its organizational structure. Although this principle will take many different forms and have different applications, it is critical to the effectiveness of a CMA. Traditional hospital management often focuses on financial goals rather than patient-care goals, and physicians must be able to hold management accountable when these goals conflict. A CMA’s legal structure must have elements of accountability and methods of resolving conflict, such as provisions for arbitration or mediation by a designated third party. When goals are not met or if they are exceeded, there must be ways of both disciplining and rewarding those responsible. Ultimately, accountability must be woven into the culture created under the CMA, and this process flows through every element of the agreement, from its contractual legal and leadership structure to its operational and financial logistics.
General Operational Elements of Co-Management Arrangements
While CMAs must be governed by basic principles, they must also involve several general operational elements. The specifics of these elements will vary by situation, but surgeons must consider each in the creation and operation of a CMA.
Legal Structure
Most CMAs involve the creation of a separate legal structural entity that will assume responsibility for management of the hospital’s service line.37,39 This entity often takes the form of a limited liability company (LLC).33 Its members may be all physicians, or it may be jointly owned by the hospital and the physicians.39 The legal structure of the company will depend on state laws and local precedent, and a lawyer with extensive experience in health care law should create it and its governing documents.37 Alternatively, some hospitals may consider directly employing physicians to co-manage a service line, but this simpler model may prove less effective than a true CMA because of the lack of independence for the physicians involved.30,36 Indeed, the maintenance of physician independence is one of the strongest features of a CMA, and it should be carefully protected in the entity’s legal structure.
Like any relationship, a CMA may end, and its creators need to “begin with the end in mind” when creating its formative documents. Physicians should engage expert legal assistance in the structuring of the parts of the contract that govern the unwinding of the agreement. If the CMA performs poorly, or if the hospital becomes insolvent in spite of the CMA, the involved physicians may face liability charges or other legal entanglements. Because the escape clause of the CMA contract may be the doctors’ only shield in such situations, this part of the agreement should be meticulously reviewed by the physicians and by knowledgeable legal counsel.
Legal Compliance
Ultimately, the CMA may implicate federal Stark laws, anti-kickback laws, antitrust laws, Civil Monetary Penalties Statute, the False Claims Act, 501(c)(3) tax exemption rules, and provider-based status rules. These may have severe penalties, including imprisonment, if violated.32,34,36,37 As such, the participants in any arrangement must make certain that the CMA complies with all applicable regulations in both its composition and function.38,41 Participants in CMAs should make all efforts to avoid such legal pitfalls through investigation of safe harbor provisions, special exemptions, and other key features of the relevant laws.37,42 While these regulations will remain in constant flux, governmental regulatory agencies have given guidelines about acceptable structure for CMAs.43,44
For CMAs, a critical feature is the level of participation of the LLC members in the defined activities of the CMA.42 Participation requirements, such as meeting attendance, changes in practice based on defined goals and metrics, and financial contributions, must be included in the operating agreement of the LLC.33 Compliance of all active members with these clearly defined requirements will both improve operations and morale and also decrease legal risk for both the CMA and its individual members.28 Furthermore, certain conduct that may run afoul of regulations should be very specifically prohibited in the member contracts. Such behavior may include pay-for-referral arrangements rather than pay-for-performance, asymmetric income distribution through the LLC, and other activities that limit patient choice.37 The salary and bonus structure must be very carefully designed and monitored, because they can have significant legal implications if not managed correctly. Independent audits should be part of the compliance plan for any CMA, and many authorities recommend limits on the total compensation to physicians as part of a CMA, as well as time limits on the agreement itself.44
Leadership and Reporting Structure
All CMAs should have a medical director who is responsible for the success of the operation. Beneath the medical director, the leadership and reporting structure will vary based on the size of the hospital and the number of surgeons. In some situations, single individuals may assume multiple roles; other situations may dictate the need for many more people. The structure may take the shape of multiple directors and even a committee for the principal areas in a large institution, but only 1 or 2 additional individuals may be required in a small hospital setting. In any case, the leadership and reporting structure should be established as part of the basic formative documents of the CMA, with all duties and responsibilities of each participant clearly defined.
Facilities Management
Management of the physical and operational aspects of the site of service is a core component of any CMA. While the hospital usually owns the facilities, it is the surgeons who must work within them. The specifics of the physical plant can impact issues such as infection rate, inventory availability, maximum volume levels, and patient perception or satisfaction. The manner in which the facilities management conducts operations is also important; large size and nice equipment do not necessarily translate into efficiency or quality. A CMA should, therefore, have a surgeon or committee whose primary role is to oversee the relevant details of the hospital’s physical and operational issues. These details will include topics such as assignment of operative suites, choices of implants, room turnover, supplies, antibiotic availability, and other matters. Because of their experience and knowledge of the operational effects of administrative decisions, orthopedic surgeons are uniquely positioned to maximize the value of existing facilities and to oversee updates or changes as needed.
Personnel Management
Even in disadvantaged or smaller facilities, maximization of human resources can often overcome challenges of inadequate physical plant or tight finances. Alternatively, poor management of staff can thwart the efforts of even the largest and best-endowed hospitals. Because practicing orthopedists are likely to know the talents and skills of key local personnel from having worked alongside them, surgeons are well suited to help direct placement and management of personnel as part of a CMA. Surgeons can effectively identify behaviors that deserve reward and can identify staff members that refuse to be team players or otherwise do not help meet larger goals. Involvement of surgeons in personnel management also helps speed the ability to have near real-time responsiveness to issues that may arise.
Clinical Data Management
Ultimately, quality metrics become the grading scale for the clinical aspects of the CMA. Selection of appropriate metrics constitutes a foundational element of the overall process and demands meticulous attention to detail.38 Multiple site-specific clinical scoring systems exist in orthopedic surgery, from the International Knee Documentation Committee (IKDC) score for knees to the American Shoulder and Elbow Surgeons (ASES) score for shoulders.45,46 Additional quality metrics exist for more generalized clinical success measurement, such as the Short Form–36 Health Survey (SF-36) score.47 Governmental agencies and other national organizations have also mandated certain clinical metrics through programs such as the Surgical Care Improvement Project (SCIP).48 Once the type and manner of desired clinical data are identified, they must be collected, processed, stored, and evaluated. Surgeon participation in and oversight of clinical data management is crucial, because orthopedists will be the best suited to interpret and apply the data and relevant trends and conclusions.
Financial Data Management
Financial concerns constitute perhaps the strongest driving force behind many of the current reform initiatives and alternative payment options in the health care landscape. For a CMA, financial success must be clearly and constantly measured and displayed for the endeavor to be successful. Since both sides have a large potential for financial gain and loss in a CMA, surgeons and hospitals must ensure that the best-qualified and most dedicated individuals oversee financial issues. Although transparency is important in all areas of a CMA, it is imperative and must be a dominating feature of the arrangement’s financial management. Financial goals, furthermore, must be clearly defined and realistic, with continuous reevaluation as the relationship moves forward. As part of the transparency plan, relevant financial data should be shared and discussed at regular intervals.
Quality and Effectiveness Reporting
An ideal co-management agreement not only reaches its goals of improved patient care and increased financial efficiency, but it can document and report achievement of these goals as well. Just as corporations must report their financial effectiveness to their shareholders, CMAs must report their own overall effectiveness to their respective stakeholders. Payers, patients, providers, and participant hospitals all have a stake in proving that the CMA has been successful—and that it will continue to be successful. Effectiveness reporting becomes the most important element of all, because the ultimate purpose is self-preservation of the CMA. Reporting should document successes and failures in all relevant elements of the arrangement, with a focus on clinical and financial data. Reports should employ both internal and external benchmarks as a means of evaluating results. Most CMAs will have a designated officer or committee tasked with the responsibility for measurement and reporting of quality and effectiveness.26 Clinical and financial data are combined into an overall big picture of the achievements of the CMA.
Conclusion
Co-management arrangements represent a popular current option for physicians and surgeons to increase alignment and achieve the mutually beneficial goals of increased quality and efficiency. In orthopedics, CMAs essentially consist of surgeons and hospital administrators working together to manage the musculoskeletal service line at a hospital. While the details of specific arrangements will vary according to individual situations, certain basic principles and important general operational elements characterize most successful CMAs. Since physician ownership of hospitals is now banned under the Affordable Care Act, CMAs can be seen as a physician-managed hospital within a hospital, with many of the benefits that have historically resulted from physician ownership and participation in management.27,49 As health care reform progresses, CMAs will likely become more widespread, more refined, more effective, and more profitable.
1. Payton B. Physician-hospital relationships: from historical failures to successful “new kids on the block.” J Med Pract Manage. 2012;27(6):359-364.
2. Kauk JR, Bray TJ. Orthopaedist-hospital alignment in a community setting. Clin Orthop. 2013;471(6):1837-1845.
3. Kaufman N. The co-management conundrum. Hosp Health Netw Daily. http://www.hhnmag.com/display/HHN-news-article.dhtml?dcrPath=/templatedata/HF_Common/NewsArticle/data/HHN/Daily/2012/Sep/kaufman092612-3960003111. Published September 26, 2012. Accessed April 22, 2015.
4. The Society of Hospital Medicine’s Co-Management Advisory Panel. A white paper on a guide to hospitalist/orthopedic surgery co-management. www.hospitalmedicine.org/AM/Template.cfm?Section=White_Papers&Template=/CM/ContentDisplay.cfm&ContentID=25864. Accessed April 22, 2015.
5. Bushnell BD, Horton JK, McDonald MF, Robertson PG. Perioperative medical comorbidities in the orthopaedic patient. J Am Acad Orthop Surg. 2008;16(4):216-227.
6. Huddleston JM, Long KH, Naessens JM, et al. Medical and surgical comanagement after elective hip and knee arthroplasty: a randomized, controlled trial. Ann Intern Med. 2004;141(1):26-38.
7. Friedman SM, Mendelson DA, Kates SL, McCann RM. Geriatric co-management of proximal femur fractures: total quality management and protocol-driven care result in better outcomes for a frail patient population. J Am Geriatrics Soc. 2008;56(7):1349-1356.
8. Steckler D, Epstein F, Riner RN. Getting ready for EHR, RHIOs and next-generation co-management agreements. Physician Exec. 2009;35(6):48, 50-42.
9. Danello PF. Clinical co-management: hospitals and oncologists working together. J Oncol Pract. 2006;2(1):21.
10. Schryer CF, Gladkova O, Spafford MM, Lingard L. Co-management in healthcare: negotiating professional boundaries. Discourse Commun. 2007;1(4):452-479.
11. Cantlupe J. Physican alignment in an era of change. HealthLeaders Media: Intell Reps. content.hcpro.com/pdf/content/256536.pdf. Published September 2010. Accessed April 22, 2015.
12. Olson SA, Mather RC 3rd. Understanding how orthopaedic surgery practices generate value for healthcare systems. Clin Orthop. 2013;471(6):1801-1808.
13. Page AE, Butler CA, Bozic KJ. Factors driving physician-hospital alignment in orthopaedic surgery. Clin Orthop. 2013;471(6):1809-1817.
14. Jackson DW. Understand the trend, considerations for hospital-based employment. Orthop Today. http://www.healio.com/orthopedics/business-of-orthopedics/news/print/orthopedics-today/%7Bf955b32f-9209-4f66-91f7-b26eb00d3cfa%7D/understand-the-trend-considerations-for-hospital-based-employment. Published March 2013. Accessed April 22, 2015.
15. Porucznik MA. What is the future of orthopaedics? AAOS Now. 2013;7(1). http://www.aaos.org/news/aaosnow/jan13/advocacy9.asp. Accssed April 22, 2015.
16. Marcus RE, Zenty TF 3rd, Adelman HG. Aligning incentives in orthopaedics: opportunities and challenges - the Case Medical Center experience. Clin Orthop. 2009;467(10):2525-2534.
17. Roche J. AAOS takes stance on bundled payments and gainsharing. AAOS Now. 2009;3(5). http://www.aaos.org/news/aaosnow/may09/reimbursement3.asp. Accessed April 28, 2015.
18. Grogan TJ. Tips for marketing your orthopedic practice. AAOS Now. 2007;1(8). http://www.aaos.org/news/bulletin/oct07/managing7.asp. Accessed April 28, 2015.
19. Bushnell BD. Developing a bundled pricing strategy. AAOS Now. 2014;8(3):16-17. http://www.aaos.org/news/aaosnow/mar14/advocacy1.asp. Accessed April 21, 2015.
20. Accountable care organizations (ACO). Centers for Medicare and Medicaid Services website. http://www.cms.gov/Medicare/Medicare-Fee-for-Service-Payment/ACO/index.html?redirect=/aco. Updated January 6, 2015. Accessed April 22, 2015.
21. Sowers KW, Newman PR, Langdon JC. Evolution of physician-hospital alignment models: a case study of comanagement. Clin Orthop. 2013;471(6):1818-1823.
22. Leahy M. Is a clinical comanagement agreement right for your practice? AAOS Now. 2013;7(7). http://www.aaos.org/news/aaosnow/jul13/managing6.asp. Accessed April 22, 2015.
23. Nahm S. Top 10 features and benefits of co-management arrangements. The Camden Group website. http://www.thecamdengroup.com/thought-leadership/top-ten/top-10-features-and-benefits-of-co-management-arrangements. Published May 2010. Accessed April 22, 2015.
24. Spindler KP, Kuhn JE, Dunn W, Matthews CE, Harrell FE Jr, Dittus RS. Reading and reviewing the orthopaedic literature: a systematic, evidence-based medicine approach. J Am Acad Orthop Surg. 2005;13(4):220-229.
25. Pfeffer J, Sutton RI. Evidence-based management. Harvard Business Rev website. https://hbr.org/2006/01/evidence-based-management/ar/1. Published January 2006. Accessed April 22, 2015.
26. Erickson JC III. What in the world is medical “co-management”? Physicians Pract. http://www.physicianspractice.com/blog/what-world-medical-%E2%80%98co-management%E2%80%99. Published October 14, 2011. Accessed April 22, 2015.
27. Steinmann J. Hospital co-management agreements and surgeon owned distribution: the two most important new models for the private practice orthopedic group. Talk presented at: California Orthopaedic Association Annual Meeting; May 20, 2011; Dana Point, CA. http://www.coa.org/docs/2011-Annual-Meeting/Friday/Steinmann.pdf. Accessed April 22, 2015.
28. Nagele RL. Hospital-physician relationships after national health reform: moving from competition to collaboration. Pa Bar Assoc Q. 2011;82(1):1-15. http://www.postschell.com/site/files/556.pdf. Accessed April 22, 2015.
29. Dyrda L. 5 Benefits and challenges of co-management agreements for orthopedic surgeons. Becker’s Spine Rev. http://www.beckersspine.com/orthopedic-spine-practices-improving-profits/item/2294-5-benefits-and-challenges-of-co-management-agreements-for-orthopedic-surgeons. Published October 21, 2010. Updated November 8, 2010. Accessed April 22, 2015.
30. Aston G. Are you ready for physician co-management? Association for Healthcare Resource & Materials Management website. http://www.ahrmm.org/ahrmm/news_and_issues/strategies_solutions_homepage/nov12_physician_comanagement.jsp. Accessed April 22, 2015.
31. Top 10 lessons learned from “mature” co-management arrangements. The Camden Group website. http://www.thecamdengroup.com/thought-leadership/blog/top-10-lessons-learned-from-mature-co-management-arrangements/. Accessed April 22, 2015.
32. Anderson GD, Brandt AS. Co-management arrangements and their continuing evolution. HealthCare Appraisers, Inc., website. http://www.healthcareappraisers.com/presentations/BVR_Webinar_Co-mgmt_AB_0611.pdf. Published 2011. Accessed April 22, 2015.
33. Colyvas N. Establishing a service line co-management agreement. AAOS Now. March 2013;7(3). http://www.aaos.org/news/aaosnow/mar13/managing1.asp. Accessed April 22, 2015.
34. Safriet SM, Werling K. The evolution of service line co-management relationships with physicians - Key observations on relationships and fair market value. Health Care Appraisers, Inc., website. http://www.healthcareappraisers.com/presentations/HAI-MGW_Co-Management_Presentation.pdf. Published 2014. Accessed April 22, 2015.
35. Bilazarian S. Sunshine act: the intersection of federal law, physicians, and corporate attorneys. Practitioner’s Corner with Dr. Seth Bilazarian. Medscape website. www.medscape.com/viewarticle/821855. Published March 24, 2014. Accessed April 22, 2015.
36. Del Negro PH. Service line co-management arrangements: models and practicalities. ABA Health eSource. 2012;9(2). http://www.americanbar.org/content/newsletter/publications/aba_health_esource_home/aba_health_law_esource_1012_delnegro.html. Published October 2012. Accessed April 22, 2015.
37. Blau ML, Romano DH, Safriet SM. Co-management arrangements in healthcare: complying with regulatory requirements in structuring hospital-physician arrangements. Health Care Appraisers, Inc., website. http://www.healthcareappraisers.com/presentations/Co-Mgmt_Arrangements_Webinar_12-1-09.pdf. Published 2009. Accessed April 22, 2015.
38. Johnson J. 5 things you should know about co-management arrangements. Healthcare Financial Manage. 2011;65(7):74-78, 80.
39. Mertz G. Co-management models can be profitable for physicians. Physicians Pract. http://www.physicianspractice.com/blog/co-management-models-can-be-profitable-physicians. Published May 5, 2013. Accessed April 22, 2015.
40. Gamble M. Co-management agreements 101: basic principles to know. Becker’s Hosp Rev. http://www.beckershospitalreview.com/hospital-transactions-and-valuation/co-management-agreements-101-basic-principles-to-know.html. Published November 28, 2011. Accessed April 22, 2015.
41. Werling K, Carnell H, Szabad M. Regulatory considerations for structuring physician/hospital co-management agreements. Health Care Law Mon. 2010;2010(9):2-6.
42. Punke H. Hospital-physician co-management agreements: how to avoid a major pitfall. Becker’s Hosp Rev. http://www.beckershospitalreview.com/hospital-physician-relationships/hospital-physician-co-management-agreements-how-to-avoid-a-major-pitfall.html. Published November 1, 2013. Accessed April 22, 2015.
43. Burack MR. OIG approves co-management arrangement. Akerman Health Law Rx website. http://www.healthlawrx.com/2013/02/oig-approves-co-management-arrangement-2/. Published February 1, 2013. Accessed April 22, 2015.
44. Greaves C. Five common sense strategies for structuring co-management agreements after advisory opinion 12-22. ABA Health eSource. 2013;9(7). http://www.americanbar.org/content/newsletter/publications/aba_health_esource_home/aba_health_law_esource_1303_greaves.html. Published March 2013. Accessed April 22, 2015.
45. Hefti F, Müller W, Jakob RP, Stäubli HU. Evaluation of knee ligament injuries with the IKDC form. Knee Surg Sports Traumatol Arthrosc. 1993;1(3-4):226-234.
46. Richards RR, An KN, Bigliani LU, et al. A standardized method for the assessment of shoulder function. J Shoulder Elbow Surg. 1994;3(6):347-352.
47. Patel AA, Donegan D, Albert T. The 36-item short form. J Am Acad Orthop Surg. 2007;15(2):126-134.
48. Surgical Care Improvement Project. The Joint Commission website. http://www.jointcommission.org/surgical_care_improvement_project/. Published October 16, 2014. Accessed April 22, 2015.
49. Pennington WT. Emulating a physician-owned hospital. Hosp Health Netw Daily. http://www.hhnmag.com/display/HHN-news-article.dhtml?dcrPath=/templatedata/HF_Common/NewsArticle/data/HHN/Daily/2013/Jul/blog072513-5840005536. Published July 25, 2013. Accessed April 22, 2015.
In the post–Affordable Care Act landscape of American health care, an explosion of alternative payment methods and other creative initiatives has occurred as patients, providers, and payers all seek higher-quality care at lower costs.1 These factors impact every level of the health care system, from large academic medical institutions in major cities to small single hospitals in rural community settings.2 Co-management arrangements are among the many innovative organizational structures that have arisen with the goals of efficiency and quality. For many reasons, a co-management arrangement has specific applicability and appeal in orthopedic surgery, and the popularity of this form of physician–hospital alignment is growing.3
Definition
In health care, and particularly even within orthopedic surgery, the term co-management can have multiple definitions. It can refer to shared responsibility for patient care across service lines—such as the “co-management” by both hospitalists and orthopedic surgeons of elderly patients with multiple chronic medical comorbidities as well as an acute hip fracture or a total knee replacement.4-7 In academic settings, it may refer to the delegation of duties from attending professors to residents in co-managing patients.
In the realm of health care business and finance, however, the term co-management arrangement (CMA) refers to the shared responsibility for a hospital service line by the hospital administration and the physicians involved in that service line. While the basic concept is not necessarily a new one, it is growing in popularity and expanding in scope, creative application, and effectiveness within the current post-reform environment.8 This model of clinical and financial integration has been implemented in multiple different medical subspecialties, from cardiology and oncology to gastroenterology and vision care.9,10 As applied to orthopedic surgery, CMAs create a situation in which orthopedic surgeons participate intimately in the management of the entire musculoskeletal service line, including inpatient and outpatient services. Orthopedics was identified as 1 of the top 3 specialties for clinical CMAs (after cardiology and imaging) in a recent survey of more than 258 hospital executives.11 Because orthopedic surgery represents an extremely profitable service line for most hospitals, it becomes an ideal target for optimization under a CMA because even relatively small percentage increases in efficiency or profitability can pay relatively large dividends for the hospital.12
Under a CMA, the physicians are compensated for their time and efforts, and they provide services across clinical and nonclinical areas. Because orthopedic surgeons are most familiar with the details of their specialty and the unique needs of their patients, they are the best suited to make decisions, both clinical and nonclinical, that impact the provision of that care. The details of individual CMAs will vary based on specific situational factors, but the common goal of improved patient care and greater economic efficiency drive the underlying theme of shared responsibility and physician–hospital alignment.13
A CMA is different from some other recent innovative forms of organizational or financial structure. A CMA is not the same as direct employment14,15 or “pay-for-performance,”16 because both of these methods of physician–hospital alignment lack the incentivized structure of a CMA. While a CMA is similar to a “gainsharing” arrangement because both hospitals and physicians benefit, it has a very different legal structure.17 A CMA also resembles a joint venture, but it differs in its goal of a focus on management roles.18 Bundled-pricing arrangements tend to focus on the end-price of an “episode of care” rather than the system that provides it.19 While CMAs may be more involved than many other forms of organizational structure, a CMA does not have the level of complexity and interaction required for a formal accountable care organization (ACO).20
Principles of Co-Management Arrangements
Because countless variances exist across the country within local and regional orthopedic markets, no single prescription for success exists to guide co-management arrangements for every potential situation.21,22 Several basic principles, however, should characterize any attempted CMA. Without a foundation in these principles, the CMA may risk suboptimal performance or overt failure.
Focus on the Patient
The most basic shared concern of the 2 parties of a CMA (surgeons and hospitals) is the patient. While each side may have different strengths and varying methods of reaching clinical and financial goals, they should be able to agree on the fundamental idea of patient-centered care. Indeed, the patient experience has become a popular buzzword in many areas of medicine,23 and it particularly applies as a foundational principle of CMAs. A focus on the patient does not directly guarantee success, because there are numerous other details and features of a productive CMA. Failure to focus on the patient, however, will lead to problems.
Evidence-Based Decision-Making
As the information age progresses, clinical, operational, and financial decisions are all best made based on data. Over the last 10 years, evidence-based medicine (EBM) has become the norm in orthopedic surgery for the evaluation of techniques, implants, medications, and other treatment options.24 This data-based clinical concept parallels the development of its cousin on the administrative side, evidence-based management.25 Both forms of “EBM” focus on using a synthesis of the best available data to inform decision-making to maximize outcomes. In a CMA, evidence-based decision-making should pervade all aspects of the endeavor.
Physician Leadership
Co-management arrangements cannot succeed with involvement and input exclusively from hospital officials. Physicians must not only participate in these arrangements, but they must take the key leadership roles.26 Physicians can learn relevant skills in business administration much quicker and easier than administrators can gain clinical skill and experience. Therefore, effective CMAs should have appropriately qualified physicians in essential leadership positions whenever possible.27,28
Appropriate Physician Compensation
While physicians may benefit from CMAs in many intangible economic ways, such as increased volume or increased time efficiency, the process of creating and operating a CMA does not inherently generate any revenue for the physicians involved. Indeed, the primary raw materials that an orthopedic surgeon possesses are time and expertise. Investment of an orthopedist’s time and expertise represents utilization of a considerably valuable resource that demands commensurate compensation.29 Hospitals can save exponentially more money through a robust CMA than they might spend for the surgeon’s time and efforts to create it,23 and they should expect returns commensurate with the amount invested.30 Stated simply, the CMA will not work unless physicians are compensated to make it work.
While appropriate compensation for time and effort may seem an obvious and basic element of success for any endeavor, the determination of such compensation for a CMA is fraught with difficulty and danger.3 The primary concern is the calculation of “fair market value” or “commercial reasonableness” of the management services provided by the orthopedic surgeon to the hospital.23,31-33 Any amount perceived as too low may discourage surgeon participation. On the other hand, amounts that exceed fair market value may constitute remuneration that can result in severe federal legal penalties. Any compensation agreement must comply with provisions of the Stark laws and the federal Anti-Kickback Statute, as well as the Civil Monetary Penalties Statute, the more recent Sunshine Act, and other laws.34-37
Consequently, creation of a well-designed compensation plan is thus one of the most critical principles of a CMA.38 Physician compensation for participation in a CMA should focus on 2 major areas—a base payment for time spent in design and management of the arrangement, and a bonus payment for reaching certain predefined quality and efficiency goals through the arrangement.3,22,27,32,34,39 As mentioned above, physicians must, at a minimum, receive fair compensation for their time and efforts. In addition, creation of incentives through a clearly defined, performance-based reward structure can further drive surgeons’ motivation for dedicated effort and creativity.9 It is critical to note that a CMA differs from a gainsharing arrangement because physicians usually do not share a percentage of actual hospital savings under a CMA.31 A gainsharing arrangement, however, usually involves physicians receiving a defined percentage of any real dollar savings created for the hospital through the relationship.17
Transparency
Transparency is a common feature of any business relationship in which 2 distinct entities must work together to achieve a mutual goal. Co-management arrangements are no exception to this rule; multiple experts have identified transparency and trust as foundational elements for success.30,40 To ensure transparency without compromising patient confidentiality, trade secrets, or other valuable restricted information from unnecessary or potentially dangerous exposure, participants in the CMA should develop a transparency plan in the early stages of the relationship. This plan should expressly state exactly what information is to be shared, when, with whom, and in what manner. By balancing information sharing with information security, CMA participants can more comfortably communicate and develop trust.
Reasonable and Modifiable Goals
While the overarching raison d’être of a CMA is to increase efficiency and improve quality, these worthy purposes must be broken down into specific, measurable goals that are unique to each arrangement. These goals should be aggressive enough to make an impact, but they should also be reasonably achievable within a designated period. In many cases, these goals will reflect or follow the regulatory stipulations of various governing bodies, such as the Centers for Medicare and Medicaid Services (CMS) or The Joint Commission.31 Because these entities may frequently change or update their rules (and even their own institutional names!), the CMA must also have a structure that can rapidly respond to alterations in the regulatory landscape.31 The goals should be modifiable and amendable on an as-needed basis with an appropriate vote of the CMA stakeholders, rather than renewable only when the arrangement’s term ends. Without such situational responsiveness, the rapidly undulating world of health care may render the CMA’s goals either laughably low or impossibly high.
Accountability
A CMA must incorporate the concept of accountability throughout its organizational structure. Although this principle will take many different forms and have different applications, it is critical to the effectiveness of a CMA. Traditional hospital management often focuses on financial goals rather than patient-care goals, and physicians must be able to hold management accountable when these goals conflict. A CMA’s legal structure must have elements of accountability and methods of resolving conflict, such as provisions for arbitration or mediation by a designated third party. When goals are not met or if they are exceeded, there must be ways of both disciplining and rewarding those responsible. Ultimately, accountability must be woven into the culture created under the CMA, and this process flows through every element of the agreement, from its contractual legal and leadership structure to its operational and financial logistics.
General Operational Elements of Co-Management Arrangements
While CMAs must be governed by basic principles, they must also involve several general operational elements. The specifics of these elements will vary by situation, but surgeons must consider each in the creation and operation of a CMA.
Legal Structure
Most CMAs involve the creation of a separate legal structural entity that will assume responsibility for management of the hospital’s service line.37,39 This entity often takes the form of a limited liability company (LLC).33 Its members may be all physicians, or it may be jointly owned by the hospital and the physicians.39 The legal structure of the company will depend on state laws and local precedent, and a lawyer with extensive experience in health care law should create it and its governing documents.37 Alternatively, some hospitals may consider directly employing physicians to co-manage a service line, but this simpler model may prove less effective than a true CMA because of the lack of independence for the physicians involved.30,36 Indeed, the maintenance of physician independence is one of the strongest features of a CMA, and it should be carefully protected in the entity’s legal structure.
Like any relationship, a CMA may end, and its creators need to “begin with the end in mind” when creating its formative documents. Physicians should engage expert legal assistance in the structuring of the parts of the contract that govern the unwinding of the agreement. If the CMA performs poorly, or if the hospital becomes insolvent in spite of the CMA, the involved physicians may face liability charges or other legal entanglements. Because the escape clause of the CMA contract may be the doctors’ only shield in such situations, this part of the agreement should be meticulously reviewed by the physicians and by knowledgeable legal counsel.
Legal Compliance
Ultimately, the CMA may implicate federal Stark laws, anti-kickback laws, antitrust laws, Civil Monetary Penalties Statute, the False Claims Act, 501(c)(3) tax exemption rules, and provider-based status rules. These may have severe penalties, including imprisonment, if violated.32,34,36,37 As such, the participants in any arrangement must make certain that the CMA complies with all applicable regulations in both its composition and function.38,41 Participants in CMAs should make all efforts to avoid such legal pitfalls through investigation of safe harbor provisions, special exemptions, and other key features of the relevant laws.37,42 While these regulations will remain in constant flux, governmental regulatory agencies have given guidelines about acceptable structure for CMAs.43,44
For CMAs, a critical feature is the level of participation of the LLC members in the defined activities of the CMA.42 Participation requirements, such as meeting attendance, changes in practice based on defined goals and metrics, and financial contributions, must be included in the operating agreement of the LLC.33 Compliance of all active members with these clearly defined requirements will both improve operations and morale and also decrease legal risk for both the CMA and its individual members.28 Furthermore, certain conduct that may run afoul of regulations should be very specifically prohibited in the member contracts. Such behavior may include pay-for-referral arrangements rather than pay-for-performance, asymmetric income distribution through the LLC, and other activities that limit patient choice.37 The salary and bonus structure must be very carefully designed and monitored, because they can have significant legal implications if not managed correctly. Independent audits should be part of the compliance plan for any CMA, and many authorities recommend limits on the total compensation to physicians as part of a CMA, as well as time limits on the agreement itself.44
Leadership and Reporting Structure
All CMAs should have a medical director who is responsible for the success of the operation. Beneath the medical director, the leadership and reporting structure will vary based on the size of the hospital and the number of surgeons. In some situations, single individuals may assume multiple roles; other situations may dictate the need for many more people. The structure may take the shape of multiple directors and even a committee for the principal areas in a large institution, but only 1 or 2 additional individuals may be required in a small hospital setting. In any case, the leadership and reporting structure should be established as part of the basic formative documents of the CMA, with all duties and responsibilities of each participant clearly defined.
Facilities Management
Management of the physical and operational aspects of the site of service is a core component of any CMA. While the hospital usually owns the facilities, it is the surgeons who must work within them. The specifics of the physical plant can impact issues such as infection rate, inventory availability, maximum volume levels, and patient perception or satisfaction. The manner in which the facilities management conducts operations is also important; large size and nice equipment do not necessarily translate into efficiency or quality. A CMA should, therefore, have a surgeon or committee whose primary role is to oversee the relevant details of the hospital’s physical and operational issues. These details will include topics such as assignment of operative suites, choices of implants, room turnover, supplies, antibiotic availability, and other matters. Because of their experience and knowledge of the operational effects of administrative decisions, orthopedic surgeons are uniquely positioned to maximize the value of existing facilities and to oversee updates or changes as needed.
Personnel Management
Even in disadvantaged or smaller facilities, maximization of human resources can often overcome challenges of inadequate physical plant or tight finances. Alternatively, poor management of staff can thwart the efforts of even the largest and best-endowed hospitals. Because practicing orthopedists are likely to know the talents and skills of key local personnel from having worked alongside them, surgeons are well suited to help direct placement and management of personnel as part of a CMA. Surgeons can effectively identify behaviors that deserve reward and can identify staff members that refuse to be team players or otherwise do not help meet larger goals. Involvement of surgeons in personnel management also helps speed the ability to have near real-time responsiveness to issues that may arise.
Clinical Data Management
Ultimately, quality metrics become the grading scale for the clinical aspects of the CMA. Selection of appropriate metrics constitutes a foundational element of the overall process and demands meticulous attention to detail.38 Multiple site-specific clinical scoring systems exist in orthopedic surgery, from the International Knee Documentation Committee (IKDC) score for knees to the American Shoulder and Elbow Surgeons (ASES) score for shoulders.45,46 Additional quality metrics exist for more generalized clinical success measurement, such as the Short Form–36 Health Survey (SF-36) score.47 Governmental agencies and other national organizations have also mandated certain clinical metrics through programs such as the Surgical Care Improvement Project (SCIP).48 Once the type and manner of desired clinical data are identified, they must be collected, processed, stored, and evaluated. Surgeon participation in and oversight of clinical data management is crucial, because orthopedists will be the best suited to interpret and apply the data and relevant trends and conclusions.
Financial Data Management
Financial concerns constitute perhaps the strongest driving force behind many of the current reform initiatives and alternative payment options in the health care landscape. For a CMA, financial success must be clearly and constantly measured and displayed for the endeavor to be successful. Since both sides have a large potential for financial gain and loss in a CMA, surgeons and hospitals must ensure that the best-qualified and most dedicated individuals oversee financial issues. Although transparency is important in all areas of a CMA, it is imperative and must be a dominating feature of the arrangement’s financial management. Financial goals, furthermore, must be clearly defined and realistic, with continuous reevaluation as the relationship moves forward. As part of the transparency plan, relevant financial data should be shared and discussed at regular intervals.
Quality and Effectiveness Reporting
An ideal co-management agreement not only reaches its goals of improved patient care and increased financial efficiency, but it can document and report achievement of these goals as well. Just as corporations must report their financial effectiveness to their shareholders, CMAs must report their own overall effectiveness to their respective stakeholders. Payers, patients, providers, and participant hospitals all have a stake in proving that the CMA has been successful—and that it will continue to be successful. Effectiveness reporting becomes the most important element of all, because the ultimate purpose is self-preservation of the CMA. Reporting should document successes and failures in all relevant elements of the arrangement, with a focus on clinical and financial data. Reports should employ both internal and external benchmarks as a means of evaluating results. Most CMAs will have a designated officer or committee tasked with the responsibility for measurement and reporting of quality and effectiveness.26 Clinical and financial data are combined into an overall big picture of the achievements of the CMA.
Conclusion
Co-management arrangements represent a popular current option for physicians and surgeons to increase alignment and achieve the mutually beneficial goals of increased quality and efficiency. In orthopedics, CMAs essentially consist of surgeons and hospital administrators working together to manage the musculoskeletal service line at a hospital. While the details of specific arrangements will vary according to individual situations, certain basic principles and important general operational elements characterize most successful CMAs. Since physician ownership of hospitals is now banned under the Affordable Care Act, CMAs can be seen as a physician-managed hospital within a hospital, with many of the benefits that have historically resulted from physician ownership and participation in management.27,49 As health care reform progresses, CMAs will likely become more widespread, more refined, more effective, and more profitable.
1. Payton B. Physician-hospital relationships: from historical failures to successful “new kids on the block.” J Med Pract Manage. 2012;27(6):359-364.
2. Kauk JR, Bray TJ. Orthopaedist-hospital alignment in a community setting. Clin Orthop. 2013;471(6):1837-1845.
3. Kaufman N. The co-management conundrum. Hosp Health Netw Daily. http://www.hhnmag.com/display/HHN-news-article.dhtml?dcrPath=/templatedata/HF_Common/NewsArticle/data/HHN/Daily/2012/Sep/kaufman092612-3960003111. Published September 26, 2012. Accessed April 22, 2015.
4. The Society of Hospital Medicine’s Co-Management Advisory Panel. A white paper on a guide to hospitalist/orthopedic surgery co-management. www.hospitalmedicine.org/AM/Template.cfm?Section=White_Papers&Template=/CM/ContentDisplay.cfm&ContentID=25864. Accessed April 22, 2015.
5. Bushnell BD, Horton JK, McDonald MF, Robertson PG. Perioperative medical comorbidities in the orthopaedic patient. J Am Acad Orthop Surg. 2008;16(4):216-227.
6. Huddleston JM, Long KH, Naessens JM, et al. Medical and surgical comanagement after elective hip and knee arthroplasty: a randomized, controlled trial. Ann Intern Med. 2004;141(1):26-38.
7. Friedman SM, Mendelson DA, Kates SL, McCann RM. Geriatric co-management of proximal femur fractures: total quality management and protocol-driven care result in better outcomes for a frail patient population. J Am Geriatrics Soc. 2008;56(7):1349-1356.
8. Steckler D, Epstein F, Riner RN. Getting ready for EHR, RHIOs and next-generation co-management agreements. Physician Exec. 2009;35(6):48, 50-42.
9. Danello PF. Clinical co-management: hospitals and oncologists working together. J Oncol Pract. 2006;2(1):21.
10. Schryer CF, Gladkova O, Spafford MM, Lingard L. Co-management in healthcare: negotiating professional boundaries. Discourse Commun. 2007;1(4):452-479.
11. Cantlupe J. Physican alignment in an era of change. HealthLeaders Media: Intell Reps. content.hcpro.com/pdf/content/256536.pdf. Published September 2010. Accessed April 22, 2015.
12. Olson SA, Mather RC 3rd. Understanding how orthopaedic surgery practices generate value for healthcare systems. Clin Orthop. 2013;471(6):1801-1808.
13. Page AE, Butler CA, Bozic KJ. Factors driving physician-hospital alignment in orthopaedic surgery. Clin Orthop. 2013;471(6):1809-1817.
14. Jackson DW. Understand the trend, considerations for hospital-based employment. Orthop Today. http://www.healio.com/orthopedics/business-of-orthopedics/news/print/orthopedics-today/%7Bf955b32f-9209-4f66-91f7-b26eb00d3cfa%7D/understand-the-trend-considerations-for-hospital-based-employment. Published March 2013. Accessed April 22, 2015.
15. Porucznik MA. What is the future of orthopaedics? AAOS Now. 2013;7(1). http://www.aaos.org/news/aaosnow/jan13/advocacy9.asp. Accssed April 22, 2015.
16. Marcus RE, Zenty TF 3rd, Adelman HG. Aligning incentives in orthopaedics: opportunities and challenges - the Case Medical Center experience. Clin Orthop. 2009;467(10):2525-2534.
17. Roche J. AAOS takes stance on bundled payments and gainsharing. AAOS Now. 2009;3(5). http://www.aaos.org/news/aaosnow/may09/reimbursement3.asp. Accessed April 28, 2015.
18. Grogan TJ. Tips for marketing your orthopedic practice. AAOS Now. 2007;1(8). http://www.aaos.org/news/bulletin/oct07/managing7.asp. Accessed April 28, 2015.
19. Bushnell BD. Developing a bundled pricing strategy. AAOS Now. 2014;8(3):16-17. http://www.aaos.org/news/aaosnow/mar14/advocacy1.asp. Accessed April 21, 2015.
20. Accountable care organizations (ACO). Centers for Medicare and Medicaid Services website. http://www.cms.gov/Medicare/Medicare-Fee-for-Service-Payment/ACO/index.html?redirect=/aco. Updated January 6, 2015. Accessed April 22, 2015.
21. Sowers KW, Newman PR, Langdon JC. Evolution of physician-hospital alignment models: a case study of comanagement. Clin Orthop. 2013;471(6):1818-1823.
22. Leahy M. Is a clinical comanagement agreement right for your practice? AAOS Now. 2013;7(7). http://www.aaos.org/news/aaosnow/jul13/managing6.asp. Accessed April 22, 2015.
23. Nahm S. Top 10 features and benefits of co-management arrangements. The Camden Group website. http://www.thecamdengroup.com/thought-leadership/top-ten/top-10-features-and-benefits-of-co-management-arrangements. Published May 2010. Accessed April 22, 2015.
24. Spindler KP, Kuhn JE, Dunn W, Matthews CE, Harrell FE Jr, Dittus RS. Reading and reviewing the orthopaedic literature: a systematic, evidence-based medicine approach. J Am Acad Orthop Surg. 2005;13(4):220-229.
25. Pfeffer J, Sutton RI. Evidence-based management. Harvard Business Rev website. https://hbr.org/2006/01/evidence-based-management/ar/1. Published January 2006. Accessed April 22, 2015.
26. Erickson JC III. What in the world is medical “co-management”? Physicians Pract. http://www.physicianspractice.com/blog/what-world-medical-%E2%80%98co-management%E2%80%99. Published October 14, 2011. Accessed April 22, 2015.
27. Steinmann J. Hospital co-management agreements and surgeon owned distribution: the two most important new models for the private practice orthopedic group. Talk presented at: California Orthopaedic Association Annual Meeting; May 20, 2011; Dana Point, CA. http://www.coa.org/docs/2011-Annual-Meeting/Friday/Steinmann.pdf. Accessed April 22, 2015.
28. Nagele RL. Hospital-physician relationships after national health reform: moving from competition to collaboration. Pa Bar Assoc Q. 2011;82(1):1-15. http://www.postschell.com/site/files/556.pdf. Accessed April 22, 2015.
29. Dyrda L. 5 Benefits and challenges of co-management agreements for orthopedic surgeons. Becker’s Spine Rev. http://www.beckersspine.com/orthopedic-spine-practices-improving-profits/item/2294-5-benefits-and-challenges-of-co-management-agreements-for-orthopedic-surgeons. Published October 21, 2010. Updated November 8, 2010. Accessed April 22, 2015.
30. Aston G. Are you ready for physician co-management? Association for Healthcare Resource & Materials Management website. http://www.ahrmm.org/ahrmm/news_and_issues/strategies_solutions_homepage/nov12_physician_comanagement.jsp. Accessed April 22, 2015.
31. Top 10 lessons learned from “mature” co-management arrangements. The Camden Group website. http://www.thecamdengroup.com/thought-leadership/blog/top-10-lessons-learned-from-mature-co-management-arrangements/. Accessed April 22, 2015.
32. Anderson GD, Brandt AS. Co-management arrangements and their continuing evolution. HealthCare Appraisers, Inc., website. http://www.healthcareappraisers.com/presentations/BVR_Webinar_Co-mgmt_AB_0611.pdf. Published 2011. Accessed April 22, 2015.
33. Colyvas N. Establishing a service line co-management agreement. AAOS Now. March 2013;7(3). http://www.aaos.org/news/aaosnow/mar13/managing1.asp. Accessed April 22, 2015.
34. Safriet SM, Werling K. The evolution of service line co-management relationships with physicians - Key observations on relationships and fair market value. Health Care Appraisers, Inc., website. http://www.healthcareappraisers.com/presentations/HAI-MGW_Co-Management_Presentation.pdf. Published 2014. Accessed April 22, 2015.
35. Bilazarian S. Sunshine act: the intersection of federal law, physicians, and corporate attorneys. Practitioner’s Corner with Dr. Seth Bilazarian. Medscape website. www.medscape.com/viewarticle/821855. Published March 24, 2014. Accessed April 22, 2015.
36. Del Negro PH. Service line co-management arrangements: models and practicalities. ABA Health eSource. 2012;9(2). http://www.americanbar.org/content/newsletter/publications/aba_health_esource_home/aba_health_law_esource_1012_delnegro.html. Published October 2012. Accessed April 22, 2015.
37. Blau ML, Romano DH, Safriet SM. Co-management arrangements in healthcare: complying with regulatory requirements in structuring hospital-physician arrangements. Health Care Appraisers, Inc., website. http://www.healthcareappraisers.com/presentations/Co-Mgmt_Arrangements_Webinar_12-1-09.pdf. Published 2009. Accessed April 22, 2015.
38. Johnson J. 5 things you should know about co-management arrangements. Healthcare Financial Manage. 2011;65(7):74-78, 80.
39. Mertz G. Co-management models can be profitable for physicians. Physicians Pract. http://www.physicianspractice.com/blog/co-management-models-can-be-profitable-physicians. Published May 5, 2013. Accessed April 22, 2015.
40. Gamble M. Co-management agreements 101: basic principles to know. Becker’s Hosp Rev. http://www.beckershospitalreview.com/hospital-transactions-and-valuation/co-management-agreements-101-basic-principles-to-know.html. Published November 28, 2011. Accessed April 22, 2015.
41. Werling K, Carnell H, Szabad M. Regulatory considerations for structuring physician/hospital co-management agreements. Health Care Law Mon. 2010;2010(9):2-6.
42. Punke H. Hospital-physician co-management agreements: how to avoid a major pitfall. Becker’s Hosp Rev. http://www.beckershospitalreview.com/hospital-physician-relationships/hospital-physician-co-management-agreements-how-to-avoid-a-major-pitfall.html. Published November 1, 2013. Accessed April 22, 2015.
43. Burack MR. OIG approves co-management arrangement. Akerman Health Law Rx website. http://www.healthlawrx.com/2013/02/oig-approves-co-management-arrangement-2/. Published February 1, 2013. Accessed April 22, 2015.
44. Greaves C. Five common sense strategies for structuring co-management agreements after advisory opinion 12-22. ABA Health eSource. 2013;9(7). http://www.americanbar.org/content/newsletter/publications/aba_health_esource_home/aba_health_law_esource_1303_greaves.html. Published March 2013. Accessed April 22, 2015.
45. Hefti F, Müller W, Jakob RP, Stäubli HU. Evaluation of knee ligament injuries with the IKDC form. Knee Surg Sports Traumatol Arthrosc. 1993;1(3-4):226-234.
46. Richards RR, An KN, Bigliani LU, et al. A standardized method for the assessment of shoulder function. J Shoulder Elbow Surg. 1994;3(6):347-352.
47. Patel AA, Donegan D, Albert T. The 36-item short form. J Am Acad Orthop Surg. 2007;15(2):126-134.
48. Surgical Care Improvement Project. The Joint Commission website. http://www.jointcommission.org/surgical_care_improvement_project/. Published October 16, 2014. Accessed April 22, 2015.
49. Pennington WT. Emulating a physician-owned hospital. Hosp Health Netw Daily. http://www.hhnmag.com/display/HHN-news-article.dhtml?dcrPath=/templatedata/HF_Common/NewsArticle/data/HHN/Daily/2013/Jul/blog072513-5840005536. Published July 25, 2013. Accessed April 22, 2015.
Investigational Osteoporosis Drug Lowers Fracture Risk
Abaloparatide-SC, an injectable drug being studied for the treatment of postmenopausal osteoporosis, reduces the rate of new spinal fractures by 86%, as well as provide statistically significant reductions in the fracture rate at other parts of the body, according to data from the phase 3 ACTIVE fracture prevention trial (ACTIVE trial). Results from the ACTIVE trial were reported at the Endocrine Society’s 97th Annual Meeting in San Diego.
“The investigational drug abaloparatide-SC, if approved, may offer patients the potential to reduce their risk of fracture and increase bone density at all sites, even the most difficult to treat, such as the hip and wrist,” said lead investigator Paul Miller, MD, Medical Director of the Colorado Center for Bone Research in Lakewood.

Abaloparatide-SC is a new manmade form of human parathyroid hormone-related protein that is manufactured by Radius Health (Waltham, Massachusetts). The drugmaker is studying the medication in various forms, including a transdermal patch, in addition to the subcutaneous injection studied in the ACTIVE trial.
During the ACTIVE trial, researchers studied whether abaloparatide-SC can reduce fractures in postmenopausal women with severe osteoporosis who have a high fracture risk. The investigators compared rates of new fractures in 690 women who received a daily injection of abaloparatide-SC (80 mcg) and 711 women who received inactive placebo shots. Neither group of women knew which treatment they received. A third group of 717 women received a daily injection of teriparatide (20 mcg) in an unblinded fashion. All patients also received calcium and vitamin D supplements.
Over 18 months of treatment, the abaloparatide-SC-treated group had the greatest reduction in the rate of new vertebral fractures shown on x-ray, Dr. Miller reported. Compared with the placebo group’s new vertebral fracture rate of 4.2%, women who were treated with abaloparatide-SC had a new vertebral fracture rate of about 0.58%, representing an 86% reduction in the rate of broken bones at the spine, according to Dr. Miller.
“We believe this reduction seen in the abaloparatide-SC-treated group could be the largest reduction ever demonstrated in the vertebral fracture rate for any potential therapeutic drug being researched for the treatment of postmenopausal osteoporosis,” Dr. Miller said.
For nonvertebral fractures, Dr. Miller said abaloparatide-SC treatment had a 43% fracture-rate reduction compared to that of placebo. The rate of vertebral and nonvertebral fractures combined decreased by 45% in the abaloparatide-SC-treated group versus the placebo group. Additionally, the time to the first nonvertebral fracture was significantly delayed for women receiving abaloparatide-SC than for those who received a placebo, he said.
Results of patients’ bone mineral density tests also were compared between the two drug treatment groups. “Abaloparatide-SC resulted in more bone growth, at a faster rate, at more skeletal sites, and in more patients than teriparatide,” stated Dr. Miller.
Abaloparatide-SC, an injectable drug being studied for the treatment of postmenopausal osteoporosis, reduces the rate of new spinal fractures by 86%, as well as provide statistically significant reductions in the fracture rate at other parts of the body, according to data from the phase 3 ACTIVE fracture prevention trial (ACTIVE trial). Results from the ACTIVE trial were reported at the Endocrine Society’s 97th Annual Meeting in San Diego.
“The investigational drug abaloparatide-SC, if approved, may offer patients the potential to reduce their risk of fracture and increase bone density at all sites, even the most difficult to treat, such as the hip and wrist,” said lead investigator Paul Miller, MD, Medical Director of the Colorado Center for Bone Research in Lakewood.
Abaloparatide-SC is a new manmade form of human parathyroid hormone-related protein that is manufactured by Radius Health (Waltham, Massachusetts). The drugmaker is studying the medication in various forms, including a transdermal patch, in addition to the subcutaneous injection studied in the ACTIVE trial.
During the ACTIVE trial, researchers studied whether abaloparatide-SC can reduce fractures in postmenopausal women with severe osteoporosis who have a high fracture risk. The investigators compared rates of new fractures in 690 women who received a daily injection of abaloparatide-SC (80 mcg) and 711 women who received inactive placebo shots. Neither group of women knew which treatment they received. A third group of 717 women received a daily injection of teriparatide (20 mcg) in an unblinded fashion. All patients also received calcium and vitamin D supplements.
Over 18 months of treatment, the abaloparatide-SC-treated group had the greatest reduction in the rate of new vertebral fractures shown on x-ray, Dr. Miller reported. Compared with the placebo group’s new vertebral fracture rate of 4.2%, women who were treated with abaloparatide-SC had a new vertebral fracture rate of about 0.58%, representing an 86% reduction in the rate of broken bones at the spine, according to Dr. Miller.
“We believe this reduction seen in the abaloparatide-SC-treated group could be the largest reduction ever demonstrated in the vertebral fracture rate for any potential therapeutic drug being researched for the treatment of postmenopausal osteoporosis,” Dr. Miller said.
For nonvertebral fractures, Dr. Miller said abaloparatide-SC treatment had a 43% fracture-rate reduction compared to that of placebo. The rate of vertebral and nonvertebral fractures combined decreased by 45% in the abaloparatide-SC-treated group versus the placebo group. Additionally, the time to the first nonvertebral fracture was significantly delayed for women receiving abaloparatide-SC than for those who received a placebo, he said.
Results of patients’ bone mineral density tests also were compared between the two drug treatment groups. “Abaloparatide-SC resulted in more bone growth, at a faster rate, at more skeletal sites, and in more patients than teriparatide,” stated Dr. Miller.

Osteoporosis Diagnosis Linked to Increased Risk of Hearing Loss?
Patients who have osteoporosis face a 1.76-fold higher risk of developing sudden sensorineural hearing loss (SSHL) than those who do not have the bone disease, according to a study published online ahead of print April 16 in the Journal of Clinical Endocrinology & Metabolism.
“A growing body of evidence indicates that osteoporosis affects not only bone health, but the cardiovascular and cerebrovascular systems,” said study author Kai-Jen Tien, MD, from the Chi Mei Medical Center in Taiwan.

SSHL, also called sudden deafness, is an unexplained, rapid loss of hearing that typically happens in one ear, according to the National Institute on Deafness and Other Communication Disorders. It can happen at once or over the course of several days. Although about half of the people who develop SSHL will spontaneously regain their hearing, immediate treatment is recommended. About 85% of those who are treated for the condition recover some hearing.
This retrospective cohort study examined medical records for 10,660 Taiwan residents who were diagnosed with osteoporosis between 1999 and 2008, and compared them to 31,980 controls who did not have the condition. Using national insurance records, the researchers analyzed how many participants were diagnosed with sudden deafness by the end of 2011.
The participants who were diagnosed with osteoporosis had a much higher risk of developing SSHL than the control group. Among the participants who had osteoporosis, 91 were diagnosed with SSHL during the follow-up period. In comparison, the control group, which was triple the size, included 155 people who were diagnosed with SSHL.
Dr. Tien and colleagues theorized that cardiovascular risk factors, bone demineralization, inflammation, and endothelial dysfunction may contribute to the association between osteoporosis and SSHL.
“More people worldwide are suffering from osteoporosis, and our work shows they are at risk of sensorineural hearing loss, as well as bone fracture and other problems,” Dr. Tien said. “Patients who have osteoporosis should be aware they need to seek medical help immediately if they experience hearing loss.”
Dr. Tien stated, “Our findings suggest sudden sensorineural hearing loss can be another broader health problem connected to osteoporosis.”
Suggested Reading
Yeh MC, Weng SF, Shen YC, et al. Increased risk of sudden sensorineural hearing loss in patients with osteoporosis: a population-based, propensity score-matched, longitudinal follow-up study. J Clin Endocrinol Metab. 2015 Apr 16:jc20144316. [Epub ahead of print]
Patients who have osteoporosis face a 1.76-fold higher risk of developing sudden sensorineural hearing loss (SSHL) than those who do not have the bone disease, according to a study published online ahead of print April 16 in the Journal of Clinical Endocrinology & Metabolism.
“A growing body of evidence indicates that osteoporosis affects not only bone health, but the cardiovascular and cerebrovascular systems,” said study author Kai-Jen Tien, MD, from the Chi Mei Medical Center in Taiwan.
SSHL, also called sudden deafness, is an unexplained, rapid loss of hearing that typically happens in one ear, according to the National Institute on Deafness and Other Communication Disorders. It can happen at once or over the course of several days. Although about half of the people who develop SSHL will spontaneously regain their hearing, immediate treatment is recommended. About 85% of those who are treated for the condition recover some hearing.
This retrospective cohort study examined medical records for 10,660 Taiwan residents who were diagnosed with osteoporosis between 1999 and 2008, and compared them to 31,980 controls who did not have the condition. Using national insurance records, the researchers analyzed how many participants were diagnosed with sudden deafness by the end of 2011.
The participants who were diagnosed with osteoporosis had a much higher risk of developing SSHL than the control group. Among the participants who had osteoporosis, 91 were diagnosed with SSHL during the follow-up period. In comparison, the control group, which was triple the size, included 155 people who were diagnosed with SSHL.
Dr. Tien and colleagues theorized that cardiovascular risk factors, bone demineralization, inflammation, and endothelial dysfunction may contribute to the association between osteoporosis and SSHL.
“More people worldwide are suffering from osteoporosis, and our work shows they are at risk of sensorineural hearing loss, as well as bone fracture and other problems,” Dr. Tien said. “Patients who have osteoporosis should be aware they need to seek medical help immediately if they experience hearing loss.”
Dr. Tien stated, “Our findings suggest sudden sensorineural hearing loss can be another broader health problem connected to osteoporosis.”
Suggested Reading
Yeh MC, Weng SF, Shen YC, et al. Increased risk of sudden sensorineural hearing loss in patients with osteoporosis: a population-based, propensity score-matched, longitudinal follow-up study. J Clin Endocrinol Metab. 2015 Apr 16:jc20144316. [Epub ahead of print]
Suggested Reading
Yeh MC, Weng SF, Shen YC, et al. Increased risk of sudden sensorineural hearing loss in patients with osteoporosis: a population-based, propensity score-matched, longitudinal follow-up study. J Clin Endocrinol Metab. 2015 Apr 16:jc20144316. [Epub ahead of print]

Young Patients Who Undergo ACL Surgery May Drastically Improve Physical Health and Function
Most patients who underwent surgery to repair and rebuild an anterior cruciate ligament (ACL) tear showed significant improvement in physical function at 2 years, which continued for at least 6 years following surgery, according to a study published April 1 in the Journal of Bone & Joint Surgery. Younger patient age, lower body mass index, and having the remnants of the torn ACL completely excised during surgery were among the strongest predictors of positive, long-term outcome.
In this study, researchers reviewed and evaluated the outcomes of 1,411 patients (44% female; average patient age at enrollment, 23) who underwent ACL surgery between 2002 and 2004 at four major medical centers. Each patient completed questionnaires that assessed health, well-being, and function prior to surgery, and again at 2 and 6 years after surgery.
“We found that health-related quality of life was significantly improved following ACL reconstruction, and this improvement was still present 6 years following surgery,” said lead study author Warren R. Dunn, MD, MPH, an orthopedic surgeon at the University of Wisconsin in Madison.

At baseline, the average physical health score was 41.9 and the mean mental health score was 51.7. At 2 years after surgery, the physical and mental health scores were stable at 53.6 and 52 points, respectively, and 54 and 52.4 points at year 6.
Among the study’s findings:
• ACL reconstruction resulted in large improvements in the physical function scores, with a mean improvement of 12 points (out of 100) at 2 years and 6 years following surgery.
• At 6 years following ACL surgery, patients gained a mean 5.3 quality-adjusted life years.
• Baseline activity level was a significant predictor of mental health scores, but not physical function scores.
• Predictors of worse postoperative outcomes were a shorter follow-up time post-surgery, revision ACL reconstruction, smoking at baseline, fewer years of education, and damage to the cartilage under the chondromalacia patella.
• Physical function continued to improve over the long term following reconstruction. Patients requiring a revision reconstruction did not fare as well as patients undergoing a single reconstruction.
• Mental health scores over the 6-year period did not significantly change, but scores consistently remained above the population norm of 50 points.
“The predictors for good and poorer outcomes may be helpful when counseling patients who are considering ACL surgery,” stated Dr. Dunn.
Suggested Reading
Dunn WR, Wolf BR, Harrell FE Jr, et al. Baseline predictors of health-related quality of life after anterior cruciate ligament reconstruction: a longitudinal analysis of a multicenter cohort at two and six years. J Bone Joint Surg Am. 2015;97(7):551-557.
Most patients who underwent surgery to repair and rebuild an anterior cruciate ligament (ACL) tear showed significant improvement in physical function at 2 years, which continued for at least 6 years following surgery, according to a study published April 1 in the Journal of Bone & Joint Surgery. Younger patient age, lower body mass index, and having the remnants of the torn ACL completely excised during surgery were among the strongest predictors of positive, long-term outcome.
In this study, researchers reviewed and evaluated the outcomes of 1,411 patients (44% female; average patient age at enrollment, 23) who underwent ACL surgery between 2002 and 2004 at four major medical centers. Each patient completed questionnaires that assessed health, well-being, and function prior to surgery, and again at 2 and 6 years after surgery.
“We found that health-related quality of life was significantly improved following ACL reconstruction, and this improvement was still present 6 years following surgery,” said lead study author Warren R. Dunn, MD, MPH, an orthopedic surgeon at the University of Wisconsin in Madison.
At baseline, the average physical health score was 41.9 and the mean mental health score was 51.7. At 2 years after surgery, the physical and mental health scores were stable at 53.6 and 52 points, respectively, and 54 and 52.4 points at year 6.
Among the study’s findings:
• ACL reconstruction resulted in large improvements in the physical function scores, with a mean improvement of 12 points (out of 100) at 2 years and 6 years following surgery.
• At 6 years following ACL surgery, patients gained a mean 5.3 quality-adjusted life years.
• Baseline activity level was a significant predictor of mental health scores, but not physical function scores.
• Predictors of worse postoperative outcomes were a shorter follow-up time post-surgery, revision ACL reconstruction, smoking at baseline, fewer years of education, and damage to the cartilage under the chondromalacia patella.
• Physical function continued to improve over the long term following reconstruction. Patients requiring a revision reconstruction did not fare as well as patients undergoing a single reconstruction.
• Mental health scores over the 6-year period did not significantly change, but scores consistently remained above the population norm of 50 points.
“The predictors for good and poorer outcomes may be helpful when counseling patients who are considering ACL surgery,” stated Dr. Dunn.
Suggested Reading
Dunn WR, Wolf BR, Harrell FE Jr, et al. Baseline predictors of health-related quality of life after anterior cruciate ligament reconstruction: a longitudinal analysis of a multicenter cohort at two and six years. J Bone Joint Surg Am. 2015;97(7):551-557.
Suggested Reading
Dunn WR, Wolf BR, Harrell FE Jr, et al. Baseline predictors of health-related quality of life after anterior cruciate ligament reconstruction: a longitudinal analysis of a multicenter cohort at two and six years. J Bone Joint Surg Am. 2015;97(7):551-557.

Hibernoma
Hibernomas are rare benign soft-tissue tumors originally described as pseudolipomas by Merkel1 in 1906. Gery coined the term hibernoma in 1914, after noting the multivacuolated cytoplasm of the tumor cells and its resemblance to normal brown fat found in hibernating animals.2
Hibernomas represent 2% of all benign fat-containing tumors and are composed of brown adipocytes, which are histologically different from the white fat of lipomas. Hibernomas usually develop between ages 20 and 40 years, and their incidence is slightly higher in males.
Diffusely present in human newborns, brown fat usually regresses by 8 weeks of age.3 Residual brown fat deposits may remain in the neck, axilla, shoulder, thorax, thigh, retroperitoneum, and periscapular/interscapular regions.4 All these vestigial areas are therefore common locations of hibernomas, with the thigh accounting for up to 30% of cases.5 These tumors are seldom identified in the abdomen, popliteal fossa, or even intracranially. Injury to brown fat cells in these locations, either by infection, inflammation, or trauma, is considered a predisposing risk factor for development of hibernomas.6
Clinical Presentation
Clinically, hibernomas present as slow-growing, painless soft-tissue masses. Physical examination usually reveals a palpable, solitary, soft, and rubbery mass within the subcutaneous fat, which is freely mobile and not attached to deep layers. These tumors may rarely produce steroid hormones and result in a paraneoplastic syndrome. Even though these tumors are usually large at presentation, compression of adjacent structures seldom occurs.
Histology and Differential Diagnosis
The characteristic hibernoma cell is a multivacuolated adipocyte with centrally located nucleus, indistinct nucleolus, and coarsely granular eosinophilic (or pale) cytoplasm (Figure 1). Cytoplasmic vacuoles are uniform, round, regular, and small and stain for neutral fat. Nuclei are usually small with no or rare atypia. These multivacuolated brown fat–like tumor cells usually stain positive for S100 and CD31, usually stain negative for CD34 and p53, and can show 11q13-21 rearrangements, also seen in lipomas and liposarcomas. Hibernomas have 4 histologic variants: typical (classic), myxoid, lipoma-like, and spindle-cell.5 The typical hibernoma, the most common, contains a varying mixture of brown and white fat cells. The myxoid type, second most common, is composed of hibernoma cells floating in a loose acellular myxoid stroma. The lipoma-like variant consists of a few scattered hibernoma cells in a predominance of white fat cells. The spindle-cell variant, the rarest, has features of typical hibernoma and spindle-cell lipoma.7
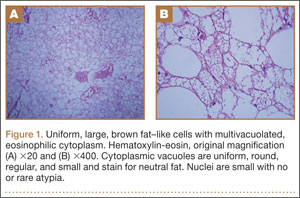
Grossly, hibernomas are well encapsulated, soft, and lobular with prominent feeding vessels.8 They typically are tan or brown because of their hypervascularity and abundant mitochondria. Tumor size ranges from 1 to 24 cm (mean, 9.4 cm).9 These tumors are well-defined intermuscular/intramuscular, subcutaneous, or retroperitoneal lesions that tend to grow along fascial planes and displace surrounding structures rather than invade them. Delicate branching capillaries are usually seen within the tumor.
Although rare, hibernoma should be included in the differential diagnosis of lipomatous soft-tissue tumors.10 Imaging findings of hibernoma are not specific; other differential diagnostic considerations for a mass with a signal similar to that of fat or containing large intratumoral vessels include angiolipoma, intramuscular hemangioma with fat, spindle-cell lipoma, pleomorphic lipoma, lipoblastoma, hemangiopericytoma, and hemangioblastoma,11-15 as well as malignant processes, including lipoma-like well-differentiated liposarcoma and myxoid liposarcoma.16 Other entities that should be considered include residual brown fat and rhabdomyoma.
Hibernomas are histologically distinguished from well-differentiated liposarcomas by location (liposarcomas tend to be deep), atypia, presence of a prominent “plexiform” capillary pattern, and specific molecular translocations, including t (12;16). Lipomas have lipocytes that are not multivacuolated, and residual brown fat does not present as a distinct mass. Rhabdomyomas are distinguished by an absence of cytoplasmic lipid vacuoles.
Imaging
Conventional radiography may show a radiolucent mass without internal mineralization or associated osseous abnormalities4 (Figure 2). Calcifications are notably absent.17 Sonographically, hibernomas are well-circumscribed, solid, hyperechoic masses with increased internal vascular flow on both grayscale and color Doppler sampling; however their appearance is not pathognomonic (Figure 3). Angiography reveals a hypervascular tumor that may have internal arteriovenous shunting.18 Hibernomas have a heterogeneous appearance on computed tomography (CT) and magnetic resonance imaging (MRI) because of the variable distribution of brown fat cells, white fat cells, myxoid material, and spindle cells within the individual tumor subtypes.5 CT of these tumors shows internal septations and low attenuation values, between those of fat and muscle19 (Figure 4). Intravenous contrast enhances internal septa, but enhancement varies from none to intense, and from generalized to focal, depending on internal tumor composition.3,17,20-22
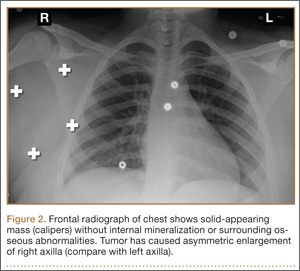
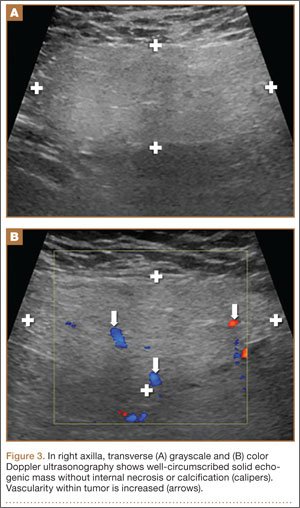
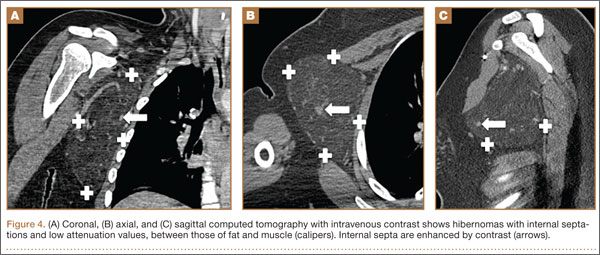
Hibernomas are usually hyperintense to skeletal muscle on T1-weighted MRI but slightly hypointense to subcutaneous fat because of the different gyromagnetic ratios and precessional frequencies of protons in white fat versus those in brown fat17 (Figure 5). Rarely, lesions are isointense to skeletal muscle on T1-weighted images.23 On T2-weighted images, high signal intensity similar to that of subcutaneous fat is typical.24 Flow voids can be readily identified.25 Short tau inversion recovery (STIR) MRI shows some areas with signal intensity higher than that of subcutaneous fat, and other areas of fat suppression.9 Ritchie and colleagues21 reported that hibernomas histologically composed of more than 70% multivacuolated adipocytes tended to have MRI signal characteristics different from those of subcutaneous fat, and those with less than 70% multivacuolated adipocytes tended to have signal characteristics paralleling those of subcutaneous fat. Myxoid hibernomas have higher signal intensity on T2-weighted and STIR MRI because of high water content.17,21,26,27
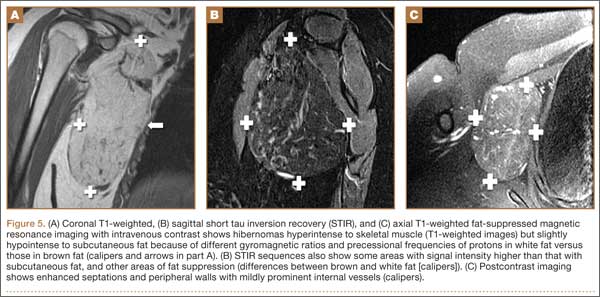
Hibernomas demonstrate moderate uptake on bone scintigraphy blood pool images and mild uptake on delayed images.4 Positron emission tomography (PET) is useful in differentiating hibernomas from other fat-containing lesions.9 Hibernomas demonstrate intense fluorine-18 fluorodeoxyglucose uptake because, unlike other adipogenic tumors, hibernomas contain abundant mitochondria and are highly metabolically active.28
Treatment and Prognosis
Complete surgical excision is the treatment of choice; given the behavior of the benign tumor, marginal complete excision is considered curative.5 Intralesional excision may be the only option for large tumors that are near nerves or vessels. However, intralesional excision may result in continued growth and local recurrence.
At surgery, these tumors usually are encapsulated and/or adherent to skeletal muscle or bone, without invasion, and easily separated from surrounding soft tissues.29 No specific surgical considerations are required beyond standard oncological principles, including careful dissection of adjacent nerves and vessels, and hemostasis. Hibernomas have the potential for significant bleeding during surgical excision. In this setting, embolization becomes a consideration, given the identification of large intratumoral vessels and the benign course of these lesions.
1. Merkel H. On a pseudolipoma of the breast. Beitr Pathol Anat. 1906;39:152-157.
2. Enzinger FM, Weiss SW. Benign lipomatous tumors. In: Enzinger FM, Weiss SW, eds. Soft Tissue Tumors. 3rd ed. St. Louis, MO: Mosby-Yearbook; 1994:420-423.
3. Alvine G, Rosenthal H, Murphey M, Huntrakoon M. Hibernoma. Skeletal Radiol. 1996;25(5):493-496.
4. Kumazoe H, Nagamatsu Y, Nishi T, Kimura YN, Nakazono T, Kudo S. Dumbbell-shaped thoracic hibernoma: computed tomography and magnetic resonance imaging findings. Jpn J Radiol. 2009;27(1):37-40.
5. Furlong MA, Fanburg-Smith JC, Miettinen M. The morphologic spectrum of hibernoma: a clinicopathologic study of 170 cases. Am J Surg Pathol. 2001;25(6):809-814.
6. Ucak A, Inan K, Onan B, Yilmaz AT. Resection of intrapericardial hibernoma associated with constrictive pericarditis. Interact Cardiovasc Thorac Surg. 2009;9(4):717-719.
7. Tomihama RT, Lindskog DM, Ahrens W, Haims AH. Hibernoma: a case report demonstrating usefulness of MR angiography in characterizing the tumor. Skeletal Radiol. 2007;36(6):541-545.
8. Choi J, Heiner J, Agni R, Hafez GR. Case of the season. Hibernoma. Semin Roentgenol. 2002;37(2):99-101.
9. Craig WD, Fanburg-Smith JC, Henry LR, Guerrero R, Barton JH. Fat-containing lesions of the retroperitoneum: radiologic-pathologic correlation. Radiographics. 2009;29(1):261-290.
10. Vassos N, Lell M, Hohenberger W, Croner RS, Agaimy A. Deep-seated huge hibernoma of soft tissue: a rare differential diagnosis of atypical lipomatous tumor/well differentiated liposarcoma. Int J Clin Exp Pathol. 2013;6(10):2178-2184.
11. Mugel T, Ghossain MA, Guinet C, et al. MR and CT findings in a case of hibernoma of the thigh extending into the pelvis. Eur Radiol. 1998;8(3):476-478.
12. Kallas KM, Vaughan L, Haghighi P, Resnick D. Hibernoma of the left axilla; a case report and review of MR imaging. Skeletal Radiol. 2003;32(5):290-294.
13. Suh JS, Cho J, Lee SH, et al. Alveolar soft part sarcoma: MR and angiographic findings. Skeletal Radiol. 2000;29(12):680-689.
14. De Beuckeleer LH, De Schepper AM, Vandevenne JE, et al. MR imaging of clear cell sarcoma (malignant melanoma of the soft parts): a multicenter correlative MRI-pathology study of 21 cases and literature review. Skeletal Radiol. 2000;29(4):187-195.
15. Chu BC, Terae S, Hida K, Furukawa M, Abe S, Miyasaka K. MR findings in spinal hemangioblastoma: correlation with symptoms and with angiographic and surgical findings. AJNR Am J Neuroradiol. 2001;22(1):206-217.
16. Cypess AM, Lehman S, Williams G, et al. Identification and importance of brown adipose tissue in adult humans. N Engl J Med. 2009;360(15):1509-1517.
17. Anderson SE, Schwab C, Stauffer E, Banic A, Steinbach LS. Hibernoma: imaging characteristics of a rare benign soft tissue tumor. Skeletal Radiol. 2001;30(10):590-595.
18. Angervall L, Nilsson L, Stener B. Microangiographic and histological studies in 2 cases of hibernoma. Cancer. 1964;17:685-692.
19. Sansom HE, Blunt DM, Moskovic EC. Large retroperitoneal hibernoma—CT findings with pathological correlation. Clin Radiol. 1999;54(9):625-627.
20. Dursun M, Agayev A, Bakir B, et al. CT and MR characteristics of hibernoma: six cases. Clin Imaging. 2008;32(1):42-47.
21. Ritchie DA, Aniq H, Davies AM, Mangham DC, Helliwell TR. Hibernoma—correlation of histopathology and magnetic-resonance-imaging features in 10 cases. Skeletal Radiol. 2006;35(8):579-589.
22. Lee JC, Gupta A, Saifuddin A, et al. Hibernoma: MRI features in eight consecutive cases. Clin Radiol. 2006;61(12):1029-1034.
23. Chitoku S, Kawai S, Watabe Y, et al. Intradural spinal hibernoma: case report. Surg Neurol. 1998;49(5):509-513.
24. Baskurt E, Padgett DM, Matsumoto JA. Multiple hibernomas in a 1-month-old female infant. AJNR Am J Neuroradiol. 2004;25(8):1443-1445.
25. da Motta AC, Tunkel DE, Westra WH, Yousem DM. Imaging findings of a hibernoma of the neck. AJNR Am J Neuroradiol. 2006;27(8):1658-1659.
26. Cook MA, Stern M, de Siva RD. MRI of a hibernoma. J Comput Assist Tomogr. 1996;20(2):333-335.
27. Murphey MD, Carroll JF, Flemming DJ, Pope TL, Gannon FH, Kransdorf MJ. From the archives of the AFIP: benign musculoskeletal lipomatous lesions. Radiographics. 2004;24(5):1433-1466.
28. Robison S, Rapmund A, Hemmings C, Fulham M, Barry P. False-positive diagnosis of metastasis on positron emission tomography–computed tomography imaging due to hibernoma. J Clin Oncol. 2009;27(6):994-995.
29. Kallas KM, Vaughan L, Haghighi P, Resnick D. Hibernoma of the left axilla; a case report and review of MR imaging. Skeletal Radiol. 2003;32(5):290-294.
Hibernomas are rare benign soft-tissue tumors originally described as pseudolipomas by Merkel1 in 1906. Gery coined the term hibernoma in 1914, after noting the multivacuolated cytoplasm of the tumor cells and its resemblance to normal brown fat found in hibernating animals.2
Hibernomas represent 2% of all benign fat-containing tumors and are composed of brown adipocytes, which are histologically different from the white fat of lipomas. Hibernomas usually develop between ages 20 and 40 years, and their incidence is slightly higher in males.
Diffusely present in human newborns, brown fat usually regresses by 8 weeks of age.3 Residual brown fat deposits may remain in the neck, axilla, shoulder, thorax, thigh, retroperitoneum, and periscapular/interscapular regions.4 All these vestigial areas are therefore common locations of hibernomas, with the thigh accounting for up to 30% of cases.5 These tumors are seldom identified in the abdomen, popliteal fossa, or even intracranially. Injury to brown fat cells in these locations, either by infection, inflammation, or trauma, is considered a predisposing risk factor for development of hibernomas.6
Clinical Presentation
Clinically, hibernomas present as slow-growing, painless soft-tissue masses. Physical examination usually reveals a palpable, solitary, soft, and rubbery mass within the subcutaneous fat, which is freely mobile and not attached to deep layers. These tumors may rarely produce steroid hormones and result in a paraneoplastic syndrome. Even though these tumors are usually large at presentation, compression of adjacent structures seldom occurs.
Histology and Differential Diagnosis
The characteristic hibernoma cell is a multivacuolated adipocyte with centrally located nucleus, indistinct nucleolus, and coarsely granular eosinophilic (or pale) cytoplasm (Figure 1). Cytoplasmic vacuoles are uniform, round, regular, and small and stain for neutral fat. Nuclei are usually small with no or rare atypia. These multivacuolated brown fat–like tumor cells usually stain positive for S100 and CD31, usually stain negative for CD34 and p53, and can show 11q13-21 rearrangements, also seen in lipomas and liposarcomas. Hibernomas have 4 histologic variants: typical (classic), myxoid, lipoma-like, and spindle-cell.5 The typical hibernoma, the most common, contains a varying mixture of brown and white fat cells. The myxoid type, second most common, is composed of hibernoma cells floating in a loose acellular myxoid stroma. The lipoma-like variant consists of a few scattered hibernoma cells in a predominance of white fat cells. The spindle-cell variant, the rarest, has features of typical hibernoma and spindle-cell lipoma.7
Grossly, hibernomas are well encapsulated, soft, and lobular with prominent feeding vessels.8 They typically are tan or brown because of their hypervascularity and abundant mitochondria. Tumor size ranges from 1 to 24 cm (mean, 9.4 cm).9 These tumors are well-defined intermuscular/intramuscular, subcutaneous, or retroperitoneal lesions that tend to grow along fascial planes and displace surrounding structures rather than invade them. Delicate branching capillaries are usually seen within the tumor.
Although rare, hibernoma should be included in the differential diagnosis of lipomatous soft-tissue tumors.10 Imaging findings of hibernoma are not specific; other differential diagnostic considerations for a mass with a signal similar to that of fat or containing large intratumoral vessels include angiolipoma, intramuscular hemangioma with fat, spindle-cell lipoma, pleomorphic lipoma, lipoblastoma, hemangiopericytoma, and hemangioblastoma,11-15 as well as malignant processes, including lipoma-like well-differentiated liposarcoma and myxoid liposarcoma.16 Other entities that should be considered include residual brown fat and rhabdomyoma.
Hibernomas are histologically distinguished from well-differentiated liposarcomas by location (liposarcomas tend to be deep), atypia, presence of a prominent “plexiform” capillary pattern, and specific molecular translocations, including t (12;16). Lipomas have lipocytes that are not multivacuolated, and residual brown fat does not present as a distinct mass. Rhabdomyomas are distinguished by an absence of cytoplasmic lipid vacuoles.
Imaging
Conventional radiography may show a radiolucent mass without internal mineralization or associated osseous abnormalities4 (Figure 2). Calcifications are notably absent.17 Sonographically, hibernomas are well-circumscribed, solid, hyperechoic masses with increased internal vascular flow on both grayscale and color Doppler sampling; however their appearance is not pathognomonic (Figure 3). Angiography reveals a hypervascular tumor that may have internal arteriovenous shunting.18 Hibernomas have a heterogeneous appearance on computed tomography (CT) and magnetic resonance imaging (MRI) because of the variable distribution of brown fat cells, white fat cells, myxoid material, and spindle cells within the individual tumor subtypes.5 CT of these tumors shows internal septations and low attenuation values, between those of fat and muscle19 (Figure 4). Intravenous contrast enhances internal septa, but enhancement varies from none to intense, and from generalized to focal, depending on internal tumor composition.3,17,20-22
Hibernomas are usually hyperintense to skeletal muscle on T1-weighted MRI but slightly hypointense to subcutaneous fat because of the different gyromagnetic ratios and precessional frequencies of protons in white fat versus those in brown fat17 (Figure 5). Rarely, lesions are isointense to skeletal muscle on T1-weighted images.23 On T2-weighted images, high signal intensity similar to that of subcutaneous fat is typical.24 Flow voids can be readily identified.25 Short tau inversion recovery (STIR) MRI shows some areas with signal intensity higher than that of subcutaneous fat, and other areas of fat suppression.9 Ritchie and colleagues21 reported that hibernomas histologically composed of more than 70% multivacuolated adipocytes tended to have MRI signal characteristics different from those of subcutaneous fat, and those with less than 70% multivacuolated adipocytes tended to have signal characteristics paralleling those of subcutaneous fat. Myxoid hibernomas have higher signal intensity on T2-weighted and STIR MRI because of high water content.17,21,26,27
Hibernomas demonstrate moderate uptake on bone scintigraphy blood pool images and mild uptake on delayed images.4 Positron emission tomography (PET) is useful in differentiating hibernomas from other fat-containing lesions.9 Hibernomas demonstrate intense fluorine-18 fluorodeoxyglucose uptake because, unlike other adipogenic tumors, hibernomas contain abundant mitochondria and are highly metabolically active.28
Treatment and Prognosis
Complete surgical excision is the treatment of choice; given the behavior of the benign tumor, marginal complete excision is considered curative.5 Intralesional excision may be the only option for large tumors that are near nerves or vessels. However, intralesional excision may result in continued growth and local recurrence.
At surgery, these tumors usually are encapsulated and/or adherent to skeletal muscle or bone, without invasion, and easily separated from surrounding soft tissues.29 No specific surgical considerations are required beyond standard oncological principles, including careful dissection of adjacent nerves and vessels, and hemostasis. Hibernomas have the potential for significant bleeding during surgical excision. In this setting, embolization becomes a consideration, given the identification of large intratumoral vessels and the benign course of these lesions.
1. Merkel H. On a pseudolipoma of the breast. Beitr Pathol Anat. 1906;39:152-157.
2. Enzinger FM, Weiss SW. Benign lipomatous tumors. In: Enzinger FM, Weiss SW, eds. Soft Tissue Tumors. 3rd ed. St. Louis, MO: Mosby-Yearbook; 1994:420-423.
3. Alvine G, Rosenthal H, Murphey M, Huntrakoon M. Hibernoma. Skeletal Radiol. 1996;25(5):493-496.
4. Kumazoe H, Nagamatsu Y, Nishi T, Kimura YN, Nakazono T, Kudo S. Dumbbell-shaped thoracic hibernoma: computed tomography and magnetic resonance imaging findings. Jpn J Radiol. 2009;27(1):37-40.
5. Furlong MA, Fanburg-Smith JC, Miettinen M. The morphologic spectrum of hibernoma: a clinicopathologic study of 170 cases. Am J Surg Pathol. 2001;25(6):809-814.
6. Ucak A, Inan K, Onan B, Yilmaz AT. Resection of intrapericardial hibernoma associated with constrictive pericarditis. Interact Cardiovasc Thorac Surg. 2009;9(4):717-719.
7. Tomihama RT, Lindskog DM, Ahrens W, Haims AH. Hibernoma: a case report demonstrating usefulness of MR angiography in characterizing the tumor. Skeletal Radiol. 2007;36(6):541-545.
8. Choi J, Heiner J, Agni R, Hafez GR. Case of the season. Hibernoma. Semin Roentgenol. 2002;37(2):99-101.
9. Craig WD, Fanburg-Smith JC, Henry LR, Guerrero R, Barton JH. Fat-containing lesions of the retroperitoneum: radiologic-pathologic correlation. Radiographics. 2009;29(1):261-290.
10. Vassos N, Lell M, Hohenberger W, Croner RS, Agaimy A. Deep-seated huge hibernoma of soft tissue: a rare differential diagnosis of atypical lipomatous tumor/well differentiated liposarcoma. Int J Clin Exp Pathol. 2013;6(10):2178-2184.
11. Mugel T, Ghossain MA, Guinet C, et al. MR and CT findings in a case of hibernoma of the thigh extending into the pelvis. Eur Radiol. 1998;8(3):476-478.
12. Kallas KM, Vaughan L, Haghighi P, Resnick D. Hibernoma of the left axilla; a case report and review of MR imaging. Skeletal Radiol. 2003;32(5):290-294.
13. Suh JS, Cho J, Lee SH, et al. Alveolar soft part sarcoma: MR and angiographic findings. Skeletal Radiol. 2000;29(12):680-689.
14. De Beuckeleer LH, De Schepper AM, Vandevenne JE, et al. MR imaging of clear cell sarcoma (malignant melanoma of the soft parts): a multicenter correlative MRI-pathology study of 21 cases and literature review. Skeletal Radiol. 2000;29(4):187-195.
15. Chu BC, Terae S, Hida K, Furukawa M, Abe S, Miyasaka K. MR findings in spinal hemangioblastoma: correlation with symptoms and with angiographic and surgical findings. AJNR Am J Neuroradiol. 2001;22(1):206-217.
16. Cypess AM, Lehman S, Williams G, et al. Identification and importance of brown adipose tissue in adult humans. N Engl J Med. 2009;360(15):1509-1517.
17. Anderson SE, Schwab C, Stauffer E, Banic A, Steinbach LS. Hibernoma: imaging characteristics of a rare benign soft tissue tumor. Skeletal Radiol. 2001;30(10):590-595.
18. Angervall L, Nilsson L, Stener B. Microangiographic and histological studies in 2 cases of hibernoma. Cancer. 1964;17:685-692.
19. Sansom HE, Blunt DM, Moskovic EC. Large retroperitoneal hibernoma—CT findings with pathological correlation. Clin Radiol. 1999;54(9):625-627.
20. Dursun M, Agayev A, Bakir B, et al. CT and MR characteristics of hibernoma: six cases. Clin Imaging. 2008;32(1):42-47.
21. Ritchie DA, Aniq H, Davies AM, Mangham DC, Helliwell TR. Hibernoma—correlation of histopathology and magnetic-resonance-imaging features in 10 cases. Skeletal Radiol. 2006;35(8):579-589.
22. Lee JC, Gupta A, Saifuddin A, et al. Hibernoma: MRI features in eight consecutive cases. Clin Radiol. 2006;61(12):1029-1034.
23. Chitoku S, Kawai S, Watabe Y, et al. Intradural spinal hibernoma: case report. Surg Neurol. 1998;49(5):509-513.
24. Baskurt E, Padgett DM, Matsumoto JA. Multiple hibernomas in a 1-month-old female infant. AJNR Am J Neuroradiol. 2004;25(8):1443-1445.
25. da Motta AC, Tunkel DE, Westra WH, Yousem DM. Imaging findings of a hibernoma of the neck. AJNR Am J Neuroradiol. 2006;27(8):1658-1659.
26. Cook MA, Stern M, de Siva RD. MRI of a hibernoma. J Comput Assist Tomogr. 1996;20(2):333-335.
27. Murphey MD, Carroll JF, Flemming DJ, Pope TL, Gannon FH, Kransdorf MJ. From the archives of the AFIP: benign musculoskeletal lipomatous lesions. Radiographics. 2004;24(5):1433-1466.
28. Robison S, Rapmund A, Hemmings C, Fulham M, Barry P. False-positive diagnosis of metastasis on positron emission tomography–computed tomography imaging due to hibernoma. J Clin Oncol. 2009;27(6):994-995.
29. Kallas KM, Vaughan L, Haghighi P, Resnick D. Hibernoma of the left axilla; a case report and review of MR imaging. Skeletal Radiol. 2003;32(5):290-294.
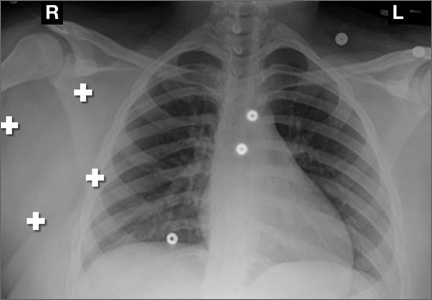
Technique for Lumbar Pedicle Subtraction Osteotomy for Sagittal Plane Deformity in Revision
Pedicle subtraction osteotomies (PSOs) have been used in the treatment of multiple spinal conditions involving a fixed sagittal imbalance, such as degenerative scoliosis, idiopathic scoliosis, posttraumatic deformities, iatrogenic flatback syndrome, and ankylosing spondylitis. The procedure was first described by Thomasen1 for the treatment of ankylosing spondylitis. More recently, multiple centers have reported the expanded use and good success of PSO in the treatment of fixed sagittal imbalance of other etiologies.2,3 According to Bridwell and colleagues,2 lumbar lordosis can be increased 34.1°, and sagittal plumb line can be improved 13.5 cm.
PSO is a complex, extensive surgery most often performed in the revision setting. Multiple authors have described the technique for PSO.4,5 There are significant technical challenges and many complications, including neurologic deficits, pseudarthrosis of adjacent levels, and wound infections.6 Short-term challenges include a large loss of blood, 2.4 L on average, according to Bridwell and colleagues.6 Time of closure of the osteotomy gap is a crucial point in the surgery. Blood loss, often large, slows only after the gap is closed and stabilized.
In this article, we describe a technique in which an additional rod or pedicle screw construct is used at the periosteotomy levels to close the osteotomy gap during PSO and simplify subsequent instrumentation. In addition, we report our experience with the procedure.
Materials and Methods
Seventeen consecutive patients (mean age, 58 years; range, 12-81 years) with fixed sagittal imbalance were treated with lumbar PSO. The indication in all cases was flatback syndrome after previous spinal surgery. Mean follow-up was 13 months. Mean number of prior surgeries was 3. Thirteen PSOs were performed at L3, and 4 were performed at L2.
Radiographic data were collected from before surgery, in the immediate postoperative period, and at final follow-up. All the radiographs were standing films. Established radiographic parameters were measured: thoracic kyphosis from T5 to T12, lumbar lordosis from L1 to S1, PSO angle (1 level above to 1 level below osteotomy level), sagittal plumb line (from center of C7 body to posterosuperior aspect of S1 body), and coronal plumb line (from center of C7 body to center of S1 body).2
Good clinical outcomes in the treatment of spinal disorders require careful attention to the alignment of the spine in the sagittal plane.7,8 When evaluating the preoperative radiographs, we measured and documented pelvic parameters. Figure 1A shows how pelvic incidence was determined. We measured this as the angle between a line drawn from the center of the S1 endplate to the center of the femoral head and the perpendicular off the S1 endplate. Figure 1B shows pelvic tilt as determined by the angle between a line drawn from the center of S1 to the femoral head and a vertical line originating from the center of the femoral head. Figure 1C shows the sacral slope, which we measured as the angle between a line drawn parallel to the endplate of S1 and its intersection with a horizontal line.
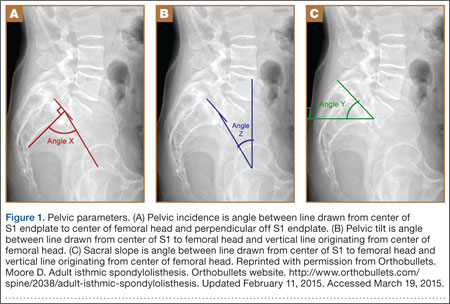
Surgical Technique
The overall surgical technique for PSO has been well described.4,5 Here we describe the “outrigger” modification to osteotomy closure (Figures 2, 3).
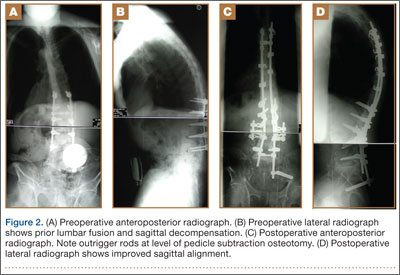
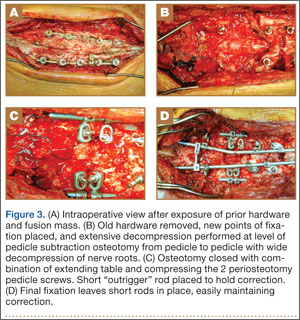
Most of our 17 cases were revisions. In these cases, new fixation points are first established. All fixation points that will be needed for the final fusion are placed. If a pedicle above or below the osteotomy level is not suitable for a screw, it can be skipped.
Wide decompression of the involved level is performed from pedicle to pedicle, ensuring that the nerve roots are completely decompressed. The dissection is then continued around the lateral wall of the vertebral body. While the neural elements are protected with gentle retraction, the pedicle and a portion of the posterior aspect of the vertebral body are removed with a combination of a rongeur and reverse-angle curettes. Resection of the vertebral body can be facilitated by attaching a short rod to the pedicle screws on either side of the osteotomy level and using it to provide gentle distraction.
Once sufficient bone has been removed to close the osteotomy, short rods are placed in the pedicle screws in the level above and the level below the osteotomy site. These rods are attached with offset connectors that allow the rods to be placed lateral to the screws. Before the surgical procedure is started, the patient is positioned on 2 sets of posts separated by the break in the table. The break in the table allows flexion to accommodate the preoperative kyphosis and allows hyperextension to help close the osteotomy site. Now, with the osteotomy site ready for closure, the table is gradually positioned in extension along with a combination of posterior pressure and compression between the pedicle screws above and below the osteotomy. Once the osteotomy is adequately compressed, the short rods are tightened, holding the osteotomy in good position. With the osteotomy held by the short rods and table positioning, decompression of the neural elements is confirmed and hemostasis obtained.
Final instrumentation is then performed with long rods that can bypass the osteotomized levels, allowing for simpler contouring. If desired, a cross connector can be placed between the long rod of the fusion construct and the short rod holding the osteotomy. The rest of the fusion procedure is completed in standard fashion with at least 1 subfascial drain.
Results
Our 17 patients’ results are summarized in the Table. Mean sagittal plumb line improved from 17.7 cm (range, 5.9 to 29 cm) before surgery to 4.5 cm (range, –0.2 to 12.9 cm) after surgery, for a mean improvement of 13.2 cm. At final follow-up, mean sagittal plumb line was 5.1 cm (range, –1.4 to 10.2 cm).
Mean lumbar lordosis improved from 10° (range, –14° to 34°) before surgery to 49° (range, 36° to 63°) after surgery, for a mean improvement of 39°. Mean PSO angle improved from 3° (range, –36° to 23°) before surgery to 41° (range, 25° to 65°) after surgery, for a mean improvement of 38°. At final follow-up, mean lumbar lordosis remained at 47° (range, 26° to 64°), and mean PSO angle was 39° (range, 24° to 59°).
Mean thoracic kyphosis improved from 18° (range, –8° to 52°) before surgery to 30° (range, 3° to 58°) after surgery, for a mean improvement of 12°. At final follow-up, mean thoracic kyphosis was 31° (range, 2° to 57°).
Fourteen patients did not have complications during the study period. Of the 3 patients with complications, 1 had an early infection, treated effectively with irrigation and débridement and intravenous antibiotics; 1 had a late deep infection, treated with multiple débridements, hardware removal, and, eventually, suppressive antibiotics; and 1 had cauda equina syndrome (caused by extensive scar tissue on the dura, which buckled with restoration of lordosis leading to cord compression), treated with duraplasty, which resulted in full neurologic recovery.
Discussion
In the present series of patients, the described technique for facilitating PSO for correction of sagittal imbalance was effective, and complications were similar to those previously reported.
The benefit of the outrigger construct is that it allows controlled compression of the osteotomy site and can be left in place at time of final instrumentation, locking in compression and correction. Other techniques involve removing the temporary rod and replacing it with final instrumentation4,5—an extra step that complicates instrumentation of the additional levels of the fusion construct and possibly adds pedicle screw stress and contributes to loosening when the new rod is reduced to the pedicle screw. The final long rod construct can bypass the osteotomy levels and allow for simpler instrumentation.
Mean age was 58 years in this series versus 52.4 years in the series reported by Bridwell and colleagues.2 Given the higher mean age of our patients, though no objective measures of bone quality were available, this technique is likely applicable to patients with poor bone quality.
The complications we have reported are in line with those reported in previous series, and maintenance of radiographic parameters at final follow-up indicates that this osteotomy technique allows for solid fusion constructs.
The outrigger technique for controlling PSO closure is an effective method that simplifies instrumentation during a complex revision case.
1. Thomasen E. Vertebral osteotomy for correction of kyphosis in ankylosing spondylitis. Clin Orthop. 1985;(194):142-152.
2. Bridwell KH, Lewis SJ, Lenke LG, Baldus C, Blanke K. Pedicle subtraction osteotomy for the treatment of fixed sagittal imbalance. J Bone Joint Surg Am. 2003;85(3):454-463.
3. Berven SH, Deviren V, Smith JA, Emami A, Hu SS, Bradford DS. Management of fixed sagittal plane deformity: results of the transpedicular wedge resection osteotomy. Spine. 2001;26(18):2036-2043.
4. Bridwell KH, Lewis SJ, Rinella A, Lenke LG, Baldus C, Blanke K. Pedicle subtraction osteotomy for the treatment of fixed sagittal imbalance. Surgical technique. J Bone Joint Surg Am. 2004;86(suppl 1):44-50.
5. Wang MY, Berven SH. Lumbar pedicle subtraction osteotomy. Neurosurgery. 2007;60(2 suppl 1):ONS140-ONS146.
6. Bridwell KH, Lewis SJ, Edwards C, et al. Complications and outcomes of pedicle subtraction osteotomies for fixed sagittal imbalance. Spine. 2003;28(18):2093-2101.
7. Vialle R, Levassor N, Rillardon L, Templier A, Skalli W, Guigui P. Radiographic analysis of the sagittal alignment and balance of the spine in asymptomatic subjects. J Bone Joint Surg Am. 2005;87(2):260-267.
8. Schwab F, Lafage V, Patel A, Farcy JP. Sagittal plane considerations and the pelvis in the adult patient. Spine. 2009;34(17):1828-1833.
Pedicle subtraction osteotomies (PSOs) have been used in the treatment of multiple spinal conditions involving a fixed sagittal imbalance, such as degenerative scoliosis, idiopathic scoliosis, posttraumatic deformities, iatrogenic flatback syndrome, and ankylosing spondylitis. The procedure was first described by Thomasen1 for the treatment of ankylosing spondylitis. More recently, multiple centers have reported the expanded use and good success of PSO in the treatment of fixed sagittal imbalance of other etiologies.2,3 According to Bridwell and colleagues,2 lumbar lordosis can be increased 34.1°, and sagittal plumb line can be improved 13.5 cm.
PSO is a complex, extensive surgery most often performed in the revision setting. Multiple authors have described the technique for PSO.4,5 There are significant technical challenges and many complications, including neurologic deficits, pseudarthrosis of adjacent levels, and wound infections.6 Short-term challenges include a large loss of blood, 2.4 L on average, according to Bridwell and colleagues.6 Time of closure of the osteotomy gap is a crucial point in the surgery. Blood loss, often large, slows only after the gap is closed and stabilized.
In this article, we describe a technique in which an additional rod or pedicle screw construct is used at the periosteotomy levels to close the osteotomy gap during PSO and simplify subsequent instrumentation. In addition, we report our experience with the procedure.
Materials and Methods
Seventeen consecutive patients (mean age, 58 years; range, 12-81 years) with fixed sagittal imbalance were treated with lumbar PSO. The indication in all cases was flatback syndrome after previous spinal surgery. Mean follow-up was 13 months. Mean number of prior surgeries was 3. Thirteen PSOs were performed at L3, and 4 were performed at L2.
Radiographic data were collected from before surgery, in the immediate postoperative period, and at final follow-up. All the radiographs were standing films. Established radiographic parameters were measured: thoracic kyphosis from T5 to T12, lumbar lordosis from L1 to S1, PSO angle (1 level above to 1 level below osteotomy level), sagittal plumb line (from center of C7 body to posterosuperior aspect of S1 body), and coronal plumb line (from center of C7 body to center of S1 body).2
Good clinical outcomes in the treatment of spinal disorders require careful attention to the alignment of the spine in the sagittal plane.7,8 When evaluating the preoperative radiographs, we measured and documented pelvic parameters. Figure 1A shows how pelvic incidence was determined. We measured this as the angle between a line drawn from the center of the S1 endplate to the center of the femoral head and the perpendicular off the S1 endplate. Figure 1B shows pelvic tilt as determined by the angle between a line drawn from the center of S1 to the femoral head and a vertical line originating from the center of the femoral head. Figure 1C shows the sacral slope, which we measured as the angle between a line drawn parallel to the endplate of S1 and its intersection with a horizontal line.
Surgical Technique
The overall surgical technique for PSO has been well described.4,5 Here we describe the “outrigger” modification to osteotomy closure (Figures 2, 3).
Most of our 17 cases were revisions. In these cases, new fixation points are first established. All fixation points that will be needed for the final fusion are placed. If a pedicle above or below the osteotomy level is not suitable for a screw, it can be skipped.
Wide decompression of the involved level is performed from pedicle to pedicle, ensuring that the nerve roots are completely decompressed. The dissection is then continued around the lateral wall of the vertebral body. While the neural elements are protected with gentle retraction, the pedicle and a portion of the posterior aspect of the vertebral body are removed with a combination of a rongeur and reverse-angle curettes. Resection of the vertebral body can be facilitated by attaching a short rod to the pedicle screws on either side of the osteotomy level and using it to provide gentle distraction.
Once sufficient bone has been removed to close the osteotomy, short rods are placed in the pedicle screws in the level above and the level below the osteotomy site. These rods are attached with offset connectors that allow the rods to be placed lateral to the screws. Before the surgical procedure is started, the patient is positioned on 2 sets of posts separated by the break in the table. The break in the table allows flexion to accommodate the preoperative kyphosis and allows hyperextension to help close the osteotomy site. Now, with the osteotomy site ready for closure, the table is gradually positioned in extension along with a combination of posterior pressure and compression between the pedicle screws above and below the osteotomy. Once the osteotomy is adequately compressed, the short rods are tightened, holding the osteotomy in good position. With the osteotomy held by the short rods and table positioning, decompression of the neural elements is confirmed and hemostasis obtained.
Final instrumentation is then performed with long rods that can bypass the osteotomized levels, allowing for simpler contouring. If desired, a cross connector can be placed between the long rod of the fusion construct and the short rod holding the osteotomy. The rest of the fusion procedure is completed in standard fashion with at least 1 subfascial drain.
Results
Our 17 patients’ results are summarized in the Table. Mean sagittal plumb line improved from 17.7 cm (range, 5.9 to 29 cm) before surgery to 4.5 cm (range, –0.2 to 12.9 cm) after surgery, for a mean improvement of 13.2 cm. At final follow-up, mean sagittal plumb line was 5.1 cm (range, –1.4 to 10.2 cm).
Mean lumbar lordosis improved from 10° (range, –14° to 34°) before surgery to 49° (range, 36° to 63°) after surgery, for a mean improvement of 39°. Mean PSO angle improved from 3° (range, –36° to 23°) before surgery to 41° (range, 25° to 65°) after surgery, for a mean improvement of 38°. At final follow-up, mean lumbar lordosis remained at 47° (range, 26° to 64°), and mean PSO angle was 39° (range, 24° to 59°).
Mean thoracic kyphosis improved from 18° (range, –8° to 52°) before surgery to 30° (range, 3° to 58°) after surgery, for a mean improvement of 12°. At final follow-up, mean thoracic kyphosis was 31° (range, 2° to 57°).
Fourteen patients did not have complications during the study period. Of the 3 patients with complications, 1 had an early infection, treated effectively with irrigation and débridement and intravenous antibiotics; 1 had a late deep infection, treated with multiple débridements, hardware removal, and, eventually, suppressive antibiotics; and 1 had cauda equina syndrome (caused by extensive scar tissue on the dura, which buckled with restoration of lordosis leading to cord compression), treated with duraplasty, which resulted in full neurologic recovery.
Discussion
In the present series of patients, the described technique for facilitating PSO for correction of sagittal imbalance was effective, and complications were similar to those previously reported.
The benefit of the outrigger construct is that it allows controlled compression of the osteotomy site and can be left in place at time of final instrumentation, locking in compression and correction. Other techniques involve removing the temporary rod and replacing it with final instrumentation4,5—an extra step that complicates instrumentation of the additional levels of the fusion construct and possibly adds pedicle screw stress and contributes to loosening when the new rod is reduced to the pedicle screw. The final long rod construct can bypass the osteotomy levels and allow for simpler instrumentation.
Mean age was 58 years in this series versus 52.4 years in the series reported by Bridwell and colleagues.2 Given the higher mean age of our patients, though no objective measures of bone quality were available, this technique is likely applicable to patients with poor bone quality.
The complications we have reported are in line with those reported in previous series, and maintenance of radiographic parameters at final follow-up indicates that this osteotomy technique allows for solid fusion constructs.
The outrigger technique for controlling PSO closure is an effective method that simplifies instrumentation during a complex revision case.
1. Thomasen E. Vertebral osteotomy for correction of kyphosis in ankylosing spondylitis. Clin Orthop. 1985;(194):142-152.
2. Bridwell KH, Lewis SJ, Lenke LG, Baldus C, Blanke K. Pedicle subtraction osteotomy for the treatment of fixed sagittal imbalance. J Bone Joint Surg Am. 2003;85(3):454-463.
3. Berven SH, Deviren V, Smith JA, Emami A, Hu SS, Bradford DS. Management of fixed sagittal plane deformity: results of the transpedicular wedge resection osteotomy. Spine. 2001;26(18):2036-2043.
4. Bridwell KH, Lewis SJ, Rinella A, Lenke LG, Baldus C, Blanke K. Pedicle subtraction osteotomy for the treatment of fixed sagittal imbalance. Surgical technique. J Bone Joint Surg Am. 2004;86(suppl 1):44-50.
5. Wang MY, Berven SH. Lumbar pedicle subtraction osteotomy. Neurosurgery. 2007;60(2 suppl 1):ONS140-ONS146.
6. Bridwell KH, Lewis SJ, Edwards C, et al. Complications and outcomes of pedicle subtraction osteotomies for fixed sagittal imbalance. Spine. 2003;28(18):2093-2101.
7. Vialle R, Levassor N, Rillardon L, Templier A, Skalli W, Guigui P. Radiographic analysis of the sagittal alignment and balance of the spine in asymptomatic subjects. J Bone Joint Surg Am. 2005;87(2):260-267.
8. Schwab F, Lafage V, Patel A, Farcy JP. Sagittal plane considerations and the pelvis in the adult patient. Spine. 2009;34(17):1828-1833.