User login
Colorectal cancer burden rises in younger age groups
Current trends in the incidence and mortality of colorectal cancer (CRC) in the United States suggest CRC will become a disease that largely affects young and middle-aged adults, according to a report published in CA: A Cancer Journal for Clinicians.
As the second leading cause of cancer-related death in the United States, and with modifiable risk factors accounting for over 50% of cases and deaths, CRC is largely a preventable disease, explained study author Rebecca L. Siegel, of the American Cancer Society, and colleagues.
According to the investigators, CRC incidence dropped by 3.3% per year from 2011 through 2016 among individuals aged 65 years or older, but the opposite was observed for those aged 50-64 years, with rates increasing by 1% per year. The increase was even greater for those younger than 50 years, with an increase of 2.2% per year.
The CRC incidence from 2012 through 2016 was highest among Alaska Natives (89 cases per 100,000 persons) and lowest among Asian/Pacific Islanders (30 cases per 100,000 persons).
“CRC has been the most commonly diagnosed cancer in Alaska Natives since the early 1970s for reasons that are unknown but may include a higher prevalence of risk factors,” the investigators wrote.
The risk of developing CRC is related to several factors, including obesity, vitamin D deficiency, diabetes, smoking, and other dietary factors, the team further explained.
Among those aged 65 years or older, CRC death rates decreased by 3% per year from 2008 through 2017. For those aged 50-64 years, death rates dropped by 0.6% per year. In contrast, death rates rose by 1.3% per year for those younger than 50 years.
“The uptick in young adults, which is most rapid among non-Hispanic whites (2% per year), began around 2004 and was preceded by declines of 1% to 2% per year since at least 1975,” the investigators wrote.
The reduction in incidence and mortality among older adults is partially attributable to higher uptake of CRC screening. According to recent data, CRC screening rates were lower for those aged 50-64 years compared with individuals aged 65 years and older.
Based on current recommendations from the American Cancer Society, CRC screening should begin at age 45, with some higher-risk patients starting at age 40.
“Progress against CRC can be accelerated by increasing access to guideline-recommended screening and high quality treatment, particularly among Alaska Natives, and elucidating causes for rising incidence in young and middle-aged adults,” the investigators concluded.
The authors disclosed financial affiliations with the American Cancer Society, which funded the study, as well as Array Biopharma, Bayer, RGenix, Tesaro, and Seattle Genetics.
SOURCE: Siegel RL et al. CA Cancer J Clin. 2020 Mar 5. doi: 10.3322/caac.21601.
FROM CA: A CANCER JOURNAL FOR CLINICIANS
Sometimes medication is enough for a Crohn’s abscess
MAUI, HAWAII – If an intra-abdominal abscess in a recently diagnosed Crohn’s disease patient is less than 6 cm across with no downstream stenosis, involves only a short segment of bowel, and the patient has no perianal disease, then infliximab and azathioprine after drainage and antibiotics might be enough to heal it, according to Miguel Regueiro, MD, chair of the department of gastroenterology, hepatology, and nutrition at the Cleveland Clinic.

That will work in about 30% of patients who hit the mark; the rest will eventually need surgery, said Dr. Regueiro, a clinical researcher who has worked extensively with surgical GI patients and is also a coauthor on the American College of Gastroenterology 2018 Crohn’s disease guidelines (Am J Gastroenterol. 2018 Apr;113[4]:481-517).
Intra-abdominal abscesses are common in Crohn’s, usually from an inflammation-induced fistula or sinus in the small intestines that spills luminal contents into the abdominal cavity. Drainage and antibiotics are first line, but then there’s the question of who needs to go to the operating room and who doesn’t.
It has to do with “how much the hole in the intestines is actually reversible. Evidence of a stricture is of paramount importance. If you have a stricture below a fistula and prestenotic dilatation, that’s a high-pressure zone.” It’s a “fixed complication that, in my opinion, no medication is ever going to treat,” he said at the Gastroenterology Updates, IBD, Liver Disease Conference.
“Infliximab is still probably the best medicine for fistulizing disease,” so Dr. Regueiro opts for that if patients haven’t been on it before, in combination with an immunomodulator, generally azathioprine at half the standard dose, to prevent patients from forming antibodies to the infliximab.
When patients do go to the operating room, there is a good chance they will end up with a temporary ostomy, and definitely so if the abscess can’t be drained completely to prevent spillage. The risk of dehiscence and other complications is too great for primary anastomosis.
“I mentally prepare my patients for that; I tell them up front. I never guarantee that they are not going to have an ostomy bag,” Dr. Regueiro said.
He also said abscess formation isn’t necessarily a sign the biologic patients were on before has failed, especially if they were only on it for 6 months or so. More likely, “the disease was too far gone at that point” for short-term treatment to have much of an effect.
So he’s often likely to continue patients on the same biologic after surgery. “We’ve done a lot of study on” this and have “actually found that” patients do well with the approach. He will switch treatment, however, if they otherwise no longer seem to respond to a biologic they have been taking a while, despite adequate serum levels.
There’s no need to delay surgery for patients on biologics. “If they get a biologic the day before, they can still go to the [operating room]. We are not seeing increased postop complications, infections, or wound dehiscence,” he said.
Dr. Regueiro generally restarts biologics 2-4 weeks after surgery, which is enough time to know if there is going to be a surgical complication but not so long that patients will have a Crohn’s relapse. He restarts the maintenance dose, as “it’s not necessary to reinduct patients after such a short break,” he said.
He also noted that opioids and steroids should be avoided with Crohn’s abscesses. Opioids increase the risk of ileus, and steroids the risk of sepsis.
Dr. Regueiro reported no relevant disclosures.
MAUI, HAWAII – If an intra-abdominal abscess in a recently diagnosed Crohn’s disease patient is less than 6 cm across with no downstream stenosis, involves only a short segment of bowel, and the patient has no perianal disease, then infliximab and azathioprine after drainage and antibiotics might be enough to heal it, according to Miguel Regueiro, MD, chair of the department of gastroenterology, hepatology, and nutrition at the Cleveland Clinic.
That will work in about 30% of patients who hit the mark; the rest will eventually need surgery, said Dr. Regueiro, a clinical researcher who has worked extensively with surgical GI patients and is also a coauthor on the American College of Gastroenterology 2018 Crohn’s disease guidelines (Am J Gastroenterol. 2018 Apr;113[4]:481-517).
Intra-abdominal abscesses are common in Crohn’s, usually from an inflammation-induced fistula or sinus in the small intestines that spills luminal contents into the abdominal cavity. Drainage and antibiotics are first line, but then there’s the question of who needs to go to the operating room and who doesn’t.
It has to do with “how much the hole in the intestines is actually reversible. Evidence of a stricture is of paramount importance. If you have a stricture below a fistula and prestenotic dilatation, that’s a high-pressure zone.” It’s a “fixed complication that, in my opinion, no medication is ever going to treat,” he said at the Gastroenterology Updates, IBD, Liver Disease Conference.
“Infliximab is still probably the best medicine for fistulizing disease,” so Dr. Regueiro opts for that if patients haven’t been on it before, in combination with an immunomodulator, generally azathioprine at half the standard dose, to prevent patients from forming antibodies to the infliximab.
When patients do go to the operating room, there is a good chance they will end up with a temporary ostomy, and definitely so if the abscess can’t be drained completely to prevent spillage. The risk of dehiscence and other complications is too great for primary anastomosis.
“I mentally prepare my patients for that; I tell them up front. I never guarantee that they are not going to have an ostomy bag,” Dr. Regueiro said.
He also said abscess formation isn’t necessarily a sign the biologic patients were on before has failed, especially if they were only on it for 6 months or so. More likely, “the disease was too far gone at that point” for short-term treatment to have much of an effect.
So he’s often likely to continue patients on the same biologic after surgery. “We’ve done a lot of study on” this and have “actually found that” patients do well with the approach. He will switch treatment, however, if they otherwise no longer seem to respond to a biologic they have been taking a while, despite adequate serum levels.
There’s no need to delay surgery for patients on biologics. “If they get a biologic the day before, they can still go to the [operating room]. We are not seeing increased postop complications, infections, or wound dehiscence,” he said.
Dr. Regueiro generally restarts biologics 2-4 weeks after surgery, which is enough time to know if there is going to be a surgical complication but not so long that patients will have a Crohn’s relapse. He restarts the maintenance dose, as “it’s not necessary to reinduct patients after such a short break,” he said.
He also noted that opioids and steroids should be avoided with Crohn’s abscesses. Opioids increase the risk of ileus, and steroids the risk of sepsis.
Dr. Regueiro reported no relevant disclosures.
EXPERT ANALYSIS FROM GUILD 2020
CRC task force updates colonoscopy follow-up guidance
The U.S. Multi-Society Task Force on Colorectal Cancer (CRC) recently updated recommendations for patient follow-up after colonoscopy and polypectomy.
The new guidance was based on advancements in both research and technology since the last recommendations were published in 2012, reported lead author Samir Gupta, MD, AGAF, of the University of California, San Diego, and colleagues.
“[Since 2012,] a number of articles have been published on risk of CRC based on colonoscopy findings and patient characteristics, as well as the potential impact of screening and surveillance colonoscopy on outcomes, such as incident CRC and polyps,” the investigators wrote in Gastroenterology. “Further, recent studies increasingly reflect the modern era of colonoscopy with more awareness of the importance of quality factors (e.g., adequate bowel preparation, cecal intubation, adequate adenoma detection, and complete polyp resection), and utilization of state of the art technologies (e.g., high-definition colonoscopes).”
The task force, which comprised the American College of Gastroenterology, the American Gastroenterological Association, and the American Society of Gastrointestinal Endoscopy, identified key topics using PICO (patient, intervention, comparison, and outcome) questions before conducting a comprehensive literature review that included 136 articles. Based on these findings, two task force members generated recommendations that were further refined through consensus discussion. The recommendations were copublished in the March issues of the American Journal of Gastroenterology, Gastroenterology, and Gastrointestinal Endoscopy.
According to Dr. Gupta and colleagues, some of the new recommendations, particularly those that advise less stringent follow-up, may encounter resistance from various stakeholders.
“Patients, primary care physicians, and colonoscopists may have concerns about lengthening a previously recommended interval, and will need to engage in shared decision making regarding whether to lengthen the follow-up interval based upon the guidance here or utilize the recommendation made at the time of the prior colonoscopy,” the task force wrote.
The most prominent recommendations of this kind concern patients who undergo removal of tubular adenomas less than 10 mm in size. For patients who have 1-2 of these adenomas removed, the task force now recommends follow-up after 7-10 years, instead of the previously recommended interval of 5-10 years.
“[This decision was] based on the growing body of evidence to support low risk for metachronous advanced neoplasia,” the task force wrote. “In this population, the risk for metachronous advanced neoplasia is similar to that for individuals with no adenoma. Importantly, the observed risk for fatal CRC among individuals with 1-10 adenomas less than 10 mm is lower than average for the general population.”
Along similar lines, patients who undergo removal of 3-4 small adenomas now have a recommended 3-5 year follow-up window, instead of the previously strict recommendation for follow-up at 3 years.
But not all of the new guidance is less stringent. While the task force previously recommended a follow-up period of less than 3 years after removal of more than 10 adenomas, they now recommend follow-up at 1 year. This change was made to simplify guidance, the investigators wrote, noting that the evidence base in this area “has not been markedly strengthened” since 2012.
Compared with the old guidance, the updated publication offers more detailed recommendations for follow-up after removal of serrated polyps. On this topic, 10 clinical scenarios are presented, with follow-up ranging from 6 months after piecemeal resection of a sessile serrated polyp greater than 20 mm to 10 years after removal of 20 or fewer hyperplastic polyps less than 10 mm that were located in the rectum or sigmoid colon. Incidentally, these two recommendations are strong and based on moderate evidence, whereas the remaining recommendations for serrated polyps are weak and based on very-low-quality evidence.
Because of such knowledge gaps, the investigators emphasized the need for more data. The publication includes extensive discussion of pressing research topics and appropriate methods of investigation.
“Our review highlights several opportunities for research to clarify risk stratification and management of patients post-polypectomy,” the task force wrote. “In order to optimize risk-reduction strategies, the mechanisms driving metachronous advanced neoplasia after baseline polypectomy and their relative frequency need to be better understood through studies that include large numbers of patients with interval cancers and/or advanced neoplasia after baseline polypectomy. Mechanisms may include new/incident growth, incomplete baseline resection, and missed neoplasia; each of these potential causes may require different interventions for improvement.”
The task force also suggested that some basic questions beyond risk stratification remain unanswered, such as the impact of surveillance on CRC incidence and mortality.
“Such evidence is needed given the increasing proportion of patients who are having adenomas detected as part of increased participation in CRC screening,” the task force wrote.
Other suggested topics of investigation include age-related analyses that incorporate procedural risk, cost-effectiveness studies, and comparisons of nonendoscopic methods of surveillance, such as fecal immunochemical testing.
The study was funded by the National Institutes of Health and the Department of Veterans Affairs. The investigators reported relationships with Covidien, Ironwood, Medtronic, and others.
SOURCE: Gupta S et al. Gastroenterology. 2020 Feb 7. doi: 10.1053/j.gastro.2019.10.026.
FROM GASTROENTEROLOGY
U.S. Multi-Society Task Force publishes polypectomy guidance
The U.S. Multi-Society Task Force (USMSTF) on Colorectal Cancer recently published recommendations for endoscopic removal of precancerous colorectal lesions.
According to lead author Tonya Kaltenbach, MD, of the University of California, San Francisco, and fellow panelists, the publication aims to improve complete resection rates, which can vary widely between endoscopists; almost one out of four lesions (22.7%) may be incompletely removed by some practitioners, leading to higher rates of colorectal cancer.
“[A]lthough the majority (50%) of postcolonoscopy colon cancers [are] likely due to missed lesions, close to one-fifth of incident cancers [are] related to incomplete resection,” the panelists wrote in Gastroenterology, referring to a pooled analysis of eight surveillance studies.
The panelists’ recommendations, which were based on both evidence and clinical experience, range from specific polyp removal techniques to guidance for institution-wide quality assurance of polypectomies. Each statement is described by both strength of recommendation and level of evidence, the latter of which was determined by Grading of Recommendations, Assessment, Development, and Evaluation Ratings of Evidence (GRADE) criteria. Recommendations were written by a panel of nine experts and approved by the governing boards of the three societies they represented – the American College of Gastroenterology, the American Gastroenterological Association, and the American Society for Gastrointestinal Endoscopy. The recommendations were copublished in the March issues of the American Journal of Gastroenterology, Gastroenterology, and Gastrointestinal Endoscopy.
Central to the publication are recommended polypectomy techniques for specific types of lesions.
“Polypectomy techniques vary widely in clinical practice,” the panelists wrote. “They are often driven by physician preference based on how they were taught and on trial and error, due to the lack of standardized training and the paucity of published evidence. In the past decade, evidence has evolved on the superiority of specific methods.”
“Optimal techniques encompass effectiveness, safety, and efficiency,” they wrote. “Colorectal lesion characteristics, including location, size, morphology, and histology, influence the optimal removal method.”
For lesions up to 9 mm, the panelists recommended cold snare polypectomy “due to high complete resection rates and safety profile.” In contrast, they recommended against both cold and hot biopsy forceps, which have been associated with higher rates of incomplete resection. Furthermore, they cautioned that hot biopsy forceps may increase risks of complications and produce inadequate tissue samples for histopathology.
For nonpedunculated lesions between 10 and 19 mm, guidance is minimal. The panelists recommended cold or hot snare polypectomy, although this statement was conditional and based on low-quality evidence.
Recommendations were more extensive for large nonpedunculated lesions (at least 20 mm). For such lesions, the panelists strongly recommended endoscopic mucosal resection (EMR). They emphasized that large lesions should be removed in the fewest possible pieces by an appropriately experienced endoscopist during a single colonoscopy session. The panelists recommended the use of a viscous injection solution with a contrast agent and adjuvant thermal ablation of the post-EMR margin. They recommended against the use of tattoo as a submucosal injection solution, and ablation of residual lesion tissue that is endoscopically visible. Additional recommendations for large lesions, including prophylactic closure of resection defects and coagulation techniques, were based on low-quality evidence.
For pedunculated lesions greater than 10 mm, the panelists recommended hot snare polypectomy. For pedunculated lesions with a head greater than 20 mm or a stalk thickness greater than 5 mm, they recommended prophylactic mechanical ligation.
Beyond lesion assessment and removal, recommendations addressed lesion marking, equipment, surveillance, and quality of polypectomy.
Concerning quality, the panelists recommended that endoscopists participate in a quality assurance program that documents adverse events, and that institutions use standardized polypectomy competency assessments, such as Cold Snare Polypectomy Competency Assessment Tool and/or Direct Observation of Polypectomy Skills.
“Focused teaching is needed to ensure the optimal endoscopic management of colorectal lesions,” the panelists wrote. They went on to suggest that “development and implementation of polypectomy quality metrics may be necessary to optimize practice and outcomes.”
“For example, the type of resection method used for the colorectal lesion removal in the procedure report should be documented, and the inclusion of adequate resection technique as a quality indicator in colorectal cancer screening programs should be considered,” they wrote. “Adverse events, including bleeding, perforation, hospital admissions, and the number of benign colorectal lesions referred for surgical management, should be measured and reported. Finally, standards for pathology preparation and reporting of lesions suspicious for submucosal invasion should be in place to provide accurate staging and management.”
The investigators reported relationships with Covidien, Ironwood, Medtronic, and others.
SOURCE: Kaltenbach T et al. Gastroenterology. 2020 Jan 18. doi: 10.1053/j.gastro.2019.12.018.
FROM GASTROENTEROLOGY
ERAS takes its place in IBD surgery
AUSTIN, TEX. – Enhanced recovery after surgery (ERAS) protocols have been around for decades, but typically excluded patients having surgery for inflammatory bowel disease (IBD). However, recent studies have shown strategies to optimize these patients, including presurgery carbohydrate loading and early postsurgery feeding, can improve outcomes, according to a review of evidence presented at the annual congress of the Crohn’s & Colitis Foundation and the American Gastroenterological Association.

“It’s really important that we implement strategies to help mitigate the impact that malnutrition is going to have on our perioperative patients, and one of the ways we do that is by using an ERAS or enhanced recovery after surgery protocol,” said Kelly Issokson, MS, RD, of Cedars-Sinai Medical Center, Los Angeles. She noted that patients with IBD are five times more likely to be malnourished than non-IBD patients, and those with fistulizing Crohn’s disease and bowel resections are at greatest risk (Inflamm Bowel Dis. 2008;14:1139-46).
“I constantly see patients who are kept NPO [nothing by mouth] 12 or 24 hours before surgery, maybe even longer sometimes, unfortunately,” she said. “We should really be minimizing that NPO to help mitigate the catabolic effect that surgery has on our patients and help them recover more quickly.”
To screen surgery patients for nutrition risk, Ms. Issokson said that gastroenterologists can ask two questions from the malnutrition screening tool: Did the patient have recent unintentional weight loss, and is the patient eating less because of poor appetite? A yes to either question merits referral to a registered dietician. Malnutrition, weight loss of 5%-10% of total body weight, and sarcopenia are predictors of surgical complications for IBD patients, the latter an independent predictor in patients aged 40 years and older.
The ERAS protocol involves optimizing preoperative and postoperative nutrition, she said. It has been linked with improved outcomes in elective colorectal surgery (World J Surg. 2014;38:1531-41), although the evidence in IBD isn’t as robust. She cited a retrospective study reported at the 2019 annual Digestive Disease Week of patients with Crohn’s disease that found no difference in readmissions, complications, or reoperations between ERAS and standard-care patients.
Preoperative nutrition optimization in ERAS involves anemia and fluid management, oral nutrition supplementation, and – based on European Society for Clinical Nutrition and Metabolism (ESPEN) 2017 guidelines – delaying the operation where possible if the patient is malnourished. “Patients who receive preoperative nutrition support have been shown to have better outcomes postoperatively,” Ms. Issokson said, citing a meta-analysis of 1,111 Crohn’s disease patients that reported the complication rate was 20% in patients on nutrition support versus 60% for those on standard care; in those on enteral nutrition, the disparity was more pronounced: 21% versus 73% (Eur J Gastro Hep. 2018;30:997-1002).
Gastroenterologists should not be afraid of implementing total parenteral nutrition (TPN) perioperatively in these patients, Ms. Issokson said. “This can really help to improve outcomes and quality of life in our patients, and it’s something that we really should not shy away from,” she added in an interview. “If our patients are malnourished and meet the criteria for TPN, then we should really not be withholding it.” Patients with severe IBD who are not absorbing from their gut and can’t meet 60% of their needs by mouth are prime candidates for TPN, she said, referencing a 2019 study that reported that preoperative TPN in malnourished IBD patients resulted in a rate of overall noninfectious complications half that of no-TPN patients: 8.3% versus 16.8% (Gastroenterol Rep. 2019 Apr;7:107-14).
Carbohydrate loading before surgery is a big part of ERAS in these patients. “Surgery has a huge impact on the catabolic state of a patient,” Ms. Issokson said. “It’s similar to running a marathon; you wouldn’t go out and run a marathon without fueling up the night before with a whole bunch of carbohydrates. So we use this same strategy in our surgical patients.”
ERAS society guidelines call for 100 g of carbohydrates the night before and 50 g 2 hours before surgery in the form of a clear liquid beverage, along with permitting a light meal up to 6 hours before, with exceptions in gastroparesis, motility disorders, and emergency surgery.
Another key component of ERAS in IBD is early postoperative feeding. “Postoperatively we want to feed our patients as soon as possible,” Ms. Issokson said. ESPEN guidelines call for feeding patients with new nondiverted colorectal anastomosis within 4 hours. “Studies show that patients aren’t able to eat enough calories to help them recover postoperatively, so implementing an oral nutrition supplement might be helpful there,” she added.
Ms. Issokson is a Crohn’s & Colitis Foundation board member, and disclosed financial relationships with Orgain, RMEI, and Medscape.
SOURCE: Issokson K et al. Crohn’s & Colitis Congress 2020, Session Sp83.
AUSTIN, TEX. – Enhanced recovery after surgery (ERAS) protocols have been around for decades, but typically excluded patients having surgery for inflammatory bowel disease (IBD). However, recent studies have shown strategies to optimize these patients, including presurgery carbohydrate loading and early postsurgery feeding, can improve outcomes, according to a review of evidence presented at the annual congress of the Crohn’s & Colitis Foundation and the American Gastroenterological Association.
“It’s really important that we implement strategies to help mitigate the impact that malnutrition is going to have on our perioperative patients, and one of the ways we do that is by using an ERAS or enhanced recovery after surgery protocol,” said Kelly Issokson, MS, RD, of Cedars-Sinai Medical Center, Los Angeles. She noted that patients with IBD are five times more likely to be malnourished than non-IBD patients, and those with fistulizing Crohn’s disease and bowel resections are at greatest risk (Inflamm Bowel Dis. 2008;14:1139-46).
“I constantly see patients who are kept NPO [nothing by mouth] 12 or 24 hours before surgery, maybe even longer sometimes, unfortunately,” she said. “We should really be minimizing that NPO to help mitigate the catabolic effect that surgery has on our patients and help them recover more quickly.”
To screen surgery patients for nutrition risk, Ms. Issokson said that gastroenterologists can ask two questions from the malnutrition screening tool: Did the patient have recent unintentional weight loss, and is the patient eating less because of poor appetite? A yes to either question merits referral to a registered dietician. Malnutrition, weight loss of 5%-10% of total body weight, and sarcopenia are predictors of surgical complications for IBD patients, the latter an independent predictor in patients aged 40 years and older.
The ERAS protocol involves optimizing preoperative and postoperative nutrition, she said. It has been linked with improved outcomes in elective colorectal surgery (World J Surg. 2014;38:1531-41), although the evidence in IBD isn’t as robust. She cited a retrospective study reported at the 2019 annual Digestive Disease Week of patients with Crohn’s disease that found no difference in readmissions, complications, or reoperations between ERAS and standard-care patients.
Preoperative nutrition optimization in ERAS involves anemia and fluid management, oral nutrition supplementation, and – based on European Society for Clinical Nutrition and Metabolism (ESPEN) 2017 guidelines – delaying the operation where possible if the patient is malnourished. “Patients who receive preoperative nutrition support have been shown to have better outcomes postoperatively,” Ms. Issokson said, citing a meta-analysis of 1,111 Crohn’s disease patients that reported the complication rate was 20% in patients on nutrition support versus 60% for those on standard care; in those on enteral nutrition, the disparity was more pronounced: 21% versus 73% (Eur J Gastro Hep. 2018;30:997-1002).
Gastroenterologists should not be afraid of implementing total parenteral nutrition (TPN) perioperatively in these patients, Ms. Issokson said. “This can really help to improve outcomes and quality of life in our patients, and it’s something that we really should not shy away from,” she added in an interview. “If our patients are malnourished and meet the criteria for TPN, then we should really not be withholding it.” Patients with severe IBD who are not absorbing from their gut and can’t meet 60% of their needs by mouth are prime candidates for TPN, she said, referencing a 2019 study that reported that preoperative TPN in malnourished IBD patients resulted in a rate of overall noninfectious complications half that of no-TPN patients: 8.3% versus 16.8% (Gastroenterol Rep. 2019 Apr;7:107-14).
Carbohydrate loading before surgery is a big part of ERAS in these patients. “Surgery has a huge impact on the catabolic state of a patient,” Ms. Issokson said. “It’s similar to running a marathon; you wouldn’t go out and run a marathon without fueling up the night before with a whole bunch of carbohydrates. So we use this same strategy in our surgical patients.”
ERAS society guidelines call for 100 g of carbohydrates the night before and 50 g 2 hours before surgery in the form of a clear liquid beverage, along with permitting a light meal up to 6 hours before, with exceptions in gastroparesis, motility disorders, and emergency surgery.
Another key component of ERAS in IBD is early postoperative feeding. “Postoperatively we want to feed our patients as soon as possible,” Ms. Issokson said. ESPEN guidelines call for feeding patients with new nondiverted colorectal anastomosis within 4 hours. “Studies show that patients aren’t able to eat enough calories to help them recover postoperatively, so implementing an oral nutrition supplement might be helpful there,” she added.
Ms. Issokson is a Crohn’s & Colitis Foundation board member, and disclosed financial relationships with Orgain, RMEI, and Medscape.
SOURCE: Issokson K et al. Crohn’s & Colitis Congress 2020, Session Sp83.
REPORTING FROM THE CROHN’S & COLITIS CONGRESS
Mailed fecal testing may catch more cancer than endoscopic screening
On a population level, mailed fecal immunohistochemical tests (FITs) may catch more cases of advanced neoplasia than endoscopic methods, based on a Dutch screening study that invited more than 30,000 people to participate.
, reported lead author Esmée J. Grobbee, MD, of Erasmus University Medical Centre in Rotterdam, the Netherlands, and colleagues.
In addition to high participation, previous research has shown that successful FIT screening depends upon continued adherence to the screening program, the investigators wrote in Clinical Gastroenterology and Hepatology. They noted that, in the present study, just two rounds of FIT were needed to outperform endoscopic methods, and that these comparative findings are a first for the field.
“No literature is available on the comparison between endoscopic screening strategies and multiple rounds of FIT screening,” the investigators wrote. “It is of key importance for policy makers to know the impact of different screening programs over multiple rounds with long-term follow-up.”
To this end, the investigators invited 30,052 screening-naive people in the Netherlands to participate in the present study. Each invitation was for one of three groups: once-only colonoscopy, once-only flexible sigmoidoscopy, or four rounds of FIT. All individuals received an advanced notification by mail followed 2 weeks later by a more substantial information kit (and first FIT test when applicable). If these steps received no response, a reminder was sent 6 weeks later.
Participants in the FIT group received one test every 2 years. Patients who had a positive FIT (hemoglobin concentration of at least 10 mcg Hb/g feces) were scheduled for a colonoscopy. Similarly, colonoscopies were performed in patients who had concerning findings on flexible sigmoidoscopy (e.g., sessile serrated adenoma. This sequential system reduced the relative number of colonoscopies in these two groups; colonoscopy rates in the FIT group and flexible sigmoidoscopy group were 13% and 3%, respectively, compared with the 24% participation rate in the colonoscopy group.
At a population level, FIT screening had the highest advanced neoplasia detection rate, at 4.5%, compared with 2.3% and 2.2% for screening by sigmoidoscopy and colonoscopy, respectively.
“In the intention-to-screen analysis, FIT already detected significantly more advanced neoplasia and colorectal cancer (CRC) after only 2 rounds of FIT, and this difference increased over rounds,” the investigators noted.
Again in the intention-to-screen population, mailed FIT detected three times as many cases of CRC than either of the other two groups (0.6% vs. 0.2% for both). In contrast, colonoscopy and sigmoidoscopy had higher detection rates for nonadvanced adenomas, at 5.6% and 3.7%, respectively, compared with 3.2% for FIT, although the investigators noted that nonadvanced adenomas are “of uncertain clinical importance.” Sessile adenoma detection rates were similar across all three groups.
The as-screened analysis revealed higher detection rates of advanced neoplasia for colonoscopy (9.1%), compared with sigmoidoscopy (7.4%) and FIT (6.1%). In the same analysis, detection rates of colorectal cancer (CRC) were comparable across all three groups.
According to the investigators, the CRC-related findings require careful interpretation.
“Comparing CRC detection rates of FIT and endoscopic screening is complex … because CRCs detected in FIT screening could in theory have been prevented in a once-only colonoscopy by the removal of adenomas,” they wrote.
Still, the key takeaway of the study – that FIT screening was the most effective strategy – may have practical implications on a global scale, according to the investigators.
“Because many countries are considering implementing screening programs, the findings of this study aid in deciding on choice of screening strategies worldwide, which is based on expected participation rates and available colonoscopy resources,” they wrote.
The study was funded by the Netherlands Organization for Health Research and Development. The investigators disclosed no conflicts of interest.
SOURCE: Grobbee EJ et al. Clin Gastro Hepatol. 2019 Aug 13. doi: 10.1016/j.cgh.2019.08.015.
FROM CLINICAL GASTROENTEROLOGY AND HEPATOLOGY
Management of Patients With Treatment-Resistant Metastatic Prostate Cancer (FULL)
Sequencing Therapies
Mark Klein, MD. The last few years, there have been several new trials in prostate cancer for people in a metastatic setting or more advanced local setting, such as the STAMPEDE, LATITUDE, and CHAARTED trials.1-4 In addition, recently a few trials have examined apalutamide and enzalutamide for people who have had PSA (prostate-specific antigen) levels rapidly rising within about 10 months or so. One of the questions that arises is, how do we wrap our heads around sequencing these therapies. Is there a sequence that we should be doing and thinking about upfront and how do the different trials compare?
Julie Graff, MD. It just got more complicated. There was news today (December 20, 2018) that using enzalutamide early on in newly diagnosed metastatic prostate cancer may have positive results. It is not yet approved by the US Food and Drug Administration (FDA), but for patients who present with metastatic prostate cancer, we may have 4 potential treatments. We could have androgen deprivation therapy (ADT) alone, ADT plus docetaxel, enzalutamide, or abiraterone.
When I see patients in this situation, I talk to them about their options, the pros and cons of each option, and try to cover all the trials that look at these combinations. It can be quite a long visit. I talk to the patient about who benefits most, whether it is patients with high-risk factors or high-volume cancers. Also, I talk with the patient about all the adverse effects (AEs), and I look at my patients’ comorbid conditions and come up with a plan.
I encourage any patient who has high-volume or high-risk disease to consider more than just ADT alone. For many patients, I have been using abiraterone plus ADT. I have a wonderful pharmacist. As a medical oncologist, I can’t do it on my own. I need someone to follow patients’ laboratory results and to be available for medication questions and complications.
Elizabeth Hansen, PharmD. With the increasing number of patients on oral antineoplastics, monitoring patients in the outpatient setting has become an increasing priority and one of my major roles as a pharmacist in the clinic at the Chalmers P. Wylie VA Ambulatory Care Center in Columbus, Ohio. This is especially important as some of these treatments require frequent laboratory monitoring, such as abiraterone with liver function tests every 2 weeks for the first 3 months of treatment and monthly thereafter. Without frequent-follow up it’s easy for these patients to get lost in the shuffle.
Abhishek Solanki, MD. You could argue that a fifth option is prostate-directed radiation for patients who have limited metastases based on the STAMPEDE trial, which we’ve started integrating into our practice at the Edward Hines, Jr. Veterans Affairs Hospital in Chicago, Illinois.4
Mark Klein. Do you have a feel for the data and using radiation in oligometastatic (≤ 5 metastatic tumors) disease in prostate cancer and how well that might work?
Abhishek Solanki. The best data we have are from the multi-arm, multistage STAMPEDE trial systemic therapies and local therapy in the setting of high-risk localized disease and metastatic disease.6 The most recent publication looked specifically at the population with newly diagnosed metastatic disease and compared standard ADT (and docetaxel in about 18% of the patients) with or without prostate-directed radiation therapy. There was no survival benefit with radiation in the overall population, but in the subgroup of patients with low metastatic burden, there was an 8% survival benefit at 3 years.
It’s difficult to know what to make of that information because, as we’ve discussed already, there are other systemic therapy options that are being used more and more upfront such as abiraterone. Can you see the same benefit of radiation in that setting? The flip side is that in this study, radiation just targeted the prostate; could survival be improved even more by targeting all sites of disease in patients with oligometastatic disease? These are still open questions in prostate cancer and there are clinical trials attempting to define the clinical benefit of radiation in the metastatic setting for patients with limited metastases.
Mark Klein. How do you select patients for radiation in this particular situation; How do you approach stratification when radiation is started upfront?
Abhishek Solanki. In the STAMPEDE trial, low metastatic burden was defined based on the definition in the CHAARTED trial, which was those patients who did not have ≥ 4 bone metastases with ≥ 1 outside the vertebral bodies or pelvis, and did not have visceral metastases.7 That’s tough, because this definition could be a patient with a solitary bone metastasis but also could include some patients who have involved nodes extending all the way up to the retroperitoneal nodes—that is a fairly heterogeneous population. What we have done at our institution is select patients who have 3 to 5 metastases, administer prostate radiation therapy, and add stereotactic body radiation therapy (SBRT) for the other sites of disease, invoking the oligometastasis approach.
We have been doing this more frequently in the last few months. Typically, we’ll do 3 to 5 fractions of SBRT to metastases. For the primary, if the patient chooses SBRT, we’ll take that approach. If the patient chooses a more standard fractionation, we’ll do 20 treatments, but from a logistic perspective, most patients would rather come in for 5 treatments than 20. We also typically would start these patients on systemic hormonal therapy.
Mark Klein. At that point, are they referred back to medical oncology for surveillance?
Abhishek Solanki. Yes, they are followed by medical oncology and radiation oncology, and typically would continue hormonal therapy.
Mark Klein. Julie, how have you thought about presenting the therapeutic options for those patients who would be either eligible for docetaxel with high-bulk disease or abiraterone? Do you find patients prefer one or the other?
Julie Graff. I try to be very open about all the possibilities, and I present both. I don’t just decide for the patient chemotherapy vs abiraterone, but after we talk about it, most of my patients do opt for the abiraterone. I had a patient referred from the community—we are seeing more and more of this because abiraterone is so expensive—whose ejection fraction was about 38%. I said to that patient, “we could do chemotherapy, but we shouldn’t do abiraterone.” But usually it’s not that clear-cut.
Elizabeth Hansen. There was also an update from the STAMPEDE trial published recently comparing upfront abiraterone and prednisone to docetaxel (18 weeks) in advanced or metastatic prostate cancer. Results from this trial indicated a nearly identical overall survival (OS) (hazard ratio [HR] = 1.16; 95% CI, 0.82-1.65; P = .40). However, the failure-free survival (HR = 0.51; 95% CI, 0.39-0.67; P < .001) and progression-free survival (PFS) (HR= 0.65; 95% CI, 0.0.48-0.88; P = .005) favored abiraterone.8,9 The authors argue that while there was no change in OS, this trial demonstrates an important difference in the pattern of treatment failure.
Julie, do you think there will be any change in the treatment paradigm between docetaxel and abiraterone with this new update?
Julie Graff. I wasn’t that impressed by that study. I do not see it as practice changing, and it makes sense to me that the PFS is different in the 2 arms because we give chemotherapy and take a break vs giving abiraterone indefinitely. For me, there’s not really a shift.
Patients With Rising PSAs
Mark Klein. Let’s discuss the data from the recent studies on enzalutamide and apalutamide for the patients with fast-rising PSAs. In your discussions with other prostate researchers, will this become a standard part of practice or not?
Julie Graff. I was one of the authors on the SPARTAN apalutamide study.10 For a long time, we have had patients without metastatic disease but with a PSA relapse after surgery or radiation; and the PSA levels climb when the cancer becomes resistant to ADT. We haven’t had many options in that setting except to use bicalutamide and some older androgen receptor (AR) antagonists. We used to use estrogen and ketoconazole as well.
But now 2 studies have come out looking at a primary endpoint of metastases-free survival. Patients whose PSA was doubling every 10 months or shorter were randomized to either apalutamide (SPARTAN10) or enzalutamide (PROSPER11), both second-generation AR antagonists. There was a placebo control arm in each of the studies. Both studies found that adding the second-generation AR targeting agent delayed the time to metastatic disease by about 2 years. There is not any signal yet for statistically significant OS benefit, so it is not entirely clear if you could wait for the first metastasis to develop and then give 1 of these treatments and have the same OS benefit.
At the VA Portland Health Care System (VAPORHCS), it took a while to make these drugs available. My fellows were excited to give these drugs right away, but I often counsel patients that we don’t know if the second-generation AR targeting agents will improve survival. They almost certainly will bring down PSAs, which helps with peace of mind, but anything we add to the ADT can cause more AEs.
I have been cautious with second-generation AR antagonists because patients, when they take one of these drugs, are going to be on it for a long time. The FDA has approved those 2 drugs regardless of PSA doubling time, but I would not give it for a PSA doubling time > 10 months. In my practice about a quarter of patients who would qualify for apalutamide or enzalutamide are actually taking one, and the others are monitored closely with computed tomography (CT) and bone scans. When the disease becomes metastatic, then we start those drugs.
Mark Klein. Why 10 months, why not 6 months, a year, or 18 months? Is there reasoning behind that?
Julie Graff. There was a publication by Matthew Smith showing that the PSA doubling time was predictive of the development of metastatic disease and cancer death or prostate cancer death, and that 10 months seemed to be the cutoff between when the prostate cancer was going to become deadly vs not.12 If you actually look at the trial data, I think the PSA doubling time was between 3 and 4 months for the participants, so pretty short.
Adverse Effects
Mark Klein. What are the AEs people are seeing from using apalutamide, enzalutamide, and abiraterone? What are they seeing in their practice vs what is in the studies? When I have had to stop people on abiraterone or drop down the dose, almost always it has been for fatigue. We check liver function tests (LFTs) repeatedly, but I can’t remember ever having to drop down the dose or take it away even for that reason.
Elizabeth Hansen.
Mark Klein. At the Minneapolis VA Health Care System (MVAHCS) when apalutamide first came out, for the PSA rapid doubling, there had already been an abstract presenting the enzalutamide data. We have chosen to recommend enzalutamide as our choice for the people with PSA doubling based on the cost. It’s significantly cheaper for the VA. Between the 2 papers there is very little difference in the efficacy data. I’m wondering what other sites have done with regard to that specific point at their VAs?
Elizabeth Hansen. In Columbus, we prefer to use either abiraterone and enzalutamide because they’re essentially cost neutral. However, this may change with generic abiraterone coming to market. Apalutamide is really cost prohibitive currently.
Julie Graff. I agree.
Patient Education
Mark Klein. At MVAHCS, the navigators handle a lot of upfront education. We have 3 navigators, including Kathleen Nelson who is on this roundtable. She works with patients and provides much of the patient education. How have you handled education for patients?
Kathleen Nelson. For the most part, our pharmacists do the drug-specific education for the oral agents, and the nurse navigators provide more generic education. We did a trial for patients on IV therapies. We learned that patients really don’t report in much detail, but if you call and ask them specific questions, then you can tease out some more detail.
Elizabeth Hansen. It is interesting that every site is different. One of my main roles is oral antineoplastic monitoring, which includes many patients on enzalutamide or abiraterone. At least initially with these patients, I try to follow them closely—abiraterone more so than enzalutamide. I typically call every 2 to 4 weeks, in between clinic visits, to follow up the laboratory tests and manage the AEs. I always try to ask direct and open-ended questions: How often are you checking your blood pressure? What is your current weight? How has your energy level changed since therapy initiation?
The VA telehealth system is amazing. For patients who need to monitor blood pressure regularly, it’s really nice for them to have those numbers come directly back to me in CPRS (Computerized Patient Record System). That has worked wonders for some of our patients to get them through therapy.
Mark Klein. What do you tend to use when the prostate cancer is progressing for a patient? And how do you determine that progression? Some studies will use PSA rise only as a marker for progression. Other studies have not used PSA rise as the only marker for progression and oftentimes require some sort of bone scan criteria or CT imaging criteria for progression.
Julie Graff. We have a limited number of treatment options. Providers typically use enzalutamide or abiraterone as there is a high degree of resistance between the 2. Then there is chemotherapy and then radium, which quite a few people don’t qualify for. We need to be very thoughtful when we change treatments. I look at the 3 factors of biochemical progression or response—PSA, radiographic progression, and clinical progression. If I don’t see 2 out of 3, I typically don’t change treatments. Then after enzalutamide or abiraterone, I wait until there are cancer-related symptoms before I consider chemotherapy and closely monitor my patients.
Imaging Modalities
Abhishek Solanki. Over the last few years the Hines VA Hospital has used fluciclovine positron emission tomography (PET), which is one of the novel imaging modalities for prostate cancer. Really the 2 novel imaging modalities that have gained the most excitement are prostate-specific membrane antigen (PSMA) PET and fluciclovine PET. Fluciclovine PET is based on a synthetic amino acid that’s taken up in multiple tissues, including prostate cancer. It has changed our practice in the localized setting for patients who have developed recurrence after radiation or radical prostatectomy. We have incorporated the scan into our workup of patients with recurrent disease, which can give us some more information at lower PSAs than historically we could get with CT, bone scan, or magnetic resonance imaging.
Our medical oncologists have started using it more and more as well. We are getting a lot of patients who have a negative CT or bone scan but have a positive fluciclovine PET. There are a few different disease settings where that becomes relevant. In patients who develop biochemical recurrence after radiation or salvage radiation after radical, we are finding that a lot of these patients who have no CT or bone scan findings of disease ultimately are found to have a PET-positive lesion. Sometimes it’s difficult to know how best to help patients with PET-only disease. Should you target the disease with an oligometastasis approach or just pursue systemic therapy or surveillance? It is challenging but more and more we are moving toward metastasis-directed therapy. There are multiple randomized trials in progress testing whether metastasis-directed therapy to the PET areas of recurrence can improve outcomes or delay systemic ADT. The STOMP trial randomized surveillance vs SBRT or surgery for patients with oligometastatic disease that showed improvement in biochemical control and ADT-free survival.13 However this was a small trial that tried to identify a signal. More definitive trials are necessary.
The other setting where we have found novel PET imaging to be helpful is in patients who have become castration resistant but don’t have clear metastases on conventional imaging. We’re identifying more patients who have only a few sites of progression, and we’ll pursue metastasis-directed therapy to those areas to try to get more mileage out of the systemic therapy that the patient is currently on and to try to avoid having to switch to the next line with the idea that, potentially, the progression site is just a limited clone that is progressing despite the current systemic therapy.
Mark Klein. I find that to be a very attractive approach. I’m assuming you do that for any systemic therapy where people have maybe 1 or 2 sites and they do not have a big PSA jump. Do you have a number of sites that you’re willing to radiate? And then, when you do that, what radiation fractionation and dosing do you use? Is there any observational data behind that for efficacy?
Abhishek Solanki. It is a patient by patient decision. Some patients, if they have a very rapid pace of progression shortly after starting systemic therapy and metastases have grown in several areas, we think that perhaps this person may benefit less from aggressive local therapy. But if it’s somebody who has been on systemic therapy for a while and has up to 3 sites of disease growth, we consider SBRT for oligoprogressive disease. Typically, we’ll use SBRT, which delivers a high dose of radiation over 3 to 5 treatments. With SBRT you can give a higher biologic dose and use more sophisticated treatment machines and image guidance for treatments to focus the radiation on the tumor area and limit exposure to normal tissue structures.
In prostate cancer to the primary site, we will typically do around 35 to 40 Gy in 5 fractions. For metastases, it depends on the site. If it’s in the lung, typically we will do 3 to 5 treatments, giving approximately 50 to 60 Gy in that course. In the spine, we use lower doses near the spinal cord and the cauda equina, typically about 30 Gy in 3 fractions. In the liver, similar to the lung, we’ll typically do 50-54 Gy in 3-5 fractions. There aren’t a lot of high-level data guiding the optimal dose/fractionation to metastases, but these are the doses we’ll use for various malignancies.
Treatment Options for Patients With Adverse Events
Mark Klein. I was just reviewing the 2004 study that randomized patients to mitoxantrone or docetaxel for up to 10 cycles.14,15 Who are good candidates for docetaxel after they have exhausted abiraterone and enzalutamide? How long do you hold to the 10-cycle rule, or do you go beyond that if they’re doing well? And if they’re not a good candidate, what are some options?
Julie Graff. The best candidates are those who are having a cancer-related AE, particularly pain, because docetaxel only improves survival over mitoxantrone by about 2.5 months. I don’t talk to patients about it as though it is a life extender, but it seems to help control pain—about 70% of patients benefited in terms of pain or some other cancer-related symptom.14
I have a lot of patients who say, “Never will I do chemotherapy.” I refer those patients to hospice, or if they’re appropriate for radium-223, I consider that. I typically give about 6 cycles of chemotherapy and then see how they’re doing. In some patients, the cancer just doesn’t respond to it.
I do tell patients about the papers that you mentioned, the 2 studies of docetaxel vs mitoxantrone where they use about 10 cycles, and some of my patients go all 10.14,15 Sometimes we have to stop because of neuropathy or some other AE. I believe in taking breaks and that you can probably start it later.
Elizabeth Hansen. I agree, our practice is similar. A lot of our patients are not very interested in chemotherapy. You have to take into consideration their ECOG (Eastern Cooperative Oncology Group) status, their goals, and quality of life when talking to them about these medications. And a lot of them tend to choose more of a palliative route. Depending on their AEs and how things are going, we will dose reduce, hold treatment, or give treatment holidays.
Mark Klein. If patients are progressing on docetaxel, what are options that people would use? Radium-223 certainly is available for patients with nonvisceral metastases, as well as cabazitaxel, mitoxantrone, estramustine and other older drugs.
Julie Graff. We have some clinical trials for patients postdocetaxel. We have the TRITON2 and TRITON3 studies open at the VA. (NCT02952534 and NCT02975934, respectively) A lot of patients would get a biopsy, and we’d look for a BRCA 1 or 2 and ATM mutation. For those patients who don’t have those mutations—and maybe 80% of them don’t—we talk about radium-223 for the patients without visceral metastases and bone pain. I have had a fair number of patients go on cabazitaxel, but I have not used mitoxantrone since cabazitaxel came out. It’s not off the table, but it hasn’t shown improvement in survival.
Elizabeth Hansen. One of our challenges, because we’re an ambulatory care center, is that we are unable to give radium-223 in house, and these services have to be sent out to a non-VA facility. It is doable, but it takes more legwork and organization on our part.
Julie Graff. We have not had radium-223, although we’re working to get that online. And we are physically connected to Oregon Health Science University (OHSU), so we send our patients there for radium. It is a pain because the doctors at OHSU don’t have CPRS access. I’m often in the middle of making sure the complete blood counts (CBCs) are sent to OHSU and to get my patients their treatments.
Mark Klein. The Minneapolis VAMC has radium-223 on site, and we have used it for patients whose cancer has progressed while on docetaxel without visceral metastases. Katie, have you had an opportunity to coordinate that care for patients?
Kathleen Nelson. Radium is administered at our facility by one of our nuclear medicine physicians. A complete blood count is checked at least 3 days prior to the infusion date but no sooner than 6 days. Due to the cost of the material, ordering without knowing the patient’s counts are within a safe range to administer is prohibitive. This adds an additional burden of 2 visits (lab with return visit) to the patient. We have treated 12 patients. Four patients stopped treatment prior to completing the 6 planned treatments citing debilitating fatigue and/or nonresolution of symptoms as their reason to stop treatment. One patient died. The 7 remaining patients subjectively reported varying degrees of pain relief.
Elizabeth Hansen. Another thing to mention is the lack of a PSA response from radium-223 as well. Patients are generally very diligent about monitoring their PSA, so this can be a bit distressing.
Mark Klein. Julie, have you noticed a PSA flare with radium-223? I know it has been reported.
Julie Graff. I haven’t. But I put little stock in PSAs in these patients. I spend 20 minutes explaining to patients that the PSA is not helpful in determining whether or not the radium is working. I tell them that the bone marker alkaline phosphatase may decrease. And I think it’s important to note, too, that radium-223 is not a treatment we have on the shelf. We order it from Denver I believe. It is weight based, and it takes 5 days to get.
Clinical Trials
Mark Klein. That leads us into clinical trials. What is the role for precision oncology in prostate cancer right now, specifically looking at particular panels? One would be the DNA repair enzyme-based genes and/or also the AR variants and any other markers.
Elizabeth Hansen. The National Comprehensive Cancer Network came out with a statement recommending germ-line and somatic-mutation testing in all patients with metastatic prostate cancer. This highlights the need to offer patients the availability of clinical trials.
Julie Graff. I agree. We occasionally get to a place in the disease where patients are feeling fine, but we don’t have anything else to offer. The studies by Robinson16 and then Matteo17 showed that (a) these DNA repair defects are present in about a quarter of patients; and (b) that PARP inhibitors can help these patients. At least it has an anticancer effect.
What’s interesting is that we have TRITON2, and TRITON3, which are sponsored by Clovis,for patients with BRCA 1/2 and ATM mutations and using the PARP-inhibitor rucaparib. Based on the data we have available, we thought a quarter of patients would have the mutation in the tumor, but they’re finding that it is more like 10% to 15%. They are screening many patients but not finding it.
I agree that clinical trials are the way to go. I am hopeful that we’ll get more treatments based on molecular markers. The approval for pembrolizumab in any tumor type with microsatellite instability is interesting, but in prostate cancer, I believe that’s about 3%. I haven’t seen anyone qualify for pembrolizumab based on that. Another plug for clinical trials: Let’s learn more and offer our patients potentially beneficial treatments earlier.
Mark Klein. The first interim analysis from the TRITON2 study found about 12% of patients had alterations in BRCA 1/2. But in those that met the RECIST criteria, they were able to have evaluable disease via that standard with about a 44% response rate so far and a 51% PSA response rate. It is promising data, but it’s only 85 patients so far. We’ll know more because the TRITON2 study is of a more pretreated population than the TRITION3 study at this point. Are there any data on precision medicine and radiation in prostate cancer?
Abhishek Solanki. In the prostate cancer setting, there are not a lot of emerging data specifically looking at using precision oncology biomarkers to help guide decisions in radiation therapy. For example, genomic classifiers, like GenomeDx Decipher (Vancouver, BC) and Myriad Genetics Prolaris (Salt Lake City, UT) are increasingly being utilized in patients with localized disease. Decipher can help predict the risk of recurrence after radical prostatectomy. The difficulty is that there are limited data that show that by using these genomic classifiers, one can improve outcomes in patients over traditional clinical characteristics.
There are 2 trials currently ongoing through NRG Oncology that are using Decipher. The GU002 is a trial for patients who had a radical prostatectomy and had a postoperative PSA that never nadired below 0.2. These patients are randomized between salvage radiation with hormone therapy with or without docetaxel. This trial is collecting Decipher results for patients enrolled in the study. The GU006 is a trial for a slightly more favorable group of patients who do nadir but still have biochemical recurrence and relatively low PSAs. This trial randomizes between radiotherapy alone and radiotherapy and 6 months of apalutamide, stratifying patients based on Decipher results, specially differentiating between patients who have a luminal vs basal subtype of prostate cancer. There are data that suggest that patients who have a luminal subtype may benefit more from the combination of radiation and hormone therapy vs patients who have basal subtype.18 However this hasn’t been validated in a prospective setting, and that’s what this trial will hopefully do.
Immunotherapies
Mark Klein. Outside of prostate cancer, there has been a lot of research trying to determine how to improve PD-L1 expression. Where are immunotherapy trials moving? How radiation might play a role in conjunction with immunotherapy.
Julie Graff. Two phase 3 studies did not show statistically improved survival or statistically significant survival improvement on ipilimumab, an immunotherapy agent that targets CTLA4. Some early studies of the PD-1 drugs nivolumab and pembrolizumab did not show much response with monotherapy. Despite the negative phase 3 studies for ipilimumab, we periodically see exceptional responses.
In prostate cancer, enzalutamide is FDA approved. And there’s currently a phase 3 study of the PD-L1 inhibitor atezolizumab plus enzalutamide in patients who have progressed on abiraterone. That trial is fully accrued, bu
I just received a Prostate Cancer Foundation Challenge Award to open a VA-only study looking at fecal microbiota transplant from responders to nonresponders to see how manipulating host factors can increase potential responses to PD-1 inhibition.
Abhishek Solanki. The classic mechanism by which radiation therapy works is direct DNA damage and indirect DNA damage through hydroxyl radicals that leads to cytotoxicity. But preclinical and clinical data suggest that radiation therapy can augment the local and systemic immunotherapy response. The radiation oncologist’s dream is what is called the abscopal effect, which is the idea that when you treat one site of disease with radiation, it can induce a response at other sites that didn’t get radiation therapy through reactivation of the immune system. I like to think of the abscopal effect like bigfoot—it’s elusive. However, it seems that the setting it is most likely to happen in is in combination with immunotherapy.
One of the ways that radiation fails locally is that it can upregulate PD-1 expression, and as a result, you can have progression of the tumor because of local immune suppression. We know that T cells are important for the activity of radiation therapy. If you combine checkpoint inhibition with radiation therapy, you can not only have better local control in the area of the tumor, but perhaps you can release tumor antigens that will then induce a systemic response.
The other potential mechanism by which radiation may work synergistically with immunotherapy is as a debulking agent. There are some data that suggest that the ratio of T-cell reinvigoration to bulk of disease, or the volume of tumor burden, is important. That is, having T-cell reinvigoration may not be sufficient to have a response to immunotherapy in patients with a large burden of disease. By using radiation to debulk disease, perhaps you could help make checkpoint inhibition more effective. Ultimately, in the setting of prostate cancer, there are not a lot of data yet showing meaningful benefits with the combination of immunotherapy and radiotherapy, but there are trials that are ongoing that will educate on potential synergy.
Pharmacy
Julie Graff. Before we end I want to make sure that we applaud the amazing pharmacists and patient care navigation teams in the VA who do such a great job of getting veterans the appropriate treatment expeditiously and keeping them safe. It’s something that is truly unique to the VA. And I want to thank the people on this call who do this every day.
Elizabeth Hansen. Thank you Julie. Compared with working in the community, at the VA I’m honestly amazed by the ease of access to these medications for our patients. Being able to deliver medications sometimes the same day to the patient is just not something that happens in the community. It’s nice to see that our veterans are getting cared for in that manner.
Author disclosures
Dr. Solanki participated in advisory boards for Blue Earth Diagnostics’ fluciclovine PET and was previously paid as a consultant. Dr. Graff is a consultant for Sanofi (docetaxel) and Astellas (enzalutamide), and has received research funding (no personal funding)from Sanofi, Merck (pembrolizumab), Astellas, and Jannsen (abiraterone, apalutamide). The other authors report no actual or potential conflicts of interest with regard to this article.
Disclaimer
The opinions expressed herein are those of the authors and do not necessarily reflect those of Federal Practitioner, Frontline Medical Communications Inc., the US Government, or any of its agencies. This article may discuss unlabeled or investigational use of certain drugs. Please review the complete prescribing information for specific drugs or drug combinations—including indications, contraindications, warnings, and adverse effects—before administering pharmacologic therapy to patients.
1. James ND, de Bono JS, Spears MR, et al; STAMPEDE Investigators. Abiraterone for prostate cancer not previously treated with hormone therapy. N Engl J Med. 2017;377(4):338-351.
2. James ND, Sydes MR, Clarke NW, et al; STAMPEDE Investigators. Addition of docetaxel, zoledronic acid, or both to first-line long-term hormone therapy in prostate cancer (STAMPEDE): survival results from an adaptive, multiarm, multistage, platform randomised controlled trial. Lancet. 2017;387(10024):1163-1177.
3. Fizazi K, Tran N, Fein L, et al; LATITUDE Investigators. Abiraterone plus prednisone in metastatic, castration-sensitive prostate cancer. N Engl J Med. 2017;377(4):352-360.
4. Kyriakopoulos CE, Chen YH, Carducci MA, et al. Chemohormonal therapy in metastatic hormone-sensitive prostate cancer: long-term survival analysis of the randomized Phase III E3805 CHAARTED trial. J Clin Oncol. 2018;36(11):1080-1087.
5. Tosoian JJ, Gorin MA, Ross AE, Pienta KJ, Tran PT, Schaeffer EM. Oligometastatic prostate cancer: definitions, clinical outcomes, and treatment considerations. Nat Rev Urol. 2017;14(1):15-25.
6. Parker CC, James ND, Brawley CD, et al; Systemic Therapy for Advanced or Metastatic Prostate cancer: Evaluation of Drug Efficacy (STAMPEDE) investigators. Radiotherapy to the primary tumour for newly diagnosed, metastatic prostate cancer (STAMPEDE): a randomised controlled phase 3 trial. Lancet. 2018;392(10162):2353-2366.
7. Sweeney CJ, Chen YH, Carducci M, et al. Chemohormonal therapy in metastatic hormone-sensitive prostate cancer. N Engl J Med. 2015;373(8):737-746.
8. Feyerabend S, Saad F, Li T, et al. Survival benefit, disease progression and quality-of-life outcomes of abiraterone acetate plus prednisone versus docetaxel in metastatic hormone-sensitive prostate cancer: a network meta-analysis. Eur J Cancer. 2018;103:78-87.
9. Sydes MR, Spears MR, Mason MD, et al; STAMPEDE Investigators. Adding abiraterone or docetaxel to long-term hormone therapy for prostate cancer: directly randomised data from the STAMPEDE multi-arm, multi-stage platform protocol. Ann Oncol. 2018;29(5):1235-1248.
10. Smith MR, Saad F, Chowdhury S, et al; SPARTAN Investigators. Apalutamide treatment and metastasis-free survival in prostate cancer. N Engl J Med. 2018;378(15):1408-1418.
11. Hussain M, Fizazi K, Saad F, et al. Enzalutamide in men with nonmetastatic, castration-resistant prostate cancer. N Engl J Med. 2018;378(26):2465-2474.
12. Smith MR, Kabbinavar F, Saad F, et al. Natural history of rising serum prostate-specific antigen in men with castrate nonmetastatic prostate cancer. J Clin Oncol. 2005;23(13):2918-2925.
13. Ost P, Reynders D, Decaestecker K, et al. Surveillance or metastasis-directed therapy for oligometastatic prostate cancer recurrence: a prospective, randomized, multicenter phase II trial. J Clin Oncol. 2018;36(5):446-453.
14. Petrylak DP, Tangen CM, Hussain MH, et al. Docetaxel and estramustine compared with mitoxantrone and prednisone for advanced refractory prostate cancer. N Engl J Med. 2004;351(15):1513-1520.
15. Tannock IF, de Wit R, Berry WR, et al; TAX 327 Investigators. Docetaxel plus prednisone or mitoxantrone plus prednisone for advanced prostate cancer. N Engl J Med. 2004;351(15):1502-1512.
16. Robinson D, Van Allen EM, Wu YM, et al. Integrative clinical genomics of advanced prostate cancer. Cell. 2015;161(5):1215-1228.
17. Mateo J, Carreira S, Sandhu S, et al. DNA-repair defects and olaparib in metastatic prostate cancer. N Engl J Med. 2015;373(18):1697-1708.
18. Zhao SG, Chang SL, Erho N, et al. Associations of luminal and basal subtyping of prostate cancer with prognosis and response to androgen deprivation therapy. JAMA Oncol. 2017;3(12):1663-1672.
Sequencing Therapies
Mark Klein, MD. The last few years, there have been several new trials in prostate cancer for people in a metastatic setting or more advanced local setting, such as the STAMPEDE, LATITUDE, and CHAARTED trials.1-4 In addition, recently a few trials have examined apalutamide and enzalutamide for people who have had PSA (prostate-specific antigen) levels rapidly rising within about 10 months or so. One of the questions that arises is, how do we wrap our heads around sequencing these therapies. Is there a sequence that we should be doing and thinking about upfront and how do the different trials compare?
Julie Graff, MD. It just got more complicated. There was news today (December 20, 2018) that using enzalutamide early on in newly diagnosed metastatic prostate cancer may have positive results. It is not yet approved by the US Food and Drug Administration (FDA), but for patients who present with metastatic prostate cancer, we may have 4 potential treatments. We could have androgen deprivation therapy (ADT) alone, ADT plus docetaxel, enzalutamide, or abiraterone.
When I see patients in this situation, I talk to them about their options, the pros and cons of each option, and try to cover all the trials that look at these combinations. It can be quite a long visit. I talk to the patient about who benefits most, whether it is patients with high-risk factors or high-volume cancers. Also, I talk with the patient about all the adverse effects (AEs), and I look at my patients’ comorbid conditions and come up with a plan.
I encourage any patient who has high-volume or high-risk disease to consider more than just ADT alone. For many patients, I have been using abiraterone plus ADT. I have a wonderful pharmacist. As a medical oncologist, I can’t do it on my own. I need someone to follow patients’ laboratory results and to be available for medication questions and complications.
Elizabeth Hansen, PharmD. With the increasing number of patients on oral antineoplastics, monitoring patients in the outpatient setting has become an increasing priority and one of my major roles as a pharmacist in the clinic at the Chalmers P. Wylie VA Ambulatory Care Center in Columbus, Ohio. This is especially important as some of these treatments require frequent laboratory monitoring, such as abiraterone with liver function tests every 2 weeks for the first 3 months of treatment and monthly thereafter. Without frequent-follow up it’s easy for these patients to get lost in the shuffle.
Abhishek Solanki, MD. You could argue that a fifth option is prostate-directed radiation for patients who have limited metastases based on the STAMPEDE trial, which we’ve started integrating into our practice at the Edward Hines, Jr. Veterans Affairs Hospital in Chicago, Illinois.4
Mark Klein. Do you have a feel for the data and using radiation in oligometastatic (≤ 5 metastatic tumors) disease in prostate cancer and how well that might work?
Abhishek Solanki. The best data we have are from the multi-arm, multistage STAMPEDE trial systemic therapies and local therapy in the setting of high-risk localized disease and metastatic disease.6 The most recent publication looked specifically at the population with newly diagnosed metastatic disease and compared standard ADT (and docetaxel in about 18% of the patients) with or without prostate-directed radiation therapy. There was no survival benefit with radiation in the overall population, but in the subgroup of patients with low metastatic burden, there was an 8% survival benefit at 3 years.
It’s difficult to know what to make of that information because, as we’ve discussed already, there are other systemic therapy options that are being used more and more upfront such as abiraterone. Can you see the same benefit of radiation in that setting? The flip side is that in this study, radiation just targeted the prostate; could survival be improved even more by targeting all sites of disease in patients with oligometastatic disease? These are still open questions in prostate cancer and there are clinical trials attempting to define the clinical benefit of radiation in the metastatic setting for patients with limited metastases.
Mark Klein. How do you select patients for radiation in this particular situation; How do you approach stratification when radiation is started upfront?
Abhishek Solanki. In the STAMPEDE trial, low metastatic burden was defined based on the definition in the CHAARTED trial, which was those patients who did not have ≥ 4 bone metastases with ≥ 1 outside the vertebral bodies or pelvis, and did not have visceral metastases.7 That’s tough, because this definition could be a patient with a solitary bone metastasis but also could include some patients who have involved nodes extending all the way up to the retroperitoneal nodes—that is a fairly heterogeneous population. What we have done at our institution is select patients who have 3 to 5 metastases, administer prostate radiation therapy, and add stereotactic body radiation therapy (SBRT) for the other sites of disease, invoking the oligometastasis approach.
We have been doing this more frequently in the last few months. Typically, we’ll do 3 to 5 fractions of SBRT to metastases. For the primary, if the patient chooses SBRT, we’ll take that approach. If the patient chooses a more standard fractionation, we’ll do 20 treatments, but from a logistic perspective, most patients would rather come in for 5 treatments than 20. We also typically would start these patients on systemic hormonal therapy.
Mark Klein. At that point, are they referred back to medical oncology for surveillance?
Abhishek Solanki. Yes, they are followed by medical oncology and radiation oncology, and typically would continue hormonal therapy.
Mark Klein. Julie, how have you thought about presenting the therapeutic options for those patients who would be either eligible for docetaxel with high-bulk disease or abiraterone? Do you find patients prefer one or the other?
Julie Graff. I try to be very open about all the possibilities, and I present both. I don’t just decide for the patient chemotherapy vs abiraterone, but after we talk about it, most of my patients do opt for the abiraterone. I had a patient referred from the community—we are seeing more and more of this because abiraterone is so expensive—whose ejection fraction was about 38%. I said to that patient, “we could do chemotherapy, but we shouldn’t do abiraterone.” But usually it’s not that clear-cut.
Elizabeth Hansen. There was also an update from the STAMPEDE trial published recently comparing upfront abiraterone and prednisone to docetaxel (18 weeks) in advanced or metastatic prostate cancer. Results from this trial indicated a nearly identical overall survival (OS) (hazard ratio [HR] = 1.16; 95% CI, 0.82-1.65; P = .40). However, the failure-free survival (HR = 0.51; 95% CI, 0.39-0.67; P < .001) and progression-free survival (PFS) (HR= 0.65; 95% CI, 0.0.48-0.88; P = .005) favored abiraterone.8,9 The authors argue that while there was no change in OS, this trial demonstrates an important difference in the pattern of treatment failure.
Julie, do you think there will be any change in the treatment paradigm between docetaxel and abiraterone with this new update?
Julie Graff. I wasn’t that impressed by that study. I do not see it as practice changing, and it makes sense to me that the PFS is different in the 2 arms because we give chemotherapy and take a break vs giving abiraterone indefinitely. For me, there’s not really a shift.
Patients With Rising PSAs
Mark Klein. Let’s discuss the data from the recent studies on enzalutamide and apalutamide for the patients with fast-rising PSAs. In your discussions with other prostate researchers, will this become a standard part of practice or not?
Julie Graff. I was one of the authors on the SPARTAN apalutamide study.10 For a long time, we have had patients without metastatic disease but with a PSA relapse after surgery or radiation; and the PSA levels climb when the cancer becomes resistant to ADT. We haven’t had many options in that setting except to use bicalutamide and some older androgen receptor (AR) antagonists. We used to use estrogen and ketoconazole as well.
But now 2 studies have come out looking at a primary endpoint of metastases-free survival. Patients whose PSA was doubling every 10 months or shorter were randomized to either apalutamide (SPARTAN10) or enzalutamide (PROSPER11), both second-generation AR antagonists. There was a placebo control arm in each of the studies. Both studies found that adding the second-generation AR targeting agent delayed the time to metastatic disease by about 2 years. There is not any signal yet for statistically significant OS benefit, so it is not entirely clear if you could wait for the first metastasis to develop and then give 1 of these treatments and have the same OS benefit.
At the VA Portland Health Care System (VAPORHCS), it took a while to make these drugs available. My fellows were excited to give these drugs right away, but I often counsel patients that we don’t know if the second-generation AR targeting agents will improve survival. They almost certainly will bring down PSAs, which helps with peace of mind, but anything we add to the ADT can cause more AEs.
I have been cautious with second-generation AR antagonists because patients, when they take one of these drugs, are going to be on it for a long time. The FDA has approved those 2 drugs regardless of PSA doubling time, but I would not give it for a PSA doubling time > 10 months. In my practice about a quarter of patients who would qualify for apalutamide or enzalutamide are actually taking one, and the others are monitored closely with computed tomography (CT) and bone scans. When the disease becomes metastatic, then we start those drugs.
Mark Klein. Why 10 months, why not 6 months, a year, or 18 months? Is there reasoning behind that?
Julie Graff. There was a publication by Matthew Smith showing that the PSA doubling time was predictive of the development of metastatic disease and cancer death or prostate cancer death, and that 10 months seemed to be the cutoff between when the prostate cancer was going to become deadly vs not.12 If you actually look at the trial data, I think the PSA doubling time was between 3 and 4 months for the participants, so pretty short.
Adverse Effects
Mark Klein. What are the AEs people are seeing from using apalutamide, enzalutamide, and abiraterone? What are they seeing in their practice vs what is in the studies? When I have had to stop people on abiraterone or drop down the dose, almost always it has been for fatigue. We check liver function tests (LFTs) repeatedly, but I can’t remember ever having to drop down the dose or take it away even for that reason.
Elizabeth Hansen.
Mark Klein. At the Minneapolis VA Health Care System (MVAHCS) when apalutamide first came out, for the PSA rapid doubling, there had already been an abstract presenting the enzalutamide data. We have chosen to recommend enzalutamide as our choice for the people with PSA doubling based on the cost. It’s significantly cheaper for the VA. Between the 2 papers there is very little difference in the efficacy data. I’m wondering what other sites have done with regard to that specific point at their VAs?
Elizabeth Hansen. In Columbus, we prefer to use either abiraterone and enzalutamide because they’re essentially cost neutral. However, this may change with generic abiraterone coming to market. Apalutamide is really cost prohibitive currently.
Julie Graff. I agree.
Patient Education
Mark Klein. At MVAHCS, the navigators handle a lot of upfront education. We have 3 navigators, including Kathleen Nelson who is on this roundtable. She works with patients and provides much of the patient education. How have you handled education for patients?
Kathleen Nelson. For the most part, our pharmacists do the drug-specific education for the oral agents, and the nurse navigators provide more generic education. We did a trial for patients on IV therapies. We learned that patients really don’t report in much detail, but if you call and ask them specific questions, then you can tease out some more detail.
Elizabeth Hansen. It is interesting that every site is different. One of my main roles is oral antineoplastic monitoring, which includes many patients on enzalutamide or abiraterone. At least initially with these patients, I try to follow them closely—abiraterone more so than enzalutamide. I typically call every 2 to 4 weeks, in between clinic visits, to follow up the laboratory tests and manage the AEs. I always try to ask direct and open-ended questions: How often are you checking your blood pressure? What is your current weight? How has your energy level changed since therapy initiation?
The VA telehealth system is amazing. For patients who need to monitor blood pressure regularly, it’s really nice for them to have those numbers come directly back to me in CPRS (Computerized Patient Record System). That has worked wonders for some of our patients to get them through therapy.
Mark Klein. What do you tend to use when the prostate cancer is progressing for a patient? And how do you determine that progression? Some studies will use PSA rise only as a marker for progression. Other studies have not used PSA rise as the only marker for progression and oftentimes require some sort of bone scan criteria or CT imaging criteria for progression.
Julie Graff. We have a limited number of treatment options. Providers typically use enzalutamide or abiraterone as there is a high degree of resistance between the 2. Then there is chemotherapy and then radium, which quite a few people don’t qualify for. We need to be very thoughtful when we change treatments. I look at the 3 factors of biochemical progression or response—PSA, radiographic progression, and clinical progression. If I don’t see 2 out of 3, I typically don’t change treatments. Then after enzalutamide or abiraterone, I wait until there are cancer-related symptoms before I consider chemotherapy and closely monitor my patients.
Imaging Modalities
Abhishek Solanki. Over the last few years the Hines VA Hospital has used fluciclovine positron emission tomography (PET), which is one of the novel imaging modalities for prostate cancer. Really the 2 novel imaging modalities that have gained the most excitement are prostate-specific membrane antigen (PSMA) PET and fluciclovine PET. Fluciclovine PET is based on a synthetic amino acid that’s taken up in multiple tissues, including prostate cancer. It has changed our practice in the localized setting for patients who have developed recurrence after radiation or radical prostatectomy. We have incorporated the scan into our workup of patients with recurrent disease, which can give us some more information at lower PSAs than historically we could get with CT, bone scan, or magnetic resonance imaging.
Our medical oncologists have started using it more and more as well. We are getting a lot of patients who have a negative CT or bone scan but have a positive fluciclovine PET. There are a few different disease settings where that becomes relevant. In patients who develop biochemical recurrence after radiation or salvage radiation after radical, we are finding that a lot of these patients who have no CT or bone scan findings of disease ultimately are found to have a PET-positive lesion. Sometimes it’s difficult to know how best to help patients with PET-only disease. Should you target the disease with an oligometastasis approach or just pursue systemic therapy or surveillance? It is challenging but more and more we are moving toward metastasis-directed therapy. There are multiple randomized trials in progress testing whether metastasis-directed therapy to the PET areas of recurrence can improve outcomes or delay systemic ADT. The STOMP trial randomized surveillance vs SBRT or surgery for patients with oligometastatic disease that showed improvement in biochemical control and ADT-free survival.13 However this was a small trial that tried to identify a signal. More definitive trials are necessary.
The other setting where we have found novel PET imaging to be helpful is in patients who have become castration resistant but don’t have clear metastases on conventional imaging. We’re identifying more patients who have only a few sites of progression, and we’ll pursue metastasis-directed therapy to those areas to try to get more mileage out of the systemic therapy that the patient is currently on and to try to avoid having to switch to the next line with the idea that, potentially, the progression site is just a limited clone that is progressing despite the current systemic therapy.
Mark Klein. I find that to be a very attractive approach. I’m assuming you do that for any systemic therapy where people have maybe 1 or 2 sites and they do not have a big PSA jump. Do you have a number of sites that you’re willing to radiate? And then, when you do that, what radiation fractionation and dosing do you use? Is there any observational data behind that for efficacy?
Abhishek Solanki. It is a patient by patient decision. Some patients, if they have a very rapid pace of progression shortly after starting systemic therapy and metastases have grown in several areas, we think that perhaps this person may benefit less from aggressive local therapy. But if it’s somebody who has been on systemic therapy for a while and has up to 3 sites of disease growth, we consider SBRT for oligoprogressive disease. Typically, we’ll use SBRT, which delivers a high dose of radiation over 3 to 5 treatments. With SBRT you can give a higher biologic dose and use more sophisticated treatment machines and image guidance for treatments to focus the radiation on the tumor area and limit exposure to normal tissue structures.
In prostate cancer to the primary site, we will typically do around 35 to 40 Gy in 5 fractions. For metastases, it depends on the site. If it’s in the lung, typically we will do 3 to 5 treatments, giving approximately 50 to 60 Gy in that course. In the spine, we use lower doses near the spinal cord and the cauda equina, typically about 30 Gy in 3 fractions. In the liver, similar to the lung, we’ll typically do 50-54 Gy in 3-5 fractions. There aren’t a lot of high-level data guiding the optimal dose/fractionation to metastases, but these are the doses we’ll use for various malignancies.
Treatment Options for Patients With Adverse Events
Mark Klein. I was just reviewing the 2004 study that randomized patients to mitoxantrone or docetaxel for up to 10 cycles.14,15 Who are good candidates for docetaxel after they have exhausted abiraterone and enzalutamide? How long do you hold to the 10-cycle rule, or do you go beyond that if they’re doing well? And if they’re not a good candidate, what are some options?
Julie Graff. The best candidates are those who are having a cancer-related AE, particularly pain, because docetaxel only improves survival over mitoxantrone by about 2.5 months. I don’t talk to patients about it as though it is a life extender, but it seems to help control pain—about 70% of patients benefited in terms of pain or some other cancer-related symptom.14
I have a lot of patients who say, “Never will I do chemotherapy.” I refer those patients to hospice, or if they’re appropriate for radium-223, I consider that. I typically give about 6 cycles of chemotherapy and then see how they’re doing. In some patients, the cancer just doesn’t respond to it.
I do tell patients about the papers that you mentioned, the 2 studies of docetaxel vs mitoxantrone where they use about 10 cycles, and some of my patients go all 10.14,15 Sometimes we have to stop because of neuropathy or some other AE. I believe in taking breaks and that you can probably start it later.
Elizabeth Hansen. I agree, our practice is similar. A lot of our patients are not very interested in chemotherapy. You have to take into consideration their ECOG (Eastern Cooperative Oncology Group) status, their goals, and quality of life when talking to them about these medications. And a lot of them tend to choose more of a palliative route. Depending on their AEs and how things are going, we will dose reduce, hold treatment, or give treatment holidays.
Mark Klein. If patients are progressing on docetaxel, what are options that people would use? Radium-223 certainly is available for patients with nonvisceral metastases, as well as cabazitaxel, mitoxantrone, estramustine and other older drugs.
Julie Graff. We have some clinical trials for patients postdocetaxel. We have the TRITON2 and TRITON3 studies open at the VA. (NCT02952534 and NCT02975934, respectively) A lot of patients would get a biopsy, and we’d look for a BRCA 1 or 2 and ATM mutation. For those patients who don’t have those mutations—and maybe 80% of them don’t—we talk about radium-223 for the patients without visceral metastases and bone pain. I have had a fair number of patients go on cabazitaxel, but I have not used mitoxantrone since cabazitaxel came out. It’s not off the table, but it hasn’t shown improvement in survival.
Elizabeth Hansen. One of our challenges, because we’re an ambulatory care center, is that we are unable to give radium-223 in house, and these services have to be sent out to a non-VA facility. It is doable, but it takes more legwork and organization on our part.
Julie Graff. We have not had radium-223, although we’re working to get that online. And we are physically connected to Oregon Health Science University (OHSU), so we send our patients there for radium. It is a pain because the doctors at OHSU don’t have CPRS access. I’m often in the middle of making sure the complete blood counts (CBCs) are sent to OHSU and to get my patients their treatments.
Mark Klein. The Minneapolis VAMC has radium-223 on site, and we have used it for patients whose cancer has progressed while on docetaxel without visceral metastases. Katie, have you had an opportunity to coordinate that care for patients?
Kathleen Nelson. Radium is administered at our facility by one of our nuclear medicine physicians. A complete blood count is checked at least 3 days prior to the infusion date but no sooner than 6 days. Due to the cost of the material, ordering without knowing the patient’s counts are within a safe range to administer is prohibitive. This adds an additional burden of 2 visits (lab with return visit) to the patient. We have treated 12 patients. Four patients stopped treatment prior to completing the 6 planned treatments citing debilitating fatigue and/or nonresolution of symptoms as their reason to stop treatment. One patient died. The 7 remaining patients subjectively reported varying degrees of pain relief.
Elizabeth Hansen. Another thing to mention is the lack of a PSA response from radium-223 as well. Patients are generally very diligent about monitoring their PSA, so this can be a bit distressing.
Mark Klein. Julie, have you noticed a PSA flare with radium-223? I know it has been reported.
Julie Graff. I haven’t. But I put little stock in PSAs in these patients. I spend 20 minutes explaining to patients that the PSA is not helpful in determining whether or not the radium is working. I tell them that the bone marker alkaline phosphatase may decrease. And I think it’s important to note, too, that radium-223 is not a treatment we have on the shelf. We order it from Denver I believe. It is weight based, and it takes 5 days to get.
Clinical Trials
Mark Klein. That leads us into clinical trials. What is the role for precision oncology in prostate cancer right now, specifically looking at particular panels? One would be the DNA repair enzyme-based genes and/or also the AR variants and any other markers.
Elizabeth Hansen. The National Comprehensive Cancer Network came out with a statement recommending germ-line and somatic-mutation testing in all patients with metastatic prostate cancer. This highlights the need to offer patients the availability of clinical trials.
Julie Graff. I agree. We occasionally get to a place in the disease where patients are feeling fine, but we don’t have anything else to offer. The studies by Robinson16 and then Matteo17 showed that (a) these DNA repair defects are present in about a quarter of patients; and (b) that PARP inhibitors can help these patients. At least it has an anticancer effect.
What’s interesting is that we have TRITON2, and TRITON3, which are sponsored by Clovis,for patients with BRCA 1/2 and ATM mutations and using the PARP-inhibitor rucaparib. Based on the data we have available, we thought a quarter of patients would have the mutation in the tumor, but they’re finding that it is more like 10% to 15%. They are screening many patients but not finding it.
I agree that clinical trials are the way to go. I am hopeful that we’ll get more treatments based on molecular markers. The approval for pembrolizumab in any tumor type with microsatellite instability is interesting, but in prostate cancer, I believe that’s about 3%. I haven’t seen anyone qualify for pembrolizumab based on that. Another plug for clinical trials: Let’s learn more and offer our patients potentially beneficial treatments earlier.
Mark Klein. The first interim analysis from the TRITON2 study found about 12% of patients had alterations in BRCA 1/2. But in those that met the RECIST criteria, they were able to have evaluable disease via that standard with about a 44% response rate so far and a 51% PSA response rate. It is promising data, but it’s only 85 patients so far. We’ll know more because the TRITON2 study is of a more pretreated population than the TRITION3 study at this point. Are there any data on precision medicine and radiation in prostate cancer?
Abhishek Solanki. In the prostate cancer setting, there are not a lot of emerging data specifically looking at using precision oncology biomarkers to help guide decisions in radiation therapy. For example, genomic classifiers, like GenomeDx Decipher (Vancouver, BC) and Myriad Genetics Prolaris (Salt Lake City, UT) are increasingly being utilized in patients with localized disease. Decipher can help predict the risk of recurrence after radical prostatectomy. The difficulty is that there are limited data that show that by using these genomic classifiers, one can improve outcomes in patients over traditional clinical characteristics.
There are 2 trials currently ongoing through NRG Oncology that are using Decipher. The GU002 is a trial for patients who had a radical prostatectomy and had a postoperative PSA that never nadired below 0.2. These patients are randomized between salvage radiation with hormone therapy with or without docetaxel. This trial is collecting Decipher results for patients enrolled in the study. The GU006 is a trial for a slightly more favorable group of patients who do nadir but still have biochemical recurrence and relatively low PSAs. This trial randomizes between radiotherapy alone and radiotherapy and 6 months of apalutamide, stratifying patients based on Decipher results, specially differentiating between patients who have a luminal vs basal subtype of prostate cancer. There are data that suggest that patients who have a luminal subtype may benefit more from the combination of radiation and hormone therapy vs patients who have basal subtype.18 However this hasn’t been validated in a prospective setting, and that’s what this trial will hopefully do.
Immunotherapies
Mark Klein. Outside of prostate cancer, there has been a lot of research trying to determine how to improve PD-L1 expression. Where are immunotherapy trials moving? How radiation might play a role in conjunction with immunotherapy.
Julie Graff. Two phase 3 studies did not show statistically improved survival or statistically significant survival improvement on ipilimumab, an immunotherapy agent that targets CTLA4. Some early studies of the PD-1 drugs nivolumab and pembrolizumab did not show much response with monotherapy. Despite the negative phase 3 studies for ipilimumab, we periodically see exceptional responses.
In prostate cancer, enzalutamide is FDA approved. And there’s currently a phase 3 study of the PD-L1 inhibitor atezolizumab plus enzalutamide in patients who have progressed on abiraterone. That trial is fully accrued, bu
I just received a Prostate Cancer Foundation Challenge Award to open a VA-only study looking at fecal microbiota transplant from responders to nonresponders to see how manipulating host factors can increase potential responses to PD-1 inhibition.
Abhishek Solanki. The classic mechanism by which radiation therapy works is direct DNA damage and indirect DNA damage through hydroxyl radicals that leads to cytotoxicity. But preclinical and clinical data suggest that radiation therapy can augment the local and systemic immunotherapy response. The radiation oncologist’s dream is what is called the abscopal effect, which is the idea that when you treat one site of disease with radiation, it can induce a response at other sites that didn’t get radiation therapy through reactivation of the immune system. I like to think of the abscopal effect like bigfoot—it’s elusive. However, it seems that the setting it is most likely to happen in is in combination with immunotherapy.
One of the ways that radiation fails locally is that it can upregulate PD-1 expression, and as a result, you can have progression of the tumor because of local immune suppression. We know that T cells are important for the activity of radiation therapy. If you combine checkpoint inhibition with radiation therapy, you can not only have better local control in the area of the tumor, but perhaps you can release tumor antigens that will then induce a systemic response.
The other potential mechanism by which radiation may work synergistically with immunotherapy is as a debulking agent. There are some data that suggest that the ratio of T-cell reinvigoration to bulk of disease, or the volume of tumor burden, is important. That is, having T-cell reinvigoration may not be sufficient to have a response to immunotherapy in patients with a large burden of disease. By using radiation to debulk disease, perhaps you could help make checkpoint inhibition more effective. Ultimately, in the setting of prostate cancer, there are not a lot of data yet showing meaningful benefits with the combination of immunotherapy and radiotherapy, but there are trials that are ongoing that will educate on potential synergy.
Pharmacy
Julie Graff. Before we end I want to make sure that we applaud the amazing pharmacists and patient care navigation teams in the VA who do such a great job of getting veterans the appropriate treatment expeditiously and keeping them safe. It’s something that is truly unique to the VA. And I want to thank the people on this call who do this every day.
Elizabeth Hansen. Thank you Julie. Compared with working in the community, at the VA I’m honestly amazed by the ease of access to these medications for our patients. Being able to deliver medications sometimes the same day to the patient is just not something that happens in the community. It’s nice to see that our veterans are getting cared for in that manner.
Author disclosures
Dr. Solanki participated in advisory boards for Blue Earth Diagnostics’ fluciclovine PET and was previously paid as a consultant. Dr. Graff is a consultant for Sanofi (docetaxel) and Astellas (enzalutamide), and has received research funding (no personal funding)from Sanofi, Merck (pembrolizumab), Astellas, and Jannsen (abiraterone, apalutamide). The other authors report no actual or potential conflicts of interest with regard to this article.
Disclaimer
The opinions expressed herein are those of the authors and do not necessarily reflect those of Federal Practitioner, Frontline Medical Communications Inc., the US Government, or any of its agencies. This article may discuss unlabeled or investigational use of certain drugs. Please review the complete prescribing information for specific drugs or drug combinations—including indications, contraindications, warnings, and adverse effects—before administering pharmacologic therapy to patients.
1. James ND, de Bono JS, Spears MR, et al; STAMPEDE Investigators. Abiraterone for prostate cancer not previously treated with hormone therapy. N Engl J Med. 2017;377(4):338-351.
2. James ND, Sydes MR, Clarke NW, et al; STAMPEDE Investigators. Addition of docetaxel, zoledronic acid, or both to first-line long-term hormone therapy in prostate cancer (STAMPEDE): survival results from an adaptive, multiarm, multistage, platform randomised controlled trial. Lancet. 2017;387(10024):1163-1177.
3. Fizazi K, Tran N, Fein L, et al; LATITUDE Investigators. Abiraterone plus prednisone in metastatic, castration-sensitive prostate cancer. N Engl J Med. 2017;377(4):352-360.
4. Kyriakopoulos CE, Chen YH, Carducci MA, et al. Chemohormonal therapy in metastatic hormone-sensitive prostate cancer: long-term survival analysis of the randomized Phase III E3805 CHAARTED trial. J Clin Oncol. 2018;36(11):1080-1087.
5. Tosoian JJ, Gorin MA, Ross AE, Pienta KJ, Tran PT, Schaeffer EM. Oligometastatic prostate cancer: definitions, clinical outcomes, and treatment considerations. Nat Rev Urol. 2017;14(1):15-25.
6. Parker CC, James ND, Brawley CD, et al; Systemic Therapy for Advanced or Metastatic Prostate cancer: Evaluation of Drug Efficacy (STAMPEDE) investigators. Radiotherapy to the primary tumour for newly diagnosed, metastatic prostate cancer (STAMPEDE): a randomised controlled phase 3 trial. Lancet. 2018;392(10162):2353-2366.
7. Sweeney CJ, Chen YH, Carducci M, et al. Chemohormonal therapy in metastatic hormone-sensitive prostate cancer. N Engl J Med. 2015;373(8):737-746.
8. Feyerabend S, Saad F, Li T, et al. Survival benefit, disease progression and quality-of-life outcomes of abiraterone acetate plus prednisone versus docetaxel in metastatic hormone-sensitive prostate cancer: a network meta-analysis. Eur J Cancer. 2018;103:78-87.
9. Sydes MR, Spears MR, Mason MD, et al; STAMPEDE Investigators. Adding abiraterone or docetaxel to long-term hormone therapy for prostate cancer: directly randomised data from the STAMPEDE multi-arm, multi-stage platform protocol. Ann Oncol. 2018;29(5):1235-1248.
10. Smith MR, Saad F, Chowdhury S, et al; SPARTAN Investigators. Apalutamide treatment and metastasis-free survival in prostate cancer. N Engl J Med. 2018;378(15):1408-1418.
11. Hussain M, Fizazi K, Saad F, et al. Enzalutamide in men with nonmetastatic, castration-resistant prostate cancer. N Engl J Med. 2018;378(26):2465-2474.
12. Smith MR, Kabbinavar F, Saad F, et al. Natural history of rising serum prostate-specific antigen in men with castrate nonmetastatic prostate cancer. J Clin Oncol. 2005;23(13):2918-2925.
13. Ost P, Reynders D, Decaestecker K, et al. Surveillance or metastasis-directed therapy for oligometastatic prostate cancer recurrence: a prospective, randomized, multicenter phase II trial. J Clin Oncol. 2018;36(5):446-453.
14. Petrylak DP, Tangen CM, Hussain MH, et al. Docetaxel and estramustine compared with mitoxantrone and prednisone for advanced refractory prostate cancer. N Engl J Med. 2004;351(15):1513-1520.
15. Tannock IF, de Wit R, Berry WR, et al; TAX 327 Investigators. Docetaxel plus prednisone or mitoxantrone plus prednisone for advanced prostate cancer. N Engl J Med. 2004;351(15):1502-1512.
16. Robinson D, Van Allen EM, Wu YM, et al. Integrative clinical genomics of advanced prostate cancer. Cell. 2015;161(5):1215-1228.
17. Mateo J, Carreira S, Sandhu S, et al. DNA-repair defects and olaparib in metastatic prostate cancer. N Engl J Med. 2015;373(18):1697-1708.
18. Zhao SG, Chang SL, Erho N, et al. Associations of luminal and basal subtyping of prostate cancer with prognosis and response to androgen deprivation therapy. JAMA Oncol. 2017;3(12):1663-1672.
Presentation of a Rare Malignancy: Leiomyosarcoma of the Prostate (FULL)
Prostatic leiomyosarcoma is an aggressive malignancy with a high risk of metastasis and a poor prognosis that poses unique diagnostic and treatment challenges.
Prostatic leiomyosarcoma is a rare tumor.1 This neoplasm is composed of highly aggressive prostatic smooth muscle cells that present with nonspecific signs and symptoms mimicking other forms of prostatic pathology. Of the primary prostatic sarcomas, leiomyosarcoma represents the most common subtype in adults and is found in 38% to 52% of newly diagnosed prostate sarcoma.1,2 The prognosis is poor, and no clear guidelines exist regarding the optimal treatment approach. We report a case of prostate leiomyosarcoma and describe the disease characteristics, diagnostic modalities, and treatment approach regarding these rare malignancies.
Case Presentation
A 72-year-old male presented with 6 months of progressive severe lower urinary tract symptoms (LUTS) secondary to bladder outlet obstruction. The patient was refractory to medical management with combination α-blocker and 5-α-reductase inhibitor therapy and continued to require multiple emergent bladder catheterizations. Workup with urinalysis, blood biochemistry, and prostate specific antigen (PSA) levels were persistently normal. He reported no hematuria, weight loss, or perineal pain. The patient reported no history of tobacco use, exposure to hazardous chemicals, and had no family history of genitourinary cancers. On rectal exam, the prostate was firm and nodular, with induration noted along the right upper lobe of the prostate.
The patient was referred for a urology consultation and subsequently underwent transurethral resection of the prostate (TURP) for suspected severe benign prostatic hypertrophy (BPH). A histopathologic examination demonstrated atypical cytology consistent with high- grade leiomyosarcoma. Immunohistochemical analysis revealed positive staining for vimentin, smooth muscle actin, desmin (partial), cytokeratin, smooth muscle myosin, muscle specific actin, and Ki-67 (50%-60% expression).
Fluorodeoxyglucose positron emission tomography (FDG-PET) scan revealed a 5.7 x 5.9 cm tumor with a maximum standardized uptake value (SUVmax) of 12.6 in the right posterior prostate, without evidence of metastatic disease (Figures 1A and 1B). 
Discussion
Originating from prostatic interstitial cells, prostatic leiomyosarcoma is a rare tumor that accounts for < 0.1% of all primary prostatic malignancies.1 Since its first description in 1950 by Riba and colleagues, < 200 cases have been reported worldwide.2 Among the sarcomas of the prostate, it is the most common tumor, accounting for around 38% to 52% of prostate sarcoma presentations.1,2
Patients typically present between the ages of 41 and 78 years (mean age 61 years).2,3 Signs and symptoms at presentation may vary; however, the most common symptoms are related to lower urinary tract obstruction (89.4% of patients). These symptoms include urinary frequency, urgency, nocturia, and may mimic the presentation of BPH.
Symptoms commonly associated with other malignancies, including constitutional symptoms such as weight loss, tend to occur less frequently or may be absent. Perineal or rectal pain may only be present in 25.6% of patients. Hematuria, burning on ejaculation, and constitutional symptoms are a less common presentation (< 10% of patients).3,4 PSA levels typically do not rise and are found to be within normal limits. The lack of PSA elevation is related to the tumors nonepithelial origin and may contribute to a delay in diagnosis.2,4,5
Diagnosis
Diagnosis may be further eluded as digital rectal exam (DRE) findings tend to reveal nonspecific enlargement of the prostate, resembling that of BPH. DRE may show a hard and firm prostate with nodular induration at the base or over the lobes of the prostate.6 At this stage a urology consultation is useful, as diagnosis is most commonly achieved using transrectal ultrasound (TRUS) with ultrasound-guided needle biopsy or after a TURP procedure.3
Prostate sarcoma is associated with markedly enlarged prostate volume, irregular margins with invasion, or heterogenous hypoechoic lesions on TRUS.7 Transperineal biopsy, computed tomography (CT)-guided biopsy, or suprapubic prostatectomy have been less frequently employed for diagnosis in previously reported cases.8 Specialized imaging modalities, such as CT scan or bone scan, do not show any specific findings with regards to these tumors; their role is limited to evaluation of the local and distant metastasis and for follow-up assessments.9 Transabdominal ultrasound may assess hydronephrosis or enlarged prostate and its relation to nearby structures, although it has not been shown to be helpful in establishing a specific diagnosis.6
Histologically, prostatic leiomyosarcoma is a distinct subtype of prostatic sarcoma. Other subtypes include stromal tumors such as rhabdomyosarcoma, fibrosarcoma, and spindle cell sarcoma.2 The majority of leiomyosarcomas are high-grade lesions demonstrating neoplastic spindle cells with nuclear atypia, multifocal necrosis, and cystic degeneration. Low-grade leiomyosarcomas are very rare.10 Immunohistochemistry is characteristically positive for vimentin, smooth muscle actin, and desmin expression. Cytokeratin may be positive in up to 25% of cases, whereas S-100, CD34, CD117, and PSA are negative.2,3 These histopathological findings help to differentiate leiomyosarcoma from other prostatic tumors.
Tumor size may vary greatly, and measurements have been reported to range from 3 cm to 21 cm, frequently presenting with invasion of local structures.11 Advanced stage disease is commonly found at initial diagnosis and is thought to be due to the lack of early specific symptoms. Metastatic disease at presentation may be found in up to one-third of patients, with the lungs being the most common site of metastasis followed by the liver. Local extent and distant spread of disease may be determined by CT or magnetic resonance imaging (MRI) scans, which provide clear delineation of neoplastic and nonneoplastic tissues. 
Treatment
Treatment regimens may include a multimodal approach of combination surgery, radiation, and chemotherapy. However, there are currently no standardized guidelines for treatment and the optimal therapy remains unknown.2,3,6 Surgery remains the mainstay of treatment, and patients with surgically resectable tumors are treated with curative intent. Surgeries performed include radical retropubic prostatectomy, radical cystoprostatectomy, suprapubic prostatectomy, and pelvic exenteration.2,5,8,12 These operations may be preceded or followed by radiation therapy and/or chemotherapy depending on extent of disease.
It has been reported that neo-adjuvant chemotherapy and/or radiotherapy can aid in decreasing tumor burden to facilitate a complete resection.2,8,13,14 Patients who are determined to not be candidates for surgery or whom have widespread disease may be offered systemic chemotherapy. Chemotherapy regimens vary, but common regimens include anthracyclines (doxorubicin or epirubicin), alkylating agents (cyclophosphamide, ifosfamide, dacarbazine), and/or vinca alkaloids (vinblastine or vincristine). Patients who do not receive surgical intervention rarely achieve a sustained remission.3,5,8
The long-term prognosis of prostatic leiomyosarcoma is poor due to the aggressive nature of the neoplasm and the high chance of disease recurrence or metastasis. Median survival is estimated at 17 months, and from 50% to 75% of patients die within 2 to 5 years of diagnosis.2,3 Prognosis may be improved in patients with localized disease at diagnosis who are candidates for complete surgical resection with negative margins.13 Adverse prognostic factors include metastatic disease at presentation and the presence of positive surgical margins after surgery.
Overall survival is very poor, and it is estimated that the 1-, 3-, and 5-year survival rates are 68%, 34%, and 26%, respectively.3 However, some studies estimate the 5-year survival to be anywhere from 0 to 60%.8,9 Due to the substantially high risk of death, prostatic leiomyosarcoma may be one of the most aggressive and poorly prognostic malignancies involving the prostate.
Conclusion
Prostatic leiomyosarcoma poses a unique diagnostic challenge, as clinical presentation alone may not always be suggestive of underlying malignancy. This challenge is further exacerbated by its aggressive nature, high risk of metastasis, and difficulties with unclear treatment. Proper history and physical examination, differential diagnosis, and a multidisciplinary approach to patient care are the foundation for early detection and promoting improved survival.
Author disclosures
The authors report no actual or potential conflicts of interest with regard to this article.
Disclaimer
The opinions expressed herein are those of the authors and do not necessarily reflect those of Federal Practitioner, Frontline Medical Communications Inc., the US Government, or any of its agencies. This article may discuss unlabeled or investigational use of certain drugs. Please review the complete prescribing information for specific drugs or drug combinations—including indications, contraindications, warnings, and adverse effects—before administering pharmacologic therapy to patients.
1. Miedler JD, MacLennan GT. Leiomyosarcoma of the prostate. J Urol. 2007;178(2):668.
2. Zazzara M, Divenuto L, Scarcia M, Cardo G, Maselli FP, Ludovico GM. Leiomyosarcoma of prostate: case report and literature review. Urol Case Rep. 2018;17:4-6.
3. Vandoros GP, Manolidis T, Karamouzis MV, et al. Leiomyosarcoma of the prostate: case report and review of 54 previously published cases. Sarcoma. 2008;2008:458709.
4. Talapatra K, Nemade B, Bhutani R, et al. Recurrent episodes of hematuria: a rare presentation of leiomyosarcoma of prostate. J Cancer Res Ther. 2006;2(4):212-214.
5. Cheville JC, Dundore PA, Nascimento AG, et al. Leiomyosarcoma of the prostate. Report of 23 cases. Cancer. 1995;76(8):1422-1427.
6. Venyo AK. A review of the literature on primary leiomyosarcoma of the prostate gland. Adv Urol. 2015;2015:485786.
7. Stilgenbauer R, Benedict M, Bamshad R, Viduetsky A. Sarcoma of the prostate: sonographic findings and pathologic correlation. J Ultrasound Med. 2007;26(12):1789-1793.
8. Sexton WJ, Lance RE, Reyes AO, Pisters PW, Tu SM, Pisters LL. Adult prostate sarcoma: the M.D. Anderson Cancer Center experience. J Urol. 2001;166(2):521-525.
9. Singh JP, Chakraborty D, Bera MK, Pal D. Leiomyosarcoma of prostate: a rare, aggressive tumor. J Cancer Res Ther. 2013;9(4):743-745.
10. Hansel DE, Herawi M, Montgomery E, Epstein JI. Spindle cell lesions of the adult prostate. Mod Pathol. 2007;20(1):148-158.
11. Punt SE, Eary JF, O'Sullivan J, Conrad EU. Fluorodeoxyglucose positron emission tomography in leiomyosarcoma: imaging characteristics. Nucl Med Commun. 2009;30(7):546-549.
12. Dotan ZA, Tal R, Golijanin D, et al. Adult genitourinary sarcoma: the 25-year Memorial Sloan-Kettering experience. J Urol. 2006;176(5):2033-2038.
13. Musser JE, Assel M, Mashni JW, Sjoberg DD, Russo P. Adult prostate sarcoma: the Memorial Sloan Kettering experience. Urology. 2014;84(3):624-628.
14. Janet NL, May AW, Akins RS. Sarcoma of the prostate: a single institutional review. Am J Clin Oncol. 2009;32:27-29
Prostatic leiomyosarcoma is an aggressive malignancy with a high risk of metastasis and a poor prognosis that poses unique diagnostic and treatment challenges.
Prostatic leiomyosarcoma is an aggressive malignancy with a high risk of metastasis and a poor prognosis that poses unique diagnostic and treatment challenges.
Prostatic leiomyosarcoma is a rare tumor.1 This neoplasm is composed of highly aggressive prostatic smooth muscle cells that present with nonspecific signs and symptoms mimicking other forms of prostatic pathology. Of the primary prostatic sarcomas, leiomyosarcoma represents the most common subtype in adults and is found in 38% to 52% of newly diagnosed prostate sarcoma.1,2 The prognosis is poor, and no clear guidelines exist regarding the optimal treatment approach. We report a case of prostate leiomyosarcoma and describe the disease characteristics, diagnostic modalities, and treatment approach regarding these rare malignancies.
Case Presentation
A 72-year-old male presented with 6 months of progressive severe lower urinary tract symptoms (LUTS) secondary to bladder outlet obstruction. The patient was refractory to medical management with combination α-blocker and 5-α-reductase inhibitor therapy and continued to require multiple emergent bladder catheterizations. Workup with urinalysis, blood biochemistry, and prostate specific antigen (PSA) levels were persistently normal. He reported no hematuria, weight loss, or perineal pain. The patient reported no history of tobacco use, exposure to hazardous chemicals, and had no family history of genitourinary cancers. On rectal exam, the prostate was firm and nodular, with induration noted along the right upper lobe of the prostate.
The patient was referred for a urology consultation and subsequently underwent transurethral resection of the prostate (TURP) for suspected severe benign prostatic hypertrophy (BPH). A histopathologic examination demonstrated atypical cytology consistent with high- grade leiomyosarcoma. Immunohistochemical analysis revealed positive staining for vimentin, smooth muscle actin, desmin (partial), cytokeratin, smooth muscle myosin, muscle specific actin, and Ki-67 (50%-60% expression).
Fluorodeoxyglucose positron emission tomography (FDG-PET) scan revealed a 5.7 x 5.9 cm tumor with a maximum standardized uptake value (SUVmax) of 12.6 in the right posterior prostate, without evidence of metastatic disease (Figures 1A and 1B).
Discussion
Originating from prostatic interstitial cells, prostatic leiomyosarcoma is a rare tumor that accounts for < 0.1% of all primary prostatic malignancies.1 Since its first description in 1950 by Riba and colleagues, < 200 cases have been reported worldwide.2 Among the sarcomas of the prostate, it is the most common tumor, accounting for around 38% to 52% of prostate sarcoma presentations.1,2
Patients typically present between the ages of 41 and 78 years (mean age 61 years).2,3 Signs and symptoms at presentation may vary; however, the most common symptoms are related to lower urinary tract obstruction (89.4% of patients). These symptoms include urinary frequency, urgency, nocturia, and may mimic the presentation of BPH.
Symptoms commonly associated with other malignancies, including constitutional symptoms such as weight loss, tend to occur less frequently or may be absent. Perineal or rectal pain may only be present in 25.6% of patients. Hematuria, burning on ejaculation, and constitutional symptoms are a less common presentation (< 10% of patients).3,4 PSA levels typically do not rise and are found to be within normal limits. The lack of PSA elevation is related to the tumors nonepithelial origin and may contribute to a delay in diagnosis.2,4,5
Diagnosis
Diagnosis may be further eluded as digital rectal exam (DRE) findings tend to reveal nonspecific enlargement of the prostate, resembling that of BPH. DRE may show a hard and firm prostate with nodular induration at the base or over the lobes of the prostate.6 At this stage a urology consultation is useful, as diagnosis is most commonly achieved using transrectal ultrasound (TRUS) with ultrasound-guided needle biopsy or after a TURP procedure.3
Prostate sarcoma is associated with markedly enlarged prostate volume, irregular margins with invasion, or heterogenous hypoechoic lesions on TRUS.7 Transperineal biopsy, computed tomography (CT)-guided biopsy, or suprapubic prostatectomy have been less frequently employed for diagnosis in previously reported cases.8 Specialized imaging modalities, such as CT scan or bone scan, do not show any specific findings with regards to these tumors; their role is limited to evaluation of the local and distant metastasis and for follow-up assessments.9 Transabdominal ultrasound may assess hydronephrosis or enlarged prostate and its relation to nearby structures, although it has not been shown to be helpful in establishing a specific diagnosis.6
Histologically, prostatic leiomyosarcoma is a distinct subtype of prostatic sarcoma. Other subtypes include stromal tumors such as rhabdomyosarcoma, fibrosarcoma, and spindle cell sarcoma.2 The majority of leiomyosarcomas are high-grade lesions demonstrating neoplastic spindle cells with nuclear atypia, multifocal necrosis, and cystic degeneration. Low-grade leiomyosarcomas are very rare.10 Immunohistochemistry is characteristically positive for vimentin, smooth muscle actin, and desmin expression. Cytokeratin may be positive in up to 25% of cases, whereas S-100, CD34, CD117, and PSA are negative.2,3 These histopathological findings help to differentiate leiomyosarcoma from other prostatic tumors.
Tumor size may vary greatly, and measurements have been reported to range from 3 cm to 21 cm, frequently presenting with invasion of local structures.11 Advanced stage disease is commonly found at initial diagnosis and is thought to be due to the lack of early specific symptoms. Metastatic disease at presentation may be found in up to one-third of patients, with the lungs being the most common site of metastasis followed by the liver. Local extent and distant spread of disease may be determined by CT or magnetic resonance imaging (MRI) scans, which provide clear delineation of neoplastic and nonneoplastic tissues.
Treatment
Treatment regimens may include a multimodal approach of combination surgery, radiation, and chemotherapy. However, there are currently no standardized guidelines for treatment and the optimal therapy remains unknown.2,3,6 Surgery remains the mainstay of treatment, and patients with surgically resectable tumors are treated with curative intent. Surgeries performed include radical retropubic prostatectomy, radical cystoprostatectomy, suprapubic prostatectomy, and pelvic exenteration.2,5,8,12 These operations may be preceded or followed by radiation therapy and/or chemotherapy depending on extent of disease.
It has been reported that neo-adjuvant chemotherapy and/or radiotherapy can aid in decreasing tumor burden to facilitate a complete resection.2,8,13,14 Patients who are determined to not be candidates for surgery or whom have widespread disease may be offered systemic chemotherapy. Chemotherapy regimens vary, but common regimens include anthracyclines (doxorubicin or epirubicin), alkylating agents (cyclophosphamide, ifosfamide, dacarbazine), and/or vinca alkaloids (vinblastine or vincristine). Patients who do not receive surgical intervention rarely achieve a sustained remission.3,5,8
The long-term prognosis of prostatic leiomyosarcoma is poor due to the aggressive nature of the neoplasm and the high chance of disease recurrence or metastasis. Median survival is estimated at 17 months, and from 50% to 75% of patients die within 2 to 5 years of diagnosis.2,3 Prognosis may be improved in patients with localized disease at diagnosis who are candidates for complete surgical resection with negative margins.13 Adverse prognostic factors include metastatic disease at presentation and the presence of positive surgical margins after surgery.
Overall survival is very poor, and it is estimated that the 1-, 3-, and 5-year survival rates are 68%, 34%, and 26%, respectively.3 However, some studies estimate the 5-year survival to be anywhere from 0 to 60%.8,9 Due to the substantially high risk of death, prostatic leiomyosarcoma may be one of the most aggressive and poorly prognostic malignancies involving the prostate.
Conclusion
Prostatic leiomyosarcoma poses a unique diagnostic challenge, as clinical presentation alone may not always be suggestive of underlying malignancy. This challenge is further exacerbated by its aggressive nature, high risk of metastasis, and difficulties with unclear treatment. Proper history and physical examination, differential diagnosis, and a multidisciplinary approach to patient care are the foundation for early detection and promoting improved survival.
Author disclosures
The authors report no actual or potential conflicts of interest with regard to this article.
Disclaimer
The opinions expressed herein are those of the authors and do not necessarily reflect those of Federal Practitioner, Frontline Medical Communications Inc., the US Government, or any of its agencies. This article may discuss unlabeled or investigational use of certain drugs. Please review the complete prescribing information for specific drugs or drug combinations—including indications, contraindications, warnings, and adverse effects—before administering pharmacologic therapy to patients.
1. Miedler JD, MacLennan GT. Leiomyosarcoma of the prostate. J Urol. 2007;178(2):668.
2. Zazzara M, Divenuto L, Scarcia M, Cardo G, Maselli FP, Ludovico GM. Leiomyosarcoma of prostate: case report and literature review. Urol Case Rep. 2018;17:4-6.
3. Vandoros GP, Manolidis T, Karamouzis MV, et al. Leiomyosarcoma of the prostate: case report and review of 54 previously published cases. Sarcoma. 2008;2008:458709.
4. Talapatra K, Nemade B, Bhutani R, et al. Recurrent episodes of hematuria: a rare presentation of leiomyosarcoma of prostate. J Cancer Res Ther. 2006;2(4):212-214.
5. Cheville JC, Dundore PA, Nascimento AG, et al. Leiomyosarcoma of the prostate. Report of 23 cases. Cancer. 1995;76(8):1422-1427.
6. Venyo AK. A review of the literature on primary leiomyosarcoma of the prostate gland. Adv Urol. 2015;2015:485786.
7. Stilgenbauer R, Benedict M, Bamshad R, Viduetsky A. Sarcoma of the prostate: sonographic findings and pathologic correlation. J Ultrasound Med. 2007;26(12):1789-1793.
8. Sexton WJ, Lance RE, Reyes AO, Pisters PW, Tu SM, Pisters LL. Adult prostate sarcoma: the M.D. Anderson Cancer Center experience. J Urol. 2001;166(2):521-525.
9. Singh JP, Chakraborty D, Bera MK, Pal D. Leiomyosarcoma of prostate: a rare, aggressive tumor. J Cancer Res Ther. 2013;9(4):743-745.
10. Hansel DE, Herawi M, Montgomery E, Epstein JI. Spindle cell lesions of the adult prostate. Mod Pathol. 2007;20(1):148-158.
11. Punt SE, Eary JF, O'Sullivan J, Conrad EU. Fluorodeoxyglucose positron emission tomography in leiomyosarcoma: imaging characteristics. Nucl Med Commun. 2009;30(7):546-549.
12. Dotan ZA, Tal R, Golijanin D, et al. Adult genitourinary sarcoma: the 25-year Memorial Sloan-Kettering experience. J Urol. 2006;176(5):2033-2038.
13. Musser JE, Assel M, Mashni JW, Sjoberg DD, Russo P. Adult prostate sarcoma: the Memorial Sloan Kettering experience. Urology. 2014;84(3):624-628.
14. Janet NL, May AW, Akins RS. Sarcoma of the prostate: a single institutional review. Am J Clin Oncol. 2009;32:27-29
Primary Urethral Carcinoma With Nodal Metastasis (FULL)
The presentation of a fungating penile mass often indicates penile carcinoma, but providers should be aware of urethral carcinoma in the differential diagnosis.
Primary urethral carcinoma (PUC) is a rare but morbid disease, representing < 1% of all urologic malignancies.1 Up to one-third of male patients may present with nodal metastases.2-4 The overall survival (OS) for all male PUC is < 50% at 5 years and is lower still in patients with nodal involvement.4
Although surgical intervention, including radical resection, has been a mainstay in disease management, the presence of high-stage disease may warrant multimodal treatment with chemotherapy, radiation, and surgery. Recent series have described success with neoadjuvant and adjuvant chemoradiation, yet the optimal regimen remains unestablished.5,6 Although nodal disease is commonly encountered with proximal, high-stage tumors, this case exhibits a rare presentation of a distal fungating penile mass with low pathologic stage but rapid progression to nodal disease.
Case Presentation
A male veteran aged 77 years with a history of diabetes mellitus and stroke presented with obstructive urinary symptoms, gross hematuria, and 15-pound weight loss. Examination revealed a distal penile mass with purulent exudate at the meatus but no inguinal lymphadenopathy. Two fragments of this mass detached during office cystoscopy, and pathology revealed high-grade urothelial cell carcinoma (UCC). A magnetic resonance image of the pelvis with and without IV contrast revealed a 2.4-cm tumor in the glans penis with possible extension into the subcutaneous connective tissue of the penis and penile skin, without invasion of the corpora cavernosa/spongiosum or lymphadenopathy (Figure 1). 
Prostatic urethral and random bladder biopsies, bilateral retrograde pyelograms, and selective ureteral washings revealed no abnormalities or signs of disease. Percutaneous biopsy of the inguinal node confirmed metastatic UCC. The patient underwent radical penectomy, creation of a perineal urethrostomy, and suprapubic cystostomy tube placement. Negative margins were confirmed on the urethral stump and corpus spongiosum. Final pathology revealed high-grade UCC with squamous differentiation on hematoxylin and eosin staining, arising from the penile urethra, invading the glans and corpus spongiosum, with no invasion of the corpus cavernosa (Figures 3 and 4).
Immunohistochemical stains were performed and strongly positive for cytokeratin 7 and p63. Final pathologic stage was described as pT2N1, with negative margins, indicating an American Joint Committee on Cancer classification of Stage III disease.7 The patient was referred postoperatively for adjuvant chemoradiation. 

Discussion
The low incidence of PUC, coupled with a high morbidity/mortality rate, creates a difficult scenario in choosing the best oncologic management for this disease. National guidelines stratify treatment algorithms by stage and location of primary tumor, as these were found to be the 2 most important prognostic factors for men.1 The location of the primary tumor is most often in the bulbomembranous urethra, but up to one-third occur in the pendulous urethra.2
A recent review reported that UCC is the most common histologic subtype.4 When considering the differential diagnosis, a distal penile mass may represent a malignant penile lesion, such as squamous cell carcinoma, Buschke-Lowenstein tumor, Kaposi sarcoma, or precancerous lesions. Additional benign and infectious disorders include epidermoid and retention cysts, leukoplakia, balanitis xerotica obliterans, condyloma acuminatum, chancre/chancroid, lymphogranuloma venereum, granuloma inguinale, and tuberculosis. Clinical workup typically includes physical examination, cystourethroscopy and biopsy, chest X-ray, and pelvic/abdominal cross-sectional imaging.9,10 Magnetic resonance imaging of the abdomen and pelvis is ideal in identifying soft tissue structures and extension of tumor.
In male patients with PUC, nodal metastases are commonly seen at initial presentation in up to one-third of patients, while distant metastases may be present in up to 6% at presentation.2-4 When tumors arise from the anterior urethra, the primary lymphatic drainage is first to the inguinal lymph nodes, whereas posterior tumors drain to the pelvic lymph nodes. A multivariate analysis of men with PUC within the Surveillance, Epidemiology, and End Results database demonstrated an OS across all stages to be 46.2% and 29.3% at 5 and 10 years, respectively. Increased likelihood of death was predicted by advanced age, high grade/stage, systemic metastases, non-UCC histology, and the lack of surgery.4
Surgical intervention, including radical resection via penectomy, has been the mainstay in disease management and was first described by Marshall in 1957 for bulbar urethral cancer.11 In 1998, Gheiler and colleagues demonstrated that surgical resection alone yielded excellent outcomes in patients with low-stage disease with 89% of patients disease free at mean 42 months. This was in stark contrast to patients with advanced stage disease (T3 or N+) who exhibited a disease-free survival rate of 42% at the same follow-up interval and benefited from combined chemoradiation and surgical resection.3
In the presence of high-stage disease, multimodal therapy with chemotherapy, radiation, and/or surgery is warranted. A study in 2008 reviewed chemoradiation in which patients with PUC received a 5-week protocol of external beam radiotherapy to the genitals, inguinal/pelvic lymph nodes, plus an additional radiation bolus to the primary tumor.5 In the 18 patients reported, 15 had complete response to therapy, and only 4 patients required salvage surgical resection. The 7-year survival for the cohort was 72% with chemoradiation alone, with about half the population recurring or progressing at 7 years. However, all patients that avoided surgical resection went on to develop urethral strictures that required surgical therapy, 3 of which required complex reconstructive procedures.
To place this survival into context, the 1999 study by Dalbagni and colleagues reported a 5-year OS of 42% when surgical resection alone was performed in 40/46 men with PUC.2 Last, a large retrospective series of 44 patients reported mostly advanced-stage patients with PUC and analyzed patients treated with chemotherapy based on histologic pathology. The results demonstrated a 72% overall response rate to neoadjuvant chemotherapy, with a median OS of 32 months in patients undergoing chemotherapy vs 46 months in patients who underwent subsequent surgery. This study solidified that for patients with PUC involving the lymph nodes; optimal treatment includes neoadjuvant cisplatin-based chemotherapy followed by surgical resection.6
As medicine and oncologic therapies become more individualized, physicians are looking to new immunologic agents for systemic therapy. Immune checkpoint inhibitors were approved by the US Food and Drug Administration for UCC of the bladder in 2016.12 Unfortunately, due to the rarity of PUC and the recent development of immune checkpoint inhibitors, there have been no published reports of these or other immunotherapies in PUC. However, given the histologic similarity and pathogenesis, checkpoint inhibitors may have a future indication in the systemic management of this disease.
Conclusion
This patient’s PUC represents a rare presentation of a distal urethral carcinoma, T2-staged tumor, with rapid progression to nodal metastases. Additionally, the presentation of a fungating penile mass would usually indicate penile carcinoma, but providers should be aware of urethral carcinoma in the differential diagnosis. Notably, the patient was found to have progression to lymph node involvement during a mere 2-month period.
Recent case series have published encouraging results with neoadjuvant chemotherapy or chemoradiation.5,6 However, radical resection in men with T2 to T4 disease is associated with significantly higher cancer-specific survival. Given our concern of a loss to follow-up, we felt that radical resection of the primary tumor and adjuvant chemoradiation represented the patient’s best oncologic outcomes. Therefore, he underwent radical penectomy and creation of a perineal urethrostomy. As of his 6-month follow-up, he showed no evidence of disease, had returned to his preoperative functional status, and was referred for chemoradiation.
Author disclosures
The authors report no actual or potential conflicts of interest with regard to this article.
Disclaimer
The opinions expressed herein are those of the authors and do not necessarily reflect those of Federal Practitioner, Frontline Medical Communications Inc., the US Government, or any of its agencies. This article may discuss unlabeled or investigational use of certain drugs. Please review the complete prescribing information for specific drugs or drug combinations—including indications, contraindications, warnings, and adverse effects—before administering pharmacologic therapy to patients.
1. Swartz MA, Porter MP, Lin DW, Weiss NS. Incidence of primary urethral carcinoma in the United States. Urology. 2006;68(6):1164-1168.
2. Dalbagni G, Zhang ZF, Lacombe L, Herr HW. Male urethral carcinoma: analysis of treatment outcome. Urology. 1999;53(6):1126-1132.
3. Gheiler EL, Tefilli MV, Tiguert R, de Oliveira JG, Pontes JE, Wood DP Jr. Management of primary urethral cancer. Urology. 1998;52(3):487-493.
4. Rabbani F. Prognostic factors in male urethral cancer. Cancer. 2011;117(11):2426-2434.
5. Cohen MS, Triaca V, Billmeyer B, et al. Coordinated chemoradiation therapy with genital preservation for the treatment of primary invasive carcinoma of the male urethra. J Urol. 2008;179(2):536-541; discussion 541.
6. Dayyani F, Pettaway CA, Kamat AM, Munsell MF, Sircar K, Pagliaro LC. Retrospective analysis of survival outcomes and the role of cisplatin-based chemotherapy in patients with urethral carcinomas referred to medical oncologists. Urol Oncol. 2013;31(7):1171-1177.
7. American Joint Committee on Cancer. AJCC cancer staging manual. 8th ed. https://cancerstaging.org/references-tools/deskreferences/Documents/AJCC%20Cancer%20Staging%20Form%20Supplement.pdf. Updated June 5, 2018. Accessed January 22, 2019.
8. Gakis G, Witjes JA, Compérat E, et al. European Association of Urology guidelines on primary urethral carcinoma. https://uroweb.org/wp-content/uploads/EAU-Guidelines-Primary-Urethral-Carcinoma-2016-1.pdf. Updated March 2015. Accessed January 22, 2019
9. National Comprehensive Cancer Network. Bladder Cancer. Version 1.2019. https://www.nccn.org/professionals/physician_gls/pdf/bladder.pdf. Updated December 20, 2018. Accessed January 17, 2019.
10. Dayyani F, Hoffman K, Eifel P, et al. Management of advanced primary urethral carcinomas. BJU Int. 2014;114(1):25-31.
11. Marshall VF. Radical excision of locally extensive carcinoma of the deep male urethra. J Urol. 1957;78(3):252-264.
12. Hsu FS, Su CH, Huang KH. A comprehensive review of US FDA-approved immune checkpoint inhibitors in urothelial carcinoma. J Immunol Res. 2017;2017:6940546.
The presentation of a fungating penile mass often indicates penile carcinoma, but providers should be aware of urethral carcinoma in the differential diagnosis.
The presentation of a fungating penile mass often indicates penile carcinoma, but providers should be aware of urethral carcinoma in the differential diagnosis.
Primary urethral carcinoma (PUC) is a rare but morbid disease, representing < 1% of all urologic malignancies.1 Up to one-third of male patients may present with nodal metastases.2-4 The overall survival (OS) for all male PUC is < 50% at 5 years and is lower still in patients with nodal involvement.4
Although surgical intervention, including radical resection, has been a mainstay in disease management, the presence of high-stage disease may warrant multimodal treatment with chemotherapy, radiation, and surgery. Recent series have described success with neoadjuvant and adjuvant chemoradiation, yet the optimal regimen remains unestablished.5,6 Although nodal disease is commonly encountered with proximal, high-stage tumors, this case exhibits a rare presentation of a distal fungating penile mass with low pathologic stage but rapid progression to nodal disease.
Case Presentation
A male veteran aged 77 years with a history of diabetes mellitus and stroke presented with obstructive urinary symptoms, gross hematuria, and 15-pound weight loss. Examination revealed a distal penile mass with purulent exudate at the meatus but no inguinal lymphadenopathy. Two fragments of this mass detached during office cystoscopy, and pathology revealed high-grade urothelial cell carcinoma (UCC). A magnetic resonance image of the pelvis with and without IV contrast revealed a 2.4-cm tumor in the glans penis with possible extension into the subcutaneous connective tissue of the penis and penile skin, without invasion of the corpora cavernosa/spongiosum or lymphadenopathy (Figure 1).
Prostatic urethral and random bladder biopsies, bilateral retrograde pyelograms, and selective ureteral washings revealed no abnormalities or signs of disease. Percutaneous biopsy of the inguinal node confirmed metastatic UCC. The patient underwent radical penectomy, creation of a perineal urethrostomy, and suprapubic cystostomy tube placement. Negative margins were confirmed on the urethral stump and corpus spongiosum. Final pathology revealed high-grade UCC with squamous differentiation on hematoxylin and eosin staining, arising from the penile urethra, invading the glans and corpus spongiosum, with no invasion of the corpus cavernosa (Figures 3 and 4).
Immunohistochemical stains were performed and strongly positive for cytokeratin 7 and p63. Final pathologic stage was described as pT2N1, with negative margins, indicating an American Joint Committee on Cancer classification of Stage III disease.7 The patient was referred postoperatively for adjuvant chemoradiation.
Discussion
The low incidence of PUC, coupled with a high morbidity/mortality rate, creates a difficult scenario in choosing the best oncologic management for this disease. National guidelines stratify treatment algorithms by stage and location of primary tumor, as these were found to be the 2 most important prognostic factors for men.1 The location of the primary tumor is most often in the bulbomembranous urethra, but up to one-third occur in the pendulous urethra.2
A recent review reported that UCC is the most common histologic subtype.4 When considering the differential diagnosis, a distal penile mass may represent a malignant penile lesion, such as squamous cell carcinoma, Buschke-Lowenstein tumor, Kaposi sarcoma, or precancerous lesions. Additional benign and infectious disorders include epidermoid and retention cysts, leukoplakia, balanitis xerotica obliterans, condyloma acuminatum, chancre/chancroid, lymphogranuloma venereum, granuloma inguinale, and tuberculosis. Clinical workup typically includes physical examination, cystourethroscopy and biopsy, chest X-ray, and pelvic/abdominal cross-sectional imaging.9,10 Magnetic resonance imaging of the abdomen and pelvis is ideal in identifying soft tissue structures and extension of tumor.
In male patients with PUC, nodal metastases are commonly seen at initial presentation in up to one-third of patients, while distant metastases may be present in up to 6% at presentation.2-4 When tumors arise from the anterior urethra, the primary lymphatic drainage is first to the inguinal lymph nodes, whereas posterior tumors drain to the pelvic lymph nodes. A multivariate analysis of men with PUC within the Surveillance, Epidemiology, and End Results database demonstrated an OS across all stages to be 46.2% and 29.3% at 5 and 10 years, respectively. Increased likelihood of death was predicted by advanced age, high grade/stage, systemic metastases, non-UCC histology, and the lack of surgery.4
Surgical intervention, including radical resection via penectomy, has been the mainstay in disease management and was first described by Marshall in 1957 for bulbar urethral cancer.11 In 1998, Gheiler and colleagues demonstrated that surgical resection alone yielded excellent outcomes in patients with low-stage disease with 89% of patients disease free at mean 42 months. This was in stark contrast to patients with advanced stage disease (T3 or N+) who exhibited a disease-free survival rate of 42% at the same follow-up interval and benefited from combined chemoradiation and surgical resection.3
In the presence of high-stage disease, multimodal therapy with chemotherapy, radiation, and/or surgery is warranted. A study in 2008 reviewed chemoradiation in which patients with PUC received a 5-week protocol of external beam radiotherapy to the genitals, inguinal/pelvic lymph nodes, plus an additional radiation bolus to the primary tumor.5 In the 18 patients reported, 15 had complete response to therapy, and only 4 patients required salvage surgical resection. The 7-year survival for the cohort was 72% with chemoradiation alone, with about half the population recurring or progressing at 7 years. However, all patients that avoided surgical resection went on to develop urethral strictures that required surgical therapy, 3 of which required complex reconstructive procedures.
To place this survival into context, the 1999 study by Dalbagni and colleagues reported a 5-year OS of 42% when surgical resection alone was performed in 40/46 men with PUC.2 Last, a large retrospective series of 44 patients reported mostly advanced-stage patients with PUC and analyzed patients treated with chemotherapy based on histologic pathology. The results demonstrated a 72% overall response rate to neoadjuvant chemotherapy, with a median OS of 32 months in patients undergoing chemotherapy vs 46 months in patients who underwent subsequent surgery. This study solidified that for patients with PUC involving the lymph nodes; optimal treatment includes neoadjuvant cisplatin-based chemotherapy followed by surgical resection.6
As medicine and oncologic therapies become more individualized, physicians are looking to new immunologic agents for systemic therapy. Immune checkpoint inhibitors were approved by the US Food and Drug Administration for UCC of the bladder in 2016.12 Unfortunately, due to the rarity of PUC and the recent development of immune checkpoint inhibitors, there have been no published reports of these or other immunotherapies in PUC. However, given the histologic similarity and pathogenesis, checkpoint inhibitors may have a future indication in the systemic management of this disease.
Conclusion
This patient’s PUC represents a rare presentation of a distal urethral carcinoma, T2-staged tumor, with rapid progression to nodal metastases. Additionally, the presentation of a fungating penile mass would usually indicate penile carcinoma, but providers should be aware of urethral carcinoma in the differential diagnosis. Notably, the patient was found to have progression to lymph node involvement during a mere 2-month period.
Recent case series have published encouraging results with neoadjuvant chemotherapy or chemoradiation.5,6 However, radical resection in men with T2 to T4 disease is associated with significantly higher cancer-specific survival. Given our concern of a loss to follow-up, we felt that radical resection of the primary tumor and adjuvant chemoradiation represented the patient’s best oncologic outcomes. Therefore, he underwent radical penectomy and creation of a perineal urethrostomy. As of his 6-month follow-up, he showed no evidence of disease, had returned to his preoperative functional status, and was referred for chemoradiation.
Author disclosures
The authors report no actual or potential conflicts of interest with regard to this article.
Disclaimer
The opinions expressed herein are those of the authors and do not necessarily reflect those of Federal Practitioner, Frontline Medical Communications Inc., the US Government, or any of its agencies. This article may discuss unlabeled or investigational use of certain drugs. Please review the complete prescribing information for specific drugs or drug combinations—including indications, contraindications, warnings, and adverse effects—before administering pharmacologic therapy to patients.
1. Swartz MA, Porter MP, Lin DW, Weiss NS. Incidence of primary urethral carcinoma in the United States. Urology. 2006;68(6):1164-1168.
2. Dalbagni G, Zhang ZF, Lacombe L, Herr HW. Male urethral carcinoma: analysis of treatment outcome. Urology. 1999;53(6):1126-1132.
3. Gheiler EL, Tefilli MV, Tiguert R, de Oliveira JG, Pontes JE, Wood DP Jr. Management of primary urethral cancer. Urology. 1998;52(3):487-493.
4. Rabbani F. Prognostic factors in male urethral cancer. Cancer. 2011;117(11):2426-2434.
5. Cohen MS, Triaca V, Billmeyer B, et al. Coordinated chemoradiation therapy with genital preservation for the treatment of primary invasive carcinoma of the male urethra. J Urol. 2008;179(2):536-541; discussion 541.
6. Dayyani F, Pettaway CA, Kamat AM, Munsell MF, Sircar K, Pagliaro LC. Retrospective analysis of survival outcomes and the role of cisplatin-based chemotherapy in patients with urethral carcinomas referred to medical oncologists. Urol Oncol. 2013;31(7):1171-1177.
7. American Joint Committee on Cancer. AJCC cancer staging manual. 8th ed. https://cancerstaging.org/references-tools/deskreferences/Documents/AJCC%20Cancer%20Staging%20Form%20Supplement.pdf. Updated June 5, 2018. Accessed January 22, 2019.
8. Gakis G, Witjes JA, Compérat E, et al. European Association of Urology guidelines on primary urethral carcinoma. https://uroweb.org/wp-content/uploads/EAU-Guidelines-Primary-Urethral-Carcinoma-2016-1.pdf. Updated March 2015. Accessed January 22, 2019
9. National Comprehensive Cancer Network. Bladder Cancer. Version 1.2019. https://www.nccn.org/professionals/physician_gls/pdf/bladder.pdf. Updated December 20, 2018. Accessed January 17, 2019.
10. Dayyani F, Hoffman K, Eifel P, et al. Management of advanced primary urethral carcinomas. BJU Int. 2014;114(1):25-31.
11. Marshall VF. Radical excision of locally extensive carcinoma of the deep male urethra. J Urol. 1957;78(3):252-264.
12. Hsu FS, Su CH, Huang KH. A comprehensive review of US FDA-approved immune checkpoint inhibitors in urothelial carcinoma. J Immunol Res. 2017;2017:6940546.
Skeletal-Related Events in Patients With Multiple Myeloma and Prostate Cancer Who Receive Standard vs Extended-Interval Bisphosphonate Dosing (FULL)
In patients with multiple myeloma and prostate cancer, extending the bisphosphonatedosing interval may help decrease medication-related morbidity without compromising therapeutic benefit.
Bone pain is one of the most common causes of morbidity in multiple myeloma (MM) and metastatic prostate cancer (CaP). This pain originates with the underlying pathologic processes of the cancer and with downstream skeletal-related events (SREs). SREs—fractures, spinal cord compression, and irradiation or surgery performed in ≥ 1 bone sites—represent a significant health care burden, particularly given the incidence of the underlying malignancies. According to American Cancer Society statistics, CaP is the second most common cancer in American men, and MM the second most common hematologic malignancy, despite its relatively low overall lifetime risk.1,2 Regardless of the underlying malignancy, bisphosphonates are the cornerstone of SRE prevention, though the optimal dosing strategy is the subject of clinical debate.
Although similar in SRE incidence, MM and CaP have distinct pathophysiologic processes in the dysregulation of bone resorption. MM is a hematologic malignancy that increases the risk of SREs by osteoclast up-regulation, primarily through the RANK (receptor activator of nuclear factor α-B) signaling pathway.3 CaP is a solid tumor malignancy that metastasizes to bone. Dysregulation of the bone resorption or formation cycle and net bone loss are a result of endogenous osteoclast up-regulation in response to abnormal bone formation in osteoblastic bone metastases.4 Androgen-deprivation therapy, the cornerstone of CaP treatment, further predisposes CaP patients to osteoporosis and SREs.
Prevention of SREs is pharmacologically driven by bisphosphonates, which have antiresorptive effects on bone through promotion of osteoclast apoptosis.5 Two IV formulations, pamidronate and zoledronic acid (ZA), are US Food and Drug Administration approved for use in bone metastases from MM or solid tumors.6-10 Although generally well tolerated, bisphosphonates can cause osteonecrosis of the jaw (ONJ), an avascular death of bone tissue, particularly with prolonged use.11 With its documented incidence of 5% to 6.7% in bone metastasis, ONJ represents a significant morbidity risk in patients with MM and CaP who are treated with IV bisphosphonates.12
Investigators are exploring bisphosphonate dosing intervals to determine which is most appropriate in mitigating the risk of ONJ. Before 2006, bisphosphonates were consistently dosed once monthly in patients with MM or metastatic bone disease—a standard derived empirically rather than from comparative studies or compelling pharmacodynamic data.13-15 In a 2006 consensus statement, the Mayo Clinic issued an expert opinion recommendation for increasing the bisphosphonate dosing interval to every 3 months in patients with MM.16 The first objective evidence for the clinical applicability of extending the ZA dosing interval was reported by Himelstein and colleagues in 2017.17 The randomized clinical trial found no differences in SRE rates when ZA was dosed every 12 weeks,17 prompting a conditional recommendation for dosing interval extension in the American Society of Clinical Oncology MM treatment guidelines (2018).13 Because of the age and racial demographics of the patients in these studies, many questions remain unanswered.
For the US Department of Veterans Affairs (VA) population, the pharmacokinetic and dynamic differences imposed by age and race limit the applicability of the available data. However, in veterans with MM or CaP, extending the bisphosphonate dosing interval may help decrease medication-related morbidity (eg, ONJ, nephrotoxicity) without compromising therapeutic benefit. To this end at the Memphis VA Medical Center (VAMC), we assessed for differences in SRE rates by comparing outcomes of patients who received ZA in standard- vs extended-interval dosing.
Methods
We retrospectively reviewed the Computerized Patient Record System for veterans with MM or metastatic CaP treated with ZA at the Memphis VAMC. Study inclusion criteria were aged > 18 years and care provided by a Memphis VAMC oncologist between January 2003 and January 2018. The study was approved by the Memphis VAMC’s Institutional Review Board, and procedures were followed in accordance with the ethical standards of its committee on human experimentation.
Using Microsoft SQL 2016 (Redmond, WA), we performed a query to identify patients who were prescribed ZA during the study period. Exclusion criteria were ZA prescribed for an indication other than MM or CaP (ie, osteoporosis) and receipt of ≤ 1 dose of ZA. Once a list was compiled, patients were stratified by ZA dosing interval: standard (mean, every month) or extended (mean, every 3 months). Patients whose ZA dosing interval was changed during treatment were included as independent data points in each group.
Skeletal-related events included fractures, spinal compression, irradiation, and surgery. Fractures and spinal compression were pertinent in the presence of radiographic documentation (eg, X-ray, magnetic resonance imaging scan) during the period the patient received ZA or within 1 dosing interval of the last recorded ZA dose. Irradiation was defined as documented application of radiation therapy to ≥ 1 bone sites for palliation of pain or as an intervention in the setting of spinal compression. Surgery was defined as any procedure performed to correct a fracture or spinal compression. Each SRE was counted as a single occurrence.
Osteonecrosis of the jaw was defined as radiographically documented necrosis of the mandible or associated structures with assessment by a VA dentist. Records from non-VA dental practices were not available for assessment. Documentation of dental assessment before the first dose of ZA and any assessments during treatment were recorded.
Medication use was assessed before and during ZA treatment. Number of ZA doses and reasons for any discontinuations were documented, as was concomitant use of calcium supplements, vitamin D supplements, calcitriol, paricalcitol, calcitonin, cinacalcet, and pamidronate.
The primary study outcome was observed difference in incidence of SREs between standard- and extended-interval dosing of ZA. Secondary outcomes included difference in incidence of ONJ as well as incidence of SREs and ONJ by disease subtype (MM, CaP).
Descriptive statistics were used to summarize demographic data and assess prespecified outcomes. Differences in rates of SREs and ONJ between dosing interval groups were analyzed with the Pearson χ2 test. The predetermined a priori level of significance was .05.
Results
Of the 300 patients prescribed ZA at the Memphis VAMC, 177 were excluded (96 for indication,78 for receiving only 1 dose of ZA, 3 for not receiving any doses of ZA). The remaining 123 patients were stratified into a standard-interval dosing group (121) and an extended-interval dosing group (35). Of the 123 patients, 33 received both standard- and extended-interval dosing of ZA over the course of the study period and were included discretely in each group for the duration of each dosing strategy. 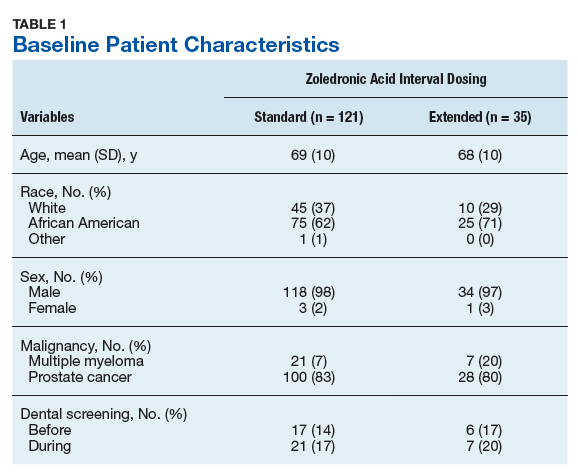
Pre-ZA dental screenings were documented in 14% of standard-interval patients and 17% of extended-interval patients, and during-ZA screenings were documented in 17% of standard-interval patients and 20% of extended-interval patients. Chi-square analysis revealed no significant difference in rates of dental screening before or during use of ZA.
Standard-interval patients received a mean (SD) 11.4 (13.5) doses of ZA (range, 2-124). Extended-interval patients received a mean (SD) of 5.9 (3.18) doses (range, 2-14). All standard-interval patients had discontinued treatment at the time of the study, most commonly because of death or for an unknown reason. Sixty percent of extended-interval patients had discontinued treatment, most commonly because of patient/physician choice or for an unknown reason (Table 2). 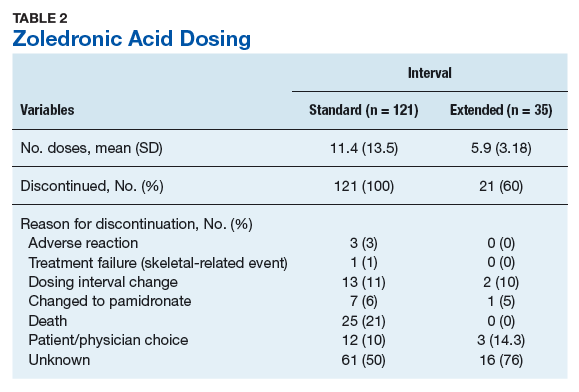
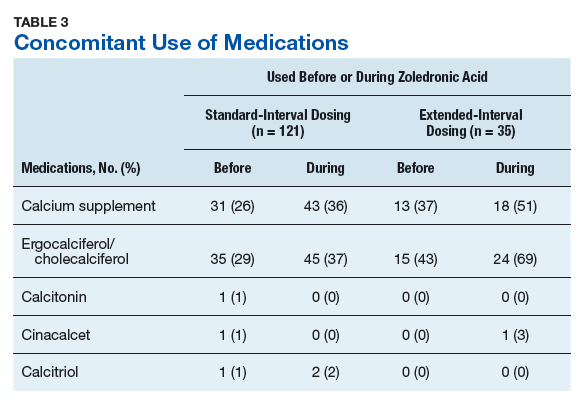
Skeletal-related events were observed in 31% of standard-interval patients and 23% of extended-interval patients. There were no statistically significant differences in SRE rates between groups (P = .374). The most common SRE in both groups was bone irradiation (42% and 60%, respectively), with no statistically significant difference in proportion between groups (Table 4). 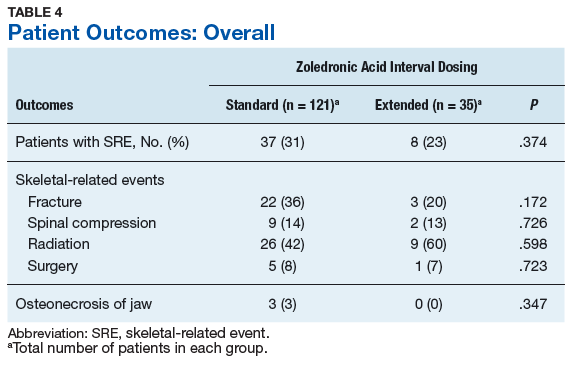
Discussion
This retrospective review of patients with MM and CaP receiving ZA for bone metastasesfound no differences in the rates of SREs when ZA was dosed monthly vs every 3 months. 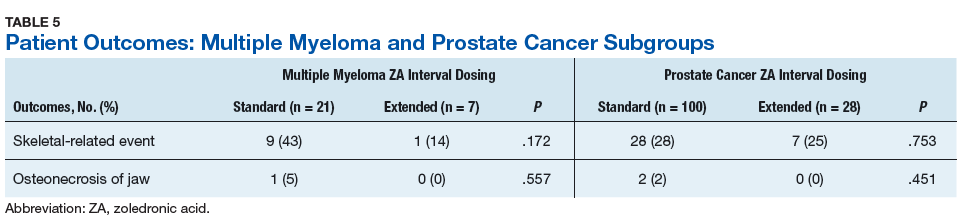
Earlier studies found that ZA can decrease SRE rates, but a major concern is that frequent, prolonged exposure to IV bisphosphonates may increase the risk of ONJ. No significant differences in ONJ rates existed between dosing groups, but all documented cases of ONJ occurred in the standard-interval group, suggesting a trend toward decreased incidence with an extension of the dosing interval.
Limitations
This study had several limitations. Geriatric African American men comprised the majority of the study population, and patients with MM accounted for only 22% of included regimens, limiting external validity. Patient overlap between groups may have confounded the results. The retrospective design precluded the ability to control for confounding variables, such as concomitant medication use and medication adherence, and significant heterogeneity was noted in rates of adherence with ZA infusion schedules regardless of dosing group. Use of medications associated with increased risk of osteoporosis—including corticosteroids and proton pump inhibitors—was not assessed.
Assessment of ONJ incidence was limited by the lack of access to dental records from providers outside the VA. Many patients in this review were not eligible for VA dental benefits because of requirements involving time and service connection, a reimbursement measurement that reflects health conditions “incurred or aggravated during active military service.”18
The results of this study provide further support for extended-interval dosing of ZA as a potential method of increasing patient adherence and decreasing the possibility of adverse drug reactions without compromising therapeutic benefit. Further randomized controlled trials are needed to define the potential decrease in ONJ incidence.
Conclusion
In comparisons of standard- and extended-interval dosing of ZA, there was no difference in the incidence of skeletal-related events in veteran patients with bone metastases from MM or CaP.
Author disclosures
The authors report no actual or potential conflicts of interest with regard to this article.
Disclaimer
The opinions expressed herein are those of the authors and do not necessarily reflect those of Federal Practitioner, Frontline Medical Communications Inc., the US Government, or any of its agencies. This article may discuss unlabeled or investigational use of certain drugs. Please review the complete prescribing information for specific drugs or drug combinations—including indications, contraindications, warnings, and adverse effects—before administering pharmacologic therapy to patients.
1. American Cancer Society. Cancer Facts & Figures 2018. Atlanta, GA: American Cancer Society; 2018.
2. Howlader N, Noone AM, Krapcho M, et al, eds. SEER Cancer Statistics Review (CSR), 1975-2014 [based on November 2016 SEER data submission posted to SEER website April 2017]. Bethesda, MD: National Cancer Institute; 2017. https://seer.cancer.gov/archive/csr/1975_2014/. Accessed January 12, 2019.
3. Roodman GD. Pathogenesis of myeloma bone disease. Leukemia. 2009;23(3):435-441.
4. Sartor O, de Bono JS. Metastatic prostate cancer. N Engl J Med. 2018;378(7):645-657.
5. Drake MT, Clarke BL, Khosla S. Bisphosphonates: mechanism of action and role in clinical practice. Mayo Clin Proc. 2008;83(9):1032-1045.
6. Zometa [package insert]. East Hanover, NJ: Novartis; 2016.
7. Aredia [package insert]. East Hanover, NJ: Novartis; 2011.
8. Berenson JR, Rosen LS, Howell A, et al. Zoledronic acid reduces skeletal-related events in patients with osteolytic metastases: a double-blind, randomized dose-response study [published correction appears in Cancer. 2001;91(10):1956]. Cancer. 2001;91(7):1191-1200.
9. Berenson JR, Lichtenstein A, Porter L, et al. Efficacy of pamidronate in reducing skeletal events in patients with advanced multiple myeloma. Myeloma Aredia Study Group. N Engl J Med. 1996;334(8):488-493.
10. Mhaskar R, Redzepovic J, Wheatley K, et al. Bisphosphonates in multiple myeloma: a network meta-analysis. Cochrane Database Syst Rev. 2012;(5):CD003188.
11. Wu S, Dahut WL, Gulley JL. The use of bisphosphonates in cancer patients. Acta Oncol. 2007;46(5):581-591.
12. Bamias A, Kastritis E, Bamia C, et al. Osteonecrosis of the jaw in cancer after treatment with bisphosphonates: incidence and risk factors. J Clin Oncol. 2005;23(34):8580-8587.
13. Anderson K, Ismaila N, Flynn PJ, et al. Role of bone-modifying agents in multiple myeloma: American Society of Clinical Oncology clinical practice guideline update. J Clin Oncol. 2018;36(8):812-818.
14. National Comprehensive Cancer Network Clinical Practice Guidelines in Oncology (NCCN Guidelines). Multiple Myeloma. Version 2.2019. https://www.nccn.org/professionals/physician_gls/pdf/myeloma.pdf. Accessed January 29, 2019.
15. National Comprehensive Cancer Network Clinical Practice Guidelines in Oncology (NCCN Guidelines). Prostate Cancer. Version 4.2018. https://www.nccn.org/professionals/physician_gls/pdf/prostate.pdf. Accessed January 29, 2019.
16. Lacy MQ, Dispenzieri A, Gertz MA, et al. Mayo Clinic consensus statement for the use of bisphosphonates in multiple myeloma. Mayo Clin Proc. 2006;81(8):1047-1053.
17. Himelstein AL, Foster JC, Khatcheressian JL, et al. Effect of longer-interval vs. standard dosing of zoledronic acid on skeletal events in patients with bone metastases: a randomized clinical trial. JAMA. 2017;317(1):48-58.
18. Office of Public and Intergovernmental Affairs, US Department of Veterans Affairs. Service connected disabilities. In: Federal Benefits for Veterans, Dependents, and Survivors. https://www.va.gov/opa/publications/benefits_book/benefits_chap02.asp. Published April 2015. Accessed May 22, 2018.
In patients with multiple myeloma and prostate cancer, extending the bisphosphonatedosing interval may help decrease medication-related morbidity without compromising therapeutic benefit.
In patients with multiple myeloma and prostate cancer, extending the bisphosphonatedosing interval may help decrease medication-related morbidity without compromising therapeutic benefit.
Bone pain is one of the most common causes of morbidity in multiple myeloma (MM) and metastatic prostate cancer (CaP). This pain originates with the underlying pathologic processes of the cancer and with downstream skeletal-related events (SREs). SREs—fractures, spinal cord compression, and irradiation or surgery performed in ≥ 1 bone sites—represent a significant health care burden, particularly given the incidence of the underlying malignancies. According to American Cancer Society statistics, CaP is the second most common cancer in American men, and MM the second most common hematologic malignancy, despite its relatively low overall lifetime risk.1,2 Regardless of the underlying malignancy, bisphosphonates are the cornerstone of SRE prevention, though the optimal dosing strategy is the subject of clinical debate.
Although similar in SRE incidence, MM and CaP have distinct pathophysiologic processes in the dysregulation of bone resorption. MM is a hematologic malignancy that increases the risk of SREs by osteoclast up-regulation, primarily through the RANK (receptor activator of nuclear factor α-B) signaling pathway.3 CaP is a solid tumor malignancy that metastasizes to bone. Dysregulation of the bone resorption or formation cycle and net bone loss are a result of endogenous osteoclast up-regulation in response to abnormal bone formation in osteoblastic bone metastases.4 Androgen-deprivation therapy, the cornerstone of CaP treatment, further predisposes CaP patients to osteoporosis and SREs.
Prevention of SREs is pharmacologically driven by bisphosphonates, which have antiresorptive effects on bone through promotion of osteoclast apoptosis.5 Two IV formulations, pamidronate and zoledronic acid (ZA), are US Food and Drug Administration approved for use in bone metastases from MM or solid tumors.6-10 Although generally well tolerated, bisphosphonates can cause osteonecrosis of the jaw (ONJ), an avascular death of bone tissue, particularly with prolonged use.11 With its documented incidence of 5% to 6.7% in bone metastasis, ONJ represents a significant morbidity risk in patients with MM and CaP who are treated with IV bisphosphonates.12
Investigators are exploring bisphosphonate dosing intervals to determine which is most appropriate in mitigating the risk of ONJ. Before 2006, bisphosphonates were consistently dosed once monthly in patients with MM or metastatic bone disease—a standard derived empirically rather than from comparative studies or compelling pharmacodynamic data.13-15 In a 2006 consensus statement, the Mayo Clinic issued an expert opinion recommendation for increasing the bisphosphonate dosing interval to every 3 months in patients with MM.16 The first objective evidence for the clinical applicability of extending the ZA dosing interval was reported by Himelstein and colleagues in 2017.17 The randomized clinical trial found no differences in SRE rates when ZA was dosed every 12 weeks,17 prompting a conditional recommendation for dosing interval extension in the American Society of Clinical Oncology MM treatment guidelines (2018).13 Because of the age and racial demographics of the patients in these studies, many questions remain unanswered.
For the US Department of Veterans Affairs (VA) population, the pharmacokinetic and dynamic differences imposed by age and race limit the applicability of the available data. However, in veterans with MM or CaP, extending the bisphosphonate dosing interval may help decrease medication-related morbidity (eg, ONJ, nephrotoxicity) without compromising therapeutic benefit. To this end at the Memphis VA Medical Center (VAMC), we assessed for differences in SRE rates by comparing outcomes of patients who received ZA in standard- vs extended-interval dosing.
Methods
We retrospectively reviewed the Computerized Patient Record System for veterans with MM or metastatic CaP treated with ZA at the Memphis VAMC. Study inclusion criteria were aged > 18 years and care provided by a Memphis VAMC oncologist between January 2003 and January 2018. The study was approved by the Memphis VAMC’s Institutional Review Board, and procedures were followed in accordance with the ethical standards of its committee on human experimentation.
Using Microsoft SQL 2016 (Redmond, WA), we performed a query to identify patients who were prescribed ZA during the study period. Exclusion criteria were ZA prescribed for an indication other than MM or CaP (ie, osteoporosis) and receipt of ≤ 1 dose of ZA. Once a list was compiled, patients were stratified by ZA dosing interval: standard (mean, every month) or extended (mean, every 3 months). Patients whose ZA dosing interval was changed during treatment were included as independent data points in each group.
Skeletal-related events included fractures, spinal compression, irradiation, and surgery. Fractures and spinal compression were pertinent in the presence of radiographic documentation (eg, X-ray, magnetic resonance imaging scan) during the period the patient received ZA or within 1 dosing interval of the last recorded ZA dose. Irradiation was defined as documented application of radiation therapy to ≥ 1 bone sites for palliation of pain or as an intervention in the setting of spinal compression. Surgery was defined as any procedure performed to correct a fracture or spinal compression. Each SRE was counted as a single occurrence.
Osteonecrosis of the jaw was defined as radiographically documented necrosis of the mandible or associated structures with assessment by a VA dentist. Records from non-VA dental practices were not available for assessment. Documentation of dental assessment before the first dose of ZA and any assessments during treatment were recorded.
Medication use was assessed before and during ZA treatment. Number of ZA doses and reasons for any discontinuations were documented, as was concomitant use of calcium supplements, vitamin D supplements, calcitriol, paricalcitol, calcitonin, cinacalcet, and pamidronate.
The primary study outcome was observed difference in incidence of SREs between standard- and extended-interval dosing of ZA. Secondary outcomes included difference in incidence of ONJ as well as incidence of SREs and ONJ by disease subtype (MM, CaP).
Descriptive statistics were used to summarize demographic data and assess prespecified outcomes. Differences in rates of SREs and ONJ between dosing interval groups were analyzed with the Pearson χ2 test. The predetermined a priori level of significance was .05.
Results
Of the 300 patients prescribed ZA at the Memphis VAMC, 177 were excluded (96 for indication,78 for receiving only 1 dose of ZA, 3 for not receiving any doses of ZA). The remaining 123 patients were stratified into a standard-interval dosing group (121) and an extended-interval dosing group (35). Of the 123 patients, 33 received both standard- and extended-interval dosing of ZA over the course of the study period and were included discretely in each group for the duration of each dosing strategy.
Pre-ZA dental screenings were documented in 14% of standard-interval patients and 17% of extended-interval patients, and during-ZA screenings were documented in 17% of standard-interval patients and 20% of extended-interval patients. Chi-square analysis revealed no significant difference in rates of dental screening before or during use of ZA.
Standard-interval patients received a mean (SD) 11.4 (13.5) doses of ZA (range, 2-124). Extended-interval patients received a mean (SD) of 5.9 (3.18) doses (range, 2-14). All standard-interval patients had discontinued treatment at the time of the study, most commonly because of death or for an unknown reason. Sixty percent of extended-interval patients had discontinued treatment, most commonly because of patient/physician choice or for an unknown reason (Table 2).
Skeletal-related events were observed in 31% of standard-interval patients and 23% of extended-interval patients. There were no statistically significant differences in SRE rates between groups (P = .374). The most common SRE in both groups was bone irradiation (42% and 60%, respectively), with no statistically significant difference in proportion between groups (Table 4).
Discussion
This retrospective review of patients with MM and CaP receiving ZA for bone metastasesfound no differences in the rates of SREs when ZA was dosed monthly vs every 3 months.
Earlier studies found that ZA can decrease SRE rates, but a major concern is that frequent, prolonged exposure to IV bisphosphonates may increase the risk of ONJ. No significant differences in ONJ rates existed between dosing groups, but all documented cases of ONJ occurred in the standard-interval group, suggesting a trend toward decreased incidence with an extension of the dosing interval.
Limitations
This study had several limitations. Geriatric African American men comprised the majority of the study population, and patients with MM accounted for only 22% of included regimens, limiting external validity. Patient overlap between groups may have confounded the results. The retrospective design precluded the ability to control for confounding variables, such as concomitant medication use and medication adherence, and significant heterogeneity was noted in rates of adherence with ZA infusion schedules regardless of dosing group. Use of medications associated with increased risk of osteoporosis—including corticosteroids and proton pump inhibitors—was not assessed.
Assessment of ONJ incidence was limited by the lack of access to dental records from providers outside the VA. Many patients in this review were not eligible for VA dental benefits because of requirements involving time and service connection, a reimbursement measurement that reflects health conditions “incurred or aggravated during active military service.”18
The results of this study provide further support for extended-interval dosing of ZA as a potential method of increasing patient adherence and decreasing the possibility of adverse drug reactions without compromising therapeutic benefit. Further randomized controlled trials are needed to define the potential decrease in ONJ incidence.
Conclusion
In comparisons of standard- and extended-interval dosing of ZA, there was no difference in the incidence of skeletal-related events in veteran patients with bone metastases from MM or CaP.
Author disclosures
The authors report no actual or potential conflicts of interest with regard to this article.
Disclaimer
The opinions expressed herein are those of the authors and do not necessarily reflect those of Federal Practitioner, Frontline Medical Communications Inc., the US Government, or any of its agencies. This article may discuss unlabeled or investigational use of certain drugs. Please review the complete prescribing information for specific drugs or drug combinations—including indications, contraindications, warnings, and adverse effects—before administering pharmacologic therapy to patients.
1. American Cancer Society. Cancer Facts & Figures 2018. Atlanta, GA: American Cancer Society; 2018.
2. Howlader N, Noone AM, Krapcho M, et al, eds. SEER Cancer Statistics Review (CSR), 1975-2014 [based on November 2016 SEER data submission posted to SEER website April 2017]. Bethesda, MD: National Cancer Institute; 2017. https://seer.cancer.gov/archive/csr/1975_2014/. Accessed January 12, 2019.
3. Roodman GD. Pathogenesis of myeloma bone disease. Leukemia. 2009;23(3):435-441.
4. Sartor O, de Bono JS. Metastatic prostate cancer. N Engl J Med. 2018;378(7):645-657.
5. Drake MT, Clarke BL, Khosla S. Bisphosphonates: mechanism of action and role in clinical practice. Mayo Clin Proc. 2008;83(9):1032-1045.
6. Zometa [package insert]. East Hanover, NJ: Novartis; 2016.
7. Aredia [package insert]. East Hanover, NJ: Novartis; 2011.
8. Berenson JR, Rosen LS, Howell A, et al. Zoledronic acid reduces skeletal-related events in patients with osteolytic metastases: a double-blind, randomized dose-response study [published correction appears in Cancer. 2001;91(10):1956]. Cancer. 2001;91(7):1191-1200.
9. Berenson JR, Lichtenstein A, Porter L, et al. Efficacy of pamidronate in reducing skeletal events in patients with advanced multiple myeloma. Myeloma Aredia Study Group. N Engl J Med. 1996;334(8):488-493.
10. Mhaskar R, Redzepovic J, Wheatley K, et al. Bisphosphonates in multiple myeloma: a network meta-analysis. Cochrane Database Syst Rev. 2012;(5):CD003188.
11. Wu S, Dahut WL, Gulley JL. The use of bisphosphonates in cancer patients. Acta Oncol. 2007;46(5):581-591.
12. Bamias A, Kastritis E, Bamia C, et al. Osteonecrosis of the jaw in cancer after treatment with bisphosphonates: incidence and risk factors. J Clin Oncol. 2005;23(34):8580-8587.
13. Anderson K, Ismaila N, Flynn PJ, et al. Role of bone-modifying agents in multiple myeloma: American Society of Clinical Oncology clinical practice guideline update. J Clin Oncol. 2018;36(8):812-818.
14. National Comprehensive Cancer Network Clinical Practice Guidelines in Oncology (NCCN Guidelines). Multiple Myeloma. Version 2.2019. https://www.nccn.org/professionals/physician_gls/pdf/myeloma.pdf. Accessed January 29, 2019.
15. National Comprehensive Cancer Network Clinical Practice Guidelines in Oncology (NCCN Guidelines). Prostate Cancer. Version 4.2018. https://www.nccn.org/professionals/physician_gls/pdf/prostate.pdf. Accessed January 29, 2019.
16. Lacy MQ, Dispenzieri A, Gertz MA, et al. Mayo Clinic consensus statement for the use of bisphosphonates in multiple myeloma. Mayo Clin Proc. 2006;81(8):1047-1053.
17. Himelstein AL, Foster JC, Khatcheressian JL, et al. Effect of longer-interval vs. standard dosing of zoledronic acid on skeletal events in patients with bone metastases: a randomized clinical trial. JAMA. 2017;317(1):48-58.
18. Office of Public and Intergovernmental Affairs, US Department of Veterans Affairs. Service connected disabilities. In: Federal Benefits for Veterans, Dependents, and Survivors. https://www.va.gov/opa/publications/benefits_book/benefits_chap02.asp. Published April 2015. Accessed May 22, 2018.