User login
The Hospitalist only
Report on PQRI
The current pay-for-reporting program from the Centers for Medicare and Medicaid (CMS) seems tailor-made for hospitalists. Here’s a look at the voluntary Physician Quality Reporting Initiative (PQRI) program, and why and how hospitalists are—and are not—participating.
CMS has revised the reporting program that began as a six-month trial in 2007. The current PQRI runs the full calendar year for 2008 and includes 119 quality measures—11 of which hospitalists can report on. Detailed specifications for the measures are available on the CMS Web site at www.cms.hhs.gov.
The earnings in this pay-for-reporting program remain the same as 2007: Physicians who successfully report on measures can earn a bonus payment equal to 1.5% of their total Medicare-allowed charges. Some hospitalists have collected their bonus for participating in the 2007 trial; it’s likely more will participate this year.
CMS has yet to release data on participation in the 2007 PQRI trial or this year’s initiative. However, SHM has urged hospitalists to participate, and many are. During a national, SHM-sponsored conference call with CMS in summer 2007, approximately 20% of the 160 hospitalists participating in the call responded to a follow-up survey. Almost half of all respondents indicated they planned to participate in PQRI reporting.
“That percentage comes from a select group of hospitalists who were highly interested in the PQRI,” points out Patrick J. Torcson, MD, MMM, FACP, director of hospital medicine at St. Tammany Parish Hospital in Covington, La.
Unlike many specialists, hospitalists are finding reporting to be a straightforward process. “For hospitalists, PQRI reporting on specific measures harmonizes nicely with workflow,” says Dr. Torcson. “Most applicable measures take place during admission or discharge. Documentation and reporting for PQRI can take place during these times.”
Report on Reporting
At St. Tammany, Dr. Torcson’s eight-hospitalist team is participating in PQRI. Although you need only to report on three measures to qualify for a bonus payment from the program, “we’re actually reporting on the full list of [hospitalist-applicable] measures,” Dr. Torcson says. It’s up to each St. Tammany hospitalist to remember to report on the 11 measures.
“Support for [reporting] really comes down to physician memory,” says Dr. Torcson. “Long term, this is going to have to be part of an electronic system, with decision support and billing capability from an electronic health record.”
In spite of the added step of PQRI reporting, Dr. Torcson says, “we’ve had an enthusiastic response from our hospitalists.” The payoff for the hospital medicine program and the hospital is yet to be seen. “You hope that PQRI performance reporting will result in improved quality of care,” henotes.
But many physicians—including hospitalists—are not participating in PQRI.
“It comes down to different practice models,” explains Dr. Torcson. “But for many physicians, a major reason not to participate is that they’re taking a wait-and-see approach. They’re waiting to see if this is just the latest flavor of the month, and think it’s not worth investing time and effort until it proves otherwise.”
Gregory B. Seymann, MD, associate clinical professor, University of California, San Diego (UCSD) School of Medicine, Division of Hospital Medicine, is a member of SHM’s Public Policy Committee and says he was disappointed his group is unable to participate in PQRI.
“I work for UCSD, where our hospitalist group is one of many, many subspecialty groups that work out of our hospital,” he explains “We do a lot of QI work, and we were certainly interested in participating in PQRI.” However, the hospital uses an electronic billing system incompatible with reporting on the measures. The software could be upgraded for about $15,000, says Dr. Seymann, but hospital administration sees no return on the investment.
“The cost wouldn’t match the increase in revenues because besides hospital medicine, there aren’t a lot of other subspecialties that would be interested in participating,” explains Dr. Seymann. “As much as I wanted our group to participate, I can’t fully fault UCSD on this decision on business grounds. They want to see some stability in [the decision to continue PQRI] before they invest.”
In the meantime, the orthopedics group at UCSD has invested in reporting. They are tracking PQRI measures on paper and reporting to CMS, and they’ll ultimately be able to show the administration whether the bonus per physician might add up to the cost of the necessary billing-system upgrade.
Beyond 2008
Everyone involved—not just UCSD—is asking: Is PQRI here to stay? That decision rests with federal lawmakers. At the end of this year, Congress must vote on whether to extend the program—and no one can guarantee whether that will happen.
“The chairs of the Senate Finance Committee have been tremendously supportive of the PQRI,” says Dr. Torcson. “There is a lot of political will behind this right now. [PQRI supporters in Congress] want better quality in healthcare for better pay.”
This year’s election will have a major impact on this decision: “A change in administration will definitely factor in,” warns Dr. Torcson. “The 2008 Medicare Physician Payment Update seemed to divide along party lines. Republicans were somewhat supportive, and Democrats didn’t seem to support it. It’s not quite that simple, but that was a general pattern.”
The best advice for physicians invested or interested in investing in PQRI is to keep an eye on the November election results and the Senate Finance Committee to find out what 2009 and beyond will look like for PQRI or other CMS pay-for-reporting initiatives.
Too Late to Participate?
Although the PQRI began Jan. 1, there is no enrollment process; physicians can start reporting any time during the year. However, participants reporting on three measures report in at least 80% of the instances in which those measures are reportable—that means all year—in order to qualify for a bonus. If you begin reporting this far into the year, you’re not likely to reach that threshold and earn your bonus.
“Starting late in the year could affect reaching that threshold, but it’s never too late to start the practice and process of reporting,” says Dr. Torcson. “You can still make that commitment to performance reporting. Even if you don’t get the 1.5% bonus, you get the benefit of getting started in the important practice of performance reporting.”
Read more about the PQRI on SHM’s Web site (www.hospitalmedicine.org). TH
Jane Jerrard has written for The Hospitalist since 2005.
Speak Up
By putting a little time and effort into your presentation skills, you can become more persuasive and effective in your day-to-day job—and even advance your career and reputation.
For hospitalists, with their often-heavy committee load and frequent formal or informal teaching conversations, addressing groups is part of the job.
“At the end of the day, hospitalists are advocates—whether for quality improvement or patient-care issues,” says Jeffrey Wiese, MD, FACP, associate professor of medicine at Tulane University Health Sciences Center in New Orleans, associate chairman of medicine, director of the Tulane Internal Medicine Residency Program, and associate director of student programs, internal medicine. “And most of their advocacy efforts [are] going to be person-to-person, verbal discussions, where their passion and conviction can come through.”
Even if you’re never asked to present at a national meeting, you are likely to address a lot of committees, teams, and task forces in your career.
“It’s important to realize that people’s time is valuable in committee meetings,” stresses Dr. Wiese. “You have to be able to speak clearly, concisely, and to the point to make your case effectively.”
Learn by Listening
If you haven’t had much experience addressing groups or you feel your presentation skills are lacking, there are simple steps to become comfortable—even accomplished—at speaking.
“Most effective speakers are partly born but mostly made,” says Robert Wachter, MD, co-founder of SHM, frequent keynote speaker and professor and associate chairman of the Department of Medicine at the University of California, San Francisco.
Becoming an effective speaker may require formal training, perhaps from a course or a book. But one step every aspiring speaker can easily take is to listen to other speakers—a lot of them.
While working on his own presentation skills, Dr. Wachter says: “I learned to be a shameless mimic and thief. Even now, when I hear a good lecture, I always ask myself what that person did really well, and can I do that, too. And when I hear a crummy speaker, I wonder what I would tell them to them improve.”
Dr. Wiese does the same thing. “My strategy is to learn from every talk I sit in on,” he says. “Watch how the speaker is performing—not just at medical meetings, but also on TV. In this election year there are a lot of opportunities to listen to speeches. Note good speakers’ cadence, pitch and tone, and borrow from them.”
Simple Secrets
Effective speaking is built on some basic tenets. “There are fundamental skills that most speakers don’t use—you’d be surprised how basic these skills are,” says Dr. Wiese. These basics include:
Practice makes perfect: No matter how confident you are of your material, practice. Whether you’ll teach, speak to a quality-improvement committee or address a national group, make an outline and run through your speech. “There’s no talk I give without at least sitting down an hour beforehand to think through what I’m going to say,” says Dr. Wiese.
Give it all you’ve got: “When you’re asked to address a group, you have to convince yourself that this is the most important talk you’ve ever given,” stresses Dr. Wiese. “Your belief in this will give you the passion and commitment to your topic that comes out in how you speak.”
Start strong: Getting your audience’s interest and attention immediately is crucial.
“Engaging the audience successfully in the first one to three minutes is unbelievably important because unless you get them to care enough to listen at the outset, you’ve lost them for the rest of the talk,” he says. He believes only about one in 100 speakers do this well. “I assume the audience is not really with me and that I need to actively engage them—and I make sure they know enough to care about the topic. I start with the reasonable assumption that I know more and care more about my topic than they do. Make sure you give them enough background to get them started.”
Fledgling speakers can try capturing their audience’s attention by starting with a joke, story, dramatic anecdote, or shocking data. Starting your presentation with a bang, says Dr. Wachter, “is a learnable skill, and it’s a lot easier when you’re addressing a small group of people you know.”
Spice up dry information: If you’re stuck with a topic you fear is too boring to engage, find a “hook” to draw the audience in. Dr. Wachter suggests, “When you explain facts, use analogy and metaphors, and use graphics only when appropriate,” he suggests.
Find your voice: A tricky thing for new speakers is controlling their voice and using it to maintain interest. Avoid using a monotone—a common effect of reading from notes or slides.
“It’s important to work on your cadence and on the pitch and tone of your voice,” advises Dr. Wiese. “I think speaking is similar to music. Music has rest notes for a reason: to augment what you just said and to set up what you’re about to say. Try replacing the “ums” and “uhs” you use while you’re thinking about what to say next with silence. The audience will be riveted.”
Go easy on the PowerPoint: Don’t rely on your slides or flipchart to influence or engage your audience. Make eye contact with individuals and in a small group; touch a shoulder or two. “The truth is that most people use PowerPoint slides because they didn’t practice their talk,” says Dr. Wiese. “Turn away from your slides and talk person to person—you’ll be much more compelling.”
Speaking Opportunities
For an ambitious hospitalist, opportunities are abundant. “Find the residency director at the nearest program and tell them you’d like to give a conference for free,” Dr. Wiese recommends. “I guarantee this will get you 20 or 30 offers.”
He says national and regional organizations are great opportunities to get involved. “All it really takes is to attend the meetings, find the people doing the talks and tell them that you want an opportunity to hone your speaking skills,” he notes.
If you’re convinced that practicing your speaking skills will help you influence committees, enhance your reputation and improve your career possibilities, then take Dr. Wiese’s advice and get ready to launch your speaking career. TH
Jane Jerrard writes “Public Policy” for The Hospitalist.
Drug Misuse Varies
Elderly inpatients’ risk of receiving potentially inappropriate medication (PIM) varies widely depending on where in the country they’re hospitalized and the specialty of their attending physicians, according to a study in the March-April edition of the Journal of Hospital Medicine.
Hospitalists may be encouraged by the fact that they, along with geriatricians, internists, and family physicians, were less likely than cardiologists to prescribe PIMs. Still, the major take-home message of the study is to “examine your individual practice and think about whether it’s appropriate to prescribe these medications,” says lead author Michael Rothberg, MD, assistant professor of medicine at Tufts University School of Medicine in Boston.
PIM use was highest in hospitals in the South. There, 55% of elderly patients received at least one PIM, compared with 34% of patients in Northeastern hospitals, where PIM use was lowest. The exact reason for this discrepancy is not known, but Dr. Rothberg hypothesizes that “we tend to prescribe like people in our hospital and like people in our region.” In other words, “it has to do with learning from the people around us.”
Most interesting to him is the wide variation in prescribing practices among individual doctors—even within the same specialty. “The decision to prescribe a drug is based on the individual provider and has to do with how you as a doctor feel about these drugs,” he explains. Although nearly half of all of the patients had received at least one PIM, there were seven hospitals in which those drugs never were prescribed. Somehow, “they found a way to care for people without [those medications],” he points out.
PIM use has been examined among elderly outpatients and nursing home residents, but only a handful of small studies have looked at the problem in hospital inpatients, says Dr. Rothberg. He and his coauthors used data from hospitals across the United States participating in Perspective, a database developed by Charlotte, N.C.-based Premier to measure quality and healthcare utilization.
The survey included patients 65 years or older admitted between Sept. 1, 2002, and June 30, 2005. Their principal diagnoses were acute myocardial infarction, chronic obstructive pulmonary disease, chest pain, community acquired pneumonia, congestive heart failure, ischemic stroke, or urinary tract infection. Surgical patients were excluded. Using the 2002 update of the Beers criteria for PIM use in older adults, the authors identified the total number of PIMs administered to each patient during his or her hospital stay. They further classified each PIM as high- or low-severity, based on the expert consensus expressed in the 1997 update of the Beers criteria.
Data were available on 493,971 patients from 384 hospitals. Of those individuals, 49% received at least one PIM, and 6% received three or more. Thirty-eight percent of patients received at least one PIM with a high severity rating.
The three agents most likely to be prescribed were promethazine, diphenhydramine, and propoxyphene—probably because these drugs treat the problems most commonly encountered in hospitals, such as allergies, sleep problems, nausea, and pain, Dr. Rothberg says.
Hospital region emerged as the most important predictor of PIM use. Compared with patients in the Midwest, patients in the South had an odds ratio of 1.63 of receiving a high-severity PIM. The odds ratio for patients in the West was 1.43. Patients in the Northeast had an odds ratio of 0.85.
The median rate of prescribing high-severity PIMs was lowest among geriatricians, at 24%. Rates among hospitalists, internists, and family physicians were 33% to 36%. Cardiologists had the highest rate: 48% prescribed at least one high-severity PIM.
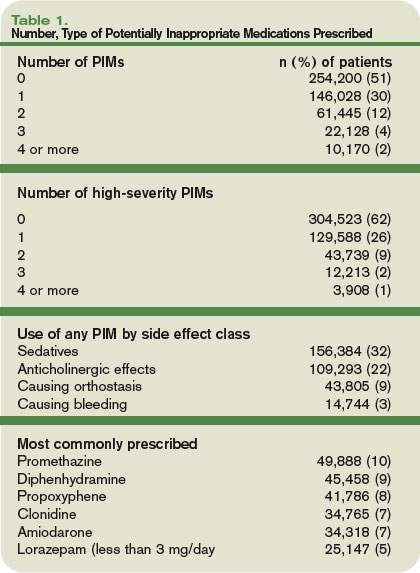
Interestingly, older patient age also was associated with a lower risk of PIM use. Of patients 85 or older, 42% received at least one PIM, compared with 53% of patients age 65 to 74 (p<0.0001). This suggests that “doctors are aware that the older patients are more frail and vulnerable” and take extra care to avoid prescribing PIMs to people in that age range, Dr. Rothberg says. A diagnosis of stroke or chronic obstructive pulmonary disease also was associated with a lower risk of receiving a PIM—further evidence that “doctors were, to some extent, taking patient factors into account” when prescribing medication.
PIM use among inpatients, as reported in this study, far exceeds the rates published for elders dwelling in the community or in nursing homes, writes Daniel S. Budnitz, MD, MPH, in an editorial accompanying the study.
The wide variation in prescribing practices means each facility must monitor its use of PIMs, just as individual hospitals monitor antibiotic use and resistance, advises Dr. Budnitz, a medical officer in the Division of Healthcare Quality Promotion at the Centers for Disease Control and Prevention. He also points out that the evidence that PIMs cause clinically significant adverse events is “weak and based largely on observational studies with inconsistent results.” The drugs in the Beers criteria are “potentially” inappropriate, he says, but some centers have recategorized them as “ ‘always avoid’ medications, ‘rarely acceptable’ medications, and medications which, indeed, have ‘some indications’ for use in older adults.” Thus, some variation among hospitals may be acceptable.
Rather than concentrate on the Beers criteria, hospitalists should focus “on identifying and mitigating the most common and most severe adverse drug events occurring in their hospitals,” such as bleeding from anticoagulants, hypoglycemic events from insulin, and oversedation from opioid analgesics, Dr. Budnitz points out. TH
Norra MacReady is a medical writer based in California.
Elderly inpatients’ risk of receiving potentially inappropriate medication (PIM) varies widely depending on where in the country they’re hospitalized and the specialty of their attending physicians, according to a study in the March-April edition of the Journal of Hospital Medicine.
Hospitalists may be encouraged by the fact that they, along with geriatricians, internists, and family physicians, were less likely than cardiologists to prescribe PIMs. Still, the major take-home message of the study is to “examine your individual practice and think about whether it’s appropriate to prescribe these medications,” says lead author Michael Rothberg, MD, assistant professor of medicine at Tufts University School of Medicine in Boston.
PIM use was highest in hospitals in the South. There, 55% of elderly patients received at least one PIM, compared with 34% of patients in Northeastern hospitals, where PIM use was lowest. The exact reason for this discrepancy is not known, but Dr. Rothberg hypothesizes that “we tend to prescribe like people in our hospital and like people in our region.” In other words, “it has to do with learning from the people around us.”
Most interesting to him is the wide variation in prescribing practices among individual doctors—even within the same specialty. “The decision to prescribe a drug is based on the individual provider and has to do with how you as a doctor feel about these drugs,” he explains. Although nearly half of all of the patients had received at least one PIM, there were seven hospitals in which those drugs never were prescribed. Somehow, “they found a way to care for people without [those medications],” he points out.
PIM use has been examined among elderly outpatients and nursing home residents, but only a handful of small studies have looked at the problem in hospital inpatients, says Dr. Rothberg. He and his coauthors used data from hospitals across the United States participating in Perspective, a database developed by Charlotte, N.C.-based Premier to measure quality and healthcare utilization.
The survey included patients 65 years or older admitted between Sept. 1, 2002, and June 30, 2005. Their principal diagnoses were acute myocardial infarction, chronic obstructive pulmonary disease, chest pain, community acquired pneumonia, congestive heart failure, ischemic stroke, or urinary tract infection. Surgical patients were excluded. Using the 2002 update of the Beers criteria for PIM use in older adults, the authors identified the total number of PIMs administered to each patient during his or her hospital stay. They further classified each PIM as high- or low-severity, based on the expert consensus expressed in the 1997 update of the Beers criteria.
Data were available on 493,971 patients from 384 hospitals. Of those individuals, 49% received at least one PIM, and 6% received three or more. Thirty-eight percent of patients received at least one PIM with a high severity rating.
The three agents most likely to be prescribed were promethazine, diphenhydramine, and propoxyphene—probably because these drugs treat the problems most commonly encountered in hospitals, such as allergies, sleep problems, nausea, and pain, Dr. Rothberg says.
Hospital region emerged as the most important predictor of PIM use. Compared with patients in the Midwest, patients in the South had an odds ratio of 1.63 of receiving a high-severity PIM. The odds ratio for patients in the West was 1.43. Patients in the Northeast had an odds ratio of 0.85.
The median rate of prescribing high-severity PIMs was lowest among geriatricians, at 24%. Rates among hospitalists, internists, and family physicians were 33% to 36%. Cardiologists had the highest rate: 48% prescribed at least one high-severity PIM.
Interestingly, older patient age also was associated with a lower risk of PIM use. Of patients 85 or older, 42% received at least one PIM, compared with 53% of patients age 65 to 74 (p<0.0001). This suggests that “doctors are aware that the older patients are more frail and vulnerable” and take extra care to avoid prescribing PIMs to people in that age range, Dr. Rothberg says. A diagnosis of stroke or chronic obstructive pulmonary disease also was associated with a lower risk of receiving a PIM—further evidence that “doctors were, to some extent, taking patient factors into account” when prescribing medication.
PIM use among inpatients, as reported in this study, far exceeds the rates published for elders dwelling in the community or in nursing homes, writes Daniel S. Budnitz, MD, MPH, in an editorial accompanying the study.
The wide variation in prescribing practices means each facility must monitor its use of PIMs, just as individual hospitals monitor antibiotic use and resistance, advises Dr. Budnitz, a medical officer in the Division of Healthcare Quality Promotion at the Centers for Disease Control and Prevention. He also points out that the evidence that PIMs cause clinically significant adverse events is “weak and based largely on observational studies with inconsistent results.” The drugs in the Beers criteria are “potentially” inappropriate, he says, but some centers have recategorized them as “ ‘always avoid’ medications, ‘rarely acceptable’ medications, and medications which, indeed, have ‘some indications’ for use in older adults.” Thus, some variation among hospitals may be acceptable.
Rather than concentrate on the Beers criteria, hospitalists should focus “on identifying and mitigating the most common and most severe adverse drug events occurring in their hospitals,” such as bleeding from anticoagulants, hypoglycemic events from insulin, and oversedation from opioid analgesics, Dr. Budnitz points out. TH
Norra MacReady is a medical writer based in California.
Vital VTE Interventions
Venous thromboembolism (VTE) affects more than 2 million Americans every year.1 Pulmonary embolism (PE) is one of the most common preventable causes of in-hospital deaths in the United States. Clinical manifestations of PE may be the first indication the patient has a VTE, and fatal PEs occur in at least 75% of hospitalized medical patients. More than 300,000 patients die from PE each year—an estimated incidence of 10%. This makes VTE prevention a top patient-safety goal in hospitals.2,3
Thromboprophylaxis can be accomplished with unfractionated heparin (UFH), low-molecular-weight heparin (LMWH; e.g., enoxaparin, dalteparin, tinzaparin) or heparinoid, or a selective factor Xa inhibitor (e.g., fondaparinux).4 For long-term treatment, oral warfarin is often used. Doses and duration of prophylaxis and treatment regimens vary.
Current guidelines should be reviewed for specific recommendations. Two current guidelines are the American College of Chest Physicians (ACCP) Seventh Conference on the Prevention of VTE and the American Society of Clinical Oncology (ASCO) Guideline for VTE prophylaxis and treatment in oncology patients. Although guidelines are available, thromboprophylaxis continues to baffle many healthcare providers. There are many advantages to thromboprophylaxis including the prevention of significant morbidity, prevention of PE, decreases in resource consumption, and decreases in the long-term clinical and economic sequelae.
The ACCP notes that most surgical patients will require thromboprophylaxis. Contraindications need to be evaluated prior to antithrombotic/anticoagulant use. Additionally, all trauma patients with at least one VTE risk factor should receive thromboprophylaxis. Acutely ill patients hospitalized with congestive heart failure or severe respiratory distress or who are confined to bed and have one or more additional risk factors, should receive VTE prophylaxis. Additionally, most patients upon admission to an intensive-care unit should be assessed for VTE risk and receive thromboprophylaxis as required.
VTE is a major complication in up to 20% of cancer patients, with hospitalized oncology patients and those undergoing treatment at the highest risk. Some of the newer drug treatments used in these patients have higher VTE rates (e.g., bevacizumab, thalidomide, lenalidomide). These patients need to be carefully evaluated for VTE prophylaxis and closely monitored.5
Generally, in hospitalized patients with cancer, VTE prophylaxis should be considered with UFH, LMWH, or fondaparinux, in the absence of bleeding or other contraindications to anticoagulation. Relative contraindications to anticoagulation include (but are not limited to):
- Active uncontrolled bleeding;
- Active cerebrovascular hemorrhage;
- Dissecting or cerebral aneurysm;
- Bacterial endocarditis;
- Pericarditis;
- Active peptic or gastrointestinal ulceration;
- Severe uncontrolled or malignant hypertension;
- Severe head trauma;
- Pregnancy (warfarin contraindication);
- Heparin-induced thrombocytopenia (heparin, LMWH); and
- Epidural catheter placement.
These same contraindications can be applied to the non-oncology patient, as well.
An important aspect of VTE management is the “Clinical Practice Guideline from the American Academy of Family Physicians and the American College of Physicians on the Diagnosis of VTE from the Annals of Family Medicine.” Consult this for a review of diagnostic tests for VTE.
Thromboprophylaxis is a necessity in a number of at-risk hospitalized patients. Knowing which patients will benefit, and the contraindications for use, will improve patient outcomes. Consult current guidelines for diagnosis recommendations as well as agents of choice, dosing regimens, and therapy duration. TH
Michele B. Kaufman is registered pharmacist based in New York City.
References
- DVT: Assess Your Patients’ Risk, Take Preventive Measures. ASHP Foundation Discoveries, Summer 2007;19(1):1,5. Available at www.ashpfoundation.org/MainMenuCategories/AboutUs/Newsletter/DiscoveriesSummer2007.aspx. Last accessed Nov. 26, 2007.
- Geertz WH, Pineo Graham F, Heit JA et al. Prevention of venous thromboembolism: the Seventh ACCP Conference on Antithrombotic and Thrombolytic Therapy. Chest. 2004;126:338-400.
- Wein L, Wein S, Haas SJ, et al. Pharmacological venous thromboembolism prophylaxis in hospitalized medical patients, a meta-analysis of randomized controlled trials. Arch Intern Med. 2007;167:1476-1486.
- Lyman GH, Khorana AA, Falanga A, et al. American Society of Clinical Oncology guideline: recommendations for venous thromboembolism prophylaxis and treatment in patients with cancer. J Clin Oncol. 2007;25(34): 5490–5505.
- Qaseem A, Snow V, Barry P for the Joint American Academy of Family Physicians/American College of Physicians Panel on Deep Vein Thrombosis/Pulmonary Embolism. Current diagnosis of venous thromboembolism in primary care: a clinical practice guideline from the American Academy of Family Physicians and the American College of Physicians. Ann Fam Med. 2007;5:57-62.
In the Literature
Literature at a Glance
A guide to this month’s abstracts
- Steroids reduce mortality only in patients with confirmed bacterial meningitis.
- Probiotics can be useful in the treatment of acute diarrhea in children.
- CT pulmonary angiography is not inferior to V/Q scanning for exclusion of PE.
- Hospitalist care results in shorter LOS compared with care by traditional general internists and family practice physicians.
- The early risk of stroke after TIA is approximately 15% to 20% at 90 days after the sentinel event.
- Different anti-thrombotic strategies produce no difference in outcomes of early acute coronary syndromes.
- The risk of fatal PE is highest in the first year after medication is stopped.
- Beers criteria medications are associated with fewer ED visits by elderly patients compared with warfarin, digoxin, and insulin.
Do Steroids Affect the Outcome in Patients with Meningitis?
Background: Pyogenic (bacterial) meningitis has high morbidity and mortality. Studies suggest some benefit of steroids in children but provide limited evidence for adult use.
Study design: Intention-to-treat, randomized control trial.
Setting: Single hospital in Vietnam.
Synopsis: Of 435 patients older than 14 with suspected meningitis all received lumbar puncture with randomization to IV dexamethasone or placebo for four days. Results showed 69% of patients had definite meningitis, 28.3% were probable, and 2.8% had an alternative diagnosis based on culture results.
The primary outcome was death after one month, which did not differ among groups (risk ratio [RR] 0.79, confidence interval [CI] 0.45-1.39).
Predefined subgroup analysis of patients with definitive meningitis showed a significant reduction in mortality at one month (RR 0.43, CI 0.2-0.94) and death/disability at six months (odds ratio [OR] 0.56, CI 0.32-0.98).
In patients with probable meningitis, those who received steroids demonstrated a trend toward harm (OR 2.65, CI 0.73-9.63).
Probable versus definite meningitis was determined retrospectively based on cultures. The most common isolate was Streptococcus suis.
Bottom line: This study provides some evidence for using steroids in adults with confirmed bacterial meningitis. Clinical application is limited by bacterial epidemiology and the difficulty of prospectively separating patients who would benefit from those who might be harmed.
Citation: Nguyen TH, Tran TH, Thwaites G, et. al. Dexamethasone in Vietnamese adolescents and adults with bacterial meningitis. N Engl J Med. 2007;357:2431-2439.
Which Probiotic Preparations Best Reduce the Duration of Acute Diarrhea in Children?
Background: Probiotics have been suggested as an adjunctive therapy to reduce the severity and duration of acute diarrhea in children. However, there are no clear data to suggest if specific probiotic agents are superior to others.
Study design: Prospective single-blind, randomized, controlled trial.
Setting: Outpatient primary care in Naples, Italy.
Synopsis: This study compared five commercially available probiotic preparations (mix of Lactobacillus delbrueckii var bulgaricus/Streptococcus thermophilus/L. acidophilus/ Bifido-bacterium bifidum; L. rhamnosus strain GG; Saccharomyces boulardii; Bacillus clausii; or Enterococcus faecium SF68) and a control group in the treatment of outpatient acute diarrhea in 571 children age 3 months to 36 months.
The primary outcomes were the duration of diarrhea and the number and consistency of stools. The groups receiving Lactobacillus GG and the mixture had a shorter total duration of diarrhea (78.5 and 70 hours, respectively), decreased total number of stools, and improved stool consistency when compared with the control (115.5 hours). The other therapies showed no improvement over the control group. These data report on products commercially available in Italy, which may differ greatly from products available locally.
Bottom line: Probiotic preparations for the treatment of acute diarrhea in children should be chosen based on effectiveness data.
Citation: Canani RB, Cirillo P, Terrin G, et al. Probiotics for treatment of acute diarrhoea in children: randomised clinical trial of five different preparations. BMJ 2007;335:340-345.
Is CTPA a Reliable Alternative to V/Q Scan for Diagnosing PE?
Background: Computed tomography pulmonary angiogram (CTPA) has replaced ventilation/perfusion (V/Q) scanning at many hospitals as the test of choice for ruling out pulmonary embolism (PE). But limited clinical data compare CTPA with V/Q scanning in those suspected of having venous thromboembolism (VTE).
Study design: Randomized, investigator blinded, controlled trial.
Setting: The emergency departments (ED), inpatient wards, and outpatient clinics of five academic centers.
Synopsis: In the study, 1,411 patients were enrolled from five medical centers. Of 694 patients randomized to CTPA, 133 (19.2%) were diagnosed with VTE in the initial evaluation period, while 101 of 712 patients (14.2%) receiving a V/Q scan were diagnosed with VTE.
Patients not initially diagnosed with VTE were monitored. At three-month follow-up, 0.4% of the CTPA group and 1.0% of the V/Q group had a diagnosed VTE.
The overall rate of VTE found in the initial diagnostic period was significantly greater in patients randomized to CTPA (19.2% vs. 14.2%; difference, 5.0%; 95% CI; 1.1% to 8.9% p=.01). This suggests CTPA has a higher false positive rate or detects clinically insignificant thrombi.
Bottom line: CTPA was not inferior to V/Q scanning for excluding clinically meaningful PE, but CTPA diagnosed about 30% more patients with VTE than did V/Q scanning.
Citation: Anderson DR, Kahn SR, Rodger MA, et al. Computed tomographic pulmonary angiography vs. ventilation-perfusion lung scanning in patients with suspected pulmonary embolism: a randomized controlled trial. JAMA. 2007;298(23):2743-2753.
Does the Hospitalist Model Improve Length of Stay, Quality, and Cost of Care?
Background: The hospitalist model, with increased physician availability and expertise but greater discontinuity of care, is becoming more prevalent in U.S. medicine. What little is known about how this model will affect patient care is derived from a number of small studies.
Study design: Retrospective cohort study.
Setting: 45 small to midsize, predominantly nonteaching hospitals throughout the U.S.
Synopsis: Using the Premier Healthcare Informatics database, this study examined information on 76,926 patients admitted for seven common diagnoses to one of three services: hospitalist, general internist, or family physician. Analysis showed that patients on a hospitalist service had a 0.4-day shorter length of stay (p<0.001) compared with those on a general internist or family physician service.
The cost to patients cared for by a hospitalist was lower than the cost of family physicians ($125 less, p=0.33) and internists ($268 less, p=0.02). There was no difference found in death rate or 14-day readmission rate among the three services.
Given the retrospective design of this study, no causal relationship can be deduced. This study is further limited by its lack of specific data on the physicians categorized into one of the three groups solely by administrative data. The authors had concerns that the biases inherent to the retrospective nature of their work accounted for the significant difference found between hospitalists and internists.
Bottom line: The hospitalist model is associated with modest improvements in length of stay as compared with traditional inpatient approaches.
Citation: Lindenauer PK, Rothberg MB, Pekow PS, et. al. Outcomes of care by hospitalists, general internists, and family physicians. N Engl J Med. 2007;357:2589-2600.
What Is the Stroke Risk Soon after TIA, and What Factors Drive the Variability of Previous Findings?
Background: Many studies have attempted to estimate the risk of stroke in the early period after a transient ischemic attack (TIA). These studies vary widely in their calculation of the estimated risk. Further, the clinical and methodological factors underlying this variability are unclear.
Study design: Systematic review and meta-analysis.
Setting: Community and hospital.
Synopsis: Searching the Cochrane review database, MEDLINE, EMBASE, CINAHL, and BIOSIS, 11 studies from 1973 to 2006 were included for meta-analysis, selected from 694 potential candidate studies identified on initial screening. The studies ranged in size from 62 to 2,285 patients.
The pooled estimate of risk for stroke following TIA was found to be 3.5%, 8%, and 9.2% at two, 30, and 90 days following TIA, respectively. However, there was significant heterogeneity for all periods considered (p<0.001).
Outcome ascertainment was identified as a major source of methodological heterogeneity. When risk of stroke at follow-up was determined by passive ascertainment (e.g., administrative documentation) the early risk of stroke was 3.1% two days after TIA, 6.4% at 30 days, and 8.7% at 90 days. But active ascertainment (e.g., direct, personal contact with study participants) determined stroke risk to be 9.9%, 13.4%, and 17.4% at two, 30, and 90 days after TIA, respectively.
Bottom line: Based on analysis of completed studies that included directly observed follow-up of study participants, the early risk of stroke after TIA is approximately 15% to 20% at 90 days following the sentinel event.
Citation: Wu CM, McLaughlin K, Lorenzetti DL, Hill MD, Manns BJ, Ghali WA. Early risk of stroke after transient ischemic attack. Arch Intern Med. 2007;167:2417-2422.
What Is the 1-year Ischemia and Mortality Rate for Three Anti-thrombotic Therapies for Early Invasive Management of ACS?
Background: Early interventional or surgical revascularization has improved morbidity and mortality in patients with acute coronary syndrome (ACS). The optimal anti-thrombotic regimen to reduce late ischemic and death rates has not been determined.
Study design: Prospective, open-label randomized control trial.
Setting: 450 academic and community-based institutions in 17 countries.
Synopsis: A total of 13,819 patients were enrolled between August 2003 and December 2005. They were assigned to heparin plus glycoprotein (GP) IIb/IIIa inhibitors (n=4,603), bivalirudin (Angiomax) plus IIb/IIIa inhibitors (n=4,604), or bivalirudin monotherapy (n=4,612).
For patients receiving GP IIb/IIIa inhibitors, a 2x2 factorial design assigned half the heparin and bivalirudin groups to routine upstream GP inhibitor administration (4,605 patients). The other half received selective GP IIb/IIIa inhibitors administration if PCI was indicated (4,602 patients).
At one year, there was no statistically significant difference in ischemia or mortality rate among the three therapy groups. No difference in ischemia rate was detected between the two GP IIb/IIIa inhibitor utilization strategies.
Since the hypotheses and the power for the one-year analysis in this trial were not prospectively determined, the results are considered to be exploratory and hypothesis generating.
Bottom line: At one year, there is no statistically significant difference in ischemia or mortality rate for the three antithrombotic regiments and the two glycoprotein utilization strategies.
Citation: Stone GW, Ware JH, Bertrand ME, et. al. Antithrombotic strategies in patients with acute coronary syndromes undergoing early invasive management. One-year results from the ACUITY trial. JAMA 2007;298:2497-2505.
What Is the PE Risk after Discontinuing Anticoagulation in Patients with Symptomatic VTE?
Background: The natural history of patients with symptomatic VTE who have completed anticoagulation is not well understood.
Study design: Inception cohort using pooled data from a prospective cohort study and one arm of an open-label randomized trial.
Setting: Academic medical centers in Canada, Sweden, and Italy.
Synopsis: Using pooled data from two previous studies, 2,052 patients with a first diagnosis of symptomatic VTE (lower-extremity deep-vein thrombosis [DVT], PE, or both) were evaluated for fatal PE after a standard course of therapy (mean of six months) with a vitamin K antagonist.
Patients were followed for up to 120 months. The investigators found an annual event risk of 0.19-0.49 per 100 person-years for fatal PE. Patients with prolonged immobility, active cancer, and thrombophilia were excluded, as were those with recurrent acute DVT.
Secondary analysis revealed an incidence of any fatal, definite or probable PE within the first year of discontinuing therapy of 0.35%-0.81%.
After the first year, the annual event risk ranged from 0.15-0.40 events per 100 person-years. Patients with advanced age, idiopathic VTE as well as those presenting with PE had higher rates of fatal PE.
Bottom line: There is a real though small (less than 1%) risk of fatal PE in the first year following discontinuation of anticoagulation for the first VTE episode. The optimal course of treatment for patients with idiopathic VTE is yet to be determined.
Citation: Douketis JD, Gu CS, Schulman S, et al. The risk for fatal pulmonary embolism after discontinuing anticoagulant therapy for venous thromboembolism. Ann Intern Med. 2007;147(11):766-774.
Do the Beers Criteria Predict ED Visits Associated with Adverse Drug Events?
Background: Adverse drug events are common in the elderly. The Beers criteria are a consensus-based list of 41 medications that are considered inappropriate for use in older adults and often lead to poor outcomes.
Study design: Retrospective medical record review and data analysis.
Setting: Three nationally representative, U.S. public health surveillance systems: the National Electronic Injury Surveillance System-Cooperative Adverse Drug Event Surveillance System (NEISS-CADES), 2004-2005; the National Ambulatory Medical Care Survey (NAMCS), 2004; and National Hospital Ambulatory Medical Care Survey (NHAMCS), 2004.
Synopsis: Using data collected from ED visits at 58 hospitals in the NEISS-CADES system, this study estimated that 177,504 visits for adverse drug events occur annually in the United States. Only 8.8% of such visits were attributable to the 41 medications included in the Beers criteria. Three drug classes (anticoagulant and antiplatelet agents, antidiabetic agents, and narrow therapeutic index agents) accounted for nearly half of all such ED visits. Warfarin (17.3%), insulin (13%), and digoxin (3.2%) were the most commonly implicated medications, collectively accounting for 33% of visits (CI, 27.8% to 38.7%).
This study suggests that because of the common use and high risk of adverse events associated with these three drugs, interventions targeting their use may prevent ED visits for adverse drug events in the elderly, compared with interventions aimed at reducing the use of medications identified in the Beers criteria.
This study only included adverse drug events identified in the ED and relied on the diagnosis and documentation of such events by the ED physician.
Bottom line: Beers criteria medications, although considered inappropriate for use in the elderly, were associated with significantly fewer ED visits for adverse events compared with warfarin, digoxin, and insulin.
Citation: Budnitz DS, Shehab N, Kegler SR, et. al. Medication use leading to emergency department visits for adverse drug events in older adults. Ann Intern Med. 2007;147:755-765. TH
Research Committee Chair Reflects

Before Andy Auerbach, MD, MPH, concludes a four-year term as chair of SHM’s Research Committee, I talked with him about his perspective on hospital medicine research. Dr. Auerbach is an associate professor of medicine at the University of California, San Francisco.
He received a career development award from the National Institutes of Health (NIH) early in his career and is the principal investigator of an R01 research project grant from the NHLBI titled “Improving use of perioperative beta-blockers through a multidimensional QI program.”
He is also a co-author of “Outcomes of Patients Treated by Hospitalists, General Internists, and Family Physicians” in the December 2007 New England Journal of Medicine, which found statistically significant differences in length of stay and cost. He received his medical degree from Dartmouth Medical School in Hanover, N.H., and did his residency training in internal medicine at Yale New Haven Hospital in Connecticut. He completed an MPH in clinical epidemiology at the Harvard School of Public Health in Boston in 1998.
Q: So, is academia as glamorous as it sounds?
Dr. Auerbach: Way more glamorous—you should see my office. And yes, we are in a white tower.
Q: How did you get your start in research?
Dr. Auerbach: I actually started out my research fellowship wanting to be a cardiologist and go into the cath lab while developing the skills to participate in and teach research methods. I found I really enjoyed the work, particularly the creative and entrepreneurial aspects of developing a project or grant and seeing it through to completion.
Q: What are the research options for hospitalists practicing in nonteaching settings?
Dr. Auerbach: I think the most straightforward way to participate in research is to partner with a clinical research organization to help enroll patients in their trials. While you don’t get the opportunity to design the study, you do get to get a feel for consent/enrollment and internal review board [IRB] processes.
The next best way to get involved with research is to partner with a researcher—and this need not be a hospitalist—at your site or very near by. Many QI projects are close to being research-ready and may provide an opportunity to make that work count twice. But it will require you to learn about analytic methods.
I’d also be remiss if I didn’t mention the value of other very useful academic products—rigorous reports of a QI intervention (think of both success and failure stories) and patient case reports. If well referenced and used as teaching documents, these can be very useful ways to advance knowledge.
Q: Are there any particular prerequisites in terms of training that you find especially helpful as you conduct your research?
Dr. Auerbach: It is hard to be a capital-R “Researcher” and compete for career development grants and NIH funding without some advanced [degrees] and a clinical research fellowship. I hesitate to call these prerequisites, but they are nearly so.
Q: What do you like best about your career as a hospitalist?
Dr. Auerbach: I really like acute care medicine, but didn’t want to subspecialize—otherwise I’d be wearing lead in a cath lab now. I also like the questions and processes in the hospital a bit more than the clinic setting.
Q: Who are your mentors and how did you find them?
Dr. Auerbach: I’ve had a remarkable set of mentors from fellowship [Mary Beth Hamel, Roger Davis, Russ Phillips] through my early career [Lee Goldman, Bob Wachter, Ralph Gonzales]. Now that I am early-mid career, I’m trying to pass their teaching on.
Q: Any advice for hospitalists interested in research but daunted by the prospect of starting their own studies?
Dr. Auerbach: If you want to do a scholarly/academic project to round out your personal/career satisfaction, I think the daunting nature of research can be overcome with the right questions and right support—and by defining what these are well before you actually dive into a dataset or implementation project. You also have to decide how much satisfaction you will get from the project in the end compared to the incremental nights/weekends you will spend to plan and execute your project—not to mention publish.
If you are thinking of research as a career, be aware of what makes you happy. If you like to write, enjoy the process of hypothesis generating/testing, and take rejection well you may be happy as a researcher. There are still plenty of nights/weekends to be spent, though.
Making a switch from full-time clinical or administrative work to research means making a very big commitment to going back to get the skills as part of a fellowship.
Q: Do researchers interested in quality improvement questions still have to run their work past the IRB?
Dr. Auerbach: Unfortunately this is now an area of uncertainty for people—unnecessarily so. Until recent events, IRBs have not required approval for QI projects that seek to enhance care according to an evidence-based standard, especially if that standard is endorsed by the institution. If you plan to publish your findings—particularly if you talk to or touch patients, or collect personal health information—I think it is nearly always wise to at least call your local IRB to ask for how you can or should conduct the study. This is best done before you start the project, obviously.
If you want to publish your results using deidentified data after the project is done, our IRB would say that is exempt from review [e.g., no need for approval]. But I think even this case would be worth a phone call to ensure your IRB feels similarly.
Whether or not you get IRB approval, be very aware of how and where you store data. TH
Satisfaction Is Job No. 1
The Career Satisfaction Task Force has focused on two key areas this year to build upon the work that resulted in last year’s white paper “A Challenge for a New Specialty: A White Paper on Hospitalist Career Satisfaction.”
The paper outlined a framework for hospital medicine program leaders and hospitalists to identify important components of matching individuals and programs for the best job fit.
This year, the task force is working to bring the white paper to life and moving it from a conceptual framework to demonstrating how to use it to solve real issues facing programs and individuals.
The first of these projects was a Webinar led by SHM Senior Vice President Joe Miller, Sylvia McKean, MD (course director of Hospital Medicine 2008), and Win Whitcomb, MD (a co-founder of SHM). Each of them has held leadership roles on this task force. About 80 people participated in the December event, and more than three-fourths of attendees rated it highly.
At last year’s Annual Meeting in Dallas, the white paper was presented in a task force workshop. In keeping with our aim to bring the framework to life, this year’s workshop will use real case studies to demonstrate how to use bring the concepts to solutions. The workshop will be facilitated by Chad Whelan, MD, assistant professor of medicine and director of the Hospitalists Scholars Training Program, University of Chicago. Discussing key concepts will be Doug Carlson, MD, associate professor, Pediatrics Division, Washington University School of Medicine in St. Louis, and Tosha Wetterneck, MD, University of Wisconsin Hospital/Clinics, Madison. Drs. Carlson and Wetterneck made significant contributions to the white paper. In this highly interactive workshop, case studies that demonstrate challenges with workload/scheduling and autonomy will be discussed. Drs. Carlson and Wetterneck will lead the participants through discussions aimed at identifying the root causes of struggle and potential solutions for the program.
In the coming months, we hope to develop a series of articles to be published in The Hospitalist addressing the issues of greatest importance for career satisfaction.
The task force realizes there may be opportunities to add knowledge about career satisfaction and provide a valuable service to SHM member. We are in the early stages of developing a survey geared to further clarifying the most important factors in making satisfying career matches as well as providing detailed feedback about programs to their leaders. We are seeking funding to enable us to begin this exciting work.
What is the best method of treating acutely worsened chronic pain?
Case
A 69-year-old female with metastatic ovarian cancer and chronic pain syndrome presented to the hospital with seven days of progressively worsening abdominal pain. The pain had been similar to her chronic cancer pain but more severe. She has acute renal failure secondary to volume depletion from poor intake. A CT scan of the abdomen and pelvis reveal progression of her cancer with acute pathology. What is the best method of treating this patient’s pain?
Overview
Pain is pandemic. It is the most common reason patients seek healthcare.1 Almost one-third of Americans will experience severe chronic pain at some point in their lives. Every year, approximately 25 million Americans experience acute pain and 50 million experience chronic pain. Only one in four patients with pain receives appropriate therapy and control of their pain.
Pain is the most common symptom experienced by hospitalized adults.2 Acute or chronic pain can be particularly challenging to treat because these patients are frequently opioid dependent and have many psychosocial factors. No one method of pain control is superior to another. However, one method to gain rapid control of an acute pain crisis in a patient with chronic pain is to use patient-controlled analgesia (PCA).
Review of the Data
The first commercially available PCA pumps became available in 1976.3 They were created after studies in the 1960s demonstrated that small doses of opioids given intravenously provided more effective pain relief than conventional intramuscular injections.
The majority of studies on PCAs are in the postoperative patient, with cancer pain being next most commonly studied. PCAs utilize microprocessor-controlled infusion pumps that deliver a preprogrammed dose of opioid when the patient pushes the demand button. They allow programming of dose (demand dose), time between doses (lockout interval), background infusion rate (basal rate), and nurse-initiated dose (bolus dose).
The PCA paradigm is based on the opioid pharmacologic concept of minimum effective analgesic concentration (MEAC).4,5 The MEAC is the smallest serum opioid concentration at which pain is relieved. The dose-response curve to opioids is sigmoidal such that minimal analgesia is achieved until the MEAC is reached, after which minute increases in opioid concentrations produce analgesia, until further increases produce no significant increased analgesic effect.
PCAs allow individualized dosing and titration to achieve the MEAC, with small incremental doses administered whenever the serum concentration falls below the MEAC. A major goal of PCA technology is to regulate drug delivery to rapidly achieve and maintain the MEAC.
Advantages of PCAs
- More individual dosing and titration of pain medications to account for inter-individual and intra-individual variability in the response to opioids;
- Negative feedback control system, an added safety measure to avoid respiratory depression. As patients become too sedated from opioids, they are no longer able to push the button to receive further opioids;
- Higher patient satisfaction with pain control, a major determinant being personal control over the delivery of pain relief;6-8 and
- Greater analgesic efficacy vs. conventional analgesia.
Disadvantages of PCAs
Select patient populations: Not all patients are able to understand and retain the required instructions necessary to safely or effectively use self-administered opioids (e.g., cognitively impaired patients).
Potential for opioid dosing errors: These are related to equipment factors, medical personnel prescribing or programming errors.
Increased cost: PCAs have been shown to be more expensive in comparison with intramuscular (IM) injections, the prior standard of care.9-10
PCA Prescribing
The parameters programmed into the PCA machine include the basal rate, demand (or incremental) dose, lockout interval, nurse-initiated bolus dose, and choice of opioid.
Basal rate: The continuous infusion of opioid set at an hourly rate. Most studies that compare PCA use with and without basal rates (in postoperative patients) do not show improved pain relief or sleep with basal rates.11 Basal rates have been associated with increased risk of sedation and respiratory depression.12
The routine use of basal rates is not recommended initially, unless a patient is opioid-tolerant (i.e., on chronic opioid therapy). For patients on chronic opioids, their 24-hour total opioid requirement is converted by equianalgesic dosing to the basal rate. Steady state is not achieved for eight to 12 hours of continuous infusion; therefore, it is not recommended to change the basal rate more frequently than every eight hours.13
Demand dose: The dose patients provide themselves by pushing the button. Studies on opioid-naïve patients using morphine PCAs have shown that 1 mg IV morphine was the optimal starting dose, based on good pain relief without respiratory depression. Lower doses, such as 0.5 mg IV morphine, are generally used in the elderly as opioid requirements are known to decrease with patient age.14
For patients with a basal rate, the demand dose is often set at 50% to 100% of the basal rate. The demand dose is the parameter that should be titrated up for acute pain control. World Health Organization guidelines recommend increasing the dose by 25% to 50% for mild to moderate pain, and 50% to 100% for moderate to severe pain.15
Lockout interval: Minimal allowable time between demand doses. This time is based on the time to peak effect of IV opioids and can vary from five to 15 minutes. The effects of varying lockout intervals—seven to 11 minutes for morphine and five to eight minutes for fentanyl—had no effect on pain levels or side effects.16 Ten minutes is a standard lockout interval.
Bolus dose: The nurse-initiated dose that may be given initially to achieve pain control and later to counteract incidental pain (e.g., that caused by physical therapy, dressing changes, or radiology tests). A recommended dose is equivalent to the basal rate or twice the demand dose.
Choice of opioid: Morphine is the standard opioid because of its familiarity, cost, and years of study. Although inter-individual variability exists, there are no major differences in side effects among the different opioids. Renal and hepatic insufficiency can increase the effects of opioids. Morphine is especially troublesome in renal failure because it has an active metabolite—morphine-6-glucuronide—that can accumulate and increase the risk of sedation and respiratory depression.
Other Concerns
PCA complications: The most well-studied adverse effects of PCAs are nausea and respiratory depression. There is no difference between PCAs and conventional analgesia in rates of nausea or respiratory depression.17
Nausea is the most common side effect in postoperative patients on PCAs. Patients rapidly develop tolerance to nausea over a period of days. However, many clinicians are concerned about respiratory depression and the risk of death. The overall incidence of respiratory depression with PCAs is less than 1% (range from 0.1 to 0.8%), similar to conventional analgesia. However, the incidence is significantly higher when basal rates are used, rising to 1.1 to 3.9%. Other factors predisposing a patient to increased risk of respiratory depression are older age, obstructive sleep apnea, hypovolemia, renal failure, and the concurrent use of other sedating medications.18
Medication errors are also common. The overall incidence of medication mishaps with PCAs is 1.2%.19 More than 50% of these occur because of operator-related errors (e.g., improper loading, programming errors, and documentation errors). Equipment malfunction is the next most common error.
Opioid equianalgesic dosing conversions: The equianalgesic dose ratio is the ratio of the dose of two opioids required to produce the same analgesic effect. (See Table 1, right.) For example, IV morphine is three times as potent as oral morphine, with an equianalgesic dose ratio of 1:3. Equianalgesic dose tables vary somewhat in their values, which have been largely determined by single-dose administration studies.20 The generalizability of these tables to chronic opioid administration is not well studied.
Incomplete cross tolerance: When switching from one opioid to another, lower doses can be used to control pain.21, 22 Tolerance to one opioid does not completely transfer to the new opioid. Starting at half to two-thirds of the new opioid dose is generally recommended to avoid opioid-specific tolerance and inter-individual variability.23,24
Back to the Case
Opioids are the mainstay of pharmacological management of moderate-to-severe cancer pain. Evaluation of the patient reveals that her acute increase in pain is likely due to progression of her cancer. She had been taking morphine (sustained-release, 90 mg oral) twice daily for her pain and had been using approximately five doses per day of immediate-release oral morphine 20 mg for breakthrough pain. This is equivalent to a total 24-hour opioid requirement of 280 mg oral morphine.
She should be started on a PCA for rapid pain control and titration. Hydromorphone (Dilaudid) is a better PCA choice than morphine because she has acute renal failure. The equianalgesic dose ratio of oral morphine to IV hydromorphone is approximately 30:1.5. The total 24-hour opioid dose of 280 mg oral morphine is equivalent to 14 mg IV hydromorphone ([280mg morphine per day ÷ 30] x 1.5 = 14).
After adjusting for 60% incomplete cross tolerance, the total 24-hour opioid dose is reduced to 8.4 mg IV hydromorphone (14 mg x 0.6 = 8.4 mg). This is approximately equivalent to 0.4 mg IV hydromorphone/hour (8.4 mg ÷ 24 hours), which is her initial basal rate. The demand dose should be set at 0.2 mg (50% the basal rate) with a lockout interval of 10 minutes.
Over a period of several days, the patient’s pain was controlled and her opioid requirements stabilized. She was on a basal rate of 1.4 mg/hour and a demand dose of 1 mg with a 10-minute lockout. Her total 24-hour opioid requirement was 44 mg of IV hydromorphone. As her renal function improved but did not completely normalize, oxycodone was chosen over morphine when converting her back to oral pain medications (less active renal metabolites). The equianalgesic dose ratio of oral oxycodone to IV hydromorphone is approximately 20:1.5. Her total 24-hour opioid dose of 44 mg IV hydromorphone is equivalent to 587 mg oral oxycodone (44 ÷ 1.5) x 20. After adjusting for 60% incomplete cross tolerance, the total 24-hour opioid dose is reduced to 352 mg oral oxycodone or 180 mg of sustained-release oxycodone twice daily (352 mg ÷ 2 ≈ 180 mg). For breakthrough pain she should receive 40 mg of immediate-release oxycodone every hour as needed (10% to 15% of the 24-hour opioid requirement). TH
Dr. Youngwerth is a hospitalist and instructor of medicine, University of Colorado at Denver, assistant director, Palliative Care Consult Service, associate director, Colorado Palliative Medicine Fellowship Program, and medical director, Hospice of Saint John.
References
- American Pain Society. Pain: Current understanding of assessment, management, and treatments. National Pharmaceutical Council 2006;1-79.
- Morrison RS, Meier DE, Fischberg D, et al. Improving the management of pain in hospitalized adults. Arch Intern Med. 2006;166:1033-1039.
- Grass JA. Patient-controlled analgesia. Anesth Analg. 2005;101:S44-S61.
- Etches RC. Patient-controlled analgesia. Surg Clinics N Amer. 1999;79:297-312.
- Nolan MF and Wilson M-C B. Patient-controlled analgesia: A method for the controlled self-administration of opioid pain medications. Phys Ther. 1995;75:374-379.
- Ballantyne JC, Carr DB, Chalmers TC, Dear KBG, Angelillo IF, Mosteller F. Postoperative patient-controlled analgesia: Meta-analyses of initial randomized control trials. J Clin Anesth. 1993;5:182-193.
- Hudcova J, McNicol E, Quah C, Lau J, Carr DB. Patient controlled opioid analgesia versus conventional opioid analgesia for postoperative pain. Cochrane Database of Systematic Reviews. 2006;4:1-10.
- Sidebotham D, Dijkhuizen MRJ, Schug SA. The safety and utilization of patient-controlled analgesia. J Pain Symptom Manage. 1997;14:202-209.
- Macintyre PE. Safety and efficacy of patient-controlled analgesia. Br J Anaesth. 2001;87:36-46.
- Manon C, Rittenhouse BE, Perreault S, et al. Efficacy and costs of patient-controlled analgesia versus regularly administered intramuscular opioid therapy. Amer Soc Anesth Inc. 1998;89:1377-1388.
- Krenn H, Oczenski W, Jellinek H, Krumpl-Ströher M, Schweitzer E, Fitzgerald RD. Nalbuphine by PCA-pump for analgesia following hysterectomy: Bolus application versus continuous infusion with bolus application. Eur J Pain. 2001;5:219-226.
- Lehmann KA. Recent developments in patient-controlled analgesia. J Pain Symptom Manage. 2005;29:S72-S89.
- American Pain Society. Principles of analgesic use in the treatment of acute pain and cancer pain. 5th ed. 2003:1-73.
- Macintyre PC, Jarvis DA. Age is the best predictor of postoperative morphine requirements. Pain. 1995;64:357-364.
- National Comprehensive Cancer Network. Clinical practice guidelines in oncology: Adult cancer pain. Version 2.2005:1-30.
- Ginsberg B, Gil KM, Muir M, Sullivan F, Williams DA, Glass PSA. The influence of lockout intervals and drug selection on patient-controlled analgesia following gynecological surgery. Pain. 1995;62:95-100.
- Walder B, Schafer M, Henzi I, Tramer MR. Efficacy and safety of patient-controlled opioid analgesia for acute postoperative pain. Acta Anaesthesiol Scand. 2001;45:795-804.
- Etches RC. Respiratory depression associated with patient-controlled analgesia: a review of eight cases. Can J Anaesth. 1994;41:125-132.
- Oswalt KE, Shrewsbury P, Stanton-Hicks M. The incidence of medication mishaps in 3,299 PCA patients. Pain. 1990;S5;S152.
- Pereira J, Lawlor P, Vigano A, Dorgan M, Bruera E. Equianalgesic dose rations for opioids: A critical review and proposals for long-term dosing. J Pain Symptom Manage. 2001;22:672-687.
- Ballantyne JC, Mao J. Opioid therapy for chronic pain. N Engl J Med. 2003;349:1943-1953.
- Mercandante S. Opioid rotation for cancer pain. Cancer. 1999;86:1856-1866.
- Mehta V, Langford RM. Acute pain management for opioid dependent patients. Anaesthesia. 2006;61:269-276.
- Pasternak GW. Incomplete cross tolerance and multiple mu opioid peptide receptors. Trends Pharm Sciences. 2001;22:67-70.
Nocturnal Economics

In my previous column, I reviewed different strategies for providing hospitalist practice night coverage based on the size of the group (February 2008, p. 61). I suggested that dedicated nocturnists are a valuable though expensive asset that any practice larger than about six to eight full-time equivalents (FTE) should consider.
This month, I offer additional thoughts about compensation for nocturnists. I’ll demonstrate why adding dedicated night coverage—in which the doctor working at night doesn’t work during the daytime hours the day before or after the night shift—may not increase practice workload significantly.
What follows is adapted from a new book I co-wrote with Joe Miller, senior vice president of SHM, and Win Whitcomb, MD, a hospitalist at Mercy Medical Center in Springfield, Mass., and co-founder of SHM.1
Compensation
If all hospitalists provide an equal amount of night coverage in rotation (e.g., each member of a four-person group works 61 nights annually), it’s not necessary to adjust the compensation scheme to reflect night work. A night-shift differential in this situation will not influence a doctor’s annual income relative to that of his partner hospitalists.
However, if the hospitalist program seeks more flexibility, it may be advisable to pay more for a night of work than a day of work. Under this scheme, hospitalists may trade day and night work among themselves, leading to enhanced satisfaction. For example, Dr. McCartney is willing to work some of Dr. Lennon’s nights because of the income benefit. Dr. Lennon may or may not work some of Dr. McCartney’s days in return.
If the practice has one or more dedicated nocturnists, they will need to realize some benefit to working only nights. This benefit can take many forms:
- The night hospitalist works less often than day doctors (e.g., day doctors work 220 days annually, night doctors work 182);
- The night hospitalist has a lighter patient load (e.g., a night hospitalist in a small practice typically sleeps three to six hours per night shift while the day doctors typically work a busy eight-to-12-hour shift);
- The night doctor earns more than the day doctors; or
- The night doctor has a higher priority in time-off scheduling.
It is common to combine these benefits. For example a night hospitalist might work less often than day doctors, have a lighter patient load, and earn the same annual income. Anecdotal experience shows that having more income or fewer workdays than day doctors is valued more than a reduced patient load.
For most practices, compensating hospitalists based significantly or entirely on their production can be a good idea but might be problematic for a night doctor. It could lead the night doctor to encourage marginal admissions, some of whom would need to be discharged by the daytime hospitalists hours later. In effect, the night hospitalist could say: “I’ll admit anyone I can get my hands on because my income will increase. I’ll leave it for the day doctors to sort out what to do with all these patients tomorrow.”
An Example
A traditional system of night call (such as pager call from home while also working days) is usually cheaper than dedicated night shifts. And while there are many benefits to having dedicated night shifts, increased patient capacity may not be one of them. Consider the following example:
- On any given day, a five-FTE hospitalist practice has three doctors working, one of whom will be on-call that night by pager;
- That will mean 219 worked days per year for each doctor, one-third of which (73) will be on-call. Each hospitalist gets 146 days off per year;
- The practice decides to switch to dedicated night shifts in which the doctors do not work the day before or after a night shift. The practice wants to retain the 146 days off for each hospitalist. This new coverage arrangement is equivalent to adding 365 shifts annually (one for each night); and
- This will require an additional 1.67 FTE hospitalists (1.67 hospitalists at 219 shifts/year=365).
In this example, by switching from on-call coverage to on-site coverage, the practice increased from five FTEs to 6.67 FTEs. If the daytime work was already enough to keep all three doctors busy, adding 1.67 FTEs for dedicated night shifts may not increase practice productivity or revenue significantly. The practice looks much less productive per FTE (6.67 FTEs are now seeing the volume previously handled by five FTEs) and much costlier.
Changing from traditional night call to dedicated night coverage can be expensive because it may require adding staff yet doesn’t usually increase practice capacity significantly. But it offers other benefits such as those listed in Table 1 (see p. TK). Some practices find they must provide dedicated night coverage to recruit hospitalists. Other institutions choose to support it believing it leads to more timely, efficient, higher-quality care. TH
Dr. Nelson has been a practicing hospitalist since 1988 and is co-founder and past president of SHM. He is a principal in Nelson/Flores Associates, a national hospitalist practice management consulting firm. He is also part of the faculty for SHM’s “Best Practices in Managing a Hospital Medicine Program” course. This column represents his views and is not intended to reflect an official position of SHM.
Reference
- Miller J, Nelson J, Whitcomb W. Hospitalists: A Guide to Building and Sustaining a Successful Program. Chicago:Health Administration Press;2007:149-150.
What is the target blood glucose for noncritical care patients?
Case
A 65-year-old obese (100 kg) man with type 2 diabetes, hypertension, and a pack-a-day smoking habit is admitted with moderately severe bilobar pneumonia. His condition is manifest by fever, cough, chills, leukocytosis, and a modest oxygen requirement. You order oxygen, intravenous (IV) fluids, diet, and appropriate antibiotics while continuing the history and chart review. The patient uses metformin and glyburide, and his home glucose readings are generally in the 160 to 180 mg/dL range. An HbA1c level performed three months ago was 9.8, leading to an increased dose of glyburide. As you finish the history, the nurse reports a glucose reading of 198 mg/dL. What is the target blood glucose for noncritical care adult inpatients?
Overview
Diabetes mellitus is an epidemic in the United States. At least 9.3% of adults older than 20 (more than 20 million people) have diabetes. Approximately 30% are unaware they have diabetes.1 Concurrent with the increasing prevalence of diabetes in the U.S. from 1980 through 2003, the number of hospital discharges with diabetes as any listed diagnosis more than doubled between 1980 and 2003. These trends are expected to accelerate.2 Studies suggest 26% of inpatients have diabetes and 12% have pre-diabetes, previously undiagnosed diabetes, or stress hyperglycemia.3
Review of the Data
A full review of the evidence is beyond the scope of this article. What follows is a sampling of the most representative or influential critical care studies.
Physiology
Fluid and electrolyte balance, left ventricular (LV) function, leukocyte action, wound healing, endothelial function, and immunoglobulin function are all impaired with hyperglycemia.
A prothrombotic state and enhanced platelet aggregation have been demonstrated with even mild elevations of blood glucose.
The mechanisms are multifactorial and complex and involve metabolic derangements leading to oxidative stress, release of free fatty acids, and counter-regulatory hormones.4-6
Observational Studies
A strong and consistent association with hyperglycemia and adverse outcomes is seen in a wide variety of critical care and peri-operative settings. Trauma survival, stroke survival and function, and the incidence of post-operative infections are all adversely affected by hyperglycemia.7-10 Acute myocardial infarction (MI) mortality, acute MI infarct size, and LV dysfunction are also consistently adversely affected in these studies.11-13
This association is typically present in hyperglycemic patients whether they have a diagnosis of diabetes or not, and the association is often even stronger in those lacking a pre-existing diagnosis. Dysfunction typically is detectable at only modest elevations of blood glucose and becomes more marked in a dose response relationship.
Uncontrolled Interventional Studies
The Portland Diabetic Project is a prospective, non-randomized, observational study of 5,510 consecutive diabetic cardiac surgery patients.14-15 The three-day blood glucose average (3-BG) has been progressively reduced for the population through the use of continuous insulin infusion (CII).
The last reported glycemic target is less than 130 mg/dL, and the current glycemic target is less than 110 mg/dL. Both CII for three days and a favorable 3-BG were independently associated with improved mortality, deep sternal-wound infection rates, and length of stay. Mortality and deep sternal-wound infection rates for diabetic patients with well-controlled glucose levels are equal to patients without diabetes.
Another study compared 800 mixed medical-surgical ICU patients with tight glycemic control (mean BG 130.7 mg/dL) to historical controls with a mean glucose of 152.3 mg/dL. The insulin infusion group had associated significant reductions in mortality and median length of ICU stay.16
Randomized Controlled Trials and Meta-Analyses
In the first Diabetes and Insulin-Glucose study (DIGAMI 1), patients with acute MI received IV insulin therapy for 24 hours, followed by multiple daily injections for three months or longer. The insulin group had lower glucose values and a 29% reduction in mortality at one year and 28% reduction at 3.4 years compared with the control group.17-18
In the most influential study to date, van den Berghe, et al., randomized 1,548 surgical intensive-care unit (ICU) patients to either intensive (IT) or conventional (CT) insulin therapy.19 The glycemic target in the IT arm was 80 to 110 mg/dL (mean glucose attained was 103 mg/dL), while the CT arm had a mean glucose level of 153 mg/dL. The IT group enjoyed substantial reductions in both ICU and total in-hospital mortality, as well as reductions in blood stream infections, acute renal failure, transfusions and the duration of mechanical ventilation (p<0.01 for all).
While a similar study in a medical ICU did not achieve statistical significance in the overall intention-to-treat analysis for mortality, it did demonstrate reductions in mortality in patients with at least three days of ICU treatment and significant reductions in morbidity.20
A meta-analysis of these two studies demonstrated a relative risk reduction in mortality (23.6 to 20.4%) and morbidity in all patients treated with intensive insulin therapy.21
A separate meta-analysis of 35 clinical trials evaluating the effect of intensive insulin infusion therapy on mortality in critically ill inpatients revealed a 15% reduction in short-term mortality.22
Noncritical Care Settings
There are no randomized controlled trials establishing the optimal glycemic target for noncritical care inpatients. There are a number of observational and pilot studies that reinforce the studies performed in critical care settings.
In a retrospective review of almost 1,900 general medical-surgical admissions, Umpierrez, et al., reported an 18-fold increase in mortality in hyperglycemic patients without prior history of diabetes and a 2.5-fold increase in mortality in patients with known diabetes compared to controls. These associations persisted with adjustment for severity of illness.23
A variety of observational and pilot studies associate hyperglycemia with poor outcomes in community acquired pneumonia, renal transplant, and the durability of remission in acute lymphocytic leukemia.24-25
Guidelines and Recommendations
Spurred by the emerging controlled trial evidence, the American Association of Clinical Endocrinologists (AACE) convened a consensus conference involving nine organizations, including SHM. Recommendations for the management of inpatient hyperglycemia included stringent glycemic targets for critical care and noncritical care areas.26 The American Diabetes Association (ADA) produced an excellent technical review on inpatient diabetes that provided the basis for ADA Clinical Practice Guideline glycemic targets.27 The glycemic targets recommended are shown in Table 1 (above).
Caveats
Before accepting these recommended glycemic targets, review the shortcomings of the literature supporting them and consider institutional and individual patient factors that might modify the glycemic target.
Insulin has beneficial vascular and anti-inflammatory effects in its own right, making it difficult in some studies to distinguish the benefit of glucose lowering from the benefit of the insulin used to attain improved control.
The majority of studies supporting inpatient glycemic targets are observational or non-randomized. Some use admission blood glucose concentrations as the sole measure of glucose control.
While most of these studies used valid methods to control for severity of illness and co-morbidities, these methods are not perfect. In some cases, hyperglycemia may have been a marker of a more stressed and sick patient rather than an independent source of adverse outcome.
The dramatic results from the first van den Berghe study have proved difficult to replicate, in part because other investigators have had difficulty achieving stringent glycemic targets safely. Two international multicenter studies recently stopped enrollment due to excess rates of hypoglycemia, but the studies have not yet been published in final form.28-29
Finally, it bears repeating that the proposed glucose targets for noncritically ill patients are based on essentially no clinical trial data in that population. In part, the glycemic targets reflect the evidence derived from landmark outpatient randomized trials.30-31 In the outpatient setting, insulin requirements and nutritional intake are far more reliable than the inpatient setting, where the iatrogenic induction of excessive hypoglycemia is a valid concern.
Safe Glycemic Control
Rapidly fluctuating nutritional status, changing insulin requirements, varied levels of expertise, and hand-offs between geographic locations and providers are all common in the inpatient setting.
Aggressively pursuing glycemic targets without having systems and safeguards in place could lead to net harm.
The AACE recently identified these barriers and recommended a multidisciplinary team approach, reliable metrics, and a standardized method for insulin protocols, orders, and hypoglycemia prevention and treatment techniques.32
Both the AACE and SHM have produced toolkits to assist institutions to safely achieve improved glycemic control and care.33-34 The SHM Glycemic Control Task Force recently summarized key concepts to emphasize in formulating protocols and order sets in the noncritical care setting (see Table 2, left).
Stringent glycemic targets recommended by the ADA and the AACE may be appropriately moderated in centers that do not yet have the systems in place to achieve those goals safely.
Your glycemic target need not be identical to the ADA and AACE glycemic targets but should be similar to them. Examples of glycemic targets for noncritically ill inpatients are shown in Table 3 (see p. 48).
The glycemic target should be actionable, in that some institutionally endorsed action should result when a patient’s glycemic target is consistently not met.
Back to the Case
Your patient has an active infection, a glucose of 198 mg/dL and an elevated HbA1c. You hold the oral agents and start a basal bolus insulin regimen.
You generate an estimate for a safe insulin total daily dose of 60 units (100 kg x 0.6 units per kg for an obese, type 2 diabetes patient), and administer half as basal insulin, with the remaining 30 units distributed as rapid acting insulin in three divided doses. Your orders include routine glucose monitoring, and you plan to adjust the insulin daily as needed to adhere to the institutional glycemic target for noncritically ill patients of 90 to 150 mg/dL. TH
Dr. Maynard is the division chief for hospital medicine at the University of California, San Diego. He is the leader of SHM’s Glycemic Control Task Force and a leader of the VTE Prevention Collaborative.
References
- Cowie CC, Rust KF, Byrd-Holt DD, et al. Prevalence of diabetes and impaired fasting glucose in adults in the U.S. population: National Health And Nutrition Examination Survey 1999-2002. Diabetes Care. 2006;29(6):1263-1268.
- Centers for Disease Control and Prevention. National diabetes fact sheet: general information and national estimates on diabetes in the United States, 2005. Atlanta, GA: Department of Health and Human Services, Centers for Disease Control and Prevention, 2005. Available at www.cdc.gov/diabetes/pubs/factsheet05.htm. Last accessed September 18, 2007.
- Umpierrez GE, Isaacs SD, Bazargan N, You X, Thaler LM, Kitabchi AE. Hyperglycemia: an independent marker of in-hospital mortality in patients with undiagnosed diabetes. J Clin Endocrinol Metab. 2002;87(3):978-982.
- Clement S, Braithwaite SS, Magee MF, Ahmann A, Smith EP, Schafer RG, Hirsch IB, the Diabetes In Hospitals Writing Committee. Management of diabetes and hyperglycemia in hospitals (Technical Review). Diabetes Care. 2004;27:553–591.
- Zarich SW. Mechanism by which hyperglycemia plays a role in the setting of acute cardiovascular illness. Rev Cardiovasc Med. 2006;7 (Suppl 2):S35-43.
- Hansen T, Thiel S, Wouters P, Christiansen J, VandenBerghe B. Intensive insulin therapy exerts anti-inflammatory effects in critically ill patients and counteracts the adverse effect of low mannose-gind lectin levels. J Clin Endocrinol Metab. 2003;88:1082-1088.
- Yendamuri S, Fulda GJ, Tinkoff GH. Admission hyperglycemia as a prognostic indicator in trauma. J Trauma. 2003;55:33-38.
- Capes SE, Hunt D, Malmberg K, Pathak P, Gerstein H. Stress hyperglycemia and prognosis of stroke in nondiabetic and diabetic patients: a systematic overview. Stroke. 2001;32:2426–
- 2432.
- Bruno A, Williams LS, Kent TA. How important is hyperglycemia during acute brain infarction? Neurologist 2004;10(4):195-200.
- Pomposelli JJ, Baxter JK, Babineau TJ, et al. Early postoperative glucose control predicts nosocomial infection rate in diabetic patients. J Parenter Enteral Nutr.1998;22(2):77-81.
- Ainla T, Baburin A, Teesalu R, Rahu M. The association between hyperglycaemia on admission and 180-day mortality in acute myocardial infarction patients with and without diabetes. Diabet Med. 2005;22(10):1321-1325.
- Timmer JR, van der Horst IC, Ottervanger JP, et al. Prognostic value of admission glucose in non-diabetic patients with myocardial infarction. Am Heart J. 2004;148:399-404.
- Capes SE, Hunt D, Malmberg K, Gerstein HC. Stress hyperglycemia and increased risk of death after myocardial infarction in patients with and without diabetes: a systematic overview. Lancet. 2000;355:773–778.
- Furnary AP, Wu Y. Clinical effects of hyperglycemia in the cardiac surgery population: the Portland Diabetic Project. Endocr Pract. 2006:12 (Suppl 3): 22-26.
- Furnary AP, Gao G, Grunkemeier GL, et al. Continuous insulin infusion reduces mortality in patients with diabetes undergoing coronary artery bypass grafting. J Thorac Cardiovasc Surg. 2003;125:1007–1021.
- Krinsley JS. Association between hyperglycemia and increased hospital mortality in a heterogeneous population of critically ill patients. Mayo Clin Proc. 2003;78:1471–1478.
- Malmberg K. Prospective randomised study of intensive insulin treatment on long-term survival after acute myocardial infarction inpatients with diabetes mellitus. BMJ. 1997;314:1512–1515.
- Malmberg K, Norhammar A, Wedel H, Ryden L. Glycometabolic state at admission: important risk marker of mortality in conventionally treated patients with diabetes mellitus and acute myocardial infarction: long-term results from the Diabetes and Insulin-Glucose Infusion in Acute Myocardial Infarction (DIGAMI) study. Circulation. 1999;99:2626–2632.
- Van den Berghe G, Wouters P, Weekers F, et al. Intensive insulin therapy in critically ill patients. N Engl J Med. 2001;345:1359–1367.
- Van den Berghe G, Wilmer A, Hermans G, et al. Intensive insulin therapy in the medical ICU. N Engl J Med. 2006;354(5):449-461.
- Van den Berghe G, Wilmer A, Milants I, et al. Intensive insulin therapy in mixed medical/surgical intensive care units: benefit versus harm. Diabetes. 2006;55(11):3151-3159.
- Pittas AG, Siegel RD, Lau J. Insulin therapy for critically ill hospitalized patients: a meta-analysis of randomized controlled trials. Arch Intern Med. 2004;164(18):2005-2011.
- McAlister FA, Majumdar SR, Blitz S, Rowe BH, Romney J, Marrie TJ. The relation between hyperglycemia and outcomes in 2,471 patients admitted to the hospital with community-acquired pneumonia. Diabetes Care. 2005;28(4):810-815.
- Thomas M, Mathew T, Russ G, Rao M, Moran J. Early peri-operative glycaemic control and allograft rejection in patients with diabetes mellitus: a pilot study. Transplantation. 2001;72(7):1321-1324.
- Weiser MA, Cabanillas ME, Konopleva M, et al. Relation between the duration of remission and hyperglycemia during induction chemotherapy for acute lymphocytic leukemia with a hyperfractionated cyclophosphamide, vincristine, doxorubicin, and dexamethasone/methotrexate-cytarabine regimen. Cancer. 2004;100(6):1179-1185.
- Garber AJ, Moghissi ES, Bransome ED Jr, et al., American College of Endocrinology Task Force on Inpatient Diabetes Metabolic Control. American College of Endocrinology position statement on inpatient diabetes and metabolic control. Endocr Pract. 2004;10:77–82.
- Standards of medical care in diabetes-2006. Diabetes Care. 2006;29 (Suppl. 1):S4-S42.
- Vanhorebeek I, Langouche L, Van den Berghe G. Tight blood glucose control with insulin in the ICU: facts and controversies. Chest. 2007;132(1):268-278.
- Devos P, Preiser JC. Current controversies around tight glucose control in critically ill patients. Curr Opin Clin Nutr Metab Care. 2007;10(2):206-209.
- The Diabetes Control and Complications Trial Research Group (DCCT). The effect of intensive treatment of diabetes on the development and progression of long-term complications in insulin-dependent diabetes mellitus. N Engl J Med. 1993;329:977-986.
- UK Prospective Diabetes Study (UKPDS) Group. Intensive blood-glucose control with sulphonylureas or insulin compared with conventional treatment and risk of complications in patients with type 2 diabetes (UKPDS 33). Lancet. 1998;352(9131):837-853.
- American College of Endocrinology and American Diabetes Association Consensus Statement on Inpatient Diabetes and Glycemic Control: a call to action. Diabetes Care. 2006;29(8):1955-1962.
- American Association of Clinical Endocrinologists Inpatient Glycemic Control Resource Center 2007. Available at http://resources.aace.com/index.asp. Last accessed December 18, 2007.
- Society of Hospital Medicine Glycemic Control Resource Room. Available at www.hospitalmedicine.org/ResourceRoomRedesign/GlycemicControl.cfm. Last accessed Nov. 25, 2007.