User login
News and Views that Matter to Pediatricians
The leading independent newspaper covering news and commentary in pediatrics.
New pediatrics growth charts better reflect severe obesity
The U.S. Centers for Disease Control and Prevention has issued extended growth charts to help doctors and researchers better understand patterns of development for the most overweight children and adolescents.
In 2017-2018, more than 4.5 million U.S. youth met the criteria for severe obesity – defined as 120% of the 95th percentile, or 35 kg/m2 or greater – according to the CDC.
The new growth charts will not replace the current charts but extend beyond the 97th percentile for body mass index. Formerly, data were extrapolated for anything over the 95th percentile based on evidence from 1963 to 1980, when obesity rates were lower.
The extended growth charts are based on data collected between 1988 and 2015 from young children and adolescents with obesity.
Experts said the expanded charts will allow researchers and clinicians to track the effects of interventions for obesity whether they involve an increase in physical activity, a decrease in consumption, or other interventions. The corresponding z-score charts also are provided.
Physicians should still use the CDC’s BMI-for-age growth charts from 2000 for pediatric patients with BMIs under the 95th percentile. The agency said it does not intend to update those charts.
The definitions of overweight, obesity, and severe obesity remain unchanged.
Mothers’ sleep issues promote poor outcomes for infants
or insomnia, based on data from approximately 5,000 infants.
Sleep disturbance is common during pregnancy, and “sleep disorders during pregnancy can have significant consequences for both the pregnant person and their infant,” write Jennifer N. Felder, PhD, of the University of California, San Francisco, and colleagues.
However, data on the impact of maternal insomnia on specific infant outcomes are limited, they said.
In a study published recently in the journal Sleep Health, the researchers reviewed data from 3,371 pregnant women diagnosed with sleep apnea and 3,213 with insomnia. Of these, 2,357 and 2,212 were matched with controls in a propensity-score analysis. The referent controls were matched for maternal characteristics, obstetric factors, and infant factors among individuals without a sleep disorder. All were singleton pregnancies.
Adverse infant outcomes included the following:
- One- and 5-minute Apgar scores less than 7.
- Respiratory distress syndrome.
- Neonatal intensive care unit admission.
- Hypoglycemia.
- Infant death.
- Hospital stay of longer than 2 days for vaginal delivery or longer than 4 days for cesarean delivery.
- Emergency department visit before 3 months of age.
- Emergency department visit in the first year of life.
- Composite measure of adverse infant outcomes.
Compared with matched controls, the infants born to mothers with sleep apnea had a significantly increased risk for any adverse outcome (50.1% vs. 53.5%) and of the specific outcomes of low 1-minute Apgar scores (6.3% vs. 9.6%), neonatal ICU stays (6.3% vs. 8.4%), and an emergency department visit in the first year of life (33.6% vs. 36.9%).
For infants born to mothers with insomnia, the only significant difference in outcomes compared with controls was an increased likelihood of an emergency department visit (37.2% vs. 32.3%).
“Research on possible mechanisms of the relation between maternal prenatal sleep apnea and poorer birth and infant outcomes associations is small but growing, implicating systemic inflammation and late or prolonged fetal heart rate decelerations,” the researchers write in their discussion.
Research on insomnia during pregnancy and adverse infant outcomes is limited, and the largest studies have been complicated by the effects of insomnia medication; therefore, “our finding that infants born to mothers with an insomnia diagnosis were at increased risk of only emergency room visit, but no other analyzed infant outcomes, is important and novel,” they note.
The findings were limited by several factors, including the reliance on medical records, which may lack details on how routinely health care professionals assessed sleep disorders, the researchers noted. “Consequently, the findings presented here may reflect more severe cases of insomnia and sleep apnea, and may not represent the population of individuals with diagnosed sleep apnea or insomnia during pregnancy generally,” the authors say. Other limitations included a lack of information on treatment of sleep disorders and on the timing of diagnosis (before pregnancy or during pregnancy).
However, the results were strengthened by the large, population-based sample and use of codes to highlight research questions, the researchers said.
In light of the health consequences of sleep disorders in pregnancy, the data suggest that sleep apnea and insomnia in pregnant women may serve as targets for risk assessment of adverse infant outcomes, and more research is needed to determine whether addressing sleep issues reduces these outcomes, they concluded.
The study was supported by the University of California, San Francisco, Preterm Birth Initiative and by grants to lead author Dr. Felder from the National Center for Complementary and Integrative Health and to a coauthor from the National Heart, Lung, and Blood Institute. The researchers reported no relevant financial relationships.
A version of this article first appeared on Medscape.com.
FROM SLEEP HEALTH
Not all children with type 2 diabetes have obesity
Obesity is not a universal phenotype in children with type 2 diabetes (T2D), a global systematic review and meta-analysis reported. In fact, the study found, as many as one in four children with T2D do not have obesity and some have normal reference-range body mass measurements. Further studies should consider other mechanisms beyond obesity in the genesis of pediatric diabetes, the authors of the international analysis concluded, writing for JAMA Network Open.
“We were aware that some children and adolescents with T2D did not have obesity, but we didn’t know the scale of obesity in T2D, or what variables may impact the occurrence of diabetes in this group,” endocrinologist M. Constantine Samaan, MD, MSc, associate professor of pediatrics at McMaster University in Hamilton, Ont., told this news organization. “So, the analysis did help us understand the body mass distribution of this group in more detail.”

The international investigators included in their meta-analysis 53 articles with 8,942 participants from multiple world regions and races/ethnicities. The overall prevalence of obesity in pediatric patients with T2D was 75.27% (95% confidence interval [CI], 70.47%-79.78%). The prevalence of obesity at time of diagnosis in 4,688 participants was 77.24% (95% CI, 70.55%-83.34%). Male participants had higher odds of obesity than females: odds ratio, 2.10 (95% CI, 1.33-3.31) – although girls are generally more likely to develop T2D. The highest prevalence of obesity occurred in Whites at 89.86% (95% CI, 71.50%-99.74%), while prevalence was lowest in Asian participants at 64.50% (95% CI, 53.28%-74.99%).
The authors noted that childhood obesity affects approximately 340 million children worldwide and is a major driver of pediatric T2D, an aggressive disease with a high treatment failure rate. Understanding the contribution of body mass to the evolution of insulin resistance, glucose intolerance, and T2D with its attendant comorbidities and complications, such as nonalcoholic fatty liver disease, remains crucial for developing personalized interventions.
Known risk factors for T2D include interactions between genetics and the environment, including lifestyle factors such as diet and low physical activity levels, Dr. Samaan noted. Certain ethnic groups have higher T2D risks, as do babies exposed in the womb to maternal obesity or diabetes, he said. “And there are likely many other factors that contribute to the risk of T2D, though these remain to be defined.”
Is “lean” T2D in children without obesity likely then to be hereditary, more severe, and harder to control with lifestyle modification? “That’s a great question, but the answer is we don’t know,” Dr. Samaan said.
Commenting on the study but not involved in it, Timothy J. Joos, MD, a pediatrician in Seattle affiliated with the Swedish Medical Center, said the findings raise the question of how many pediatric T2D patients are being missed because they don’t meet current screening criteria. “In nonobese T2D pediatric patients, genetics (and by proxy family history) obviously play a heavier role. In my practice, I often get parents asking me to screen their skinny teenager for diabetes because of diabetes in a family member. In the past I would begrudgingly comply with a smirk on my face. Now the smirk will be gone.”
Dr. Joos said it would be interesting to see what percentage of these T2D patients without obesity (body mass index < 95th percentile) would still meet the criteria for being overweight (BMI > 85th percentile) as this is the primary criterion for screening according to the American Diabetes Association guidelines.
Current guidelines generally look for elevated body mass measures as a main screening indication, Dr. Samaan’s group noted. But in their view, while factors such as ethnicity and in utero exposure to diabetes are already used in combination with BMI-based measures to justify screening, more sophisticated prediabetes and diabetes prediction models are needed to support a more comprehensive screening approach.
“Because being overweight is the initial criterion, children with multiple other criteria are not being screened,” Dr. Joos said. He agreed that more research is needed to sort out the other risk factors for pediatric T2D without obesity so these patients may be detected earlier.
New models may need to incorporate lifestyle factors, hormones, puberty, growth, and sex as well, the authors wrote. Markers of insulin resistance, insulin production capacity, and other markers are needed to refine the identification of those who should be screened.
Dr. Samaan’s group is planning to study the findings in more detail to clarify the effect of body mass on the comorbidities and complications of pediatric T2D.
In addition to the study limitation of significant interstudy heterogeneity, the authors acknowledged varying degrees of glycemic control and dyslipidemia among participants.
No specific funding was provided for this review and meta-analysis. The authors disclosed no conflicts of interest. Dr. Joos disclosed no competing interests with regard to his comments.
Obesity is not a universal phenotype in children with type 2 diabetes (T2D), a global systematic review and meta-analysis reported. In fact, the study found, as many as one in four children with T2D do not have obesity and some have normal reference-range body mass measurements. Further studies should consider other mechanisms beyond obesity in the genesis of pediatric diabetes, the authors of the international analysis concluded, writing for JAMA Network Open.
“We were aware that some children and adolescents with T2D did not have obesity, but we didn’t know the scale of obesity in T2D, or what variables may impact the occurrence of diabetes in this group,” endocrinologist M. Constantine Samaan, MD, MSc, associate professor of pediatrics at McMaster University in Hamilton, Ont., told this news organization. “So, the analysis did help us understand the body mass distribution of this group in more detail.”
The international investigators included in their meta-analysis 53 articles with 8,942 participants from multiple world regions and races/ethnicities. The overall prevalence of obesity in pediatric patients with T2D was 75.27% (95% confidence interval [CI], 70.47%-79.78%). The prevalence of obesity at time of diagnosis in 4,688 participants was 77.24% (95% CI, 70.55%-83.34%). Male participants had higher odds of obesity than females: odds ratio, 2.10 (95% CI, 1.33-3.31) – although girls are generally more likely to develop T2D. The highest prevalence of obesity occurred in Whites at 89.86% (95% CI, 71.50%-99.74%), while prevalence was lowest in Asian participants at 64.50% (95% CI, 53.28%-74.99%).
The authors noted that childhood obesity affects approximately 340 million children worldwide and is a major driver of pediatric T2D, an aggressive disease with a high treatment failure rate. Understanding the contribution of body mass to the evolution of insulin resistance, glucose intolerance, and T2D with its attendant comorbidities and complications, such as nonalcoholic fatty liver disease, remains crucial for developing personalized interventions.
Known risk factors for T2D include interactions between genetics and the environment, including lifestyle factors such as diet and low physical activity levels, Dr. Samaan noted. Certain ethnic groups have higher T2D risks, as do babies exposed in the womb to maternal obesity or diabetes, he said. “And there are likely many other factors that contribute to the risk of T2D, though these remain to be defined.”
Is “lean” T2D in children without obesity likely then to be hereditary, more severe, and harder to control with lifestyle modification? “That’s a great question, but the answer is we don’t know,” Dr. Samaan said.
Commenting on the study but not involved in it, Timothy J. Joos, MD, a pediatrician in Seattle affiliated with the Swedish Medical Center, said the findings raise the question of how many pediatric T2D patients are being missed because they don’t meet current screening criteria. “In nonobese T2D pediatric patients, genetics (and by proxy family history) obviously play a heavier role. In my practice, I often get parents asking me to screen their skinny teenager for diabetes because of diabetes in a family member. In the past I would begrudgingly comply with a smirk on my face. Now the smirk will be gone.”
Dr. Joos said it would be interesting to see what percentage of these T2D patients without obesity (body mass index < 95th percentile) would still meet the criteria for being overweight (BMI > 85th percentile) as this is the primary criterion for screening according to the American Diabetes Association guidelines.
Current guidelines generally look for elevated body mass measures as a main screening indication, Dr. Samaan’s group noted. But in their view, while factors such as ethnicity and in utero exposure to diabetes are already used in combination with BMI-based measures to justify screening, more sophisticated prediabetes and diabetes prediction models are needed to support a more comprehensive screening approach.
“Because being overweight is the initial criterion, children with multiple other criteria are not being screened,” Dr. Joos said. He agreed that more research is needed to sort out the other risk factors for pediatric T2D without obesity so these patients may be detected earlier.
New models may need to incorporate lifestyle factors, hormones, puberty, growth, and sex as well, the authors wrote. Markers of insulin resistance, insulin production capacity, and other markers are needed to refine the identification of those who should be screened.
Dr. Samaan’s group is planning to study the findings in more detail to clarify the effect of body mass on the comorbidities and complications of pediatric T2D.
In addition to the study limitation of significant interstudy heterogeneity, the authors acknowledged varying degrees of glycemic control and dyslipidemia among participants.
No specific funding was provided for this review and meta-analysis. The authors disclosed no conflicts of interest. Dr. Joos disclosed no competing interests with regard to his comments.
FROM JAMA NETWORK OPEN
Cancer researcher banned from federal funding for faking data in nearly 400 images in 16 grant applications
according to a U.S. government research watchdog.
Alice C. Chang, PhD, whose publications and grants listed her name as Chun-Ju Chang, received nearly $700,000 in funding from the National Institutes of Health through grant applications that the U.S. Office of Research Integrity said contained fake data. She will be banned from receiving federal grants for a decade – a more severe sanction than ORI has typically imposed in recent years.
In its findings, ORI said Dr. Chang, who was an associate professor of basic medical sciences at Purdue’s College of Veterinary Medicine, West Lafayette, Ind., “knowingly, intentionally, or recklessly falsified and/or fabricated data from the same mouse models or cell lines by reusing the data, with or without manipulation, to represent unrelated experiments from different mouse models or cell lines with different treatments in three hundred eighty-four (384) figure panels in sixteen (16) grant applications.”
Two of the grant applications were funded. Dr. Chang received $688,196 from the National Cancer Institute, a division of NIH, from 2018 to 2019 for “Targeting metformin-directed stem cell fate in triple negative breast cancer.” The other grant ORI says was submitted in 2014 and funded, “Targeting cell polarity machinery to exhaust breast cancer stem cell pool,” does not show up in NIH RePorter. The rest of the grants were not approved.
We found a Chun-Ju Chang who is dean of the College of Life Sciences at China Medical University in Taiwan and has published papers with a group that Chun-Ju Chang at Purdue also published with. She did not immediately respond to our request for comment.
ORI’s finding also stated Dr. Chang faked data in two papers supported by government funding by reusing figures reporting gene expression in mice and cells after drug treatments, relabeling them to say they showed the results of different experiments. According to the agency, she has agreed to request corrections for the papers:
“Leptin–STAT3–G9a Signaling Promotes Obesity-Mediated Breast Cancer Progression,” published in May 2015 in Cancer Research and cited 83 times, according to Clarivate’s Web of Science.
“Retinoic acid directs breast cancer cell state changes through regulation of TET2-PKC-zeta pathway,” published in February 2017 in Oncogene and cited 26 times.
Between the two papers and 15 of the grant applications, ORI said that Dr. Chang reused gene expression data, sometimes with manipulation, in 119 figure panels. She reused other types of data and images in hundreds of figures across multiple grant applications, ORI found.
As well as correcting the two papers, Dr. Chang agreed to a 10-year ban from all federal contracting, including grant funding. She also agreed not to serve in any advisory or consulting role with the U.S. Public Health Service, which includes the NIH, for that time period.
A version of this article first appeared on Retraction Watch.
Dupilumab significantly improves markers of AD severity in pediatric patients
A registry-based study provides further evidence that treatment with dupilumab significantly reduces severity and symptoms of atopic dermatitis (AD) in clinical practice.
Dupilumab also decreased severity-associated biomarkers in pediatric patients with moderate to severe AD, researchers in the Netherlands reported.
Obtaining serum biomarkers is not the current standard in everyday practice, but studying them may improve understanding of who might respond best to dupilumab, said Jessica Hui, MD, a pediatric allergist and immunologist at National Jewish Health in Denver, in an email comment to this news organization.
“AD is heterogeneous, as each patient may have different presentations and underlying biology,” said Dr. Hui, who wasn’t involved in the research. “Studying biomarkers can eventually assist us in providing targeted therapy to each individual patient.”
Dr. Hui added, “As blood biomarkers can inform us of severity and treatment response, we can be hopeful that this will assist us in the management of AD patients in the future.”
Examining effect on disease severity
Dupilumab, a monoclonal antibody that inhibits interleukin (IL)-4 and IL-13 signaling, is approved in Europe and the United States to treat moderate to severe AD in patients 6 months of age or older, and to treat certain other inflammatory conditions.
Phase 3 studies show that dupilumab is effective for improving AD symptoms and quality of life in pediatric patients, but few clinical practice studies have researched the effect of the therapy on severity- and disease-related biomarkers in this population, the study authors write.
The study was published online in Pediatric Allergy Immunology.
In a new study, a team led by Esmé Kamphuis, MD, of the University of Groningen, the Netherlands, and colleagues evaluated the efficacy and safety of a 28-week dupilumab treatment course in 61 pediatric patients with moderate to severe AD. Additionally, the investigators examined the effect of this treatment regimen on serum biomarkers associated with disease severity.
Patients in the study were registered in the multicenter BioDay registry, which includes patients with moderate to severe AD receiving biologics or small-molecule agents. The AD cohort included children between 6 and 12 years of age (n = 16) and adolescents between 12 and less than 18 years of age (n = 45), all of whom received dupilumab on a dosing regimen indicated by age and body weight.
Over one-third (36.1%) of dupilumab-treated patients achieved an Investigator Global Assessment score of “almost clear” by 28 weeks of treatment. Approximately 75.4% of patients reached an Eczema Area and Severity Index (EASI) of 50, 49.2% reached EASI-75, and 24.6% reached EASI-90 at the 7-month follow-up.
Among patient-reported outcomes, 84.7% experienced improvements of 4 or more points on the Patient-Oriented Eczema Measure after the 28-week dupilumab treatment. In addition, improvements of 4 or more points on the Numeric Rating Scale for pruritus and pain were achieved by 45.3% and 77.4% of patients, respectively.
The most frequently reported side effects included conjunctivitis (n = 10) and headache (n = 4).
Of the 19 severity-associated serum biomarkers measured at baseline, week 4, and week 16, markers related to AD severity and treatment response significantly decreased during treatment (thymus- and activation-regulated chemokine, pulmonary and activation-regulated chemokine, periostin, soluble IL-2 receptor alpha).
A predicted EASI, calculated from selected biomarkers, demonstrated a significant association with disease severity in the cohort.
Implications for practice
When asked to comment on the study findings, Raegan Hunt, MD, the division chief of pediatric dermatology at Texas Children’s Hospital in Houston, said it is important to validate the changes in AD serum biomarkers in pediatric patients on dupilumab therapy, given that this treatment has historically been better studied in adults.
“This study adds to daily practice outcomes data, which in many cases is more relevant to the everyday care of patients than structured clinical trial data,” said Dr. Hunt, an associate professor at the Baylor College of Medicine, Houston.
Dr. Hunt, who didn’t participate in the study, noted that more research is needed on the adverse effects of dupilumab in the pediatric AD population.
Dr. Hui added that there is a lack of clear understanding of the exact underlying mechanisms for certain side effects, such as conjunctivitis, warranting further study.
The study’s BioDay registry is funded by Sanofi/Regeneron, AbbVie, Leo Pharma, Pfizer, and Eli Lilly. Several study coauthors report relationships with several pharmaceutical companies. Dr. Hunt and Dr. Hui report no relevant financial relationships.
A version of this article first appeared on Medscape.com.
FROM PEDIATRIC ALLERGY IMMUNOLOGY
Have you heard the one about the cow in the doctor’s office?
Maybe the cow was late for its appointment
It’s been a long day running the front desk at your doctor’s office. People calling in prescriptions, a million appointments, you’ve been running yourself ragged keeping things together. Finally, it’s almost closing time. The last patient of the day has just checked out and you turn back to the waiting room, expecting to see it blessedly empty.
Instead, a 650-pound cow is staring at you.
“I’m sorry, sir or madam, we’re about to close.”
Moo.

“I understand it’s important, but seriously, the doctor’s about to …”
Moo.
“Fine, I’ll see what we can do for you. What’s your insurance?”
Moo Cross Moo Shield.
“Sorry, we don’t take that. You’ll have to go someplace else.”
This is probably not how things went down recently at Orange (Va.) Family Physicians, when they had a cow break into the office. Cows don’t have health insurance.
The intrepid bovine was being transferred to a new home when it jumped off the trailer and wandered an eighth of a mile to Orange Family Physicians, where the cow wranglers found it hanging around outside. Unfortunately, this was a smart cow, and it bolted as it saw the wranglers, crashing through the glass doors into the doctor’s office. Though neither man had ever wrangled a cow from inside a building, they ultimately secured a rope around the cow’s neck and escorted it back outside, tying it to a nearby pole to keep it from further adventures.
One of the wranglers summed up the situation quite nicely on his Facebook page: “You ain’t no cowboy if you don’t rope a calf out of a [doctor’s] office.”
We can see that decision in your eyes
The cliché that eyes are the windows to the soul doesn’t tell the whole story about how telling eyes really are. It’s all about how they move. In a recent study, researchers determined that a type of eye movement known as a saccade reveals your choice before you even decide.

Saccades involve the eyes jumping from one fixation point to another, senior author Alaa Ahmed of the University of Colorado, Boulder, explained in a statement from the university. Saccade vigor was the key in how aligned the type of decisions were made by the 22 study participants.
In the study, subjects walked on a treadmill at varied inclines for a period of time. Then they sat in front of a monitor and a high-speed camera that tracked their eye movements as the monitor presented them with a series of exercise options. The participants had only 4 seconds to choose between them.
After they made their choices, participants went back on the treadmill to perform the exercises they had chosen. The researchers found that participants’ eyes jumped between the options slowly then faster to the option they eventually picked. The more impulsive decision-makers also tended to move their eyes even more rapidly before slowing down after a decision was made, making it pretty conclusive that the eyes were revealing their choices.
The way your eyes shift gives you away without saying a thing. Might be wise, then, to wear sunglasses to your next poker tournament.
Let them eat soap
Okay, we admit it: LOTME spends a lot of time in the bathroom. Today, though, we’re interested in the sinks. Specifically, the P-traps under the sinks. You know, the curvy bit that keeps sewer gas from wafting back into the room?

Well, researchers from the University of Reading (England) recently found some fungi while examining a bunch of sinks on the university’s Whiteknights campus. “It isn’t a big surprise to find fungi in a warm, wet environment. But sinks and P-traps have thus far been overlooked as potential reservoirs of these microorganisms,” they said in a written statement.
Samples collected from 289 P-traps contained “a very similar community of yeasts and molds, showing that sinks in use in public environments share a role as reservoirs of fungal organisms,” they noted.
The fungi living in the traps survived conditions with high temperatures, low pH, and little in the way of nutrients. So what were they eating? Some varieties, they said, “use detergents, found in soap, as a source of carbon-rich food.” We’ll repeat that last part: They used the soap as food.
WARNING: Rant Ahead.
There are a lot of cleaning products for sale that say they will make your home safe by killing 99.9% of germs and bacteria. Not fungi, exactly, but we’re still talking microorganisms. Molds, bacteria, and viruses are all stuff that can infect humans and make them sick.
So you kill 99.9% of them. Great, but that leaves 0.1% that you just made angry. And what do they do next? They learn to eat soap. Then University of Reading investigators find out that all the extra hand washing going on during the COVID-19 pandemic was “clogging up sinks with nasty disease-causing bacteria.”
These are microorganisms we’re talking about people. They’ve been at this for a billion years! Rats can’t beat them, cockroaches won’t stop them – Earth’s ultimate survivors are powerless against the invisible horde.
We’re doomed.
Maybe the cow was late for its appointment
It’s been a long day running the front desk at your doctor’s office. People calling in prescriptions, a million appointments, you’ve been running yourself ragged keeping things together. Finally, it’s almost closing time. The last patient of the day has just checked out and you turn back to the waiting room, expecting to see it blessedly empty.
Instead, a 650-pound cow is staring at you.
“I’m sorry, sir or madam, we’re about to close.”
Moo.
“I understand it’s important, but seriously, the doctor’s about to …”
Moo.
“Fine, I’ll see what we can do for you. What’s your insurance?”
Moo Cross Moo Shield.
“Sorry, we don’t take that. You’ll have to go someplace else.”
This is probably not how things went down recently at Orange (Va.) Family Physicians, when they had a cow break into the office. Cows don’t have health insurance.
The intrepid bovine was being transferred to a new home when it jumped off the trailer and wandered an eighth of a mile to Orange Family Physicians, where the cow wranglers found it hanging around outside. Unfortunately, this was a smart cow, and it bolted as it saw the wranglers, crashing through the glass doors into the doctor’s office. Though neither man had ever wrangled a cow from inside a building, they ultimately secured a rope around the cow’s neck and escorted it back outside, tying it to a nearby pole to keep it from further adventures.
One of the wranglers summed up the situation quite nicely on his Facebook page: “You ain’t no cowboy if you don’t rope a calf out of a [doctor’s] office.”
We can see that decision in your eyes
The cliché that eyes are the windows to the soul doesn’t tell the whole story about how telling eyes really are. It’s all about how they move. In a recent study, researchers determined that a type of eye movement known as a saccade reveals your choice before you even decide.
Saccades involve the eyes jumping from one fixation point to another, senior author Alaa Ahmed of the University of Colorado, Boulder, explained in a statement from the university. Saccade vigor was the key in how aligned the type of decisions were made by the 22 study participants.
In the study, subjects walked on a treadmill at varied inclines for a period of time. Then they sat in front of a monitor and a high-speed camera that tracked their eye movements as the monitor presented them with a series of exercise options. The participants had only 4 seconds to choose between them.
After they made their choices, participants went back on the treadmill to perform the exercises they had chosen. The researchers found that participants’ eyes jumped between the options slowly then faster to the option they eventually picked. The more impulsive decision-makers also tended to move their eyes even more rapidly before slowing down after a decision was made, making it pretty conclusive that the eyes were revealing their choices.
The way your eyes shift gives you away without saying a thing. Might be wise, then, to wear sunglasses to your next poker tournament.
Let them eat soap
Okay, we admit it: LOTME spends a lot of time in the bathroom. Today, though, we’re interested in the sinks. Specifically, the P-traps under the sinks. You know, the curvy bit that keeps sewer gas from wafting back into the room?
Well, researchers from the University of Reading (England) recently found some fungi while examining a bunch of sinks on the university’s Whiteknights campus. “It isn’t a big surprise to find fungi in a warm, wet environment. But sinks and P-traps have thus far been overlooked as potential reservoirs of these microorganisms,” they said in a written statement.
Samples collected from 289 P-traps contained “a very similar community of yeasts and molds, showing that sinks in use in public environments share a role as reservoirs of fungal organisms,” they noted.
The fungi living in the traps survived conditions with high temperatures, low pH, and little in the way of nutrients. So what were they eating? Some varieties, they said, “use detergents, found in soap, as a source of carbon-rich food.” We’ll repeat that last part: They used the soap as food.
WARNING: Rant Ahead.
There are a lot of cleaning products for sale that say they will make your home safe by killing 99.9% of germs and bacteria. Not fungi, exactly, but we’re still talking microorganisms. Molds, bacteria, and viruses are all stuff that can infect humans and make them sick.
So you kill 99.9% of them. Great, but that leaves 0.1% that you just made angry. And what do they do next? They learn to eat soap. Then University of Reading investigators find out that all the extra hand washing going on during the COVID-19 pandemic was “clogging up sinks with nasty disease-causing bacteria.”
These are microorganisms we’re talking about people. They’ve been at this for a billion years! Rats can’t beat them, cockroaches won’t stop them – Earth’s ultimate survivors are powerless against the invisible horde.
We’re doomed.
Noninvasive laser therapy tied to improved short-term memory
Investigators compared the effect of 1,064 nm of tPBM delivered over a 12-minute session to the right PFC vs. three other treatment arms: delivery of the same intervention to the left PFC, delivery of the intervention at a lower frequency, and a sham intervention.
All participants were shown a series of items prior to the intervention and asked to recall them after the intervention. Those who received tPBM 1,064 nm to the right PFC showed a superior performance of up to 25% in the memory tasks compared with the other groups.
Patients with attention-related conditions, such as attention deficit hyperactivity disorder, “could benefit from this type of treatment, which is safe, simple, and noninvasive, with no side effects,” coinvestigator Dongwei Li, a visiting PhD student at the Centre for Human Brain Health, University of Birmingham, England, said in a news release.
The findings were published online in Science Advances.
Differing wavelengths
The researchers note that “in the past decades,” noninvasive brain stimulation technology using transcranial application of direct or alternating electrical or magnetic fields “has been proven to be useful” in the improvement of working memory (WM).
When applied to the right PFC, tPBM has been shown to improve accuracy and speed of reaction time in WM tasks and improvements in “high-order cognitive functions,” such as sustained attention, emotion, and executive functions.
The investigators wanted to assess the impact of tPBM applied to different parts of the brain and at different wavelengths. They conducted four double-blind, sham-controlled experiments encompassing 90 neurotypical college students (mean age, 22 years). Each student participated in only one of the four experiments.
All completed two different tPBM sessions, separated by a week, in which sham and active tPBM were compared. Two different types of change-detection memory tasks were given: one requiring participants to remember the orientation of a series of items before and after the intervention and one other requiring them to remember the color of the items (experiments 1 and 2).
A series of follow-up experiments focused on comparing different wavelengths (1,064 nm vs. 852 nm) and different stimulation sites (right vs. left PFC; experiments 3 and 4).
EEG recordings were obtained during the intervention and the memory tasks.
Each experiment consisted of one active tPBM session and one sham tPBM session, with sessions consisting of 12 minutes of laser light (or sham) intervention. These sessions were conducted on the first and the seventh day; then, on the eighth day, participants were asked to report (or guess) which session was the active tPBM session.
Stimulating astrocytes
Results showed that, compared with sham tPBM, there was an improvement in WM capacity and scores by the 1,064 nm intervention in the orientation as well as the color task.
Participants who received the targeted treatment were able to remember between four and five test objects, whereas those with the treatment variations were only able to remember between three and four objects.
“These results support the hypothesis that 1,064 nm tPBM on the right PFC enhances WM capacity,” the investigators wrote.
They also found improvements in WM in participants receiving tPBM vs. sham regardless of whether their performance in the WM task was at a low or high level. This finding held true in both the orientation and the color tasks.
“Therefore, participants with good and poor WM capacity improved after 1,064 nm tPBM,” the researchers noted.
In addition, participants were unable to guess or report whether they had received sham or active tPBM.
EEG monitoring showed changes in brain activity that predicted the improvements in memory performance. In particular, 1,064 tPBM applied to the right PFC increased occipitoparietal contralateral delay activity (CDA), with CDA mediating the WM improvement.
This is “consistent with previous research that CDA is indicative of the number of maintained objects in visual working memory,” the investigators wrote.
Pearson correlation analyses showed that the differences in CDA set-size effects between active and sham session “correlated positively” with the behavioral differences between these sessions. For the orientation task, the r was 0.446 (P < .04); and for the color task, the r was .563 (P < .02).
No similar improvements were found with the 852 nm tPBM.
“We need further research to understand exactly why the tPBM is having this positive effect,” coinvestigator Ole Jensen, PhD, professor in translational neuroscience and codirector of the Centre for Human Brain Health, said in the release.
“It’s possible that the light is stimulating the astrocytes – the powerplants – in the nerve cells within the PFC, and this has a positive effect on the cells’ efficiency,” he noted.
Dr. Jensen added that his team “will also be investigating how long the effects might last. Clearly, if these experiments are to lead to a clinical intervention, we will need to see long-lasting benefits.”
Beneficial cognitive, emotional effects
Commenting for this news organization, Francisco Gonzalez-Lima, PhD, professor in the department of psychology, University of Texas at Austin, called the study “well done.”
Dr. Gonzalez-Lima was one of the first researchers to demonstrate that 1,064 nm transcranial infrared laser stimulation “produces beneficial cognitive and emotional effects in humans, including improving visual working memory,” he said.
The current study “reported an additional brain effect linked to the improved visual working memory that consists of an EEG-derived response, which is a new finding,” noted Dr. Gonzales-Lima, who was not involved with the new research.
He added that the same laser method “has been found by the Gonzalez-Lima lab to be effective at improving cognition in older adults and depressed and bipolar patients.”
The study was supported by the National Natural Science Foundation of China, the Ministry of Science and Technology of the People’s Republic of China, and the National Defence Basic Scientific Research Program of China. The investigators and Dr. Gonzalez-Lima report no relevant financial relationships.
A version of this article first appeared on Medscape.com.
FROM SCIENCE ADVANCES
Should you quit employment to open a practice? These docs share how they did it
“Everyone said private practice is dying,” said Omar Maniya, MD, an emergency physician who left his hospital job for family practice in New Jersey. “But I think it could be one of the best models we have to advance our health care system and prevent burnout – and bring joy back to the practice of medicine.”
But employment doesn’t necessarily mean happiness. In the Medscape “Employed Physicians: Loving the Focus, Hating the Bureaucracy” ” report, more than 1,350 U.S. physicians employed by a health care organization, hospital, large group practice, or other medical group were surveyedabout their work. As the subtitle suggests, many are torn.
In the survey, employed doctors cited three main downsides to the lifestyle: They have less autonomy, more corporate rules than they’d like, and lower earning potential. Nearly one-third say they’re unhappy about their work-life balance, too, which raises the risk for burnout.
Some physicians find that employment has more cons than pros and turn to private practice instead.
A system skewed toward employment
In the mid-1990s, when James Milford, MD, completed his residency, going straight into private practice was the norm. The family physician bucked that trend by joining a large regional medical center in Wisconsin. He spent the next 20+ years working to establish a network of medical clinics.
“It was very satisfying,” Dr. Milford said. “When I started, I had a lot of input, a lot of control.”
Since then, the pendulum has been swinging toward employment. Brieanna Seefeldt, DO, a family physician outside Denver, completed her residency in 2012.
“I told the recruiter I wanted my own practice,” Dr. Seefeldt said, “They said if you’re not independently wealthy, there’s no way.”
Sonal G. Patel, MD, a pediatric neurologist in Bethesda, finished her residency the same year as Dr. Seefeldt. Dr. Patel never even considered private practice.
“I always thought I would have a certain amount of clinic time where I have my regular patients,” she said, “but I’d also be doing hospital rounds and reading EEG studies at the hospital.”
For Dr. Maniya, who completed his residency in 2021, the choice was simple. Growing up, he watched his immigrant parents, both doctors in private practice, struggle to keep up.
“I opted for a big, sophisticated health system,” he said. “I thought we’d be pushing the envelope of what was possible in medicine.”
Becoming disillusioned with employment
All four of these physicians are now in private practice and are much happier.
Within a few years of starting her job, Dr. Seefeldt was one of the top producers in her area but felt tremendous pressure to see more and more patients. The last straw came after an unpaid maternity leave.
“They told me I owed them for my maternity leave, for lack of productivity,” she said. “I was in practice for only 4 years, but already feeling the effects of burnout.”
Dr. Patel only lasted 2 years before realizing employment didn’t suit her.
“There was an excessive amount of hospital calls,” she said. “And there were bureaucratic issues that made it very difficult to practice the way I thought my practice would be.”
It took just 18 months for Dr. Maniya’s light-bulb moment. He was working at a hospital when COVID-19 hit.
“At my big health care system, it took 9 months to come up with a way to get COVID swabs for free,” he said. “At the same time, I was helping out the family business, a private practice. It took me two calls and 48 hours to get free swabs for not just the practice, not just our patients, but the entire city of Hamilton, New Jersey.”
Milford lasted the longest as an employee – nearly 25 years. The end came after a healthcare company with hospitals in 30 states bought out the medical center.
“My control gradually eroded,” he said. “It got to the point where I had no input regarding things like employees or processes we wanted to improve.”
Making the leap to private practice
Private practice can take different forms.
Dr. Seefeldt opted for direct primary care, a model in which her patients pay a set monthly fee for care whenever needed. Her practice doesn’t take any insurance besides Medicaid.
“Direct primary care is about working directly with the patient and cost-conscious, transparent care,” she said. “And I don’t have to deal with insurance.”
For Dr. Patel, working with an accountable care organization made the transition easier. She owns her practice solo but works with a company called Privia for administrative needs. Privia sent a consultant to set up her office in the company’s electronic medical record. Things were up and running within the first week.
Dr. Maniya joined his mother’s practice, easing his way in over 18 months.
And then there’s what Milford did, building a private practice from the ground up.
“We did a lot of Googling, a lot of meeting with accountants, meeting with small business development from the state of Wisconsin,” he said. “We asked people that were in business, ‘What are the things businesses fail on? Not medical practices, but businesses.’” All that research helped him launch successfully.
Making the dollars and cents add up
Moving from employment into private practice takes time, effort, and of course, money. How much of each varies depending on where you live, your specialty, whether you choose to rent or buy office space, staffing needs, and other factors.
Dr. Seefeldt, Dr. Patel, Dr. Milford, and Dr. Maniya illustrate the range.
- Dr. Seefeldt got a home equity loan of $50,000 to cover startup costs – and paid it back within 6 months.
- Purchasing EEG equipment added to Dr. Patel’s budget; she spent $130,000 of her own money to launch her practice in a temporary office and took out a $150,000 loan to finance the buildout of her final space. It took her 3 years to pay it back.
- When Dr. Milford left employment, he borrowed the buildout and startup costs for his practice from his father, a retired surgeon, to the tune of $500,000.
- Dr. Maniya assumed the largest risk. When he took over the family practice, he borrowed $1.5 million to modernize and build a new office. The practice has now quintupled in size. “It’s going great,” he said. “One of our questions is, should we pay back the loan at a faster pace rather than make the minimum payments?”
Several years in, Dr. Patel reports she’s easily making three to four times as much as she would have at a hospital. However, Dr. Maniya’s guaranteed compensation is 10% less than his old job.
“But as a partner in a private practice, if it succeeds, it could be 100%-150% more in a good year,” he said. On the flip side, if the practice runs into financial trouble, so does he. “Does the risk keep me up at night, give me heartburn? You betcha.”
Dr. Milford and Dr. Seefeldt have both chosen to take less compensation than they could, opting to reinvest in and nurture their practices.
“I love it,” said Dr. Milford. “I joke that I have half as much in my pocketbook, twice as much in my heart. But it’s not really half as much, 5 years in. If I weren’t growing the business, I’d be making more than before.”
Private practice is not without challenges
Being the big cheese does have drawbacks. In the current climate, staffing is a persistent issue for doctors in private practice – both maintaining a full staff and managing their employees.
And without the backing of a large corporation, doctors are sometimes called on to do less than pleasant tasks.
“If the toilet gets clogged and the plumber can’t come for a few hours, the patients still need a bathroom,” Dr. Maniya said. “I’ll go in with my $400 shoes and snake the toilet.”
Dr. Milford pointed out that when the buck stops with you, small mistakes can have enormous ramifications. “But with the bad comes the great potential for good. You have the ability to positively affect patients and healthcare, and to make a difference for people. It creates great personal satisfaction.”
Is running your own practice all it’s cracked up to be?
If it’s not yet apparent, all four doctors highly recommend moving from employment to private practice when possible. The autonomy and the improved work-life balance have helped them find the satisfaction they’d been missing while making burnout less likely.
“When you don’t have to spend 30% of your day apologizing to patients for how bad the health care system is, it reignites your passion for why you went into medicine in the first place,” said Dr. Maniya. In his practice, he’s made a conscious decision to pursue a mix of demographics. “Thirty percent of our patients are Medicaid. The vast majority are middle to low income.”
For physicians who are also parents, the ability to set their own schedules is life-changing.
“My son got an award ... and the teacher invited me to the assembly. In a corporate-based world, I’d struggle to be able to go,” said Dr. Seefeldt. As her own boss, she didn’t have to forgo this special event. Instead, she coordinated directly with her scheduled patient to make time for it.
In Medscape’s report, 61% of employed physicians indicated that they don’t have a say on key management decisions. However, doctors who launch private practices embrace the chance to set their own standards.
“We make sure from the minute someone calls they know they’re in good hands, we’re responsive, we address concerns right away. That’s the difference with private practice – the one-on-one connection is huge,” said Dr. Patel.
“This is exactly what I always wanted. It brings me joy knowing we’ve made a difference in these children’s lives, in their parents’ lives,” she concluded.
A version of this article first appeared on Medscape.com.
There are new things we can do to improve early autism detection
We are all seeing more children on the autism spectrum than we ever expected. With a Centers for Disease Control–estimated prevalence of 1 in 44, the average pediatrician will be caring for 45 children with autism. It may feel like even more as parents bring in their children with related concerns or fears. Early entry into services has been shown to improve functioning, making early identification important. However, screening at the youngest ages has important limitations.
Sharing a concern about possible autism with parents is a painful aspect of primary care practice. We want to get it right, not frighten parents unnecessarily, nor miss children and delay intervention.
Autism screening is recommended by the American Academy of Pediatrics at 18- and 24-month pediatric well-child visits. There are several reasons for screening repeatedly: Autism symptoms emerge gradually in the toddler period; about 32% of children later found to have autism were developing in a typical pattern and appeared normal at 18 months only to regress by age 24 months; children may miss the 18 month screen; and all screens have false negatives as well as false positives. But even screening at these two ages is not enough.
One criticism of current screening tests pointed out by the U.S. Preventive Services Task Force has been a problem with the sample used to develop or validate the tool. Many test development studies included only children at risk by being in early intervention, siblings of children with diagnosed autism, or children only failing the screening tests rather than a community sample that the screen in actually used for.
Another obstacle to prediction of autism diagnoses made years later is that some children may not have had any clinical manifestations at the younger age even as judged by the best gold standard testing and, thus, negative screens were ambiguous. Additionally, data from prospective studies of high-risk infant siblings reveal that only 18% of children diagnosed with autism at 36 months were given that diagnosis at 18 months of age despite use of comprehensive diagnostic assessments.
Prevalence is also reported as 30% higher at age 8-12 years as at 3-7 years on gold-standard tests. Children identified later with autism tend to have milder symptoms and higher cognitive functioning. Therefore, we need some humility in thinking we can identify children as early as 18 months; rather, we need to use the best available methods at all ages and remain vigilant to symptoms as they evolve as well as to new screening and testing measures.
The most commonly used parent report screen is the 20-item Modified Checklist for Autism in Toddlers–Revised (M-CHAT-R), a modification of the original CHAT screen. To have reasonable positive predictive value, the M-CHAT-R authors recommend a clinician or trained staff member conduct a structured follow-up interview with the parent when the M-CHAT-R has a score of 3-7. Scores of 8 or more reflect enough symptoms to more strongly predict an autism diagnosis and thus the interview may be skipped in those cases. The recommended two-step process is called M-CHAT-R/F. At 18 months without the R/F, a positive M-CHAT-R only is associated with an autism diagnosis 27% of the time (PPV, 0.27); which is unacceptable for primary care use.
Unfortunately, the M-CHAT-R/F appears to be less accurate for 18-month-olds than 24-month-olds, in part because its yes/no response options are harder for a caregiver to answer, especially for behaviors just developing, or because of lack of experience with toddlers.
An alternative modification of the original CHAT called the Quantitative CHAT or Q-CHAT-10 has a range of response options for the caregiver; for example, always/usually/sometimes/rarely/never or many times a day/a few times a day/a few times a week/less than once a week/never. The authors of the Q-CHAT-10, however, recommend a summary pass/fail result for ease of use rather than using the range of response option values in the score. We recently published a study testing accuracy using add-up scoring that utilized the entire range of response option values, called Q-CHAT-10-O (O for ordinal), for children 16-20 months old as well as cartoon depictions of the behaviors. Our study also included diagnostic testing of screen-negative as well as screen-positive children to accurately calculate sensitivity and specificity for this method. In our study, Q-CHAT-10-O with a cutoff score greater than 11 showed higher sensitivity (0.63) than either M-CHAT-R/F (0.34) or Q-CHAT-10 (0.31) for this age range although the PPV (0.35) and negative predictive value (0.92) were comparable with M-CHAT R/F. Although Q-CHAT-10-O sensitivity (0.63) is less than M-CHAT-R (without follow-up; 0.73) and specificity (0.79) is less than the two-stage R/F procedure (0.90), on balance, it is more accurate and more practical for a primary care population. After 20 months of age, the M-CHAT-R/F has adequate accuracy to rescreen, if indicated, and for the subsequent 24 month screening. Language items are often of highest value in predicting outcomes in several tools including in the screen we are now validating for 18 month olds.
The Q-CHAT-10-O with ordinal scoring and pictures can also be recommended because it shows advantages over M-CHAT-R/F with half the number of items (10 vs. 20), no requirement for a follow-up interview, and improved sensitivity. Unlike M-CHAT-R, it also contributes to equity in screening because results did not differ depending on race or socioeconomic background.
Is there an even better way to detect autism in primary care? In 2022 an article was published regarding an exciting method of early autism detection called the Social Attention and Communication Surveillance–Revised (SACS-R), an eight-item observation checklist completed at public health nurse check-ups in Australia. The observers had 4 years of nursing degree education and a 3.5-hour training session.
The SACS-R and the preschool version (for older children) had significant associations with diagnostic testing at 12, 18, 24, and 42 months. The SACS-R had excellent PPV (82.6%), NPV (98.7%), and specificity (99.6%) and moderate sensitivity (61.5%) when used between 12 and 24 months of age. Pointing, eye contact, waving “bye, bye,” social communication by showing, and pretend play were the key indicators for observations at 18 months, with absence of three or more indicating risk for autism. Different key indicators were used at the other ages, reflecting the evolution of autism symptoms. This hybrid (observation and scoring) surveillance method by professionals shows hopeful data for the critical ability to identify children at risk for autism in primary care very early but requires more than parent report, that is, new levels of autism-specific clinician training and direct observations at multiple visits over time.
The takeaway is to remember that we should all watch closely for early signs of autism, informed by research on the key findings that a professional might observe, as well as by using the best screens available. We should remember that both false positives and false negatives are inherent in screening, especially at the youngest ages. We need to combine our concern with the parent’s concern as well as screen results and be sure to follow-up closely as symptoms can change in even a few months. Many factors may prevent a family from returning to see us or following our advice to go for testing or intervention, so tracking the child and their service use is an important part of the good care we strive to provide children with autism.
Other screening tools
You may have heard of other parent-report screens for autism. It is important to compare their accuracy specifically for 18-month-olds in a community setting.
- The Infant Toddler Checklist (https://psychology-tools.com/test/infant-toddler-checklist) has moderate overall psychometrics with sensitivity ranging from 0.55 to 0.77; specificity from 0.42 to 0.85; PPV from 0.20 to 0.55; and NPV from 0.83 to 0.94. However, the data were based on a sample including both community-dwelling toddlers and those with a family history of autism.
- The Brief Infant-Toddler Social and Emotional Assessment (https://eprovide.mapi-trust.org/instruments/brief-infant-toddler-social-emotional-assessment/) – the screen’s four autism-specific scales had high specificity (84%-90%) but low sensitivity (40%-52%).
- Canvas Dx (https://canvasdx.com/) from the Cognoa company is not a parent-report measure but rather a three-part evaluation including an app-based parent questionnaire, parent uploads of home videos analyzed by a specialist, and a 13- to 15-item primary care physician observational checklist. There were 56 diagnosed of the 426 children in the 18- to 24-month-old range from a sample of children presenting with parent or clinician concerns rather than from a community sample.
Dr. Howard is assistant professor of pediatrics at Johns Hopkins University, Baltimore, and creator of CHADIS (www.CHADIS.com). She had no other relevant disclosures. Dr. Howard’s contribution to this publication was as a paid expert to MDedge News. Email her at [email protected].
References
Sturner R et al. Autism screening at 18 months of age: A comparison of the Q-CHAT-10 and M-CHAT screeners. Molecular Autism. Jan 3;13(1):2.
Barbaro J et al. Diagnostic accuracy of the Social Attention and Communication Surveillance–Revised with preschool tool for early autism detection in very young children. JAMA Netw Open. 2022;5(3):e2146415.
A 17-year-old male was referred by his pediatrician for evaluation of a year-long rash
A biopsy of the edge of one of lesions on the torso was performed. Histopathology demonstrated hyperkeratosis of the stratum corneum with focal thickening of the granular cell layer, basal layer degeneration of the epidermis, and a band-like subepidermal lymphocytic infiltrate with Civatte bodies consistent with lichen planus. There was some reduction in the elastic fibers on the papillary dermis.

Given the morphology of the lesions and the histopathologic presentation, he was diagnosed with annular atrophic lichen planus (AALP). Lichen planus is a chronic inflammatory condition that can affect the skin, nails, hair, and mucosa. Lichen planus is seen in less than 1% of the population, occurring mainly in middle-aged adults and rarely seen in children. Though, there appears to be no clear racial predilection, a small study in the United States showed a higher incidence of lichen planus in Black children. Lesions with classic characteristics are pruritic, polygonal, violaceous, flat-topped papules and plaques.
There are different subtypes of lichen planus, which include papular or classic form, hypertrophic, vesiculobullous, actinic, annular, atrophic, annular atrophic, linear, follicular, lichen planus pigmentosus, lichen pigmentosa pigmentosus-inversus, lichen planus–lupus erythematosus overlap syndrome, and lichen planus pemphigoides. The annular atrophic form is the least common of all, and there are few reports in the pediatric population. AALP presents as annular papules and plaques with atrophic centers that resolve within a few months leaving postinflammatory hypo- or hyperpigmentation and, in some patients, permanent atrophic scarring.
In histopathology, the lesions show the classic characteristics of lichen planus including vacuolar interface changes and necrotic keratinocytes, hypergranulosis, band-like infiltrate in the dermis, melanin incontinence, and Civatte bodies. In AALP, the center of the lesion shows an atrophic epidermis, and there is also a characteristic partial reduction to complete destruction of elastic fibers in the papillary dermis in the center of the lesion and sometimes in the periphery as well, which helps differentiate AALP from other forms of lichen planus.
The differential diagnosis for AALP includes tinea corporis, which can present with annular lesions, but they are usually scaly and rarely resolve on their own. Pityriasis rosea lesions can also look very similar to AALP lesions, but the difference is the presence of an inner collaret of scale and a lack of atrophy in pityriasis rosea. Pityriasis rosea is a rash that can be triggered by viral infections, medications, and vaccines and self-resolves within 10-12 weeks. Secondary syphilis can also be annular and resemble lesions of AALP. Syphilis patients are usually sexually active and may have lesions present on the palms and soles, which were not seen in our patient.
Granuloma annulare should also be included in the differential diagnosis of AALP. Granuloma annulare lesions present as annular papules or plaques with raised borders and a slightly hyperpigmented center that may appear more depressed compared to the edges of the lesion, though not atrophic as seen in AALP. Pityriasis lichenoides chronica is an inflammatory condition of the skin in which patients present with erythematous to brown papules in different stages which may have a mica-like scale, usually not seen on AALP. Sometimes a skin biopsy will be needed to differentiate between these conditions.
It is very important to make a timely diagnosis of AALP and treat the lesions early as it may leave long-lasting dyspigmentation and scarring. Though AAPL lesions can be resistant to treatment with topical medications, there are reports of improvement with superpotent topical corticosteroids and calcineurin inhibitors. In recalcitrant cases, systemic therapy with isotretinoin, acitretin, methotrexate, systemic corticosteroids, dapsone, and hydroxychloroquine can be considered. Our patient was treated with clobetasol propionate ointment 0.05% with good response.
Dr. Matiz is a pediatric dermatologist at Southern California Permanente Medical Group, San Diego.
References
Bowers S and Warshaw EM. J Am Acad Dermatol. 2006 Oct;55(4):557-72; quiz 573-6.
Gorouhi F et al. Scientific World Journal. 2014 Jan 30;2014:742826.
Santhosh P and George M. Int J Dermatol. 2022.61:1213-7.
Sears S et al. Pediatr Dermatol. 2021;38:1283-7.
Weston G and Payette M. Int J Womens Dermatol. 2015 Sep 16;1(3):140-9.
A biopsy of the edge of one of lesions on the torso was performed. Histopathology demonstrated hyperkeratosis of the stratum corneum with focal thickening of the granular cell layer, basal layer degeneration of the epidermis, and a band-like subepidermal lymphocytic infiltrate with Civatte bodies consistent with lichen planus. There was some reduction in the elastic fibers on the papillary dermis.
Given the morphology of the lesions and the histopathologic presentation, he was diagnosed with annular atrophic lichen planus (AALP). Lichen planus is a chronic inflammatory condition that can affect the skin, nails, hair, and mucosa. Lichen planus is seen in less than 1% of the population, occurring mainly in middle-aged adults and rarely seen in children. Though, there appears to be no clear racial predilection, a small study in the United States showed a higher incidence of lichen planus in Black children. Lesions with classic characteristics are pruritic, polygonal, violaceous, flat-topped papules and plaques.
There are different subtypes of lichen planus, which include papular or classic form, hypertrophic, vesiculobullous, actinic, annular, atrophic, annular atrophic, linear, follicular, lichen planus pigmentosus, lichen pigmentosa pigmentosus-inversus, lichen planus–lupus erythematosus overlap syndrome, and lichen planus pemphigoides. The annular atrophic form is the least common of all, and there are few reports in the pediatric population. AALP presents as annular papules and plaques with atrophic centers that resolve within a few months leaving postinflammatory hypo- or hyperpigmentation and, in some patients, permanent atrophic scarring.
In histopathology, the lesions show the classic characteristics of lichen planus including vacuolar interface changes and necrotic keratinocytes, hypergranulosis, band-like infiltrate in the dermis, melanin incontinence, and Civatte bodies. In AALP, the center of the lesion shows an atrophic epidermis, and there is also a characteristic partial reduction to complete destruction of elastic fibers in the papillary dermis in the center of the lesion and sometimes in the periphery as well, which helps differentiate AALP from other forms of lichen planus.
The differential diagnosis for AALP includes tinea corporis, which can present with annular lesions, but they are usually scaly and rarely resolve on their own. Pityriasis rosea lesions can also look very similar to AALP lesions, but the difference is the presence of an inner collaret of scale and a lack of atrophy in pityriasis rosea. Pityriasis rosea is a rash that can be triggered by viral infections, medications, and vaccines and self-resolves within 10-12 weeks. Secondary syphilis can also be annular and resemble lesions of AALP. Syphilis patients are usually sexually active and may have lesions present on the palms and soles, which were not seen in our patient.
Granuloma annulare should also be included in the differential diagnosis of AALP. Granuloma annulare lesions present as annular papules or plaques with raised borders and a slightly hyperpigmented center that may appear more depressed compared to the edges of the lesion, though not atrophic as seen in AALP. Pityriasis lichenoides chronica is an inflammatory condition of the skin in which patients present with erythematous to brown papules in different stages which may have a mica-like scale, usually not seen on AALP. Sometimes a skin biopsy will be needed to differentiate between these conditions.
It is very important to make a timely diagnosis of AALP and treat the lesions early as it may leave long-lasting dyspigmentation and scarring. Though AAPL lesions can be resistant to treatment with topical medications, there are reports of improvement with superpotent topical corticosteroids and calcineurin inhibitors. In recalcitrant cases, systemic therapy with isotretinoin, acitretin, methotrexate, systemic corticosteroids, dapsone, and hydroxychloroquine can be considered. Our patient was treated with clobetasol propionate ointment 0.05% with good response.
Dr. Matiz is a pediatric dermatologist at Southern California Permanente Medical Group, San Diego.
References
Bowers S and Warshaw EM. J Am Acad Dermatol. 2006 Oct;55(4):557-72; quiz 573-6.
Gorouhi F et al. Scientific World Journal. 2014 Jan 30;2014:742826.
Santhosh P and George M. Int J Dermatol. 2022.61:1213-7.
Sears S et al. Pediatr Dermatol. 2021;38:1283-7.
Weston G and Payette M. Int J Womens Dermatol. 2015 Sep 16;1(3):140-9.
A 17-year-old healthy male was referred by his pediatrician for evaluation of a rash on the skin which has been present on and off for a year. During the initial presentation, the lesions were clustered on the back, were slightly itchy, and resolved after 3 months. Several new lesions have developed on the neck, torso, and extremities, leaving hypopigmented marks on the skin. He has previously been treated with topical antifungal creams, oral fluconazole, and triamcinolone ointment without resolution of the lesions.
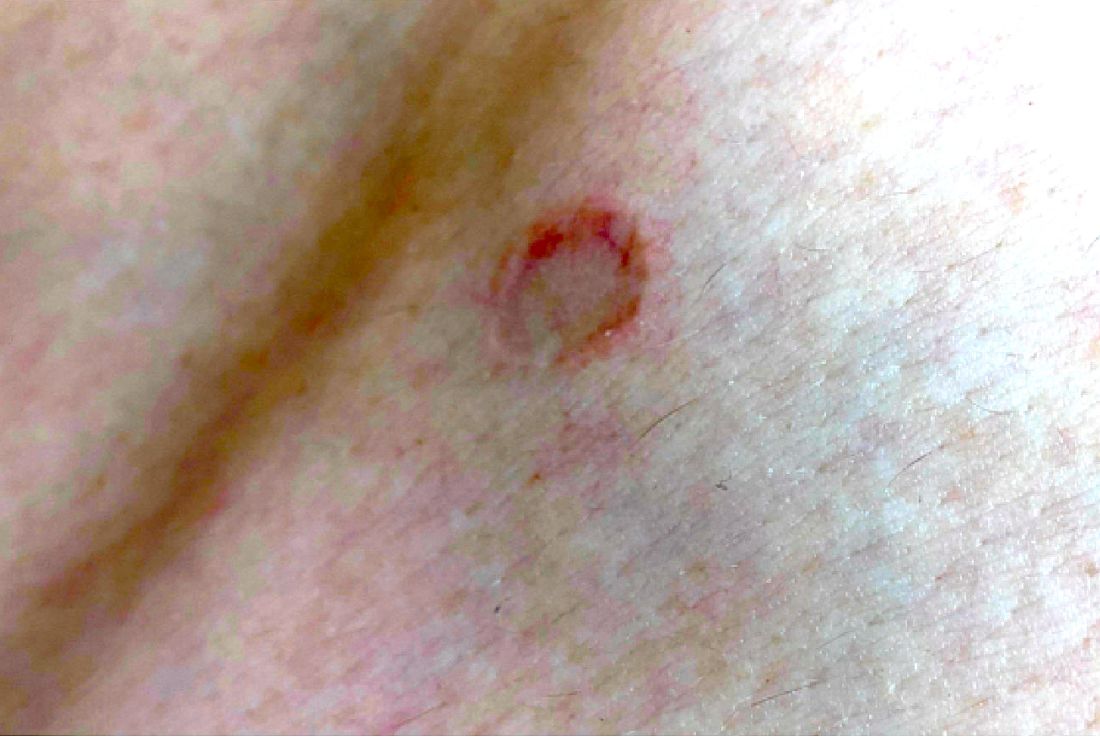
He is not involved in any contact sports, he has not traveled outside the country, and is not taking any other medications. He is not sexually active. He also has a diagnosis of mild acne that he is currently treating with over-the-counter medications.
On physical exam he had several annular plaques with central atrophic centers and no scale. He also had some hypo- and hyperpigmented macules at the sites of prior skin lesions