User login
Continuous remote patient monitoring
The SARS-CoV-2 pandemic required health care systems around the world to rapidly innovate and adapt to unprecedented operational and clinical strain. Many health care systems leveraged virtual care capabilities as an innovative approach to safely and efficiently manage patients while reducing staff exposure and medical resource constraints (Healthcare [Basel]. 2020 Nov;8[4]:517; JMIR Form Res. 2021 Jan; 5[1]:e23190). With Medicare insurance claims data demonstrating a 30% reduction of in-person health visits, telemedicine has become an essential means to fill the gaps in providing essential medical services (JAMA Intern Med. 2021 Mar;181[3]:388-91). A vast majority of virtual health care visits come via telephonic encounters, which have inherent limitations in the ability to monitor patients with complex or critical medical conditions (Front Public Health. 2020;8:410; N Engl J Med. 2020 Apr;382[18]:1679-81). Remote patient monitoring (RPM) has been established in multiple clinical models as an effective adjunct in telemedicine encounters in order to ensure treatment regimen adherence, make real-time treatment adjustments, and identify patients at risk for early decompensation.
Long-term RPM data has demonstrated cost reduction, reduced burden of in-office visits, expedited management of significant clinical events, and decreased all-cause mortality rates. Previously RPM was limited to the care of patients with chronic conditions, particularly cardiac patients with congestive heart failure and invasive devices, such as pacemakers or implantable cardioverter–defibrillators (JMIR Form Res. 2021 Jan;5[1]:e23190; Front Public Health. 2020; 8:410). In response to the pandemic, the Centers for Medicare and Medicaid Services (CMS) added RPM billing codes in 2019 and then included coverage of acute conditions in 2020 that permitted a more extensive role of RPM in telemedicine. This change in financial reimbursement led to a more aggressive expansion of RPM devices to assess physiologic parameters, such as weight, blood pressure, oxygen saturation, and blood glucose levels for clinicians to review.

Currently, RPM devices fall within a low-risk FDA category that do not require clinical trials for validation prior to being cleared for CMS billing in a fee-for-service reimbursement model (N Engl J Med. 2021 Apr;384[15]:1384-6). A shortage of evidence-based publications to guide clinicians in this new landscape creates challenges from underuse, misuse, or abuse of RPM tools. In order to maximize the clinical benefits of RPM, standardized processes and device specifications derived from up-to-date research need to be established in professional society guidelines.

Formalized RPM protocols should play a key role in overcoming the hesitancy of health institutions becoming early adopters of RPM technologies. Some significant challenges leading to reluctance of executing an RPM program were recently highlighted at the REPROGRAM international consortium of telemedicine. These concerns involved building a technological infrastructure, training clinical staff, ensuring remote connectivity with broadband Internet, and working with patients of various technologic literacy (Front Public Health. 2020;8:410). We attempted to address these challenges by using a COVID-19 remote patient monitoring (CRPM) strategy within our Military Health System (MHS). By using the well-established responsible, accountable, consulted, and informed (RACI) matrix process mapping tool, we created a standardized enrollment process of high-risk patients across eight military treatment facilities (MTFs). High risk patients included those with COVID-19 pneumonia and persistent hypoxemia, those recovering from acute exacerbations of congestive heart failure, those with cardiopulmonary instability associated with malignancy, and other conditions that required continuous monitoring outside of the hospital setting.

In our CRPM process, the hospital inpatient unit or ED refer high-risk patients to a primary designated provider at each MTF for enrollment prior to discharge. Enrolled patients are equipped with an FDA-approved home monitoring kit that contains an electronic tablet, a network hub that operates independently of and/or in conjunction with Wi-Fi, and an armband containing a coin-sized monitor. The system has the capability to pair with additional smart-enabled accessories, such as a blood pressure cuff, temperature patch, and digital spirometer. With continuous bio-physiologic and symptom-based monitoring, a team of teleworking critical-care nurses monitor patients continuously. In case of a decompensation necessitating a higher level of care, an emergency action plan (EAP) is activated to ensure patients urgently receive emergency medical services. Once released from the CRPM program, discharged patients use prepaid shipping boxes to facilitate contactless repackaging, sanitization, and pickup for redistribution of devices to the MTF.

Given the increased number of hospital admissions noted during the COVID-19 global pandemic, the CRPM program has allowed us to address overutilization of hospital beds. Furthermore, it has allowed us to address issues of screening and resource utilization as we consider patients for safe implementation of home monitoring. While data concerning the outcome of the CRPM program are pending, we are encouraged about the ability to provide high quality care in a remote setting. To that end, we have addressed technologic difficulties, communication between remote providers and patients in the home environment, and communication between health care providers in various settings, such as the ED, inpatient wards, and the outpatient clinic.

To be sure, there are many challenges in making sure that CRPM adequately addresses the needs of patients, who may have persistent perturbations in cardiopulmonary status, tremendous anxiety about the progress or deterioration in their health status, and lack of understanding about their medical condition. Furthermore, providers face the challenge of making clinical decisions sometimes without the advantage of in-person examinations. Sometimes decisions must be made with incomplete information or when the status of the patient does not follow presupposed algorithms. Nevertheless, like many issues during the COVID-19 pandemic, patients and providers have evolved, pivoted, and made necessary adjustments to address an unprecedented time in recent history.
Ultimately, we believe that a continuous remote patient monitoring program can be designed, implemented, and maintained across a multifacility health care system for safe, effective, and efficient health care delivery. Limitations in implementing such a program might include lack of adequate Internet services, lack of telephonic communication, inadequate home facilities, lack of adequate home support, and, perhaps, lack of available emergency services. However, if the conditions for home monitoring are optimized, CRPM holds the promise of reducing the burden on emergency and inpatient hospital services, particularly when those services are strained in circumstances such as the ongoing global pandemic due to COVID-19. With further study, standardization, and evolution, remote monitoring will likely become a more acceptable and necessary form of health care delivery in the future.
Dr. Salomon is an Internal Medicine Resident (PGY-2); Dr. Muller is an Internal Medicine Resident (PGY-2); Dr. Boster is a Pulmonary and Critical Care Fellow; Dr. Loudermilk is a Pulmonary and Critical Care Fellow; and Dr. Kemp is Pulmonary and Critical Care staff, San Antonio Military Medical Center, Fort Sam Houston, Texas.
The SARS-CoV-2 pandemic required health care systems around the world to rapidly innovate and adapt to unprecedented operational and clinical strain. Many health care systems leveraged virtual care capabilities as an innovative approach to safely and efficiently manage patients while reducing staff exposure and medical resource constraints (Healthcare [Basel]. 2020 Nov;8[4]:517; JMIR Form Res. 2021 Jan; 5[1]:e23190). With Medicare insurance claims data demonstrating a 30% reduction of in-person health visits, telemedicine has become an essential means to fill the gaps in providing essential medical services (JAMA Intern Med. 2021 Mar;181[3]:388-91). A vast majority of virtual health care visits come via telephonic encounters, which have inherent limitations in the ability to monitor patients with complex or critical medical conditions (Front Public Health. 2020;8:410; N Engl J Med. 2020 Apr;382[18]:1679-81). Remote patient monitoring (RPM) has been established in multiple clinical models as an effective adjunct in telemedicine encounters in order to ensure treatment regimen adherence, make real-time treatment adjustments, and identify patients at risk for early decompensation.
Long-term RPM data has demonstrated cost reduction, reduced burden of in-office visits, expedited management of significant clinical events, and decreased all-cause mortality rates. Previously RPM was limited to the care of patients with chronic conditions, particularly cardiac patients with congestive heart failure and invasive devices, such as pacemakers or implantable cardioverter–defibrillators (JMIR Form Res. 2021 Jan;5[1]:e23190; Front Public Health. 2020; 8:410). In response to the pandemic, the Centers for Medicare and Medicaid Services (CMS) added RPM billing codes in 2019 and then included coverage of acute conditions in 2020 that permitted a more extensive role of RPM in telemedicine. This change in financial reimbursement led to a more aggressive expansion of RPM devices to assess physiologic parameters, such as weight, blood pressure, oxygen saturation, and blood glucose levels for clinicians to review.
Currently, RPM devices fall within a low-risk FDA category that do not require clinical trials for validation prior to being cleared for CMS billing in a fee-for-service reimbursement model (N Engl J Med. 2021 Apr;384[15]:1384-6). A shortage of evidence-based publications to guide clinicians in this new landscape creates challenges from underuse, misuse, or abuse of RPM tools. In order to maximize the clinical benefits of RPM, standardized processes and device specifications derived from up-to-date research need to be established in professional society guidelines.
Formalized RPM protocols should play a key role in overcoming the hesitancy of health institutions becoming early adopters of RPM technologies. Some significant challenges leading to reluctance of executing an RPM program were recently highlighted at the REPROGRAM international consortium of telemedicine. These concerns involved building a technological infrastructure, training clinical staff, ensuring remote connectivity with broadband Internet, and working with patients of various technologic literacy (Front Public Health. 2020;8:410). We attempted to address these challenges by using a COVID-19 remote patient monitoring (CRPM) strategy within our Military Health System (MHS). By using the well-established responsible, accountable, consulted, and informed (RACI) matrix process mapping tool, we created a standardized enrollment process of high-risk patients across eight military treatment facilities (MTFs). High risk patients included those with COVID-19 pneumonia and persistent hypoxemia, those recovering from acute exacerbations of congestive heart failure, those with cardiopulmonary instability associated with malignancy, and other conditions that required continuous monitoring outside of the hospital setting.
In our CRPM process, the hospital inpatient unit or ED refer high-risk patients to a primary designated provider at each MTF for enrollment prior to discharge. Enrolled patients are equipped with an FDA-approved home monitoring kit that contains an electronic tablet, a network hub that operates independently of and/or in conjunction with Wi-Fi, and an armband containing a coin-sized monitor. The system has the capability to pair with additional smart-enabled accessories, such as a blood pressure cuff, temperature patch, and digital spirometer. With continuous bio-physiologic and symptom-based monitoring, a team of teleworking critical-care nurses monitor patients continuously. In case of a decompensation necessitating a higher level of care, an emergency action plan (EAP) is activated to ensure patients urgently receive emergency medical services. Once released from the CRPM program, discharged patients use prepaid shipping boxes to facilitate contactless repackaging, sanitization, and pickup for redistribution of devices to the MTF.
Given the increased number of hospital admissions noted during the COVID-19 global pandemic, the CRPM program has allowed us to address overutilization of hospital beds. Furthermore, it has allowed us to address issues of screening and resource utilization as we consider patients for safe implementation of home monitoring. While data concerning the outcome of the CRPM program are pending, we are encouraged about the ability to provide high quality care in a remote setting. To that end, we have addressed technologic difficulties, communication between remote providers and patients in the home environment, and communication between health care providers in various settings, such as the ED, inpatient wards, and the outpatient clinic.
To be sure, there are many challenges in making sure that CRPM adequately addresses the needs of patients, who may have persistent perturbations in cardiopulmonary status, tremendous anxiety about the progress or deterioration in their health status, and lack of understanding about their medical condition. Furthermore, providers face the challenge of making clinical decisions sometimes without the advantage of in-person examinations. Sometimes decisions must be made with incomplete information or when the status of the patient does not follow presupposed algorithms. Nevertheless, like many issues during the COVID-19 pandemic, patients and providers have evolved, pivoted, and made necessary adjustments to address an unprecedented time in recent history.
Ultimately, we believe that a continuous remote patient monitoring program can be designed, implemented, and maintained across a multifacility health care system for safe, effective, and efficient health care delivery. Limitations in implementing such a program might include lack of adequate Internet services, lack of telephonic communication, inadequate home facilities, lack of adequate home support, and, perhaps, lack of available emergency services. However, if the conditions for home monitoring are optimized, CRPM holds the promise of reducing the burden on emergency and inpatient hospital services, particularly when those services are strained in circumstances such as the ongoing global pandemic due to COVID-19. With further study, standardization, and evolution, remote monitoring will likely become a more acceptable and necessary form of health care delivery in the future.
Dr. Salomon is an Internal Medicine Resident (PGY-2); Dr. Muller is an Internal Medicine Resident (PGY-2); Dr. Boster is a Pulmonary and Critical Care Fellow; Dr. Loudermilk is a Pulmonary and Critical Care Fellow; and Dr. Kemp is Pulmonary and Critical Care staff, San Antonio Military Medical Center, Fort Sam Houston, Texas.
The SARS-CoV-2 pandemic required health care systems around the world to rapidly innovate and adapt to unprecedented operational and clinical strain. Many health care systems leveraged virtual care capabilities as an innovative approach to safely and efficiently manage patients while reducing staff exposure and medical resource constraints (Healthcare [Basel]. 2020 Nov;8[4]:517; JMIR Form Res. 2021 Jan; 5[1]:e23190). With Medicare insurance claims data demonstrating a 30% reduction of in-person health visits, telemedicine has become an essential means to fill the gaps in providing essential medical services (JAMA Intern Med. 2021 Mar;181[3]:388-91). A vast majority of virtual health care visits come via telephonic encounters, which have inherent limitations in the ability to monitor patients with complex or critical medical conditions (Front Public Health. 2020;8:410; N Engl J Med. 2020 Apr;382[18]:1679-81). Remote patient monitoring (RPM) has been established in multiple clinical models as an effective adjunct in telemedicine encounters in order to ensure treatment regimen adherence, make real-time treatment adjustments, and identify patients at risk for early decompensation.
Long-term RPM data has demonstrated cost reduction, reduced burden of in-office visits, expedited management of significant clinical events, and decreased all-cause mortality rates. Previously RPM was limited to the care of patients with chronic conditions, particularly cardiac patients with congestive heart failure and invasive devices, such as pacemakers or implantable cardioverter–defibrillators (JMIR Form Res. 2021 Jan;5[1]:e23190; Front Public Health. 2020; 8:410). In response to the pandemic, the Centers for Medicare and Medicaid Services (CMS) added RPM billing codes in 2019 and then included coverage of acute conditions in 2020 that permitted a more extensive role of RPM in telemedicine. This change in financial reimbursement led to a more aggressive expansion of RPM devices to assess physiologic parameters, such as weight, blood pressure, oxygen saturation, and blood glucose levels for clinicians to review.
Currently, RPM devices fall within a low-risk FDA category that do not require clinical trials for validation prior to being cleared for CMS billing in a fee-for-service reimbursement model (N Engl J Med. 2021 Apr;384[15]:1384-6). A shortage of evidence-based publications to guide clinicians in this new landscape creates challenges from underuse, misuse, or abuse of RPM tools. In order to maximize the clinical benefits of RPM, standardized processes and device specifications derived from up-to-date research need to be established in professional society guidelines.
Formalized RPM protocols should play a key role in overcoming the hesitancy of health institutions becoming early adopters of RPM technologies. Some significant challenges leading to reluctance of executing an RPM program were recently highlighted at the REPROGRAM international consortium of telemedicine. These concerns involved building a technological infrastructure, training clinical staff, ensuring remote connectivity with broadband Internet, and working with patients of various technologic literacy (Front Public Health. 2020;8:410). We attempted to address these challenges by using a COVID-19 remote patient monitoring (CRPM) strategy within our Military Health System (MHS). By using the well-established responsible, accountable, consulted, and informed (RACI) matrix process mapping tool, we created a standardized enrollment process of high-risk patients across eight military treatment facilities (MTFs). High risk patients included those with COVID-19 pneumonia and persistent hypoxemia, those recovering from acute exacerbations of congestive heart failure, those with cardiopulmonary instability associated with malignancy, and other conditions that required continuous monitoring outside of the hospital setting.
In our CRPM process, the hospital inpatient unit or ED refer high-risk patients to a primary designated provider at each MTF for enrollment prior to discharge. Enrolled patients are equipped with an FDA-approved home monitoring kit that contains an electronic tablet, a network hub that operates independently of and/or in conjunction with Wi-Fi, and an armband containing a coin-sized monitor. The system has the capability to pair with additional smart-enabled accessories, such as a blood pressure cuff, temperature patch, and digital spirometer. With continuous bio-physiologic and symptom-based monitoring, a team of teleworking critical-care nurses monitor patients continuously. In case of a decompensation necessitating a higher level of care, an emergency action plan (EAP) is activated to ensure patients urgently receive emergency medical services. Once released from the CRPM program, discharged patients use prepaid shipping boxes to facilitate contactless repackaging, sanitization, and pickup for redistribution of devices to the MTF.
Given the increased number of hospital admissions noted during the COVID-19 global pandemic, the CRPM program has allowed us to address overutilization of hospital beds. Furthermore, it has allowed us to address issues of screening and resource utilization as we consider patients for safe implementation of home monitoring. While data concerning the outcome of the CRPM program are pending, we are encouraged about the ability to provide high quality care in a remote setting. To that end, we have addressed technologic difficulties, communication between remote providers and patients in the home environment, and communication between health care providers in various settings, such as the ED, inpatient wards, and the outpatient clinic.
To be sure, there are many challenges in making sure that CRPM adequately addresses the needs of patients, who may have persistent perturbations in cardiopulmonary status, tremendous anxiety about the progress or deterioration in their health status, and lack of understanding about their medical condition. Furthermore, providers face the challenge of making clinical decisions sometimes without the advantage of in-person examinations. Sometimes decisions must be made with incomplete information or when the status of the patient does not follow presupposed algorithms. Nevertheless, like many issues during the COVID-19 pandemic, patients and providers have evolved, pivoted, and made necessary adjustments to address an unprecedented time in recent history.
Ultimately, we believe that a continuous remote patient monitoring program can be designed, implemented, and maintained across a multifacility health care system for safe, effective, and efficient health care delivery. Limitations in implementing such a program might include lack of adequate Internet services, lack of telephonic communication, inadequate home facilities, lack of adequate home support, and, perhaps, lack of available emergency services. However, if the conditions for home monitoring are optimized, CRPM holds the promise of reducing the burden on emergency and inpatient hospital services, particularly when those services are strained in circumstances such as the ongoing global pandemic due to COVID-19. With further study, standardization, and evolution, remote monitoring will likely become a more acceptable and necessary form of health care delivery in the future.
Dr. Salomon is an Internal Medicine Resident (PGY-2); Dr. Muller is an Internal Medicine Resident (PGY-2); Dr. Boster is a Pulmonary and Critical Care Fellow; Dr. Loudermilk is a Pulmonary and Critical Care Fellow; and Dr. Kemp is Pulmonary and Critical Care staff, San Antonio Military Medical Center, Fort Sam Houston, Texas.
Denosumab boosts bone strength in glucocorticoid users
Bone strength and microarchitecture remained stronger at 24 months after treatment with denosumab compared to risedronate, in a study of 110 adults using glucocorticoids.
Patients using glucocorticoids are at increased risk for vertebral and nonvertebral fractures at both the start of treatment or as treatment continues, wrote Piet Geusens, MD, of Maastricht University, the Netherlands, and colleagues.

Imaging data collected via high-resolution peripheral quantitative computed tomography (HR-pQCT) allow for the assessment of bone microarchitecture and strength, but specific data comparing the impact of bone treatment in patients using glucocorticoids are lacking, they said.
In a study published in the Journal of Bone and Mineral Research, the researchers identified a subset of 56 patients randomized to denosumab and 54 to risedronate patients out of a total of 590 patients who were enrolled in a phase 3 randomized, controlled trial of denosumab vs. risedronate for bone mineral density. The main results of the larger trial – presented at EULAR 2018 – showed greater increases in bone strength with denosumab over risedronate in patients receiving glucocorticoids.
In the current study, the researchers reviewed HR-pQCT scans of the distal radius and tibia at baseline, 12 months, and 24 months. Bone strength and microarchitecture were defined in terms of failure load (FL) as a primary outcome. Patients also were divided into subpopulations of those initiating glucocorticoid treatment (GC-I) and continuing treatment (GC-C).
Baseline characteristics were mainly balanced among the treatment groups within the GC-I and GC-C categories.
Among the GC-I patients, in the denosumab group, FL increased significantly from baseline to 12 months at the radius at tibia (1.8% and 1.7%, respectively) but did not change significantly in the risedronate group, which translated to a significant treatment difference between the drugs of 3.3% for radius and 2.5% for tibia.
At 24 months, the radius measure of FL was unchanged from baseline in denosumab patients but significantly decreased in risedronate patients, with a difference of –4.1%, which translated to a significant between-treatment difference at the radius of 5.6% (P < .001). Changes at the tibia were not significantly different between the groups at 24 months.
Among the GC-C patients, FL was unchanged from baseline to 12 months for both the denosumab and risedronate groups. However, FL significantly increased with denosumab (4.3%) and remained unchanged in the risedronate group.
The researchers also found significant differences between denosumab and risedronate in percentage changes in cortical bone mineral density, and less prominent changes and differences in trabecular bone mineral density.
The study findings were limited by several factors including the use of the HR-pQCT scanner, which limits the measurement of trabecular microarchitecture, and the use of only standard HR-pQCT parameters, which do not allow insight into endosteal changes, and the inability to correct for multiplicity of data, the researchers noted.
However, the results support the superiority of denosumab over risedronate for preventing FL and total bone mineral density loss at the radius and tibia in new glucocorticoid users, and for increasing FL and total bone mineral density at the radius in long-term glucocorticoid users, they said.
Denosumab therefore could be a useful therapeutic option and could inform decision-making in patients initiating GC-therapy or on long-term GC-therapy, they concluded.
The study was supported by Amgen. Dr. Geusens disclosed grants from Amgen, Celgene, Lilly, Merck, Pfizer, Roche, UCB, Fresenius, Mylan, and Sandoz, and grants and other funding from AbbVie, outside the current study.
Bone strength and microarchitecture remained stronger at 24 months after treatment with denosumab compared to risedronate, in a study of 110 adults using glucocorticoids.
Patients using glucocorticoids are at increased risk for vertebral and nonvertebral fractures at both the start of treatment or as treatment continues, wrote Piet Geusens, MD, of Maastricht University, the Netherlands, and colleagues.
Imaging data collected via high-resolution peripheral quantitative computed tomography (HR-pQCT) allow for the assessment of bone microarchitecture and strength, but specific data comparing the impact of bone treatment in patients using glucocorticoids are lacking, they said.
In a study published in the Journal of Bone and Mineral Research, the researchers identified a subset of 56 patients randomized to denosumab and 54 to risedronate patients out of a total of 590 patients who were enrolled in a phase 3 randomized, controlled trial of denosumab vs. risedronate for bone mineral density. The main results of the larger trial – presented at EULAR 2018 – showed greater increases in bone strength with denosumab over risedronate in patients receiving glucocorticoids.
In the current study, the researchers reviewed HR-pQCT scans of the distal radius and tibia at baseline, 12 months, and 24 months. Bone strength and microarchitecture were defined in terms of failure load (FL) as a primary outcome. Patients also were divided into subpopulations of those initiating glucocorticoid treatment (GC-I) and continuing treatment (GC-C).
Baseline characteristics were mainly balanced among the treatment groups within the GC-I and GC-C categories.
Among the GC-I patients, in the denosumab group, FL increased significantly from baseline to 12 months at the radius at tibia (1.8% and 1.7%, respectively) but did not change significantly in the risedronate group, which translated to a significant treatment difference between the drugs of 3.3% for radius and 2.5% for tibia.
At 24 months, the radius measure of FL was unchanged from baseline in denosumab patients but significantly decreased in risedronate patients, with a difference of –4.1%, which translated to a significant between-treatment difference at the radius of 5.6% (P < .001). Changes at the tibia were not significantly different between the groups at 24 months.
Among the GC-C patients, FL was unchanged from baseline to 12 months for both the denosumab and risedronate groups. However, FL significantly increased with denosumab (4.3%) and remained unchanged in the risedronate group.
The researchers also found significant differences between denosumab and risedronate in percentage changes in cortical bone mineral density, and less prominent changes and differences in trabecular bone mineral density.
The study findings were limited by several factors including the use of the HR-pQCT scanner, which limits the measurement of trabecular microarchitecture, and the use of only standard HR-pQCT parameters, which do not allow insight into endosteal changes, and the inability to correct for multiplicity of data, the researchers noted.
However, the results support the superiority of denosumab over risedronate for preventing FL and total bone mineral density loss at the radius and tibia in new glucocorticoid users, and for increasing FL and total bone mineral density at the radius in long-term glucocorticoid users, they said.
Denosumab therefore could be a useful therapeutic option and could inform decision-making in patients initiating GC-therapy or on long-term GC-therapy, they concluded.
The study was supported by Amgen. Dr. Geusens disclosed grants from Amgen, Celgene, Lilly, Merck, Pfizer, Roche, UCB, Fresenius, Mylan, and Sandoz, and grants and other funding from AbbVie, outside the current study.
Bone strength and microarchitecture remained stronger at 24 months after treatment with denosumab compared to risedronate, in a study of 110 adults using glucocorticoids.
Patients using glucocorticoids are at increased risk for vertebral and nonvertebral fractures at both the start of treatment or as treatment continues, wrote Piet Geusens, MD, of Maastricht University, the Netherlands, and colleagues.
Imaging data collected via high-resolution peripheral quantitative computed tomography (HR-pQCT) allow for the assessment of bone microarchitecture and strength, but specific data comparing the impact of bone treatment in patients using glucocorticoids are lacking, they said.
In a study published in the Journal of Bone and Mineral Research, the researchers identified a subset of 56 patients randomized to denosumab and 54 to risedronate patients out of a total of 590 patients who were enrolled in a phase 3 randomized, controlled trial of denosumab vs. risedronate for bone mineral density. The main results of the larger trial – presented at EULAR 2018 – showed greater increases in bone strength with denosumab over risedronate in patients receiving glucocorticoids.
In the current study, the researchers reviewed HR-pQCT scans of the distal radius and tibia at baseline, 12 months, and 24 months. Bone strength and microarchitecture were defined in terms of failure load (FL) as a primary outcome. Patients also were divided into subpopulations of those initiating glucocorticoid treatment (GC-I) and continuing treatment (GC-C).
Baseline characteristics were mainly balanced among the treatment groups within the GC-I and GC-C categories.
Among the GC-I patients, in the denosumab group, FL increased significantly from baseline to 12 months at the radius at tibia (1.8% and 1.7%, respectively) but did not change significantly in the risedronate group, which translated to a significant treatment difference between the drugs of 3.3% for radius and 2.5% for tibia.
At 24 months, the radius measure of FL was unchanged from baseline in denosumab patients but significantly decreased in risedronate patients, with a difference of –4.1%, which translated to a significant between-treatment difference at the radius of 5.6% (P < .001). Changes at the tibia were not significantly different between the groups at 24 months.
Among the GC-C patients, FL was unchanged from baseline to 12 months for both the denosumab and risedronate groups. However, FL significantly increased with denosumab (4.3%) and remained unchanged in the risedronate group.
The researchers also found significant differences between denosumab and risedronate in percentage changes in cortical bone mineral density, and less prominent changes and differences in trabecular bone mineral density.
The study findings were limited by several factors including the use of the HR-pQCT scanner, which limits the measurement of trabecular microarchitecture, and the use of only standard HR-pQCT parameters, which do not allow insight into endosteal changes, and the inability to correct for multiplicity of data, the researchers noted.
However, the results support the superiority of denosumab over risedronate for preventing FL and total bone mineral density loss at the radius and tibia in new glucocorticoid users, and for increasing FL and total bone mineral density at the radius in long-term glucocorticoid users, they said.
Denosumab therefore could be a useful therapeutic option and could inform decision-making in patients initiating GC-therapy or on long-term GC-therapy, they concluded.
The study was supported by Amgen. Dr. Geusens disclosed grants from Amgen, Celgene, Lilly, Merck, Pfizer, Roche, UCB, Fresenius, Mylan, and Sandoz, and grants and other funding from AbbVie, outside the current study.
FROM THE JOURNAL OF BONE AND MINERAL RESEARCH
Surgeons in China ‘are the executioners,’ procuring organs before brain death
In a deep dive into obscure Chinese language transplant journals, a pair of researchers from Australia and Israel have added a new layer of horror to what’s already known about forced organ harvesting in China.
Searching for documentation that vital organs are being harvested from nonconsenting executed prisoners, a practice that the China Tribunal confirmed “beyond any reasonable doubt” in 2020, Jacob Lavee, MD, an Israeli heart transplant surgeon, and Matthew Roberston, a PhD student at Australian National University, uncovered something even more shocking: that vital organs are being explanted from patients who are still alive.
“We have shown for the first time that the transplant surgeons are the executioners – that the mode of execution is organ procurement. These are self-admissions of executing the patient,” Dr. Lavee told this news organization. “Up until now, there has been what we call circumstantial evidence of this, but our paper is what you’d call the smoking gun, because it’s in the words of the physicians themselves that they are doing it. In the words of these surgeons, intubation was done only after the beginning of surgery, which means the patients were breathing spontaneously up until the moment the operation started ... meaning they were not brain dead.”
The research, published in the American Journal of Transplantation, involved intricate analysis of thousands of Chinese language transplant articles and identified 71 articles in which transplant surgeons describe starting organ procurement surgery before declaring their patients brain dead.
“What we found were improper, illegitimate, nonexistent, or false declarations of brain death,” Mr. Robertson said in an interview. He explained that this violates what’s known as the dead donor rule, which is fundamental in transplant ethics. “The surgeons wrote that the donor was brain dead, but according to everything we know about medical science, they could not possibly have been brain dead because there was no apnea test performed. Brain death is not just something you say, there’s this whole battery of tests, and the key is the apnea test, [in which] the patient is already intubated and ventilated, they turn the machine off, and they’re looking for carbon dioxide in the blood above a certain level.”
Mr. Robertson and Dr. Lavee have painstakingly documented “incriminating sentences” in each of the 71 articles proving that brain death had not occurred before the organ explantation procedure began. “There were two criteria by which we claimed a problematic brain death declaration,” said Mr. Robertson, who translated the Chinese. “One was where the patient was not ventilated and was only intubated after they were declared brain dead; the other was that the intubation took place immediately prior to the surgery beginning.”
“It was mind-boggling,” said Dr. Lavee, from Tel Aviv University. “When I first started reading, my initial reaction is, ‘This can’t be.’ I read it once, and again, and I insisted that Matt get another independent translation of the Chinese just to be sure. I told him, ‘There’s no way a physician, a surgeon could write this – it doesn’t make sense.’ But the more of these papers we read, we saw it was a pattern – and they didn’t come out of a single medical center, they are spread all over China.”
For the analysis, Mr. Robertson wrote code and customized an algorithm to examine 124,770 medical articles from official Chinese databases between 1980 and 2020. The 71 articles revealing cases involving problematic brain death came from 56 hospitals (of which 12 were military) in 33 cities across 15 provinces, they report. In total, 348 surgeons, nurses, anesthesiologists, and other medical workers or researchers were listed as authors of these publications.
Why would these medical personnel write such self-incriminating evidence? The researchers say it’s unclear. “They don’t think anyone’s reading this stuff,” Mr. Robertson suggests. “Sometimes it’s revealed in just five or six characters in a paper of eight pages.” Dr. Lavee wonders if it’s also ignorance. “If this has been a practice for 20 or 30 years in China, I guess nobody at that time was aware they were doing something wrong, although how to declare brain death is something that is known in China. They’ve published a lot about it.”
The article is “evidence that this barbarity continues and is a very valuable contribution that continues to bring attention to an enormous human rights violation,” said Arthur Caplan, PhD, head of the Division of Medical Ethics at New York University’s Grossman School of Medicine. “What they’ve reported has been going on for many, many years, the data are very clear that China’s doing many more transplants than they have cadaver organ donors,” he said, adding that the country’s well-documented and lucrative involvement in transplant tourism “means you have to have a donor ready when the would-be recipient appears; you have to have a matched organ available, and that’s hard to do waiting on a cadaver donor.”
Although the researchers found no incriminating publications after 2015, they speculate that this is likely due to growing awareness among Chinese surgeons that publishing the information would attract international condemnation. “We think these practices are continuing to go on,” said Dr. Lavee. He acknowledged that a voluntary organ donation program is slowly developing in parallel to this. He said, given China’s place as the world’s second largest transplant country behind the U.S., as well as its low rate of voluntary donation, it’s reasonable to conclude that the main source of organs remains prisoners on death row.
Dr. Caplan and the researchers have called for academic institutions and medical journals to resume their previous boycotts of Chinese transplant publications and speakers, but as long as China denies the practices, economic and political leaders will turn a blind eye. “In the past, I don’t think the question of China’s medical professional involvement in the execution of donors has been taken as seriously as it should have,” said Mr. Robertson. “I certainly hope that with the publication of this paper in the leading journal in the field, this will change.”
The study was supported by the Google Cloud Research Credits program, the Australian Government Research Training Program Scholarship, and the Victims of Communism Memorial Foundation. Mr. Robertson, Dr. Lavee, and Dr. Caplan have disclosed no relevant financial relationships.
A version of this article first appeared on Medscape.com.
In a deep dive into obscure Chinese language transplant journals, a pair of researchers from Australia and Israel have added a new layer of horror to what’s already known about forced organ harvesting in China.
Searching for documentation that vital organs are being harvested from nonconsenting executed prisoners, a practice that the China Tribunal confirmed “beyond any reasonable doubt” in 2020, Jacob Lavee, MD, an Israeli heart transplant surgeon, and Matthew Roberston, a PhD student at Australian National University, uncovered something even more shocking: that vital organs are being explanted from patients who are still alive.
“We have shown for the first time that the transplant surgeons are the executioners – that the mode of execution is organ procurement. These are self-admissions of executing the patient,” Dr. Lavee told this news organization. “Up until now, there has been what we call circumstantial evidence of this, but our paper is what you’d call the smoking gun, because it’s in the words of the physicians themselves that they are doing it. In the words of these surgeons, intubation was done only after the beginning of surgery, which means the patients were breathing spontaneously up until the moment the operation started ... meaning they were not brain dead.”
The research, published in the American Journal of Transplantation, involved intricate analysis of thousands of Chinese language transplant articles and identified 71 articles in which transplant surgeons describe starting organ procurement surgery before declaring their patients brain dead.
“What we found were improper, illegitimate, nonexistent, or false declarations of brain death,” Mr. Robertson said in an interview. He explained that this violates what’s known as the dead donor rule, which is fundamental in transplant ethics. “The surgeons wrote that the donor was brain dead, but according to everything we know about medical science, they could not possibly have been brain dead because there was no apnea test performed. Brain death is not just something you say, there’s this whole battery of tests, and the key is the apnea test, [in which] the patient is already intubated and ventilated, they turn the machine off, and they’re looking for carbon dioxide in the blood above a certain level.”
Mr. Robertson and Dr. Lavee have painstakingly documented “incriminating sentences” in each of the 71 articles proving that brain death had not occurred before the organ explantation procedure began. “There were two criteria by which we claimed a problematic brain death declaration,” said Mr. Robertson, who translated the Chinese. “One was where the patient was not ventilated and was only intubated after they were declared brain dead; the other was that the intubation took place immediately prior to the surgery beginning.”
“It was mind-boggling,” said Dr. Lavee, from Tel Aviv University. “When I first started reading, my initial reaction is, ‘This can’t be.’ I read it once, and again, and I insisted that Matt get another independent translation of the Chinese just to be sure. I told him, ‘There’s no way a physician, a surgeon could write this – it doesn’t make sense.’ But the more of these papers we read, we saw it was a pattern – and they didn’t come out of a single medical center, they are spread all over China.”
For the analysis, Mr. Robertson wrote code and customized an algorithm to examine 124,770 medical articles from official Chinese databases between 1980 and 2020. The 71 articles revealing cases involving problematic brain death came from 56 hospitals (of which 12 were military) in 33 cities across 15 provinces, they report. In total, 348 surgeons, nurses, anesthesiologists, and other medical workers or researchers were listed as authors of these publications.
Why would these medical personnel write such self-incriminating evidence? The researchers say it’s unclear. “They don’t think anyone’s reading this stuff,” Mr. Robertson suggests. “Sometimes it’s revealed in just five or six characters in a paper of eight pages.” Dr. Lavee wonders if it’s also ignorance. “If this has been a practice for 20 or 30 years in China, I guess nobody at that time was aware they were doing something wrong, although how to declare brain death is something that is known in China. They’ve published a lot about it.”
The article is “evidence that this barbarity continues and is a very valuable contribution that continues to bring attention to an enormous human rights violation,” said Arthur Caplan, PhD, head of the Division of Medical Ethics at New York University’s Grossman School of Medicine. “What they’ve reported has been going on for many, many years, the data are very clear that China’s doing many more transplants than they have cadaver organ donors,” he said, adding that the country’s well-documented and lucrative involvement in transplant tourism “means you have to have a donor ready when the would-be recipient appears; you have to have a matched organ available, and that’s hard to do waiting on a cadaver donor.”
Although the researchers found no incriminating publications after 2015, they speculate that this is likely due to growing awareness among Chinese surgeons that publishing the information would attract international condemnation. “We think these practices are continuing to go on,” said Dr. Lavee. He acknowledged that a voluntary organ donation program is slowly developing in parallel to this. He said, given China’s place as the world’s second largest transplant country behind the U.S., as well as its low rate of voluntary donation, it’s reasonable to conclude that the main source of organs remains prisoners on death row.
Dr. Caplan and the researchers have called for academic institutions and medical journals to resume their previous boycotts of Chinese transplant publications and speakers, but as long as China denies the practices, economic and political leaders will turn a blind eye. “In the past, I don’t think the question of China’s medical professional involvement in the execution of donors has been taken as seriously as it should have,” said Mr. Robertson. “I certainly hope that with the publication of this paper in the leading journal in the field, this will change.”
The study was supported by the Google Cloud Research Credits program, the Australian Government Research Training Program Scholarship, and the Victims of Communism Memorial Foundation. Mr. Robertson, Dr. Lavee, and Dr. Caplan have disclosed no relevant financial relationships.
A version of this article first appeared on Medscape.com.
In a deep dive into obscure Chinese language transplant journals, a pair of researchers from Australia and Israel have added a new layer of horror to what’s already known about forced organ harvesting in China.
Searching for documentation that vital organs are being harvested from nonconsenting executed prisoners, a practice that the China Tribunal confirmed “beyond any reasonable doubt” in 2020, Jacob Lavee, MD, an Israeli heart transplant surgeon, and Matthew Roberston, a PhD student at Australian National University, uncovered something even more shocking: that vital organs are being explanted from patients who are still alive.
“We have shown for the first time that the transplant surgeons are the executioners – that the mode of execution is organ procurement. These are self-admissions of executing the patient,” Dr. Lavee told this news organization. “Up until now, there has been what we call circumstantial evidence of this, but our paper is what you’d call the smoking gun, because it’s in the words of the physicians themselves that they are doing it. In the words of these surgeons, intubation was done only after the beginning of surgery, which means the patients were breathing spontaneously up until the moment the operation started ... meaning they were not brain dead.”
The research, published in the American Journal of Transplantation, involved intricate analysis of thousands of Chinese language transplant articles and identified 71 articles in which transplant surgeons describe starting organ procurement surgery before declaring their patients brain dead.
“What we found were improper, illegitimate, nonexistent, or false declarations of brain death,” Mr. Robertson said in an interview. He explained that this violates what’s known as the dead donor rule, which is fundamental in transplant ethics. “The surgeons wrote that the donor was brain dead, but according to everything we know about medical science, they could not possibly have been brain dead because there was no apnea test performed. Brain death is not just something you say, there’s this whole battery of tests, and the key is the apnea test, [in which] the patient is already intubated and ventilated, they turn the machine off, and they’re looking for carbon dioxide in the blood above a certain level.”
Mr. Robertson and Dr. Lavee have painstakingly documented “incriminating sentences” in each of the 71 articles proving that brain death had not occurred before the organ explantation procedure began. “There were two criteria by which we claimed a problematic brain death declaration,” said Mr. Robertson, who translated the Chinese. “One was where the patient was not ventilated and was only intubated after they were declared brain dead; the other was that the intubation took place immediately prior to the surgery beginning.”
“It was mind-boggling,” said Dr. Lavee, from Tel Aviv University. “When I first started reading, my initial reaction is, ‘This can’t be.’ I read it once, and again, and I insisted that Matt get another independent translation of the Chinese just to be sure. I told him, ‘There’s no way a physician, a surgeon could write this – it doesn’t make sense.’ But the more of these papers we read, we saw it was a pattern – and they didn’t come out of a single medical center, they are spread all over China.”
For the analysis, Mr. Robertson wrote code and customized an algorithm to examine 124,770 medical articles from official Chinese databases between 1980 and 2020. The 71 articles revealing cases involving problematic brain death came from 56 hospitals (of which 12 were military) in 33 cities across 15 provinces, they report. In total, 348 surgeons, nurses, anesthesiologists, and other medical workers or researchers were listed as authors of these publications.
Why would these medical personnel write such self-incriminating evidence? The researchers say it’s unclear. “They don’t think anyone’s reading this stuff,” Mr. Robertson suggests. “Sometimes it’s revealed in just five or six characters in a paper of eight pages.” Dr. Lavee wonders if it’s also ignorance. “If this has been a practice for 20 or 30 years in China, I guess nobody at that time was aware they were doing something wrong, although how to declare brain death is something that is known in China. They’ve published a lot about it.”
The article is “evidence that this barbarity continues and is a very valuable contribution that continues to bring attention to an enormous human rights violation,” said Arthur Caplan, PhD, head of the Division of Medical Ethics at New York University’s Grossman School of Medicine. “What they’ve reported has been going on for many, many years, the data are very clear that China’s doing many more transplants than they have cadaver organ donors,” he said, adding that the country’s well-documented and lucrative involvement in transplant tourism “means you have to have a donor ready when the would-be recipient appears; you have to have a matched organ available, and that’s hard to do waiting on a cadaver donor.”
Although the researchers found no incriminating publications after 2015, they speculate that this is likely due to growing awareness among Chinese surgeons that publishing the information would attract international condemnation. “We think these practices are continuing to go on,” said Dr. Lavee. He acknowledged that a voluntary organ donation program is slowly developing in parallel to this. He said, given China’s place as the world’s second largest transplant country behind the U.S., as well as its low rate of voluntary donation, it’s reasonable to conclude that the main source of organs remains prisoners on death row.
Dr. Caplan and the researchers have called for academic institutions and medical journals to resume their previous boycotts of Chinese transplant publications and speakers, but as long as China denies the practices, economic and political leaders will turn a blind eye. “In the past, I don’t think the question of China’s medical professional involvement in the execution of donors has been taken as seriously as it should have,” said Mr. Robertson. “I certainly hope that with the publication of this paper in the leading journal in the field, this will change.”
The study was supported by the Google Cloud Research Credits program, the Australian Government Research Training Program Scholarship, and the Victims of Communism Memorial Foundation. Mr. Robertson, Dr. Lavee, and Dr. Caplan have disclosed no relevant financial relationships.
A version of this article first appeared on Medscape.com.
Pneumonia shows strong connection to chronic otitis media
Individuals with a prior diagnosis of pneumonia were significantly more likely to develop chronic otitis media (COM) than were those without a history of pneumonia, based on data from a nationwide cohort study of more than 100,000 patients.
“Recently, middle ear diseases, including COM, have been recognized as respiratory tract diseases beyond the pathophysiological concepts of ventilation dysfunction, with recurrent infection that occurs from anatomically adjacent structures such as the middle ear, mastoid cavity, and eustachian tube,” but the potential link between pneumonia and chronic otitis media and adults in particular has not been examined, wrote Sung Kyun Kim, MD, of Hallym University, Dongtan, South Korea, and colleagues.
In a study recently published in the International Journal of Infectious Diseases, the researchers identified 23,436 adults with COM and 93,744 controls aged 40 years and older from a Korean health insurance database between 2002 and 2015.
The overall incidence of pneumonia in the study population was significantly higher in the COM group compared with controls (9.3% vs. 7.2%, P <.001). The odds ratios of pneumonia were significantly higher in the COM group compared with controls, and a history of pneumonia increased the odds of COM regardless of sex and across all ages.
Pneumonia was defined as when a patient had a diagnosis of pneumonia based on ICD-10 codes and underwent a chest x-ray or chest CT scan. Chronic otitis media was defined as when a patient had a diagnosis based on ICD-10 codes at least two times with one of the following conditions: chronic serous otitis media, chronic mucoid otitis media, other chronic nonsuppurative otitis media, unspecified nonsuppurative otitis media, chronic tubotympanic suppurative otitis media, chronic atticoantral suppurative otitis media, other chronic suppurative otitis media, or unspecified suppurative otitis media.
Age groups were divided into 5-year intervals, and patients were classified into income groups and rural vs. urban residence.
In a further sensitivity analysis, individuals who were diagnosed with pneumonia five or more times before the index date had a significantly higher odds ratio for COM compared with those with less than five diagnoses of pneumonia (adjusted odds ratio, 1.34; P < .001).
Microbiome dysbiosis may explain part of the connection between pneumonia and COM, the researchers wrote in their discussion. Pathogens in the lungs can prompt changes in the microbiome dynamics, as might the use of antibiotics, they said. In addition, “Mucus plugging in the airway caused by pneumonia induces hypoxic conditions and leads to the expression of inflammatory markers in the eustachian tube and middle ear mucosa,” they noted.
The study findings were limited by several factors, including the retrospective design and lack of data on microbiological cultures for antibiotic susceptibility, radiologic findings on the severity of pneumonia, results of pulmonary function tests, and hearing thresholds, the researchers noted. Other limitations were the exclusion of the frequency of upper respiratory infections and antibiotic use due to lack of data, they said.
However, the results show an association between pneumonia diagnoses and increased incidence of COM, which suggests a novel perspective that “infection of the lower respiratory tract may affect the function of the eustachian tube and the middle ear to later cause COM,” they concluded.
The study received no outside funding. The researchers have disclosed no relevant financial relationships.
A version of this article first appeared on Medscape.com.
Individuals with a prior diagnosis of pneumonia were significantly more likely to develop chronic otitis media (COM) than were those without a history of pneumonia, based on data from a nationwide cohort study of more than 100,000 patients.
“Recently, middle ear diseases, including COM, have been recognized as respiratory tract diseases beyond the pathophysiological concepts of ventilation dysfunction, with recurrent infection that occurs from anatomically adjacent structures such as the middle ear, mastoid cavity, and eustachian tube,” but the potential link between pneumonia and chronic otitis media and adults in particular has not been examined, wrote Sung Kyun Kim, MD, of Hallym University, Dongtan, South Korea, and colleagues.
In a study recently published in the International Journal of Infectious Diseases, the researchers identified 23,436 adults with COM and 93,744 controls aged 40 years and older from a Korean health insurance database between 2002 and 2015.
The overall incidence of pneumonia in the study population was significantly higher in the COM group compared with controls (9.3% vs. 7.2%, P <.001). The odds ratios of pneumonia were significantly higher in the COM group compared with controls, and a history of pneumonia increased the odds of COM regardless of sex and across all ages.
Pneumonia was defined as when a patient had a diagnosis of pneumonia based on ICD-10 codes and underwent a chest x-ray or chest CT scan. Chronic otitis media was defined as when a patient had a diagnosis based on ICD-10 codes at least two times with one of the following conditions: chronic serous otitis media, chronic mucoid otitis media, other chronic nonsuppurative otitis media, unspecified nonsuppurative otitis media, chronic tubotympanic suppurative otitis media, chronic atticoantral suppurative otitis media, other chronic suppurative otitis media, or unspecified suppurative otitis media.
Age groups were divided into 5-year intervals, and patients were classified into income groups and rural vs. urban residence.
In a further sensitivity analysis, individuals who were diagnosed with pneumonia five or more times before the index date had a significantly higher odds ratio for COM compared with those with less than five diagnoses of pneumonia (adjusted odds ratio, 1.34; P < .001).
Microbiome dysbiosis may explain part of the connection between pneumonia and COM, the researchers wrote in their discussion. Pathogens in the lungs can prompt changes in the microbiome dynamics, as might the use of antibiotics, they said. In addition, “Mucus plugging in the airway caused by pneumonia induces hypoxic conditions and leads to the expression of inflammatory markers in the eustachian tube and middle ear mucosa,” they noted.
The study findings were limited by several factors, including the retrospective design and lack of data on microbiological cultures for antibiotic susceptibility, radiologic findings on the severity of pneumonia, results of pulmonary function tests, and hearing thresholds, the researchers noted. Other limitations were the exclusion of the frequency of upper respiratory infections and antibiotic use due to lack of data, they said.
However, the results show an association between pneumonia diagnoses and increased incidence of COM, which suggests a novel perspective that “infection of the lower respiratory tract may affect the function of the eustachian tube and the middle ear to later cause COM,” they concluded.
The study received no outside funding. The researchers have disclosed no relevant financial relationships.
A version of this article first appeared on Medscape.com.
Individuals with a prior diagnosis of pneumonia were significantly more likely to develop chronic otitis media (COM) than were those without a history of pneumonia, based on data from a nationwide cohort study of more than 100,000 patients.
“Recently, middle ear diseases, including COM, have been recognized as respiratory tract diseases beyond the pathophysiological concepts of ventilation dysfunction, with recurrent infection that occurs from anatomically adjacent structures such as the middle ear, mastoid cavity, and eustachian tube,” but the potential link between pneumonia and chronic otitis media and adults in particular has not been examined, wrote Sung Kyun Kim, MD, of Hallym University, Dongtan, South Korea, and colleagues.
In a study recently published in the International Journal of Infectious Diseases, the researchers identified 23,436 adults with COM and 93,744 controls aged 40 years and older from a Korean health insurance database between 2002 and 2015.
The overall incidence of pneumonia in the study population was significantly higher in the COM group compared with controls (9.3% vs. 7.2%, P <.001). The odds ratios of pneumonia were significantly higher in the COM group compared with controls, and a history of pneumonia increased the odds of COM regardless of sex and across all ages.
Pneumonia was defined as when a patient had a diagnosis of pneumonia based on ICD-10 codes and underwent a chest x-ray or chest CT scan. Chronic otitis media was defined as when a patient had a diagnosis based on ICD-10 codes at least two times with one of the following conditions: chronic serous otitis media, chronic mucoid otitis media, other chronic nonsuppurative otitis media, unspecified nonsuppurative otitis media, chronic tubotympanic suppurative otitis media, chronic atticoantral suppurative otitis media, other chronic suppurative otitis media, or unspecified suppurative otitis media.
Age groups were divided into 5-year intervals, and patients were classified into income groups and rural vs. urban residence.
In a further sensitivity analysis, individuals who were diagnosed with pneumonia five or more times before the index date had a significantly higher odds ratio for COM compared with those with less than five diagnoses of pneumonia (adjusted odds ratio, 1.34; P < .001).
Microbiome dysbiosis may explain part of the connection between pneumonia and COM, the researchers wrote in their discussion. Pathogens in the lungs can prompt changes in the microbiome dynamics, as might the use of antibiotics, they said. In addition, “Mucus plugging in the airway caused by pneumonia induces hypoxic conditions and leads to the expression of inflammatory markers in the eustachian tube and middle ear mucosa,” they noted.
The study findings were limited by several factors, including the retrospective design and lack of data on microbiological cultures for antibiotic susceptibility, radiologic findings on the severity of pneumonia, results of pulmonary function tests, and hearing thresholds, the researchers noted. Other limitations were the exclusion of the frequency of upper respiratory infections and antibiotic use due to lack of data, they said.
However, the results show an association between pneumonia diagnoses and increased incidence of COM, which suggests a novel perspective that “infection of the lower respiratory tract may affect the function of the eustachian tube and the middle ear to later cause COM,” they concluded.
The study received no outside funding. The researchers have disclosed no relevant financial relationships.
A version of this article first appeared on Medscape.com.
FROM THE INTERNATIONAL JOURNAL OF INFECTIOUS DISEASES
Flu vaccines cut seasonal death in heart failure patients
WASHINGTON – Patients with heart failure who received an annual influenza vaccine for 3 years running had significantly fewer all-cause hospitalizations and significantly fewer cases of pneumonia during that time, compared with placebo-treated patients with heart failure, in a prospective, randomized, global trial with 5,129 participants.
Although the results failed to show a significant reduction in all-cause deaths linked to influenza vaccination, compared with controls during the entire 3 years of the study, the results did show a significant 21% relative mortality-risk reduction by vaccination during periods of peak influenza circulation, and a significant 23% reduction in cardiovascular deaths, compared with controls during peak seasons.

“This is the first randomized, controlled trial of influenza vaccine in patients with heart failure, and we showed that vaccination reduces deaths” during peak influenza seasons, Mark Loeb, MD, said during a press briefing at the annual scientific sessions of the American College of Cardiology. The results send “an important global message that patients with heart failure should receive the influenza vaccine,” said Dr. Loeb, a professor at McMaster University, Hamilton, Ont., who specializes in clinical epidemiology and infectious diseases.
Dr. Loeb admitted that he and his associates erred when they picked the time window to assess the two primary endpoints for the trial: the combined rate of cardiovascular death, nonfatal MI, and nonfatal stroke, and this combined endpoint plus hospitalizations for heart failure.
The time window they selected was the entirety of all 3 years following three annual immunizations. That was a mistake.
No flu vaccine benefit outside flu season
“We know that the influenza vaccine will not have any effect outside of when influenza is circulating. In retrospect, we should have done that,” Dr. Loeb bemoaned during his talk. He chalked up the bad choice to concern over collecting enough endpoints to see a significant between-group difference when the researchers designed the study.
For the entire 3 years of follow-up, influenza vaccination was tied to a nonsignificant 7% relative risk reduction for the first primary endpoint, and a nonsignificant 9% relative risk reduction for the second primary endpoint, he reported.
But Dr. Loeb lobbied for the relevance of several significant secondary endpoints that collectively showed a compelling pattern of benefit during his talk. These included, for the full 3-years of follow-up, important, significant reductions relative to placebo of 16% for first all-cause hospitalizations (P = .01), and a 42% relative risk reduction in first cases of pneumonia (P = .0006).
Then there were the benefits that appeared during influenza season. In that analysis, first events for the first primary endpoint fell after vaccination by a significant 18% relative to placebo. The in-season analysis also showed the significant cuts in both all-cause and cardiovascular deaths.
Despite the neutral primary endpoints, “if you look at these data as a whole I think they speak to the importance of vaccinating patients with heart failure against influenza,” Dr. Loeb maintained.
‘Totality of evidence supports vaccination’
“I agree that the totality of evidence supports influenza vaccination,” commented Mark H. Drazner, MD, professor and clinical chief of cardiology at the University of Texas Southwestern Medical Center, Dallas, who was designated discussant for the report.

“The message should be to offer influenza vaccine to patients with heart failure,” Dr. Drazner said in an interview. “Previous data on influenza vaccine in patients with heart failure were largely observational. This was a randomized, prospective, placebo-controlled trial. That’s a step forward. Proving efficacy in a randomized trial is important.”
Dr Drazner added that his institution already promotes a “strong mandate” to vaccinate patients with heart failure against influenza.
“The influenza vaccine is a very effective and cost-efficient public health measure. Preventing hospitalizations of patients with heart failure has so many benefits,” commented Craig Beavers, PharmD, vice president of professional services at Baptist Health in Paducah, Ky., and a discussant during the press briefing.

The Influenza Vaccine To Prevent Adverse Vascular Events (IVVE) trial enrolled people with heart failure in New York Heart Association functional class II, III, or IV from any of 10 low- and middle-income countries including China, India, the Philippines, and multiple countries from Africa and the Middle East. They averaged 57 years of age, and slightly more than half were women.
IVVE was sponsored by McMaster University; the only commercial support that IVVE received was a free supply of influenza vaccine from Sanofi Pasteur. Dr. Loeb, Dr. Drazner, and Dr. Beavers had no disclosures.
WASHINGTON – Patients with heart failure who received an annual influenza vaccine for 3 years running had significantly fewer all-cause hospitalizations and significantly fewer cases of pneumonia during that time, compared with placebo-treated patients with heart failure, in a prospective, randomized, global trial with 5,129 participants.
Although the results failed to show a significant reduction in all-cause deaths linked to influenza vaccination, compared with controls during the entire 3 years of the study, the results did show a significant 21% relative mortality-risk reduction by vaccination during periods of peak influenza circulation, and a significant 23% reduction in cardiovascular deaths, compared with controls during peak seasons.
“This is the first randomized, controlled trial of influenza vaccine in patients with heart failure, and we showed that vaccination reduces deaths” during peak influenza seasons, Mark Loeb, MD, said during a press briefing at the annual scientific sessions of the American College of Cardiology. The results send “an important global message that patients with heart failure should receive the influenza vaccine,” said Dr. Loeb, a professor at McMaster University, Hamilton, Ont., who specializes in clinical epidemiology and infectious diseases.
Dr. Loeb admitted that he and his associates erred when they picked the time window to assess the two primary endpoints for the trial: the combined rate of cardiovascular death, nonfatal MI, and nonfatal stroke, and this combined endpoint plus hospitalizations for heart failure.
The time window they selected was the entirety of all 3 years following three annual immunizations. That was a mistake.
No flu vaccine benefit outside flu season
“We know that the influenza vaccine will not have any effect outside of when influenza is circulating. In retrospect, we should have done that,” Dr. Loeb bemoaned during his talk. He chalked up the bad choice to concern over collecting enough endpoints to see a significant between-group difference when the researchers designed the study.
For the entire 3 years of follow-up, influenza vaccination was tied to a nonsignificant 7% relative risk reduction for the first primary endpoint, and a nonsignificant 9% relative risk reduction for the second primary endpoint, he reported.
But Dr. Loeb lobbied for the relevance of several significant secondary endpoints that collectively showed a compelling pattern of benefit during his talk. These included, for the full 3-years of follow-up, important, significant reductions relative to placebo of 16% for first all-cause hospitalizations (P = .01), and a 42% relative risk reduction in first cases of pneumonia (P = .0006).
Then there were the benefits that appeared during influenza season. In that analysis, first events for the first primary endpoint fell after vaccination by a significant 18% relative to placebo. The in-season analysis also showed the significant cuts in both all-cause and cardiovascular deaths.
Despite the neutral primary endpoints, “if you look at these data as a whole I think they speak to the importance of vaccinating patients with heart failure against influenza,” Dr. Loeb maintained.
‘Totality of evidence supports vaccination’
“I agree that the totality of evidence supports influenza vaccination,” commented Mark H. Drazner, MD, professor and clinical chief of cardiology at the University of Texas Southwestern Medical Center, Dallas, who was designated discussant for the report.
“The message should be to offer influenza vaccine to patients with heart failure,” Dr. Drazner said in an interview. “Previous data on influenza vaccine in patients with heart failure were largely observational. This was a randomized, prospective, placebo-controlled trial. That’s a step forward. Proving efficacy in a randomized trial is important.”
Dr Drazner added that his institution already promotes a “strong mandate” to vaccinate patients with heart failure against influenza.
“The influenza vaccine is a very effective and cost-efficient public health measure. Preventing hospitalizations of patients with heart failure has so many benefits,” commented Craig Beavers, PharmD, vice president of professional services at Baptist Health in Paducah, Ky., and a discussant during the press briefing.
The Influenza Vaccine To Prevent Adverse Vascular Events (IVVE) trial enrolled people with heart failure in New York Heart Association functional class II, III, or IV from any of 10 low- and middle-income countries including China, India, the Philippines, and multiple countries from Africa and the Middle East. They averaged 57 years of age, and slightly more than half were women.
IVVE was sponsored by McMaster University; the only commercial support that IVVE received was a free supply of influenza vaccine from Sanofi Pasteur. Dr. Loeb, Dr. Drazner, and Dr. Beavers had no disclosures.
WASHINGTON – Patients with heart failure who received an annual influenza vaccine for 3 years running had significantly fewer all-cause hospitalizations and significantly fewer cases of pneumonia during that time, compared with placebo-treated patients with heart failure, in a prospective, randomized, global trial with 5,129 participants.
Although the results failed to show a significant reduction in all-cause deaths linked to influenza vaccination, compared with controls during the entire 3 years of the study, the results did show a significant 21% relative mortality-risk reduction by vaccination during periods of peak influenza circulation, and a significant 23% reduction in cardiovascular deaths, compared with controls during peak seasons.
“This is the first randomized, controlled trial of influenza vaccine in patients with heart failure, and we showed that vaccination reduces deaths” during peak influenza seasons, Mark Loeb, MD, said during a press briefing at the annual scientific sessions of the American College of Cardiology. The results send “an important global message that patients with heart failure should receive the influenza vaccine,” said Dr. Loeb, a professor at McMaster University, Hamilton, Ont., who specializes in clinical epidemiology and infectious diseases.
Dr. Loeb admitted that he and his associates erred when they picked the time window to assess the two primary endpoints for the trial: the combined rate of cardiovascular death, nonfatal MI, and nonfatal stroke, and this combined endpoint plus hospitalizations for heart failure.
The time window they selected was the entirety of all 3 years following three annual immunizations. That was a mistake.
No flu vaccine benefit outside flu season
“We know that the influenza vaccine will not have any effect outside of when influenza is circulating. In retrospect, we should have done that,” Dr. Loeb bemoaned during his talk. He chalked up the bad choice to concern over collecting enough endpoints to see a significant between-group difference when the researchers designed the study.
For the entire 3 years of follow-up, influenza vaccination was tied to a nonsignificant 7% relative risk reduction for the first primary endpoint, and a nonsignificant 9% relative risk reduction for the second primary endpoint, he reported.
But Dr. Loeb lobbied for the relevance of several significant secondary endpoints that collectively showed a compelling pattern of benefit during his talk. These included, for the full 3-years of follow-up, important, significant reductions relative to placebo of 16% for first all-cause hospitalizations (P = .01), and a 42% relative risk reduction in first cases of pneumonia (P = .0006).
Then there were the benefits that appeared during influenza season. In that analysis, first events for the first primary endpoint fell after vaccination by a significant 18% relative to placebo. The in-season analysis also showed the significant cuts in both all-cause and cardiovascular deaths.
Despite the neutral primary endpoints, “if you look at these data as a whole I think they speak to the importance of vaccinating patients with heart failure against influenza,” Dr. Loeb maintained.
‘Totality of evidence supports vaccination’
“I agree that the totality of evidence supports influenza vaccination,” commented Mark H. Drazner, MD, professor and clinical chief of cardiology at the University of Texas Southwestern Medical Center, Dallas, who was designated discussant for the report.
“The message should be to offer influenza vaccine to patients with heart failure,” Dr. Drazner said in an interview. “Previous data on influenza vaccine in patients with heart failure were largely observational. This was a randomized, prospective, placebo-controlled trial. That’s a step forward. Proving efficacy in a randomized trial is important.”
Dr Drazner added that his institution already promotes a “strong mandate” to vaccinate patients with heart failure against influenza.
“The influenza vaccine is a very effective and cost-efficient public health measure. Preventing hospitalizations of patients with heart failure has so many benefits,” commented Craig Beavers, PharmD, vice president of professional services at Baptist Health in Paducah, Ky., and a discussant during the press briefing.
The Influenza Vaccine To Prevent Adverse Vascular Events (IVVE) trial enrolled people with heart failure in New York Heart Association functional class II, III, or IV from any of 10 low- and middle-income countries including China, India, the Philippines, and multiple countries from Africa and the Middle East. They averaged 57 years of age, and slightly more than half were women.
IVVE was sponsored by McMaster University; the only commercial support that IVVE received was a free supply of influenza vaccine from Sanofi Pasteur. Dr. Loeb, Dr. Drazner, and Dr. Beavers had no disclosures.
AT ACC 2022
Pneumococcal pneumonia outcomes worse than those of Legionnaires disease
Outcomes for patients with bacteremic Streptococcus pneumoniae were significantly worse than those for patients with Legionnaires disease (LD), based on data from 106 individuals.
Reported cases of LD in the United States have increased in recent decades, but they are likely under-reported, wrote Sima Salahie, MD, of Wayne State University School of Medicine, Detroit, and Central Michigan University College of Medicine, Grosse Pointe Woods, and colleagues.
Clinical presentations may be similar for both conditions, but different antimicrobial therapies are needed; therefore, identifying distinguishing factors can promote better management of hospitalized patients, they reported.
In a retrospective case companion study published in the American Journal of the Medical Sciences, the researchers reviewed data from 51 adults with LD and 55 with bacteremic S. pneumoniae pneumonia (SP) who were hospitalized at a single center between 2013 and 2018. Diagnoses were confirmed by laboratory and radiology results. In addition, data were collected on clinical features including body mass index, systolic and diastolic blood pressure, pulse, respiratory rate, and temperature.
Overall, patients with SP were significantly more likely than those with LD to require mechanical ventilation (P = .04), intensive care unit stay (P = .004), and to die (P = .002). Patients with SP also had higher rates of septic shock compared to LD patients, although this difference fell short of statistical significance (49.1% vs. 30.4%; P = .06).
In a multivariate analysis, male sex, diarrhea, higher body mass index, hyponatremia, and lower Charleston Weighted Index of Comorbidity (CWIC) score were significant independent predictors of LD, with odds ratios of 21.6, 4.5, 1.13, 5.6, and 0.61, respectively.
The incidence of LD peaked in summer, while the incidence of SP peaked in the winter, the researchers noted. “Seasonality is a variable that has not always been included in previous scoring systems but should be considered in future modeling,” they said.
“Noteworthy is that LD represented almost as many cases as documented bacteremic pneumococcal pneumonia,” the researchers wrote in their discussion. “This occurred at a time when there was no outbreak of L. pneumophila in our community, and as these were all community acquired, there was no evidence of a nosocomial outbreak in our institution,” they said.
The study findings were limited by several factors, including the possible underestimation of SP because of the requirement for positive blood cultures and the lack of other methods of diagnosing SP, the researchers noted.
“However, the data suggest variables to distinguish LD from SP,” they said. “Establishing reliable clinical and laboratory parameters embedded in a simple diagnostic score that can accurately identify patients with LD may be helpful in aiding physicians’ early diagnosis in distinguishing LD from SP but will need to be defined.”
The study received no outside funding. The researchers disclosed no financial conflicts.
A version of this article first appeared on Medscape.com.
Outcomes for patients with bacteremic Streptococcus pneumoniae were significantly worse than those for patients with Legionnaires disease (LD), based on data from 106 individuals.
Reported cases of LD in the United States have increased in recent decades, but they are likely under-reported, wrote Sima Salahie, MD, of Wayne State University School of Medicine, Detroit, and Central Michigan University College of Medicine, Grosse Pointe Woods, and colleagues.
Clinical presentations may be similar for both conditions, but different antimicrobial therapies are needed; therefore, identifying distinguishing factors can promote better management of hospitalized patients, they reported.
In a retrospective case companion study published in the American Journal of the Medical Sciences, the researchers reviewed data from 51 adults with LD and 55 with bacteremic S. pneumoniae pneumonia (SP) who were hospitalized at a single center between 2013 and 2018. Diagnoses were confirmed by laboratory and radiology results. In addition, data were collected on clinical features including body mass index, systolic and diastolic blood pressure, pulse, respiratory rate, and temperature.
Overall, patients with SP were significantly more likely than those with LD to require mechanical ventilation (P = .04), intensive care unit stay (P = .004), and to die (P = .002). Patients with SP also had higher rates of septic shock compared to LD patients, although this difference fell short of statistical significance (49.1% vs. 30.4%; P = .06).
In a multivariate analysis, male sex, diarrhea, higher body mass index, hyponatremia, and lower Charleston Weighted Index of Comorbidity (CWIC) score were significant independent predictors of LD, with odds ratios of 21.6, 4.5, 1.13, 5.6, and 0.61, respectively.
The incidence of LD peaked in summer, while the incidence of SP peaked in the winter, the researchers noted. “Seasonality is a variable that has not always been included in previous scoring systems but should be considered in future modeling,” they said.
“Noteworthy is that LD represented almost as many cases as documented bacteremic pneumococcal pneumonia,” the researchers wrote in their discussion. “This occurred at a time when there was no outbreak of L. pneumophila in our community, and as these were all community acquired, there was no evidence of a nosocomial outbreak in our institution,” they said.
The study findings were limited by several factors, including the possible underestimation of SP because of the requirement for positive blood cultures and the lack of other methods of diagnosing SP, the researchers noted.
“However, the data suggest variables to distinguish LD from SP,” they said. “Establishing reliable clinical and laboratory parameters embedded in a simple diagnostic score that can accurately identify patients with LD may be helpful in aiding physicians’ early diagnosis in distinguishing LD from SP but will need to be defined.”
The study received no outside funding. The researchers disclosed no financial conflicts.
A version of this article first appeared on Medscape.com.
Outcomes for patients with bacteremic Streptococcus pneumoniae were significantly worse than those for patients with Legionnaires disease (LD), based on data from 106 individuals.
Reported cases of LD in the United States have increased in recent decades, but they are likely under-reported, wrote Sima Salahie, MD, of Wayne State University School of Medicine, Detroit, and Central Michigan University College of Medicine, Grosse Pointe Woods, and colleagues.
Clinical presentations may be similar for both conditions, but different antimicrobial therapies are needed; therefore, identifying distinguishing factors can promote better management of hospitalized patients, they reported.
In a retrospective case companion study published in the American Journal of the Medical Sciences, the researchers reviewed data from 51 adults with LD and 55 with bacteremic S. pneumoniae pneumonia (SP) who were hospitalized at a single center between 2013 and 2018. Diagnoses were confirmed by laboratory and radiology results. In addition, data were collected on clinical features including body mass index, systolic and diastolic blood pressure, pulse, respiratory rate, and temperature.
Overall, patients with SP were significantly more likely than those with LD to require mechanical ventilation (P = .04), intensive care unit stay (P = .004), and to die (P = .002). Patients with SP also had higher rates of septic shock compared to LD patients, although this difference fell short of statistical significance (49.1% vs. 30.4%; P = .06).
In a multivariate analysis, male sex, diarrhea, higher body mass index, hyponatremia, and lower Charleston Weighted Index of Comorbidity (CWIC) score were significant independent predictors of LD, with odds ratios of 21.6, 4.5, 1.13, 5.6, and 0.61, respectively.
The incidence of LD peaked in summer, while the incidence of SP peaked in the winter, the researchers noted. “Seasonality is a variable that has not always been included in previous scoring systems but should be considered in future modeling,” they said.
“Noteworthy is that LD represented almost as many cases as documented bacteremic pneumococcal pneumonia,” the researchers wrote in their discussion. “This occurred at a time when there was no outbreak of L. pneumophila in our community, and as these were all community acquired, there was no evidence of a nosocomial outbreak in our institution,” they said.
The study findings were limited by several factors, including the possible underestimation of SP because of the requirement for positive blood cultures and the lack of other methods of diagnosing SP, the researchers noted.
“However, the data suggest variables to distinguish LD from SP,” they said. “Establishing reliable clinical and laboratory parameters embedded in a simple diagnostic score that can accurately identify patients with LD may be helpful in aiding physicians’ early diagnosis in distinguishing LD from SP but will need to be defined.”
The study received no outside funding. The researchers disclosed no financial conflicts.
A version of this article first appeared on Medscape.com.
Pneumonia decision tool reduces death in ED patients
a 3-year, pragmatic, cluster-controlled study shows.
“We designed the ePNa specifically to require minimal input from the clinician so everything it does is already in the electronic medical record,” Nathan Dean, MD, University of Utah, Salt Lake City, told this news organization.
“So it’s actually putting the guideline recommendations into effect for physicians so that they can make better decisions by having all this information – it’s a comprehensive best practice kind of tool where best practices are likely to make the biggest difference for patients with a high severity of illness,” he added.
The study was published online in the American Journal of Respiratory and Critical Care Medicine.
Guideline-based tool
The ePNa makes use of pneumonia guidelines of 2007 and 2019 from the American Thoracic Society/Infectious Disease Society of America. The system was deployed into six geographic clusters of 16 Intermountain hospital EDs at 2-month intervals between December 2017 and November 2018. Simultaneous deployment was impractical, as implementation of the tool takes education, monitoring, and feedback that can be facilitated by focusing on only a few hospitals at a time.
The decision support tool gathers key patient indicators including age, fever, oxygen saturation, vital signs, and laboratory and chest imaging results to offer recommendations on care, including appropriate antibiotic therapy, microbiology studies, and whether a given patient should be sent to the intensive care unit, admitted to hospital, or may safely be discharged home.
Investigators analyzed a total of 6,848 patients, of whom 4,536 were managed for pneumonia before the ePNa was deployed and 2,312 after deployment.
The median age of patients was 67 years (interquartile range, 50-79 years). Roughly half were female and almost all were White. “Observed 30-day all-cause mortality including both outpatients and inpatients was 8.6% before deployment versus 4.8% after deployment of ePNa,” Dr. Dean and colleagues reported.
Adjusted for severity of illness, the odds ratio for lower mortality post-ePNa launch was 0.62 (95% confidence interval, 0.49-0.79; P < .0010) “and lower morality was consistent across hospital clusters.”
Compared with patients who were discharged home, reductions in mortality were greatest in patients who were directly admitted to ICUs from the ED (OR, 0.32; 95% CI, 0.14-0.77; P = .01). The OR for patients admitted to the medical floor was 0.53 (95% CI, 0.25-1.1; P = .09), which did not reach statistical significance.
Dr. Dean explained that the reductions in mortality were seen among those with the most severe illness, in whom best practices would benefit the most. In contrast, patients who are sent home on an antibiotic are at low risk for mortality while patients admitted to the medical floor may well have another, more lethal illness from which they end up dying, rather than simple pneumonia.
“For me, this was a clear demonstration that these best practices made the biggest difference in patients who were sick and who did not have any underlying disease that was going to kill them anyway,” he emphasized. On the other hand, both 30-day mortality and 7-day secondary hospital admission were higher among patients the tool recommended for hospital ward admission but who were discharged home from the ED.
“This was an unexpected finding,” Dr. Dean observed. However, as he explained, the authors reviewed 25% of randomly selected patients who fell into this subgroup and discovered that the ePNa tool was used in only about 20% of patients – “so doctors did not use the tool in the majority of this group.”
In addition, some of these patients declined hospital admission, so the doctors may have recommended that they be admitted but the patients said no. “The hypothesis here is that if they had been admitted to the hospital, they may have had a lower mortality risk,” Dr. Dean said.
Noticeable changes
Another noticeable change following the introduction of the ePNa tool was that guideline-concordant antibiotic prescribing increased in the 8 hours after patients presented to the ED, from 79.5% prior to the tool’s launch to 87.9%, again after adjusting for pneumonia severity (P < .001). Use of broad-spectrum antibiotics was not significantly different between the two treatment intervals, but administration of antibiotics active against methicillin-resistant Staphylococcus aureus dropped significantly between the two treatment intervals (P < .001). And the mean time from admission to the ED to the first antibiotic taken was slightly faster, improving from 159.4 minutes (95% CI, 156.9-161.9 minutes) prior to the ePNa launch to 150.9 minutes (95% CI, 144.1-157.8) post deployment (P < .001).
“Overall outpatient disposition for treatment of pneumonia from the emergency department increased from 29.2% before ePNa to 46.9% [post ePNA],” the authors noted, while a similar increase was observed in patients for whom ePNA recommended outpatient care – from 49.2% pre-ePNA to 66.6% after ePNA.
Both hospital ward admission and admission to the ICU decreased after ePNa had been introduced. Despite a significant increase in the percentage of patients being discharged home, neither 7-day secondary hospital admission nor severity-adjusted, 30-day mortality were significantly different before versus after the introduction of ePNa, the authors stressed.
A limitation of the study was that the trial was confined to a single health care system in one region of the United States with a patient population that may differ from that in other regions.
Reason for its success
Asked to comment on the findings, Adam Balls, MD, emergency department chair, Intermountain Medical Center, Murray, Utah, suggested that the reason the ePNa tool has been so successful at improving care for pneumonia patients is that it puts the guidelines directly into the hands of individual providers and tells them what’s going on. (Dr. Balls was not involved in the study.) “The tool allows us to take into consideration various clinical features – a patient’s oxygen requirements and whether or not they had prior complicated pneumonias that required additional antibiotics, for example – and then it makes the best determination for not only the disposition for that patient but antibiotic treatment as well,” he said in an interview.
This then allows physicians to either appropriately discharge less severely ill patients and admit those who are more ill – “and in general, just do a better job of treating pneumonia with this tool,” Dr. Balls said. He himself uses the decision support tool when attending to his own patients with pneumonia, as he feels that the tool really does make his care of these patients better. “There is a disparity around how we treat pneumonia in the U.S.
“Clinicians sometimes have a bias or a preference for certain antibiotics and we may not be appropriately treating these patients with broad-spectrum antibiotics or are perhaps using antibiotics that are not as effective based on an individual patient scenario so this is definitely a user-friendly tool that hopefully can be deployed throughout other health care systems to improve the treatment of pneumonia overall,” Dr. Balls emphasized.
A version of this article first appeared on Medscape.com.
a 3-year, pragmatic, cluster-controlled study shows.
“We designed the ePNa specifically to require minimal input from the clinician so everything it does is already in the electronic medical record,” Nathan Dean, MD, University of Utah, Salt Lake City, told this news organization.
“So it’s actually putting the guideline recommendations into effect for physicians so that they can make better decisions by having all this information – it’s a comprehensive best practice kind of tool where best practices are likely to make the biggest difference for patients with a high severity of illness,” he added.
The study was published online in the American Journal of Respiratory and Critical Care Medicine.
Guideline-based tool
The ePNa makes use of pneumonia guidelines of 2007 and 2019 from the American Thoracic Society/Infectious Disease Society of America. The system was deployed into six geographic clusters of 16 Intermountain hospital EDs at 2-month intervals between December 2017 and November 2018. Simultaneous deployment was impractical, as implementation of the tool takes education, monitoring, and feedback that can be facilitated by focusing on only a few hospitals at a time.
The decision support tool gathers key patient indicators including age, fever, oxygen saturation, vital signs, and laboratory and chest imaging results to offer recommendations on care, including appropriate antibiotic therapy, microbiology studies, and whether a given patient should be sent to the intensive care unit, admitted to hospital, or may safely be discharged home.
Investigators analyzed a total of 6,848 patients, of whom 4,536 were managed for pneumonia before the ePNa was deployed and 2,312 after deployment.
The median age of patients was 67 years (interquartile range, 50-79 years). Roughly half were female and almost all were White. “Observed 30-day all-cause mortality including both outpatients and inpatients was 8.6% before deployment versus 4.8% after deployment of ePNa,” Dr. Dean and colleagues reported.
Adjusted for severity of illness, the odds ratio for lower mortality post-ePNa launch was 0.62 (95% confidence interval, 0.49-0.79; P < .0010) “and lower morality was consistent across hospital clusters.”
Compared with patients who were discharged home, reductions in mortality were greatest in patients who were directly admitted to ICUs from the ED (OR, 0.32; 95% CI, 0.14-0.77; P = .01). The OR for patients admitted to the medical floor was 0.53 (95% CI, 0.25-1.1; P = .09), which did not reach statistical significance.
Dr. Dean explained that the reductions in mortality were seen among those with the most severe illness, in whom best practices would benefit the most. In contrast, patients who are sent home on an antibiotic are at low risk for mortality while patients admitted to the medical floor may well have another, more lethal illness from which they end up dying, rather than simple pneumonia.
“For me, this was a clear demonstration that these best practices made the biggest difference in patients who were sick and who did not have any underlying disease that was going to kill them anyway,” he emphasized. On the other hand, both 30-day mortality and 7-day secondary hospital admission were higher among patients the tool recommended for hospital ward admission but who were discharged home from the ED.
“This was an unexpected finding,” Dr. Dean observed. However, as he explained, the authors reviewed 25% of randomly selected patients who fell into this subgroup and discovered that the ePNa tool was used in only about 20% of patients – “so doctors did not use the tool in the majority of this group.”
In addition, some of these patients declined hospital admission, so the doctors may have recommended that they be admitted but the patients said no. “The hypothesis here is that if they had been admitted to the hospital, they may have had a lower mortality risk,” Dr. Dean said.
Noticeable changes
Another noticeable change following the introduction of the ePNa tool was that guideline-concordant antibiotic prescribing increased in the 8 hours after patients presented to the ED, from 79.5% prior to the tool’s launch to 87.9%, again after adjusting for pneumonia severity (P < .001). Use of broad-spectrum antibiotics was not significantly different between the two treatment intervals, but administration of antibiotics active against methicillin-resistant Staphylococcus aureus dropped significantly between the two treatment intervals (P < .001). And the mean time from admission to the ED to the first antibiotic taken was slightly faster, improving from 159.4 minutes (95% CI, 156.9-161.9 minutes) prior to the ePNa launch to 150.9 minutes (95% CI, 144.1-157.8) post deployment (P < .001).
“Overall outpatient disposition for treatment of pneumonia from the emergency department increased from 29.2% before ePNa to 46.9% [post ePNA],” the authors noted, while a similar increase was observed in patients for whom ePNA recommended outpatient care – from 49.2% pre-ePNA to 66.6% after ePNA.
Both hospital ward admission and admission to the ICU decreased after ePNa had been introduced. Despite a significant increase in the percentage of patients being discharged home, neither 7-day secondary hospital admission nor severity-adjusted, 30-day mortality were significantly different before versus after the introduction of ePNa, the authors stressed.
A limitation of the study was that the trial was confined to a single health care system in one region of the United States with a patient population that may differ from that in other regions.
Reason for its success
Asked to comment on the findings, Adam Balls, MD, emergency department chair, Intermountain Medical Center, Murray, Utah, suggested that the reason the ePNa tool has been so successful at improving care for pneumonia patients is that it puts the guidelines directly into the hands of individual providers and tells them what’s going on. (Dr. Balls was not involved in the study.) “The tool allows us to take into consideration various clinical features – a patient’s oxygen requirements and whether or not they had prior complicated pneumonias that required additional antibiotics, for example – and then it makes the best determination for not only the disposition for that patient but antibiotic treatment as well,” he said in an interview.
This then allows physicians to either appropriately discharge less severely ill patients and admit those who are more ill – “and in general, just do a better job of treating pneumonia with this tool,” Dr. Balls said. He himself uses the decision support tool when attending to his own patients with pneumonia, as he feels that the tool really does make his care of these patients better. “There is a disparity around how we treat pneumonia in the U.S.
“Clinicians sometimes have a bias or a preference for certain antibiotics and we may not be appropriately treating these patients with broad-spectrum antibiotics or are perhaps using antibiotics that are not as effective based on an individual patient scenario so this is definitely a user-friendly tool that hopefully can be deployed throughout other health care systems to improve the treatment of pneumonia overall,” Dr. Balls emphasized.
A version of this article first appeared on Medscape.com.
a 3-year, pragmatic, cluster-controlled study shows.
“We designed the ePNa specifically to require minimal input from the clinician so everything it does is already in the electronic medical record,” Nathan Dean, MD, University of Utah, Salt Lake City, told this news organization.
“So it’s actually putting the guideline recommendations into effect for physicians so that they can make better decisions by having all this information – it’s a comprehensive best practice kind of tool where best practices are likely to make the biggest difference for patients with a high severity of illness,” he added.
The study was published online in the American Journal of Respiratory and Critical Care Medicine.
Guideline-based tool
The ePNa makes use of pneumonia guidelines of 2007 and 2019 from the American Thoracic Society/Infectious Disease Society of America. The system was deployed into six geographic clusters of 16 Intermountain hospital EDs at 2-month intervals between December 2017 and November 2018. Simultaneous deployment was impractical, as implementation of the tool takes education, monitoring, and feedback that can be facilitated by focusing on only a few hospitals at a time.
The decision support tool gathers key patient indicators including age, fever, oxygen saturation, vital signs, and laboratory and chest imaging results to offer recommendations on care, including appropriate antibiotic therapy, microbiology studies, and whether a given patient should be sent to the intensive care unit, admitted to hospital, or may safely be discharged home.
Investigators analyzed a total of 6,848 patients, of whom 4,536 were managed for pneumonia before the ePNa was deployed and 2,312 after deployment.
The median age of patients was 67 years (interquartile range, 50-79 years). Roughly half were female and almost all were White. “Observed 30-day all-cause mortality including both outpatients and inpatients was 8.6% before deployment versus 4.8% after deployment of ePNa,” Dr. Dean and colleagues reported.
Adjusted for severity of illness, the odds ratio for lower mortality post-ePNa launch was 0.62 (95% confidence interval, 0.49-0.79; P < .0010) “and lower morality was consistent across hospital clusters.”
Compared with patients who were discharged home, reductions in mortality were greatest in patients who were directly admitted to ICUs from the ED (OR, 0.32; 95% CI, 0.14-0.77; P = .01). The OR for patients admitted to the medical floor was 0.53 (95% CI, 0.25-1.1; P = .09), which did not reach statistical significance.
Dr. Dean explained that the reductions in mortality were seen among those with the most severe illness, in whom best practices would benefit the most. In contrast, patients who are sent home on an antibiotic are at low risk for mortality while patients admitted to the medical floor may well have another, more lethal illness from which they end up dying, rather than simple pneumonia.
“For me, this was a clear demonstration that these best practices made the biggest difference in patients who were sick and who did not have any underlying disease that was going to kill them anyway,” he emphasized. On the other hand, both 30-day mortality and 7-day secondary hospital admission were higher among patients the tool recommended for hospital ward admission but who were discharged home from the ED.
“This was an unexpected finding,” Dr. Dean observed. However, as he explained, the authors reviewed 25% of randomly selected patients who fell into this subgroup and discovered that the ePNa tool was used in only about 20% of patients – “so doctors did not use the tool in the majority of this group.”
In addition, some of these patients declined hospital admission, so the doctors may have recommended that they be admitted but the patients said no. “The hypothesis here is that if they had been admitted to the hospital, they may have had a lower mortality risk,” Dr. Dean said.
Noticeable changes
Another noticeable change following the introduction of the ePNa tool was that guideline-concordant antibiotic prescribing increased in the 8 hours after patients presented to the ED, from 79.5% prior to the tool’s launch to 87.9%, again after adjusting for pneumonia severity (P < .001). Use of broad-spectrum antibiotics was not significantly different between the two treatment intervals, but administration of antibiotics active against methicillin-resistant Staphylococcus aureus dropped significantly between the two treatment intervals (P < .001). And the mean time from admission to the ED to the first antibiotic taken was slightly faster, improving from 159.4 minutes (95% CI, 156.9-161.9 minutes) prior to the ePNa launch to 150.9 minutes (95% CI, 144.1-157.8) post deployment (P < .001).
“Overall outpatient disposition for treatment of pneumonia from the emergency department increased from 29.2% before ePNa to 46.9% [post ePNA],” the authors noted, while a similar increase was observed in patients for whom ePNA recommended outpatient care – from 49.2% pre-ePNA to 66.6% after ePNA.
Both hospital ward admission and admission to the ICU decreased after ePNa had been introduced. Despite a significant increase in the percentage of patients being discharged home, neither 7-day secondary hospital admission nor severity-adjusted, 30-day mortality were significantly different before versus after the introduction of ePNa, the authors stressed.
A limitation of the study was that the trial was confined to a single health care system in one region of the United States with a patient population that may differ from that in other regions.
Reason for its success
Asked to comment on the findings, Adam Balls, MD, emergency department chair, Intermountain Medical Center, Murray, Utah, suggested that the reason the ePNa tool has been so successful at improving care for pneumonia patients is that it puts the guidelines directly into the hands of individual providers and tells them what’s going on. (Dr. Balls was not involved in the study.) “The tool allows us to take into consideration various clinical features – a patient’s oxygen requirements and whether or not they had prior complicated pneumonias that required additional antibiotics, for example – and then it makes the best determination for not only the disposition for that patient but antibiotic treatment as well,” he said in an interview.
This then allows physicians to either appropriately discharge less severely ill patients and admit those who are more ill – “and in general, just do a better job of treating pneumonia with this tool,” Dr. Balls said. He himself uses the decision support tool when attending to his own patients with pneumonia, as he feels that the tool really does make his care of these patients better. “There is a disparity around how we treat pneumonia in the U.S.
“Clinicians sometimes have a bias or a preference for certain antibiotics and we may not be appropriately treating these patients with broad-spectrum antibiotics or are perhaps using antibiotics that are not as effective based on an individual patient scenario so this is definitely a user-friendly tool that hopefully can be deployed throughout other health care systems to improve the treatment of pneumonia overall,” Dr. Balls emphasized.
A version of this article first appeared on Medscape.com.
FROM THE AMERICAN JOURNAL OF RESPIRATORY AND CRITICAL CARE MEDICINE
Mild COVID-19 infection linked to later type 2 diabetes
People who recover from a mild case of COVID-19 appear to have an increased risk for subsequent new-onset type 2 diabetes but not other types of diabetes, new data suggest.
“If confirmed, the results of the present study indicate that diabetes screening in individuals who have recovered from even mild COVID-19 should be recommended,” say Wolfgang Rathmann, MD, of the Leibniz Center for Diabetes Research at Heinrich Heine University, Düsseldorf, Germany, and colleagues.
The findings, from a nationwide primary care database in Germany, were recently published in Diabetologia.
These primary care data align with those from other studies of more seriously ill patients with COVID-19 that found increased rates of type 2 diabetes diagnoses in the subsequent months following illness, they point out.
“COVID-19 infection may lead to diabetes by upregulation of the immune system after remission, which may induce pancreatic beta-cell dysfunction and insulin resistance, or patients may have been at risk for developing diabetes due to having obesity or prediabetes, and the stress COVID-19 put on their bodies sped it up,” said Dr. Rathmann in a press release.
However, because the patients with COVID-19 in the study were only followed for about 3 months, “further follow-up is needed to understand whether type 2 diabetes after mild COVID-19 is just temporary and can be reversed after they have fully recovered or whether it leads to a chronic condition,” he noted.
Increase in type 2 diabetes 3 months after mild COVID-19
The retrospective cohort analysis was performed using data from the Disease Analyzer, a representative panel of 1,171 physician practices in Germany, from March 2020 to January 2021, with follow-up through July 2021.
Individuals with a history of COVID-19 or diabetes and those taking corticosteroids within 30 days after the index dates were excluded.
A total of 35,865 patients with confirmed SARS-CoV-2 infection were propensity score-matched on a one-to-one basis for sex, age, health insurance, and comorbidities with those who had acute respiratory tract infections (controls) but were COVID-19 negative. Median follow-up was 119 days for the COVID-19 group and 161 days for controls.
There was a 28% increased risk of type 2 diabetes for those who had COVID-19 versus controls (15.8 per 1,000 person-years vs. 12.3 per 1,000 person-years, respectively, which was significantly different, and an incidence rate ratio of 1.28).
The incidence of other types of diabetes or unspecified diabetes for the COVID-19 and control groups did not differ significantly (4.3 per 1,000 person-years vs. 3.7 per 1,000 person-years; IRR, 1.17).
Similar findings were seen in sensitivity analyses by glucose-lowering medication prescriptions and by ICD-10 codes.
Although type 2 diabetes is not likely to be a problem for the vast majority of people who have mild COVID-19, the authors recommend that anyone who has recovered from COVID-19 be aware of the warning signs and symptoms such as fatigue, frequent urination, and increased thirst, and seek treatment right away.
CoviDiab registry tracking type 1 and type 2 diabetes
Over the course of the pandemic, there have been conflicting data on whether COVID-19 induces or reveals a propensity for type 1 and type 2 diabetes.
The CoviDiab global registry is tracking this and will include diabetes type for adults and children.
The aim is to have “as many as possible cases of new-onset diabetes for which we can have also a minimum set of clinical data including type of diabetes and A1c,” coprincipal investigator Francesco Rubino, MD, of King’s College London, previously told this news organization.
“By looking at this information we can infer whether a role of COVID-19 in triggering diabetes is clinically plausible – or not – and what type of diabetes is most frequently associated with COVID-19.”
Rubino said that the CoviDiab team is approaching the data with the assumption that, at least in adults diagnosed with type 2 diabetes, the explanation might be that the person already had undiagnosed diabetes or the hyperglycemia may be stress-induced and temporary.
The German Diabetes Center is funded by the German Federal Ministry of Health and the Ministry of Culture and Science of the State of North Rhine-Westphalia. Dr. Rathmann has reported receiving consulting fees for attending educational sessions or advisory boards for AstraZeneca, Boehringer Ingelheim, and Novo Nordisk and institutional research grants from Novo Nordisk outside of the topic of the current work.
A version of this article first appeared on Medscape.com.
People who recover from a mild case of COVID-19 appear to have an increased risk for subsequent new-onset type 2 diabetes but not other types of diabetes, new data suggest.
“If confirmed, the results of the present study indicate that diabetes screening in individuals who have recovered from even mild COVID-19 should be recommended,” say Wolfgang Rathmann, MD, of the Leibniz Center for Diabetes Research at Heinrich Heine University, Düsseldorf, Germany, and colleagues.
The findings, from a nationwide primary care database in Germany, were recently published in Diabetologia.
These primary care data align with those from other studies of more seriously ill patients with COVID-19 that found increased rates of type 2 diabetes diagnoses in the subsequent months following illness, they point out.
“COVID-19 infection may lead to diabetes by upregulation of the immune system after remission, which may induce pancreatic beta-cell dysfunction and insulin resistance, or patients may have been at risk for developing diabetes due to having obesity or prediabetes, and the stress COVID-19 put on their bodies sped it up,” said Dr. Rathmann in a press release.
However, because the patients with COVID-19 in the study were only followed for about 3 months, “further follow-up is needed to understand whether type 2 diabetes after mild COVID-19 is just temporary and can be reversed after they have fully recovered or whether it leads to a chronic condition,” he noted.
Increase in type 2 diabetes 3 months after mild COVID-19
The retrospective cohort analysis was performed using data from the Disease Analyzer, a representative panel of 1,171 physician practices in Germany, from March 2020 to January 2021, with follow-up through July 2021.
Individuals with a history of COVID-19 or diabetes and those taking corticosteroids within 30 days after the index dates were excluded.
A total of 35,865 patients with confirmed SARS-CoV-2 infection were propensity score-matched on a one-to-one basis for sex, age, health insurance, and comorbidities with those who had acute respiratory tract infections (controls) but were COVID-19 negative. Median follow-up was 119 days for the COVID-19 group and 161 days for controls.
There was a 28% increased risk of type 2 diabetes for those who had COVID-19 versus controls (15.8 per 1,000 person-years vs. 12.3 per 1,000 person-years, respectively, which was significantly different, and an incidence rate ratio of 1.28).
The incidence of other types of diabetes or unspecified diabetes for the COVID-19 and control groups did not differ significantly (4.3 per 1,000 person-years vs. 3.7 per 1,000 person-years; IRR, 1.17).
Similar findings were seen in sensitivity analyses by glucose-lowering medication prescriptions and by ICD-10 codes.
Although type 2 diabetes is not likely to be a problem for the vast majority of people who have mild COVID-19, the authors recommend that anyone who has recovered from COVID-19 be aware of the warning signs and symptoms such as fatigue, frequent urination, and increased thirst, and seek treatment right away.
CoviDiab registry tracking type 1 and type 2 diabetes
Over the course of the pandemic, there have been conflicting data on whether COVID-19 induces or reveals a propensity for type 1 and type 2 diabetes.
The CoviDiab global registry is tracking this and will include diabetes type for adults and children.
The aim is to have “as many as possible cases of new-onset diabetes for which we can have also a minimum set of clinical data including type of diabetes and A1c,” coprincipal investigator Francesco Rubino, MD, of King’s College London, previously told this news organization.
“By looking at this information we can infer whether a role of COVID-19 in triggering diabetes is clinically plausible – or not – and what type of diabetes is most frequently associated with COVID-19.”
Rubino said that the CoviDiab team is approaching the data with the assumption that, at least in adults diagnosed with type 2 diabetes, the explanation might be that the person already had undiagnosed diabetes or the hyperglycemia may be stress-induced and temporary.
The German Diabetes Center is funded by the German Federal Ministry of Health and the Ministry of Culture and Science of the State of North Rhine-Westphalia. Dr. Rathmann has reported receiving consulting fees for attending educational sessions or advisory boards for AstraZeneca, Boehringer Ingelheim, and Novo Nordisk and institutional research grants from Novo Nordisk outside of the topic of the current work.
A version of this article first appeared on Medscape.com.
People who recover from a mild case of COVID-19 appear to have an increased risk for subsequent new-onset type 2 diabetes but not other types of diabetes, new data suggest.
“If confirmed, the results of the present study indicate that diabetes screening in individuals who have recovered from even mild COVID-19 should be recommended,” say Wolfgang Rathmann, MD, of the Leibniz Center for Diabetes Research at Heinrich Heine University, Düsseldorf, Germany, and colleagues.
The findings, from a nationwide primary care database in Germany, were recently published in Diabetologia.
These primary care data align with those from other studies of more seriously ill patients with COVID-19 that found increased rates of type 2 diabetes diagnoses in the subsequent months following illness, they point out.
“COVID-19 infection may lead to diabetes by upregulation of the immune system after remission, which may induce pancreatic beta-cell dysfunction and insulin resistance, or patients may have been at risk for developing diabetes due to having obesity or prediabetes, and the stress COVID-19 put on their bodies sped it up,” said Dr. Rathmann in a press release.
However, because the patients with COVID-19 in the study were only followed for about 3 months, “further follow-up is needed to understand whether type 2 diabetes after mild COVID-19 is just temporary and can be reversed after they have fully recovered or whether it leads to a chronic condition,” he noted.
Increase in type 2 diabetes 3 months after mild COVID-19
The retrospective cohort analysis was performed using data from the Disease Analyzer, a representative panel of 1,171 physician practices in Germany, from March 2020 to January 2021, with follow-up through July 2021.
Individuals with a history of COVID-19 or diabetes and those taking corticosteroids within 30 days after the index dates were excluded.
A total of 35,865 patients with confirmed SARS-CoV-2 infection were propensity score-matched on a one-to-one basis for sex, age, health insurance, and comorbidities with those who had acute respiratory tract infections (controls) but were COVID-19 negative. Median follow-up was 119 days for the COVID-19 group and 161 days for controls.
There was a 28% increased risk of type 2 diabetes for those who had COVID-19 versus controls (15.8 per 1,000 person-years vs. 12.3 per 1,000 person-years, respectively, which was significantly different, and an incidence rate ratio of 1.28).
The incidence of other types of diabetes or unspecified diabetes for the COVID-19 and control groups did not differ significantly (4.3 per 1,000 person-years vs. 3.7 per 1,000 person-years; IRR, 1.17).
Similar findings were seen in sensitivity analyses by glucose-lowering medication prescriptions and by ICD-10 codes.
Although type 2 diabetes is not likely to be a problem for the vast majority of people who have mild COVID-19, the authors recommend that anyone who has recovered from COVID-19 be aware of the warning signs and symptoms such as fatigue, frequent urination, and increased thirst, and seek treatment right away.
CoviDiab registry tracking type 1 and type 2 diabetes
Over the course of the pandemic, there have been conflicting data on whether COVID-19 induces or reveals a propensity for type 1 and type 2 diabetes.
The CoviDiab global registry is tracking this and will include diabetes type for adults and children.
The aim is to have “as many as possible cases of new-onset diabetes for which we can have also a minimum set of clinical data including type of diabetes and A1c,” coprincipal investigator Francesco Rubino, MD, of King’s College London, previously told this news organization.
“By looking at this information we can infer whether a role of COVID-19 in triggering diabetes is clinically plausible – or not – and what type of diabetes is most frequently associated with COVID-19.”
Rubino said that the CoviDiab team is approaching the data with the assumption that, at least in adults diagnosed with type 2 diabetes, the explanation might be that the person already had undiagnosed diabetes or the hyperglycemia may be stress-induced and temporary.
The German Diabetes Center is funded by the German Federal Ministry of Health and the Ministry of Culture and Science of the State of North Rhine-Westphalia. Dr. Rathmann has reported receiving consulting fees for attending educational sessions or advisory boards for AstraZeneca, Boehringer Ingelheim, and Novo Nordisk and institutional research grants from Novo Nordisk outside of the topic of the current work.
A version of this article first appeared on Medscape.com.
FROM DIABETOLOGIA
WHO issues new TB guidelines for children and adolescents
The World Health Organization now recommends shortened treatment for children with mild tuberculosis, as well as two oral TB treatments (bedaquiline and delamanid) for use in children of all ages. The updated guidelines for TB management in children and adolescents were announced March 21 ahead of World Tuberculosis Day on March 24.
The agency also called for increased investment in global TB programs, noting that in 2020, TB deaths increased for the first time in over a decade. “We cannot falter in our commitment to reach and save every man, woman, child, family, and community impacted by this deadly disease,” said Tereza Kasaeva, MD, PhD, director of the WHO Global Tuberculosis Programme during a press conference.
TB is the 13th-leading cause of death and the second top infectious killer after COVID-19, with more than 4,100 people dying from TB every day. WHO estimates that 1.1 million children fall ill with TB each year.
Calls for investment
The increase in TB deaths from 1.4 million in 2019 to 1.5 million in 2020 was coupled with a decrease in funding. From 2019-2020, global spending for TB diagnostic, treatment, and prevention services fell from $5.8 billion to $5.3 billion. This is less than half of the $13 billion target funding amount for 2022, Dr. Kasaeva said.
Efforts to expand access to TB care have fallen short mainly because of this lack of funding, especially for children. In 2020, about 63% of children under 15 years of age with TB either did not receive or were not reported to have access to TB diagnosis and treatment services, which rose to 72% in children under age 5. Almost two-thirds of children under age 5 also did not receive TB preventive treatment in 2022, according to WHO statistics.
The socioeconomic ramifications of the COVID-19 pandemic as well as ongoing conflict in Eastern Europe, Africa, and the Middle East have “further exacerbated the situation,” Dr. Kasaeva said. “This conveys the urgent need to dramatically increase investments to ramp up the fight against TB and achieve commitments to end TB made by global leaders.”
Dr. Kasaeva laid out WHO’s main points for global investment in TB care:
- Increase domestic and international funding to close gaps in TB research and program implementation. For countries with smaller economies, increased international investment will be necessary in the short or medium term to help regain progress.
- Double funding for TB research, including vaccines.
- Invest in sustaining TB programs and services during the COVID-19 pandemic and ongoing crises so care is not disrupted.
New guidelines
Dr. Kasaeva also noted that adoption of WHO’s new guidelines for children and adolescents should be fast-tracked to improve access to and quality of care. The updates include:
- Rapid molecular tests called Xpert Ultra should be used as the initial test for TB in children and adolescents.
- Diagnostic testing can now include noninvasive specimens, like stool samples.
- Children with mild TB can be treated with a , rather than 6 months. This shortened regimen will allow children to return to school faster and save money for families and the health care system, said Kerri Viney, MD, PhD, a team lead for the WHO Tuberculosis Programme, with a focus on vulnerable populations, including children. She presented the new guidelines during the WHO press conference.
- The recommended treatment regimen for TB meningitis has also been shortened from 12 to 6 months.
Two oral medications for drug-resistant TB (bedaquiline and delamanid) are now recommended for use in children of all ages. “There is no longer a need for painful injections that can have serious side effects, including deafness,” Dr. Viney said.
Health systems should develop new models of decentralized and integrated TB care to bring TB care closer to where children live.
The guidelines are available on the WHO website.
“The WHO guidelines issued today are a game changer for children and adolescents with TB,” Dr. Kasaeva said. The next step is assisting countries in implementing these updates so that children and adolescents globally have access to high quality TB care,” Dr. Viney added. “We have the policy recommendations. We have the implementation guidance, we have child-friendly formulations of TB medicines,” she said. “Let us not wait any longer. Let us invest to end TB in children and adolescents.”
A version of this article first appeared on Medscape.com.
The World Health Organization now recommends shortened treatment for children with mild tuberculosis, as well as two oral TB treatments (bedaquiline and delamanid) for use in children of all ages. The updated guidelines for TB management in children and adolescents were announced March 21 ahead of World Tuberculosis Day on March 24.
The agency also called for increased investment in global TB programs, noting that in 2020, TB deaths increased for the first time in over a decade. “We cannot falter in our commitment to reach and save every man, woman, child, family, and community impacted by this deadly disease,” said Tereza Kasaeva, MD, PhD, director of the WHO Global Tuberculosis Programme during a press conference.
TB is the 13th-leading cause of death and the second top infectious killer after COVID-19, with more than 4,100 people dying from TB every day. WHO estimates that 1.1 million children fall ill with TB each year.
Calls for investment
The increase in TB deaths from 1.4 million in 2019 to 1.5 million in 2020 was coupled with a decrease in funding. From 2019-2020, global spending for TB diagnostic, treatment, and prevention services fell from $5.8 billion to $5.3 billion. This is less than half of the $13 billion target funding amount for 2022, Dr. Kasaeva said.
Efforts to expand access to TB care have fallen short mainly because of this lack of funding, especially for children. In 2020, about 63% of children under 15 years of age with TB either did not receive or were not reported to have access to TB diagnosis and treatment services, which rose to 72% in children under age 5. Almost two-thirds of children under age 5 also did not receive TB preventive treatment in 2022, according to WHO statistics.
The socioeconomic ramifications of the COVID-19 pandemic as well as ongoing conflict in Eastern Europe, Africa, and the Middle East have “further exacerbated the situation,” Dr. Kasaeva said. “This conveys the urgent need to dramatically increase investments to ramp up the fight against TB and achieve commitments to end TB made by global leaders.”
Dr. Kasaeva laid out WHO’s main points for global investment in TB care:
- Increase domestic and international funding to close gaps in TB research and program implementation. For countries with smaller economies, increased international investment will be necessary in the short or medium term to help regain progress.
- Double funding for TB research, including vaccines.
- Invest in sustaining TB programs and services during the COVID-19 pandemic and ongoing crises so care is not disrupted.
New guidelines
Dr. Kasaeva also noted that adoption of WHO’s new guidelines for children and adolescents should be fast-tracked to improve access to and quality of care. The updates include:
- Rapid molecular tests called Xpert Ultra should be used as the initial test for TB in children and adolescents.
- Diagnostic testing can now include noninvasive specimens, like stool samples.
- Children with mild TB can be treated with a , rather than 6 months. This shortened regimen will allow children to return to school faster and save money for families and the health care system, said Kerri Viney, MD, PhD, a team lead for the WHO Tuberculosis Programme, with a focus on vulnerable populations, including children. She presented the new guidelines during the WHO press conference.
- The recommended treatment regimen for TB meningitis has also been shortened from 12 to 6 months.
Two oral medications for drug-resistant TB (bedaquiline and delamanid) are now recommended for use in children of all ages. “There is no longer a need for painful injections that can have serious side effects, including deafness,” Dr. Viney said.
Health systems should develop new models of decentralized and integrated TB care to bring TB care closer to where children live.
The guidelines are available on the WHO website.
“The WHO guidelines issued today are a game changer for children and adolescents with TB,” Dr. Kasaeva said. The next step is assisting countries in implementing these updates so that children and adolescents globally have access to high quality TB care,” Dr. Viney added. “We have the policy recommendations. We have the implementation guidance, we have child-friendly formulations of TB medicines,” she said. “Let us not wait any longer. Let us invest to end TB in children and adolescents.”
A version of this article first appeared on Medscape.com.
The World Health Organization now recommends shortened treatment for children with mild tuberculosis, as well as two oral TB treatments (bedaquiline and delamanid) for use in children of all ages. The updated guidelines for TB management in children and adolescents were announced March 21 ahead of World Tuberculosis Day on March 24.
The agency also called for increased investment in global TB programs, noting that in 2020, TB deaths increased for the first time in over a decade. “We cannot falter in our commitment to reach and save every man, woman, child, family, and community impacted by this deadly disease,” said Tereza Kasaeva, MD, PhD, director of the WHO Global Tuberculosis Programme during a press conference.
TB is the 13th-leading cause of death and the second top infectious killer after COVID-19, with more than 4,100 people dying from TB every day. WHO estimates that 1.1 million children fall ill with TB each year.
Calls for investment
The increase in TB deaths from 1.4 million in 2019 to 1.5 million in 2020 was coupled with a decrease in funding. From 2019-2020, global spending for TB diagnostic, treatment, and prevention services fell from $5.8 billion to $5.3 billion. This is less than half of the $13 billion target funding amount for 2022, Dr. Kasaeva said.
Efforts to expand access to TB care have fallen short mainly because of this lack of funding, especially for children. In 2020, about 63% of children under 15 years of age with TB either did not receive or were not reported to have access to TB diagnosis and treatment services, which rose to 72% in children under age 5. Almost two-thirds of children under age 5 also did not receive TB preventive treatment in 2022, according to WHO statistics.
The socioeconomic ramifications of the COVID-19 pandemic as well as ongoing conflict in Eastern Europe, Africa, and the Middle East have “further exacerbated the situation,” Dr. Kasaeva said. “This conveys the urgent need to dramatically increase investments to ramp up the fight against TB and achieve commitments to end TB made by global leaders.”
Dr. Kasaeva laid out WHO’s main points for global investment in TB care:
- Increase domestic and international funding to close gaps in TB research and program implementation. For countries with smaller economies, increased international investment will be necessary in the short or medium term to help regain progress.
- Double funding for TB research, including vaccines.
- Invest in sustaining TB programs and services during the COVID-19 pandemic and ongoing crises so care is not disrupted.
New guidelines
Dr. Kasaeva also noted that adoption of WHO’s new guidelines for children and adolescents should be fast-tracked to improve access to and quality of care. The updates include:
- Rapid molecular tests called Xpert Ultra should be used as the initial test for TB in children and adolescents.
- Diagnostic testing can now include noninvasive specimens, like stool samples.
- Children with mild TB can be treated with a , rather than 6 months. This shortened regimen will allow children to return to school faster and save money for families and the health care system, said Kerri Viney, MD, PhD, a team lead for the WHO Tuberculosis Programme, with a focus on vulnerable populations, including children. She presented the new guidelines during the WHO press conference.
- The recommended treatment regimen for TB meningitis has also been shortened from 12 to 6 months.
Two oral medications for drug-resistant TB (bedaquiline and delamanid) are now recommended for use in children of all ages. “There is no longer a need for painful injections that can have serious side effects, including deafness,” Dr. Viney said.
Health systems should develop new models of decentralized and integrated TB care to bring TB care closer to where children live.
The guidelines are available on the WHO website.
“The WHO guidelines issued today are a game changer for children and adolescents with TB,” Dr. Kasaeva said. The next step is assisting countries in implementing these updates so that children and adolescents globally have access to high quality TB care,” Dr. Viney added. “We have the policy recommendations. We have the implementation guidance, we have child-friendly formulations of TB medicines,” she said. “Let us not wait any longer. Let us invest to end TB in children and adolescents.”
A version of this article first appeared on Medscape.com.
Oxygen Therapies and Clinical Outcomes for Patients Hospitalized With COVID-19: First Surge vs Second Surge
From Lahey Hospital and Medical Center, Burlington, MA (Drs. Liesching and Lei), and Tufts University School of Medicine, Boston, MA (Dr. Liesching)
ABSTRACT
Objective: To compare the utilization of oxygen therapies and clinical outcomes of patients admitted for COVID-19 during the second surge of the pandemic to that of patients admitted during the first surge.
Design: Observational study using a registry database.
Setting: Three hospitals (791 inpatient beds and 76 intensive care unit [ICU] beds) within the Beth Israel Lahey Health system in Massachusetts.
Participants: We included 3183 patients with COVID-19 admitted to hospitals.
Measurements: Baseline data included demographics and comorbidities. Treatments included low-flow supplemental oxygen (2-6 L/min), high-flow oxygen via nasal cannula, and invasive mechanical ventilation. Outcomes included ICU admission, length of stay, ventilator days, and mortality.
Results: A total of 3183 patients were included: 1586 during the first surge and 1597 during the second surge. Compared to the first surge, patients admitted during the second surge had a similar rate of receiving low-flow supplemental oxygen (65.8% vs 64.1%, P = .3), a higher rate of receiving high-flow nasal cannula (15.4% vs 10.8%, P = .0001), and a lower ventilation rate (5.6% vs 9.7%, P < .0001). The outcomes during the second surge were better than those during the first surge: lower ICU admission rate (8.1% vs 12.7%, P < .0001), shorter length of hospital stay (5 vs 6 days, P < .0001), fewer ventilator days (10 vs 16, P = .01), and lower mortality (8.3% vs 19.2%, P < .0001). Among ventilated patients, those who received high-flow nasal cannula had lower mortality.
Conclusion: Compared to the first surge of the COVID-19 pandemic, patients admitted during the second surge had similar likelihood of receiving low-flow supplemental oxygen, were more likely to receive high-flow nasal cannula, were less likely to be ventilated, and had better outcomes.
Keywords: supplemental oxygen, high-flow nasal cannula, ventilator.
The respiratory system receives the major impact of SARS-CoV-2 virus, and hypoxemia has been the predominant diagnosis for patients hospitalized with COVID-19.1,2 During the initial stage of the pandemic, oxygen therapies and mechanical ventilation were the only choices for these patients.3-6 Standard-of-care treatment for patients with COVID-19 during the initial surge included oxygen therapies and mechanical ventilation for hypoxemia and medications for comorbidities and COVID-19–associated sequelae, such as multi-organ dysfunction and failure. A report from New York during the first surge (May 2020) showed that among 5700 hospitalized patients with COVID-19, 27.8% received supplemental oxygen and 12.2% received invasive mechanical ventilation.7 High-flow nasal cannula (HFNC) oxygen delivery has been utilized widely throughout the pandemic due to its superiority over other noninvasive respiratory support techniques.8-12 Mechanical ventilation is always necessary for critically ill patients with acute respiratory distress syndrome. However, ventilator scarcity has become a bottleneck in caring for severely ill patients with COVID-19 during the pandemic.13
The clinical outcomes of hospitalized COVID-19 patients include a high intubation rate, long length of hospital and intensive care unit (ICU) stay, and high mortality.14,15 As the pandemic evolved, new medications, including remdesivir, hydroxychloroquine, lopinavir, or interferon β-1a, were used in addition to the standard of care, but these did not result in significantly different mortality from standard of care.16 Steroids are becoming foundational to the treatment of severe COVID-19 pneumonia, but evidence from high-quality randomized controlled clinical trials is lacking.17
During the first surge from March to May 2020, Massachusetts had the third highest number of COVID-19 cases among states in the United States.18 In early 2021, COVID-19 cases were climbing close to the peak of the second surge in Massachusetts. In this study, we compared utilization of low-flow supplemental oxygen, HFNC, and mechanical ventilation and clinical outcomes of patients admitted to 3 hospitals in Massachusetts during the second surge of the pandemic to that of patients admitted during the first surge.
Methods
Setting
Beth Israel Lahey Health is a system of academic and teaching hospitals with primary care and specialty care providers. We included 3 centers within the Beth Israel Lahey Health system in Massachusetts: Lahey Hospital and Medical Center, with 335 inpatient hospital beds and 52 critical care beds; Beverly Hospital, with 227 beds and 14 critical care beds; and Winchester Hospital, with 229 beds and 10 ICU beds.
Participants
We included patients admitted to the 3 hospitals with COVID-19 as a primary or secondary diagnosis during the first surge of the pandemic (March 1, 2020 to June 15, 2020) and the second surge (November 15, 2020 to January 27, 2021). The timeframe of the first surge was defined as the window between the start date and the end date of data collection. During the time window of the first surge, 1586 patients were included. The start time of the second surge was defined as the date when the data collection was restarted; the end date was set when the number of patients (1597) accumulated was close to the number of patients in the first surge (1586), so that the two groups had similar sample size.
Study Design
A data registry of COVID-19 patients was created by our institution, and the data were prospectively collected starting in March 2020. We retrospectively extracted data on the following from the registry database for this observational study: demographics and baseline comorbidities; the use of low-flow supplemental oxygen, HFNC, and invasive mechanical ventilator; and ICU admission, length of hospital stay, length of ICU stay, and hospital discharge disposition. Start and end times for each oxygen therapy were not entered in the registry. Data about other oxygen therapies, such as noninvasive positive-pressure ventilation, were not collected in the registry database, and therefore were not included in the analysis.
Statistical Analysis
Continuous variables (eg, age) were tested for data distribution normality using the Shapiro-Wilk test. Normally distributed data were tested using unpaired t-tests and displayed as mean (SD). The skewed data were tested using the Wilcoxon rank sum test and displayed as median (interquartile range [IQR]). The categorical variables were compared using chi-square test. Comparisons with P ≤ .05 were considered significantly different. Statistical analysis for this study was generated using Statistical Analysis Software (SAS), version 9.4 for Windows (SAS Institute Inc.).
Results
Baseline Characteristics
We included 3183 patients: 1586 admitted during the first surge and 1597 admitted during the second surge. Baseline characteristics of patients with COVID-19 admitted during the first and second surges are shown in Table 1. Patients admitted during the second surge were older (73 years vs 71 years, P = .01) and had higher rates of hypertension (64.8% vs 59.6%, P = .003) and asthma (12.9% vs 10.7%, P = .049) but a lower rate of interstitial lung disease (3.3% vs 7.7%, P < .001). Sequential organ failure assessment scores at admission and the rates of other comorbidities were not significantly different between the 2 surges.

Oxygen Therapies
The number of patients who were hospitalized and received low-flow supplemental oxygen, and/or HFNC, and/or ventilator in the first surge and the second surge is shown in the Figure. Of all patients included, 2067 (64.9%) received low-flow supplemental oxygen; of these, 374 (18.1%) subsequently received HFNC, and 85 (22.7%) of these subsequently received mechanical ventilation. Of all 3183 patients, 417 (13.1%) received HFNC; 43 of these patients received HFNC without receiving low-flow supplemental oxygen, and 98 (23.5%) subsequently received mechanical ventilation. Out of all 3183 patients, 244 (7.7%) received mechanical ventilation; 98 (40.2%) of these received HFNC while the remaining 146 (59.8%) did not. At the beginning of the first surge, the ratio of patients who received invasive mechanical ventilation to patients who received HFNC was close to 1:1 (10/10); the ratio decreased to 6:10 in May and June 2020. At the beginning of the second surge, the ratio was 8:10 and then decreased to 3:10 in December 2020 and January 2021.
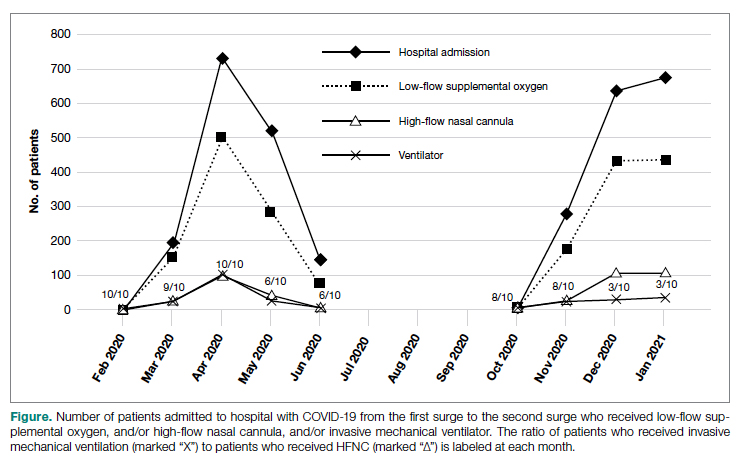
As shown in Table 2, the proportion of patients who received low-flow supplemental oxygen during the second surge was similar to that during the first surge (65.8% vs 64.1%, P = .3). Patients admitted during the second surge were more likely to receive HFNC than patients admitted during the first surge (15.4% vs 10.8%, P = .0001). Patients admitted during the second surge were less likely to be ventilated than the patients admitted during the first surge (5.6% vs 9.7%, P < .0001).
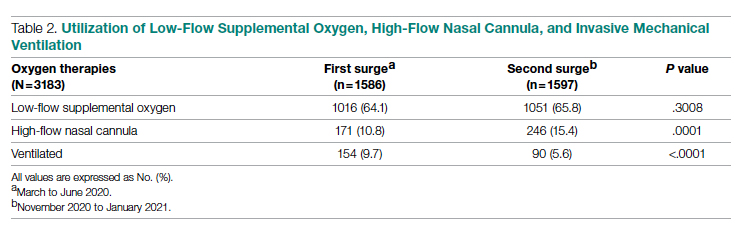
Clinical Outcomes
As shown in Table 3, second surge outcomes were much better than first surge outcomes: the ICU admission rate was lower (8.1% vs 12.7%, P < .0001); patients were more likely to be discharged to home (60.2% vs 47.4%, P < .0001), had a shorter length of hospital stay (5 vs 6 days, P < .0001), and had fewer ventilator days (10 vs 16, P = .01); and mortality was lower (8.3% vs 19.2%, P < .0001). There was a trend that length of ICU stay was shorter during the second surge than during the first surge (7 days vs 9 days, P = .09).
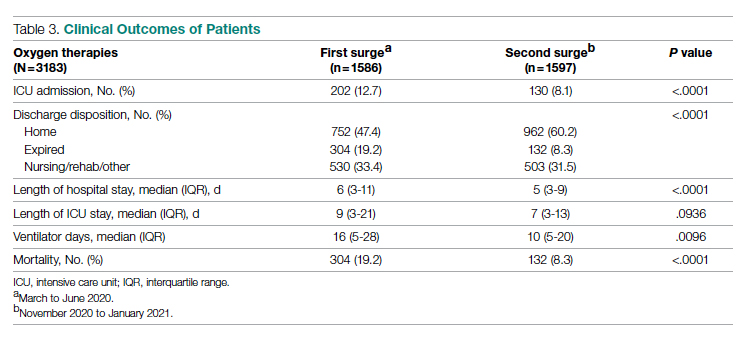
As noted (Figure), the ratio of patients who received invasive mechanical ventilation to patients who received HFNC was decreasing during both the first surge and the second surge. To further analyze the relation between ventilator and HFNC, we performed a subgroup analysis for 244 ventilated patients during both surges to compare outcomes between patients who received HFNC and those who did not receive HFNC (Table 4). Ninety-eight (40%) patients received HFNC. Ventilated patients who received HFNC had lower mortality than those patients who did not receive HFNC (31.6% vs 48%, P = .01), but had a longer length of hospital stay (29 days vs 14 days, P < .0001), longer length of ICU stay (17 days vs 9 days, P < .0001), and a higher number of ventilator days (16 vs 11, P = .001).
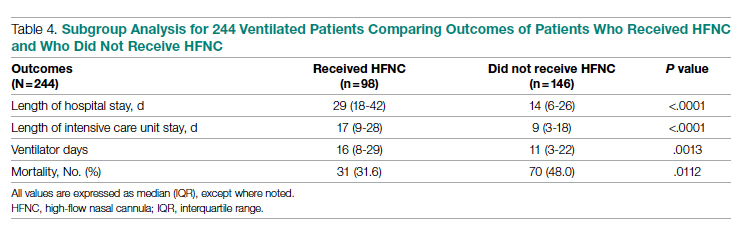
Discussion
Our study compared the baseline patient characteristics; utilization of low-flow supplemental oxygen therapy, HFNC, and mechanical ventilation; and clinical outcomes between the first surge (n = 1586) and the second surge (n = 1597) of the COVID-19 pandemic. During both surges, about two-thirds of admitted patients received low-flow supplemental oxygen. A higher proportion of the admitted patients received HFNC during the second surge than during the first surge, while the intubation rate was lower during the second surge than during the first surge.
Reported low-flow supplemental oxygen use ranged from 28% to 63% depending on the cohort characteristics and location during the first surge.6,7,19 A report from New York during the first surge (March 1 to April 4, 2020) showed that among 5700 hospitalized patients with COVID-19, 27.8% received low-flow supplemental oxygen.7 HFNC is recommended in guidelines on management of patients with acute respiratory failure due to COVID-19.20 In our study, HFNC was utilized in a higher proportion of patients admitted for COVID-19 during the second surge (15.5% vs 10.8%, P = .0001). During the early pandemic period in Wuhan, China, 11% to 21% of admitted COVID-19 patients received HFNC.21,22 Utilization of HFNC in New York during the first surge (March to May 2020) varied from 5% to 14.3% of patients admitted with COVID-19.23,24 Our subgroup analysis of the ventilated patients showed that patients who received HFNC had lower mortality than those who did not (31.6% vs 48.0%, P = .011). Comparably, a report from Paris, France, showed that among patients admitted to ICUs for acute hypoxemic respiratory failure, those who received HFNC had lower mortality at day 60 than those who did not (21% vs 31%, P = .052).25 Our recent analysis showed that patients treated with HFNC prior to mechanical ventilation had lower mortality than those treated with only conventional oxygen (30% vs 52%, P = .05).26 In this subgroup analysis, we could not determine if HFNC treatment was administered before or after ventilation because HFNC was entered as dichotomous data (“Yes” or “No”) in the registry database. We merely showed the beneficial effect of HFNC on reducing mortality for ventilated COVID-19 patients, but did not mean to focus on how and when to apply HFNC.
We observed that the patients admitted during the second surge were less likely to be ventilated than the patients admitted during the first surge (5.6% vs 9.7%, P < .0001). During the first surge in New York, among 5700 patients admitted with COVID-19, 12.2% received invasive mechanical ventilation.7 In another report, also from New York during the first surge, 26.1% of 2015 hospitalized COVID-19 patients received mechanical ventilation.27 In our study, the ventilation rate of 9.7% during the first surge was lower.
Outcomes during the second surge were better than during the first surge, including ICU admission rate, hospital and ICU length of stay, ventilator days, and mortality. The mortality was 19.2% during the first surge vs 8.3% during the second surge (P < .0001). The mortality of 19.2% was lower than the 30.6% mortality reported for 2015 hospitalized COVID-19 patients in New York during the first surge.27 A retrospective study showed that early administration of remdesivir was associated with reduced ICU admission, ventilation use, and mortality.28 The RECOVERY clinical trial showed that dexamethasone improved mortality for COVID-19 patients who received respiratory support, but not for patients who did not receive any respiratory support.29 Perhaps some, if not all, of the improvement in ICU admission and mortality during the second surge was attributed to the new medications, such as antivirals and steroids.
The length of hospital stay for patients with moderate to severe COVID-19 varied from 4 to 53 days at different locations of the world, as shown in a meta-analysis by Rees and colleagues.30 Our results showing a length of stay of 6 days during the first surge and 5 days during the second surge fell into the shorter end of this range. In a retrospective analysis of 1643 adults with severe COVID-19 admitted to hospitals in New York City between March 9, 2020 and April 23, 2020, median hospital length of stay was 7 (IQR, 3-14) days.31 For the ventilated patients in our study, the length of stay of 14 days (did not receive HFNC) and 29 days (received HFNC) was much longer. This longer length of stay might be attributed to the patients in our study being older and having more severe comorbidities.
The main purpose of this study was to compare the oxygen therapies and outcomes between 2 surges. It is difficult to associate the clinical outcomes with the oxygen therapies because new therapies and medications were available after the first surge. It was not possible to adjust the outcomes with confounders (other therapies and medications) because the registry data did not include the new therapies and medications.
A strength of this study was that we included a large, balanced number of patients in the first surge and the second surge. We did not plan the sample size in both groups as we could not predict the number of admissions. We set the end date of data collection for analysis as the time when the number of patients admitted during the second surge was similar to the number of patients admitted during the first surge. A limitation was that the registry database was created by the institution and was not designed solely for this study. The data for oxygen therapies were limited to low-flow supplemental oxygen, HFNC, and invasive mechanical ventilation; data for noninvasive ventilation were not included.
Conclusion
At our centers, during the second surge of COVID-19 pandemic, patients hospitalized with COVID-19 infection were more likely to receive HFNC but less likely to be ventilated. Compared to the first surge, the hospitalized patients with COVID-19 infection had a lower ICU admission rate, shorter length of hospital stay, fewer ventilator days, and lower mortality. For ventilated patients, those who received HFNC had lower mortality than those who did not.
Corresponding author: Timothy N. Liesching, MD, 41 Mall Road, Burlington, MA 01805; [email protected]
Disclosures: None reported.
doi:10.12788/jcom.0086
1. Xie J, Covassin N, Fan Z, et al. Association between hypoxemia and mortality in patients with COVID-19. Mayo Clin Proc. 2020;95(6):1138-1147. doi:10.1016/j.mayocp.2020.04.006
2. Asleh R, Asher E, Yagel O, et al. Predictors of hypoxemia and related adverse outcomes in patients hospitalized with COVID-19: a double-center retrospective study. J Clin Med. 2021;10(16):3581. doi:10.3390/jcm10163581
3. Choi KJ, Hong HL, Kim EJ. Association between oxygen saturation/fraction of inhaled oxygen and mortality in patients with COVID-19 associated pneumonia requiring oxygen therapy. Tuberc Respir Dis (Seoul). 2021;84(2):125-133. doi:10.4046/trd.2020.0126
4. Dixit SB. Role of noninvasive oxygen therapy strategies in COVID-19 patients: Where are we going? Indian J Crit Care Med. 2020;24(10):897-898. doi:10.5005/jp-journals-10071-23625
5. Gonzalez-Castro A, Fajardo Campoverde A, Medina A, et al. Non-invasive mechanical ventilation and high-flow oxygen therapy in the COVID-19 pandemic: the value of a draw. Med Intensiva (Engl Ed). 2021;45(5):320-321. doi:10.1016/j.medine.2021.04.001
6. Pan W, Li J, Ou Y, et al. Clinical outcome of standardized oxygen therapy nursing strategy in COVID-19. Ann Palliat Med. 2020;9(4):2171-2177. doi:10.21037/apm-20-1272
7. Richardson S, Hirsch JS, Narasimhan M, et al. Presenting characteristics, comorbidities, and outcomes among 5700 patients hospitalized with COVID-19 in the New York City area. JAMA. 2020;323(20):2052-2059. doi:10.1001/jama.2020.6775
8. He G, Han Y, Fang Q, et al. Clinical experience of high-flow nasal cannula oxygen therapy in severe COVID-19 patients. Article in Chinese. Zhejiang Da Xue Xue Bao Yi Xue Ban. 2020;49(2):232-239. doi:10.3785/j.issn.1008-9292.2020.03.13
9. Lalla U, Allwood BW, Louw EH, et al. The utility of high-flow nasal cannula oxygen therapy in the management of respiratory failure secondary to COVID-19 pneumonia. S Afr Med J. 2020;110(6):12941.
10. Zhang TT, Dai B, Wang W. Should the high-flow nasal oxygen therapy be used or avoided in COVID-19? J Transl Int Med. 2020;8(2):57-58. doi:10.2478/jtim-2020-0018
11. Agarwal A, Basmaji J, Muttalib F, et al. High-flow nasal cannula for acute hypoxemic respiratory failure in patients with COVID-19: systematic reviews of effectiveness and its risks of aerosolization, dispersion, and infection transmission. Can J Anaesth. 2020;67(9):1217-1248. doi:10.1007/s12630-020-01740-2
12. Geng S, Mei Q, Zhu C, et al. High flow nasal cannula is a good treatment option for COVID-19. Heart Lung. 2020;49(5):444-445. doi:10.1016/j.hrtlng.2020.03.018
13. Feinstein MM, Niforatos JD, Hyun I, et al. Considerations for ventilator triage during the COVID-19 pandemic. Lancet Respir Med. 2020;8(6):e53. doi:10.1016/S2213-2600(20)30192-2
14. Wu Z, McGoogan JM. Characteristics of and important lessons from the coronavirus disease 2019 (COVID-19) outbreak in China: summary of a report of 72314 cases from the Chinese Center for Disease Control and Prevention. JAMA. 2020;323(13):1239-1242. doi:10.1001/jama.2020.2648
15. Rojas-Marte G, Hashmi AT, Khalid M, et al. Outcomes in patients with COVID-19 disease and high oxygen requirements. J Clin Med Res. 2021;13(1):26-37. doi:10.14740/jocmr4405
16. Zhang R, Mylonakis E. In inpatients with COVID-19, none of remdesivir, hydroxychloroquine, lopinavir, or interferon β-1a differed from standard care for in-hospital mortality. Ann Intern Med. 2021;174(2):JC17. doi:10.7326/ACPJ202102160-017
17. Rello J, Waterer GW, Bourdiol A, Roquilly A. COVID-19, steroids and other immunomodulators: The jigsaw is not complete. Anaesth Crit Care Pain Med. 2020;39(6):699-701. doi:10.1016/j.accpm.2020.10.011
18. Dargin J, Stempek S, Lei Y, Gray Jr. A, Liesching T. The effect of a tiered provider staffing model on patient outcomes during the coronavirus disease 2019 pandemic: A single-center observational study. Int J Crit Illn Inj Sci. 2021;11(3). doi:10.4103/ijciis.ijciis_37_21
19. Ni YN, Wang T, Liang BM, Liang ZA. The independent factors associated with oxygen therapy in COVID-19 patients under 65 years old. PLoS One. 2021;16(1):e0245690. doi:10.1371/journal.pone.0245690
20. Alhazzani W, Moller MH, Arabi YM, et al. Surviving Sepsis Campaign: guidelines on the management of critically ill adults with coronavirus disease 2019 (COVID-19). Crit Care Med. 2020;48(6):e440-e469. doi:10.1097/CCM.0000000000004363
21. Wang D, Hu B, Hu C, et al. Clinical characteristics of 138 hospitalized patients with 2019 novel coronavirus-infected pneumonia in Wuhan, China. JAMA. 2020;323(11):1061-1069. doi:10.1001/jama.2020.1585
22. Zhou F, Yu T, Du R, et al. Clinical course and risk factors for mortality of adult inpatients with COVID-19 in Wuhan, China: a retrospective cohort study. Lancet. 2020;395(10229):1054-1062. doi:10.1016/S0140-6736(20)30566-3
23. Argenziano MG, Bruce SL, Slater CL, et al. Characterization and clinical course of 1000 patients with coronavirus disease 2019 in New York: retrospective case series. BMJ. 2020;369:m1996. doi:10.1136/bmj.m1996
24. Cummings MJ, Baldwin MR, Abrams D, et al. Epidemiology, clinical course, and outcomes of critically ill adults with COVID-19 in New York City: a prospective cohort study. Lancet. 2020;395(10239):1763-1770. doi:10.1016/S0140-6736(20)31189-2
25. Demoule A, Vieillard Baron A, Darmon M, et al. High-flow nasal cannula in critically ill patients with severe COVID-19. Am J Respir Crit Care Med. 2020;202(7):1039-1042. doi:10.1164/rccm.202005-2007LE
26. Hansen CK, Stempek S, Liesching T, Lei Y, Dargin J. Characteristics and outcomes of patients receiving high flow nasal cannula therapy prior to mechanical ventilation in COVID-19 respiratory failure: a prospective observational study. Int J Crit Illn Inj Sci. 2021;11(2):56-60. doi:10.4103/IJCIIS.IJCIIS_181_20
27. van Gerwen M, Alsen M, Little C, et al. Risk factors and outcomes of COVID-19 in New York City; a retrospective cohort study. J Med Virol. 2021;93(2):907-915. doi:10.1002/jmv.26337
28. Hussain Alsayed HA, Saheb Sharif-Askari F, Saheb Sharif-Askari N, Hussain AAS, Hamid Q, Halwani R. Early administration of remdesivir to COVID-19 patients associates with higher recovery rate and lower need for ICU admission: A retrospective cohort study. PLoS One. 2021;16(10):e0258643. doi:10.1371/journal.pone.0258643
29. RECOVERY Collaborative Group, Horby P, Lim WS, et al. Dexamethasone in hospitalized patients with Covid-19. N Engl J Med. 2021;384(8):693-704. doi:10.1056/NEJMoa2021436
30. Rees EM, Nightingale ES, Jafari Y, et al. COVID-19 length of hospital stay: a systematic review and data synthesis. BMC Med. 2020;18(1):270. doi:10.1186/s12916-020-01726-3
31. Anderson M, Bach P, Baldwin MR. Hospital length of stay for severe COVID-19: implications for Remdesivir’s value. medRxiv. 2020;2020.08.10.20171637. doi:10.1101/2020.08.10.20171637
From Lahey Hospital and Medical Center, Burlington, MA (Drs. Liesching and Lei), and Tufts University School of Medicine, Boston, MA (Dr. Liesching)
ABSTRACT
Objective: To compare the utilization of oxygen therapies and clinical outcomes of patients admitted for COVID-19 during the second surge of the pandemic to that of patients admitted during the first surge.
Design: Observational study using a registry database.
Setting: Three hospitals (791 inpatient beds and 76 intensive care unit [ICU] beds) within the Beth Israel Lahey Health system in Massachusetts.
Participants: We included 3183 patients with COVID-19 admitted to hospitals.
Measurements: Baseline data included demographics and comorbidities. Treatments included low-flow supplemental oxygen (2-6 L/min), high-flow oxygen via nasal cannula, and invasive mechanical ventilation. Outcomes included ICU admission, length of stay, ventilator days, and mortality.
Results: A total of 3183 patients were included: 1586 during the first surge and 1597 during the second surge. Compared to the first surge, patients admitted during the second surge had a similar rate of receiving low-flow supplemental oxygen (65.8% vs 64.1%, P = .3), a higher rate of receiving high-flow nasal cannula (15.4% vs 10.8%, P = .0001), and a lower ventilation rate (5.6% vs 9.7%, P < .0001). The outcomes during the second surge were better than those during the first surge: lower ICU admission rate (8.1% vs 12.7%, P < .0001), shorter length of hospital stay (5 vs 6 days, P < .0001), fewer ventilator days (10 vs 16, P = .01), and lower mortality (8.3% vs 19.2%, P < .0001). Among ventilated patients, those who received high-flow nasal cannula had lower mortality.
Conclusion: Compared to the first surge of the COVID-19 pandemic, patients admitted during the second surge had similar likelihood of receiving low-flow supplemental oxygen, were more likely to receive high-flow nasal cannula, were less likely to be ventilated, and had better outcomes.
Keywords: supplemental oxygen, high-flow nasal cannula, ventilator.
The respiratory system receives the major impact of SARS-CoV-2 virus, and hypoxemia has been the predominant diagnosis for patients hospitalized with COVID-19.1,2 During the initial stage of the pandemic, oxygen therapies and mechanical ventilation were the only choices for these patients.3-6 Standard-of-care treatment for patients with COVID-19 during the initial surge included oxygen therapies and mechanical ventilation for hypoxemia and medications for comorbidities and COVID-19–associated sequelae, such as multi-organ dysfunction and failure. A report from New York during the first surge (May 2020) showed that among 5700 hospitalized patients with COVID-19, 27.8% received supplemental oxygen and 12.2% received invasive mechanical ventilation.7 High-flow nasal cannula (HFNC) oxygen delivery has been utilized widely throughout the pandemic due to its superiority over other noninvasive respiratory support techniques.8-12 Mechanical ventilation is always necessary for critically ill patients with acute respiratory distress syndrome. However, ventilator scarcity has become a bottleneck in caring for severely ill patients with COVID-19 during the pandemic.13
The clinical outcomes of hospitalized COVID-19 patients include a high intubation rate, long length of hospital and intensive care unit (ICU) stay, and high mortality.14,15 As the pandemic evolved, new medications, including remdesivir, hydroxychloroquine, lopinavir, or interferon β-1a, were used in addition to the standard of care, but these did not result in significantly different mortality from standard of care.16 Steroids are becoming foundational to the treatment of severe COVID-19 pneumonia, but evidence from high-quality randomized controlled clinical trials is lacking.17
During the first surge from March to May 2020, Massachusetts had the third highest number of COVID-19 cases among states in the United States.18 In early 2021, COVID-19 cases were climbing close to the peak of the second surge in Massachusetts. In this study, we compared utilization of low-flow supplemental oxygen, HFNC, and mechanical ventilation and clinical outcomes of patients admitted to 3 hospitals in Massachusetts during the second surge of the pandemic to that of patients admitted during the first surge.
Methods
Setting
Beth Israel Lahey Health is a system of academic and teaching hospitals with primary care and specialty care providers. We included 3 centers within the Beth Israel Lahey Health system in Massachusetts: Lahey Hospital and Medical Center, with 335 inpatient hospital beds and 52 critical care beds; Beverly Hospital, with 227 beds and 14 critical care beds; and Winchester Hospital, with 229 beds and 10 ICU beds.
Participants
We included patients admitted to the 3 hospitals with COVID-19 as a primary or secondary diagnosis during the first surge of the pandemic (March 1, 2020 to June 15, 2020) and the second surge (November 15, 2020 to January 27, 2021). The timeframe of the first surge was defined as the window between the start date and the end date of data collection. During the time window of the first surge, 1586 patients were included. The start time of the second surge was defined as the date when the data collection was restarted; the end date was set when the number of patients (1597) accumulated was close to the number of patients in the first surge (1586), so that the two groups had similar sample size.
Study Design
A data registry of COVID-19 patients was created by our institution, and the data were prospectively collected starting in March 2020. We retrospectively extracted data on the following from the registry database for this observational study: demographics and baseline comorbidities; the use of low-flow supplemental oxygen, HFNC, and invasive mechanical ventilator; and ICU admission, length of hospital stay, length of ICU stay, and hospital discharge disposition. Start and end times for each oxygen therapy were not entered in the registry. Data about other oxygen therapies, such as noninvasive positive-pressure ventilation, were not collected in the registry database, and therefore were not included in the analysis.
Statistical Analysis
Continuous variables (eg, age) were tested for data distribution normality using the Shapiro-Wilk test. Normally distributed data were tested using unpaired t-tests and displayed as mean (SD). The skewed data were tested using the Wilcoxon rank sum test and displayed as median (interquartile range [IQR]). The categorical variables were compared using chi-square test. Comparisons with P ≤ .05 were considered significantly different. Statistical analysis for this study was generated using Statistical Analysis Software (SAS), version 9.4 for Windows (SAS Institute Inc.).
Results
Baseline Characteristics
We included 3183 patients: 1586 admitted during the first surge and 1597 admitted during the second surge. Baseline characteristics of patients with COVID-19 admitted during the first and second surges are shown in Table 1. Patients admitted during the second surge were older (73 years vs 71 years, P = .01) and had higher rates of hypertension (64.8% vs 59.6%, P = .003) and asthma (12.9% vs 10.7%, P = .049) but a lower rate of interstitial lung disease (3.3% vs 7.7%, P < .001). Sequential organ failure assessment scores at admission and the rates of other comorbidities were not significantly different between the 2 surges.
Oxygen Therapies
The number of patients who were hospitalized and received low-flow supplemental oxygen, and/or HFNC, and/or ventilator in the first surge and the second surge is shown in the Figure. Of all patients included, 2067 (64.9%) received low-flow supplemental oxygen; of these, 374 (18.1%) subsequently received HFNC, and 85 (22.7%) of these subsequently received mechanical ventilation. Of all 3183 patients, 417 (13.1%) received HFNC; 43 of these patients received HFNC without receiving low-flow supplemental oxygen, and 98 (23.5%) subsequently received mechanical ventilation. Out of all 3183 patients, 244 (7.7%) received mechanical ventilation; 98 (40.2%) of these received HFNC while the remaining 146 (59.8%) did not. At the beginning of the first surge, the ratio of patients who received invasive mechanical ventilation to patients who received HFNC was close to 1:1 (10/10); the ratio decreased to 6:10 in May and June 2020. At the beginning of the second surge, the ratio was 8:10 and then decreased to 3:10 in December 2020 and January 2021.
As shown in Table 2, the proportion of patients who received low-flow supplemental oxygen during the second surge was similar to that during the first surge (65.8% vs 64.1%, P = .3). Patients admitted during the second surge were more likely to receive HFNC than patients admitted during the first surge (15.4% vs 10.8%, P = .0001). Patients admitted during the second surge were less likely to be ventilated than the patients admitted during the first surge (5.6% vs 9.7%, P < .0001).
Clinical Outcomes
As shown in Table 3, second surge outcomes were much better than first surge outcomes: the ICU admission rate was lower (8.1% vs 12.7%, P < .0001); patients were more likely to be discharged to home (60.2% vs 47.4%, P < .0001), had a shorter length of hospital stay (5 vs 6 days, P < .0001), and had fewer ventilator days (10 vs 16, P = .01); and mortality was lower (8.3% vs 19.2%, P < .0001). There was a trend that length of ICU stay was shorter during the second surge than during the first surge (7 days vs 9 days, P = .09).
As noted (Figure), the ratio of patients who received invasive mechanical ventilation to patients who received HFNC was decreasing during both the first surge and the second surge. To further analyze the relation between ventilator and HFNC, we performed a subgroup analysis for 244 ventilated patients during both surges to compare outcomes between patients who received HFNC and those who did not receive HFNC (Table 4). Ninety-eight (40%) patients received HFNC. Ventilated patients who received HFNC had lower mortality than those patients who did not receive HFNC (31.6% vs 48%, P = .01), but had a longer length of hospital stay (29 days vs 14 days, P < .0001), longer length of ICU stay (17 days vs 9 days, P < .0001), and a higher number of ventilator days (16 vs 11, P = .001).
Discussion
Our study compared the baseline patient characteristics; utilization of low-flow supplemental oxygen therapy, HFNC, and mechanical ventilation; and clinical outcomes between the first surge (n = 1586) and the second surge (n = 1597) of the COVID-19 pandemic. During both surges, about two-thirds of admitted patients received low-flow supplemental oxygen. A higher proportion of the admitted patients received HFNC during the second surge than during the first surge, while the intubation rate was lower during the second surge than during the first surge.
Reported low-flow supplemental oxygen use ranged from 28% to 63% depending on the cohort characteristics and location during the first surge.6,7,19 A report from New York during the first surge (March 1 to April 4, 2020) showed that among 5700 hospitalized patients with COVID-19, 27.8% received low-flow supplemental oxygen.7 HFNC is recommended in guidelines on management of patients with acute respiratory failure due to COVID-19.20 In our study, HFNC was utilized in a higher proportion of patients admitted for COVID-19 during the second surge (15.5% vs 10.8%, P = .0001). During the early pandemic period in Wuhan, China, 11% to 21% of admitted COVID-19 patients received HFNC.21,22 Utilization of HFNC in New York during the first surge (March to May 2020) varied from 5% to 14.3% of patients admitted with COVID-19.23,24 Our subgroup analysis of the ventilated patients showed that patients who received HFNC had lower mortality than those who did not (31.6% vs 48.0%, P = .011). Comparably, a report from Paris, France, showed that among patients admitted to ICUs for acute hypoxemic respiratory failure, those who received HFNC had lower mortality at day 60 than those who did not (21% vs 31%, P = .052).25 Our recent analysis showed that patients treated with HFNC prior to mechanical ventilation had lower mortality than those treated with only conventional oxygen (30% vs 52%, P = .05).26 In this subgroup analysis, we could not determine if HFNC treatment was administered before or after ventilation because HFNC was entered as dichotomous data (“Yes” or “No”) in the registry database. We merely showed the beneficial effect of HFNC on reducing mortality for ventilated COVID-19 patients, but did not mean to focus on how and when to apply HFNC.
We observed that the patients admitted during the second surge were less likely to be ventilated than the patients admitted during the first surge (5.6% vs 9.7%, P < .0001). During the first surge in New York, among 5700 patients admitted with COVID-19, 12.2% received invasive mechanical ventilation.7 In another report, also from New York during the first surge, 26.1% of 2015 hospitalized COVID-19 patients received mechanical ventilation.27 In our study, the ventilation rate of 9.7% during the first surge was lower.
Outcomes during the second surge were better than during the first surge, including ICU admission rate, hospital and ICU length of stay, ventilator days, and mortality. The mortality was 19.2% during the first surge vs 8.3% during the second surge (P < .0001). The mortality of 19.2% was lower than the 30.6% mortality reported for 2015 hospitalized COVID-19 patients in New York during the first surge.27 A retrospective study showed that early administration of remdesivir was associated with reduced ICU admission, ventilation use, and mortality.28 The RECOVERY clinical trial showed that dexamethasone improved mortality for COVID-19 patients who received respiratory support, but not for patients who did not receive any respiratory support.29 Perhaps some, if not all, of the improvement in ICU admission and mortality during the second surge was attributed to the new medications, such as antivirals and steroids.
The length of hospital stay for patients with moderate to severe COVID-19 varied from 4 to 53 days at different locations of the world, as shown in a meta-analysis by Rees and colleagues.30 Our results showing a length of stay of 6 days during the first surge and 5 days during the second surge fell into the shorter end of this range. In a retrospective analysis of 1643 adults with severe COVID-19 admitted to hospitals in New York City between March 9, 2020 and April 23, 2020, median hospital length of stay was 7 (IQR, 3-14) days.31 For the ventilated patients in our study, the length of stay of 14 days (did not receive HFNC) and 29 days (received HFNC) was much longer. This longer length of stay might be attributed to the patients in our study being older and having more severe comorbidities.
The main purpose of this study was to compare the oxygen therapies and outcomes between 2 surges. It is difficult to associate the clinical outcomes with the oxygen therapies because new therapies and medications were available after the first surge. It was not possible to adjust the outcomes with confounders (other therapies and medications) because the registry data did not include the new therapies and medications.
A strength of this study was that we included a large, balanced number of patients in the first surge and the second surge. We did not plan the sample size in both groups as we could not predict the number of admissions. We set the end date of data collection for analysis as the time when the number of patients admitted during the second surge was similar to the number of patients admitted during the first surge. A limitation was that the registry database was created by the institution and was not designed solely for this study. The data for oxygen therapies were limited to low-flow supplemental oxygen, HFNC, and invasive mechanical ventilation; data for noninvasive ventilation were not included.
Conclusion
At our centers, during the second surge of COVID-19 pandemic, patients hospitalized with COVID-19 infection were more likely to receive HFNC but less likely to be ventilated. Compared to the first surge, the hospitalized patients with COVID-19 infection had a lower ICU admission rate, shorter length of hospital stay, fewer ventilator days, and lower mortality. For ventilated patients, those who received HFNC had lower mortality than those who did not.
Corresponding author: Timothy N. Liesching, MD, 41 Mall Road, Burlington, MA 01805; [email protected]
Disclosures: None reported.
doi:10.12788/jcom.0086
From Lahey Hospital and Medical Center, Burlington, MA (Drs. Liesching and Lei), and Tufts University School of Medicine, Boston, MA (Dr. Liesching)
ABSTRACT
Objective: To compare the utilization of oxygen therapies and clinical outcomes of patients admitted for COVID-19 during the second surge of the pandemic to that of patients admitted during the first surge.
Design: Observational study using a registry database.
Setting: Three hospitals (791 inpatient beds and 76 intensive care unit [ICU] beds) within the Beth Israel Lahey Health system in Massachusetts.
Participants: We included 3183 patients with COVID-19 admitted to hospitals.
Measurements: Baseline data included demographics and comorbidities. Treatments included low-flow supplemental oxygen (2-6 L/min), high-flow oxygen via nasal cannula, and invasive mechanical ventilation. Outcomes included ICU admission, length of stay, ventilator days, and mortality.
Results: A total of 3183 patients were included: 1586 during the first surge and 1597 during the second surge. Compared to the first surge, patients admitted during the second surge had a similar rate of receiving low-flow supplemental oxygen (65.8% vs 64.1%, P = .3), a higher rate of receiving high-flow nasal cannula (15.4% vs 10.8%, P = .0001), and a lower ventilation rate (5.6% vs 9.7%, P < .0001). The outcomes during the second surge were better than those during the first surge: lower ICU admission rate (8.1% vs 12.7%, P < .0001), shorter length of hospital stay (5 vs 6 days, P < .0001), fewer ventilator days (10 vs 16, P = .01), and lower mortality (8.3% vs 19.2%, P < .0001). Among ventilated patients, those who received high-flow nasal cannula had lower mortality.
Conclusion: Compared to the first surge of the COVID-19 pandemic, patients admitted during the second surge had similar likelihood of receiving low-flow supplemental oxygen, were more likely to receive high-flow nasal cannula, were less likely to be ventilated, and had better outcomes.
Keywords: supplemental oxygen, high-flow nasal cannula, ventilator.
The respiratory system receives the major impact of SARS-CoV-2 virus, and hypoxemia has been the predominant diagnosis for patients hospitalized with COVID-19.1,2 During the initial stage of the pandemic, oxygen therapies and mechanical ventilation were the only choices for these patients.3-6 Standard-of-care treatment for patients with COVID-19 during the initial surge included oxygen therapies and mechanical ventilation for hypoxemia and medications for comorbidities and COVID-19–associated sequelae, such as multi-organ dysfunction and failure. A report from New York during the first surge (May 2020) showed that among 5700 hospitalized patients with COVID-19, 27.8% received supplemental oxygen and 12.2% received invasive mechanical ventilation.7 High-flow nasal cannula (HFNC) oxygen delivery has been utilized widely throughout the pandemic due to its superiority over other noninvasive respiratory support techniques.8-12 Mechanical ventilation is always necessary for critically ill patients with acute respiratory distress syndrome. However, ventilator scarcity has become a bottleneck in caring for severely ill patients with COVID-19 during the pandemic.13
The clinical outcomes of hospitalized COVID-19 patients include a high intubation rate, long length of hospital and intensive care unit (ICU) stay, and high mortality.14,15 As the pandemic evolved, new medications, including remdesivir, hydroxychloroquine, lopinavir, or interferon β-1a, were used in addition to the standard of care, but these did not result in significantly different mortality from standard of care.16 Steroids are becoming foundational to the treatment of severe COVID-19 pneumonia, but evidence from high-quality randomized controlled clinical trials is lacking.17
During the first surge from March to May 2020, Massachusetts had the third highest number of COVID-19 cases among states in the United States.18 In early 2021, COVID-19 cases were climbing close to the peak of the second surge in Massachusetts. In this study, we compared utilization of low-flow supplemental oxygen, HFNC, and mechanical ventilation and clinical outcomes of patients admitted to 3 hospitals in Massachusetts during the second surge of the pandemic to that of patients admitted during the first surge.
Methods
Setting
Beth Israel Lahey Health is a system of academic and teaching hospitals with primary care and specialty care providers. We included 3 centers within the Beth Israel Lahey Health system in Massachusetts: Lahey Hospital and Medical Center, with 335 inpatient hospital beds and 52 critical care beds; Beverly Hospital, with 227 beds and 14 critical care beds; and Winchester Hospital, with 229 beds and 10 ICU beds.
Participants
We included patients admitted to the 3 hospitals with COVID-19 as a primary or secondary diagnosis during the first surge of the pandemic (March 1, 2020 to June 15, 2020) and the second surge (November 15, 2020 to January 27, 2021). The timeframe of the first surge was defined as the window between the start date and the end date of data collection. During the time window of the first surge, 1586 patients were included. The start time of the second surge was defined as the date when the data collection was restarted; the end date was set when the number of patients (1597) accumulated was close to the number of patients in the first surge (1586), so that the two groups had similar sample size.
Study Design
A data registry of COVID-19 patients was created by our institution, and the data were prospectively collected starting in March 2020. We retrospectively extracted data on the following from the registry database for this observational study: demographics and baseline comorbidities; the use of low-flow supplemental oxygen, HFNC, and invasive mechanical ventilator; and ICU admission, length of hospital stay, length of ICU stay, and hospital discharge disposition. Start and end times for each oxygen therapy were not entered in the registry. Data about other oxygen therapies, such as noninvasive positive-pressure ventilation, were not collected in the registry database, and therefore were not included in the analysis.
Statistical Analysis
Continuous variables (eg, age) were tested for data distribution normality using the Shapiro-Wilk test. Normally distributed data were tested using unpaired t-tests and displayed as mean (SD). The skewed data were tested using the Wilcoxon rank sum test and displayed as median (interquartile range [IQR]). The categorical variables were compared using chi-square test. Comparisons with P ≤ .05 were considered significantly different. Statistical analysis for this study was generated using Statistical Analysis Software (SAS), version 9.4 for Windows (SAS Institute Inc.).
Results
Baseline Characteristics
We included 3183 patients: 1586 admitted during the first surge and 1597 admitted during the second surge. Baseline characteristics of patients with COVID-19 admitted during the first and second surges are shown in Table 1. Patients admitted during the second surge were older (73 years vs 71 years, P = .01) and had higher rates of hypertension (64.8% vs 59.6%, P = .003) and asthma (12.9% vs 10.7%, P = .049) but a lower rate of interstitial lung disease (3.3% vs 7.7%, P < .001). Sequential organ failure assessment scores at admission and the rates of other comorbidities were not significantly different between the 2 surges.
Oxygen Therapies
The number of patients who were hospitalized and received low-flow supplemental oxygen, and/or HFNC, and/or ventilator in the first surge and the second surge is shown in the Figure. Of all patients included, 2067 (64.9%) received low-flow supplemental oxygen; of these, 374 (18.1%) subsequently received HFNC, and 85 (22.7%) of these subsequently received mechanical ventilation. Of all 3183 patients, 417 (13.1%) received HFNC; 43 of these patients received HFNC without receiving low-flow supplemental oxygen, and 98 (23.5%) subsequently received mechanical ventilation. Out of all 3183 patients, 244 (7.7%) received mechanical ventilation; 98 (40.2%) of these received HFNC while the remaining 146 (59.8%) did not. At the beginning of the first surge, the ratio of patients who received invasive mechanical ventilation to patients who received HFNC was close to 1:1 (10/10); the ratio decreased to 6:10 in May and June 2020. At the beginning of the second surge, the ratio was 8:10 and then decreased to 3:10 in December 2020 and January 2021.
As shown in Table 2, the proportion of patients who received low-flow supplemental oxygen during the second surge was similar to that during the first surge (65.8% vs 64.1%, P = .3). Patients admitted during the second surge were more likely to receive HFNC than patients admitted during the first surge (15.4% vs 10.8%, P = .0001). Patients admitted during the second surge were less likely to be ventilated than the patients admitted during the first surge (5.6% vs 9.7%, P < .0001).
Clinical Outcomes
As shown in Table 3, second surge outcomes were much better than first surge outcomes: the ICU admission rate was lower (8.1% vs 12.7%, P < .0001); patients were more likely to be discharged to home (60.2% vs 47.4%, P < .0001), had a shorter length of hospital stay (5 vs 6 days, P < .0001), and had fewer ventilator days (10 vs 16, P = .01); and mortality was lower (8.3% vs 19.2%, P < .0001). There was a trend that length of ICU stay was shorter during the second surge than during the first surge (7 days vs 9 days, P = .09).
As noted (Figure), the ratio of patients who received invasive mechanical ventilation to patients who received HFNC was decreasing during both the first surge and the second surge. To further analyze the relation between ventilator and HFNC, we performed a subgroup analysis for 244 ventilated patients during both surges to compare outcomes between patients who received HFNC and those who did not receive HFNC (Table 4). Ninety-eight (40%) patients received HFNC. Ventilated patients who received HFNC had lower mortality than those patients who did not receive HFNC (31.6% vs 48%, P = .01), but had a longer length of hospital stay (29 days vs 14 days, P < .0001), longer length of ICU stay (17 days vs 9 days, P < .0001), and a higher number of ventilator days (16 vs 11, P = .001).
Discussion
Our study compared the baseline patient characteristics; utilization of low-flow supplemental oxygen therapy, HFNC, and mechanical ventilation; and clinical outcomes between the first surge (n = 1586) and the second surge (n = 1597) of the COVID-19 pandemic. During both surges, about two-thirds of admitted patients received low-flow supplemental oxygen. A higher proportion of the admitted patients received HFNC during the second surge than during the first surge, while the intubation rate was lower during the second surge than during the first surge.
Reported low-flow supplemental oxygen use ranged from 28% to 63% depending on the cohort characteristics and location during the first surge.6,7,19 A report from New York during the first surge (March 1 to April 4, 2020) showed that among 5700 hospitalized patients with COVID-19, 27.8% received low-flow supplemental oxygen.7 HFNC is recommended in guidelines on management of patients with acute respiratory failure due to COVID-19.20 In our study, HFNC was utilized in a higher proportion of patients admitted for COVID-19 during the second surge (15.5% vs 10.8%, P = .0001). During the early pandemic period in Wuhan, China, 11% to 21% of admitted COVID-19 patients received HFNC.21,22 Utilization of HFNC in New York during the first surge (March to May 2020) varied from 5% to 14.3% of patients admitted with COVID-19.23,24 Our subgroup analysis of the ventilated patients showed that patients who received HFNC had lower mortality than those who did not (31.6% vs 48.0%, P = .011). Comparably, a report from Paris, France, showed that among patients admitted to ICUs for acute hypoxemic respiratory failure, those who received HFNC had lower mortality at day 60 than those who did not (21% vs 31%, P = .052).25 Our recent analysis showed that patients treated with HFNC prior to mechanical ventilation had lower mortality than those treated with only conventional oxygen (30% vs 52%, P = .05).26 In this subgroup analysis, we could not determine if HFNC treatment was administered before or after ventilation because HFNC was entered as dichotomous data (“Yes” or “No”) in the registry database. We merely showed the beneficial effect of HFNC on reducing mortality for ventilated COVID-19 patients, but did not mean to focus on how and when to apply HFNC.
We observed that the patients admitted during the second surge were less likely to be ventilated than the patients admitted during the first surge (5.6% vs 9.7%, P < .0001). During the first surge in New York, among 5700 patients admitted with COVID-19, 12.2% received invasive mechanical ventilation.7 In another report, also from New York during the first surge, 26.1% of 2015 hospitalized COVID-19 patients received mechanical ventilation.27 In our study, the ventilation rate of 9.7% during the first surge was lower.
Outcomes during the second surge were better than during the first surge, including ICU admission rate, hospital and ICU length of stay, ventilator days, and mortality. The mortality was 19.2% during the first surge vs 8.3% during the second surge (P < .0001). The mortality of 19.2% was lower than the 30.6% mortality reported for 2015 hospitalized COVID-19 patients in New York during the first surge.27 A retrospective study showed that early administration of remdesivir was associated with reduced ICU admission, ventilation use, and mortality.28 The RECOVERY clinical trial showed that dexamethasone improved mortality for COVID-19 patients who received respiratory support, but not for patients who did not receive any respiratory support.29 Perhaps some, if not all, of the improvement in ICU admission and mortality during the second surge was attributed to the new medications, such as antivirals and steroids.
The length of hospital stay for patients with moderate to severe COVID-19 varied from 4 to 53 days at different locations of the world, as shown in a meta-analysis by Rees and colleagues.30 Our results showing a length of stay of 6 days during the first surge and 5 days during the second surge fell into the shorter end of this range. In a retrospective analysis of 1643 adults with severe COVID-19 admitted to hospitals in New York City between March 9, 2020 and April 23, 2020, median hospital length of stay was 7 (IQR, 3-14) days.31 For the ventilated patients in our study, the length of stay of 14 days (did not receive HFNC) and 29 days (received HFNC) was much longer. This longer length of stay might be attributed to the patients in our study being older and having more severe comorbidities.
The main purpose of this study was to compare the oxygen therapies and outcomes between 2 surges. It is difficult to associate the clinical outcomes with the oxygen therapies because new therapies and medications were available after the first surge. It was not possible to adjust the outcomes with confounders (other therapies and medications) because the registry data did not include the new therapies and medications.
A strength of this study was that we included a large, balanced number of patients in the first surge and the second surge. We did not plan the sample size in both groups as we could not predict the number of admissions. We set the end date of data collection for analysis as the time when the number of patients admitted during the second surge was similar to the number of patients admitted during the first surge. A limitation was that the registry database was created by the institution and was not designed solely for this study. The data for oxygen therapies were limited to low-flow supplemental oxygen, HFNC, and invasive mechanical ventilation; data for noninvasive ventilation were not included.
Conclusion
At our centers, during the second surge of COVID-19 pandemic, patients hospitalized with COVID-19 infection were more likely to receive HFNC but less likely to be ventilated. Compared to the first surge, the hospitalized patients with COVID-19 infection had a lower ICU admission rate, shorter length of hospital stay, fewer ventilator days, and lower mortality. For ventilated patients, those who received HFNC had lower mortality than those who did not.
Corresponding author: Timothy N. Liesching, MD, 41 Mall Road, Burlington, MA 01805; [email protected]
Disclosures: None reported.
doi:10.12788/jcom.0086
1. Xie J, Covassin N, Fan Z, et al. Association between hypoxemia and mortality in patients with COVID-19. Mayo Clin Proc. 2020;95(6):1138-1147. doi:10.1016/j.mayocp.2020.04.006
2. Asleh R, Asher E, Yagel O, et al. Predictors of hypoxemia and related adverse outcomes in patients hospitalized with COVID-19: a double-center retrospective study. J Clin Med. 2021;10(16):3581. doi:10.3390/jcm10163581
3. Choi KJ, Hong HL, Kim EJ. Association between oxygen saturation/fraction of inhaled oxygen and mortality in patients with COVID-19 associated pneumonia requiring oxygen therapy. Tuberc Respir Dis (Seoul). 2021;84(2):125-133. doi:10.4046/trd.2020.0126
4. Dixit SB. Role of noninvasive oxygen therapy strategies in COVID-19 patients: Where are we going? Indian J Crit Care Med. 2020;24(10):897-898. doi:10.5005/jp-journals-10071-23625
5. Gonzalez-Castro A, Fajardo Campoverde A, Medina A, et al. Non-invasive mechanical ventilation and high-flow oxygen therapy in the COVID-19 pandemic: the value of a draw. Med Intensiva (Engl Ed). 2021;45(5):320-321. doi:10.1016/j.medine.2021.04.001
6. Pan W, Li J, Ou Y, et al. Clinical outcome of standardized oxygen therapy nursing strategy in COVID-19. Ann Palliat Med. 2020;9(4):2171-2177. doi:10.21037/apm-20-1272
7. Richardson S, Hirsch JS, Narasimhan M, et al. Presenting characteristics, comorbidities, and outcomes among 5700 patients hospitalized with COVID-19 in the New York City area. JAMA. 2020;323(20):2052-2059. doi:10.1001/jama.2020.6775
8. He G, Han Y, Fang Q, et al. Clinical experience of high-flow nasal cannula oxygen therapy in severe COVID-19 patients. Article in Chinese. Zhejiang Da Xue Xue Bao Yi Xue Ban. 2020;49(2):232-239. doi:10.3785/j.issn.1008-9292.2020.03.13
9. Lalla U, Allwood BW, Louw EH, et al. The utility of high-flow nasal cannula oxygen therapy in the management of respiratory failure secondary to COVID-19 pneumonia. S Afr Med J. 2020;110(6):12941.
10. Zhang TT, Dai B, Wang W. Should the high-flow nasal oxygen therapy be used or avoided in COVID-19? J Transl Int Med. 2020;8(2):57-58. doi:10.2478/jtim-2020-0018
11. Agarwal A, Basmaji J, Muttalib F, et al. High-flow nasal cannula for acute hypoxemic respiratory failure in patients with COVID-19: systematic reviews of effectiveness and its risks of aerosolization, dispersion, and infection transmission. Can J Anaesth. 2020;67(9):1217-1248. doi:10.1007/s12630-020-01740-2
12. Geng S, Mei Q, Zhu C, et al. High flow nasal cannula is a good treatment option for COVID-19. Heart Lung. 2020;49(5):444-445. doi:10.1016/j.hrtlng.2020.03.018
13. Feinstein MM, Niforatos JD, Hyun I, et al. Considerations for ventilator triage during the COVID-19 pandemic. Lancet Respir Med. 2020;8(6):e53. doi:10.1016/S2213-2600(20)30192-2
14. Wu Z, McGoogan JM. Characteristics of and important lessons from the coronavirus disease 2019 (COVID-19) outbreak in China: summary of a report of 72314 cases from the Chinese Center for Disease Control and Prevention. JAMA. 2020;323(13):1239-1242. doi:10.1001/jama.2020.2648
15. Rojas-Marte G, Hashmi AT, Khalid M, et al. Outcomes in patients with COVID-19 disease and high oxygen requirements. J Clin Med Res. 2021;13(1):26-37. doi:10.14740/jocmr4405
16. Zhang R, Mylonakis E. In inpatients with COVID-19, none of remdesivir, hydroxychloroquine, lopinavir, or interferon β-1a differed from standard care for in-hospital mortality. Ann Intern Med. 2021;174(2):JC17. doi:10.7326/ACPJ202102160-017
17. Rello J, Waterer GW, Bourdiol A, Roquilly A. COVID-19, steroids and other immunomodulators: The jigsaw is not complete. Anaesth Crit Care Pain Med. 2020;39(6):699-701. doi:10.1016/j.accpm.2020.10.011
18. Dargin J, Stempek S, Lei Y, Gray Jr. A, Liesching T. The effect of a tiered provider staffing model on patient outcomes during the coronavirus disease 2019 pandemic: A single-center observational study. Int J Crit Illn Inj Sci. 2021;11(3). doi:10.4103/ijciis.ijciis_37_21
19. Ni YN, Wang T, Liang BM, Liang ZA. The independent factors associated with oxygen therapy in COVID-19 patients under 65 years old. PLoS One. 2021;16(1):e0245690. doi:10.1371/journal.pone.0245690
20. Alhazzani W, Moller MH, Arabi YM, et al. Surviving Sepsis Campaign: guidelines on the management of critically ill adults with coronavirus disease 2019 (COVID-19). Crit Care Med. 2020;48(6):e440-e469. doi:10.1097/CCM.0000000000004363
21. Wang D, Hu B, Hu C, et al. Clinical characteristics of 138 hospitalized patients with 2019 novel coronavirus-infected pneumonia in Wuhan, China. JAMA. 2020;323(11):1061-1069. doi:10.1001/jama.2020.1585
22. Zhou F, Yu T, Du R, et al. Clinical course and risk factors for mortality of adult inpatients with COVID-19 in Wuhan, China: a retrospective cohort study. Lancet. 2020;395(10229):1054-1062. doi:10.1016/S0140-6736(20)30566-3
23. Argenziano MG, Bruce SL, Slater CL, et al. Characterization and clinical course of 1000 patients with coronavirus disease 2019 in New York: retrospective case series. BMJ. 2020;369:m1996. doi:10.1136/bmj.m1996
24. Cummings MJ, Baldwin MR, Abrams D, et al. Epidemiology, clinical course, and outcomes of critically ill adults with COVID-19 in New York City: a prospective cohort study. Lancet. 2020;395(10239):1763-1770. doi:10.1016/S0140-6736(20)31189-2
25. Demoule A, Vieillard Baron A, Darmon M, et al. High-flow nasal cannula in critically ill patients with severe COVID-19. Am J Respir Crit Care Med. 2020;202(7):1039-1042. doi:10.1164/rccm.202005-2007LE
26. Hansen CK, Stempek S, Liesching T, Lei Y, Dargin J. Characteristics and outcomes of patients receiving high flow nasal cannula therapy prior to mechanical ventilation in COVID-19 respiratory failure: a prospective observational study. Int J Crit Illn Inj Sci. 2021;11(2):56-60. doi:10.4103/IJCIIS.IJCIIS_181_20
27. van Gerwen M, Alsen M, Little C, et al. Risk factors and outcomes of COVID-19 in New York City; a retrospective cohort study. J Med Virol. 2021;93(2):907-915. doi:10.1002/jmv.26337
28. Hussain Alsayed HA, Saheb Sharif-Askari F, Saheb Sharif-Askari N, Hussain AAS, Hamid Q, Halwani R. Early administration of remdesivir to COVID-19 patients associates with higher recovery rate and lower need for ICU admission: A retrospective cohort study. PLoS One. 2021;16(10):e0258643. doi:10.1371/journal.pone.0258643
29. RECOVERY Collaborative Group, Horby P, Lim WS, et al. Dexamethasone in hospitalized patients with Covid-19. N Engl J Med. 2021;384(8):693-704. doi:10.1056/NEJMoa2021436
30. Rees EM, Nightingale ES, Jafari Y, et al. COVID-19 length of hospital stay: a systematic review and data synthesis. BMC Med. 2020;18(1):270. doi:10.1186/s12916-020-01726-3
31. Anderson M, Bach P, Baldwin MR. Hospital length of stay for severe COVID-19: implications for Remdesivir’s value. medRxiv. 2020;2020.08.10.20171637. doi:10.1101/2020.08.10.20171637
1. Xie J, Covassin N, Fan Z, et al. Association between hypoxemia and mortality in patients with COVID-19. Mayo Clin Proc. 2020;95(6):1138-1147. doi:10.1016/j.mayocp.2020.04.006
2. Asleh R, Asher E, Yagel O, et al. Predictors of hypoxemia and related adverse outcomes in patients hospitalized with COVID-19: a double-center retrospective study. J Clin Med. 2021;10(16):3581. doi:10.3390/jcm10163581
3. Choi KJ, Hong HL, Kim EJ. Association between oxygen saturation/fraction of inhaled oxygen and mortality in patients with COVID-19 associated pneumonia requiring oxygen therapy. Tuberc Respir Dis (Seoul). 2021;84(2):125-133. doi:10.4046/trd.2020.0126
4. Dixit SB. Role of noninvasive oxygen therapy strategies in COVID-19 patients: Where are we going? Indian J Crit Care Med. 2020;24(10):897-898. doi:10.5005/jp-journals-10071-23625
5. Gonzalez-Castro A, Fajardo Campoverde A, Medina A, et al. Non-invasive mechanical ventilation and high-flow oxygen therapy in the COVID-19 pandemic: the value of a draw. Med Intensiva (Engl Ed). 2021;45(5):320-321. doi:10.1016/j.medine.2021.04.001
6. Pan W, Li J, Ou Y, et al. Clinical outcome of standardized oxygen therapy nursing strategy in COVID-19. Ann Palliat Med. 2020;9(4):2171-2177. doi:10.21037/apm-20-1272
7. Richardson S, Hirsch JS, Narasimhan M, et al. Presenting characteristics, comorbidities, and outcomes among 5700 patients hospitalized with COVID-19 in the New York City area. JAMA. 2020;323(20):2052-2059. doi:10.1001/jama.2020.6775
8. He G, Han Y, Fang Q, et al. Clinical experience of high-flow nasal cannula oxygen therapy in severe COVID-19 patients. Article in Chinese. Zhejiang Da Xue Xue Bao Yi Xue Ban. 2020;49(2):232-239. doi:10.3785/j.issn.1008-9292.2020.03.13
9. Lalla U, Allwood BW, Louw EH, et al. The utility of high-flow nasal cannula oxygen therapy in the management of respiratory failure secondary to COVID-19 pneumonia. S Afr Med J. 2020;110(6):12941.
10. Zhang TT, Dai B, Wang W. Should the high-flow nasal oxygen therapy be used or avoided in COVID-19? J Transl Int Med. 2020;8(2):57-58. doi:10.2478/jtim-2020-0018
11. Agarwal A, Basmaji J, Muttalib F, et al. High-flow nasal cannula for acute hypoxemic respiratory failure in patients with COVID-19: systematic reviews of effectiveness and its risks of aerosolization, dispersion, and infection transmission. Can J Anaesth. 2020;67(9):1217-1248. doi:10.1007/s12630-020-01740-2
12. Geng S, Mei Q, Zhu C, et al. High flow nasal cannula is a good treatment option for COVID-19. Heart Lung. 2020;49(5):444-445. doi:10.1016/j.hrtlng.2020.03.018
13. Feinstein MM, Niforatos JD, Hyun I, et al. Considerations for ventilator triage during the COVID-19 pandemic. Lancet Respir Med. 2020;8(6):e53. doi:10.1016/S2213-2600(20)30192-2
14. Wu Z, McGoogan JM. Characteristics of and important lessons from the coronavirus disease 2019 (COVID-19) outbreak in China: summary of a report of 72314 cases from the Chinese Center for Disease Control and Prevention. JAMA. 2020;323(13):1239-1242. doi:10.1001/jama.2020.2648
15. Rojas-Marte G, Hashmi AT, Khalid M, et al. Outcomes in patients with COVID-19 disease and high oxygen requirements. J Clin Med Res. 2021;13(1):26-37. doi:10.14740/jocmr4405
16. Zhang R, Mylonakis E. In inpatients with COVID-19, none of remdesivir, hydroxychloroquine, lopinavir, or interferon β-1a differed from standard care for in-hospital mortality. Ann Intern Med. 2021;174(2):JC17. doi:10.7326/ACPJ202102160-017
17. Rello J, Waterer GW, Bourdiol A, Roquilly A. COVID-19, steroids and other immunomodulators: The jigsaw is not complete. Anaesth Crit Care Pain Med. 2020;39(6):699-701. doi:10.1016/j.accpm.2020.10.011
18. Dargin J, Stempek S, Lei Y, Gray Jr. A, Liesching T. The effect of a tiered provider staffing model on patient outcomes during the coronavirus disease 2019 pandemic: A single-center observational study. Int J Crit Illn Inj Sci. 2021;11(3). doi:10.4103/ijciis.ijciis_37_21
19. Ni YN, Wang T, Liang BM, Liang ZA. The independent factors associated with oxygen therapy in COVID-19 patients under 65 years old. PLoS One. 2021;16(1):e0245690. doi:10.1371/journal.pone.0245690
20. Alhazzani W, Moller MH, Arabi YM, et al. Surviving Sepsis Campaign: guidelines on the management of critically ill adults with coronavirus disease 2019 (COVID-19). Crit Care Med. 2020;48(6):e440-e469. doi:10.1097/CCM.0000000000004363
21. Wang D, Hu B, Hu C, et al. Clinical characteristics of 138 hospitalized patients with 2019 novel coronavirus-infected pneumonia in Wuhan, China. JAMA. 2020;323(11):1061-1069. doi:10.1001/jama.2020.1585
22. Zhou F, Yu T, Du R, et al. Clinical course and risk factors for mortality of adult inpatients with COVID-19 in Wuhan, China: a retrospective cohort study. Lancet. 2020;395(10229):1054-1062. doi:10.1016/S0140-6736(20)30566-3
23. Argenziano MG, Bruce SL, Slater CL, et al. Characterization and clinical course of 1000 patients with coronavirus disease 2019 in New York: retrospective case series. BMJ. 2020;369:m1996. doi:10.1136/bmj.m1996
24. Cummings MJ, Baldwin MR, Abrams D, et al. Epidemiology, clinical course, and outcomes of critically ill adults with COVID-19 in New York City: a prospective cohort study. Lancet. 2020;395(10239):1763-1770. doi:10.1016/S0140-6736(20)31189-2
25. Demoule A, Vieillard Baron A, Darmon M, et al. High-flow nasal cannula in critically ill patients with severe COVID-19. Am J Respir Crit Care Med. 2020;202(7):1039-1042. doi:10.1164/rccm.202005-2007LE
26. Hansen CK, Stempek S, Liesching T, Lei Y, Dargin J. Characteristics and outcomes of patients receiving high flow nasal cannula therapy prior to mechanical ventilation in COVID-19 respiratory failure: a prospective observational study. Int J Crit Illn Inj Sci. 2021;11(2):56-60. doi:10.4103/IJCIIS.IJCIIS_181_20
27. van Gerwen M, Alsen M, Little C, et al. Risk factors and outcomes of COVID-19 in New York City; a retrospective cohort study. J Med Virol. 2021;93(2):907-915. doi:10.1002/jmv.26337
28. Hussain Alsayed HA, Saheb Sharif-Askari F, Saheb Sharif-Askari N, Hussain AAS, Hamid Q, Halwani R. Early administration of remdesivir to COVID-19 patients associates with higher recovery rate and lower need for ICU admission: A retrospective cohort study. PLoS One. 2021;16(10):e0258643. doi:10.1371/journal.pone.0258643
29. RECOVERY Collaborative Group, Horby P, Lim WS, et al. Dexamethasone in hospitalized patients with Covid-19. N Engl J Med. 2021;384(8):693-704. doi:10.1056/NEJMoa2021436
30. Rees EM, Nightingale ES, Jafari Y, et al. COVID-19 length of hospital stay: a systematic review and data synthesis. BMC Med. 2020;18(1):270. doi:10.1186/s12916-020-01726-3
31. Anderson M, Bach P, Baldwin MR. Hospital length of stay for severe COVID-19: implications for Remdesivir’s value. medRxiv. 2020;2020.08.10.20171637. doi:10.1101/2020.08.10.20171637