User login
For MD-IQ use only
Microbiome’s new happy place: The beer gut
Your gut microbiome will thank you later
A healthy gut seems like the new catch-all to better overall health these days. Nutrition and diet culture has us drinking kombucha and ginger tea and coffee, but what if we told you that going to happy hour might also help?
In a recent double-blind study published in the Journal of Agricultural and Food Chemistry, 19 men were divided into two groups and asked to drink 11 ounces of alcoholic lager (5.2% by volume) or nonalcoholic lager with dinner for 4 weeks.
Beer? Yes. Beer.
We humans have trillions of microorganisms running rampant through our digestive tracts. When they’re happy, we have a lower chance of developing heart disease and diabetes. You know what else has millions of happy microorganisms from fermentation? Beer. It also has polyphenols that can help the body’s tissues fight cancers, as well as heart disease and inflammation. So beer is looking a little more healthy now, isn’t it?
In the study, the researchers found that both the alcoholic- and nonalcoholic-lager groups had a boost in bacterial diversity in the gut and higher fecal alkaline phosphatase levels, which showed improved intestinal health. They acknowledged, however, that the nonalcoholic route would be safer and healthier for overall health.
So add a lager to the list of gut-healthy foods that you should be consuming. It may give the phrase “beer gut” a whole new meaning.
We’ve lost our minds, but at least we know how fast they’re going
The phrase “quantum consciousness” sounds like something out of a particularly cheesy episode of Star Trek: “Oh no, Captain, the quantum consciousness has invaded our computer, and the only way to drive it out is to reverse the polarity of a focused tachyon beam.”
When it comes to understanding such basic existential issues as the origin of consciousness, however, quantum mechanics wasn’t off the table. The theory of the quantum origin of consciousness dates back to the 1990s (thanks in part to noted physician Roger Penrose), and goes something like this: There are microtubules within neurons in the brain that are small enough and isolated enough from the warm, wet, and chaotic brain environment where quantum effects can briefly come into play. We’re talking miniscule fractions of a second here, but still, long enough for quantum calculations to take place in the form of system wavefunction collapse, courtesy of gravity.
To plunge even deeper into the rabbit hole of quantum mechanics, the reason Schrödinger’s cat doesn’t occur in real life is wavefunction collapse; the more massive a quantum system is, the more likely it is to collapse into one state or another (alive or dead, in the cat’s case). The quantum origin of consciousness, or Orch OR theory, holds that human consciousness arises from electrical oscillations within the neuronal microtubules caused by the computations stemming from the collapse of small quantum systems.
That is an awful lot of overly simplified explanation, especially considering the study that just came out essentially disproved it. Oops. The research, published in Physics of Life Reviews, is pretty simple. The researchers went to a lab deep underground to avoid interference from cosmic rays, and sat around for months, observing a chunk of germanium for signs of spontaneous radiation, attributable to the same sort of wavefunction collapse that is supposedly occurring in our brains. They found nothing out of the ordinary, pretty definitively disproving most of Orch OR theory.
The researchers were unwilling to completely dismiss the idea (this is quantum mechanics, after all, uncertainty kind of goes with the territory), but it does seem like we’ll have to search elsewhere for sources of human consciousness. Personally, we’re big fans of the cymbal-playing monkey.
Missing links: A real fish story
Dear LOTME:
Ear’s a question that’s been keeping me up at night. Is the human middle ear the result of top-secret government experiments involving alien technology, Abraham Lincoln, and the Illuminati?
Restless in Roswell
Dear Restless:
The paleoanthropologic community has been sorting through this mystery for decades, and fossils discovered in China over the past 20 years finally provide a much less conspiratorially satisfying answer.

For some time now, experts in the field have believed that the bones of the human middle ear evolved from the spiracular gill of a fish. The spiracle is a small hole behind each eye that opens to the mouth in some fishes and was used to breathe air in the earliest, most primitive species. But how did we get from spiracle to ear?
The missing links come in the form of the cranial anatomy of Shuyu, a 438-million-year-old, fingernail-sized skull of a jawless fish, and the 419-million-year-old fossil of a completely preserved fish with gill filaments in the first branchial chamber.
“These fossils provided the first anatomical and fossil evidence for a vertebrate spiracle originating from fish gills,” senior author Gai Zhikun, PhD, of the Institute of Vertebrate Paleontology and Paleoanthropology, Beijing, said in a written statement.
In many ways, it seems, we are fish: “Many important structures of human beings can be traced back to our fish ancestors, such as our teeth, jaws, middle ears, etc,” added Zhu Min, PhD, also of the institute.
So, Restless, the next time you hear the soothing sounds of an angry mob storming the Capitol or you chew on a slab, slice, or chunk of mutant, laboratory-produced chicken in your favorite fast-food restaurant, be sure to thank Shuyu.
Can you lend me an ear?
If you thought locusts were only a nuisance, think again. They have their uses. If you take a locust’s ear and put it inside a robot, the robot will be able to hear and receive signals. Who knew?
Researchers from Tel Aviv University in Israel showed the robot’s hearing abilities by giving clap signals that told the robot what to do: One clap means go forward, two claps mean move back. What do you think the robot would do if it heard the clap break from Cha Cha Slide?
“Our task was to replace the robot’s electronic microphone with a dead insect’s ear, use the ear’s ability to detect the electrical signals from the environment, in this case vibrations in the air, and, using a special chip, convert the insect input to that of the robot,” Ben M. Maoz, PhD, said in a statement from the university.
And how does a dead locust ear work in a robot? Well, Dr. Maoz explained: “My laboratory has developed a special device – Ear-on-a-Chip – that allows the ear to be kept alive throughout the experiment by supplying oxygen and food to the organ while allowing the electrical signals to be taken out of the locust’s ear and amplified and transmitted to the robot.”
The research won’t stop at hearing, he said, as the other four senses also will be taken into consideration. This could help us sense dangers in the future, such as earthquakes or diseases. We said it before and we’ll say it again: We’re rooting for you, science!
Your gut microbiome will thank you later
A healthy gut seems like the new catch-all to better overall health these days. Nutrition and diet culture has us drinking kombucha and ginger tea and coffee, but what if we told you that going to happy hour might also help?
In a recent double-blind study published in the Journal of Agricultural and Food Chemistry, 19 men were divided into two groups and asked to drink 11 ounces of alcoholic lager (5.2% by volume) or nonalcoholic lager with dinner for 4 weeks.
Beer? Yes. Beer.
We humans have trillions of microorganisms running rampant through our digestive tracts. When they’re happy, we have a lower chance of developing heart disease and diabetes. You know what else has millions of happy microorganisms from fermentation? Beer. It also has polyphenols that can help the body’s tissues fight cancers, as well as heart disease and inflammation. So beer is looking a little more healthy now, isn’t it?
In the study, the researchers found that both the alcoholic- and nonalcoholic-lager groups had a boost in bacterial diversity in the gut and higher fecal alkaline phosphatase levels, which showed improved intestinal health. They acknowledged, however, that the nonalcoholic route would be safer and healthier for overall health.
So add a lager to the list of gut-healthy foods that you should be consuming. It may give the phrase “beer gut” a whole new meaning.
We’ve lost our minds, but at least we know how fast they’re going
The phrase “quantum consciousness” sounds like something out of a particularly cheesy episode of Star Trek: “Oh no, Captain, the quantum consciousness has invaded our computer, and the only way to drive it out is to reverse the polarity of a focused tachyon beam.”
When it comes to understanding such basic existential issues as the origin of consciousness, however, quantum mechanics wasn’t off the table. The theory of the quantum origin of consciousness dates back to the 1990s (thanks in part to noted physician Roger Penrose), and goes something like this: There are microtubules within neurons in the brain that are small enough and isolated enough from the warm, wet, and chaotic brain environment where quantum effects can briefly come into play. We’re talking miniscule fractions of a second here, but still, long enough for quantum calculations to take place in the form of system wavefunction collapse, courtesy of gravity.
To plunge even deeper into the rabbit hole of quantum mechanics, the reason Schrödinger’s cat doesn’t occur in real life is wavefunction collapse; the more massive a quantum system is, the more likely it is to collapse into one state or another (alive or dead, in the cat’s case). The quantum origin of consciousness, or Orch OR theory, holds that human consciousness arises from electrical oscillations within the neuronal microtubules caused by the computations stemming from the collapse of small quantum systems.
That is an awful lot of overly simplified explanation, especially considering the study that just came out essentially disproved it. Oops. The research, published in Physics of Life Reviews, is pretty simple. The researchers went to a lab deep underground to avoid interference from cosmic rays, and sat around for months, observing a chunk of germanium for signs of spontaneous radiation, attributable to the same sort of wavefunction collapse that is supposedly occurring in our brains. They found nothing out of the ordinary, pretty definitively disproving most of Orch OR theory.
The researchers were unwilling to completely dismiss the idea (this is quantum mechanics, after all, uncertainty kind of goes with the territory), but it does seem like we’ll have to search elsewhere for sources of human consciousness. Personally, we’re big fans of the cymbal-playing monkey.
Missing links: A real fish story
Dear LOTME:
Ear’s a question that’s been keeping me up at night. Is the human middle ear the result of top-secret government experiments involving alien technology, Abraham Lincoln, and the Illuminati?
Restless in Roswell
Dear Restless:
The paleoanthropologic community has been sorting through this mystery for decades, and fossils discovered in China over the past 20 years finally provide a much less conspiratorially satisfying answer.
For some time now, experts in the field have believed that the bones of the human middle ear evolved from the spiracular gill of a fish. The spiracle is a small hole behind each eye that opens to the mouth in some fishes and was used to breathe air in the earliest, most primitive species. But how did we get from spiracle to ear?
The missing links come in the form of the cranial anatomy of Shuyu, a 438-million-year-old, fingernail-sized skull of a jawless fish, and the 419-million-year-old fossil of a completely preserved fish with gill filaments in the first branchial chamber.
“These fossils provided the first anatomical and fossil evidence for a vertebrate spiracle originating from fish gills,” senior author Gai Zhikun, PhD, of the Institute of Vertebrate Paleontology and Paleoanthropology, Beijing, said in a written statement.
In many ways, it seems, we are fish: “Many important structures of human beings can be traced back to our fish ancestors, such as our teeth, jaws, middle ears, etc,” added Zhu Min, PhD, also of the institute.
So, Restless, the next time you hear the soothing sounds of an angry mob storming the Capitol or you chew on a slab, slice, or chunk of mutant, laboratory-produced chicken in your favorite fast-food restaurant, be sure to thank Shuyu.
Can you lend me an ear?
If you thought locusts were only a nuisance, think again. They have their uses. If you take a locust’s ear and put it inside a robot, the robot will be able to hear and receive signals. Who knew?
Researchers from Tel Aviv University in Israel showed the robot’s hearing abilities by giving clap signals that told the robot what to do: One clap means go forward, two claps mean move back. What do you think the robot would do if it heard the clap break from Cha Cha Slide?
“Our task was to replace the robot’s electronic microphone with a dead insect’s ear, use the ear’s ability to detect the electrical signals from the environment, in this case vibrations in the air, and, using a special chip, convert the insect input to that of the robot,” Ben M. Maoz, PhD, said in a statement from the university.
And how does a dead locust ear work in a robot? Well, Dr. Maoz explained: “My laboratory has developed a special device – Ear-on-a-Chip – that allows the ear to be kept alive throughout the experiment by supplying oxygen and food to the organ while allowing the electrical signals to be taken out of the locust’s ear and amplified and transmitted to the robot.”
The research won’t stop at hearing, he said, as the other four senses also will be taken into consideration. This could help us sense dangers in the future, such as earthquakes or diseases. We said it before and we’ll say it again: We’re rooting for you, science!
Nonhormonal drug for menopause symptoms passes phase 3 test
A phase 3 trial has associated the neurokinin-3 (NK3)–receptor inhibitor fezolinetant, an oral therapy taken once daily, with substantial control over the symptoms of menopause, according to results of the randomized SKYLIGHT 2 trial.
The nonhormonal therapy has the potential to address an important unmet need, Genevieve Neal-Perry, MD, PhD, said at the annual meeting of the Endocrine Society.
The health risks of hormone therapy (HT) have “caused quite a few women to consider whether hormone replacement is right for them, and, in addition, there are other individuals who have hormone-responsive cancers or other disorders that might prohibit them [from using HT],” Dr. Neal-Perry said.
The NK3 receptor stimulates the thermoregulatory center in the hypothalamus. By blocking the NK3 receptor, vasodilation and other downstream effects are inhibited, explained Dr. Neal-Perry. She credited relatively recent advances in understanding the mechanisms of menopausal symptoms for identifying this and other potentially targetable mediators.
SKYLIGHT 2 trial: Two phases
In the double-blind multinational phase 3 SKYLIGHT 2 trial, 484 otherwise healthy symptomatic menopausal women were randomized to 30 mg of fezolinetant, 45 mg of fezolinetant, or placebo. The 120 participating centers were in North American and Europe.
In the first phase, safety and efficacy were evaluated over 12 weeks. In a second extension phase, placebo patients were rerandomized to one of the fezolinetant study doses. Those on active therapy remained in their assigned groups. All patients were then followed for an additional 40 weeks.
The coprimary endpoints were frequency and severity of moderate to severe vasomotor symptoms as reported by patients using an electronic diary. There were several secondary endpoints, including patient-reported outcomes regarding sleep quality.
As expected from other controlled trials, placebo patients achieved about a 40% reduction in moderate to severe vasomotor symptom frequency over the first 12 weeks. Relative to placebo, symptom frequency declined more quickly and steeply on fezolinetant. By week 12, both achieved reductions of about 60%. Statistical P values for the differences in the three arms were not provided, but Dr. Neal-Perry reported they were significant.
Vasomotor severity, like frequency, is reduced
The change in vasomotor severity, which subjects in the trial rated as better or worse, was also significant. The differences in the severity curves were less, but they separated in favor of the two active treatment arms by about 2 weeks, and the curves continued to show an advantage for fezolinetant over both the first 12 weeks and then the remaining 40 weeks.
Overall, the decline in vasomotor symptom frequency remained on a persistent downward slope on both doses of fezolinetant for the full 52 weeks of the study, so that the reduction at 52 weeks was on the order of 25% greater than that seen at 12 weeks.
At 52 weeks, “you can see that individuals on placebo who were crossed over to an active treatment had a significant reduction in their hot flashes and look very much like those who were randomized to fezolinetant at the beginning of the study,” said Dr. Neal-Perry, who is chair of the department of obstetrics and gynecology at the University of North Carolina at Chapel Hill.
Other outcomes also favored fezolinetant over placebo. For example, a reduction in sleep disturbance observed at 12 weeks was sustained over the full 52 weeks of the study. The reduction in sleep symptoms appeared to be slightly greater on the higher dose, but the benefit at 52 weeks among patients after the crossover was similar on either active arm.
No serious side effects identified
There were no serious drug-related treatment-emergent adverse events in any treatment group. One patient in the placebo arm (< 1%), two patients in the 30-mg fezolinetant arm (1.2%), and five patients in the 45-mg arm (3%) discontinued therapy for an adverse event considered to be treatment related.
“The most common side effect associated with fezolinetant was headache. There were no other side effects that led patients to pull out of the study,” Dr. Neal-Perry reported at the meeting, which was held in Atlanta and virtually.
According to Dr. Neal-Perry the vasomotor symptoms relative to menopause, which occur in almost all women, are moderate to severe in an estimated 35%-45%. Some groups, such as those with an elevated body mass index and African Americans, appear to be at even greater risk. Study enrollment was specifically designed to include these high-risk groups, but the subgroup efficacy data have not yet been analyzed.
Other drugs with a similar mechanism of action have not been brought forward because of concern about elevated liver enzymes, but Dr. Neal-Perry said that this does not appear to be an issue for fezolinetant, which was designed with greater specificity for the NK3 target than previous treatments.
If fezolinetant is approved, Dr. Neal-Perry expects this agent to fulfill an important unmet need because of the limitations of other nonhormonal solutions for control of menopause symptoms.
HT alternatives limited
For control of many menopause symptoms, particularly hot flashes, hormone therapy (HT) is the most efficacious, but Richard J. Santen, MD, emeritus professor and an endocrinologist at the University of Virginia, Charlottesville, agreed there is a need for alternatives.
In addition to those who have contraindications for HT, Dr. Santen said in an interview that this option is not acceptable to others “for a variety of reasons.” The problem is that the alternatives are limited.
“The SSRI agents and gabapentin are alternative nonhormonal agents, but they have side effects and are not as effective,” he said. Hot flashes “can be a major disruptor of quality of life,” so he is intrigued with the positive results achieved with fezolinetant.
“A new drug such as reported at the Endocrine Society meeting would be an important new addition to the armamentarium,” he said.
Dr. Neal-Perry reports no conflicts of interest.
FROM ENDO 2022
Health Systems Education Leadership: Learning From the VA Designated Education Officer Role
The US Department of Veterans Affairs (VA) operates the largest integrated health care system in the United States, providing physical and mental health care to more than 9 million veterans enrolled each year through a national system of inpatient, outpatient, and long-term care settings.1 As 1 of 4 statutory missions, the VA conducts the largest training effort for health professionals in cooperation with affiliated academic institutions. From 2016 through 2020, an average of 123,000 trainees from various professions received training at the VA.2 Physician residents comprised the largest trainee group (37%), followed by associated health students and residents (20%), and nursing professionals (21%).2 In VA, associated health professions include all health care disciplines other than allopathic and osteopathic medicine, dentistry, and nursing. The associated health professions encompass about 40 specialties, including audiology, dietetics, physical and occupational therapy, optometry, pharmacy, podiatry, psychology, and social work.
The VA also trains a smaller number of advanced fellows to address specialties important to the nation and veterans health that are not sufficiently addressed by standard accredited professional training.3 The VA Advanced Fellowship programs include 22 postresidency, postdoctoral, and postmasters fellowships to physicians and dentists, and associated health professions, including psychologists, social workers, and pharmacists. 3 From 2015 to 2019, 57 to 61% of medical school students reported having a VA clinical training experience during medical school.4 Of current VA employees, 20% of registered nurses, 64% of physicians, 73% of podiatrists and optometrists, and 81% of psychologists reported VA training prior to employment.5
Health professions education is led by the designated education officer (DEO) at each VA facility.6 Also known as the associate chief of staff for education (ACOS/E), the DEO is a leadership position that is accountable to local VA facility executive leadership as well as the national Office of Academic Affiliations (OAA), which directs all VA health professions training across the US.6 At most VA facilities, the DEO oversees clinical training and education reporting directly to the facility chief of staff. At the same time, the ACOS/E is accountable to the OAA to ensure adherence with national education directives and policy. The DEO oversees trainee programs through collaboration with training program directors, faculty, academic affiliates, and accreditation agencies across > 40 health professions.
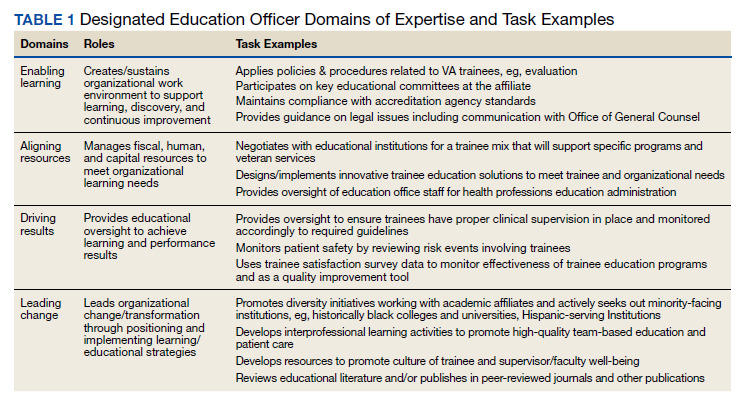
The DEO is expected to possess expertise in leadership attributes identified by the US Office of Personnel Management as essential to build a federal corporate culture that drives results, serves customers, and builds successful teams and coalitions within and outside the VA.7 These leadership attributes include leading change, leading people, driving results, business acumen, and building coalitions.7 They are operationalized by OAA as 4 domains of expertise required to lead education across multiple professions, including: (1) creating and sustaining an organizational work environment that supports learning, discovery, and continuous improvement; (2) aligning and managing fiscal, human, and capital resources to meet organizational learning needs; (3) driving learning and performance results to impact organizational success; and (4) leading change and transformation through positioning and implementing innovative learning and education strategies (Table 1).6
In this article we describe the VA DEO leadership role and the tasks required to lead education across multiple professions within the VA health care system. Given the broad scope of leading educational programs across multiple clinical professions and the interprofessional backgrounds of DEOs across the VA, we evaluated DEO self-perceived effectiveness to impact educational decisions and behavior by professional discipline. Our evaluation question is: Are different professional education and practice backgrounds functionally capable of providing leadership over all education of health professions training programs? Finally, we describe DEOs perceptions of facilitators and barriers to performing their DEO role within the VA.
Methods
We conducted a mixed methods analysis of data collected by OAA to assess DEO needs within a multiprofessional clinical learning environment. The needs assessment was conducted by an OAA evaluator (NH) with input on instrument development and data analysis from OAA leadership (KS, MB). This evaluation is categorized as an operations activity based on VA Handbook 1200 where information generated is used for business operations and quality improvement. 8 The overall project was subject to administrative rather than institutional review board oversight.
A needs assessment tool was developed based on the OAA domains of expertise.6 Prior to its administration, the tool was piloted with 8 DEOs in the field and the survey shortened based on their feedback. DEOs were asked about individual professional characteristics (eg, clinical profession, academic appointment, type of health professions training programs at the VA site) and their self-perceived effectiveness in impacting educational decisions and behaviors on general and profession-specific tasks within each of the 4 domains of expertise on a 5-point Likert scale (1, not effective; 5, very effective). 6,9 The needs assessment also included an open-ended question asking respondents to comment on any issues they felt important to understanding DEO role effectiveness.
The needs assessment was administered online via SurveyMonkey to 132 DEOs via email in September and October 2019. The DEOs represented 148 of 160 VA facilities with health professions education; 14 DEOs covered > 1 VA facility, and 12 positions were vacant. Email reminders were sent to nonresponders after 1 week. At 2 weeks, nonresponders received telephone reminders and personalized follow-up emails from OAA staff. The response rate at the end of 3 weeks was 96%.
Data Analysis
Mixed methods analyses included quantitative analyses to identify differences in general and profession-specific self-ratings of effectiveness in influencing educational decisions and behaviors by DEO profession, and qualitative analyses to further understand DEO’s perceptions of facilitators and barriers to DEO task effectiveness.10,11 Quantitative analyses included descriptive statistics for all variables followed by nonparametric tests including χ2 and Mann- Whitney U tests to assess differences between physician and other professional DEOs in descriptive characteristics and selfperceived effectiveness on general and profession- specific tasks. Quantitative analyses were conducted using SPSS software, version 26. Qualitative analyses consisted of rapid assessment procedures to identify facilitators and barriers to DEO effectiveness by profession using Atlas.ti version 8, which involved reviewing responses to the open-ended question and assigning each response to predetermined categories based on the organizational level it applied to (eg, individual DEO, VA facility, or external to the organization).12,13 Responses within categories were then summarized to identify the main themes.
Results
Completed surveys were received from 127 respondents representing 139 VA facilities. Eighty percent were physicians and 20% were other professionals, including psychologists, pharmacists, dentists, dieticians, nurses, and nonclinicians. There were no statistically significant differences between physician and other professional DEOs in the percent working full time or length of time spent working in the position. About one-third of the sample had been in the position for < 2 years, one-third had been in the position for 2 to < 5 years, and one-third had been in the role for ≥ 5 years. Eighty percent reported having a faculty appointment with an academic affiliate. While 92% of physician DEOs had a faculty appointment, only 40% of other professional DEOs did (P < .001). Most faculty appointments for both groups were with a school of medicine. More physician DEOs than other professionals had training programs at their site for physicians (P = .003) and dentists (P < .001), but there were no statistically significant differences for having associated health, nursing, or advanced fellowship training programs at their sites. Across all DEOs, 98% reported training programs at their site for associated health professions, 95% for physician training, 93% for nursing training, 59% for dental training, and 48% for advanced fellowships.
Self-Perceived Effectiveness
There were no statistically significant differences between physician and other professional DEOs on self-perceived effectiveness in impacting educational decisions or behaviors for general tasks applicable across professions (Table 2). This result held even after controlling for length of time in the position and whether the DEO had an academic appointment. Generally, both groups reported being effective on tasks in the enabling learning domain, including applying policies and procedures related to trainees who rotate through the VA and maintaining adherence with accreditation agency standards across health professions. Mean score ranges for both physician and other professional DEOs reported moderate effectiveness in aligning resources effectiveness questions (2.45-3.72 vs 2.75-3.76), driving results questions (3.02-3.60 vs 3.39-3.48), and leading change questions (3.12-3.50 vs 3.42-3.80).
For profession-specific tasks, effectiveness ratings between the 2 groups were generally not statistically significant for medical, dental, and advanced fellowship training programs (Table 3). There was a pattern of statistically significant differences between physician and other professional DEOs for associated health and nursing training programs on tasks across the 4 domains of expertise with physicians having lower mean ratings compared with other professionals. Generally, physician DEOs had higher task effectiveness when compared with other professionals for medical training programs, and other professionals had higher task effectiveness ratings than did physicians for associated health or nursing training programs.
Facilitators and Barriers
Seventy responses related to facilitators and barriers to DEO effectiveness were received (59 from physicians and 11 from other professionals). Most responses were categorized as individual level facilitators or barriers (53% for physician and 64% for other professionals). Only 3% of comments were categorized as external to the organization (all made by physicians). The themes were similar for both groups and were aggregated in Table 4. Facilitators included continuing education, having a mentor who works at a similar type of facility, maintaining balance and time management when working with different training programs, learning to work and develop relationships with training program directors, developing an overall picture of each type of health professions training program, holding regular meetings with all health training programs and academic affiliates, having a formal education service line with budget and staffing, facility executive leadership who are knowledgeable of the education mission and DEO role, having a national oversight body, and the DEO’s relationships with academic affiliates.
Barriers to role effectiveness at the individual DEO level included assignment of multiple roles and a focus on regulation and monitoring with little time for development of new programs and strategic planning. The organizational level barriers included difficulty getting core services to engage with health professions trainees and siloed education leadership.
Discussion
DEOs oversee multiple health professions training programs within local facilities. The DEO is accountable to local VA facility leadership and a national education office to lead local health professions education at local facilities and integrate these educational activities across the national VA system.
The VA DEO role is similar to the Accreditation Council for Graduate Medical Education designated institutional official (DIO) except that the VA DEO provides oversight of > 40 health professions training programs.14,15 The VA DEO, therefore, has broader oversight than the DIO role that focuses only on graduate physician education. Similar to the DIO, the VA DEO role initially emphasized the enabling learning and aligning resources domains to provide oversight and administration of health professions training programs. Over time, both roles have expanded to include defining and ensuring healthy clinical learning environments, aligning educational resources and training with the institutional mission, workforce, and societal needs, and creating continuous educational improvement models.6,16,17 To accomplish these expanded goals, both the DEO and the DIO work closely with other educational leaders at the academic affiliate and the VA facility. As health professions education advances, there will be increased emphasis placed on delivering educational programs to improve clinical practice and health care outcomes.18
Our findings that DEO profession did not influence self-ratings of effectiveness to influence educational decisions or behaviors on general tasks applicable across health professions suggest that education and practice background are not factors influencing selfratings. Nor were self-ratings influenced by other factors. Since the DEO is a senior leadership position, candidates for the position already may possess managerial and leadership skills. In our sample, several individuals commented that they had prior education leadership positions, eg, training program director or had years of experience working in the VA. Similarly, having an academic appointment may not be important for the performance of general administrative tasks. However, an academic appointment may be important for effective performance of educational tasks, such as clinical teaching, didactic training, and curriculum development, which were not measured in this study.
The finding of differences in self-ratings between physicians and other professionals on profession-specific tasks for associated health and nursing suggests that physicians may require additional curriculum to enhance their knowledge in managing other professional educational programs. For nursing specifically, this finding could also reflect substantial input from the lead nurse executive in the facility. DEOs also identified practical ways to facilitate their work with multiple health professions that could immediately be put into practice, including developing relationships and enhancing communication with training program directors, faculty, and academic affiliates of each profession.
Taken together, the quantitative and qualitative findings indicate that despite differences in professional backgrounds, DEOs have high self-ratings of their own effectiveness to influence educational decisions and behaviors on general tasks they are expected to accomplish. There are some professionspecific tasks where professional background does influence self-perceived effectiveness, ie, physicians have higher self-ratings on physician-specific tasks and other professionals have higher self-ratings on associated health or nursing tasks. These perceived differences may be mitigated by increasing facilitators and decreasing barriers identified for the individual DEO, within the organization, and external to the organization.
Limitations Our findings should be interpreted with the following limitations in mind. The selfreport nature of the data opens the possibility of self-report bias or Dunning-Kruger effects where effectiveness ratings could have been overestimated by respondents.21 Although respondents were assured of their anonymity and that results would only be reported in the aggregate, there is potential for providing more positive responses on a needs assessment administered by the national education program office. We recommend further work be conducted to validate the needs assessment tool against other data collection methods, such as actual outcomes of educational effectiveness. Our study did not incorporate measures of educational effectiveness to determine whether self-perceived DEO effectiveness is translated to better trainee or learning outcomes. Before this can happen, educational policymakers must identify the most important facility-level learning outcomes. Since the DEO is a facility level educational administrator, learning efeffectiveness must be defined at the facility level. The qualitative findings could also be expanded through the application of more detailed qualitative methods, such as indepth interviews. The tasks rated by DEOs were based on OAA’s current definition of the DEO role.6 As the field advances, DEO tasks will also evolve.22-24
Conclusions
The DEO is a senior educational leadership role that oversees all health professions training in the VA. Our findings are supportive of individuals from various health disciplines serving in the VA DEO role with responsibilities that span multiple health profession training programs. We recommend further work to validate the instrument used in this study, as well as the application of qualitative methods like indepth interviews to further our understanding of the DEO role.
1. US Department of Veterans Affairs, Veterans Health Administration. Updated April 18, 2022. Accessed May 6, 2022. https://www.va.gov/health/aboutvha.asp
2. US Department of Veterans Affairs, Veterans Health Administration, Office of Academic Affiliations. Health professions education: academic Year 2019-2020. Published 2020. Accessed May 6, 2022. https://www.va.gov/OAA/docs /OAA_Statistics_2020.pdf
3. US Department of Veterans Affairs, Veterans Health Administration, Office of Academic Affiliations. Advanced Fellowships and Professional Development. Updated November 26, 2021. Accessed May 6, 2022. https://www.va.gov/oaa /advancedfellowships/advanced-fellowships.asp
4. Association of American Medical Colleges. Medical school graduation questionnaire, 2019 all schools summary report. Published July 2019. Accessed May 6, 2022. https://www.aamc.org/system/files/2019-08/2019-gq-all-schools -summary-report.pdf
5. US Department of Veterans Affairs, National Center for Organization Development. VA all employee survey. Published 2019. Accessed May 6, 2022. https://www.va.gov /NCOD/VAworkforcesurveys.asp
6. US Department of Veterans Affairs, Veterans Health Administration, Office of Academic Affiliations. Education leaders in the VA: the role of the designated education officer (DEO). Published December 2019. Accessed May 6, 2022. https://www.va.gov/OAA/docs/DEO_Learning _Leader_2019.pdf
7. US Office of Personnel Management. Policy, data oversight: guide to senior executive service qualifications. Published 2010. Accessed May 6, 2022. https://www.opm .gov/policy-data-oversight/senior-executive-service /executive-core-qualifications/
8. US Department of Veterans Affairs, Office of Research and Development. Program guide: 1200.21 VHA operations activities that may constitute research. Published January 9, 2019. Accessed May 6, 2022. https://www.research .va.gov/resources/policies/ProgramGuide-1200-21-VHA -Operations-Activities.pdf
9. Riesenberg LA, Rosenbaum PF, Stick SL. Competencies, essential training, and resources viewed by designated institutional officials as important to the position in graduate medical education [published correction appears in Acad Med. 2006 Dec;81(12):1025]. Acad Med. 2006;81(5):426- 431. doi:10.1097/01.ACM.0000222279.28824.f5
10. Palinkas LA, Mendon SJ, Hamilton AB. Inn o v a t i o n s i n M i x e d M e t h o d s E v a l u a - tions. Annu Rev Public Health. 2019;40:423-442. doi:10.1146/annurev-publhealth-040218-044215
11. Tashakkori A, Creswell JW. Exploring the nature of research questions in mixed methods research. J Mix Methods Res. 2007;1(3):207-211. doi:10.1177/1558689807302814
12. Averill JB. Matrix analysis as a complementary analytic strategy in qualitative inquiry. Qual Health Res. 2002;12(6):855-866. doi:10.1177/104973230201200611
13. Hamilton AB, Finley EP. Qualitative methods in implementation research: An introduction. Psychiatry Res. 2019;280:112516.
14. Bellini L, Hartmann D, Opas L. Beyond must: supporting the evolving role of the designated institutional official. J Grad Med Educ. 2010;2(2):147-150. doi:10.4300/JGME-D-10-00073.1
15. Riesenberg LA, Rosenbaum P, Stick SL. Characteristics, roles, and responsibilities of the Designated Institutional Official (DIO) position in graduate medical education education [published correction appears in Acad Med. 2006 Dec;81(12):1025] [published correction appears in Acad Med. 2006 Mar;81(3):274]. Acad Med. 2006;81(1):8-19. doi:10.1097/00001888-200601000-00005
16. Group on Resident Affairs Core Competency Task Force. Institutional GME leadership competencies. 2015. Accessed May 6, 2022. https://www.aamc.org/system /files/c/2/441248-institutionalgmeleadershipcompetencies .pdf
17. Weiss KB, Bagian JP, Nasca TJ. The clinical learning environment: the foundation of graduate medical education. JAMA. 2013;309(16):1687-1688. doi:10.1001/jama.2013.1931
18. Beliveau ME, Warnes CA, Harrington RA, et al. Organizational change, leadership, and the transformation of continuing professional development: lessons learned from the American College of Cardiology. J Contin Educ Health Prof. 2015;35(3):201-210. doi:10.1002/chp.21301
19. World Health Organization. Framework for Action on Interprofessional Education and Collaborative Practice. Published September 1, 2020. Accessed May 10, 2022. https://www.who.int/publications/i/item/framework -for-action-on-interprofessional-education-collaborative -practice
20. Weiss K, Passiment M, Riordan L, Wagner R for the National Collaborative for Improving the Clinical Learning Environment IP-CLE Report Work Group. Achieving the optimal interprofessional clinical learning environment: proceedings from an NCICLE symposium. Published January 18, 2019. Accessed May 6, 2022. doi:10.33385/NCICLE.0002
21. Althubaiti A. Information bias in health research: definition, pitfalls, and adjustment methods. J Multidiscip Healthc. 2016;9:211-217. Published 2016 May 4. doi:10.2147/JMDH.S104807
22. Gilman SC, Chokshi DA, Bowen JL, Rugen KW, Cox M. Connecting the dots: interprofessional health education and delivery system redesign at the Veterans Health Administration. Acad Med. 2014;89(8):1113-1116. doi:10.1097/ACM.0000000000000312
23. Health Professions Accreditors Collaborative. Guidance on developing quality interprofessional education for the health professions. Published February 1, 2019. Accessed May 6, 2022. https://healthprofessionsaccreditors.org/wp -content/uploads/2019/02/HPACGuidance02-01-19.pdf
24. Watts BV, Paull DE, Williams LC, Neily J, Hemphill RR, Brannen JL. Department of Veterans Affairs Chief Resident in Quality and Patient Safety Program: a model to spread change. Am J Med Qual. 2016;31(6):598-600. doi:10.1177/1062860616643403
The US Department of Veterans Affairs (VA) operates the largest integrated health care system in the United States, providing physical and mental health care to more than 9 million veterans enrolled each year through a national system of inpatient, outpatient, and long-term care settings.1 As 1 of 4 statutory missions, the VA conducts the largest training effort for health professionals in cooperation with affiliated academic institutions. From 2016 through 2020, an average of 123,000 trainees from various professions received training at the VA.2 Physician residents comprised the largest trainee group (37%), followed by associated health students and residents (20%), and nursing professionals (21%).2 In VA, associated health professions include all health care disciplines other than allopathic and osteopathic medicine, dentistry, and nursing. The associated health professions encompass about 40 specialties, including audiology, dietetics, physical and occupational therapy, optometry, pharmacy, podiatry, psychology, and social work.
The VA also trains a smaller number of advanced fellows to address specialties important to the nation and veterans health that are not sufficiently addressed by standard accredited professional training.3 The VA Advanced Fellowship programs include 22 postresidency, postdoctoral, and postmasters fellowships to physicians and dentists, and associated health professions, including psychologists, social workers, and pharmacists. 3 From 2015 to 2019, 57 to 61% of medical school students reported having a VA clinical training experience during medical school.4 Of current VA employees, 20% of registered nurses, 64% of physicians, 73% of podiatrists and optometrists, and 81% of psychologists reported VA training prior to employment.5
Health professions education is led by the designated education officer (DEO) at each VA facility.6 Also known as the associate chief of staff for education (ACOS/E), the DEO is a leadership position that is accountable to local VA facility executive leadership as well as the national Office of Academic Affiliations (OAA), which directs all VA health professions training across the US.6 At most VA facilities, the DEO oversees clinical training and education reporting directly to the facility chief of staff. At the same time, the ACOS/E is accountable to the OAA to ensure adherence with national education directives and policy. The DEO oversees trainee programs through collaboration with training program directors, faculty, academic affiliates, and accreditation agencies across > 40 health professions.
The DEO is expected to possess expertise in leadership attributes identified by the US Office of Personnel Management as essential to build a federal corporate culture that drives results, serves customers, and builds successful teams and coalitions within and outside the VA.7 These leadership attributes include leading change, leading people, driving results, business acumen, and building coalitions.7 They are operationalized by OAA as 4 domains of expertise required to lead education across multiple professions, including: (1) creating and sustaining an organizational work environment that supports learning, discovery, and continuous improvement; (2) aligning and managing fiscal, human, and capital resources to meet organizational learning needs; (3) driving learning and performance results to impact organizational success; and (4) leading change and transformation through positioning and implementing innovative learning and education strategies (Table 1).6
In this article we describe the VA DEO leadership role and the tasks required to lead education across multiple professions within the VA health care system. Given the broad scope of leading educational programs across multiple clinical professions and the interprofessional backgrounds of DEOs across the VA, we evaluated DEO self-perceived effectiveness to impact educational decisions and behavior by professional discipline. Our evaluation question is: Are different professional education and practice backgrounds functionally capable of providing leadership over all education of health professions training programs? Finally, we describe DEOs perceptions of facilitators and barriers to performing their DEO role within the VA.
Methods
We conducted a mixed methods analysis of data collected by OAA to assess DEO needs within a multiprofessional clinical learning environment. The needs assessment was conducted by an OAA evaluator (NH) with input on instrument development and data analysis from OAA leadership (KS, MB). This evaluation is categorized as an operations activity based on VA Handbook 1200 where information generated is used for business operations and quality improvement. 8 The overall project was subject to administrative rather than institutional review board oversight.
A needs assessment tool was developed based on the OAA domains of expertise.6 Prior to its administration, the tool was piloted with 8 DEOs in the field and the survey shortened based on their feedback. DEOs were asked about individual professional characteristics (eg, clinical profession, academic appointment, type of health professions training programs at the VA site) and their self-perceived effectiveness in impacting educational decisions and behaviors on general and profession-specific tasks within each of the 4 domains of expertise on a 5-point Likert scale (1, not effective; 5, very effective). 6,9 The needs assessment also included an open-ended question asking respondents to comment on any issues they felt important to understanding DEO role effectiveness.
The needs assessment was administered online via SurveyMonkey to 132 DEOs via email in September and October 2019. The DEOs represented 148 of 160 VA facilities with health professions education; 14 DEOs covered > 1 VA facility, and 12 positions were vacant. Email reminders were sent to nonresponders after 1 week. At 2 weeks, nonresponders received telephone reminders and personalized follow-up emails from OAA staff. The response rate at the end of 3 weeks was 96%.
Data Analysis
Mixed methods analyses included quantitative analyses to identify differences in general and profession-specific self-ratings of effectiveness in influencing educational decisions and behaviors by DEO profession, and qualitative analyses to further understand DEO’s perceptions of facilitators and barriers to DEO task effectiveness.10,11 Quantitative analyses included descriptive statistics for all variables followed by nonparametric tests including χ2 and Mann- Whitney U tests to assess differences between physician and other professional DEOs in descriptive characteristics and selfperceived effectiveness on general and profession- specific tasks. Quantitative analyses were conducted using SPSS software, version 26. Qualitative analyses consisted of rapid assessment procedures to identify facilitators and barriers to DEO effectiveness by profession using Atlas.ti version 8, which involved reviewing responses to the open-ended question and assigning each response to predetermined categories based on the organizational level it applied to (eg, individual DEO, VA facility, or external to the organization).12,13 Responses within categories were then summarized to identify the main themes.
Results
Completed surveys were received from 127 respondents representing 139 VA facilities. Eighty percent were physicians and 20% were other professionals, including psychologists, pharmacists, dentists, dieticians, nurses, and nonclinicians. There were no statistically significant differences between physician and other professional DEOs in the percent working full time or length of time spent working in the position. About one-third of the sample had been in the position for < 2 years, one-third had been in the position for 2 to < 5 years, and one-third had been in the role for ≥ 5 years. Eighty percent reported having a faculty appointment with an academic affiliate. While 92% of physician DEOs had a faculty appointment, only 40% of other professional DEOs did (P < .001). Most faculty appointments for both groups were with a school of medicine. More physician DEOs than other professionals had training programs at their site for physicians (P = .003) and dentists (P < .001), but there were no statistically significant differences for having associated health, nursing, or advanced fellowship training programs at their sites. Across all DEOs, 98% reported training programs at their site for associated health professions, 95% for physician training, 93% for nursing training, 59% for dental training, and 48% for advanced fellowships.
Self-Perceived Effectiveness
There were no statistically significant differences between physician and other professional DEOs on self-perceived effectiveness in impacting educational decisions or behaviors for general tasks applicable across professions (Table 2). This result held even after controlling for length of time in the position and whether the DEO had an academic appointment. Generally, both groups reported being effective on tasks in the enabling learning domain, including applying policies and procedures related to trainees who rotate through the VA and maintaining adherence with accreditation agency standards across health professions. Mean score ranges for both physician and other professional DEOs reported moderate effectiveness in aligning resources effectiveness questions (2.45-3.72 vs 2.75-3.76), driving results questions (3.02-3.60 vs 3.39-3.48), and leading change questions (3.12-3.50 vs 3.42-3.80).
For profession-specific tasks, effectiveness ratings between the 2 groups were generally not statistically significant for medical, dental, and advanced fellowship training programs (Table 3). There was a pattern of statistically significant differences between physician and other professional DEOs for associated health and nursing training programs on tasks across the 4 domains of expertise with physicians having lower mean ratings compared with other professionals. Generally, physician DEOs had higher task effectiveness when compared with other professionals for medical training programs, and other professionals had higher task effectiveness ratings than did physicians for associated health or nursing training programs.
Facilitators and Barriers
Seventy responses related to facilitators and barriers to DEO effectiveness were received (59 from physicians and 11 from other professionals). Most responses were categorized as individual level facilitators or barriers (53% for physician and 64% for other professionals). Only 3% of comments were categorized as external to the organization (all made by physicians). The themes were similar for both groups and were aggregated in Table 4. Facilitators included continuing education, having a mentor who works at a similar type of facility, maintaining balance and time management when working with different training programs, learning to work and develop relationships with training program directors, developing an overall picture of each type of health professions training program, holding regular meetings with all health training programs and academic affiliates, having a formal education service line with budget and staffing, facility executive leadership who are knowledgeable of the education mission and DEO role, having a national oversight body, and the DEO’s relationships with academic affiliates.
Barriers to role effectiveness at the individual DEO level included assignment of multiple roles and a focus on regulation and monitoring with little time for development of new programs and strategic planning. The organizational level barriers included difficulty getting core services to engage with health professions trainees and siloed education leadership.
Discussion
DEOs oversee multiple health professions training programs within local facilities. The DEO is accountable to local VA facility leadership and a national education office to lead local health professions education at local facilities and integrate these educational activities across the national VA system.
The VA DEO role is similar to the Accreditation Council for Graduate Medical Education designated institutional official (DIO) except that the VA DEO provides oversight of > 40 health professions training programs.14,15 The VA DEO, therefore, has broader oversight than the DIO role that focuses only on graduate physician education. Similar to the DIO, the VA DEO role initially emphasized the enabling learning and aligning resources domains to provide oversight and administration of health professions training programs. Over time, both roles have expanded to include defining and ensuring healthy clinical learning environments, aligning educational resources and training with the institutional mission, workforce, and societal needs, and creating continuous educational improvement models.6,16,17 To accomplish these expanded goals, both the DEO and the DIO work closely with other educational leaders at the academic affiliate and the VA facility. As health professions education advances, there will be increased emphasis placed on delivering educational programs to improve clinical practice and health care outcomes.18
Our findings that DEO profession did not influence self-ratings of effectiveness to influence educational decisions or behaviors on general tasks applicable across health professions suggest that education and practice background are not factors influencing selfratings. Nor were self-ratings influenced by other factors. Since the DEO is a senior leadership position, candidates for the position already may possess managerial and leadership skills. In our sample, several individuals commented that they had prior education leadership positions, eg, training program director or had years of experience working in the VA. Similarly, having an academic appointment may not be important for the performance of general administrative tasks. However, an academic appointment may be important for effective performance of educational tasks, such as clinical teaching, didactic training, and curriculum development, which were not measured in this study.
The finding of differences in self-ratings between physicians and other professionals on profession-specific tasks for associated health and nursing suggests that physicians may require additional curriculum to enhance their knowledge in managing other professional educational programs. For nursing specifically, this finding could also reflect substantial input from the lead nurse executive in the facility. DEOs also identified practical ways to facilitate their work with multiple health professions that could immediately be put into practice, including developing relationships and enhancing communication with training program directors, faculty, and academic affiliates of each profession.
Taken together, the quantitative and qualitative findings indicate that despite differences in professional backgrounds, DEOs have high self-ratings of their own effectiveness to influence educational decisions and behaviors on general tasks they are expected to accomplish. There are some professionspecific tasks where professional background does influence self-perceived effectiveness, ie, physicians have higher self-ratings on physician-specific tasks and other professionals have higher self-ratings on associated health or nursing tasks. These perceived differences may be mitigated by increasing facilitators and decreasing barriers identified for the individual DEO, within the organization, and external to the organization.
Limitations Our findings should be interpreted with the following limitations in mind. The selfreport nature of the data opens the possibility of self-report bias or Dunning-Kruger effects where effectiveness ratings could have been overestimated by respondents.21 Although respondents were assured of their anonymity and that results would only be reported in the aggregate, there is potential for providing more positive responses on a needs assessment administered by the national education program office. We recommend further work be conducted to validate the needs assessment tool against other data collection methods, such as actual outcomes of educational effectiveness. Our study did not incorporate measures of educational effectiveness to determine whether self-perceived DEO effectiveness is translated to better trainee or learning outcomes. Before this can happen, educational policymakers must identify the most important facility-level learning outcomes. Since the DEO is a facility level educational administrator, learning efeffectiveness must be defined at the facility level. The qualitative findings could also be expanded through the application of more detailed qualitative methods, such as indepth interviews. The tasks rated by DEOs were based on OAA’s current definition of the DEO role.6 As the field advances, DEO tasks will also evolve.22-24
Conclusions
The DEO is a senior educational leadership role that oversees all health professions training in the VA. Our findings are supportive of individuals from various health disciplines serving in the VA DEO role with responsibilities that span multiple health profession training programs. We recommend further work to validate the instrument used in this study, as well as the application of qualitative methods like indepth interviews to further our understanding of the DEO role.
1. US Department of Veterans Affairs, Veterans Health Administration. Updated April 18, 2022. Accessed May 6, 2022. https://www.va.gov/health/aboutvha.asp
2. US Department of Veterans Affairs, Veterans Health Administration, Office of Academic Affiliations. Health professions education: academic Year 2019-2020. Published 2020. Accessed May 6, 2022. https://www.va.gov/OAA/docs /OAA_Statistics_2020.pdf
3. US Department of Veterans Affairs, Veterans Health Administration, Office of Academic Affiliations. Advanced Fellowships and Professional Development. Updated November 26, 2021. Accessed May 6, 2022. https://www.va.gov/oaa /advancedfellowships/advanced-fellowships.asp
4. Association of American Medical Colleges. Medical school graduation questionnaire, 2019 all schools summary report. Published July 2019. Accessed May 6, 2022. https://www.aamc.org/system/files/2019-08/2019-gq-all-schools -summary-report.pdf
5. US Department of Veterans Affairs, National Center for Organization Development. VA all employee survey. Published 2019. Accessed May 6, 2022. https://www.va.gov /NCOD/VAworkforcesurveys.asp
6. US Department of Veterans Affairs, Veterans Health Administration, Office of Academic Affiliations. Education leaders in the VA: the role of the designated education officer (DEO). Published December 2019. Accessed May 6, 2022. https://www.va.gov/OAA/docs/DEO_Learning _Leader_2019.pdf
7. US Office of Personnel Management. Policy, data oversight: guide to senior executive service qualifications. Published 2010. Accessed May 6, 2022. https://www.opm .gov/policy-data-oversight/senior-executive-service /executive-core-qualifications/
8. US Department of Veterans Affairs, Office of Research and Development. Program guide: 1200.21 VHA operations activities that may constitute research. Published January 9, 2019. Accessed May 6, 2022. https://www.research .va.gov/resources/policies/ProgramGuide-1200-21-VHA -Operations-Activities.pdf
9. Riesenberg LA, Rosenbaum PF, Stick SL. Competencies, essential training, and resources viewed by designated institutional officials as important to the position in graduate medical education [published correction appears in Acad Med. 2006 Dec;81(12):1025]. Acad Med. 2006;81(5):426- 431. doi:10.1097/01.ACM.0000222279.28824.f5
10. Palinkas LA, Mendon SJ, Hamilton AB. Inn o v a t i o n s i n M i x e d M e t h o d s E v a l u a - tions. Annu Rev Public Health. 2019;40:423-442. doi:10.1146/annurev-publhealth-040218-044215
11. Tashakkori A, Creswell JW. Exploring the nature of research questions in mixed methods research. J Mix Methods Res. 2007;1(3):207-211. doi:10.1177/1558689807302814
12. Averill JB. Matrix analysis as a complementary analytic strategy in qualitative inquiry. Qual Health Res. 2002;12(6):855-866. doi:10.1177/104973230201200611
13. Hamilton AB, Finley EP. Qualitative methods in implementation research: An introduction. Psychiatry Res. 2019;280:112516.
14. Bellini L, Hartmann D, Opas L. Beyond must: supporting the evolving role of the designated institutional official. J Grad Med Educ. 2010;2(2):147-150. doi:10.4300/JGME-D-10-00073.1
15. Riesenberg LA, Rosenbaum P, Stick SL. Characteristics, roles, and responsibilities of the Designated Institutional Official (DIO) position in graduate medical education education [published correction appears in Acad Med. 2006 Dec;81(12):1025] [published correction appears in Acad Med. 2006 Mar;81(3):274]. Acad Med. 2006;81(1):8-19. doi:10.1097/00001888-200601000-00005
16. Group on Resident Affairs Core Competency Task Force. Institutional GME leadership competencies. 2015. Accessed May 6, 2022. https://www.aamc.org/system /files/c/2/441248-institutionalgmeleadershipcompetencies .pdf
17. Weiss KB, Bagian JP, Nasca TJ. The clinical learning environment: the foundation of graduate medical education. JAMA. 2013;309(16):1687-1688. doi:10.1001/jama.2013.1931
18. Beliveau ME, Warnes CA, Harrington RA, et al. Organizational change, leadership, and the transformation of continuing professional development: lessons learned from the American College of Cardiology. J Contin Educ Health Prof. 2015;35(3):201-210. doi:10.1002/chp.21301
19. World Health Organization. Framework for Action on Interprofessional Education and Collaborative Practice. Published September 1, 2020. Accessed May 10, 2022. https://www.who.int/publications/i/item/framework -for-action-on-interprofessional-education-collaborative -practice
20. Weiss K, Passiment M, Riordan L, Wagner R for the National Collaborative for Improving the Clinical Learning Environment IP-CLE Report Work Group. Achieving the optimal interprofessional clinical learning environment: proceedings from an NCICLE symposium. Published January 18, 2019. Accessed May 6, 2022. doi:10.33385/NCICLE.0002
21. Althubaiti A. Information bias in health research: definition, pitfalls, and adjustment methods. J Multidiscip Healthc. 2016;9:211-217. Published 2016 May 4. doi:10.2147/JMDH.S104807
22. Gilman SC, Chokshi DA, Bowen JL, Rugen KW, Cox M. Connecting the dots: interprofessional health education and delivery system redesign at the Veterans Health Administration. Acad Med. 2014;89(8):1113-1116. doi:10.1097/ACM.0000000000000312
23. Health Professions Accreditors Collaborative. Guidance on developing quality interprofessional education for the health professions. Published February 1, 2019. Accessed May 6, 2022. https://healthprofessionsaccreditors.org/wp -content/uploads/2019/02/HPACGuidance02-01-19.pdf
24. Watts BV, Paull DE, Williams LC, Neily J, Hemphill RR, Brannen JL. Department of Veterans Affairs Chief Resident in Quality and Patient Safety Program: a model to spread change. Am J Med Qual. 2016;31(6):598-600. doi:10.1177/1062860616643403
‘Forever chemicals’ linked to hypertension in middle-aged women
In a large, prospective study, researchers found an association between higher blood levels of PFAS and increased risk of hypertension in middle-aged women. Women in the highest tertile of overall PFAS concentrations had a 71% increased risk of developing hypertension.
“Our findings suggest that long-term cumulative exposure, even before midlife, may increase the risk of high blood pressure, and therefore, the benefit of reducing the population exposure to PFAS and potential prevention of high blood pressure and other health conditions would be enormous,” Sung Kyun Park, ScD, MPH, University of Michigan School of Public Health, Ann Arbor, said in an interview.
The study was published online in Hypertension.
Everywhere and forever
“PFAS are forever chemicals as well as everywhere chemicals,” Dr. Park noted.
Possible sources of PFAS exposure run the gamut from nonstick cookware, food wrappers, and waterproof fabrics to cosmetics and drinking water. They have been detected in the blood of most people and have been linked to a variety of health concerns.
“A few studies showed an association between PFAS and hypertension, but those were cross-sectional and examined prevalence of hypertension. It was unclear whether PFAS are associated with the development (incidence) of hypertension,” Dr. Park explained.
For their study, the researchers examined the association between serum concentrations of PFAS and risks of incident hypertension in 1,058 initially normotensive women participating in the Study of Women’s Health Across the Nation-Multi-Pollutant Study (SWAN-MPS). They were followed annually between 1999 and 2017.
During 11,722 person-years of follow-up, 470 of the women developed hypertension, at a rate of 40.1 cases per 1,000 person-years. Hypertension was defined as blood pressure of at least 140 mm Hg systolic or at least 90 mm Hg diastolic or receiving antihypertensive treatment.
Women in the highest tertile of baseline serum concentration of perfluorooctane sulfonate (PFOS) had a 42% higher risk of developing hypertension, compared with peers in the lowest tertile (adjusted hazard ratio, 1.42; 95% confidence interval, 1.19-1.68; P trend = .01).
Similar results were found for perfluorooctanoate (PFOA) and 2-N-ethyl-perfluorooctane sulfonamido acetate (EtFOSAA), with 47% (aHR, 1.47; 95% CI, 1.24-1.75; P trend = .01) and 42% (aHR, 1.42; 95% CI, 1.19-1.70; P trend = .01) higher risks of incident hypertension, comparing the highest to the lowest tertiles.
The risks persisted after adjusting for various factors, including race, study site, education, financial strain, smoking status, alcohol use, total calorie intake, and menopausal status.
In the PFAS “mixture” analysis, women in the highest tertile of overall PFAS concentrations were 71% more likely to develop hypertension during follow-up, compared with women in the lowest tertile (aHR, 1.71; 95% CI, 1.15-2.54; P trend = .008).
“These findings suggest that PFAS might be an underappreciated contributing factor to women’s cardiovascular disease risk,” the researchers write.
They caution that the study only included middle-aged women and that it is unclear whether the findings hold for middle-aged men.
“This is an important question, but the answer is that we do not know,” Dr. Park told this news organization.
“Women become more susceptible to metabolic changes and hypertension risk during the menopausal transition. Our findings suggest that PFAS may play a role in the development of hypertension in women during this critical life stage,” Dr. Park said.
The researchers say more research is needed to confirm and expand the findings and to find ways to reduce PFAS exposure.
“If confirmed in future studies, these findings suggest that understanding human exposure to PFAS and developing effective strategies to reduce PFAS exposure may help prevent the development of hypertension and thereby reduce the global burden of CVD,” the researchers write.
‘The more we learn, the worse it gets’
This is an “interesting” study and shows that “the more we learn about PFAS, the worse it seems to get,” Ankur Shah, MD, division of kidney disease and hypertension, Warren Alpert Medical School of Brown University, Providence, R.I., said in an interview.
“This multisite, multiracial and multiethnic, community-based longitudinal study establishes an association between PFAS and hypertension,” said Dr. Shah, who wasn’t involved in the study.
“This adds to a growing literature base of associations of PFAS with illnesses, including malignancy, thyroid disorders, diabetes, ulcerative colitis, hyperlipidemia, and pregnancy-induced hypertension,” he noted.
Dr. Shah also noted that the authors adjusted for race and ethnicity, study site, education, financial strain, smoking status, environmental tobacco smoke, alcohol consumption, total calorie intake, and menopausal status “and still found a strong association.”
“Still to be determined are both whether PFAS are the causative agent or if there is an unmeasured/unadjusted for entity which has resulted in both increased PFAS exposure and hypertension, as well as if PFAS are causative, if reduction in PFAS exposure would be result in blood pressure reduction,” Dr. Shah added.
The study had no sources of funding. Dr. Park and Dr. Shah have disclosed no relevant financial relationships.
A version of this article first appeared on Medscape.com.
FROM HYPERTENSION
Center-based childcare associated with healthier body weight
The findings of the prospective Canadian study suggest that professional childcare centers that engage in standard practices are having a positive and lasting impact on children’s health, reported lead author Michaela Kucab, RD, MHSc, of the University of Toronto and colleagues.
“Attending center-based childcare in early childhood may influence important health behaviors including nutrition, physical activity, and routines related to child growth and weight status,” the investigators wrote in their abstract, which Ms. Kucab presented at the virtual conference sponsored by the American Society for Nutrition.
Their study involved 3,503 children who attended childcare in Canada during early childhood (mean age at baseline was 2.7 years) with follow-up from ages 4-10.
Overweight/obesity risk reduced
Children who received full-time, center-based care had a 22% lower risk of overweight/obesity and a mean body mass index z score (zBMI) that was 0.11 points lower at age 4 and 7 years than those who received non–center-based care. The benefits of center-based care were even more pronounced among children from lower-income families, who, at age 10, had a 48% lower risk of overweight/obesity and a mean zBMI that was 0.32 points lower with center-based versus non–center-based care.
In a written comment, Ms. Kucab and principal author Jonathon Maguire, MD, MSc, of the University of Toronto, explained that the former difference in zBMI translates to approximately half a pound of bodyweight in an average child, whereas the larger difference in zBMI among children from lower-income families would amount to approximately three pounds. They emphasized that these are rough estimations.
Ms. Kucab and Dr. Maguire noted that body weight differences correlated with the amount of time spent in center-based care.
“There was an observed trend, whereby the estimated mean difference [in zBMI] became slightly larger (or stronger) with a higher intensity of center-based childcare compared to non–center-based childcare,” they said.
To learn more about the earliest impacts of center-based care, the investigators are conducting a clinical trial, The Nutrition Recommendation Intervention Trials in Children’s Health Care (NuRISH), which will involve 600 children aged younger than 2 years.
Center-based childcare may reduce disadvantages of low-income children
“Although more research is needed, our findings suggest that center-based childcare may help” reduce disadvantages children from low-income families experience related to their heath,” Ms. Kucab said in a press release.
Laurent Legault, MD, an associate professor specializing in endocrinology in the department of pediatrics at McGill University, Montreal, highlighted the “quite significant” sample size of more than 3,000 participants, noting that “it’s quite tough to have numerous children” involved in a study, especially with several years of follow-up.
Dr. Legault also praised the investigators for considering socioeconomic status, “which is absolutely paramount, because, unfortunately, it’s not necessarily an even playing field for these families.”
He said the findings deserve to be promoted, as they highlight the benefits of center-based care, including ones with room for physical activity, opportunities for social interaction with other children, and a structured routine.
Still, Dr. Legault said it’s “very difficult to pinpoint specifically” what led to healthier body weights. “The problem, of course, is that obesity is very multifactorial in nature,” although “early intervention is more likely to be efficient.”
Center-based care appears to be one such intervention, he said, which should “push people to make centered care more affordable and easy to access for everyone.”The investigators and Dr. Legault reported no conflicts of interest.
FROM NUTRITION 2022
Predictors of County-Level Home Modification Use Across the US
This article is part of a series of articles on the Home Improvements and Structural Alterations program (HISA), a home modification (HM) program within the Veterans Health Administration (VHA). HISA is a benefit awarded to veterans with disabilities (VWDs) and is instrumental in affording physical accessibility and structural alterations to veterans’ homes.1 The overarching goals of this project are to describe and understand HISA use by VWDs. Previous work has shown geographical variation in the number of HISA prescriptions across counties in the US (Figure 1).1 The current work seeks to describe and predict the county-level rates of HISA use. Information about what predicts HISA utilization at the county level is important because it enhances understanding of program utilization at a national level. The long-term goal of the series is to provide knowledge about HM services within VHA to improve community-based independent living of VWDs by increasing awareness and utilization of HM services.
Background
A health care professional (HCP) approves a HM support award by evaluating the practicality of the support to improve the built environment of a given veteran’s disability.1,2 Previously we detailed some of the preliminary research into the HISA program, including HISA user demographic and clinical characteristics, types of HMs received, user suggestions for improvement, and geospatial analysis of HISA prescriptions concentration.1-4
The geospatial analyses of HISA prescriptions revealed clusters of high numbers of HISA users (hot spots) and low numbers of HISA users (cold spots), indicating that HISA is either not prescribed or uniformly used across the US. The previous research prompted investigation into county-level variables that may impact HISA utilization rates. This inquiry focuses on county characteristics associated with HISA use rates, such as measures of clinical care and quality of care (eg, access to health services variables, lack of insurance, preventable hospital stays), physical environment, and sociodemographic characteristics. Clinical care and quality of care measures promote the interaction with HCPs. Moreover, access to health care is an important indicator of health outcomes.5,6 An individual’s capacity to access health services, such as a HM program, greatly impacts well-being, safety, independence, and health.2,4 Well-being, safety, independence, and health become compromised if individuals cannot access care, if needed care is lacking in their area, if HCPs are not available, or are unwilling to provide care due to lack of insurance coverage.7-12 In locations where health care services are minimal due to lack of specialists or health care facilities, the quality of (or access to) care may be compromised, resulting in preventable conditions becoming problematic.13,14 These conditions may result in unnecessary hospitalizations for conditions that could have been treated during routine care. Financial barriers to care particularly among low-income people and the uninsured have proven detrimental to health.15,16 On the other hand, preventable hospital stays are a quality of care measure (ie, a proxy for poor quality of care). HISA operates within a health care system; thus, it is imperative to include these measures impacting health.
In this study, we sought to identify county-level predictors—in particular, county-level proxies for access to care—that may be associated with county-level HISA use. We define HISA utilization rate as the percentage of a county’s VHA patients who have received a HISA award.
Methods
This study used data from the National Prosthetics Patient Database (NPPD), US Department of Veterans Affairs (VA) medical database inpatient and outpatient datasets, VHA Support Service Center (VSSC) data cubes, and the County Health Rankings database (CHRD). First, the study cohort was identified from NPPD users who have obtained a HISA award from fiscal years (FY) 2015 to 2018. Analysis started with FY 2015 following new regulations (38 CFR § 17) governing the operations of the HISA program.2 The study cohort was matched with records from NPPD and VA inpatient and outpatient datasets to obtain information about the veterans’ demographic characteristics and their HM characteristics and costs. The number of VHA end-of-year (EOY) patients per county was extracted from the VSSC Current Enrollment Cube, which was used in calculation of the county-level HISA utilization rate.17 Finally, zip code–based locational data were used to calculate approximate drive time and distance from the HISA user’s approximate location to the facility where they received their HM prescription. Drive times and drive distances were calculated with Esri ArcGIS Pro (v2.6.3) by placing zip code centroid and VHA facilities on a nationwide road network that contains both road speeds and distances.
Calculations
Patient-level data were aggregated up to county-level variables by calculating the sum, mean, or percent per county. HISA user sample characteristics, including sex, race, rurality (urban, rural), marital status, and Class 1 vs Class 2 disability-related eligibility groups, were aggregated to the county level by calculating percentages of HISA users of the given characteristics out of total HISA users in the county. Disability-related eligibility groups (Class 1 vs Class 2 HISA users) determines the maximum lifetime award dollar amount. Specifically, those with service-connected disabilities or those with a ≥ 50% disability rating (regardless of whether or not their disability is service connected) are classified as Class 1 HISA users and are eligible to receive a maximum lifetime award of $6800. Those with a recorded disability that is not connected to their military service, and who have a disability rating of < 50% are classified as Class 2 HISA users and are eligible to receive a lifetime maximum award of $2000.
The county-level number of HISA users was used as the numerator for calculation of county-level HISA utilization rate. Counties with zero HISA users were excluded. The number of EOY VHA patients per county in FY 2018 was divided by 1000 and used as the denominator in the calculation of county-level HISA utilization rate. Thus, the outcome variable is HISA utilization rate per 1000 VHA patients in FY 2018 (HISA utilization rate).
County-Level Variables
County-level variables were downloaded from the 2020 CHRD.5,6 An explanation of the CHRD model and the factors used in this study are shown in the eAppendix (available at doi: 10.12788/fp.0279).6 County-level aggregated HISA user data and the CHRD data were matched using county Federal Information Processing Standards codes. Access to care measures collected from CHRD included percentages uninsured and ratios of population to primary care physicians, dentists, mental health professionals, and other primary care professionals. Other CHRD measures included those for quality of care (rate of preventable hospital stay) and housing quality (percent of households with high housing costs, percent of households with overcrowding, percent of households with lack of kitchen or plumbing, percent of households with severe housing cost burden, percent of homeownership). Of secondary interest was county population rurality, as previous research findings showed the annual average of HISA users who are from rural areas ranged from 30 to 35%.
Analysis Methods
SAS (v9.4), R (v4.0.2), and RStudio (v1.3.1093) were used for data preparation and analysis.18 Multiple regression analysis was used to predict county-level utilization rate from county-level variables. Sociodemographic characteristics from CHRD and HISA data were included as important control predictors in the regression model, though our focus for this paper are the access to care and housing quality predictors.
Model diagnostics (examination of model residuals, Breusch-Godfrey test, Breusch-Pagan test) revealed significant heteroskedasticity of the model; thus, robust standard errors and associated P values were computed using the R estimatr package (v0.30.2).19 Some predictor variables of interest (eg, ratio of mental health professionals) were removed during the model building process either due to problems of multicollinearity or excessive missingness that would have resulted in listwise deletion.
Results
County-level HISA utilization rate per 1000 EOY VHA patients ranged from 0.09 to 59.7%, with a 6.6% mean and 5% median (Figure 2). The data were highly positively skewed. The final model included 33 total predictor variables (Table 1). The final regression model was a significantly better predictor of county-level HISA utilization rate than a null model (F[33-2184], 10.18; P < .001). The adjusted model R2 showed that the overall model accounted for approximately 23% of variance in county-level HISA utilization rate (Table 2).
Among the primary variables of interest, percent uninsured adults and rate of preventable hospital stays emerged as significant predictors of county-level HISA utilization rate. Specifically, county percentage of uninsured adults was negatively related to county-level HISA utilization rate (b = -8.99, P = .005), indicating that the higher the proportion of uninsured adults—with all other predictors held constant—the lower the HISA utilization rate. Percent uninsured adults ranged from 2.7 to 42.4% across counties, with a mean (SD) of 12.7% (5.8%) and 11.4% median.
County rate of preventable hospital stays, however, was significantly and positively related to county-level HISA utilization rate (b = .0004, P = .009), indicating that the higher the rate of preventable hospital stays—with all other predictors held constant—the higher the HISA utilization rate. The direction of this effect is the opposite of the direction of the effect of percent uninsured adults (positive rather than negative), even though both could be considered measures of access to care. The standardized β for these 2 predictors indicate that county rate of preventable hospital stays is a somewhat stronger predictor of county-level HISA utilization rate than is county percent of uninsured adults (β = .11 and β = -.09, respectively). Rate of preventable hospital stays ranged from 683 to 16,802 across counties included in this analysis, with a mean (SD) of 4,796.5 (1659.9) and a 4669 median.
Of secondary interest was county rurality. The county-level percentage of rural residents was significantly and positively related to county-level HISA utilization rate, indicating that the higher the proportion of individuals within county considered rural—all other predictors held constant—the higher the HISA utilization rate. The mean (SD) percentage of rural residents per county was 52.3% (30.2) and 52.7 % median.
Discussion
This study examined whether county-level characteristics, specifically variables for access to care, quality of care, and housing quality, were predictive of a county’s HISA utilization rate. Given that this series of work on the HISA program is (to our knowledge) the first of its kind, and given the exploratory nature of this analysis, we did not have specific predictions for the effects of any one given variable. Nevertheless, some of the results were surprising, and we believe they warrant additional study. In particular, the opposing direction of effects for access to care and quality of care variables were hard to reconcile.
The county percent of uninsured adults (an access to care variable, specifically, a proxy for poor access to care) was negatively associated with county-level HISA utilization rate, whereas the county rate of preventable hospital stays (a quality of care variable, but also potentially an access to care variable, and specifically, proxies for poor quality of care or poor access to care) was positively associated with county-level HISA utilization rate. To describe the relationships more generally, one coefficient in the regression model indicated that the poorer the access to care, the lower the HISA utilization rate (higher percent of uninsured adults predicts lower HISA utilization rate), while another coefficient in the regression model indicated the poorer the quality of and access to care, the higher the HISA utilization rate (higher rate of preventable hospital stays predicts higher HISA utilization rate). Future study is warranted to disentangle and reconcile the various community-level predictors of this service.
Housing quality measures (eg, percent of households with high housing costs, percent of households with overcrowding, percent of households with lack of kitchen or plumbing, percent of households with severe housing cost burden, and percent of homeownership) are important in the consideration of whether a HM will be performed or should be performed. For example, if a person is cost burdened by the amount of expenditure spent in housing there will be little discretionary funds to perform a HM. Individuals who do not own their home may experience complications in obtaining permission from landlords to perform a HM. County-level predictors of housing quality (percent of households with high housing costs, overcrowding, and lack of kitchen or plumbing) were not significantly associated with county-level HISA utilization rate but are also nevertheless relevant to the discussion of home modifications. Of particular interest is the percent of households with lack of kitchen or plumbing variable, which was positively related to county-level HISA utilization rate although not statistically significant. HM elements related to the kitchen (eg, heighten countertop) add to the accessibility of the home allowing for the performing of activities of daily living such as cooking. Between FY 2015 and FY 2018, we discovered 131 prescriptions for kitchen (n = 90) and plumbing (n = 41) HMs, which is a very small proportion of the 30,780 total HMs (there were 24,397 bathroom HMs). The nonsignificant coefficient for this variable may reflect the small number of veterans that obtained these HM.
Limitations
The potentially conflicting direction of effects for a significant access to care variable (percent uninsured adults) and a significant access to care and quality of care variable (preventable hospital stays) are interesting and warrant additional study, but the inability to interpret or explain this apparent inconsistency constitutes a limitation of the current data and analyses presented here. Another limitation is that this analysis uses county-level predictors for what is ultimately an individual-level outcome. It would have been ideal to have both individual- and county-level data to conduct a multilevel analysis; in particular, individual-level data within counties of individuals (both veterans and nonveterans) who did not receive a HISA award (including both those who applied and were denied, and who did not apply) would be highly valuable.
Conclusions
Our continuing research into veterans’ use of HM fills a gap in the literature about the characteristics of HISA users, the impact of county-level variables on the use of HISA, and the geographic distribution and use of HISA within the VHA. While it is important to examine the influence of broader systems on individual outcomes, there could be myriad other factors that are more proximal and more closely related to whether any one individual applies for, let alone receives, a HISA award. Indeed, a low overall adjusted model R2 indicates that there is considerable variability in county-level HISA utilization rate that was not accounted for by the current model; this further speaks to warranted additional study.
More research is needed to understand and account for geographical variation in HISA utilization rate across the US. However, this work serves as an exploratory first step at quantifying and predicting HISA utilization rate at a broad level, with the ultimate goal of increasing access to HMs for veterans with disabilities.
Acknowledgments
This research was supported by grant 15521 from the US Department of Veterans Affairs, Office of Rural Health. Furthermore, the research was supported in part by grant K12 HD055929 from the National Institutes of Health. We want to acknowledge Cheri E. Knecht, Project Coordinator, for her assistance throughout all aspects of our research study and for her thoughtful contributions during the writing of this manuscript.
1. Semeah LM, Ahrentzen S, Jia H, Cowper-Ripley DC, Levy CE, Mann WC. The home improvements and structural alterations benefits program: veterans with disabilities and home accessibility. J Disability Policy Studies. 2017;28(1):43-51. doi:10.1177/1044207317696275
2. Semeah LM, Wang X, Cowper Ripley DC, Lee MJ, Ahonle ZJ, Ganesh SP, et al. Improving health through a home modification service for veterans. In: Fiedler BA, ed. Three Facets of Public Health and Paths to Improvements. Academic Press; 2020:381-416.
3. Semeah LM, Ahrentzen S, Cowper-Ripley DC, Santos-Roman LM, Beamish JO, Farley K. Rental housing needs and barriers from the perspective of veterans with disabilities. Housing Policy Debate. 2019;29(4):542-558. doi:10.1080/10511482.2018.1543203
4. Semeah LM, Ganesh SP, Wang X, et al. Home modification and health services utilization by rural and urban veterans with disabilities. Housing Policy Debate. 2021;31(6):862-874.doi:10.1080/10511482.2020.1858923
5. University of Wisconsin Population Health Institute. County health rankings model. Accessed May 13, 2022. https://www.countyhealthrankings.org/about-us
6. Remington PL, Catlin BB, Gennuso KP. The County Health Rankings: rationale and methods. Popul Health Metr. 2015;13(11). doi:10.1186/s12963-015-0044-2
7. National Academies of Sciences, Engineering, and Medicine. Health-Care Utilization as a Proxy in Disability Determination. Washington, DC: The National Academies Press; 2018.
8. Douthit N, Kiv S, Dwolatzky T, Biswas S. Exposing some important barriers to health care access in the rural USA. Public Health. 2015;129(6):611-20. doi:10.1016/j.puhe.2015.04.001
9. Medicaid and Chip Payment and Access Commission (MACPAC). Medicaid access in brief: adults’ experiences in obtaining medical care. November 2016. Accessed May 13, 2022. https://www.macpac.gov/publication/access-in-brief-adults-experiences-in-obtaining-medical-care
10. Tolbert J, Orgera, K, Damico A. Key facts about the uninsured population. November 6, 2020. Accessed May 13, 2022. https://www.kff.org/uninsured/issue-brief/key-facts-about-the-uninsured-population
11. Meit M, Knudson A, Gilbert T, et al. The 2014 update of the rural-urban chartbook, 2014. October 2014. Accessed May 13, 2022. http://www.ruralhealthresearch.org
12. National Center for Health Statistics (US). Report No.: 2016-1232. Health, United States, 2015: with special feature on racial and ethnic health disparities. Hyattsville, MD: National Center for Health Statistics.
13. Broussard DL, Mason KE, Carruth AR, Carton TW. Assessing potentially preventable hospitalizations at the county level: a comparison of measures using Medicare data and state hospital discharge data. Popul Health Manag. 2018;21(6):438-445. doi:10.1089/pop.2017.0141
14. Pezzin LE, Bogner HR, Kurichi JE, et al. Preventable hospitalizations, barriers to care, and disability. Medicine (Baltimore). 2018;97:e0691 doi:10.1097/MD.0000000000010691
15. Davis K, Ballreich J. Equitable access to care: how the United States ranks internationally. N Engl J Med. 2014;371(17):1567-70. doi:10.1056/NEJMp1406707
16. Squires D, Anderson C. U.S. health care from a global perspective: spending, use of services, prices, and health in 13 countries. Issue Brief (Commonw Fund). 2015;15:1-15.
17. VHA Service Support Center. Current enrollment cube (vssc.med.va.gov). Retrieved August 06, 2019. [Data not verified.]
18. Bunn A, Korpela M. R: A language and environment for statistical computing: an introduction to dplR. January 29, 2021. Accessed May 13, 2022. http://r.meteo.uni.wroc.pl/web/packages/dplR/vignettes/intro-dplR.pdf
19. Sheppard BH, Hartwick J, Warshaw PR. The theory of reasoned action: a meta-analysis of past research with recommendations for modifications and future research. J Consumer Research. 1988;15(3):325-343. doi:10.1086/209170
This article is part of a series of articles on the Home Improvements and Structural Alterations program (HISA), a home modification (HM) program within the Veterans Health Administration (VHA). HISA is a benefit awarded to veterans with disabilities (VWDs) and is instrumental in affording physical accessibility and structural alterations to veterans’ homes.1 The overarching goals of this project are to describe and understand HISA use by VWDs. Previous work has shown geographical variation in the number of HISA prescriptions across counties in the US (Figure 1).1 The current work seeks to describe and predict the county-level rates of HISA use. Information about what predicts HISA utilization at the county level is important because it enhances understanding of program utilization at a national level. The long-term goal of the series is to provide knowledge about HM services within VHA to improve community-based independent living of VWDs by increasing awareness and utilization of HM services.
Background
A health care professional (HCP) approves a HM support award by evaluating the practicality of the support to improve the built environment of a given veteran’s disability.1,2 Previously we detailed some of the preliminary research into the HISA program, including HISA user demographic and clinical characteristics, types of HMs received, user suggestions for improvement, and geospatial analysis of HISA prescriptions concentration.1-4
The geospatial analyses of HISA prescriptions revealed clusters of high numbers of HISA users (hot spots) and low numbers of HISA users (cold spots), indicating that HISA is either not prescribed or uniformly used across the US. The previous research prompted investigation into county-level variables that may impact HISA utilization rates. This inquiry focuses on county characteristics associated with HISA use rates, such as measures of clinical care and quality of care (eg, access to health services variables, lack of insurance, preventable hospital stays), physical environment, and sociodemographic characteristics. Clinical care and quality of care measures promote the interaction with HCPs. Moreover, access to health care is an important indicator of health outcomes.5,6 An individual’s capacity to access health services, such as a HM program, greatly impacts well-being, safety, independence, and health.2,4 Well-being, safety, independence, and health become compromised if individuals cannot access care, if needed care is lacking in their area, if HCPs are not available, or are unwilling to provide care due to lack of insurance coverage.7-12 In locations where health care services are minimal due to lack of specialists or health care facilities, the quality of (or access to) care may be compromised, resulting in preventable conditions becoming problematic.13,14 These conditions may result in unnecessary hospitalizations for conditions that could have been treated during routine care. Financial barriers to care particularly among low-income people and the uninsured have proven detrimental to health.15,16 On the other hand, preventable hospital stays are a quality of care measure (ie, a proxy for poor quality of care). HISA operates within a health care system; thus, it is imperative to include these measures impacting health.
In this study, we sought to identify county-level predictors—in particular, county-level proxies for access to care—that may be associated with county-level HISA use. We define HISA utilization rate as the percentage of a county’s VHA patients who have received a HISA award.
Methods
This study used data from the National Prosthetics Patient Database (NPPD), US Department of Veterans Affairs (VA) medical database inpatient and outpatient datasets, VHA Support Service Center (VSSC) data cubes, and the County Health Rankings database (CHRD). First, the study cohort was identified from NPPD users who have obtained a HISA award from fiscal years (FY) 2015 to 2018. Analysis started with FY 2015 following new regulations (38 CFR § 17) governing the operations of the HISA program.2 The study cohort was matched with records from NPPD and VA inpatient and outpatient datasets to obtain information about the veterans’ demographic characteristics and their HM characteristics and costs. The number of VHA end-of-year (EOY) patients per county was extracted from the VSSC Current Enrollment Cube, which was used in calculation of the county-level HISA utilization rate.17 Finally, zip code–based locational data were used to calculate approximate drive time and distance from the HISA user’s approximate location to the facility where they received their HM prescription. Drive times and drive distances were calculated with Esri ArcGIS Pro (v2.6.3) by placing zip code centroid and VHA facilities on a nationwide road network that contains both road speeds and distances.
Calculations
Patient-level data were aggregated up to county-level variables by calculating the sum, mean, or percent per county. HISA user sample characteristics, including sex, race, rurality (urban, rural), marital status, and Class 1 vs Class 2 disability-related eligibility groups, were aggregated to the county level by calculating percentages of HISA users of the given characteristics out of total HISA users in the county. Disability-related eligibility groups (Class 1 vs Class 2 HISA users) determines the maximum lifetime award dollar amount. Specifically, those with service-connected disabilities or those with a ≥ 50% disability rating (regardless of whether or not their disability is service connected) are classified as Class 1 HISA users and are eligible to receive a maximum lifetime award of $6800. Those with a recorded disability that is not connected to their military service, and who have a disability rating of < 50% are classified as Class 2 HISA users and are eligible to receive a lifetime maximum award of $2000.
The county-level number of HISA users was used as the numerator for calculation of county-level HISA utilization rate. Counties with zero HISA users were excluded. The number of EOY VHA patients per county in FY 2018 was divided by 1000 and used as the denominator in the calculation of county-level HISA utilization rate. Thus, the outcome variable is HISA utilization rate per 1000 VHA patients in FY 2018 (HISA utilization rate).
County-Level Variables
County-level variables were downloaded from the 2020 CHRD.5,6 An explanation of the CHRD model and the factors used in this study are shown in the eAppendix (available at doi: 10.12788/fp.0279).6 County-level aggregated HISA user data and the CHRD data were matched using county Federal Information Processing Standards codes. Access to care measures collected from CHRD included percentages uninsured and ratios of population to primary care physicians, dentists, mental health professionals, and other primary care professionals. Other CHRD measures included those for quality of care (rate of preventable hospital stay) and housing quality (percent of households with high housing costs, percent of households with overcrowding, percent of households with lack of kitchen or plumbing, percent of households with severe housing cost burden, percent of homeownership). Of secondary interest was county population rurality, as previous research findings showed the annual average of HISA users who are from rural areas ranged from 30 to 35%.
Analysis Methods
SAS (v9.4), R (v4.0.2), and RStudio (v1.3.1093) were used for data preparation and analysis.18 Multiple regression analysis was used to predict county-level utilization rate from county-level variables. Sociodemographic characteristics from CHRD and HISA data were included as important control predictors in the regression model, though our focus for this paper are the access to care and housing quality predictors.
Model diagnostics (examination of model residuals, Breusch-Godfrey test, Breusch-Pagan test) revealed significant heteroskedasticity of the model; thus, robust standard errors and associated P values were computed using the R estimatr package (v0.30.2).19 Some predictor variables of interest (eg, ratio of mental health professionals) were removed during the model building process either due to problems of multicollinearity or excessive missingness that would have resulted in listwise deletion.
Results
County-level HISA utilization rate per 1000 EOY VHA patients ranged from 0.09 to 59.7%, with a 6.6% mean and 5% median (Figure 2). The data were highly positively skewed. The final model included 33 total predictor variables (Table 1). The final regression model was a significantly better predictor of county-level HISA utilization rate than a null model (F[33-2184], 10.18; P < .001). The adjusted model R2 showed that the overall model accounted for approximately 23% of variance in county-level HISA utilization rate (Table 2).
Among the primary variables of interest, percent uninsured adults and rate of preventable hospital stays emerged as significant predictors of county-level HISA utilization rate. Specifically, county percentage of uninsured adults was negatively related to county-level HISA utilization rate (b = -8.99, P = .005), indicating that the higher the proportion of uninsured adults—with all other predictors held constant—the lower the HISA utilization rate. Percent uninsured adults ranged from 2.7 to 42.4% across counties, with a mean (SD) of 12.7% (5.8%) and 11.4% median.
County rate of preventable hospital stays, however, was significantly and positively related to county-level HISA utilization rate (b = .0004, P = .009), indicating that the higher the rate of preventable hospital stays—with all other predictors held constant—the higher the HISA utilization rate. The direction of this effect is the opposite of the direction of the effect of percent uninsured adults (positive rather than negative), even though both could be considered measures of access to care. The standardized β for these 2 predictors indicate that county rate of preventable hospital stays is a somewhat stronger predictor of county-level HISA utilization rate than is county percent of uninsured adults (β = .11 and β = -.09, respectively). Rate of preventable hospital stays ranged from 683 to 16,802 across counties included in this analysis, with a mean (SD) of 4,796.5 (1659.9) and a 4669 median.
Of secondary interest was county rurality. The county-level percentage of rural residents was significantly and positively related to county-level HISA utilization rate, indicating that the higher the proportion of individuals within county considered rural—all other predictors held constant—the higher the HISA utilization rate. The mean (SD) percentage of rural residents per county was 52.3% (30.2) and 52.7 % median.
Discussion
This study examined whether county-level characteristics, specifically variables for access to care, quality of care, and housing quality, were predictive of a county’s HISA utilization rate. Given that this series of work on the HISA program is (to our knowledge) the first of its kind, and given the exploratory nature of this analysis, we did not have specific predictions for the effects of any one given variable. Nevertheless, some of the results were surprising, and we believe they warrant additional study. In particular, the opposing direction of effects for access to care and quality of care variables were hard to reconcile.
The county percent of uninsured adults (an access to care variable, specifically, a proxy for poor access to care) was negatively associated with county-level HISA utilization rate, whereas the county rate of preventable hospital stays (a quality of care variable, but also potentially an access to care variable, and specifically, proxies for poor quality of care or poor access to care) was positively associated with county-level HISA utilization rate. To describe the relationships more generally, one coefficient in the regression model indicated that the poorer the access to care, the lower the HISA utilization rate (higher percent of uninsured adults predicts lower HISA utilization rate), while another coefficient in the regression model indicated the poorer the quality of and access to care, the higher the HISA utilization rate (higher rate of preventable hospital stays predicts higher HISA utilization rate). Future study is warranted to disentangle and reconcile the various community-level predictors of this service.
Housing quality measures (eg, percent of households with high housing costs, percent of households with overcrowding, percent of households with lack of kitchen or plumbing, percent of households with severe housing cost burden, and percent of homeownership) are important in the consideration of whether a HM will be performed or should be performed. For example, if a person is cost burdened by the amount of expenditure spent in housing there will be little discretionary funds to perform a HM. Individuals who do not own their home may experience complications in obtaining permission from landlords to perform a HM. County-level predictors of housing quality (percent of households with high housing costs, overcrowding, and lack of kitchen or plumbing) were not significantly associated with county-level HISA utilization rate but are also nevertheless relevant to the discussion of home modifications. Of particular interest is the percent of households with lack of kitchen or plumbing variable, which was positively related to county-level HISA utilization rate although not statistically significant. HM elements related to the kitchen (eg, heighten countertop) add to the accessibility of the home allowing for the performing of activities of daily living such as cooking. Between FY 2015 and FY 2018, we discovered 131 prescriptions for kitchen (n = 90) and plumbing (n = 41) HMs, which is a very small proportion of the 30,780 total HMs (there were 24,397 bathroom HMs). The nonsignificant coefficient for this variable may reflect the small number of veterans that obtained these HM.
Limitations
The potentially conflicting direction of effects for a significant access to care variable (percent uninsured adults) and a significant access to care and quality of care variable (preventable hospital stays) are interesting and warrant additional study, but the inability to interpret or explain this apparent inconsistency constitutes a limitation of the current data and analyses presented here. Another limitation is that this analysis uses county-level predictors for what is ultimately an individual-level outcome. It would have been ideal to have both individual- and county-level data to conduct a multilevel analysis; in particular, individual-level data within counties of individuals (both veterans and nonveterans) who did not receive a HISA award (including both those who applied and were denied, and who did not apply) would be highly valuable.
Conclusions
Our continuing research into veterans’ use of HM fills a gap in the literature about the characteristics of HISA users, the impact of county-level variables on the use of HISA, and the geographic distribution and use of HISA within the VHA. While it is important to examine the influence of broader systems on individual outcomes, there could be myriad other factors that are more proximal and more closely related to whether any one individual applies for, let alone receives, a HISA award. Indeed, a low overall adjusted model R2 indicates that there is considerable variability in county-level HISA utilization rate that was not accounted for by the current model; this further speaks to warranted additional study.
More research is needed to understand and account for geographical variation in HISA utilization rate across the US. However, this work serves as an exploratory first step at quantifying and predicting HISA utilization rate at a broad level, with the ultimate goal of increasing access to HMs for veterans with disabilities.
Acknowledgments
This research was supported by grant 15521 from the US Department of Veterans Affairs, Office of Rural Health. Furthermore, the research was supported in part by grant K12 HD055929 from the National Institutes of Health. We want to acknowledge Cheri E. Knecht, Project Coordinator, for her assistance throughout all aspects of our research study and for her thoughtful contributions during the writing of this manuscript.
1. Semeah LM, Ahrentzen S, Jia H, Cowper-Ripley DC, Levy CE, Mann WC. The home improvements and structural alterations benefits program: veterans with disabilities and home accessibility. J Disability Policy Studies. 2017;28(1):43-51. doi:10.1177/1044207317696275
2. Semeah LM, Wang X, Cowper Ripley DC, Lee MJ, Ahonle ZJ, Ganesh SP, et al. Improving health through a home modification service for veterans. In: Fiedler BA, ed. Three Facets of Public Health and Paths to Improvements. Academic Press; 2020:381-416.
3. Semeah LM, Ahrentzen S, Cowper-Ripley DC, Santos-Roman LM, Beamish JO, Farley K. Rental housing needs and barriers from the perspective of veterans with disabilities. Housing Policy Debate. 2019;29(4):542-558. doi:10.1080/10511482.2018.1543203
4. Semeah LM, Ganesh SP, Wang X, et al. Home modification and health services utilization by rural and urban veterans with disabilities. Housing Policy Debate. 2021;31(6):862-874.doi:10.1080/10511482.2020.1858923
5. University of Wisconsin Population Health Institute. County health rankings model. Accessed May 13, 2022. https://www.countyhealthrankings.org/about-us
6. Remington PL, Catlin BB, Gennuso KP. The County Health Rankings: rationale and methods. Popul Health Metr. 2015;13(11). doi:10.1186/s12963-015-0044-2
7. National Academies of Sciences, Engineering, and Medicine. Health-Care Utilization as a Proxy in Disability Determination. Washington, DC: The National Academies Press; 2018.
8. Douthit N, Kiv S, Dwolatzky T, Biswas S. Exposing some important barriers to health care access in the rural USA. Public Health. 2015;129(6):611-20. doi:10.1016/j.puhe.2015.04.001
9. Medicaid and Chip Payment and Access Commission (MACPAC). Medicaid access in brief: adults’ experiences in obtaining medical care. November 2016. Accessed May 13, 2022. https://www.macpac.gov/publication/access-in-brief-adults-experiences-in-obtaining-medical-care
10. Tolbert J, Orgera, K, Damico A. Key facts about the uninsured population. November 6, 2020. Accessed May 13, 2022. https://www.kff.org/uninsured/issue-brief/key-facts-about-the-uninsured-population
11. Meit M, Knudson A, Gilbert T, et al. The 2014 update of the rural-urban chartbook, 2014. October 2014. Accessed May 13, 2022. http://www.ruralhealthresearch.org
12. National Center for Health Statistics (US). Report No.: 2016-1232. Health, United States, 2015: with special feature on racial and ethnic health disparities. Hyattsville, MD: National Center for Health Statistics.
13. Broussard DL, Mason KE, Carruth AR, Carton TW. Assessing potentially preventable hospitalizations at the county level: a comparison of measures using Medicare data and state hospital discharge data. Popul Health Manag. 2018;21(6):438-445. doi:10.1089/pop.2017.0141
14. Pezzin LE, Bogner HR, Kurichi JE, et al. Preventable hospitalizations, barriers to care, and disability. Medicine (Baltimore). 2018;97:e0691 doi:10.1097/MD.0000000000010691
15. Davis K, Ballreich J. Equitable access to care: how the United States ranks internationally. N Engl J Med. 2014;371(17):1567-70. doi:10.1056/NEJMp1406707
16. Squires D, Anderson C. U.S. health care from a global perspective: spending, use of services, prices, and health in 13 countries. Issue Brief (Commonw Fund). 2015;15:1-15.
17. VHA Service Support Center. Current enrollment cube (vssc.med.va.gov). Retrieved August 06, 2019. [Data not verified.]
18. Bunn A, Korpela M. R: A language and environment for statistical computing: an introduction to dplR. January 29, 2021. Accessed May 13, 2022. http://r.meteo.uni.wroc.pl/web/packages/dplR/vignettes/intro-dplR.pdf
19. Sheppard BH, Hartwick J, Warshaw PR. The theory of reasoned action: a meta-analysis of past research with recommendations for modifications and future research. J Consumer Research. 1988;15(3):325-343. doi:10.1086/209170
When suffering defies diagnosis
I still remember the woman who came to my office that day, years ago. She was struggling and uncomfortable, and she wanted “something” for stress. She described her life, and to me, it sounded stressful. She lived in a blended family and she described the chaos that one might expect to find in a household with four teens, their friends, their activities, and all it took to keep the household going. I spent 2 hours evaluating the patient, and I could not find a diagnosis that fit this problem nor – I believed – a pill that would fix it. She didn’t “meet criteria” for a psychiatric disorder, but she insisted she was uncomfortable and she wanted to try medication. I admit, I relented and I gave her a prescription for fluoxetine.
When she returned a few weeks later, my patient said she felt better, and what I remember decades later was her statement: “Now I can see dishes in the sink and be okay with it.” Perhaps she had downplayed her anxiety during our first meeting, but what I took from this was that some people are uncomfortable in ways that our lexicon does not capture, and sometimes medication helps with this discomfort.

The APA’s Diagnostic and Statistical Manual of Mental Disorders attempts to capture the problems of emotional and behavioral distress and classify them into discrete syndromes that can be validated and reliably diagnosed by different evaluators. Our disorders are syndromic; they are defined by clusters of symptoms that occur together, and not by a single symptom, lab value, or radiologic finding. The DSM is rewritten periodically so that what is or is not a disorder can bend with new discoveries and with a changing culture. And for better or for worse, when there is an available medication that can alleviate a problem, this may influence what once was a variant of normal into becoming a disorder.
Our illnesses often lie along a spectrum, so there is no precise point where someone who is easily distracted is a person with attention deficit disorder as opposed to being a mentally healthy person who is easily distracted, or a shy person is someone with social anxiety disorder. whether they want to address this with medications, and whether their distress warrants taking a chance that they might have side effects or an adverse reaction to a medication.
When we look at our criteria, sometimes we fall short. One needs to have at least five symptoms out of nine options, to be present for 2 weeks to be diagnosed with major depression, yet I don’t know a single psychiatrist who would not offer medication to a patient who ascribed to feeling profoundly sad with thoughts of suicide in the absence of other symptoms of depression. These issues have come to the forefront with the recent inclusion of prolonged grief in the DSM, as a disorder that is distinct from both normal grieving and from major depression.
In recent weeks, mass murder has been on everyone’s mind as we mourn those lost in Uvalde, Buffalo, and unfortunately, in so many other places. Absolutely no one thinks that someone who shoots strangers is “normal” or emotionally well. Yet psychiatry is often tasked with figuring out if someone is mad (mentally ill), bad (evil), or both. We don’t have a clear path for how to treat and manage people who commit horrendous acts of violence unless they meet criteria for another illness. Yet no one would argue that a person who informs others that he is thinking of killing strangers is in need of some type of intervention, regardless of his motive. We struggle too, with how to manage people who have more regular angry outbursts or emotional dysregulation. Perhaps we diagnose intermittent explosive disorder, or irritability caused by a mood disorder, but we don’t always know how to help people to control their tempers and modulate their emotions. And our semantics to describe psychic pain and anguish are surprisingly limited – sometimes we can only assume that someone who lashes out must be in turmoil.
Psychiatry continues to struggle with our relationship with human suffering. Suffering is part of life, not necessarily a sign of illness, and in his iconic memoir, “Man’s Search for Meaning,” psychiatrist Viktor Frankl, MD, wrote of the atrocities he endured in a Nazi concentration camp. It was through his suffering that Dr. Frankl found meaning and he used these harrowing experiences to fuel positive emotions later in life. Dr. Frankl wrote: “If there is a meaning in life at all, then there must be a meaning in suffering. Suffering is an ineradicable part of life, even as fate and death. Without suffering and death, human life cannot be complete.”
Suffering may be the kindling for acts of violence, or for profound creativity. Would we have music, art, cinema, poetry, or fiction if no one ever suffered? Yet suffering and emotional torment are often what leads people to seek treatment, and what leads us, as healers, to offer any range of therapies. For years, suicide rates have been rising, as have overdose death. And now, in addition to these “deaths of despair,” we are hearing about skyrocketing rates of depression and anxiety in our world that is so full of reasons to be sad and anxious. Access to treatment is limited by so many things, and it is not always clear when one needs psychiatric interventions or when problems will heal on their own, leaving scars or not.
I wrote this article in response to the hundreds of comments that were placed on an article I wrote after the horrors at Uvalde and Buffalo: “Don’t Equate Mass Shootings with Mental Illness.” Many of the commenters suggested I believe the shooter was perfectly sane, and that I am naive (or worse). Many wrote in with their own thoughts about what causes people to become mass murderers. One commenter wrote: “To suggest that random killers do not have mental health issues and their behavior is normal is ridiculous.” I don’t believe that I ever suggested that such behavior was normal, but – for many of these crimes – we as a society have decided to treat the behavior as criminal and not as the product of our current concept of mental disorders. Obviously, people who are well, who are emotionally at peace and comfortable in their own skin, don’t kill strangers.
Dr. Miller is a coauthor of “Committed: The Battle Over Involuntary Psychiatric Care” (Baltimore: Johns Hopkins University Press, 2016). She has a private practice and is assistant professor of psychiatry and behavioral sciences at Johns Hopkins in Baltimore.
I still remember the woman who came to my office that day, years ago. She was struggling and uncomfortable, and she wanted “something” for stress. She described her life, and to me, it sounded stressful. She lived in a blended family and she described the chaos that one might expect to find in a household with four teens, their friends, their activities, and all it took to keep the household going. I spent 2 hours evaluating the patient, and I could not find a diagnosis that fit this problem nor – I believed – a pill that would fix it. She didn’t “meet criteria” for a psychiatric disorder, but she insisted she was uncomfortable and she wanted to try medication. I admit, I relented and I gave her a prescription for fluoxetine.
When she returned a few weeks later, my patient said she felt better, and what I remember decades later was her statement: “Now I can see dishes in the sink and be okay with it.” Perhaps she had downplayed her anxiety during our first meeting, but what I took from this was that some people are uncomfortable in ways that our lexicon does not capture, and sometimes medication helps with this discomfort.
The APA’s Diagnostic and Statistical Manual of Mental Disorders attempts to capture the problems of emotional and behavioral distress and classify them into discrete syndromes that can be validated and reliably diagnosed by different evaluators. Our disorders are syndromic; they are defined by clusters of symptoms that occur together, and not by a single symptom, lab value, or radiologic finding. The DSM is rewritten periodically so that what is or is not a disorder can bend with new discoveries and with a changing culture. And for better or for worse, when there is an available medication that can alleviate a problem, this may influence what once was a variant of normal into becoming a disorder.
Our illnesses often lie along a spectrum, so there is no precise point where someone who is easily distracted is a person with attention deficit disorder as opposed to being a mentally healthy person who is easily distracted, or a shy person is someone with social anxiety disorder. whether they want to address this with medications, and whether their distress warrants taking a chance that they might have side effects or an adverse reaction to a medication.
When we look at our criteria, sometimes we fall short. One needs to have at least five symptoms out of nine options, to be present for 2 weeks to be diagnosed with major depression, yet I don’t know a single psychiatrist who would not offer medication to a patient who ascribed to feeling profoundly sad with thoughts of suicide in the absence of other symptoms of depression. These issues have come to the forefront with the recent inclusion of prolonged grief in the DSM, as a disorder that is distinct from both normal grieving and from major depression.
In recent weeks, mass murder has been on everyone’s mind as we mourn those lost in Uvalde, Buffalo, and unfortunately, in so many other places. Absolutely no one thinks that someone who shoots strangers is “normal” or emotionally well. Yet psychiatry is often tasked with figuring out if someone is mad (mentally ill), bad (evil), or both. We don’t have a clear path for how to treat and manage people who commit horrendous acts of violence unless they meet criteria for another illness. Yet no one would argue that a person who informs others that he is thinking of killing strangers is in need of some type of intervention, regardless of his motive. We struggle too, with how to manage people who have more regular angry outbursts or emotional dysregulation. Perhaps we diagnose intermittent explosive disorder, or irritability caused by a mood disorder, but we don’t always know how to help people to control their tempers and modulate their emotions. And our semantics to describe psychic pain and anguish are surprisingly limited – sometimes we can only assume that someone who lashes out must be in turmoil.
Psychiatry continues to struggle with our relationship with human suffering. Suffering is part of life, not necessarily a sign of illness, and in his iconic memoir, “Man’s Search for Meaning,” psychiatrist Viktor Frankl, MD, wrote of the atrocities he endured in a Nazi concentration camp. It was through his suffering that Dr. Frankl found meaning and he used these harrowing experiences to fuel positive emotions later in life. Dr. Frankl wrote: “If there is a meaning in life at all, then there must be a meaning in suffering. Suffering is an ineradicable part of life, even as fate and death. Without suffering and death, human life cannot be complete.”
Suffering may be the kindling for acts of violence, or for profound creativity. Would we have music, art, cinema, poetry, or fiction if no one ever suffered? Yet suffering and emotional torment are often what leads people to seek treatment, and what leads us, as healers, to offer any range of therapies. For years, suicide rates have been rising, as have overdose death. And now, in addition to these “deaths of despair,” we are hearing about skyrocketing rates of depression and anxiety in our world that is so full of reasons to be sad and anxious. Access to treatment is limited by so many things, and it is not always clear when one needs psychiatric interventions or when problems will heal on their own, leaving scars or not.
I wrote this article in response to the hundreds of comments that were placed on an article I wrote after the horrors at Uvalde and Buffalo: “Don’t Equate Mass Shootings with Mental Illness.” Many of the commenters suggested I believe the shooter was perfectly sane, and that I am naive (or worse). Many wrote in with their own thoughts about what causes people to become mass murderers. One commenter wrote: “To suggest that random killers do not have mental health issues and their behavior is normal is ridiculous.” I don’t believe that I ever suggested that such behavior was normal, but – for many of these crimes – we as a society have decided to treat the behavior as criminal and not as the product of our current concept of mental disorders. Obviously, people who are well, who are emotionally at peace and comfortable in their own skin, don’t kill strangers.
Dr. Miller is a coauthor of “Committed: The Battle Over Involuntary Psychiatric Care” (Baltimore: Johns Hopkins University Press, 2016). She has a private practice and is assistant professor of psychiatry and behavioral sciences at Johns Hopkins in Baltimore.
FDA OKs first systemic treatment for alopecia areata
.
The disorder with the hallmark signs of patchy baldness affects more than 300,000 people in the United States each year. In patients with the autoimmune disorder, the body attacks its own hair follicles and hair falls out, often in clumps. In February, the FDA granted priority review for baricitinib in adults with severe AA.
Baricitinib (Olumiant) is a Janus kinase (JAK) inhibitor, which blocks the activity of one or more enzymes, interfering with the pathway that leads to inflammation.
The FDA reports the most common side effects include upper respiratory tract infections, headache, acne, hyperlipidemia, increase of creatinine phosphokinase, urinary tract infection, elevated liver enzymes, inflammation of hair follicles, fatigue, lower respiratory tract infections, nausea, Candida infections, anemia, neutropenia, abdominal pain, herpes zoster (shingles), and weight gain. The labeling for baricitinib includes a boxed warning for serious infections, mortality, malignancy, major adverse cardiovascular events, and thrombosis.
Evidence from two trials led to announcement
The decision came after review of the results from two randomized, double-blind, placebo-controlled trials (BRAVE AA-1 and BRAVE AA-2) with patients who had at least 50% scalp hair loss as measured by the Severity of Alopecia Tool (SALT score) for more than 6 months.
Patients in these trials got either a placebo, 2 mg of baricitinib, or 4 mg of baricitinib every day. The primary endpoint for both trials was the proportion of patients who achieved at least 80% scalp hair coverage at week 36.
In BRAVE AA-1, 22% of the 184 patients who received 2 mg of baricitinib and 35% of the 281 patients who received 4 mg of baricitinib achieved at least 80% scalp hair coverage, compared with 5% of the 189 patients in the placebo group.
In BRAVE AA-2, 17% of the 156 patients who received 2 mg of baricitinib and 32% of the 234 patients who received 4 mg achieved at least 80% scalp hair coverage, compared with 3% of the 156 patients in the placebo group.
The results were reported at the annual meeting of the American Academy of Dermatology meeting in March.
Baricitinib was originally approved in 2018 as a treatment for adult patients with moderately to severely active rheumatoid arthritis who have had an inadequate response to one or more tumor necrosis factor (TNF)–blockers. It is also approved for treating COVID-19 in certain hospitalized adults.
Two other companies, Pfizer and Concert Pharmaceuticals, have JAK inhibitors in late-stage development for AA. The drugs are already on the market for treating rheumatoid arthritis and other autoimmune diseases. FDA approval is important for insurance coverage of the drugs, which have a list price of nearly $2,500 a month, according to The New York Times.
Until now, the only treatments for moderate to severe AA approved by the FDA have been intralesional steroid injections, contact sensitization, and systemic immunosuppressants, but they have demonstrated limited efficacy, are inconvenient for patients to take, and have been unsuitable for use long term.
“Today’s approval will help fulfill a significant unmet need for patients with severe alopecia areata,” Kendall Marcus, MD, director of the Division of Dermatology and Dentistry in the FDA’s Center for Drug Evaluation and Research, said in the press release.
As Medscape reported last month, The European Medicines Agency’s (EMA) Committee for Medicinal Products for Human Use (CHMP) has recommended approval of baricitinib for adults with severe AA.
AA received widespread international attention earlier this year at the Academy Awards ceremony, when actor Will Smith walked from the audience up onto the stage and slapped comedian Chris Rock in the face after he directed a joke at Mr. Smith’s wife, Jada Pinkett Smith, about her shaved head. Mrs. Pinkett Smith has AA and has been public about her struggles with the disease.
A version of this article first appeared on Medscape.com.
Momelotinib hits the mark for deadly bone marrow cancer
“The current state for the treatment of myelofibrosis relies on JAK2,” said Ruben Mesa, MD, of the Mays Cancer Center at the UT Health San Antonio MD Anderson Cancer Center.
“Momelotinib is a JAK1 and JAK2 inhibitor.” However, in the early days of studying momelotinib,“it became clear that there was also potentially an improvement in anemia,” which may be related to the additional inhibition of ACVR1, he explained.
Data suggest that the ability to curb anemia in anemic myelofibrosis patients prolongs their lives for up to 8 years, Dr. Mesa added.
Previous studies, notably the phase 3 SIMPLIFY study, showed that momelotinib was associated with comparable effects on spleen volume, transfusion, and total symptom scores from baseline that were similar to ruxolitinib.
In the current study, known as MOMENTUM, a daily dose of momelotinib was compared to danazol for treatment of symptomatic and anemic myelofibrosis (MF) patients who had previously received standard JAK-inhibitor therapy.
In the study, the researchers randomized 130 patients to momelotinib and 65 to danazol. After 24 weeks, those in the danazol group were allowed to cross over to momelotinib. The primary endpoint of the study was total symptom score (TSS) response after 24 weeks. Secondary endpoints included transfusion independence and splenic response at 24 weeks. The median age of the patients in the momelotinib group was 71 years, 60.8% were male, and 82% were white. The baseline demographics were not significantly different in the danazol group.
Overall, 24.6% of momelotinib patients responded with improved total symptom scores at 24 weeks vs. 9.2% of the danazol group. Spleen response also was significantly higher in the momelotinib group; 40% of patients showed a 25% reduction and 23% showed a 35% reduction, compared with 6.2% and 3.1%, respectively, of patients in the danazol group. Transfusion independence at week 24 also was higher for momelotinib patients, compared with danazol patients (31% vs. 20%, respectively, P = 0064).
Adverse events of grade 3 or higher occurred in 53.8% of momelotinib patients and 64.6% of danazol patients, and serious adverse events occurred in 34.6% and 40.0%, respectively. Nearly all patients had anemia, but only 27.7% and 26.2% of the momelotinib and danazol groups, respectively, had thrombocytopenia of grade 3 or higher. The most common nonhematologic adverse events were diarrhea, nausea, and increased blood creatinine. A total of 27.7% of the patients in the momelotinib group discontinued treatment; 16 of whom did so because of an adverse event.
Also, at 24 weeks, patients in the momelotinib group showed a trend towards increased overall survival, compared with danazol (HR, 0.506, P = 0.719).
With momelotinib, there is a consistent thrombocytopenic profile across subgroups, the data on which were presented separately at ASCO (poster 7061), Dr. Mesa added.
“We feel that these findings support the future use of momelotinib as an effective treatment in MF patients, especially those with anemia,” he concluded.
Cytopenia data are exciting
The key finding in the current study is that “momelotinib leads to important endpoints including significant improvement in symptoms and spleen reduction,” said Dr. Gabriela Hobbs of Harvard Medical School, Boston, who served as the discussant for the study.
“I think a novel finding of momelotinib that is definitely exciting from the treatment perspective is that momelotinib can also lead to improvement in cytopenias,” she said. “We often have to decide between treating the symptoms of the spleen at the expense of blood counts,” in MF patients, she noted.
The study was sponsored by Sierra Oncology. Dr. Mesa disclosed relationships with companies including Constellation Pharmaceutical, La Jolla Pharma, and study sponsor Sierra Oncology, as well as funding from AbbVie, Celgene, Constellation Pharmaceuticals, CTI, Genentech, Incyte, Mays Cancer Center, NCI, Promedior, and Samus. Dr. Hobbs had no financial conflicts to disclose.
This article was updated 06/14/2022.
FROM ASCO 2022
A prescription for de-diagnosing
In 2016, Gupta and Cahill challenged the field of psychiatry to reexamine prescribing patterns.1 They warned against the use of polypharmacy when not attached to improved patient functioning. They were concerned with the limited evidence for polypharmacy as well as DSM diagnostic criteria. In their inspiring article, they described a process of deprescribing.
In an effort to study and practice their recommendations, we have noticed a lack of literature examining the elimination of diagnostic labels. While there have been some studies looking at comorbidity, especially with substance use disorders,2 there is a paucity of scientific evidence on patients with numerous diagnoses. Yet our practices are filled with patients who have been labeled with multiple conflicting or redundant diagnoses throughout their lives depending on the setting or the orientation of the practitioner.

The DSM-5 warns against diagnosing disorders when “the occurrence … is not better explained by” another disorder.3 A mix of diagnoses creates confusion for patients as well as clinicians trying to sort through their reported psychiatric histories.
A routine example would include a patient presenting for an initial evaluation and stating “I’ve been diagnosed as manic-depressive, high anxiety, split personality, posttraumatic stress, insomnia, ADD, and depression.” A review of the medical record will reveal a list of diagnoses, including bipolar II, generalized anxiety disorder, borderline personality disorder, posttraumatic stress disorder, unspecified insomnia, attention-deficit/hyperactivity disorder, and major depressive disorder. The medication list includes lamotrigine, valproic acid, citalopram, bupropion, buspirone, prazosin, methylphenidate, clonazepam, hydroxyzine, and low-dose quetiapine at night as needed.
This is an example of polypharmacy treating multiple, and at times conflicting, diagnoses. While an extreme case, in our experience, cases like this are not uncommon. It was actually in our efforts to examine deprescribing that we noticed this quandary. When inquiring about patients on many psychotropic medications, we often receive this retort: the patient is only prescribed one medication per disorder. Some providers have the belief that multiple disorders justify multiple medications, and that this tautological thinking legitimizes polypharmacy.
A patient who has varying moods, some fears, a fluctuating temperament, past traumas, occasional difficulty sleeping, intermittent inattention, and some sadness may be given all the diagnoses listed above and the resulting medication list. The multiplication of diagnoses, “polydiagnosing,” is a convenient justification for future polypharmacy. A lack of careful assessment and thinking in the application of new diagnoses permits the use of increasing numbers of pharmacological agents. A constellation of symptoms of anxiety, concentration deficits, affective dysregulation, and psychosis may justify the combination of benzodiazepines, stimulants, mood stabilizers, and antipsychotics, while a patient with “just” schizophrenia who is sometimes sad, scared, or distracted is more likely to be kept on just one medication, likely an antipsychotic.
Contrary to most medical disorders (for example, tuberculosis) but similar to others (for example, chronic pain), psychiatric disorders are based on the opinion of a “modest number of ‘expert’ classifications.”4 While the broad categories of disorders are justifiable, individual diagnoses are burdened with high rates of comorbidity; lack of treatment specificity; and evidence that distinct syndromes share a genetic basis. Those concerns were exemplified in the study examining the inter-rater reliability of DSM-5 diagnoses, where many disorders were found to have questionable validity.5
A psychiatric diagnosis should be based on biological, psychological, and social factors, which align with our understanding of the natural course of an illness. A patient presenting with transient symptoms of sadness in the context of significant social factors like homelessness and/or significant biological factors associated with schizophrenia should not reflexively receive an additional diagnosis of a depressive disorder. A patient reporting poor concentration in the context of a manic episode should not receive an additional diagnosis of attention-deficit disorder. An older patient with depression on multiple antipsychotics for adjunctive treatment should not necessarily receive a diagnosis of cognitive disorder at the first sign of memory problems.
The cavalier and inconsistent use of diagnoses renders the patients with no clear narrative of who they are. They end up integrating the varying providers’ opinions as a cacophony of labels of unclear significance. Many patients have contradictory diagnoses like major depressive disorder and bipolar disorder, or schizophrenia and schizoaffective disorder. Those inaccurate diagnoses could not only lead to treatment mistakes, but also psychological harm.6

A clearer diagnostic picture is not only more scientifically sound but also more coherent to the patient. This in turn can lead to an improved treatment alliance and buy-in from the patient.
How should a provider practice de-diagnosing? Based on the work of Reeve, et al.,7 on the principles crucial to deprescribing, and subsequent research by Gupta and Cahill,8 we compiled a list of considerations for practitioners wishing to engage in this type of work with their patients.
Choose the right time. While insurance companies require diagnostic findings from the first visit, abrupt de-diagnosing for the sake of simplifying the record from that first visit could be detrimental. Patients can become attached to and find meaning in their diagnostic labels. This was exemplified with the removal of Asperger’s syndrome from the DSM-5.9 Acute symptomatology may be an opportune time to revisit the core pathology of a patient, or a poor time for a patient to have this discussion.
Compile a list of all the patient’s diagnoses. Our initial visits are often illuminated when patients enumerate the vast number of diagnoses they have been given by different providers. Patients will often list half a dozen diagnoses. The patterns often follow life courses with ADHD, conduct disorder, and learning disability in childhood; with anxiety, depression, and/or bipolar disorder in early adulthood; to complicated grief, depression with pseudodementia, and neurocognitive disorders in older adults. Yet patients rarely appreciate the temporary or episodic nature of mental disorders and instead accumulate diagnoses at each change of provider.
Initiate discussion with the patient. It is meaningful to see if patients resonate with the question, “Do you ever feel like every psychiatrist you have seen has given you a different diagnosis?” In our experience, patients’ reactions to this question usually exemplify the problematic nature of the vast array of diagnoses our patients are given. The majority of them are unable to confidently explain the meaning of those diagnoses, the context in which they were given, or their significance. This simple exercise has a powerful effect on raising awareness to patients of the problematic nature of polydiagnosing.
Introduce de-diagnosing. The engagement of patients in the diagnostic process has a significant effect. Reviewing not only diagnostic criteria but also nosology and debates in our understanding of diagnoses can provide patients with further engagement in their care. A simple review of the debate of the bereavement exclusion may permit a patient to not only understand the complexity, but also the changing nature of diagnoses. Suddenly, they are no longer bystanders, but informed participants in their care.
Identify diagnoses most appropriate for removal. Contradictory diagnoses are common in the clinical settings we work in. We routinely see patients carrying multiple mood diagnoses, despite our diagnostic systems not permitting one to have both unipolar and bipolar depression. Superfluous diagnoses are also frequent, with patients receiving depressive, or anxious labels when in an acute state of psychosis or mania. This is exemplified by patients suffering from thought blocking and receiving cognitive or attention-related diagnoses. Concurrent yet different diagnoses are also common in patients with a different list of diagnoses by their primary care provider, their therapist, and their psychiatrist. This is particularly problematic as it forces the patient to alternate their thinking or choose between their providers.
Create a new narrative for the patient. Once diagnoses are explained, clarified, and understood, patients with the help of their providers can reexamine their life story under a new and simplified construct. This process often leads to a less confusing sense of self, an increased dedication to the treatment process, whether behavioral, social, psychological, or pharmacologic.
Consider deprescribing. With a more straightforward and more grounded list of diagnoses (or simply one diagnosis), we find the process of deprescribing to be simpler and more engaging for patients. For example, patients can clearly understand the lack of necessity of an antipsychotic prescription for a resolved substance-induced psychosis. Patients are more engaged in their care, leading to improved medication compliance and less attachment to discontinued medications.
Monitor and adapt. One should of course reevaluate diagnoses as the course of illness provides us with additional information. However, we suggest waiting for a manic episode to emerge prior to diagnosing bipolar rather than suggesting the diagnosis because a patient was wearing red shoes, spoke multiple languages, had multiple degrees and was creative.10 The contextual basis and progression of the symptoms should lead to continual reassessment of diagnoses.
Physicians are aware of the balance between Occam’s razor, which promotes the simplest single explanation for a problem, versus Hickam’s dictum that reminds us that patients can have as many diseases as they please. However, similarly to polypharmacy, “polydiagnosing” has negative effects. While the field of psychiatry’s advancing knowledge may encourage providers to diagnose their patients with the growing number of diagnoses, patients still need and benefit from a coherent and clear medical narrative. Psychiatry would be wise to recognize this concerning trend, in its attempt at rectifying polypharmacy.
Dr. Badre is a clinical and forensic psychiatrist in San Diego. He holds teaching positions at the University of California, San Diego, and the University of San Diego. He teaches medical education, psychopharmacology, ethics in psychiatry, and correctional care. Dr. Badre can be reached at his website, BadreMD.com. He has no conflicts of interest. Dr. Lehman is a professor of psychiatry at the University of California, San Diego. He is codirector of all acute and intensive psychiatric treatment at the Veterans Affairs Medical Center in San Diego, where he practices clinical psychiatry. He has no conflicts of interest.
References
1. Gupta S & Cahill JD. A prescription for “deprescribing” in psychiatry. Psychiatr Serv. 2016 Aug 1;67(8):904-7. doi: 10.1176/appi.ps.201500359.
2. Schuckit MA. Comorbidity between substance use disorders and psychiatric conditions. Addiction. 2006 Sep;101 Suppl 1:76-88. doi: 10.1111/j.1360-0443.2006.01592.x.
3. The Diagnostic and Statistical Manual of Mental Disorders, Fifth Edition, Text Revision (DSM-5-TR). American Psychiatric Association, 2022. https://psychiatry.org/psychiatrists/practice/dsm.
4. Kendler KS. An historical framework for psychiatric nosology. Psychol Med. 2009 Dec;39(12):1935-41. doi: 10.1017/S0033291709005753.
5. Regier DA et al. DSM-5 field trials in the United States and Canada. Am J Psychiatry. 2013 Jan;170(1):59-70. doi: 10.1176/appi.ajp.2012.12070999.
6. Bhattacharya R et al. When good news is bad news: psychological impact of false-positive diagnosis of HIV. AIDS Care. 2008 May;20(5):560-4. doi: 10.1080/09540120701867206.
7. Reeve E et al. Review of deprescribing processes and development of an evidence‐based, patient‐centred deprescribing process. Br J Clin Pharmacol. 2014 Oct;78(4):738-47. doi: 10.1111/bcp.12386.
8. Gupta S and Cahill JD. A prescription for “deprescribing” in psychiatry.
9. Solomon M. “On the appearance and disappearance of Asperger’s syndrome” in Kendler and Parnas (eds.) Philosophical Issues in Psychiatry IV: Classification of Psychiatric Illness. Oxford University Press, 2017. doi: 10.1093/med/9780198796022.003.0023.
10. Akiskal HS. Searching for behavioral indicators of bipolar II in patients presenting with major depressive episodes: The “red sign,” the “rule of three,” and other biographic signs of temperamental extravagance, activation, and hypomania. J Affect Disord. 2005 Feb;84(2-3):279-90. doi: 10.1016/j.jad.2004.06.002.
In 2016, Gupta and Cahill challenged the field of psychiatry to reexamine prescribing patterns.1 They warned against the use of polypharmacy when not attached to improved patient functioning. They were concerned with the limited evidence for polypharmacy as well as DSM diagnostic criteria. In their inspiring article, they described a process of deprescribing.
In an effort to study and practice their recommendations, we have noticed a lack of literature examining the elimination of diagnostic labels. While there have been some studies looking at comorbidity, especially with substance use disorders,2 there is a paucity of scientific evidence on patients with numerous diagnoses. Yet our practices are filled with patients who have been labeled with multiple conflicting or redundant diagnoses throughout their lives depending on the setting or the orientation of the practitioner.
The DSM-5 warns against diagnosing disorders when “the occurrence … is not better explained by” another disorder.3 A mix of diagnoses creates confusion for patients as well as clinicians trying to sort through their reported psychiatric histories.
A routine example would include a patient presenting for an initial evaluation and stating “I’ve been diagnosed as manic-depressive, high anxiety, split personality, posttraumatic stress, insomnia, ADD, and depression.” A review of the medical record will reveal a list of diagnoses, including bipolar II, generalized anxiety disorder, borderline personality disorder, posttraumatic stress disorder, unspecified insomnia, attention-deficit/hyperactivity disorder, and major depressive disorder. The medication list includes lamotrigine, valproic acid, citalopram, bupropion, buspirone, prazosin, methylphenidate, clonazepam, hydroxyzine, and low-dose quetiapine at night as needed.
This is an example of polypharmacy treating multiple, and at times conflicting, diagnoses. While an extreme case, in our experience, cases like this are not uncommon. It was actually in our efforts to examine deprescribing that we noticed this quandary. When inquiring about patients on many psychotropic medications, we often receive this retort: the patient is only prescribed one medication per disorder. Some providers have the belief that multiple disorders justify multiple medications, and that this tautological thinking legitimizes polypharmacy.
A patient who has varying moods, some fears, a fluctuating temperament, past traumas, occasional difficulty sleeping, intermittent inattention, and some sadness may be given all the diagnoses listed above and the resulting medication list. The multiplication of diagnoses, “polydiagnosing,” is a convenient justification for future polypharmacy. A lack of careful assessment and thinking in the application of new diagnoses permits the use of increasing numbers of pharmacological agents. A constellation of symptoms of anxiety, concentration deficits, affective dysregulation, and psychosis may justify the combination of benzodiazepines, stimulants, mood stabilizers, and antipsychotics, while a patient with “just” schizophrenia who is sometimes sad, scared, or distracted is more likely to be kept on just one medication, likely an antipsychotic.
Contrary to most medical disorders (for example, tuberculosis) but similar to others (for example, chronic pain), psychiatric disorders are based on the opinion of a “modest number of ‘expert’ classifications.”4 While the broad categories of disorders are justifiable, individual diagnoses are burdened with high rates of comorbidity; lack of treatment specificity; and evidence that distinct syndromes share a genetic basis. Those concerns were exemplified in the study examining the inter-rater reliability of DSM-5 diagnoses, where many disorders were found to have questionable validity.5
A psychiatric diagnosis should be based on biological, psychological, and social factors, which align with our understanding of the natural course of an illness. A patient presenting with transient symptoms of sadness in the context of significant social factors like homelessness and/or significant biological factors associated with schizophrenia should not reflexively receive an additional diagnosis of a depressive disorder. A patient reporting poor concentration in the context of a manic episode should not receive an additional diagnosis of attention-deficit disorder. An older patient with depression on multiple antipsychotics for adjunctive treatment should not necessarily receive a diagnosis of cognitive disorder at the first sign of memory problems.
The cavalier and inconsistent use of diagnoses renders the patients with no clear narrative of who they are. They end up integrating the varying providers’ opinions as a cacophony of labels of unclear significance. Many patients have contradictory diagnoses like major depressive disorder and bipolar disorder, or schizophrenia and schizoaffective disorder. Those inaccurate diagnoses could not only lead to treatment mistakes, but also psychological harm.6
A clearer diagnostic picture is not only more scientifically sound but also more coherent to the patient. This in turn can lead to an improved treatment alliance and buy-in from the patient.
How should a provider practice de-diagnosing? Based on the work of Reeve, et al.,7 on the principles crucial to deprescribing, and subsequent research by Gupta and Cahill,8 we compiled a list of considerations for practitioners wishing to engage in this type of work with their patients.
Choose the right time. While insurance companies require diagnostic findings from the first visit, abrupt de-diagnosing for the sake of simplifying the record from that first visit could be detrimental. Patients can become attached to and find meaning in their diagnostic labels. This was exemplified with the removal of Asperger’s syndrome from the DSM-5.9 Acute symptomatology may be an opportune time to revisit the core pathology of a patient, or a poor time for a patient to have this discussion.
Compile a list of all the patient’s diagnoses. Our initial visits are often illuminated when patients enumerate the vast number of diagnoses they have been given by different providers. Patients will often list half a dozen diagnoses. The patterns often follow life courses with ADHD, conduct disorder, and learning disability in childhood; with anxiety, depression, and/or bipolar disorder in early adulthood; to complicated grief, depression with pseudodementia, and neurocognitive disorders in older adults. Yet patients rarely appreciate the temporary or episodic nature of mental disorders and instead accumulate diagnoses at each change of provider.
Initiate discussion with the patient. It is meaningful to see if patients resonate with the question, “Do you ever feel like every psychiatrist you have seen has given you a different diagnosis?” In our experience, patients’ reactions to this question usually exemplify the problematic nature of the vast array of diagnoses our patients are given. The majority of them are unable to confidently explain the meaning of those diagnoses, the context in which they were given, or their significance. This simple exercise has a powerful effect on raising awareness to patients of the problematic nature of polydiagnosing.
Introduce de-diagnosing. The engagement of patients in the diagnostic process has a significant effect. Reviewing not only diagnostic criteria but also nosology and debates in our understanding of diagnoses can provide patients with further engagement in their care. A simple review of the debate of the bereavement exclusion may permit a patient to not only understand the complexity, but also the changing nature of diagnoses. Suddenly, they are no longer bystanders, but informed participants in their care.
Identify diagnoses most appropriate for removal. Contradictory diagnoses are common in the clinical settings we work in. We routinely see patients carrying multiple mood diagnoses, despite our diagnostic systems not permitting one to have both unipolar and bipolar depression. Superfluous diagnoses are also frequent, with patients receiving depressive, or anxious labels when in an acute state of psychosis or mania. This is exemplified by patients suffering from thought blocking and receiving cognitive or attention-related diagnoses. Concurrent yet different diagnoses are also common in patients with a different list of diagnoses by their primary care provider, their therapist, and their psychiatrist. This is particularly problematic as it forces the patient to alternate their thinking or choose between their providers.
Create a new narrative for the patient. Once diagnoses are explained, clarified, and understood, patients with the help of their providers can reexamine their life story under a new and simplified construct. This process often leads to a less confusing sense of self, an increased dedication to the treatment process, whether behavioral, social, psychological, or pharmacologic.
Consider deprescribing. With a more straightforward and more grounded list of diagnoses (or simply one diagnosis), we find the process of deprescribing to be simpler and more engaging for patients. For example, patients can clearly understand the lack of necessity of an antipsychotic prescription for a resolved substance-induced psychosis. Patients are more engaged in their care, leading to improved medication compliance and less attachment to discontinued medications.
Monitor and adapt. One should of course reevaluate diagnoses as the course of illness provides us with additional information. However, we suggest waiting for a manic episode to emerge prior to diagnosing bipolar rather than suggesting the diagnosis because a patient was wearing red shoes, spoke multiple languages, had multiple degrees and was creative.10 The contextual basis and progression of the symptoms should lead to continual reassessment of diagnoses.
Physicians are aware of the balance between Occam’s razor, which promotes the simplest single explanation for a problem, versus Hickam’s dictum that reminds us that patients can have as many diseases as they please. However, similarly to polypharmacy, “polydiagnosing” has negative effects. While the field of psychiatry’s advancing knowledge may encourage providers to diagnose their patients with the growing number of diagnoses, patients still need and benefit from a coherent and clear medical narrative. Psychiatry would be wise to recognize this concerning trend, in its attempt at rectifying polypharmacy.
Dr. Badre is a clinical and forensic psychiatrist in San Diego. He holds teaching positions at the University of California, San Diego, and the University of San Diego. He teaches medical education, psychopharmacology, ethics in psychiatry, and correctional care. Dr. Badre can be reached at his website, BadreMD.com. He has no conflicts of interest. Dr. Lehman is a professor of psychiatry at the University of California, San Diego. He is codirector of all acute and intensive psychiatric treatment at the Veterans Affairs Medical Center in San Diego, where he practices clinical psychiatry. He has no conflicts of interest.
References
1. Gupta S & Cahill JD. A prescription for “deprescribing” in psychiatry. Psychiatr Serv. 2016 Aug 1;67(8):904-7. doi: 10.1176/appi.ps.201500359.
2. Schuckit MA. Comorbidity between substance use disorders and psychiatric conditions. Addiction. 2006 Sep;101 Suppl 1:76-88. doi: 10.1111/j.1360-0443.2006.01592.x.
3. The Diagnostic and Statistical Manual of Mental Disorders, Fifth Edition, Text Revision (DSM-5-TR). American Psychiatric Association, 2022. https://psychiatry.org/psychiatrists/practice/dsm.
4. Kendler KS. An historical framework for psychiatric nosology. Psychol Med. 2009 Dec;39(12):1935-41. doi: 10.1017/S0033291709005753.
5. Regier DA et al. DSM-5 field trials in the United States and Canada. Am J Psychiatry. 2013 Jan;170(1):59-70. doi: 10.1176/appi.ajp.2012.12070999.
6. Bhattacharya R et al. When good news is bad news: psychological impact of false-positive diagnosis of HIV. AIDS Care. 2008 May;20(5):560-4. doi: 10.1080/09540120701867206.
7. Reeve E et al. Review of deprescribing processes and development of an evidence‐based, patient‐centred deprescribing process. Br J Clin Pharmacol. 2014 Oct;78(4):738-47. doi: 10.1111/bcp.12386.
8. Gupta S and Cahill JD. A prescription for “deprescribing” in psychiatry.
9. Solomon M. “On the appearance and disappearance of Asperger’s syndrome” in Kendler and Parnas (eds.) Philosophical Issues in Psychiatry IV: Classification of Psychiatric Illness. Oxford University Press, 2017. doi: 10.1093/med/9780198796022.003.0023.
10. Akiskal HS. Searching for behavioral indicators of bipolar II in patients presenting with major depressive episodes: The “red sign,” the “rule of three,” and other biographic signs of temperamental extravagance, activation, and hypomania. J Affect Disord. 2005 Feb;84(2-3):279-90. doi: 10.1016/j.jad.2004.06.002.