User login
Impact of Hospitalists on Care Outcomes in a Large Integrated Health System in British Columbia
From the Fraser Health Authority, Surrey, British Columbia, Canada.
Abstract
- Objective: To study care outcomes associated with a network of hospitalist services compared to traditional providers.
- Design: Retrospective review of administrative data.
- Setting and participants: Patients from a large integrated health care system in British Columbia in western Canada admitted and cared for by 3 provider groups between April 1, 2012, and March 31, 2018: hospitalists, family physicians (FP), and internal medicine (IM) physicians:
- Measurements: Average total length of stay (LOS), 30-day readmission, in-hospital mortality, and hospital standardized mortality ratio (HSMR) were the study outcome measures. Multiple logistic regression or generalized regression were completed to determine the relationship between provider groups and outcomes.
- Results: A total of 248,412 hospitalizations were included. Compared to patients admitted to hospitalists, patients admitted to other providers had higher odds of mortality (odds ratio [OR] for FP, 1.29; 95% confidence interval [CI], 1.21-1.37; OR for IM, 1.24; 95% CI, 1.15-1.33). Compared to hospitalist care, FP care was associated with higher readmission (OR, 1.27; 95% CI, 1.22-1.33), while IM care showed lower odds of readmission (OR, 0.83; 95% CI, 0.79-0.87). Patients admitted to the IM group had significantly lower total LOS (mean, 5.13 days; 95% CI, 5.04-5.21) compared to patients admitted to hospitalists (mean, 7.37 days; CI, 7.26-7.49) and FPs (mean, 7.30 days; 95% CI, 7.19-7.41). In a subgroup analysis of patients presenting with congestive heart failure, chronic obstructive pulmonary disease, and pneumonia, these general tendencies broadly persisted for mortality and LOS comparisons between FPs and hospitalists, but results were mixed for hospital readmissions.
- Conclusion: Care provided by hospitalists was associated with lower mortality and readmission rates compared with care provided by FPs, despite similar LOS. These findings may reflect differences in volume of services delivered by individual physicians, on-site availability to address urgent medical issues, and evolving specialization of clinical and nonclinical care processes in the acute care setting.
Keywords: hospital medicine; length of stay; readmission; mortality.
The hospitalist model of care has undergone rapid growth globally in recent years.1 The first hospitalist programs in Canada began around the same time as those in the United States and share many similarities in design and operations with their counterparts.2-4 However, unlike in the United States, where the hospitalist model has successfully established itself as an emerging specialty, debates about the merits of the model and its value proposition continue among Canadian observers.5-9
Historically, the type of physicians who acted as the most responsible provider (MRP) in Canadian hospitals depended on setting and geography.10 In large urban areas, groups of general internists or specialists have historically looked after general medicine patients as part of university-affiliated teaching services.11,12 Patients admitted to community hospitals have traditionally been cared for by their own primary care providers, typically general practitioners or family physicians (FPs). In the mid-1990s, many primary care providers in urban centers began to withdraw from inpatient care and primarily focused their practices in the outpatient setting.13-15 Hospitalist programs emerged as health care administrators sought to fill the resulting gap in MRP coverage.2,10
To date, attempts to understand the impact of hospitalist programs in Canada have been limited. A number of early studies aimed to describe16 the role of hospitalists in Canada and suggested improvements in length of stay (LOS) and staff satisfaction.17 However, these studies relied on unadjusted before-after comparisons and lacked methodological rigor to draw robust conclusions. More recently, a few studies have evaluated care outcomes associated with hospitalists using administrative databases, which attempted to control for potential confounding factors.18-21
While these studies are beginning to shed some light on the impact of hospital medicine programs in Canada, there are a number of issues that limit their generalizability. For example, the majority of studies to date focus on hospital medicine programs in Canada’s largest province (Ontario), and most describe experiences from single institutions. Since each of the 13 provincial and territorial governments organizes its health care system differently,22 results from 1 province may not be generalizable to other parts of the country. Moreover, hospitalists in Ontario are more diverse in their training backgrounds, with a larger percentage having trained in general internal medicine (IM), as compared to other parts of Canada, where the majority of hospitalists are overwhelmingly trained as FPs.3
We aimed to study care outcomes associated with a network of hospitalist services compared to “traditional” providers (community-based FPs and IM specialists) in a large integrated health care system in the province of British Columbia in western Canada. The hospital medicine services in this network span a range of community and academic hospitals, and collectively constitute 1 of the largest regional programs in the country. This provides a unique opportunity to understand the impact of hospitalists on outcome measures across a range of acute care institutions.
Methods
Setting and Population
Fraser Health Authority is 1 of 5 regional health authorities in British Columbia that emerged in 2001.23,24 It operates a network of hospitalist programs in 10 of its 12 acute care hospitals. In addition to hospitalists, there are a variable number of “traditional” physician providers who continue to act as MRPs. These include community-based FPs who continue to see their own patients in the hospital, either as part of a solo-practice model or a clinic-based call group. There are also a number of general internists and other subspecialists who accept MRP roles for general medicine patients who may present with higher-acuity conditions. As a result, patients requiring hospitalization due to nonsurgical or noncritical care conditions at each Fraser Health hospital may be cared for by a physician belonging to 1 of 3 groups, depending on local circumstances: an FP, a hospitalist, or an internist.
Inclusion and Exclusion Criteria
In order to evaluate comparative outcomes associated with hospitalist care, we included all patients admitted to a physician in each of the 3 provider groups between April 1, 2012, and March 31, 2018. We chose this time period for 2 reasons: first, we wanted to ensure comparability over an extended period of time, given the methodological changes implemented in 2009 by the Canadian Institute for Health Information (CIHI), the federal organization in the country responsible for setting standards for health care measures.25 Second, previous internal reviews had suggested that data quality prior to this year was inconsistent. We only considered hospitalizations where patients were admitted to and discharged by the same service, and excluded 2 acute care facilities and 1 free-standing rehabilitation facility without a hospitalist service during this period. We also excluded patients who resided in a location beyond the geographic catchment area of Fraser Health. Further details about data collection are outlined in the Appendix.
Measures
We used the framework developed by White and Glazier26 to inform the selection of our outcome measures, as well as relevant variables that may impact them. This framework proposes that the design of the inpatient care model (structures and processes of care) directly affects care outcomes. The model also proposes that patient and provider attributes can modulate this relationship, and suggests that a comprehensive evaluation of hospitalist performance needs to take these factors into account. We identified average total LOS, 30-day readmission rate, in-hospital mortality, and hospital standardized mortality ratio (HSMR)27 as primary outcome measures. HSMR is defined as actual over expected mortality and is measured by CIHI through a formula that takes into account patient illness attributes (eg, the most responsible diagnosis, comorbidity levels) and baseline population mortality rates.27 We chose these measures because they are clinically relevant and easy to obtain and have been utilized in previous similar studies in Canada and the United States.18-21,26
Statistical Analysis
Baseline demographic and clinical differences in patient outcomes were examined using independent t-tests or chi-square tests. Furthermore, baseline differences based on provider groups were explored using analysis of variance or chi-square tests. Multiple logistic regression analyses were completed to determine the relationship between provider groups and readmission and mortality, while the relationship between provider groups and hospital LOS was determined with generalized linear regression (using gamma distribution and a log link). Gamma distribution with a log link analysis is appropriate with outcome measures that are positively skewed (eg, hospital LOS). It assumes that data are sampled from an exponential family of distributions, thus mimicking a log-normal distribution, and minimizes estimation bias and standard errors. These analyses were completed while controlling for the effects of age, gender, and other potential confounding factors.
We initially attempted to control for case mix by incorporating case-mix groups (CMGs) in our multivariate analysis. However, we identified 475 CMGs with at least 1 patient in our study population. We then explored the inclusion of major clinical categories (MCCs) that broadly group CMGs into various higher order/organ-system level categories (eg, diseases of the respiratory system); however, we could not aggregate them into sufficiently homogenous groups to be entered into regression models. Instead, we conducted subgroup analyses on patients in our study population who were hospitalized with 1 of the following 3 CMGs: chronic obstructive pulmonary disease (COPD, n = 11,404 patients), congestive heart failure without coronary angiography (CHF, n = 7680), and pneumonia (itself an aggregate of 3 separate CMGs: aspiration pneumonia, bacterial pneumonia, viral/unspecified pneumonia, n = 11,155). We chose these CMGs as they are among the top 8 presentations for all 3 provider groups.
For all outcome measures, we excluded atypical patients (defined by CIHI as those with atypically long stays) and patients who had been transferred between facilities. For the readmission analysis, we also excluded patients who died in the hospital (Appendix A). Data analyses were completed in IBM SPSS, version 21. For all analyses, significance was determined using 2-tailed test and alpha < 0.05.
Ethics
The Fraser Health Department of Research and Evaluation reviewed this project to determine need for formal Ethics Review Board review, and granted an exemption based on institutional guidelines for program evaluations.
Results
A total of 132,178 patients were admitted to and discharged by 1 of the 3 study provider groups during the study period, accounting for a total of 248,412 hospitalizations. After excluding patients cared for in Fraser Health facilities without a hospitalist service and those who resided in a geographic area beyond Fraser Health, a total of 224,214 admissions were included in the final analysis.
Patient Characteristics
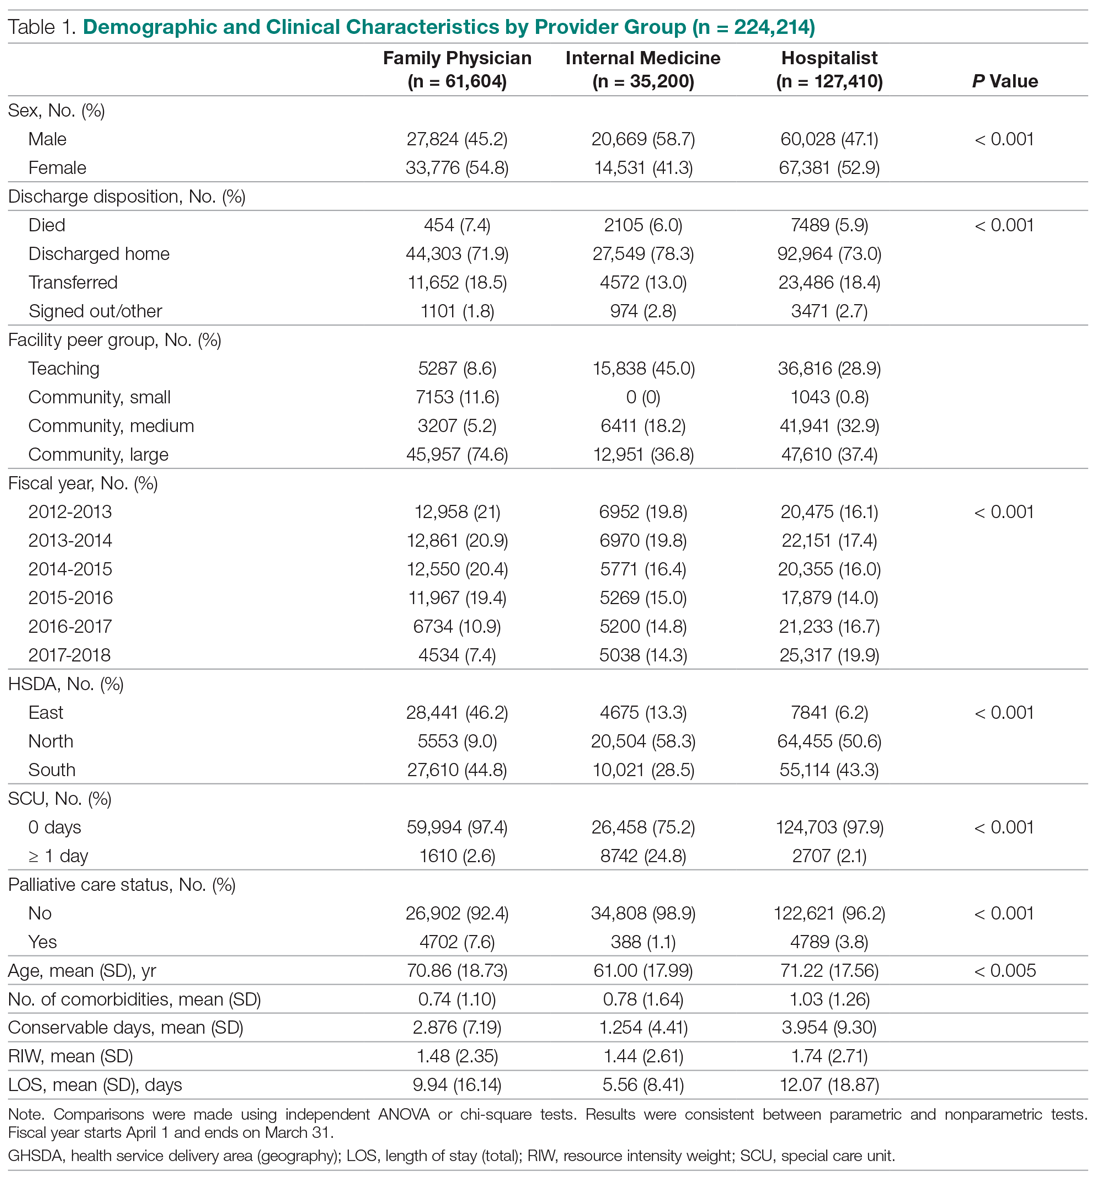
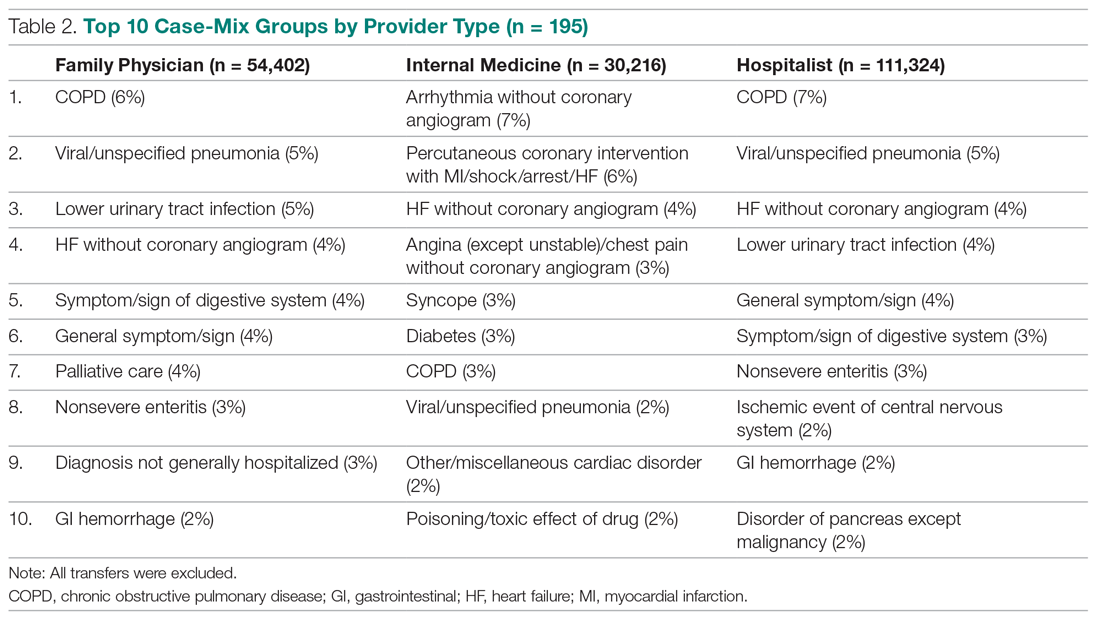
The demographic and clinical characteristics of patients by provider group are summarized in Table 1. Patients admitted to IM providers were substantially younger than those admitted to either FPs or hospitalists (61.00 vs 70.86 and 71.22 years, respectively; P < 0.005). However, patients admitted to hospitalists had higher degrees of complexity (as measured by higher comorbidity levels, number of secondary diagnoses, and higher resource intensity weights [RIWs]; P < 000.1 for all comparisons). Overall, the most common CMGs seen by FPs and hospitalists were similar, while IM providers primarily saw patients with cardiac conditions (Table 2).
Trends Over Time
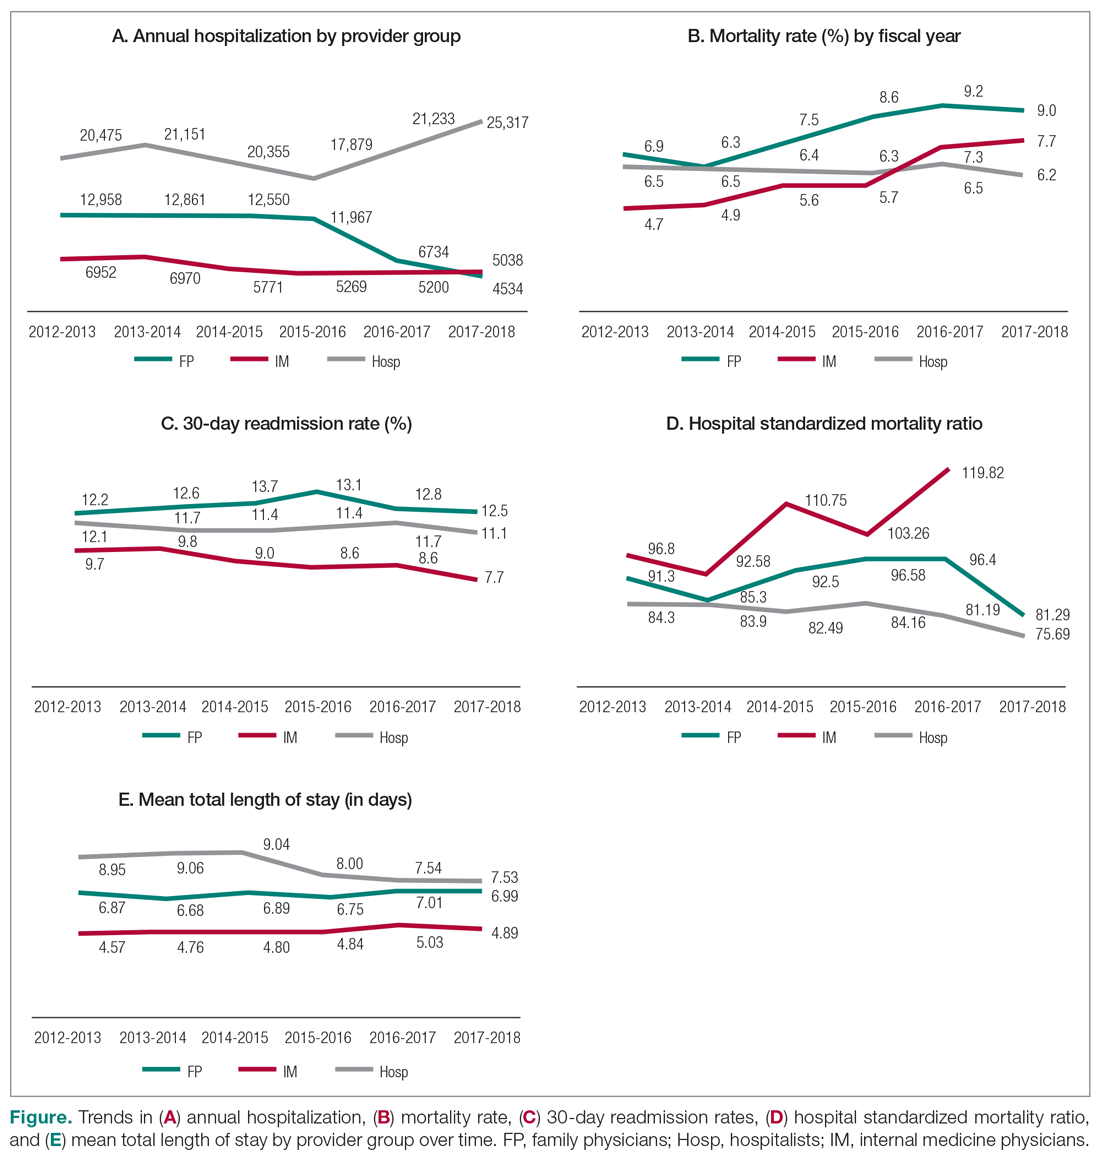
During the study period, the number of patients admitted to the hospitalist services increased by 24%, while admissions to FPs and IM providers declined steadily (Figure). During this time, LOS for hospitalists progressively declined, while LOS for FPs and IM providers increased. Similar trends were observed for measures of mortality, while readmission rates remained constant for FPs, despite a decline observed for other providers.
Mortality
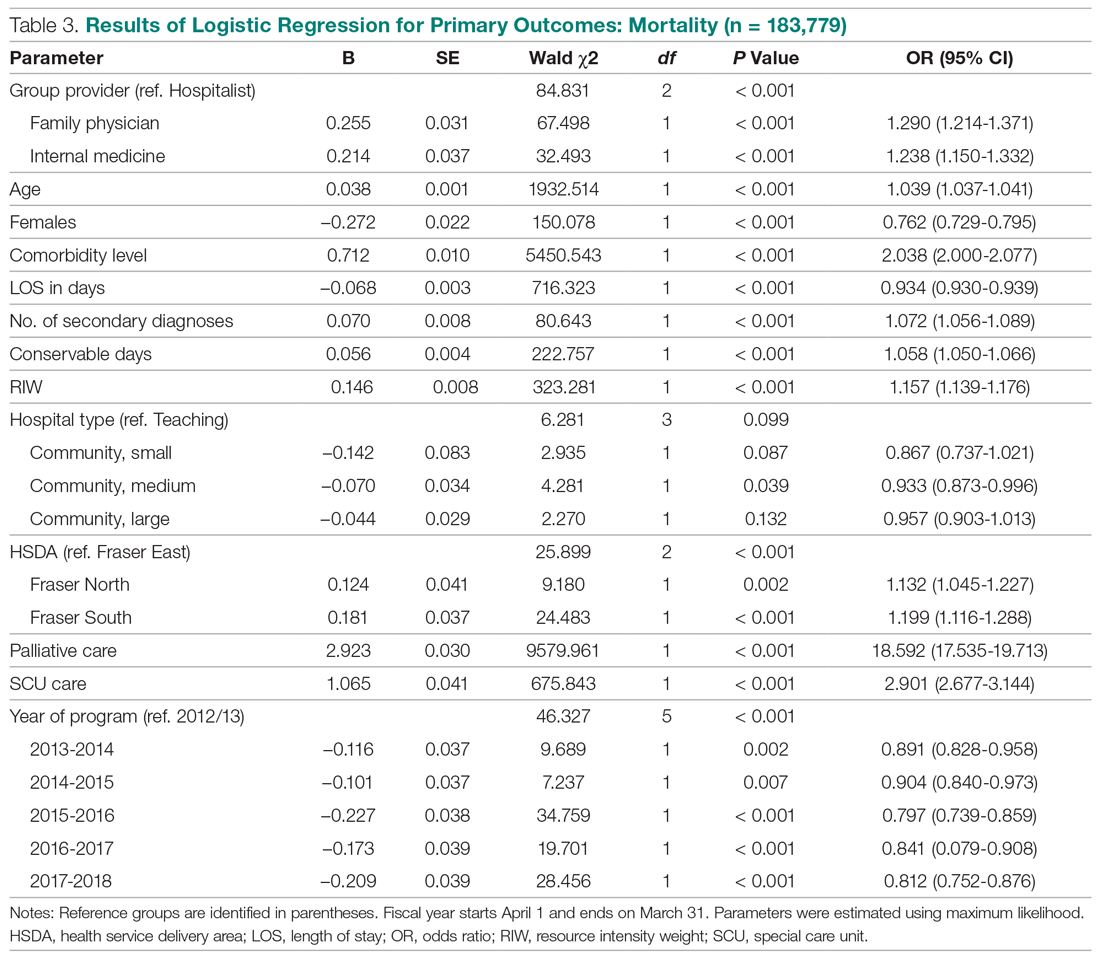
Table 3 summarizes the relationship between provider groups and in-hospital mortality (n = 183,779). Controlling for other variables, patients admitted to FP and IM providers had higher odds of mortality when compared to hospitalists (odds ratio [OR] for FPs, 1.29; 95% confidence interval [CI], 1.21-1.37; OR for IM, 1.24; 95% CI, 1.15-1.33). Older age, higher comorbidity level, higher number of secondary diagnoses, higher use of hospital resources (as measured by RIWs), longer than expected hospital stay (as measured by conservable days), and male gender were also associated with higher mortality. Similarly, patients receiving palliative care and those who spent at least 1 day in a special care unit (critical care, observation, and monitored care units) also had higher odds of mortality. On the other hand, admission to nonteaching medium facilities and longer hospital stay were associated with lower mortality. Compared to the first year of this analysis, lower mortality rates were observed in subsequent fiscal years. Finally, there appear to be geographic variations in mortality within Fraser Health.
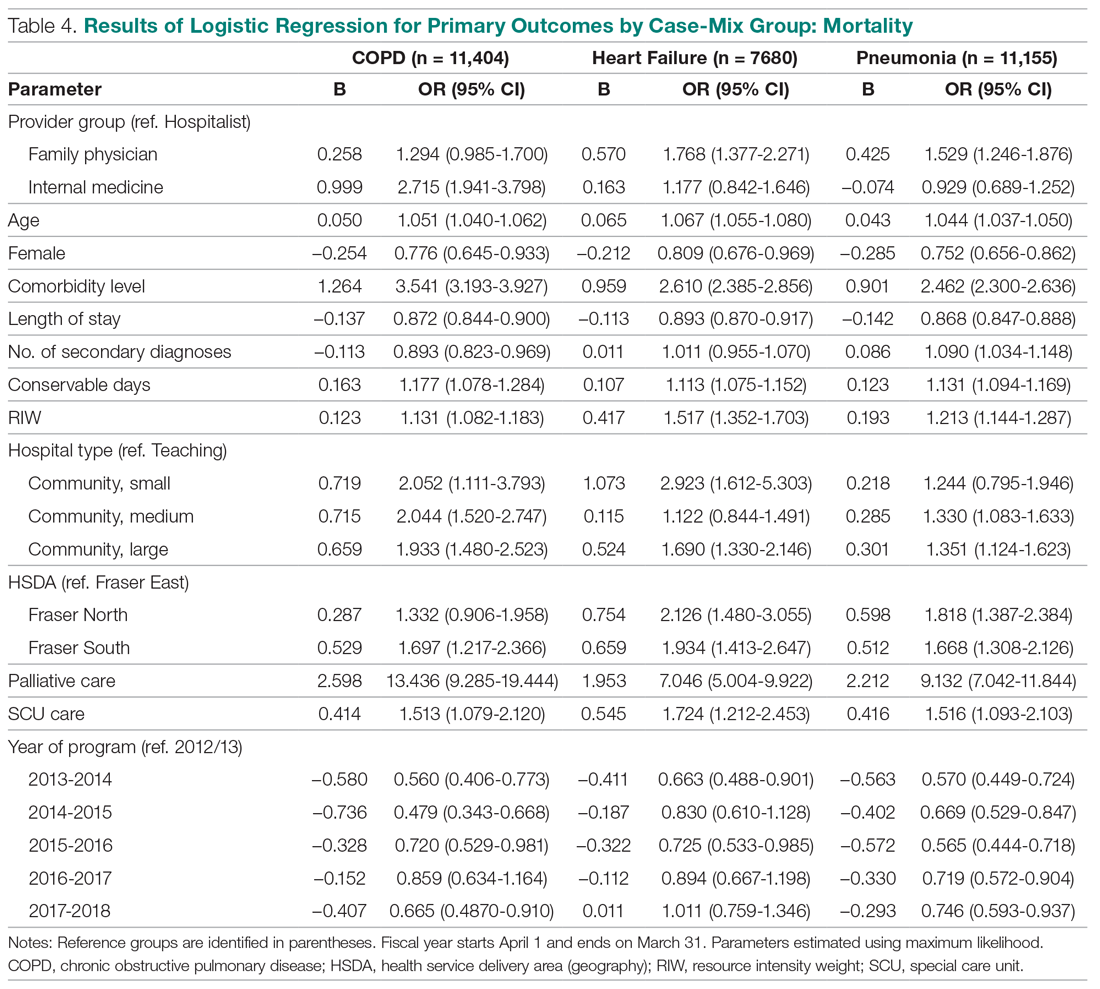
Our analysis of patients with COPD, CHF, and pneumonia showed mixed results (Table 4). Patients admitted to the FP provider group with CHF and pneumonia had higher mortality compared to hospitalists (OR for CHF, 1.77; 95% CI, 1.38-2.27; OR for pneumonia, 1.53; 95% CI, 1.25-1.88), with a similar but nonstatistically significant trend observed for patients with COPD (OR, 1.29; 95% CI, 0.99-1.70). On the other hand, the higher observed mortality associated with the IM provider group in the overall study population only persisted for patients with COPD (OR, 2.71; 95% CI, 1.94-3.80), with no statistically significant differences for patients with CHF (OR, 1.18; 95% CI, 0.84-1.65) and pneumonia (OR, 0.93; 95% CI, 0.69-1.25).
We also studied adjusted mortality as measured by HSMRs. Currently, our Health Information Management system calculates an HSMR value for each patient admitted to our acute care facilities using the methodology developed by CIHI. Prior internal audits demonstrated that our internal calculations closely approximate those reported nationally. Our analysis suggests that over time, HSMR rates for the 3 provider groups have diverged, with patients admitted to IM providers having a higher mortality rate than what would be expected based on the presenting clinical conditions and comorbidity levels (Figure, part D).
Readmission
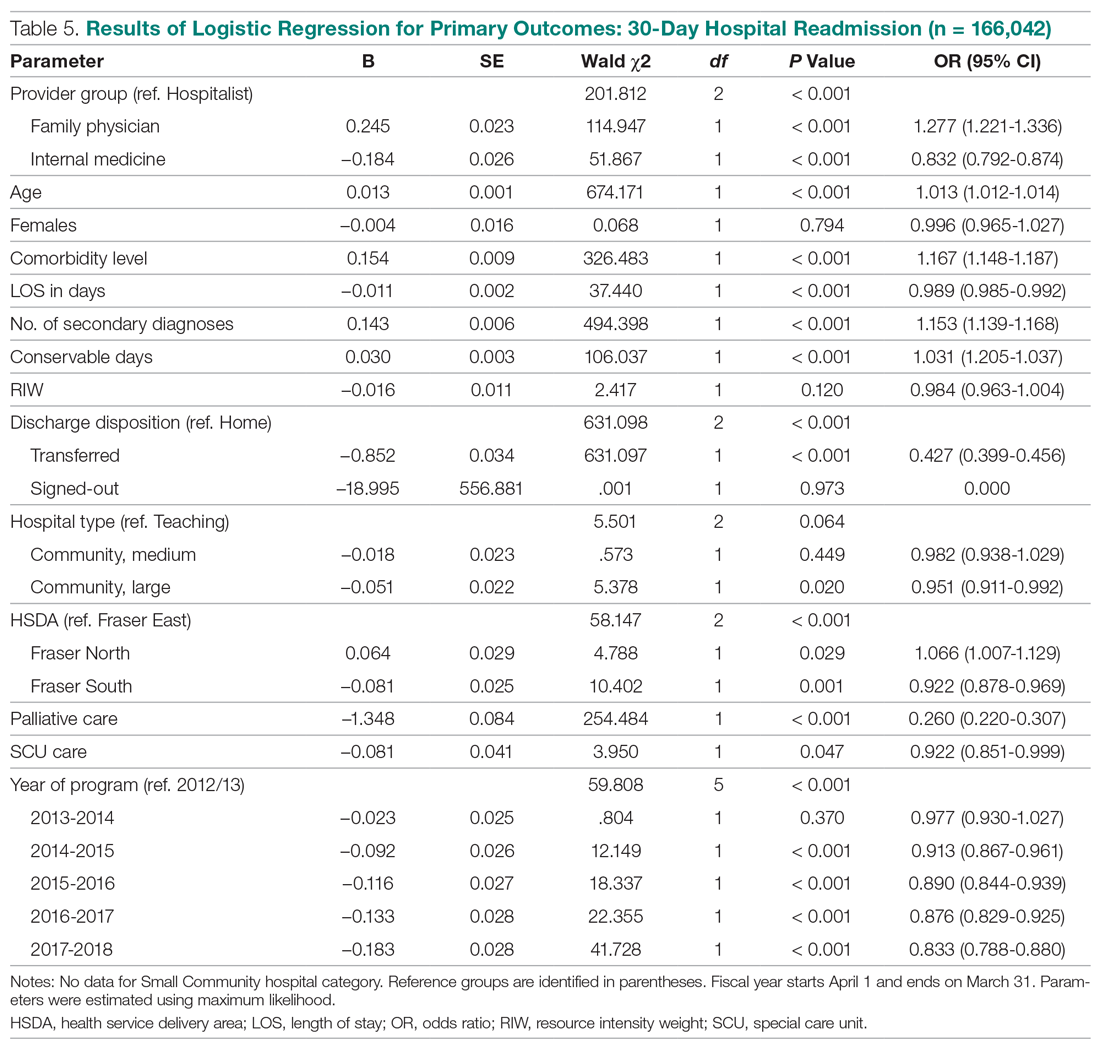
The results of our multiple logistic regression for readmission are summarized in Table 5 (n = 166,042). The impact of provider group on 30-day readmission is mixed, with higher odds associated with FPs compared to hospitalists (OR, 1.27; 95% CI, 1.22-1.34) and lower odds associated with IM physicians (OR, 0.83; 95% CI, 0.79-0.87). Gender and RIW did not show any significant associations, but increasing age, higher number of secondary diagnoses, higher comorbidity levels, and longer than expected LOS (as measure by conservable days) were associated with higher odds of readmission. Conversely, longer hospitalization, admission to a large community hospital, palliative status, admission to a special care unit, geography, and fiscal year were associated with lower odds of readmission.
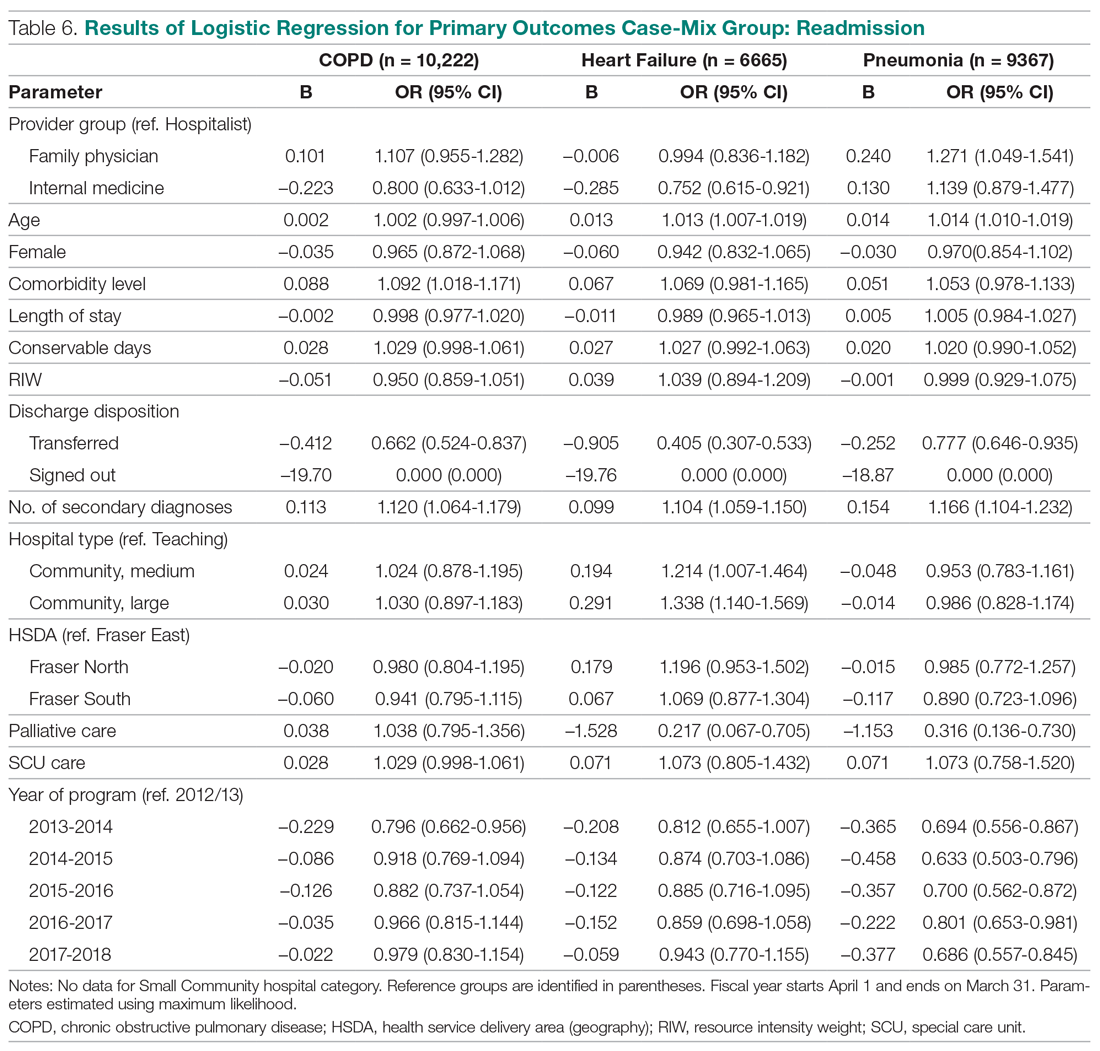
The above differences between provider groups were no longer consistently present when we analyzed patients presenting with COPD, CHF, and pneumonias (Table 6). Only patients admitted to the FP provider group with pneumonia had higher odds of readmission compared to hospitalists (OR, 1.27; 95% CI, 1.05-1.54). Conversely, only patients admitted to the IM provider group with CHF showed lower readmission (OR, 0.75; 95% CI, 0.62-0.92).
Total LOS
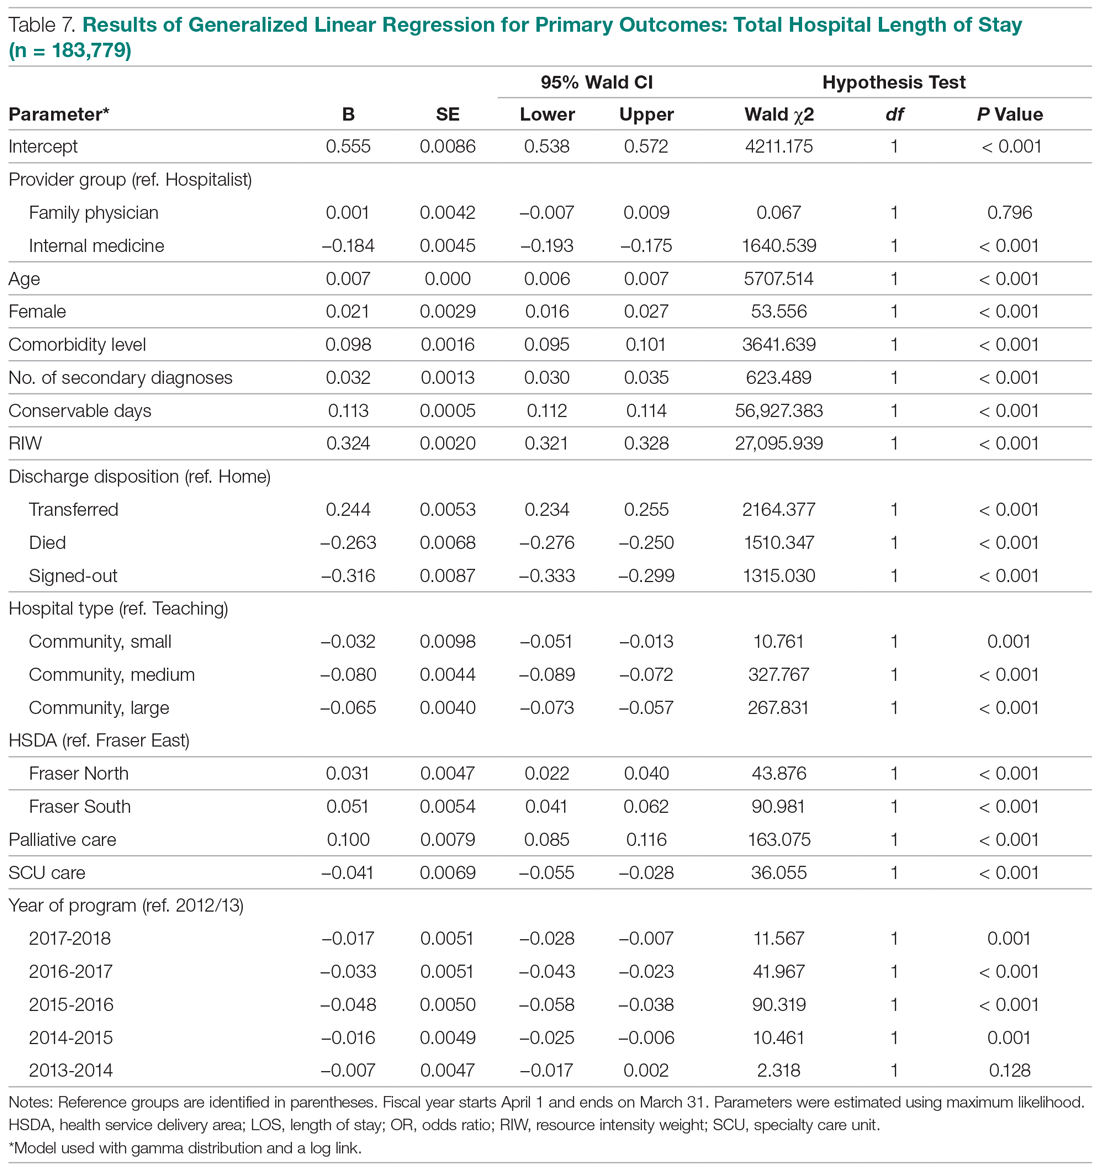
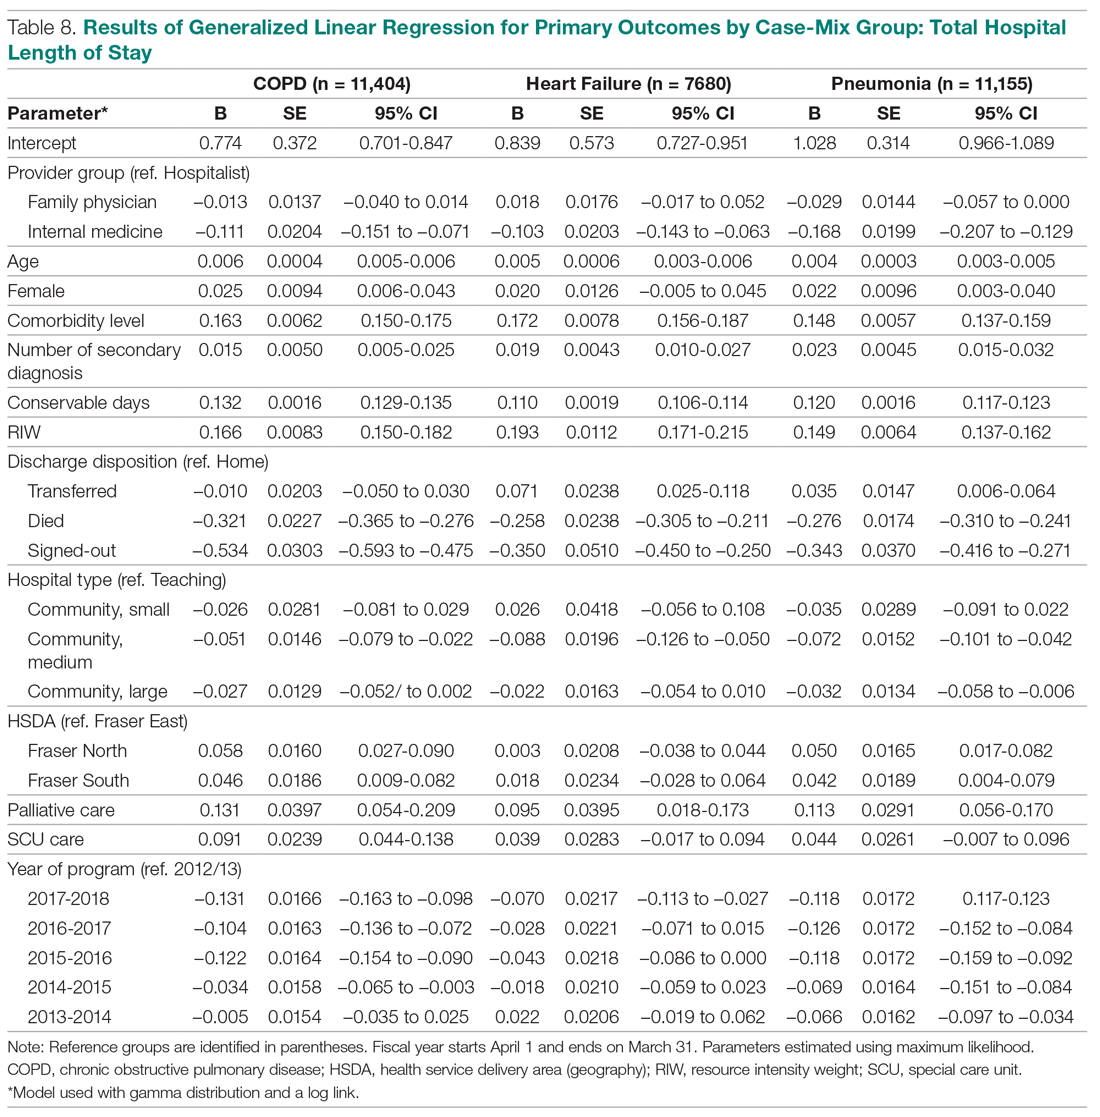
Results using generalized linear regressions for total LOS are presented in Table 7 (n = 183,779). Patients admitted to the IM provider group had significantly lower total LOS (mean, 5.13 days; 95% CI, 5.04-5.21) compared to the hospitalist (mean, 7.37 days; 95% CI, 7.26-7.49) and FP (mean, 7.30 days; 95% CI, 7.19-7.41) groups, with no significant differences between the latter 2 groups. Older patients, females, patients with higher comorbidity levels or number of secondary diagnoses, higher RIW, palliative patients, and discharge to a facility other than the patient’s home were associated with a significantly longer LOS. On the other hand, admission to nonteaching hospitals and admission to a special care unit was associated with lower LOS.
When we compared total LOS for patients admitted with COPD, CHF, and pneumonias, the same differences observed for the broader comparisons persisted: IM patients consistently showed shorter LOS compared to hospitalist patients, while LOS associated with FP patients was similar (Table 8).
Discussion
To our knowledge, our evaluation is the largest study to date designed to understand outcomes associated with hospitalist care in Canada. Our analyses suggest that patients admitted to our large network of hospitalist services present with clinical conditions that are very similar to those of general medicine patients in other Canadian provinces.28,29 They also show that patients cared for by hospitalists experience lower mortality rates compared to those cared for by FPs. Our findings are similar to previous studies, which have suggested a 12% to 75% reduction in odds of mortality associated with hospitalist care.18,19 These differences persisted even when we focused on patients presenting with specific clinical conditions (CHF, COPD, and pneumonias).
White and colleagues have previously demonstrated that generalist physicians who had higher volumes of inpatient care activity also had lower mortality rates compared to those who cared for hospitalized patients less frequently.19 An association between higher physician caseloads and better outcomes has been established for many surgical and medical conditions.30-32 Given that 85% of hospitalists in our program have post-graduate medical training in family medicine (internal department surveys, data not shown), it is less likely that training background can explain differences in outcomes. Instead, differences in patient volumes and the dedicated focus of hospitalists on acute care are likely more important contributors to lower mortality. In our program, a full-time hospitalist spends an average of 2000 hours annually providing services in the hospital setting. The continuous on-site presence of hospitalists enhances their clinical experience with regards to the management of common medical conditions, and increases their exposure to less common presentations of illnesses. The ability to respond to deteriorating patients in a timely manner may be another factor in explaining the differences in mortality rates between dedicated hospital-based generalist providers and similarly trained physicians with a primarily community-based focus.
In our study, hospitalist care was also broadly associated with lower mortality compared to the IM providers, although these differences were not consistently present when patients with specific diagnoses were compared. This may be partly explained by the relationship between caseload and outcomes, but other factors may also be important. For example, patients admitted by IM providers spend significantly more time in specialized units. They also predominantly present with cardiac conditions, and as such may have higher acuity levels and require more invasive interventions. While this may explain the higher observed mortality, a within-group comparison still suggests higher than expected mortality for IM patients. The HSMR methodology measures actual mortality rates compared to what would be expected based on clinical presentation and baseline population characteristics. Calculating HSMR is highly dependent on proper documentation and chart abstraction,33,34 and it is possible that some of the differences observed are due to incomplete physician documentation. However, a more in-depth analysis of care processes will be required to clarify the observed trends.
Compared to hospitalists, patients cared for by FPs also had higher odds of readmission within 30 days, which is consistent with prior studies.18,19 One of the criticisms of the hospitalist model has been the inherent discontinuity of care that is built into the model, which can contribute to suboptimal transitions of care between the acute and community settings.35 The expectation is that FPs who admit their own patients do not face this challenge, and as a result their patients should be readmitted less frequently after discharge. Our data and those from previous studies do not support this hypothesis. At the same time, when we studied patients with specific clinical diagnoses, only those hospitalized for pneumonias continued to demonstrate higher readmission odds. This suggests that hospital readmission rate is a complex measure that may be influenced by a multitude of hospital and community factors, and may be different for patients who present with different clinical diagnoses. Further research is required to better understand the relationship between provider type and experience with hospital readmission for patients with various clinical presentations.
Unlike the United States, where hospitalist care has been associated with reductions in LOS,26,36 studies in the Canadian health care setting have shown mixed results.17-21 In our evaluation, hospitalist care is not associated with reductions in total LOS compared to care provided by FPs or IM physicians. This could be due to a number of factors. First, unlike FPs, who know their patients, hospitalists may have a more conservative risk tolerance in discharging patients with whom they are not familiar. Similarly, physicians who have trained in IM may have a lower threshold for discharging patients than hospitalists, whose training background is mainly rooted in family medicine.3 Second, discontinuity of care has been associated with longer LOS for hospitalized patients.37,38 Hospitalists generally work for 7- to 10-day rotations. As a result, a patient may see a number of different hospitalists during the same hospital stay, which could nullify any gains in LOS that may be expected from better familiarity with hospital processes. Third, whereas a FP or an internist may only have a few inpatients under their care at any given time, each hospitalist typically cares for 17 to 22 patients every day. Increasing hospitalist workload has been shown to negatively impact LOS and may result in lower efficiency.39 Finally, many patients in our health system who require more time to recuperate or need complex discharge planning are usually transferred to the care of the hospitalist service from other services, or are preferentially admitted to hospitalists from the emergency department. As a result, hospitalists may look after a disproportionately higher number of long-stay patients. Despite all this, hospitalists in our population perform similarly to FPs, regardless of the clinical diagnoses of hospitalized patients.
Our study has a number of notable limitations. First, we used administrative data to conduct our evaluation and could only control for factors that are available in our data systems. As a result, some potential confounders may not have been taken into consideration. For example, our databases do not contain provider characteristics (eg, age, years of clinical experience) that have been deemed to be relevant by White and Glazier.26 Similarly, we did not have all the necessary information about the characteristics of the various MRP programs (eg, number of physicians involved in group practices, the schedule model of community FP call groups) and were not able to account for the potential impact of these on observed outcomes. Second, although our findings mirror prior studies from other parts of Canada, they may not be applicable to hospitalist programs in other jurisdictions or in health systems that are not regionalized or integrated. Third, our IM provider group is heterogeneous, with a number of different IM subspecialties (cardiologists, gastroenterologists, general internists) grouped under the IM category in our database. As a result, comparisons between the IM provider group and the other 2 provider groups, which are more homogenous, should be interpreted with caution.
Finally, we included only patients admitted to facilities in which a hospitalist service existed during the study period. As a result, a medium-size community hospital without a hospitalist service where patients are cared for exclusively by FPs and IM physicians was not included in the comparisons, and in 4 of the 10 facilities included, the number of FP patients was less than 10% of total hospitalized patients at the site (Appendix A). This may have resulted in an under-representation of FP patients.
Conclusion
Debates about the merits of the hospitalist model in Canada continue, and are in part fueled by a paucity of robust evidence about its impact on care outcomes compared to more traditional ways of providing inpatient care. In our evaluation, care provided by hospitalists is associated with lower mortality and readmission rates, despite similar LOS compared with FPs. Hospitalist care is also associated with lower mortality compared to IM providers. Hospitalists also demonstrated progressive improvement over time, with decreasing LOS and mortality rates and a stable readmission rate. Our results suggest that physicians with a focus on inpatient care can have positive contributions to quality and efficiency of care in Canada.
Corresponding author: Vandad Yousefi MD, CCFP, FHM, Fraser Health Authority, 400, 13450–102 Avenue, Surrey BC V3T 0H1, Canada.
Financial disclosures: None.
1. Kisuule F, Howell E. Hospital medicine beyond the United States. Int J Gen Med. 2018;11:65-71.
2. Yousefi V, Wilton D. Dedesigning hospital care: learning from the experience of hospital medicine in Canada. J Global Health Care Syst. 2011;1(3).
3. Soong C, Fan E, Howell E, et al. Characteristics of hospitalists and hospitalist programs in the United States and Canada. J Clin Outcomes Manag. 2009;16:69-76.
4. Yousefi V. How Canadian hospitalists spend their time - A work-sampling study within a hospital medicine program in Ontario. J Clin Outcomes Manag. 2011;18:159-166.
5. Wilson G. Are inpatients’ needs better served by hospitalists than by their family doctors? No. Can Fam Physician. 2008;54:1101-1103.
6. Samoil D. Are inpatients’ needs better served by hospitalists than by their family doctors: Yes? Can Fam Physician. 2008;54:1100-1101.
7. Nicolson B. Where’s Marcus Welby when you need him? BC Medical J. 2016;58:63-64.
8. Lemire F. Enhanced skills in family medicine: Update. Can Fam Physician. 2018;64:160.
9. Lerner J. Wanting family medicine without primary care. Can Fam Physician. 2018; 64:155.
10. Canadian Society of Hospital Medicine. Core Competencies in Hospital Medicine - Care of the Medical Inpatient. 2015.
11. Redelmeier DA. A Canadian perspective on the American hospitalist movement. Arch Intern Med. 1999;159:1665-1668.
12. Ghali WA, Greenberg PB, Mejia R, et al. International perspectives on general internal medicine and the case for “globalization” of a discipline. J Gen Intern Med. 2006;21:197-200.
13. Day A, MacMillan L. Neglect of the inpatient: The hospitalist movement in Canada responds. Hosp Q. 2001;4:36.
14. Sullivan P. Enter the hospitalist: New type of patient creating a new type of specialist. CMAJ. 2000;162:1345-1346.
15. Chan BTB. The declining comprehensiveness of primary care. CMAJ. 2002;166:429-434.
16. Abenhaim HA, Kahn SR, Raffoul J, Becker MR. Program description: A hospitalist-run, medical short-stay unit in a teaching hospital. CMAJ. 2000;163:1477-1480.
17. McGowan B, Nightingale M. The hospitalist program a new specialty on the horizon in acute care medicine a hospital case study. BC Med J. 2003;45:391-394.
18. Yousefi V, Chong C. Does implementation of a hospitalist program in a Canadian community hospital improve measures of quality of care and utilization? An observational comparative analysis of hospitalists vs. traditional care providers. BMC Health Serv Res. 2013;13:204.
19. White HL. Assessing the prevalence, penetration and performance of hospital physicians in Ontario: Implications for the quality and efficiency of inpatient care. ProQuest Dissertations Publishing; 2016.
20. Gutierrez CA, Norris M, Chail M. Impact of a newly established hospitalist training program on patient LOS and RIW. Poster presented at the 9th Annual Canadian Society of Hospital Medicine Conference, September 23-25, 2011; Banff, Alberta.
21. Seth P, Nicholson K, Habbous S, Menard J. Implementation of a hospitalist medicine model in a full-service community hospital: Examining impact two years post-implementation on health resource use andpatient satisfaction. Poster presented at the 13th Annual Canadian Society of Hospital Medicine Conference. 2015; Niagara Falls, Ontario.
22. Lewis S. A system in name only--access, variation, and reform in Canada’s provinces. N Engl J Med. 2015;372:497-500.
23. Lewis S, Kouri D. Regionalization: Making sense of the Canadian experience. Healthcare Papers. 2004;5:12-31.
24. Fraser Health Authority. About Fraser health. www.fraserhealth.ca/about-us/about-fraser-health#.XFJrl9JKiUk. Updated 2018. Accessed January 30, 2019.
25. Canadian Institute for Health Information. CMG+. https://www.cihi.ca/en/cmg. Accessed January 30, 2019.
26. White HL, Glazier RH. Do hospitalist physicians improve the quality of inpatient care delivery? A systematic review of process, efficiency and outcome measures. BMC Med. 2011;9:58.
27. Canadian Institute for Health Information. Hospital standardized mortality ratio technical notes. 2008. www.cihi.ca/sites/default/files/document/hsmr-tech-notes_en_0.pdf.
28. McAlister FA, Youngson E, Bakal JA, et al. Physician experience and outcomes among patients admitted to general internal medicine teaching wards. CMAJ. 2015;187:1041-1048.
29. Verma AA, Guo Y, Kwan JL, et al. Patient characteristics, resource use and outcomes associated with general internal medicine hospital care: The general medicine inpatient initiative (GEMINI) retrospective cohort study. CMAJ Open. 2017;5:E849.
30. Morche J, Mathes T, Pieper D. Relationship between surgeon volume and outcomes: A systematic review of systematic reviews. Syst Rev. 2016;5:204.
31. Halm EA, Lee C, Chassin MR. Is volume related to outcome in health care? A systematic review and methodologic critique of the literature. Ann Intern Med. 2002;137:511-520.
32. Chen CH, Chen YH, Lin HC, Lin HC. Association between physician caseload and patient outcome for sepsis treatment. Infect Control Hosp Epidemiol. 2009;30:556-562.
33. van Gestel YR, Lemmens VE, Lingsma HF, et al. The hospital standardized mortality ratio fallacy: A narrative review. Med Care. 2012;50:662-667.
34. Scott IA, Brand CA, Phelps GE, et al. Using hospital standardised mortality ratios to assess quality of care—proceed with extreme caution. Med J Aust. 2011; 194:645-648.
35. Wachter RM. Hospitalists in the United States -- mission accomplished or work in progress? N Engl J Med. 2004;350:1935-1936.
36. Peterson MC. A systematic review of outcomes and quality measures in adult patients cared for by hospitalists vs nonhospitalists. Mayo Clin Proc. 2009;84:248-254.
37. Chandra S, Wright SM, Howell EE. The creating incentives and continuity leading to efficiency staffing model: A quality improvement initiative in hospital medicine. Mayo Clin Proc. 2012;87:364-371.
38. Epstein K, Juarez E, Epstein A, et al. The impact of fragmentation of hospitalist care on length of stay. J Hosp Med. 2010;5:335-338.
39. Elliott DJ, Young RS, Brice J, et al. Effect of hospitalist workload on the quality and efficiency of care. JAMA Intern Med. 2014;174:786-793.
From the Fraser Health Authority, Surrey, British Columbia, Canada.
Abstract
- Objective: To study care outcomes associated with a network of hospitalist services compared to traditional providers.
- Design: Retrospective review of administrative data.
- Setting and participants: Patients from a large integrated health care system in British Columbia in western Canada admitted and cared for by 3 provider groups between April 1, 2012, and March 31, 2018: hospitalists, family physicians (FP), and internal medicine (IM) physicians:
- Measurements: Average total length of stay (LOS), 30-day readmission, in-hospital mortality, and hospital standardized mortality ratio (HSMR) were the study outcome measures. Multiple logistic regression or generalized regression were completed to determine the relationship between provider groups and outcomes.
- Results: A total of 248,412 hospitalizations were included. Compared to patients admitted to hospitalists, patients admitted to other providers had higher odds of mortality (odds ratio [OR] for FP, 1.29; 95% confidence interval [CI], 1.21-1.37; OR for IM, 1.24; 95% CI, 1.15-1.33). Compared to hospitalist care, FP care was associated with higher readmission (OR, 1.27; 95% CI, 1.22-1.33), while IM care showed lower odds of readmission (OR, 0.83; 95% CI, 0.79-0.87). Patients admitted to the IM group had significantly lower total LOS (mean, 5.13 days; 95% CI, 5.04-5.21) compared to patients admitted to hospitalists (mean, 7.37 days; CI, 7.26-7.49) and FPs (mean, 7.30 days; 95% CI, 7.19-7.41). In a subgroup analysis of patients presenting with congestive heart failure, chronic obstructive pulmonary disease, and pneumonia, these general tendencies broadly persisted for mortality and LOS comparisons between FPs and hospitalists, but results were mixed for hospital readmissions.
- Conclusion: Care provided by hospitalists was associated with lower mortality and readmission rates compared with care provided by FPs, despite similar LOS. These findings may reflect differences in volume of services delivered by individual physicians, on-site availability to address urgent medical issues, and evolving specialization of clinical and nonclinical care processes in the acute care setting.
Keywords: hospital medicine; length of stay; readmission; mortality.
The hospitalist model of care has undergone rapid growth globally in recent years.1 The first hospitalist programs in Canada began around the same time as those in the United States and share many similarities in design and operations with their counterparts.2-4 However, unlike in the United States, where the hospitalist model has successfully established itself as an emerging specialty, debates about the merits of the model and its value proposition continue among Canadian observers.5-9
Historically, the type of physicians who acted as the most responsible provider (MRP) in Canadian hospitals depended on setting and geography.10 In large urban areas, groups of general internists or specialists have historically looked after general medicine patients as part of university-affiliated teaching services.11,12 Patients admitted to community hospitals have traditionally been cared for by their own primary care providers, typically general practitioners or family physicians (FPs). In the mid-1990s, many primary care providers in urban centers began to withdraw from inpatient care and primarily focused their practices in the outpatient setting.13-15 Hospitalist programs emerged as health care administrators sought to fill the resulting gap in MRP coverage.2,10
To date, attempts to understand the impact of hospitalist programs in Canada have been limited. A number of early studies aimed to describe16 the role of hospitalists in Canada and suggested improvements in length of stay (LOS) and staff satisfaction.17 However, these studies relied on unadjusted before-after comparisons and lacked methodological rigor to draw robust conclusions. More recently, a few studies have evaluated care outcomes associated with hospitalists using administrative databases, which attempted to control for potential confounding factors.18-21
While these studies are beginning to shed some light on the impact of hospital medicine programs in Canada, there are a number of issues that limit their generalizability. For example, the majority of studies to date focus on hospital medicine programs in Canada’s largest province (Ontario), and most describe experiences from single institutions. Since each of the 13 provincial and territorial governments organizes its health care system differently,22 results from 1 province may not be generalizable to other parts of the country. Moreover, hospitalists in Ontario are more diverse in their training backgrounds, with a larger percentage having trained in general internal medicine (IM), as compared to other parts of Canada, where the majority of hospitalists are overwhelmingly trained as FPs.3
We aimed to study care outcomes associated with a network of hospitalist services compared to “traditional” providers (community-based FPs and IM specialists) in a large integrated health care system in the province of British Columbia in western Canada. The hospital medicine services in this network span a range of community and academic hospitals, and collectively constitute 1 of the largest regional programs in the country. This provides a unique opportunity to understand the impact of hospitalists on outcome measures across a range of acute care institutions.
Methods
Setting and Population
Fraser Health Authority is 1 of 5 regional health authorities in British Columbia that emerged in 2001.23,24 It operates a network of hospitalist programs in 10 of its 12 acute care hospitals. In addition to hospitalists, there are a variable number of “traditional” physician providers who continue to act as MRPs. These include community-based FPs who continue to see their own patients in the hospital, either as part of a solo-practice model or a clinic-based call group. There are also a number of general internists and other subspecialists who accept MRP roles for general medicine patients who may present with higher-acuity conditions. As a result, patients requiring hospitalization due to nonsurgical or noncritical care conditions at each Fraser Health hospital may be cared for by a physician belonging to 1 of 3 groups, depending on local circumstances: an FP, a hospitalist, or an internist.
Inclusion and Exclusion Criteria
In order to evaluate comparative outcomes associated with hospitalist care, we included all patients admitted to a physician in each of the 3 provider groups between April 1, 2012, and March 31, 2018. We chose this time period for 2 reasons: first, we wanted to ensure comparability over an extended period of time, given the methodological changes implemented in 2009 by the Canadian Institute for Health Information (CIHI), the federal organization in the country responsible for setting standards for health care measures.25 Second, previous internal reviews had suggested that data quality prior to this year was inconsistent. We only considered hospitalizations where patients were admitted to and discharged by the same service, and excluded 2 acute care facilities and 1 free-standing rehabilitation facility without a hospitalist service during this period. We also excluded patients who resided in a location beyond the geographic catchment area of Fraser Health. Further details about data collection are outlined in the Appendix.
Measures
We used the framework developed by White and Glazier26 to inform the selection of our outcome measures, as well as relevant variables that may impact them. This framework proposes that the design of the inpatient care model (structures and processes of care) directly affects care outcomes. The model also proposes that patient and provider attributes can modulate this relationship, and suggests that a comprehensive evaluation of hospitalist performance needs to take these factors into account. We identified average total LOS, 30-day readmission rate, in-hospital mortality, and hospital standardized mortality ratio (HSMR)27 as primary outcome measures. HSMR is defined as actual over expected mortality and is measured by CIHI through a formula that takes into account patient illness attributes (eg, the most responsible diagnosis, comorbidity levels) and baseline population mortality rates.27 We chose these measures because they are clinically relevant and easy to obtain and have been utilized in previous similar studies in Canada and the United States.18-21,26
Statistical Analysis
Baseline demographic and clinical differences in patient outcomes were examined using independent t-tests or chi-square tests. Furthermore, baseline differences based on provider groups were explored using analysis of variance or chi-square tests. Multiple logistic regression analyses were completed to determine the relationship between provider groups and readmission and mortality, while the relationship between provider groups and hospital LOS was determined with generalized linear regression (using gamma distribution and a log link). Gamma distribution with a log link analysis is appropriate with outcome measures that are positively skewed (eg, hospital LOS). It assumes that data are sampled from an exponential family of distributions, thus mimicking a log-normal distribution, and minimizes estimation bias and standard errors. These analyses were completed while controlling for the effects of age, gender, and other potential confounding factors.
We initially attempted to control for case mix by incorporating case-mix groups (CMGs) in our multivariate analysis. However, we identified 475 CMGs with at least 1 patient in our study population. We then explored the inclusion of major clinical categories (MCCs) that broadly group CMGs into various higher order/organ-system level categories (eg, diseases of the respiratory system); however, we could not aggregate them into sufficiently homogenous groups to be entered into regression models. Instead, we conducted subgroup analyses on patients in our study population who were hospitalized with 1 of the following 3 CMGs: chronic obstructive pulmonary disease (COPD, n = 11,404 patients), congestive heart failure without coronary angiography (CHF, n = 7680), and pneumonia (itself an aggregate of 3 separate CMGs: aspiration pneumonia, bacterial pneumonia, viral/unspecified pneumonia, n = 11,155). We chose these CMGs as they are among the top 8 presentations for all 3 provider groups.
For all outcome measures, we excluded atypical patients (defined by CIHI as those with atypically long stays) and patients who had been transferred between facilities. For the readmission analysis, we also excluded patients who died in the hospital (Appendix A). Data analyses were completed in IBM SPSS, version 21. For all analyses, significance was determined using 2-tailed test and alpha < 0.05.
Ethics
The Fraser Health Department of Research and Evaluation reviewed this project to determine need for formal Ethics Review Board review, and granted an exemption based on institutional guidelines for program evaluations.
Results
A total of 132,178 patients were admitted to and discharged by 1 of the 3 study provider groups during the study period, accounting for a total of 248,412 hospitalizations. After excluding patients cared for in Fraser Health facilities without a hospitalist service and those who resided in a geographic area beyond Fraser Health, a total of 224,214 admissions were included in the final analysis.
Patient Characteristics
The demographic and clinical characteristics of patients by provider group are summarized in Table 1. Patients admitted to IM providers were substantially younger than those admitted to either FPs or hospitalists (61.00 vs 70.86 and 71.22 years, respectively; P < 0.005). However, patients admitted to hospitalists had higher degrees of complexity (as measured by higher comorbidity levels, number of secondary diagnoses, and higher resource intensity weights [RIWs]; P < 000.1 for all comparisons). Overall, the most common CMGs seen by FPs and hospitalists were similar, while IM providers primarily saw patients with cardiac conditions (Table 2).
Trends Over Time
During the study period, the number of patients admitted to the hospitalist services increased by 24%, while admissions to FPs and IM providers declined steadily (Figure). During this time, LOS for hospitalists progressively declined, while LOS for FPs and IM providers increased. Similar trends were observed for measures of mortality, while readmission rates remained constant for FPs, despite a decline observed for other providers.
Mortality
Table 3 summarizes the relationship between provider groups and in-hospital mortality (n = 183,779). Controlling for other variables, patients admitted to FP and IM providers had higher odds of mortality when compared to hospitalists (odds ratio [OR] for FPs, 1.29; 95% confidence interval [CI], 1.21-1.37; OR for IM, 1.24; 95% CI, 1.15-1.33). Older age, higher comorbidity level, higher number of secondary diagnoses, higher use of hospital resources (as measured by RIWs), longer than expected hospital stay (as measured by conservable days), and male gender were also associated with higher mortality. Similarly, patients receiving palliative care and those who spent at least 1 day in a special care unit (critical care, observation, and monitored care units) also had higher odds of mortality. On the other hand, admission to nonteaching medium facilities and longer hospital stay were associated with lower mortality. Compared to the first year of this analysis, lower mortality rates were observed in subsequent fiscal years. Finally, there appear to be geographic variations in mortality within Fraser Health.
Our analysis of patients with COPD, CHF, and pneumonia showed mixed results (Table 4). Patients admitted to the FP provider group with CHF and pneumonia had higher mortality compared to hospitalists (OR for CHF, 1.77; 95% CI, 1.38-2.27; OR for pneumonia, 1.53; 95% CI, 1.25-1.88), with a similar but nonstatistically significant trend observed for patients with COPD (OR, 1.29; 95% CI, 0.99-1.70). On the other hand, the higher observed mortality associated with the IM provider group in the overall study population only persisted for patients with COPD (OR, 2.71; 95% CI, 1.94-3.80), with no statistically significant differences for patients with CHF (OR, 1.18; 95% CI, 0.84-1.65) and pneumonia (OR, 0.93; 95% CI, 0.69-1.25).
We also studied adjusted mortality as measured by HSMRs. Currently, our Health Information Management system calculates an HSMR value for each patient admitted to our acute care facilities using the methodology developed by CIHI. Prior internal audits demonstrated that our internal calculations closely approximate those reported nationally. Our analysis suggests that over time, HSMR rates for the 3 provider groups have diverged, with patients admitted to IM providers having a higher mortality rate than what would be expected based on the presenting clinical conditions and comorbidity levels (Figure, part D).
Readmission
The results of our multiple logistic regression for readmission are summarized in Table 5 (n = 166,042). The impact of provider group on 30-day readmission is mixed, with higher odds associated with FPs compared to hospitalists (OR, 1.27; 95% CI, 1.22-1.34) and lower odds associated with IM physicians (OR, 0.83; 95% CI, 0.79-0.87). Gender and RIW did not show any significant associations, but increasing age, higher number of secondary diagnoses, higher comorbidity levels, and longer than expected LOS (as measure by conservable days) were associated with higher odds of readmission. Conversely, longer hospitalization, admission to a large community hospital, palliative status, admission to a special care unit, geography, and fiscal year were associated with lower odds of readmission.
The above differences between provider groups were no longer consistently present when we analyzed patients presenting with COPD, CHF, and pneumonias (Table 6). Only patients admitted to the FP provider group with pneumonia had higher odds of readmission compared to hospitalists (OR, 1.27; 95% CI, 1.05-1.54). Conversely, only patients admitted to the IM provider group with CHF showed lower readmission (OR, 0.75; 95% CI, 0.62-0.92).
Total LOS
Results using generalized linear regressions for total LOS are presented in Table 7 (n = 183,779). Patients admitted to the IM provider group had significantly lower total LOS (mean, 5.13 days; 95% CI, 5.04-5.21) compared to the hospitalist (mean, 7.37 days; 95% CI, 7.26-7.49) and FP (mean, 7.30 days; 95% CI, 7.19-7.41) groups, with no significant differences between the latter 2 groups. Older patients, females, patients with higher comorbidity levels or number of secondary diagnoses, higher RIW, palliative patients, and discharge to a facility other than the patient’s home were associated with a significantly longer LOS. On the other hand, admission to nonteaching hospitals and admission to a special care unit was associated with lower LOS.
When we compared total LOS for patients admitted with COPD, CHF, and pneumonias, the same differences observed for the broader comparisons persisted: IM patients consistently showed shorter LOS compared to hospitalist patients, while LOS associated with FP patients was similar (Table 8).
Discussion
To our knowledge, our evaluation is the largest study to date designed to understand outcomes associated with hospitalist care in Canada. Our analyses suggest that patients admitted to our large network of hospitalist services present with clinical conditions that are very similar to those of general medicine patients in other Canadian provinces.28,29 They also show that patients cared for by hospitalists experience lower mortality rates compared to those cared for by FPs. Our findings are similar to previous studies, which have suggested a 12% to 75% reduction in odds of mortality associated with hospitalist care.18,19 These differences persisted even when we focused on patients presenting with specific clinical conditions (CHF, COPD, and pneumonias).
White and colleagues have previously demonstrated that generalist physicians who had higher volumes of inpatient care activity also had lower mortality rates compared to those who cared for hospitalized patients less frequently.19 An association between higher physician caseloads and better outcomes has been established for many surgical and medical conditions.30-32 Given that 85% of hospitalists in our program have post-graduate medical training in family medicine (internal department surveys, data not shown), it is less likely that training background can explain differences in outcomes. Instead, differences in patient volumes and the dedicated focus of hospitalists on acute care are likely more important contributors to lower mortality. In our program, a full-time hospitalist spends an average of 2000 hours annually providing services in the hospital setting. The continuous on-site presence of hospitalists enhances their clinical experience with regards to the management of common medical conditions, and increases their exposure to less common presentations of illnesses. The ability to respond to deteriorating patients in a timely manner may be another factor in explaining the differences in mortality rates between dedicated hospital-based generalist providers and similarly trained physicians with a primarily community-based focus.
In our study, hospitalist care was also broadly associated with lower mortality compared to the IM providers, although these differences were not consistently present when patients with specific diagnoses were compared. This may be partly explained by the relationship between caseload and outcomes, but other factors may also be important. For example, patients admitted by IM providers spend significantly more time in specialized units. They also predominantly present with cardiac conditions, and as such may have higher acuity levels and require more invasive interventions. While this may explain the higher observed mortality, a within-group comparison still suggests higher than expected mortality for IM patients. The HSMR methodology measures actual mortality rates compared to what would be expected based on clinical presentation and baseline population characteristics. Calculating HSMR is highly dependent on proper documentation and chart abstraction,33,34 and it is possible that some of the differences observed are due to incomplete physician documentation. However, a more in-depth analysis of care processes will be required to clarify the observed trends.
Compared to hospitalists, patients cared for by FPs also had higher odds of readmission within 30 days, which is consistent with prior studies.18,19 One of the criticisms of the hospitalist model has been the inherent discontinuity of care that is built into the model, which can contribute to suboptimal transitions of care between the acute and community settings.35 The expectation is that FPs who admit their own patients do not face this challenge, and as a result their patients should be readmitted less frequently after discharge. Our data and those from previous studies do not support this hypothesis. At the same time, when we studied patients with specific clinical diagnoses, only those hospitalized for pneumonias continued to demonstrate higher readmission odds. This suggests that hospital readmission rate is a complex measure that may be influenced by a multitude of hospital and community factors, and may be different for patients who present with different clinical diagnoses. Further research is required to better understand the relationship between provider type and experience with hospital readmission for patients with various clinical presentations.
Unlike the United States, where hospitalist care has been associated with reductions in LOS,26,36 studies in the Canadian health care setting have shown mixed results.17-21 In our evaluation, hospitalist care is not associated with reductions in total LOS compared to care provided by FPs or IM physicians. This could be due to a number of factors. First, unlike FPs, who know their patients, hospitalists may have a more conservative risk tolerance in discharging patients with whom they are not familiar. Similarly, physicians who have trained in IM may have a lower threshold for discharging patients than hospitalists, whose training background is mainly rooted in family medicine.3 Second, discontinuity of care has been associated with longer LOS for hospitalized patients.37,38 Hospitalists generally work for 7- to 10-day rotations. As a result, a patient may see a number of different hospitalists during the same hospital stay, which could nullify any gains in LOS that may be expected from better familiarity with hospital processes. Third, whereas a FP or an internist may only have a few inpatients under their care at any given time, each hospitalist typically cares for 17 to 22 patients every day. Increasing hospitalist workload has been shown to negatively impact LOS and may result in lower efficiency.39 Finally, many patients in our health system who require more time to recuperate or need complex discharge planning are usually transferred to the care of the hospitalist service from other services, or are preferentially admitted to hospitalists from the emergency department. As a result, hospitalists may look after a disproportionately higher number of long-stay patients. Despite all this, hospitalists in our population perform similarly to FPs, regardless of the clinical diagnoses of hospitalized patients.
Our study has a number of notable limitations. First, we used administrative data to conduct our evaluation and could only control for factors that are available in our data systems. As a result, some potential confounders may not have been taken into consideration. For example, our databases do not contain provider characteristics (eg, age, years of clinical experience) that have been deemed to be relevant by White and Glazier.26 Similarly, we did not have all the necessary information about the characteristics of the various MRP programs (eg, number of physicians involved in group practices, the schedule model of community FP call groups) and were not able to account for the potential impact of these on observed outcomes. Second, although our findings mirror prior studies from other parts of Canada, they may not be applicable to hospitalist programs in other jurisdictions or in health systems that are not regionalized or integrated. Third, our IM provider group is heterogeneous, with a number of different IM subspecialties (cardiologists, gastroenterologists, general internists) grouped under the IM category in our database. As a result, comparisons between the IM provider group and the other 2 provider groups, which are more homogenous, should be interpreted with caution.
Finally, we included only patients admitted to facilities in which a hospitalist service existed during the study period. As a result, a medium-size community hospital without a hospitalist service where patients are cared for exclusively by FPs and IM physicians was not included in the comparisons, and in 4 of the 10 facilities included, the number of FP patients was less than 10% of total hospitalized patients at the site (Appendix A). This may have resulted in an under-representation of FP patients.
Conclusion
Debates about the merits of the hospitalist model in Canada continue, and are in part fueled by a paucity of robust evidence about its impact on care outcomes compared to more traditional ways of providing inpatient care. In our evaluation, care provided by hospitalists is associated with lower mortality and readmission rates, despite similar LOS compared with FPs. Hospitalist care is also associated with lower mortality compared to IM providers. Hospitalists also demonstrated progressive improvement over time, with decreasing LOS and mortality rates and a stable readmission rate. Our results suggest that physicians with a focus on inpatient care can have positive contributions to quality and efficiency of care in Canada.
Corresponding author: Vandad Yousefi MD, CCFP, FHM, Fraser Health Authority, 400, 13450–102 Avenue, Surrey BC V3T 0H1, Canada.
Financial disclosures: None.
From the Fraser Health Authority, Surrey, British Columbia, Canada.
Abstract
- Objective: To study care outcomes associated with a network of hospitalist services compared to traditional providers.
- Design: Retrospective review of administrative data.
- Setting and participants: Patients from a large integrated health care system in British Columbia in western Canada admitted and cared for by 3 provider groups between April 1, 2012, and March 31, 2018: hospitalists, family physicians (FP), and internal medicine (IM) physicians:
- Measurements: Average total length of stay (LOS), 30-day readmission, in-hospital mortality, and hospital standardized mortality ratio (HSMR) were the study outcome measures. Multiple logistic regression or generalized regression were completed to determine the relationship between provider groups and outcomes.
- Results: A total of 248,412 hospitalizations were included. Compared to patients admitted to hospitalists, patients admitted to other providers had higher odds of mortality (odds ratio [OR] for FP, 1.29; 95% confidence interval [CI], 1.21-1.37; OR for IM, 1.24; 95% CI, 1.15-1.33). Compared to hospitalist care, FP care was associated with higher readmission (OR, 1.27; 95% CI, 1.22-1.33), while IM care showed lower odds of readmission (OR, 0.83; 95% CI, 0.79-0.87). Patients admitted to the IM group had significantly lower total LOS (mean, 5.13 days; 95% CI, 5.04-5.21) compared to patients admitted to hospitalists (mean, 7.37 days; CI, 7.26-7.49) and FPs (mean, 7.30 days; 95% CI, 7.19-7.41). In a subgroup analysis of patients presenting with congestive heart failure, chronic obstructive pulmonary disease, and pneumonia, these general tendencies broadly persisted for mortality and LOS comparisons between FPs and hospitalists, but results were mixed for hospital readmissions.
- Conclusion: Care provided by hospitalists was associated with lower mortality and readmission rates compared with care provided by FPs, despite similar LOS. These findings may reflect differences in volume of services delivered by individual physicians, on-site availability to address urgent medical issues, and evolving specialization of clinical and nonclinical care processes in the acute care setting.
Keywords: hospital medicine; length of stay; readmission; mortality.
The hospitalist model of care has undergone rapid growth globally in recent years.1 The first hospitalist programs in Canada began around the same time as those in the United States and share many similarities in design and operations with their counterparts.2-4 However, unlike in the United States, where the hospitalist model has successfully established itself as an emerging specialty, debates about the merits of the model and its value proposition continue among Canadian observers.5-9
Historically, the type of physicians who acted as the most responsible provider (MRP) in Canadian hospitals depended on setting and geography.10 In large urban areas, groups of general internists or specialists have historically looked after general medicine patients as part of university-affiliated teaching services.11,12 Patients admitted to community hospitals have traditionally been cared for by their own primary care providers, typically general practitioners or family physicians (FPs). In the mid-1990s, many primary care providers in urban centers began to withdraw from inpatient care and primarily focused their practices in the outpatient setting.13-15 Hospitalist programs emerged as health care administrators sought to fill the resulting gap in MRP coverage.2,10
To date, attempts to understand the impact of hospitalist programs in Canada have been limited. A number of early studies aimed to describe16 the role of hospitalists in Canada and suggested improvements in length of stay (LOS) and staff satisfaction.17 However, these studies relied on unadjusted before-after comparisons and lacked methodological rigor to draw robust conclusions. More recently, a few studies have evaluated care outcomes associated with hospitalists using administrative databases, which attempted to control for potential confounding factors.18-21
While these studies are beginning to shed some light on the impact of hospital medicine programs in Canada, there are a number of issues that limit their generalizability. For example, the majority of studies to date focus on hospital medicine programs in Canada’s largest province (Ontario), and most describe experiences from single institutions. Since each of the 13 provincial and territorial governments organizes its health care system differently,22 results from 1 province may not be generalizable to other parts of the country. Moreover, hospitalists in Ontario are more diverse in their training backgrounds, with a larger percentage having trained in general internal medicine (IM), as compared to other parts of Canada, where the majority of hospitalists are overwhelmingly trained as FPs.3
We aimed to study care outcomes associated with a network of hospitalist services compared to “traditional” providers (community-based FPs and IM specialists) in a large integrated health care system in the province of British Columbia in western Canada. The hospital medicine services in this network span a range of community and academic hospitals, and collectively constitute 1 of the largest regional programs in the country. This provides a unique opportunity to understand the impact of hospitalists on outcome measures across a range of acute care institutions.
Methods
Setting and Population
Fraser Health Authority is 1 of 5 regional health authorities in British Columbia that emerged in 2001.23,24 It operates a network of hospitalist programs in 10 of its 12 acute care hospitals. In addition to hospitalists, there are a variable number of “traditional” physician providers who continue to act as MRPs. These include community-based FPs who continue to see their own patients in the hospital, either as part of a solo-practice model or a clinic-based call group. There are also a number of general internists and other subspecialists who accept MRP roles for general medicine patients who may present with higher-acuity conditions. As a result, patients requiring hospitalization due to nonsurgical or noncritical care conditions at each Fraser Health hospital may be cared for by a physician belonging to 1 of 3 groups, depending on local circumstances: an FP, a hospitalist, or an internist.
Inclusion and Exclusion Criteria
In order to evaluate comparative outcomes associated with hospitalist care, we included all patients admitted to a physician in each of the 3 provider groups between April 1, 2012, and March 31, 2018. We chose this time period for 2 reasons: first, we wanted to ensure comparability over an extended period of time, given the methodological changes implemented in 2009 by the Canadian Institute for Health Information (CIHI), the federal organization in the country responsible for setting standards for health care measures.25 Second, previous internal reviews had suggested that data quality prior to this year was inconsistent. We only considered hospitalizations where patients were admitted to and discharged by the same service, and excluded 2 acute care facilities and 1 free-standing rehabilitation facility without a hospitalist service during this period. We also excluded patients who resided in a location beyond the geographic catchment area of Fraser Health. Further details about data collection are outlined in the Appendix.
Measures
We used the framework developed by White and Glazier26 to inform the selection of our outcome measures, as well as relevant variables that may impact them. This framework proposes that the design of the inpatient care model (structures and processes of care) directly affects care outcomes. The model also proposes that patient and provider attributes can modulate this relationship, and suggests that a comprehensive evaluation of hospitalist performance needs to take these factors into account. We identified average total LOS, 30-day readmission rate, in-hospital mortality, and hospital standardized mortality ratio (HSMR)27 as primary outcome measures. HSMR is defined as actual over expected mortality and is measured by CIHI through a formula that takes into account patient illness attributes (eg, the most responsible diagnosis, comorbidity levels) and baseline population mortality rates.27 We chose these measures because they are clinically relevant and easy to obtain and have been utilized in previous similar studies in Canada and the United States.18-21,26
Statistical Analysis
Baseline demographic and clinical differences in patient outcomes were examined using independent t-tests or chi-square tests. Furthermore, baseline differences based on provider groups were explored using analysis of variance or chi-square tests. Multiple logistic regression analyses were completed to determine the relationship between provider groups and readmission and mortality, while the relationship between provider groups and hospital LOS was determined with generalized linear regression (using gamma distribution and a log link). Gamma distribution with a log link analysis is appropriate with outcome measures that are positively skewed (eg, hospital LOS). It assumes that data are sampled from an exponential family of distributions, thus mimicking a log-normal distribution, and minimizes estimation bias and standard errors. These analyses were completed while controlling for the effects of age, gender, and other potential confounding factors.
We initially attempted to control for case mix by incorporating case-mix groups (CMGs) in our multivariate analysis. However, we identified 475 CMGs with at least 1 patient in our study population. We then explored the inclusion of major clinical categories (MCCs) that broadly group CMGs into various higher order/organ-system level categories (eg, diseases of the respiratory system); however, we could not aggregate them into sufficiently homogenous groups to be entered into regression models. Instead, we conducted subgroup analyses on patients in our study population who were hospitalized with 1 of the following 3 CMGs: chronic obstructive pulmonary disease (COPD, n = 11,404 patients), congestive heart failure without coronary angiography (CHF, n = 7680), and pneumonia (itself an aggregate of 3 separate CMGs: aspiration pneumonia, bacterial pneumonia, viral/unspecified pneumonia, n = 11,155). We chose these CMGs as they are among the top 8 presentations for all 3 provider groups.
For all outcome measures, we excluded atypical patients (defined by CIHI as those with atypically long stays) and patients who had been transferred between facilities. For the readmission analysis, we also excluded patients who died in the hospital (Appendix A). Data analyses were completed in IBM SPSS, version 21. For all analyses, significance was determined using 2-tailed test and alpha < 0.05.
Ethics
The Fraser Health Department of Research and Evaluation reviewed this project to determine need for formal Ethics Review Board review, and granted an exemption based on institutional guidelines for program evaluations.
Results
A total of 132,178 patients were admitted to and discharged by 1 of the 3 study provider groups during the study period, accounting for a total of 248,412 hospitalizations. After excluding patients cared for in Fraser Health facilities without a hospitalist service and those who resided in a geographic area beyond Fraser Health, a total of 224,214 admissions were included in the final analysis.
Patient Characteristics
The demographic and clinical characteristics of patients by provider group are summarized in Table 1. Patients admitted to IM providers were substantially younger than those admitted to either FPs or hospitalists (61.00 vs 70.86 and 71.22 years, respectively; P < 0.005). However, patients admitted to hospitalists had higher degrees of complexity (as measured by higher comorbidity levels, number of secondary diagnoses, and higher resource intensity weights [RIWs]; P < 000.1 for all comparisons). Overall, the most common CMGs seen by FPs and hospitalists were similar, while IM providers primarily saw patients with cardiac conditions (Table 2).
Trends Over Time
During the study period, the number of patients admitted to the hospitalist services increased by 24%, while admissions to FPs and IM providers declined steadily (Figure). During this time, LOS for hospitalists progressively declined, while LOS for FPs and IM providers increased. Similar trends were observed for measures of mortality, while readmission rates remained constant for FPs, despite a decline observed for other providers.
Mortality
Table 3 summarizes the relationship between provider groups and in-hospital mortality (n = 183,779). Controlling for other variables, patients admitted to FP and IM providers had higher odds of mortality when compared to hospitalists (odds ratio [OR] for FPs, 1.29; 95% confidence interval [CI], 1.21-1.37; OR for IM, 1.24; 95% CI, 1.15-1.33). Older age, higher comorbidity level, higher number of secondary diagnoses, higher use of hospital resources (as measured by RIWs), longer than expected hospital stay (as measured by conservable days), and male gender were also associated with higher mortality. Similarly, patients receiving palliative care and those who spent at least 1 day in a special care unit (critical care, observation, and monitored care units) also had higher odds of mortality. On the other hand, admission to nonteaching medium facilities and longer hospital stay were associated with lower mortality. Compared to the first year of this analysis, lower mortality rates were observed in subsequent fiscal years. Finally, there appear to be geographic variations in mortality within Fraser Health.
Our analysis of patients with COPD, CHF, and pneumonia showed mixed results (Table 4). Patients admitted to the FP provider group with CHF and pneumonia had higher mortality compared to hospitalists (OR for CHF, 1.77; 95% CI, 1.38-2.27; OR for pneumonia, 1.53; 95% CI, 1.25-1.88), with a similar but nonstatistically significant trend observed for patients with COPD (OR, 1.29; 95% CI, 0.99-1.70). On the other hand, the higher observed mortality associated with the IM provider group in the overall study population only persisted for patients with COPD (OR, 2.71; 95% CI, 1.94-3.80), with no statistically significant differences for patients with CHF (OR, 1.18; 95% CI, 0.84-1.65) and pneumonia (OR, 0.93; 95% CI, 0.69-1.25).
We also studied adjusted mortality as measured by HSMRs. Currently, our Health Information Management system calculates an HSMR value for each patient admitted to our acute care facilities using the methodology developed by CIHI. Prior internal audits demonstrated that our internal calculations closely approximate those reported nationally. Our analysis suggests that over time, HSMR rates for the 3 provider groups have diverged, with patients admitted to IM providers having a higher mortality rate than what would be expected based on the presenting clinical conditions and comorbidity levels (Figure, part D).
Readmission
The results of our multiple logistic regression for readmission are summarized in Table 5 (n = 166,042). The impact of provider group on 30-day readmission is mixed, with higher odds associated with FPs compared to hospitalists (OR, 1.27; 95% CI, 1.22-1.34) and lower odds associated with IM physicians (OR, 0.83; 95% CI, 0.79-0.87). Gender and RIW did not show any significant associations, but increasing age, higher number of secondary diagnoses, higher comorbidity levels, and longer than expected LOS (as measure by conservable days) were associated with higher odds of readmission. Conversely, longer hospitalization, admission to a large community hospital, palliative status, admission to a special care unit, geography, and fiscal year were associated with lower odds of readmission.
The above differences between provider groups were no longer consistently present when we analyzed patients presenting with COPD, CHF, and pneumonias (Table 6). Only patients admitted to the FP provider group with pneumonia had higher odds of readmission compared to hospitalists (OR, 1.27; 95% CI, 1.05-1.54). Conversely, only patients admitted to the IM provider group with CHF showed lower readmission (OR, 0.75; 95% CI, 0.62-0.92).
Total LOS
Results using generalized linear regressions for total LOS are presented in Table 7 (n = 183,779). Patients admitted to the IM provider group had significantly lower total LOS (mean, 5.13 days; 95% CI, 5.04-5.21) compared to the hospitalist (mean, 7.37 days; 95% CI, 7.26-7.49) and FP (mean, 7.30 days; 95% CI, 7.19-7.41) groups, with no significant differences between the latter 2 groups. Older patients, females, patients with higher comorbidity levels or number of secondary diagnoses, higher RIW, palliative patients, and discharge to a facility other than the patient’s home were associated with a significantly longer LOS. On the other hand, admission to nonteaching hospitals and admission to a special care unit was associated with lower LOS.
When we compared total LOS for patients admitted with COPD, CHF, and pneumonias, the same differences observed for the broader comparisons persisted: IM patients consistently showed shorter LOS compared to hospitalist patients, while LOS associated with FP patients was similar (Table 8).
Discussion
To our knowledge, our evaluation is the largest study to date designed to understand outcomes associated with hospitalist care in Canada. Our analyses suggest that patients admitted to our large network of hospitalist services present with clinical conditions that are very similar to those of general medicine patients in other Canadian provinces.28,29 They also show that patients cared for by hospitalists experience lower mortality rates compared to those cared for by FPs. Our findings are similar to previous studies, which have suggested a 12% to 75% reduction in odds of mortality associated with hospitalist care.18,19 These differences persisted even when we focused on patients presenting with specific clinical conditions (CHF, COPD, and pneumonias).
White and colleagues have previously demonstrated that generalist physicians who had higher volumes of inpatient care activity also had lower mortality rates compared to those who cared for hospitalized patients less frequently.19 An association between higher physician caseloads and better outcomes has been established for many surgical and medical conditions.30-32 Given that 85% of hospitalists in our program have post-graduate medical training in family medicine (internal department surveys, data not shown), it is less likely that training background can explain differences in outcomes. Instead, differences in patient volumes and the dedicated focus of hospitalists on acute care are likely more important contributors to lower mortality. In our program, a full-time hospitalist spends an average of 2000 hours annually providing services in the hospital setting. The continuous on-site presence of hospitalists enhances their clinical experience with regards to the management of common medical conditions, and increases their exposure to less common presentations of illnesses. The ability to respond to deteriorating patients in a timely manner may be another factor in explaining the differences in mortality rates between dedicated hospital-based generalist providers and similarly trained physicians with a primarily community-based focus.
In our study, hospitalist care was also broadly associated with lower mortality compared to the IM providers, although these differences were not consistently present when patients with specific diagnoses were compared. This may be partly explained by the relationship between caseload and outcomes, but other factors may also be important. For example, patients admitted by IM providers spend significantly more time in specialized units. They also predominantly present with cardiac conditions, and as such may have higher acuity levels and require more invasive interventions. While this may explain the higher observed mortality, a within-group comparison still suggests higher than expected mortality for IM patients. The HSMR methodology measures actual mortality rates compared to what would be expected based on clinical presentation and baseline population characteristics. Calculating HSMR is highly dependent on proper documentation and chart abstraction,33,34 and it is possible that some of the differences observed are due to incomplete physician documentation. However, a more in-depth analysis of care processes will be required to clarify the observed trends.
Compared to hospitalists, patients cared for by FPs also had higher odds of readmission within 30 days, which is consistent with prior studies.18,19 One of the criticisms of the hospitalist model has been the inherent discontinuity of care that is built into the model, which can contribute to suboptimal transitions of care between the acute and community settings.35 The expectation is that FPs who admit their own patients do not face this challenge, and as a result their patients should be readmitted less frequently after discharge. Our data and those from previous studies do not support this hypothesis. At the same time, when we studied patients with specific clinical diagnoses, only those hospitalized for pneumonias continued to demonstrate higher readmission odds. This suggests that hospital readmission rate is a complex measure that may be influenced by a multitude of hospital and community factors, and may be different for patients who present with different clinical diagnoses. Further research is required to better understand the relationship between provider type and experience with hospital readmission for patients with various clinical presentations.
Unlike the United States, where hospitalist care has been associated with reductions in LOS,26,36 studies in the Canadian health care setting have shown mixed results.17-21 In our evaluation, hospitalist care is not associated with reductions in total LOS compared to care provided by FPs or IM physicians. This could be due to a number of factors. First, unlike FPs, who know their patients, hospitalists may have a more conservative risk tolerance in discharging patients with whom they are not familiar. Similarly, physicians who have trained in IM may have a lower threshold for discharging patients than hospitalists, whose training background is mainly rooted in family medicine.3 Second, discontinuity of care has been associated with longer LOS for hospitalized patients.37,38 Hospitalists generally work for 7- to 10-day rotations. As a result, a patient may see a number of different hospitalists during the same hospital stay, which could nullify any gains in LOS that may be expected from better familiarity with hospital processes. Third, whereas a FP or an internist may only have a few inpatients under their care at any given time, each hospitalist typically cares for 17 to 22 patients every day. Increasing hospitalist workload has been shown to negatively impact LOS and may result in lower efficiency.39 Finally, many patients in our health system who require more time to recuperate or need complex discharge planning are usually transferred to the care of the hospitalist service from other services, or are preferentially admitted to hospitalists from the emergency department. As a result, hospitalists may look after a disproportionately higher number of long-stay patients. Despite all this, hospitalists in our population perform similarly to FPs, regardless of the clinical diagnoses of hospitalized patients.
Our study has a number of notable limitations. First, we used administrative data to conduct our evaluation and could only control for factors that are available in our data systems. As a result, some potential confounders may not have been taken into consideration. For example, our databases do not contain provider characteristics (eg, age, years of clinical experience) that have been deemed to be relevant by White and Glazier.26 Similarly, we did not have all the necessary information about the characteristics of the various MRP programs (eg, number of physicians involved in group practices, the schedule model of community FP call groups) and were not able to account for the potential impact of these on observed outcomes. Second, although our findings mirror prior studies from other parts of Canada, they may not be applicable to hospitalist programs in other jurisdictions or in health systems that are not regionalized or integrated. Third, our IM provider group is heterogeneous, with a number of different IM subspecialties (cardiologists, gastroenterologists, general internists) grouped under the IM category in our database. As a result, comparisons between the IM provider group and the other 2 provider groups, which are more homogenous, should be interpreted with caution.
Finally, we included only patients admitted to facilities in which a hospitalist service existed during the study period. As a result, a medium-size community hospital without a hospitalist service where patients are cared for exclusively by FPs and IM physicians was not included in the comparisons, and in 4 of the 10 facilities included, the number of FP patients was less than 10% of total hospitalized patients at the site (Appendix A). This may have resulted in an under-representation of FP patients.
Conclusion
Debates about the merits of the hospitalist model in Canada continue, and are in part fueled by a paucity of robust evidence about its impact on care outcomes compared to more traditional ways of providing inpatient care. In our evaluation, care provided by hospitalists is associated with lower mortality and readmission rates, despite similar LOS compared with FPs. Hospitalist care is also associated with lower mortality compared to IM providers. Hospitalists also demonstrated progressive improvement over time, with decreasing LOS and mortality rates and a stable readmission rate. Our results suggest that physicians with a focus on inpatient care can have positive contributions to quality and efficiency of care in Canada.
Corresponding author: Vandad Yousefi MD, CCFP, FHM, Fraser Health Authority, 400, 13450–102 Avenue, Surrey BC V3T 0H1, Canada.
Financial disclosures: None.
1. Kisuule F, Howell E. Hospital medicine beyond the United States. Int J Gen Med. 2018;11:65-71.
2. Yousefi V, Wilton D. Dedesigning hospital care: learning from the experience of hospital medicine in Canada. J Global Health Care Syst. 2011;1(3).
3. Soong C, Fan E, Howell E, et al. Characteristics of hospitalists and hospitalist programs in the United States and Canada. J Clin Outcomes Manag. 2009;16:69-76.
4. Yousefi V. How Canadian hospitalists spend their time - A work-sampling study within a hospital medicine program in Ontario. J Clin Outcomes Manag. 2011;18:159-166.
5. Wilson G. Are inpatients’ needs better served by hospitalists than by their family doctors? No. Can Fam Physician. 2008;54:1101-1103.
6. Samoil D. Are inpatients’ needs better served by hospitalists than by their family doctors: Yes? Can Fam Physician. 2008;54:1100-1101.
7. Nicolson B. Where’s Marcus Welby when you need him? BC Medical J. 2016;58:63-64.
8. Lemire F. Enhanced skills in family medicine: Update. Can Fam Physician. 2018;64:160.
9. Lerner J. Wanting family medicine without primary care. Can Fam Physician. 2018; 64:155.
10. Canadian Society of Hospital Medicine. Core Competencies in Hospital Medicine - Care of the Medical Inpatient. 2015.
11. Redelmeier DA. A Canadian perspective on the American hospitalist movement. Arch Intern Med. 1999;159:1665-1668.
12. Ghali WA, Greenberg PB, Mejia R, et al. International perspectives on general internal medicine and the case for “globalization” of a discipline. J Gen Intern Med. 2006;21:197-200.
13. Day A, MacMillan L. Neglect of the inpatient: The hospitalist movement in Canada responds. Hosp Q. 2001;4:36.
14. Sullivan P. Enter the hospitalist: New type of patient creating a new type of specialist. CMAJ. 2000;162:1345-1346.
15. Chan BTB. The declining comprehensiveness of primary care. CMAJ. 2002;166:429-434.
16. Abenhaim HA, Kahn SR, Raffoul J, Becker MR. Program description: A hospitalist-run, medical short-stay unit in a teaching hospital. CMAJ. 2000;163:1477-1480.
17. McGowan B, Nightingale M. The hospitalist program a new specialty on the horizon in acute care medicine a hospital case study. BC Med J. 2003;45:391-394.
18. Yousefi V, Chong C. Does implementation of a hospitalist program in a Canadian community hospital improve measures of quality of care and utilization? An observational comparative analysis of hospitalists vs. traditional care providers. BMC Health Serv Res. 2013;13:204.
19. White HL. Assessing the prevalence, penetration and performance of hospital physicians in Ontario: Implications for the quality and efficiency of inpatient care. ProQuest Dissertations Publishing; 2016.
20. Gutierrez CA, Norris M, Chail M. Impact of a newly established hospitalist training program on patient LOS and RIW. Poster presented at the 9th Annual Canadian Society of Hospital Medicine Conference, September 23-25, 2011; Banff, Alberta.
21. Seth P, Nicholson K, Habbous S, Menard J. Implementation of a hospitalist medicine model in a full-service community hospital: Examining impact two years post-implementation on health resource use andpatient satisfaction. Poster presented at the 13th Annual Canadian Society of Hospital Medicine Conference. 2015; Niagara Falls, Ontario.
22. Lewis S. A system in name only--access, variation, and reform in Canada’s provinces. N Engl J Med. 2015;372:497-500.
23. Lewis S, Kouri D. Regionalization: Making sense of the Canadian experience. Healthcare Papers. 2004;5:12-31.
24. Fraser Health Authority. About Fraser health. www.fraserhealth.ca/about-us/about-fraser-health#.XFJrl9JKiUk. Updated 2018. Accessed January 30, 2019.
25. Canadian Institute for Health Information. CMG+. https://www.cihi.ca/en/cmg. Accessed January 30, 2019.
26. White HL, Glazier RH. Do hospitalist physicians improve the quality of inpatient care delivery? A systematic review of process, efficiency and outcome measures. BMC Med. 2011;9:58.
27. Canadian Institute for Health Information. Hospital standardized mortality ratio technical notes. 2008. www.cihi.ca/sites/default/files/document/hsmr-tech-notes_en_0.pdf.
28. McAlister FA, Youngson E, Bakal JA, et al. Physician experience and outcomes among patients admitted to general internal medicine teaching wards. CMAJ. 2015;187:1041-1048.
29. Verma AA, Guo Y, Kwan JL, et al. Patient characteristics, resource use and outcomes associated with general internal medicine hospital care: The general medicine inpatient initiative (GEMINI) retrospective cohort study. CMAJ Open. 2017;5:E849.
30. Morche J, Mathes T, Pieper D. Relationship between surgeon volume and outcomes: A systematic review of systematic reviews. Syst Rev. 2016;5:204.
31. Halm EA, Lee C, Chassin MR. Is volume related to outcome in health care? A systematic review and methodologic critique of the literature. Ann Intern Med. 2002;137:511-520.
32. Chen CH, Chen YH, Lin HC, Lin HC. Association between physician caseload and patient outcome for sepsis treatment. Infect Control Hosp Epidemiol. 2009;30:556-562.
33. van Gestel YR, Lemmens VE, Lingsma HF, et al. The hospital standardized mortality ratio fallacy: A narrative review. Med Care. 2012;50:662-667.
34. Scott IA, Brand CA, Phelps GE, et al. Using hospital standardised mortality ratios to assess quality of care—proceed with extreme caution. Med J Aust. 2011; 194:645-648.
35. Wachter RM. Hospitalists in the United States -- mission accomplished or work in progress? N Engl J Med. 2004;350:1935-1936.
36. Peterson MC. A systematic review of outcomes and quality measures in adult patients cared for by hospitalists vs nonhospitalists. Mayo Clin Proc. 2009;84:248-254.
37. Chandra S, Wright SM, Howell EE. The creating incentives and continuity leading to efficiency staffing model: A quality improvement initiative in hospital medicine. Mayo Clin Proc. 2012;87:364-371.
38. Epstein K, Juarez E, Epstein A, et al. The impact of fragmentation of hospitalist care on length of stay. J Hosp Med. 2010;5:335-338.
39. Elliott DJ, Young RS, Brice J, et al. Effect of hospitalist workload on the quality and efficiency of care. JAMA Intern Med. 2014;174:786-793.
1. Kisuule F, Howell E. Hospital medicine beyond the United States. Int J Gen Med. 2018;11:65-71.
2. Yousefi V, Wilton D. Dedesigning hospital care: learning from the experience of hospital medicine in Canada. J Global Health Care Syst. 2011;1(3).
3. Soong C, Fan E, Howell E, et al. Characteristics of hospitalists and hospitalist programs in the United States and Canada. J Clin Outcomes Manag. 2009;16:69-76.
4. Yousefi V. How Canadian hospitalists spend their time - A work-sampling study within a hospital medicine program in Ontario. J Clin Outcomes Manag. 2011;18:159-166.
5. Wilson G. Are inpatients’ needs better served by hospitalists than by their family doctors? No. Can Fam Physician. 2008;54:1101-1103.
6. Samoil D. Are inpatients’ needs better served by hospitalists than by their family doctors: Yes? Can Fam Physician. 2008;54:1100-1101.
7. Nicolson B. Where’s Marcus Welby when you need him? BC Medical J. 2016;58:63-64.
8. Lemire F. Enhanced skills in family medicine: Update. Can Fam Physician. 2018;64:160.
9. Lerner J. Wanting family medicine without primary care. Can Fam Physician. 2018; 64:155.
10. Canadian Society of Hospital Medicine. Core Competencies in Hospital Medicine - Care of the Medical Inpatient. 2015.
11. Redelmeier DA. A Canadian perspective on the American hospitalist movement. Arch Intern Med. 1999;159:1665-1668.
12. Ghali WA, Greenberg PB, Mejia R, et al. International perspectives on general internal medicine and the case for “globalization” of a discipline. J Gen Intern Med. 2006;21:197-200.
13. Day A, MacMillan L. Neglect of the inpatient: The hospitalist movement in Canada responds. Hosp Q. 2001;4:36.
14. Sullivan P. Enter the hospitalist: New type of patient creating a new type of specialist. CMAJ. 2000;162:1345-1346.
15. Chan BTB. The declining comprehensiveness of primary care. CMAJ. 2002;166:429-434.
16. Abenhaim HA, Kahn SR, Raffoul J, Becker MR. Program description: A hospitalist-run, medical short-stay unit in a teaching hospital. CMAJ. 2000;163:1477-1480.
17. McGowan B, Nightingale M. The hospitalist program a new specialty on the horizon in acute care medicine a hospital case study. BC Med J. 2003;45:391-394.
18. Yousefi V, Chong C. Does implementation of a hospitalist program in a Canadian community hospital improve measures of quality of care and utilization? An observational comparative analysis of hospitalists vs. traditional care providers. BMC Health Serv Res. 2013;13:204.
19. White HL. Assessing the prevalence, penetration and performance of hospital physicians in Ontario: Implications for the quality and efficiency of inpatient care. ProQuest Dissertations Publishing; 2016.
20. Gutierrez CA, Norris M, Chail M. Impact of a newly established hospitalist training program on patient LOS and RIW. Poster presented at the 9th Annual Canadian Society of Hospital Medicine Conference, September 23-25, 2011; Banff, Alberta.
21. Seth P, Nicholson K, Habbous S, Menard J. Implementation of a hospitalist medicine model in a full-service community hospital: Examining impact two years post-implementation on health resource use andpatient satisfaction. Poster presented at the 13th Annual Canadian Society of Hospital Medicine Conference. 2015; Niagara Falls, Ontario.
22. Lewis S. A system in name only--access, variation, and reform in Canada’s provinces. N Engl J Med. 2015;372:497-500.
23. Lewis S, Kouri D. Regionalization: Making sense of the Canadian experience. Healthcare Papers. 2004;5:12-31.
24. Fraser Health Authority. About Fraser health. www.fraserhealth.ca/about-us/about-fraser-health#.XFJrl9JKiUk. Updated 2018. Accessed January 30, 2019.
25. Canadian Institute for Health Information. CMG+. https://www.cihi.ca/en/cmg. Accessed January 30, 2019.
26. White HL, Glazier RH. Do hospitalist physicians improve the quality of inpatient care delivery? A systematic review of process, efficiency and outcome measures. BMC Med. 2011;9:58.
27. Canadian Institute for Health Information. Hospital standardized mortality ratio technical notes. 2008. www.cihi.ca/sites/default/files/document/hsmr-tech-notes_en_0.pdf.
28. McAlister FA, Youngson E, Bakal JA, et al. Physician experience and outcomes among patients admitted to general internal medicine teaching wards. CMAJ. 2015;187:1041-1048.
29. Verma AA, Guo Y, Kwan JL, et al. Patient characteristics, resource use and outcomes associated with general internal medicine hospital care: The general medicine inpatient initiative (GEMINI) retrospective cohort study. CMAJ Open. 2017;5:E849.
30. Morche J, Mathes T, Pieper D. Relationship between surgeon volume and outcomes: A systematic review of systematic reviews. Syst Rev. 2016;5:204.
31. Halm EA, Lee C, Chassin MR. Is volume related to outcome in health care? A systematic review and methodologic critique of the literature. Ann Intern Med. 2002;137:511-520.
32. Chen CH, Chen YH, Lin HC, Lin HC. Association between physician caseload and patient outcome for sepsis treatment. Infect Control Hosp Epidemiol. 2009;30:556-562.
33. van Gestel YR, Lemmens VE, Lingsma HF, et al. The hospital standardized mortality ratio fallacy: A narrative review. Med Care. 2012;50:662-667.
34. Scott IA, Brand CA, Phelps GE, et al. Using hospital standardised mortality ratios to assess quality of care—proceed with extreme caution. Med J Aust. 2011; 194:645-648.
35. Wachter RM. Hospitalists in the United States -- mission accomplished or work in progress? N Engl J Med. 2004;350:1935-1936.
36. Peterson MC. A systematic review of outcomes and quality measures in adult patients cared for by hospitalists vs nonhospitalists. Mayo Clin Proc. 2009;84:248-254.
37. Chandra S, Wright SM, Howell EE. The creating incentives and continuity leading to efficiency staffing model: A quality improvement initiative in hospital medicine. Mayo Clin Proc. 2012;87:364-371.
38. Epstein K, Juarez E, Epstein A, et al. The impact of fragmentation of hospitalist care on length of stay. J Hosp Med. 2010;5:335-338.
39. Elliott DJ, Young RS, Brice J, et al. Effect of hospitalist workload on the quality and efficiency of care. JAMA Intern Med. 2014;174:786-793.
The Society of Hospital Medicine’s Commitment to Increasing Academic Representation for Women and Underrepresented Groups in Medicine: A Good Start
Documentation of gender-based disparities in medicine often focus on lower numbers of women in prominent positions as evidence of inequality and inequity; examples include lower proportion of women physicians as conference speakers,1 first and last authors of manuscripts,2 invited editorials,3 award recipients,4 grant recipients,5 medical society leadership,6 editorial boards,7 and presenters at grand rounds.8 Notably, these disparities are likely greater for intersectional physicians, who experience bias through multiple lenses of disadvantage.9 While the scarcity of women and marginalized populations in leadership roles in medicine provides convincing evidence that inequality exists, the underrepresentation of women and other marginalized physicians in prominent positions is also a cause of continued disparity. Fewer academic opportunities for women physicians and other underrepresented physician groups in medicine may perpetuate slower career advancement10 and contribute to less availability of mentors and sponsors.11 Less obviously, underrepresentation also unintentionally and explicitly signals to junior faculty from marginalized groups that they are not welcome and are unlikely to be successful.9,12
Improving representation of women in other fields has been demonstrated to reduce implicit and explicit sexism.13,14 Increasing diversity in academic leadership is likely to further improve diversity at all levels,9,15 which may in turn reduce gaps in health outcomes seen for marginalized patients.16-18 Measuring and eliminating bias that disadvantages underrepresented physicians in academic opportunities is a moral imperative for institutions and organizations. For this reason, the Society of Hospital Medicine (SHM) has been attempting to address this issue within its organizational structure, publications, and conference presenters.19
The first step for an organization that aims to increase representation of women and other marginalized groups in medicine is to assess the current representation of leadership and opportunities.20 If data are available, this review should include intersectional measurement of other axes of discrimination. Rapid analysis of large data sets of names is feasible using freely available computer algorithms, for example.21 Only once a baseline understanding of representation within an organization is established can identification of goals and areas of improvement and evaluation of efforts to increase representation begin. Reporting this data to the organization’s membership should be undertaken to increase the accountability of leadership to reduce gaps. This work is currently underway at the Journal of Hospital Medicine and within the Society of Hospital Medicine.19
This month’s issue of the Journal of Hospital Medicine includes an article written by Northcutt, et al that describes one such attempt, focusing on representation of conference speakers at SHM’s Annual Meeting. In this study, authors performed a pre- and postintervention analysis of an open call system for selecting didactic speakers for the SHM Annual Meeting. The open call system, implemented for the 2019 SHM Annual Meeting, invited all members to apply for a didactic session. The planning committee then utilized a standardized evaluation form to determine the final speaker list. In previous years, didactic speakers did not apply but were invited and were not formally evaluated. Northcutt et al report that this intervention was associated with a significant increase in the proportion of women conference speakers.22
The Northcutt article and the open call and evaluation system is one example of an intentional adjustment to the speaker selection process aimed at recruiting more diverse presenters. Other examples of intentional efforts to increase diversity within conferences include using curated lists designed to improve representation or contacting other national organizations for recommendations. 20 Efforts such as these are necessary because men in medicine are more likely to volunteer for prominent positions than women,23 meaning that any system of recruitment or allocation of academic opportunities that relies on self-promotion is likely to perpetuate underrepresentation. Using pre-existing speakers list or previous programs will also support ongoing disparities, because men have traditionally represented the majority of speakers.
Of course, conferences are an important and public representation of a society, but are only the starting point for working towards equity within a large organization such as SHM. Similar efforts must be directed towards authorship in SHM publications, representation on editorial boards, society leadership and employment opportunities. Once organizations have an established baseline around publications, leadership recruitment, and employment representation, a review of recruitment policies (for articles, speakers, leaders, and employees) should then be conducted, looking for areas that lead to bias.
Planning committees, editorial boards, and society leadership groups should also intentionally increase their own diversity, as increasing the proportion of women on a convening committee has been demonstrated to increase the number of invited women speakers.15,24 In addition, committees can adopt a mandate to increase diversity in invited speakers, editorials, and authorship; for example, direct instruction to avoid all-male panels led a conference planning committee to invite more women and increased the numbers of women speakers.25 A speaker, authorship, or editorial policy that emphasizes diversity and inclusion should be developed and made available to the organization’s membership.26
Finally, there is evidence that implicit bias training for editorial boards and conference planning committees may be effective.27 Implicit bias training emphasizes that judgements of merit and skill are often subjective and based on in-group membership rather than the quality of applicants.9 For example, underrepresentation of women at a neuroimmunology conference was not explained by quantity or impact of previous publications,28 and evaluation scores for the Society for Hospital Medicine’s Annual Meeting have increased as the proportion of women speakers has increased, suggesting that the presence of women presenters was associated with better presentations. To address concerns about how diversity and inclusion efforts may influence the quality of speakers and authors,29 objective criteria could be developed in advance of a selection process and candidates should be held to the same standard.30 The use of objective evaluation criteria in the selection of conference speakers has also been associated with increasing the proportion of women conference speakers. All in all, SHM’s efforts (and Northcutt’s work) should be lauded but also recognized as what they are: a good start. Continued vigilance focused on equity is the only way to ensure that the move towards greater representation continues.
1. Ruzycki SM, Fletcher S, Earp M, Bharwani A, Lithgow KC. Trends in the proportion of female speakers at medical conferences in the United States and in Canada, 2007 to 2017. JAMA Netw Open. 2019;2(4):e192103. https://doi.org/ 10.1001/jamanetworkopen.2019.2103.
2. Penn CA, Ebott JA, Larach DB, Hesson AM, Waljee JF, Larach MG. The gender authorship gap in gynecologic oncology research. Gynecol Oncol Rep. 2019;29:83-84. https://doi.org/10.1016/j.gore.2019.07.011.
3. Thomas EG, Jayabalasingham B, Collins T, Geertzen J, Bui C, Dominici F. Gender disparities in invited commentary authorship in 2459 medical journals. JAMA Netw Open. 2019;2(10):e1913682.https://doi.org/10.1001/jamanetworkopen.2019.13682.
4. Silver JK, Slocum CS, Bank AM, et al. Where are the women? The underrepresentation of women physicians among recognition award recipients from medical specialty societies. PM R. 2017;9(8):804-815. https://doi.org/ 10.1016/j.pmrj.2017.06.001.
5. Burns KEA, Straus SE, Liu K, Rizv, L, Guyatt G. Gender differences in grant and personnel award funding rates at the Canadian Institute of Health Research based on research content area: a retrospective analysis. PLoS Med. 2019;16(10):e1002935. https://doi.org/ 10.1371/journal.pmed.1002935.
6. Silver JK, Ghalib R, Poorman JA, Al-Assi D, Parangi S, Bhargava H, et al. Analysis of gender equity in leadership of physician-focused medical specialty societies, 2008-2017analysis of gender equity in leadership of physician-focused medical specialty societies, 2008-2017. JAMA Internal Medicine. 2019;179(3):433-435. https://doi.org/10.1001/jamainternmed.2018.5303.
7. Erren TC, Groß JV, Shaw DM, Selle B. Representation of women as authors, reviewers, editors in chief, and editorial board members at 6 general medical journals in 2010 and 2011. JAMA Intern Med. 2014;174(4):633-635. https://doi.org/ 10.1001/jamainternmed.2013.14760.
8. Files JA, Mayer AP, Ko MG, et al. Speaker introductions at internal medicine grand rounds: forms of address reveal gender bias. J Womens Health (Larchmt). 2017;26(5):413-419. https://doi.org/ 10.1089/jwh.2016.6044.
9. Price EG, Gozu A, Kern DE, et al. The role of cultural diversity climate in recruitment, promotion, and retention of faculty in academic medicine. J Gen Intern Med. 2005;20(7):565-571. https://doi.org/10.1111/j.1525-1497.2005.0127.x.
10. Carr PL, Gunn CM, Kaplan SA, Raj A, Freund KM. Inadequate progress for women in academic medicine: findings from the National Faculty Study. J Womens Health (Larchmt). 2015;24(3):190-199. https://doi.org/10.1089/jwh.2014.4848.
11. Farkas AH, Bonifacino E, Turner R, Tilstra SA, Corbelli JA. Mentorship of women in academic medicine: a systematic review. J Gen Intern Med. 2019;34(7):1322-1329. https://doi.org/10.1007/s11606-019-04955-2.
12. Pololi L, Cooper LA, Carr P. Race, disadvantage and faculty experiences in academic medicine. J Gen Intern Med. 2010;25(12):1363-1369. https://doi.org/10.1007/s11606-010-1478-7.
13. Beaman L CR, Duflo E, Pande R, Topalova P. Powerful women: does exposure reduce bias? Q J Econ. 2009;124(4):1497-1540.
14. Mansbridge J. Should Blacks represent Blacks and women represent women? A contingent “Yes”. J Polit. 1999;61(3):628-657. https://doi.org/ https://doi.org/10.2307/2647821.
15. Lithgow KC, Fletcher, S., Earp, M.E., Bharwani, A., Ruzycki, S.M. Association between the proprtion of women on a conference planning committee and the proportion of women conference speakers at medical conferences. JAMA Netw Open. 2020; In press.
16. Alsan M, Garrick, O., Graziani, G.C. Does diversity matter for health? Experimental evidence from Oakland. National Bureau of Economic Research. 2018.
17. Greenwood BN, Carnahan, S., Huang, L. Patient–physician gender concordance and increased mortality among female heart attack patients. Proc Natl Acad Sci USA. 2018;115(34):8569-8574. https://doi.org/10.1073/pnas.1800097115.
18. Silver JK, Bean AC, Slocum C, et al. Physician Workforce Disparities and Patient Care: A Narrative Review. Health Equity. 2019;3(1):360-777. https://doi.org/10.1089/heq.2019.0040.
19. Shah SS, Shaughnessy, E.E., Spector, N.D. Leading by example: How medical journals can improve representation in academic medicine. J Hos Med. 2019;14(7):393. https://doi.org/10.12788/jhm.3247.
20. Martin JL. Ten simple rules to achieve conference speaker gender balance. PLoS Comput Biol. 2014;10(11):e1003903. https://doi.org/ 10.1371/journal.pcbi.1003903.
21. Sumner J. The Gender Balance Assessment Tool (GBAT): a web-based tool for estimating gender balance in syllabi and bibliographies. Polit Sci Polit. 2018;2(51):396-400. https://doi.org/10.1017/S1049096517002074.
22. Northcutt N, Papp S, Keniston A, et al; on behalf of the Society of Hospital Medicine Diversity, Equity and Inclusion Special Interest Group. SPEAKers at the National Society of Hospital Medicine Meeting: A Follow-UP Study of Gender Equity for Conference Speakers from 2015 to 2019. The SPEAK Up Study. J Hosp Med. 2020;15(4):228-231. https://doi.org/10.12788/jhm.3401.
23. Wayne NL, Vermillion M, Uijtdehaage S. Gender differences in leadership amongst first-year medical students in the small-group setting. Acad Med. 2010;85(8):1276-1281. https://doi.org/10.1097/ACM.0b013e3181e5f2ce
24. Casadevall A, Handelsman J. The presence of female conveners correlates with a higher proportion of female speakers at scientific symposia. MBio. 2014;5(1):e00846-13. https://doi.org/10.1128/mBio.00846-13.25. Casadevall A. Achieving speaker gender equity at the American Society for Microbiology General Meeting. MBio. 2015;6(4):e01146. https://doi.org/10.1128/mBio.01146-15.
26. Health NIo. Guidelines for the inclusion of women, minorities, and persons with disabilities in NIH-supported conference grats 2003. https://grants.nih.gov/grants/guide/notice-files/NOT-OD-03-066.html. Accessed March 12, 2019.
27. Devine PG, Forscher PS, Cox WTL, Kaatz A, Sheridan J, Carnes M. A gender bias habit-breaking intervention led to increased hiring of female faculty in STEMM departments. J Exp Soc Psychol. 2017;73:211-215. https://doi.org/10.1016/j.jesp.2017.07.002.
28. Klein RS, Voskuhl, R, Segal BM, et al. Speaking out about gender imbalance in invited speakers improves diversity. Nat Immunol. 201;18(5):475-478. https://doi.org/10.1038/ni.3707.
29. Borrero-Mejias C, Starling AJ, Burch R, Loder E. Ten (Eleven) things not to say to your female colleagues. Headache. 2019;59(10):1846-1854. https://doi.org/10.1111/head.13647.
30. Bandiera G, Abrahams C, Ruetalo M, Hanson MD, Nickell L, Spadafora S. Identifying and promoting best practices in residency application and selection in a complex academic health network. Acad Med. 2015;90(12):1594-1601. https://doi.org/10.1097/ACM.0000000000000954.
Documentation of gender-based disparities in medicine often focus on lower numbers of women in prominent positions as evidence of inequality and inequity; examples include lower proportion of women physicians as conference speakers,1 first and last authors of manuscripts,2 invited editorials,3 award recipients,4 grant recipients,5 medical society leadership,6 editorial boards,7 and presenters at grand rounds.8 Notably, these disparities are likely greater for intersectional physicians, who experience bias through multiple lenses of disadvantage.9 While the scarcity of women and marginalized populations in leadership roles in medicine provides convincing evidence that inequality exists, the underrepresentation of women and other marginalized physicians in prominent positions is also a cause of continued disparity. Fewer academic opportunities for women physicians and other underrepresented physician groups in medicine may perpetuate slower career advancement10 and contribute to less availability of mentors and sponsors.11 Less obviously, underrepresentation also unintentionally and explicitly signals to junior faculty from marginalized groups that they are not welcome and are unlikely to be successful.9,12
Improving representation of women in other fields has been demonstrated to reduce implicit and explicit sexism.13,14 Increasing diversity in academic leadership is likely to further improve diversity at all levels,9,15 which may in turn reduce gaps in health outcomes seen for marginalized patients.16-18 Measuring and eliminating bias that disadvantages underrepresented physicians in academic opportunities is a moral imperative for institutions and organizations. For this reason, the Society of Hospital Medicine (SHM) has been attempting to address this issue within its organizational structure, publications, and conference presenters.19
The first step for an organization that aims to increase representation of women and other marginalized groups in medicine is to assess the current representation of leadership and opportunities.20 If data are available, this review should include intersectional measurement of other axes of discrimination. Rapid analysis of large data sets of names is feasible using freely available computer algorithms, for example.21 Only once a baseline understanding of representation within an organization is established can identification of goals and areas of improvement and evaluation of efforts to increase representation begin. Reporting this data to the organization’s membership should be undertaken to increase the accountability of leadership to reduce gaps. This work is currently underway at the Journal of Hospital Medicine and within the Society of Hospital Medicine.19
This month’s issue of the Journal of Hospital Medicine includes an article written by Northcutt, et al that describes one such attempt, focusing on representation of conference speakers at SHM’s Annual Meeting. In this study, authors performed a pre- and postintervention analysis of an open call system for selecting didactic speakers for the SHM Annual Meeting. The open call system, implemented for the 2019 SHM Annual Meeting, invited all members to apply for a didactic session. The planning committee then utilized a standardized evaluation form to determine the final speaker list. In previous years, didactic speakers did not apply but were invited and were not formally evaluated. Northcutt et al report that this intervention was associated with a significant increase in the proportion of women conference speakers.22
The Northcutt article and the open call and evaluation system is one example of an intentional adjustment to the speaker selection process aimed at recruiting more diverse presenters. Other examples of intentional efforts to increase diversity within conferences include using curated lists designed to improve representation or contacting other national organizations for recommendations. 20 Efforts such as these are necessary because men in medicine are more likely to volunteer for prominent positions than women,23 meaning that any system of recruitment or allocation of academic opportunities that relies on self-promotion is likely to perpetuate underrepresentation. Using pre-existing speakers list or previous programs will also support ongoing disparities, because men have traditionally represented the majority of speakers.
Of course, conferences are an important and public representation of a society, but are only the starting point for working towards equity within a large organization such as SHM. Similar efforts must be directed towards authorship in SHM publications, representation on editorial boards, society leadership and employment opportunities. Once organizations have an established baseline around publications, leadership recruitment, and employment representation, a review of recruitment policies (for articles, speakers, leaders, and employees) should then be conducted, looking for areas that lead to bias.
Planning committees, editorial boards, and society leadership groups should also intentionally increase their own diversity, as increasing the proportion of women on a convening committee has been demonstrated to increase the number of invited women speakers.15,24 In addition, committees can adopt a mandate to increase diversity in invited speakers, editorials, and authorship; for example, direct instruction to avoid all-male panels led a conference planning committee to invite more women and increased the numbers of women speakers.25 A speaker, authorship, or editorial policy that emphasizes diversity and inclusion should be developed and made available to the organization’s membership.26
Finally, there is evidence that implicit bias training for editorial boards and conference planning committees may be effective.27 Implicit bias training emphasizes that judgements of merit and skill are often subjective and based on in-group membership rather than the quality of applicants.9 For example, underrepresentation of women at a neuroimmunology conference was not explained by quantity or impact of previous publications,28 and evaluation scores for the Society for Hospital Medicine’s Annual Meeting have increased as the proportion of women speakers has increased, suggesting that the presence of women presenters was associated with better presentations. To address concerns about how diversity and inclusion efforts may influence the quality of speakers and authors,29 objective criteria could be developed in advance of a selection process and candidates should be held to the same standard.30 The use of objective evaluation criteria in the selection of conference speakers has also been associated with increasing the proportion of women conference speakers. All in all, SHM’s efforts (and Northcutt’s work) should be lauded but also recognized as what they are: a good start. Continued vigilance focused on equity is the only way to ensure that the move towards greater representation continues.
Documentation of gender-based disparities in medicine often focus on lower numbers of women in prominent positions as evidence of inequality and inequity; examples include lower proportion of women physicians as conference speakers,1 first and last authors of manuscripts,2 invited editorials,3 award recipients,4 grant recipients,5 medical society leadership,6 editorial boards,7 and presenters at grand rounds.8 Notably, these disparities are likely greater for intersectional physicians, who experience bias through multiple lenses of disadvantage.9 While the scarcity of women and marginalized populations in leadership roles in medicine provides convincing evidence that inequality exists, the underrepresentation of women and other marginalized physicians in prominent positions is also a cause of continued disparity. Fewer academic opportunities for women physicians and other underrepresented physician groups in medicine may perpetuate slower career advancement10 and contribute to less availability of mentors and sponsors.11 Less obviously, underrepresentation also unintentionally and explicitly signals to junior faculty from marginalized groups that they are not welcome and are unlikely to be successful.9,12
Improving representation of women in other fields has been demonstrated to reduce implicit and explicit sexism.13,14 Increasing diversity in academic leadership is likely to further improve diversity at all levels,9,15 which may in turn reduce gaps in health outcomes seen for marginalized patients.16-18 Measuring and eliminating bias that disadvantages underrepresented physicians in academic opportunities is a moral imperative for institutions and organizations. For this reason, the Society of Hospital Medicine (SHM) has been attempting to address this issue within its organizational structure, publications, and conference presenters.19
The first step for an organization that aims to increase representation of women and other marginalized groups in medicine is to assess the current representation of leadership and opportunities.20 If data are available, this review should include intersectional measurement of other axes of discrimination. Rapid analysis of large data sets of names is feasible using freely available computer algorithms, for example.21 Only once a baseline understanding of representation within an organization is established can identification of goals and areas of improvement and evaluation of efforts to increase representation begin. Reporting this data to the organization’s membership should be undertaken to increase the accountability of leadership to reduce gaps. This work is currently underway at the Journal of Hospital Medicine and within the Society of Hospital Medicine.19
This month’s issue of the Journal of Hospital Medicine includes an article written by Northcutt, et al that describes one such attempt, focusing on representation of conference speakers at SHM’s Annual Meeting. In this study, authors performed a pre- and postintervention analysis of an open call system for selecting didactic speakers for the SHM Annual Meeting. The open call system, implemented for the 2019 SHM Annual Meeting, invited all members to apply for a didactic session. The planning committee then utilized a standardized evaluation form to determine the final speaker list. In previous years, didactic speakers did not apply but were invited and were not formally evaluated. Northcutt et al report that this intervention was associated with a significant increase in the proportion of women conference speakers.22
The Northcutt article and the open call and evaluation system is one example of an intentional adjustment to the speaker selection process aimed at recruiting more diverse presenters. Other examples of intentional efforts to increase diversity within conferences include using curated lists designed to improve representation or contacting other national organizations for recommendations. 20 Efforts such as these are necessary because men in medicine are more likely to volunteer for prominent positions than women,23 meaning that any system of recruitment or allocation of academic opportunities that relies on self-promotion is likely to perpetuate underrepresentation. Using pre-existing speakers list or previous programs will also support ongoing disparities, because men have traditionally represented the majority of speakers.
Of course, conferences are an important and public representation of a society, but are only the starting point for working towards equity within a large organization such as SHM. Similar efforts must be directed towards authorship in SHM publications, representation on editorial boards, society leadership and employment opportunities. Once organizations have an established baseline around publications, leadership recruitment, and employment representation, a review of recruitment policies (for articles, speakers, leaders, and employees) should then be conducted, looking for areas that lead to bias.
Planning committees, editorial boards, and society leadership groups should also intentionally increase their own diversity, as increasing the proportion of women on a convening committee has been demonstrated to increase the number of invited women speakers.15,24 In addition, committees can adopt a mandate to increase diversity in invited speakers, editorials, and authorship; for example, direct instruction to avoid all-male panels led a conference planning committee to invite more women and increased the numbers of women speakers.25 A speaker, authorship, or editorial policy that emphasizes diversity and inclusion should be developed and made available to the organization’s membership.26
Finally, there is evidence that implicit bias training for editorial boards and conference planning committees may be effective.27 Implicit bias training emphasizes that judgements of merit and skill are often subjective and based on in-group membership rather than the quality of applicants.9 For example, underrepresentation of women at a neuroimmunology conference was not explained by quantity or impact of previous publications,28 and evaluation scores for the Society for Hospital Medicine’s Annual Meeting have increased as the proportion of women speakers has increased, suggesting that the presence of women presenters was associated with better presentations. To address concerns about how diversity and inclusion efforts may influence the quality of speakers and authors,29 objective criteria could be developed in advance of a selection process and candidates should be held to the same standard.30 The use of objective evaluation criteria in the selection of conference speakers has also been associated with increasing the proportion of women conference speakers. All in all, SHM’s efforts (and Northcutt’s work) should be lauded but also recognized as what they are: a good start. Continued vigilance focused on equity is the only way to ensure that the move towards greater representation continues.
1. Ruzycki SM, Fletcher S, Earp M, Bharwani A, Lithgow KC. Trends in the proportion of female speakers at medical conferences in the United States and in Canada, 2007 to 2017. JAMA Netw Open. 2019;2(4):e192103. https://doi.org/ 10.1001/jamanetworkopen.2019.2103.
2. Penn CA, Ebott JA, Larach DB, Hesson AM, Waljee JF, Larach MG. The gender authorship gap in gynecologic oncology research. Gynecol Oncol Rep. 2019;29:83-84. https://doi.org/10.1016/j.gore.2019.07.011.
3. Thomas EG, Jayabalasingham B, Collins T, Geertzen J, Bui C, Dominici F. Gender disparities in invited commentary authorship in 2459 medical journals. JAMA Netw Open. 2019;2(10):e1913682.https://doi.org/10.1001/jamanetworkopen.2019.13682.
4. Silver JK, Slocum CS, Bank AM, et al. Where are the women? The underrepresentation of women physicians among recognition award recipients from medical specialty societies. PM R. 2017;9(8):804-815. https://doi.org/ 10.1016/j.pmrj.2017.06.001.
5. Burns KEA, Straus SE, Liu K, Rizv, L, Guyatt G. Gender differences in grant and personnel award funding rates at the Canadian Institute of Health Research based on research content area: a retrospective analysis. PLoS Med. 2019;16(10):e1002935. https://doi.org/ 10.1371/journal.pmed.1002935.
6. Silver JK, Ghalib R, Poorman JA, Al-Assi D, Parangi S, Bhargava H, et al. Analysis of gender equity in leadership of physician-focused medical specialty societies, 2008-2017analysis of gender equity in leadership of physician-focused medical specialty societies, 2008-2017. JAMA Internal Medicine. 2019;179(3):433-435. https://doi.org/10.1001/jamainternmed.2018.5303.
7. Erren TC, Groß JV, Shaw DM, Selle B. Representation of women as authors, reviewers, editors in chief, and editorial board members at 6 general medical journals in 2010 and 2011. JAMA Intern Med. 2014;174(4):633-635. https://doi.org/ 10.1001/jamainternmed.2013.14760.
8. Files JA, Mayer AP, Ko MG, et al. Speaker introductions at internal medicine grand rounds: forms of address reveal gender bias. J Womens Health (Larchmt). 2017;26(5):413-419. https://doi.org/ 10.1089/jwh.2016.6044.
9. Price EG, Gozu A, Kern DE, et al. The role of cultural diversity climate in recruitment, promotion, and retention of faculty in academic medicine. J Gen Intern Med. 2005;20(7):565-571. https://doi.org/10.1111/j.1525-1497.2005.0127.x.
10. Carr PL, Gunn CM, Kaplan SA, Raj A, Freund KM. Inadequate progress for women in academic medicine: findings from the National Faculty Study. J Womens Health (Larchmt). 2015;24(3):190-199. https://doi.org/10.1089/jwh.2014.4848.
11. Farkas AH, Bonifacino E, Turner R, Tilstra SA, Corbelli JA. Mentorship of women in academic medicine: a systematic review. J Gen Intern Med. 2019;34(7):1322-1329. https://doi.org/10.1007/s11606-019-04955-2.
12. Pololi L, Cooper LA, Carr P. Race, disadvantage and faculty experiences in academic medicine. J Gen Intern Med. 2010;25(12):1363-1369. https://doi.org/10.1007/s11606-010-1478-7.
13. Beaman L CR, Duflo E, Pande R, Topalova P. Powerful women: does exposure reduce bias? Q J Econ. 2009;124(4):1497-1540.
14. Mansbridge J. Should Blacks represent Blacks and women represent women? A contingent “Yes”. J Polit. 1999;61(3):628-657. https://doi.org/ https://doi.org/10.2307/2647821.
15. Lithgow KC, Fletcher, S., Earp, M.E., Bharwani, A., Ruzycki, S.M. Association between the proprtion of women on a conference planning committee and the proportion of women conference speakers at medical conferences. JAMA Netw Open. 2020; In press.
16. Alsan M, Garrick, O., Graziani, G.C. Does diversity matter for health? Experimental evidence from Oakland. National Bureau of Economic Research. 2018.
17. Greenwood BN, Carnahan, S., Huang, L. Patient–physician gender concordance and increased mortality among female heart attack patients. Proc Natl Acad Sci USA. 2018;115(34):8569-8574. https://doi.org/10.1073/pnas.1800097115.
18. Silver JK, Bean AC, Slocum C, et al. Physician Workforce Disparities and Patient Care: A Narrative Review. Health Equity. 2019;3(1):360-777. https://doi.org/10.1089/heq.2019.0040.
19. Shah SS, Shaughnessy, E.E., Spector, N.D. Leading by example: How medical journals can improve representation in academic medicine. J Hos Med. 2019;14(7):393. https://doi.org/10.12788/jhm.3247.
20. Martin JL. Ten simple rules to achieve conference speaker gender balance. PLoS Comput Biol. 2014;10(11):e1003903. https://doi.org/ 10.1371/journal.pcbi.1003903.
21. Sumner J. The Gender Balance Assessment Tool (GBAT): a web-based tool for estimating gender balance in syllabi and bibliographies. Polit Sci Polit. 2018;2(51):396-400. https://doi.org/10.1017/S1049096517002074.
22. Northcutt N, Papp S, Keniston A, et al; on behalf of the Society of Hospital Medicine Diversity, Equity and Inclusion Special Interest Group. SPEAKers at the National Society of Hospital Medicine Meeting: A Follow-UP Study of Gender Equity for Conference Speakers from 2015 to 2019. The SPEAK Up Study. J Hosp Med. 2020;15(4):228-231. https://doi.org/10.12788/jhm.3401.
23. Wayne NL, Vermillion M, Uijtdehaage S. Gender differences in leadership amongst first-year medical students in the small-group setting. Acad Med. 2010;85(8):1276-1281. https://doi.org/10.1097/ACM.0b013e3181e5f2ce
24. Casadevall A, Handelsman J. The presence of female conveners correlates with a higher proportion of female speakers at scientific symposia. MBio. 2014;5(1):e00846-13. https://doi.org/10.1128/mBio.00846-13.25. Casadevall A. Achieving speaker gender equity at the American Society for Microbiology General Meeting. MBio. 2015;6(4):e01146. https://doi.org/10.1128/mBio.01146-15.
26. Health NIo. Guidelines for the inclusion of women, minorities, and persons with disabilities in NIH-supported conference grats 2003. https://grants.nih.gov/grants/guide/notice-files/NOT-OD-03-066.html. Accessed March 12, 2019.
27. Devine PG, Forscher PS, Cox WTL, Kaatz A, Sheridan J, Carnes M. A gender bias habit-breaking intervention led to increased hiring of female faculty in STEMM departments. J Exp Soc Psychol. 2017;73:211-215. https://doi.org/10.1016/j.jesp.2017.07.002.
28. Klein RS, Voskuhl, R, Segal BM, et al. Speaking out about gender imbalance in invited speakers improves diversity. Nat Immunol. 201;18(5):475-478. https://doi.org/10.1038/ni.3707.
29. Borrero-Mejias C, Starling AJ, Burch R, Loder E. Ten (Eleven) things not to say to your female colleagues. Headache. 2019;59(10):1846-1854. https://doi.org/10.1111/head.13647.
30. Bandiera G, Abrahams C, Ruetalo M, Hanson MD, Nickell L, Spadafora S. Identifying and promoting best practices in residency application and selection in a complex academic health network. Acad Med. 2015;90(12):1594-1601. https://doi.org/10.1097/ACM.0000000000000954.
1. Ruzycki SM, Fletcher S, Earp M, Bharwani A, Lithgow KC. Trends in the proportion of female speakers at medical conferences in the United States and in Canada, 2007 to 2017. JAMA Netw Open. 2019;2(4):e192103. https://doi.org/ 10.1001/jamanetworkopen.2019.2103.
2. Penn CA, Ebott JA, Larach DB, Hesson AM, Waljee JF, Larach MG. The gender authorship gap in gynecologic oncology research. Gynecol Oncol Rep. 2019;29:83-84. https://doi.org/10.1016/j.gore.2019.07.011.
3. Thomas EG, Jayabalasingham B, Collins T, Geertzen J, Bui C, Dominici F. Gender disparities in invited commentary authorship in 2459 medical journals. JAMA Netw Open. 2019;2(10):e1913682.https://doi.org/10.1001/jamanetworkopen.2019.13682.
4. Silver JK, Slocum CS, Bank AM, et al. Where are the women? The underrepresentation of women physicians among recognition award recipients from medical specialty societies. PM R. 2017;9(8):804-815. https://doi.org/ 10.1016/j.pmrj.2017.06.001.
5. Burns KEA, Straus SE, Liu K, Rizv, L, Guyatt G. Gender differences in grant and personnel award funding rates at the Canadian Institute of Health Research based on research content area: a retrospective analysis. PLoS Med. 2019;16(10):e1002935. https://doi.org/ 10.1371/journal.pmed.1002935.
6. Silver JK, Ghalib R, Poorman JA, Al-Assi D, Parangi S, Bhargava H, et al. Analysis of gender equity in leadership of physician-focused medical specialty societies, 2008-2017analysis of gender equity in leadership of physician-focused medical specialty societies, 2008-2017. JAMA Internal Medicine. 2019;179(3):433-435. https://doi.org/10.1001/jamainternmed.2018.5303.
7. Erren TC, Groß JV, Shaw DM, Selle B. Representation of women as authors, reviewers, editors in chief, and editorial board members at 6 general medical journals in 2010 and 2011. JAMA Intern Med. 2014;174(4):633-635. https://doi.org/ 10.1001/jamainternmed.2013.14760.
8. Files JA, Mayer AP, Ko MG, et al. Speaker introductions at internal medicine grand rounds: forms of address reveal gender bias. J Womens Health (Larchmt). 2017;26(5):413-419. https://doi.org/ 10.1089/jwh.2016.6044.
9. Price EG, Gozu A, Kern DE, et al. The role of cultural diversity climate in recruitment, promotion, and retention of faculty in academic medicine. J Gen Intern Med. 2005;20(7):565-571. https://doi.org/10.1111/j.1525-1497.2005.0127.x.
10. Carr PL, Gunn CM, Kaplan SA, Raj A, Freund KM. Inadequate progress for women in academic medicine: findings from the National Faculty Study. J Womens Health (Larchmt). 2015;24(3):190-199. https://doi.org/10.1089/jwh.2014.4848.
11. Farkas AH, Bonifacino E, Turner R, Tilstra SA, Corbelli JA. Mentorship of women in academic medicine: a systematic review. J Gen Intern Med. 2019;34(7):1322-1329. https://doi.org/10.1007/s11606-019-04955-2.
12. Pololi L, Cooper LA, Carr P. Race, disadvantage and faculty experiences in academic medicine. J Gen Intern Med. 2010;25(12):1363-1369. https://doi.org/10.1007/s11606-010-1478-7.
13. Beaman L CR, Duflo E, Pande R, Topalova P. Powerful women: does exposure reduce bias? Q J Econ. 2009;124(4):1497-1540.
14. Mansbridge J. Should Blacks represent Blacks and women represent women? A contingent “Yes”. J Polit. 1999;61(3):628-657. https://doi.org/ https://doi.org/10.2307/2647821.
15. Lithgow KC, Fletcher, S., Earp, M.E., Bharwani, A., Ruzycki, S.M. Association between the proprtion of women on a conference planning committee and the proportion of women conference speakers at medical conferences. JAMA Netw Open. 2020; In press.
16. Alsan M, Garrick, O., Graziani, G.C. Does diversity matter for health? Experimental evidence from Oakland. National Bureau of Economic Research. 2018.
17. Greenwood BN, Carnahan, S., Huang, L. Patient–physician gender concordance and increased mortality among female heart attack patients. Proc Natl Acad Sci USA. 2018;115(34):8569-8574. https://doi.org/10.1073/pnas.1800097115.
18. Silver JK, Bean AC, Slocum C, et al. Physician Workforce Disparities and Patient Care: A Narrative Review. Health Equity. 2019;3(1):360-777. https://doi.org/10.1089/heq.2019.0040.
19. Shah SS, Shaughnessy, E.E., Spector, N.D. Leading by example: How medical journals can improve representation in academic medicine. J Hos Med. 2019;14(7):393. https://doi.org/10.12788/jhm.3247.
20. Martin JL. Ten simple rules to achieve conference speaker gender balance. PLoS Comput Biol. 2014;10(11):e1003903. https://doi.org/ 10.1371/journal.pcbi.1003903.
21. Sumner J. The Gender Balance Assessment Tool (GBAT): a web-based tool for estimating gender balance in syllabi and bibliographies. Polit Sci Polit. 2018;2(51):396-400. https://doi.org/10.1017/S1049096517002074.
22. Northcutt N, Papp S, Keniston A, et al; on behalf of the Society of Hospital Medicine Diversity, Equity and Inclusion Special Interest Group. SPEAKers at the National Society of Hospital Medicine Meeting: A Follow-UP Study of Gender Equity for Conference Speakers from 2015 to 2019. The SPEAK Up Study. J Hosp Med. 2020;15(4):228-231. https://doi.org/10.12788/jhm.3401.
23. Wayne NL, Vermillion M, Uijtdehaage S. Gender differences in leadership amongst first-year medical students in the small-group setting. Acad Med. 2010;85(8):1276-1281. https://doi.org/10.1097/ACM.0b013e3181e5f2ce
24. Casadevall A, Handelsman J. The presence of female conveners correlates with a higher proportion of female speakers at scientific symposia. MBio. 2014;5(1):e00846-13. https://doi.org/10.1128/mBio.00846-13.25. Casadevall A. Achieving speaker gender equity at the American Society for Microbiology General Meeting. MBio. 2015;6(4):e01146. https://doi.org/10.1128/mBio.01146-15.
26. Health NIo. Guidelines for the inclusion of women, minorities, and persons with disabilities in NIH-supported conference grats 2003. https://grants.nih.gov/grants/guide/notice-files/NOT-OD-03-066.html. Accessed March 12, 2019.
27. Devine PG, Forscher PS, Cox WTL, Kaatz A, Sheridan J, Carnes M. A gender bias habit-breaking intervention led to increased hiring of female faculty in STEMM departments. J Exp Soc Psychol. 2017;73:211-215. https://doi.org/10.1016/j.jesp.2017.07.002.
28. Klein RS, Voskuhl, R, Segal BM, et al. Speaking out about gender imbalance in invited speakers improves diversity. Nat Immunol. 201;18(5):475-478. https://doi.org/10.1038/ni.3707.
29. Borrero-Mejias C, Starling AJ, Burch R, Loder E. Ten (Eleven) things not to say to your female colleagues. Headache. 2019;59(10):1846-1854. https://doi.org/10.1111/head.13647.
30. Bandiera G, Abrahams C, Ruetalo M, Hanson MD, Nickell L, Spadafora S. Identifying and promoting best practices in residency application and selection in a complex academic health network. Acad Med. 2015;90(12):1594-1601. https://doi.org/10.1097/ACM.0000000000000954.
© 2020 Society of Hospital Medicine
Leadership & Professional Development: Evidence-Based Strategies to Make Team Meetings More Effective
“Without meeting leadership skills, one joins the ranks of so many others who bear the responsibility for the meeting ‘problem’ and are the cause of so much frustration in the workplace.”1 Physicians, like so many others, often feel that team meetings are inefficient, a waste of time, and mentally draining. It does not have to be this way. There are evidence-based strategies that can make meetings truly work and actually enjoyable to attend.2 This is particularly important because eliminating meetings is a false solution. Hospitals need team meetings to promote coordination, collaboration, communication, and consensus decision-making. While no one individual can solve the meetings problem, each of us can find a meeting we lead and make it work better.
First, recognize that, as a leader, you are a steward of others’ time. As a steward, be intentional when designing meetings. Think carefully about who needs to be there, how much time to spend on the meeting, and how the meeting should be run. Dysfunction increases with meeting size, so invite attendees wisely; include only those essential to the meeting. For individuals not in the core group, offer them the opportunity to share their input premeeting if desired, share good meeting minutes with them, and welcome them to attend future meetings if desired. Consider “representative voices”—openly asking certain attendees to represent a group of stakeholders. Use a timed agenda to invite certain people for part, but not all, of the meeting.
Keep your meetings lean and deliberate. Avoid defaulting to one-hour meetings out of habit. Parkinson’s Law suggests that people will fill the time allotted to a particular task. If a meeting can be done in 30 minutes but is scheduled for 60 minutes, chances are that people will use the full hour. If a decision is reached faster than anticipated, end the meeting early. Refer back to your steward mindset and schedule meeting time with intention.
Meetings are often experienced psychologically like we experience interruptions. Thus, when attendees arrive at a meeting, express gratitude. Your job is to keep attendees active and engaged; therefore, facilitate the meeting actively and creatively. Try out different techniques such as devoting a few minutes to silent, written brainstorming. Leveraging silence gives attendees the opportunity to think on their own before contributing to the discussion and results in nearly twice the number of ideas.3 Perhaps members can be assigned explicit roles such as devil’s advocate, or each attendee can be assigned a specific agenda item, invoking responsibility and participation. If you always sit during meetings, try standing. If you have never tried a walking meeting, give it a go. Attendees appreciate mixing things up.
Lastly, remember to check-in with attendees to see how things are going. Never get too comfortable as a meeting leader, especially since meeting frustration abounds. Asking your team for feedback will carry over to other aspects of your role. You will be seen as a conscientious leader, open to exploration and professional development. This builds trust and creates a positive, collaborative work environment.
While you cannot control how others run their meetings, you do have the ability to make a meeting that you lead truly work. Be intentional with your role as a meeting facilitator and focus on the whole experience. Evaluate and learn from your team, show others that you care about your meetings so that they begin to care about theirs too.
1. Rogelberg SG. The Surprising Science of Meetings: How You Can Lead your Team to Peak Performance. Oxford University Press; 2019.
2. Rogelberg SG. Why your meetings stink–and what to do about it. Harvard Business Review. 2019;140-143. https://hbr.org/2019/01/why-your-meetings-stink-and-what-to-do-about-it. Accessed March 6, 2020.
3. Rogelberg SG, Kreamer L. The case for more silence in meetings. Harvard Business Review. https://hbr.org/2019/06/the-case-for-more-silence-in-meetings. Accessed August 2, 2019.
“Without meeting leadership skills, one joins the ranks of so many others who bear the responsibility for the meeting ‘problem’ and are the cause of so much frustration in the workplace.”1 Physicians, like so many others, often feel that team meetings are inefficient, a waste of time, and mentally draining. It does not have to be this way. There are evidence-based strategies that can make meetings truly work and actually enjoyable to attend.2 This is particularly important because eliminating meetings is a false solution. Hospitals need team meetings to promote coordination, collaboration, communication, and consensus decision-making. While no one individual can solve the meetings problem, each of us can find a meeting we lead and make it work better.
First, recognize that, as a leader, you are a steward of others’ time. As a steward, be intentional when designing meetings. Think carefully about who needs to be there, how much time to spend on the meeting, and how the meeting should be run. Dysfunction increases with meeting size, so invite attendees wisely; include only those essential to the meeting. For individuals not in the core group, offer them the opportunity to share their input premeeting if desired, share good meeting minutes with them, and welcome them to attend future meetings if desired. Consider “representative voices”—openly asking certain attendees to represent a group of stakeholders. Use a timed agenda to invite certain people for part, but not all, of the meeting.
Keep your meetings lean and deliberate. Avoid defaulting to one-hour meetings out of habit. Parkinson’s Law suggests that people will fill the time allotted to a particular task. If a meeting can be done in 30 minutes but is scheduled for 60 minutes, chances are that people will use the full hour. If a decision is reached faster than anticipated, end the meeting early. Refer back to your steward mindset and schedule meeting time with intention.
Meetings are often experienced psychologically like we experience interruptions. Thus, when attendees arrive at a meeting, express gratitude. Your job is to keep attendees active and engaged; therefore, facilitate the meeting actively and creatively. Try out different techniques such as devoting a few minutes to silent, written brainstorming. Leveraging silence gives attendees the opportunity to think on their own before contributing to the discussion and results in nearly twice the number of ideas.3 Perhaps members can be assigned explicit roles such as devil’s advocate, or each attendee can be assigned a specific agenda item, invoking responsibility and participation. If you always sit during meetings, try standing. If you have never tried a walking meeting, give it a go. Attendees appreciate mixing things up.
Lastly, remember to check-in with attendees to see how things are going. Never get too comfortable as a meeting leader, especially since meeting frustration abounds. Asking your team for feedback will carry over to other aspects of your role. You will be seen as a conscientious leader, open to exploration and professional development. This builds trust and creates a positive, collaborative work environment.
While you cannot control how others run their meetings, you do have the ability to make a meeting that you lead truly work. Be intentional with your role as a meeting facilitator and focus on the whole experience. Evaluate and learn from your team, show others that you care about your meetings so that they begin to care about theirs too.
“Without meeting leadership skills, one joins the ranks of so many others who bear the responsibility for the meeting ‘problem’ and are the cause of so much frustration in the workplace.”1 Physicians, like so many others, often feel that team meetings are inefficient, a waste of time, and mentally draining. It does not have to be this way. There are evidence-based strategies that can make meetings truly work and actually enjoyable to attend.2 This is particularly important because eliminating meetings is a false solution. Hospitals need team meetings to promote coordination, collaboration, communication, and consensus decision-making. While no one individual can solve the meetings problem, each of us can find a meeting we lead and make it work better.
First, recognize that, as a leader, you are a steward of others’ time. As a steward, be intentional when designing meetings. Think carefully about who needs to be there, how much time to spend on the meeting, and how the meeting should be run. Dysfunction increases with meeting size, so invite attendees wisely; include only those essential to the meeting. For individuals not in the core group, offer them the opportunity to share their input premeeting if desired, share good meeting minutes with them, and welcome them to attend future meetings if desired. Consider “representative voices”—openly asking certain attendees to represent a group of stakeholders. Use a timed agenda to invite certain people for part, but not all, of the meeting.
Keep your meetings lean and deliberate. Avoid defaulting to one-hour meetings out of habit. Parkinson’s Law suggests that people will fill the time allotted to a particular task. If a meeting can be done in 30 minutes but is scheduled for 60 minutes, chances are that people will use the full hour. If a decision is reached faster than anticipated, end the meeting early. Refer back to your steward mindset and schedule meeting time with intention.
Meetings are often experienced psychologically like we experience interruptions. Thus, when attendees arrive at a meeting, express gratitude. Your job is to keep attendees active and engaged; therefore, facilitate the meeting actively and creatively. Try out different techniques such as devoting a few minutes to silent, written brainstorming. Leveraging silence gives attendees the opportunity to think on their own before contributing to the discussion and results in nearly twice the number of ideas.3 Perhaps members can be assigned explicit roles such as devil’s advocate, or each attendee can be assigned a specific agenda item, invoking responsibility and participation. If you always sit during meetings, try standing. If you have never tried a walking meeting, give it a go. Attendees appreciate mixing things up.
Lastly, remember to check-in with attendees to see how things are going. Never get too comfortable as a meeting leader, especially since meeting frustration abounds. Asking your team for feedback will carry over to other aspects of your role. You will be seen as a conscientious leader, open to exploration and professional development. This builds trust and creates a positive, collaborative work environment.
While you cannot control how others run their meetings, you do have the ability to make a meeting that you lead truly work. Be intentional with your role as a meeting facilitator and focus on the whole experience. Evaluate and learn from your team, show others that you care about your meetings so that they begin to care about theirs too.
1. Rogelberg SG. The Surprising Science of Meetings: How You Can Lead your Team to Peak Performance. Oxford University Press; 2019.
2. Rogelberg SG. Why your meetings stink–and what to do about it. Harvard Business Review. 2019;140-143. https://hbr.org/2019/01/why-your-meetings-stink-and-what-to-do-about-it. Accessed March 6, 2020.
3. Rogelberg SG, Kreamer L. The case for more silence in meetings. Harvard Business Review. https://hbr.org/2019/06/the-case-for-more-silence-in-meetings. Accessed August 2, 2019.
1. Rogelberg SG. The Surprising Science of Meetings: How You Can Lead your Team to Peak Performance. Oxford University Press; 2019.
2. Rogelberg SG. Why your meetings stink–and what to do about it. Harvard Business Review. 2019;140-143. https://hbr.org/2019/01/why-your-meetings-stink-and-what-to-do-about-it. Accessed March 6, 2020.
3. Rogelberg SG, Kreamer L. The case for more silence in meetings. Harvard Business Review. https://hbr.org/2019/06/the-case-for-more-silence-in-meetings. Accessed August 2, 2019.
© 2020 Society of Hospital Medicine
SPEAKers at the National Society of Hospital Medicine Meeting: A Follow-UP Study of Gender Equity for Conference Speakers from 2015 to 2019. The SPEAK UP Study
Persistent gender disparities exist in pay,1,2 leadership opportunities,3,4 promotion,5 and speaking opportunities.6 While the gender distribution of the hospitalist workforce may be approaching parity,3,7,8 gender differences in leadership, speakership, and authorship have already been noted in hospital medicine.3 Between 2006 and 2012, women constituted less than a third (26%) of the presenters at the national conferences of the Society of Hospital Medicine (SHM) and the Society of General Internal Medicine (SGIM).3
The SHM Annual Meeting has historically had an “open call” peer review process for workshop presenters with the goal of increasing the diversity of presenters. In 2019, this process was expanded to include didactic speakers. Our aim in this study was to assess whether these open call procedures resulted in improved representation of women speakers and how the proportion of women speakers affects the overall evaluation scores of the conference. Our hypothesis was that the introduction of an open call process for the SHM conference didactic speakers would be associated with an increased proportion of women speakers, compared with the closed call processes, without a negative impact on conference scores.
METHODS
The study is a retrospective evaluation of data collected regarding speakers at the annual SHM conference from 2015 to 2019. The SHM national conference typically has two main types of offerings: workshops and didactics. Workshop presenters from 2015 to 2019 were selected via an open call process as defined below. Didactic speakers (except for plenary speakers) were selected using the open call process for 2019 only.
We aimed to compare (1) the number and proportion of women speakers, compared with men speakers, over time and (2) the proportion of women speakers when open call processes were utilized versus that seen with closed call processes. Open call included workshops for all years and didactics for 2019; closed call included didactics for 2015 to 2018 and plenary sessions 2015 to 2019 (Table). The speaker list for the conferences was obtained from conference pamphlets or agendas available via Internet searches or obtained through attendance at the conference.

Speaker Categories and Identification Process
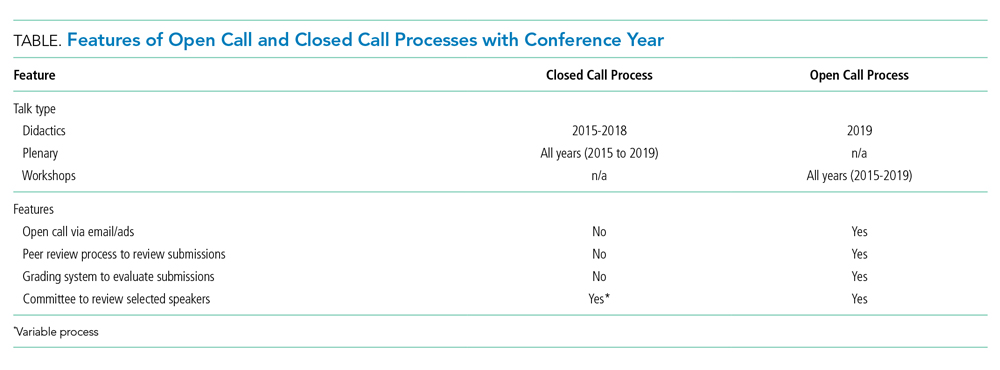
We determined whether each individual was a featured speaker (one whose talk was unopposed by other sessions), plenary speaker (defined as such in the conference pamphlets), whether they spoke in a group format, and whether the speaking opportunity type was a workshop or a didactic session. Numbers of featured and plenary speakers were combined because of low numbers. SHM provided deidentified conference evaluation data for each year studied. For the purposes of this study, we analyzed all speakers which included physicians, advanced practice providers, and professionals such as nurses and other interdisciplinary team members. The same speaker could be included multiple times if they had multiple speaking opportunities.
Open Call Process
We defined the “open call process” (referred to as “open call” here forward) as the process utilized by SHM that includes the following two components: (1) advertisements to members of SHM and to the medical community at large through a variety of mechanisms including emails, websites, and social media outlets and (2) an online submission process that includes names of proposed speakers and their topic and, in the case of workshops, session objectives as well as an outline of the proposed workshop. SHM committees may also submit suggestions for topics and speakers. Annual Conference Committee members then review and rate submissions on the categories of topic, organization and clarity, objectives, and speaker qualifications (with a focus on institutional, geographic, and gender diversity). Scores are assigned from 1 to 5 (with 5 being the best score) for each category and a section for comments is available. All submissions are also evaluated by the course director.
After initial committee reviews, scores with marked reviewer discrepancies are rereviewed and discussed by the committee and course director. A cutoff score is then calculated with proposals falling below the cutoff threshold omitted from further consideration. Weekly calls are then focused on subcategories (ie tracks) with emphasis on clinical and educational content. Each of the tracks have a subcommittee with track leads to curate the best content first and then focus on final speaker selection. More recently, templates are shared with the track leads that include a location to call out gender and institutional diversity. Weekly calls are held to hone the content and determine the speakers.
For the purposes of this study, when the above process was not used, the authors refer to it as “closed call.” Closed call processes do not typically involve open invitations or a peer review process. (Table)
Gender
Gender was assigned based on the speaker’s self-identification by the pronouns used in their biography submitted to the conference or on their institutional website or other websites where the speaker was referenced. Persons using she/her/hers pronouns were noted as women and persons using he/him/his were noted as men. For the purposes of this study, we conceptualized gender as binary (ie woman/man) given the limited information we had from online sources.
ANALYSIS
REDCap, a secure, Web-based application for building and managing online survey and databases, was used to collect and manage all study data.9
All analyses were performed using SAS Enterprise Guide 8.1 (SAS Institute, Inc., Cary, North Carolina) using retrospectively collected data. A Cochran-Armitage test for trend was used to evaluate the proportion of women speakers from 2015 to 2019. A chi-square test was used to assess the proportion of women speakers for open call processes versus that seen with closed call. One-way analysis of variance (ANOVA) was used to evaluate annual conference evaluation scores from 2015 to 2019. Either numbers with proportions or means with standard deviations have been reported. Bonferroni’s correction for multiple comparisons was applied, with a P < .008 considered statistically significant.
RESULTS
Between 2015 and 2019, a total of 709 workshop and didactic presentations were given by 1,261 speakers at the annual Society of Hospital Medicine Conference. Of these, 505 (40%) were women; 756 (60%) were men. There were no missing data.
From 2015 to 2019, representation of women speakers increased from 35% of all speakers to 47% of all speakers (P = .0068). Women plenary speakers increased from 23% in 2015 to 45% in 2019 (P = .0396).
The proportion of women presenters for workshops (which have utilized an open call process throughout the study period), ranged from 43% to 53% from 2015 to 2019 with no statistically significant difference in gender distribution across years (Figure).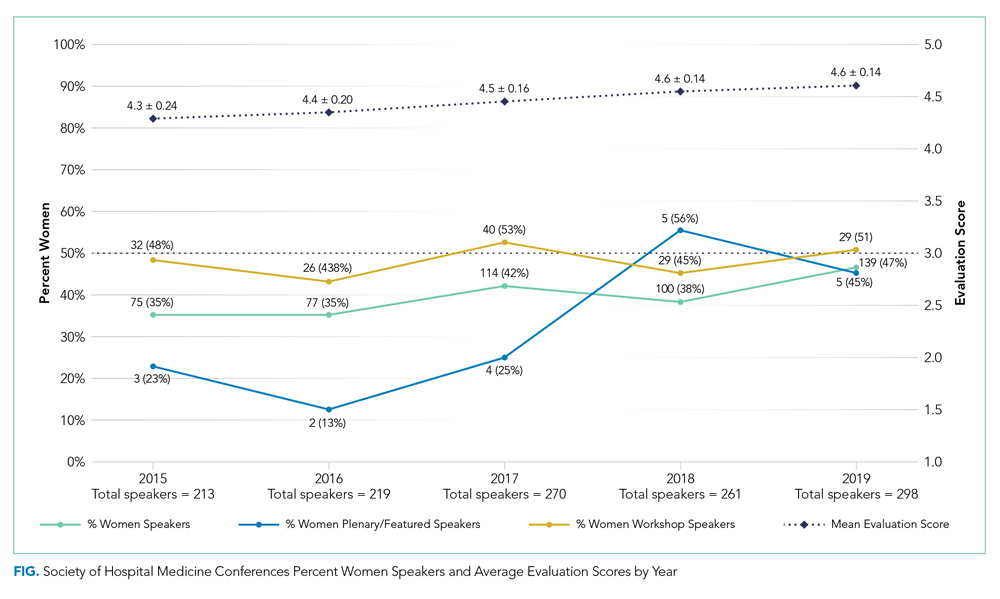
A greater proportion of speakers selected by an open call process were women compared to when speakers were selected by a closed call process (261 (47%) vs 244 (34%); P < .0001).
Of didactics or workshops given in a group format (N = 299), 82 (27%) were given by all-men groups and 38 (13%) were given by all-women groups. Women speakers participating in all-women group talks accounted for 21% of all women speakers; whereas men speakers participating in all-men group talks account for 26% of all men speakers (P = .02). We found that all-men group speaking opportunities did decrease from 41% of group talks in 2015 to 21% of group talks in 2019 (P = .0065).
We saw an average 3% annual increase in women speakers from 2015 to 2019, an 8% increase from 2018 to 2019 for all speakers, and an 11% increase in women speakers specific to didactic sessions. Overall conference ratings increased from a mean of 4.3 ± 0.24 in 2015 to a mean of 4.6 ± 0.14 in 2019 (n = 1,202; P < .0001; Figure).
DISCUSSION
The important findings of this study are that there has been an increase in women speakers over the last 5 years at the annual Society of Hospital Medicine Conference, that women had higher representation as speakers when open call processes were followed, and that conference scores continued to improve during the time frame studied. These findings suggest that a systematic open call process helps to support equitable speaking opportunities for men and women at a national hospital medicine conference without a negative impact on conference quality.
To recruit more diverse speakers, open call and peer review processes were used in addition to deliberate efforts at ensuring diversity in speakers. We found that over time, the proportion of women with speaking opportunities increased from 2015 to 2019. Interestingly, workshops, which had open call processes in place for the duration of the study period, had almost equal numbers of men and women presenting in all years. We also found that the number of all-men speaking groups decreased between 2015 and 2019.
A single process change can impact gender equity, but the target of true equity is expected to require additional measures such as assessment of committee structures and diversity, checklists, and reporting structures (data analysis and plans when goals not achieved).10-13 For instance, the American Society for Microbiology General Meeting was able to achieve gender equity in speakers by a multifold approach including ensuring the program committee was aware of gender statistics, increasing female representation among session convener teams, and direct instruction to try to avoid all-male sessions.11
It is important to acknowledge that these processes do require valuable resources including time. SHM has historically used committee volunteers to conduct the peer review process with each committee member reviewing 20 to 30 workshop submissions and 30 to 50 didactic sessions. While open processes with peer review seem to generate improved gender equity, ensuring processes are in place during the selection process is also key.
Several recent notable efforts to enhance gender equity and to increase diversity have been proposed. One such example of a process that may further improve gender equity was proposed by editors at the Journal of Hospital Medicine to assess current representation via demographics including gender, race, and ethnicity of authors with plans to assess patterns in the coming years.14 The American College of Physicians also published a position paper on achieving gender equity with a recommendation that organizational policies and procedures should be implemented that address implicit bias.15
Our study showed that, from 2015 to 2019, conference evaluations saw a significant increase in the score concurrently with the rise in proportion of women speakers. This finding suggests that quality does not seem to be affected by this new methodology for speaker selection and in fact this methodology may actually help improve the overall quality of the conference. To our knowledge, this is one of the first studies to concurrently evaluate speaker gender equity with conference quality.
Our study offers several strengths. This study took a pragmatic approach to understanding how processes can impact gender equity, and we were able to take advantage of the evolution of the open call system (ie workshops which have been an open call process for the duration of the study versus speaking opportunities that were not).
Our study also has several limitations. First, this study is retrospective in nature and thus other processes could have contributed to the improved gender equity, such as an organization’s priorities over time. During this study period, the SHM conference saw an average 3% increase annually in women speakers and an increase of 8% from 2018 to 2019 for all speakers compared to national trends of approximately 1%,6 which suggests that the open call processes in place could be contributing to the overall increases seen. Similarly, because of the retrospective nature of the study, we cannot be certain that the improvements in conference scores were directly the result of improved gender equity, although it does suggest that the improvements in gender equity did not have an adverse impact on the scores. We also did not assess how the composition of selection committee members for the meeting could have impacted the overall composition of the speakers. Our study looked at diversity only from the perspective of gender in a binary fashion, and thus additional studies are needed to assess how to improve diversity overall. It is unclear how this new open call for speakers affects race and ethnic diversity specifically. Identifying gender for the purposes of this study was facilitated by speakers providing their own biographies and the respective pronouns used in those biographies, and thus gender was easier to ascertain than race and ethnicity, which are not as readily available. For organizations to understand their diversity, equity, and inclusion efforts, enhancing the ability to fairly track and measure diversity will be key. Lastly, understanding of the exact composition of hospitalists from both a gender and race/ethnicity perspective is lacking. Studies have suggested that, based upon those surveyed or studied, there is a fairly equal balance of men and women albeit in academic groups.3
CONCLUSIONS
An open call approach to speakers at a national hospitalist conference seems to have contributed to improvements regarding gender equity in speaking opportunities with a concurrent improvement in overall rating of the conference. The open call system is a potential mechanism that other institutions and organizations could employ to enhance their diversity efforts.
Acknowledgments
Society of Hospital Medicine Diversity, Equity, Inclusion Special Interest Group
Work Group for SPEAK UP: Marisha Burden, MD, Daniel Cabrera, MD, Amira del Pino-Jones, MD, Areeba Kara, MD, Angela Keniston, MSPH, Keshav Khanijow, MD, Flora Kisuule, MD, Chiara Mandel, Benji Mathews, MD, David Paje, MD, Stephan Papp, MD, Snehal Patel, MD, Suchita Shah Sata, MD, Dustin Smith, MD, Kevin Vuernick
1. Weaver AC, Wetterneck TB, Whelan CT, Hinami K. A matter of priorities? Exploring the persistent gender pay gap in hospital medicine. J Hosp Med. 2015;10(8):486-490. https://doi.org/10.1002/jhm.2400.
2. Jena AB, Olenski AR, Blumenthal DM. Sex differences in physician salary in US public medical schools. JAMA Intern Med. 2016;176(9):1294-1304. https://doi.org/10.1001/jamainternmed.2016.3284.
3. Burden M, Frank MG, Keniston A, et al. Gender disparities in leadership and scholarly productivity of academic hospitalists. J Hosp Med. 2015;10(8):481-485. https://doi.org/10.1002/jhm.2340.
4. Silver JK, Ghalib R, Poorman JA, et al. Analysis of gender equity in leadership of physician-focused medical specialty societies, 2008-2017. JAMA Intern Med. 2019;179(3):433-435. https://doi.org/10.1001/jamainternmed.2018.5303.
5. Jena AB, Khullar D, Ho O, Olenski AR, Blumenthal DM. Sex differences in academic rank in US medical schools in 2014. JAMA. 2015;314(11):1149-1158. https://doi.org/10.1001/jama.2015.10680.
6. Ruzycki SM, Fletcher S, Earp M, Bharwani A, Lithgow KC. Trends in the Proportion of Female Speakers at Medical Conferences in the United States and in Canada, 2007 to 2017. JAMA Netw Open. 2019;2(4):e192103. https://doi.org/10.1001/jamanetworkopen.2019.2103
7. Reid MB, Misky GJ, Harrison RA, Sharpe B, Auerbach A, Glasheen JJ. Mentorship, productivity, and promotion among academic hospitalists. J Gen Intern Med. 2012;27(1):23-27. https://doi.org/10.1007/s11606-011-1892-5.
8. Today’s Hospitalist 2018 Compensation and Career Survey Results. https://www.todayshospitalist.com/salary-survey-results/. Accessed September 28, 2019.
9. Harris PA, Taylor R, Thielke R, Payne J, Gonzalez N, Conde JG. Research electronic data capture (REDCap)--a metadata-driven methodology and workflow process for providing translational research informatics support. J Biomed Inform. 2009;42(2):377-381. https://doi.org/10.1016/j.jbi.2008.08.010.
10. Burden M, del Pino-Jones A, Shafer M, Sheth S, Rexrode K. Association of American Medical Colleagues (AAMC) Group on Women in Medicine and Science. Recruitment Toolkit: https://www.aamc.org/download/492864/data/equityinrecruitmenttoolkit.pdf. Accessed July 27, 2019.
11. Casadevall A. Achieving speaker gender equity at the american society for microbiology general meeting. MBio. 2015;6:e01146. https://doi.org/10.1128/mBio.01146-15.
12. Westring A, McDonald JM, Carr P, Grisso JA. An integrated framework for gender equity in academic medicine. Acad Med. 2016;91(8):1041-1044. https://doi.org/10.1097/ACM.0000000000001275.
13. Martin JL. Ten simple rules to achieve conference speaker gender balance. PLoS Comput Biol. 2014;10(11):e1003903. https://doi.org/10.1371/journal.pcbi.1003903.
14. Shah SS, Shaughnessy EE, Spector ND. Leading by example: how medical journals can improve representation in academic medicine. J Hosp Med. 2019;14(7):393. https://doi.org/10.12788/jhm.3247.
15. Butkus R, Serchen J, Moyer DV, et al. Achieving gender equity in physician compensation and career advancement: a position paper of the American College of Physicians. Ann Intern Med. 2018;168:721-723. https://doi.org/10.7326/M17-3438.
Persistent gender disparities exist in pay,1,2 leadership opportunities,3,4 promotion,5 and speaking opportunities.6 While the gender distribution of the hospitalist workforce may be approaching parity,3,7,8 gender differences in leadership, speakership, and authorship have already been noted in hospital medicine.3 Between 2006 and 2012, women constituted less than a third (26%) of the presenters at the national conferences of the Society of Hospital Medicine (SHM) and the Society of General Internal Medicine (SGIM).3
The SHM Annual Meeting has historically had an “open call” peer review process for workshop presenters with the goal of increasing the diversity of presenters. In 2019, this process was expanded to include didactic speakers. Our aim in this study was to assess whether these open call procedures resulted in improved representation of women speakers and how the proportion of women speakers affects the overall evaluation scores of the conference. Our hypothesis was that the introduction of an open call process for the SHM conference didactic speakers would be associated with an increased proportion of women speakers, compared with the closed call processes, without a negative impact on conference scores.
METHODS
The study is a retrospective evaluation of data collected regarding speakers at the annual SHM conference from 2015 to 2019. The SHM national conference typically has two main types of offerings: workshops and didactics. Workshop presenters from 2015 to 2019 were selected via an open call process as defined below. Didactic speakers (except for plenary speakers) were selected using the open call process for 2019 only.
We aimed to compare (1) the number and proportion of women speakers, compared with men speakers, over time and (2) the proportion of women speakers when open call processes were utilized versus that seen with closed call processes. Open call included workshops for all years and didactics for 2019; closed call included didactics for 2015 to 2018 and plenary sessions 2015 to 2019 (Table). The speaker list for the conferences was obtained from conference pamphlets or agendas available via Internet searches or obtained through attendance at the conference.
Speaker Categories and Identification Process
We determined whether each individual was a featured speaker (one whose talk was unopposed by other sessions), plenary speaker (defined as such in the conference pamphlets), whether they spoke in a group format, and whether the speaking opportunity type was a workshop or a didactic session. Numbers of featured and plenary speakers were combined because of low numbers. SHM provided deidentified conference evaluation data for each year studied. For the purposes of this study, we analyzed all speakers which included physicians, advanced practice providers, and professionals such as nurses and other interdisciplinary team members. The same speaker could be included multiple times if they had multiple speaking opportunities.
Open Call Process
We defined the “open call process” (referred to as “open call” here forward) as the process utilized by SHM that includes the following two components: (1) advertisements to members of SHM and to the medical community at large through a variety of mechanisms including emails, websites, and social media outlets and (2) an online submission process that includes names of proposed speakers and their topic and, in the case of workshops, session objectives as well as an outline of the proposed workshop. SHM committees may also submit suggestions for topics and speakers. Annual Conference Committee members then review and rate submissions on the categories of topic, organization and clarity, objectives, and speaker qualifications (with a focus on institutional, geographic, and gender diversity). Scores are assigned from 1 to 5 (with 5 being the best score) for each category and a section for comments is available. All submissions are also evaluated by the course director.
After initial committee reviews, scores with marked reviewer discrepancies are rereviewed and discussed by the committee and course director. A cutoff score is then calculated with proposals falling below the cutoff threshold omitted from further consideration. Weekly calls are then focused on subcategories (ie tracks) with emphasis on clinical and educational content. Each of the tracks have a subcommittee with track leads to curate the best content first and then focus on final speaker selection. More recently, templates are shared with the track leads that include a location to call out gender and institutional diversity. Weekly calls are held to hone the content and determine the speakers.
For the purposes of this study, when the above process was not used, the authors refer to it as “closed call.” Closed call processes do not typically involve open invitations or a peer review process. (Table)
Gender
Gender was assigned based on the speaker’s self-identification by the pronouns used in their biography submitted to the conference or on their institutional website or other websites where the speaker was referenced. Persons using she/her/hers pronouns were noted as women and persons using he/him/his were noted as men. For the purposes of this study, we conceptualized gender as binary (ie woman/man) given the limited information we had from online sources.
ANALYSIS
REDCap, a secure, Web-based application for building and managing online survey and databases, was used to collect and manage all study data.9
All analyses were performed using SAS Enterprise Guide 8.1 (SAS Institute, Inc., Cary, North Carolina) using retrospectively collected data. A Cochran-Armitage test for trend was used to evaluate the proportion of women speakers from 2015 to 2019. A chi-square test was used to assess the proportion of women speakers for open call processes versus that seen with closed call. One-way analysis of variance (ANOVA) was used to evaluate annual conference evaluation scores from 2015 to 2019. Either numbers with proportions or means with standard deviations have been reported. Bonferroni’s correction for multiple comparisons was applied, with a P < .008 considered statistically significant.
RESULTS
Between 2015 and 2019, a total of 709 workshop and didactic presentations were given by 1,261 speakers at the annual Society of Hospital Medicine Conference. Of these, 505 (40%) were women; 756 (60%) were men. There were no missing data.
From 2015 to 2019, representation of women speakers increased from 35% of all speakers to 47% of all speakers (P = .0068). Women plenary speakers increased from 23% in 2015 to 45% in 2019 (P = .0396).
The proportion of women presenters for workshops (which have utilized an open call process throughout the study period), ranged from 43% to 53% from 2015 to 2019 with no statistically significant difference in gender distribution across years (Figure).
A greater proportion of speakers selected by an open call process were women compared to when speakers were selected by a closed call process (261 (47%) vs 244 (34%); P < .0001).
Of didactics or workshops given in a group format (N = 299), 82 (27%) were given by all-men groups and 38 (13%) were given by all-women groups. Women speakers participating in all-women group talks accounted for 21% of all women speakers; whereas men speakers participating in all-men group talks account for 26% of all men speakers (P = .02). We found that all-men group speaking opportunities did decrease from 41% of group talks in 2015 to 21% of group talks in 2019 (P = .0065).
We saw an average 3% annual increase in women speakers from 2015 to 2019, an 8% increase from 2018 to 2019 for all speakers, and an 11% increase in women speakers specific to didactic sessions. Overall conference ratings increased from a mean of 4.3 ± 0.24 in 2015 to a mean of 4.6 ± 0.14 in 2019 (n = 1,202; P < .0001; Figure).
DISCUSSION
The important findings of this study are that there has been an increase in women speakers over the last 5 years at the annual Society of Hospital Medicine Conference, that women had higher representation as speakers when open call processes were followed, and that conference scores continued to improve during the time frame studied. These findings suggest that a systematic open call process helps to support equitable speaking opportunities for men and women at a national hospital medicine conference without a negative impact on conference quality.
To recruit more diverse speakers, open call and peer review processes were used in addition to deliberate efforts at ensuring diversity in speakers. We found that over time, the proportion of women with speaking opportunities increased from 2015 to 2019. Interestingly, workshops, which had open call processes in place for the duration of the study period, had almost equal numbers of men and women presenting in all years. We also found that the number of all-men speaking groups decreased between 2015 and 2019.
A single process change can impact gender equity, but the target of true equity is expected to require additional measures such as assessment of committee structures and diversity, checklists, and reporting structures (data analysis and plans when goals not achieved).10-13 For instance, the American Society for Microbiology General Meeting was able to achieve gender equity in speakers by a multifold approach including ensuring the program committee was aware of gender statistics, increasing female representation among session convener teams, and direct instruction to try to avoid all-male sessions.11
It is important to acknowledge that these processes do require valuable resources including time. SHM has historically used committee volunteers to conduct the peer review process with each committee member reviewing 20 to 30 workshop submissions and 30 to 50 didactic sessions. While open processes with peer review seem to generate improved gender equity, ensuring processes are in place during the selection process is also key.
Several recent notable efforts to enhance gender equity and to increase diversity have been proposed. One such example of a process that may further improve gender equity was proposed by editors at the Journal of Hospital Medicine to assess current representation via demographics including gender, race, and ethnicity of authors with plans to assess patterns in the coming years.14 The American College of Physicians also published a position paper on achieving gender equity with a recommendation that organizational policies and procedures should be implemented that address implicit bias.15
Our study showed that, from 2015 to 2019, conference evaluations saw a significant increase in the score concurrently with the rise in proportion of women speakers. This finding suggests that quality does not seem to be affected by this new methodology for speaker selection and in fact this methodology may actually help improve the overall quality of the conference. To our knowledge, this is one of the first studies to concurrently evaluate speaker gender equity with conference quality.
Our study offers several strengths. This study took a pragmatic approach to understanding how processes can impact gender equity, and we were able to take advantage of the evolution of the open call system (ie workshops which have been an open call process for the duration of the study versus speaking opportunities that were not).
Our study also has several limitations. First, this study is retrospective in nature and thus other processes could have contributed to the improved gender equity, such as an organization’s priorities over time. During this study period, the SHM conference saw an average 3% increase annually in women speakers and an increase of 8% from 2018 to 2019 for all speakers compared to national trends of approximately 1%,6 which suggests that the open call processes in place could be contributing to the overall increases seen. Similarly, because of the retrospective nature of the study, we cannot be certain that the improvements in conference scores were directly the result of improved gender equity, although it does suggest that the improvements in gender equity did not have an adverse impact on the scores. We also did not assess how the composition of selection committee members for the meeting could have impacted the overall composition of the speakers. Our study looked at diversity only from the perspective of gender in a binary fashion, and thus additional studies are needed to assess how to improve diversity overall. It is unclear how this new open call for speakers affects race and ethnic diversity specifically. Identifying gender for the purposes of this study was facilitated by speakers providing their own biographies and the respective pronouns used in those biographies, and thus gender was easier to ascertain than race and ethnicity, which are not as readily available. For organizations to understand their diversity, equity, and inclusion efforts, enhancing the ability to fairly track and measure diversity will be key. Lastly, understanding of the exact composition of hospitalists from both a gender and race/ethnicity perspective is lacking. Studies have suggested that, based upon those surveyed or studied, there is a fairly equal balance of men and women albeit in academic groups.3
CONCLUSIONS
An open call approach to speakers at a national hospitalist conference seems to have contributed to improvements regarding gender equity in speaking opportunities with a concurrent improvement in overall rating of the conference. The open call system is a potential mechanism that other institutions and organizations could employ to enhance their diversity efforts.
Acknowledgments
Society of Hospital Medicine Diversity, Equity, Inclusion Special Interest Group
Work Group for SPEAK UP: Marisha Burden, MD, Daniel Cabrera, MD, Amira del Pino-Jones, MD, Areeba Kara, MD, Angela Keniston, MSPH, Keshav Khanijow, MD, Flora Kisuule, MD, Chiara Mandel, Benji Mathews, MD, David Paje, MD, Stephan Papp, MD, Snehal Patel, MD, Suchita Shah Sata, MD, Dustin Smith, MD, Kevin Vuernick
Persistent gender disparities exist in pay,1,2 leadership opportunities,3,4 promotion,5 and speaking opportunities.6 While the gender distribution of the hospitalist workforce may be approaching parity,3,7,8 gender differences in leadership, speakership, and authorship have already been noted in hospital medicine.3 Between 2006 and 2012, women constituted less than a third (26%) of the presenters at the national conferences of the Society of Hospital Medicine (SHM) and the Society of General Internal Medicine (SGIM).3
The SHM Annual Meeting has historically had an “open call” peer review process for workshop presenters with the goal of increasing the diversity of presenters. In 2019, this process was expanded to include didactic speakers. Our aim in this study was to assess whether these open call procedures resulted in improved representation of women speakers and how the proportion of women speakers affects the overall evaluation scores of the conference. Our hypothesis was that the introduction of an open call process for the SHM conference didactic speakers would be associated with an increased proportion of women speakers, compared with the closed call processes, without a negative impact on conference scores.
METHODS
The study is a retrospective evaluation of data collected regarding speakers at the annual SHM conference from 2015 to 2019. The SHM national conference typically has two main types of offerings: workshops and didactics. Workshop presenters from 2015 to 2019 were selected via an open call process as defined below. Didactic speakers (except for plenary speakers) were selected using the open call process for 2019 only.
We aimed to compare (1) the number and proportion of women speakers, compared with men speakers, over time and (2) the proportion of women speakers when open call processes were utilized versus that seen with closed call processes. Open call included workshops for all years and didactics for 2019; closed call included didactics for 2015 to 2018 and plenary sessions 2015 to 2019 (Table). The speaker list for the conferences was obtained from conference pamphlets or agendas available via Internet searches or obtained through attendance at the conference.
Speaker Categories and Identification Process
We determined whether each individual was a featured speaker (one whose talk was unopposed by other sessions), plenary speaker (defined as such in the conference pamphlets), whether they spoke in a group format, and whether the speaking opportunity type was a workshop or a didactic session. Numbers of featured and plenary speakers were combined because of low numbers. SHM provided deidentified conference evaluation data for each year studied. For the purposes of this study, we analyzed all speakers which included physicians, advanced practice providers, and professionals such as nurses and other interdisciplinary team members. The same speaker could be included multiple times if they had multiple speaking opportunities.
Open Call Process
We defined the “open call process” (referred to as “open call” here forward) as the process utilized by SHM that includes the following two components: (1) advertisements to members of SHM and to the medical community at large through a variety of mechanisms including emails, websites, and social media outlets and (2) an online submission process that includes names of proposed speakers and their topic and, in the case of workshops, session objectives as well as an outline of the proposed workshop. SHM committees may also submit suggestions for topics and speakers. Annual Conference Committee members then review and rate submissions on the categories of topic, organization and clarity, objectives, and speaker qualifications (with a focus on institutional, geographic, and gender diversity). Scores are assigned from 1 to 5 (with 5 being the best score) for each category and a section for comments is available. All submissions are also evaluated by the course director.
After initial committee reviews, scores with marked reviewer discrepancies are rereviewed and discussed by the committee and course director. A cutoff score is then calculated with proposals falling below the cutoff threshold omitted from further consideration. Weekly calls are then focused on subcategories (ie tracks) with emphasis on clinical and educational content. Each of the tracks have a subcommittee with track leads to curate the best content first and then focus on final speaker selection. More recently, templates are shared with the track leads that include a location to call out gender and institutional diversity. Weekly calls are held to hone the content and determine the speakers.
For the purposes of this study, when the above process was not used, the authors refer to it as “closed call.” Closed call processes do not typically involve open invitations or a peer review process. (Table)
Gender
Gender was assigned based on the speaker’s self-identification by the pronouns used in their biography submitted to the conference or on their institutional website or other websites where the speaker was referenced. Persons using she/her/hers pronouns were noted as women and persons using he/him/his were noted as men. For the purposes of this study, we conceptualized gender as binary (ie woman/man) given the limited information we had from online sources.
ANALYSIS
REDCap, a secure, Web-based application for building and managing online survey and databases, was used to collect and manage all study data.9
All analyses were performed using SAS Enterprise Guide 8.1 (SAS Institute, Inc., Cary, North Carolina) using retrospectively collected data. A Cochran-Armitage test for trend was used to evaluate the proportion of women speakers from 2015 to 2019. A chi-square test was used to assess the proportion of women speakers for open call processes versus that seen with closed call. One-way analysis of variance (ANOVA) was used to evaluate annual conference evaluation scores from 2015 to 2019. Either numbers with proportions or means with standard deviations have been reported. Bonferroni’s correction for multiple comparisons was applied, with a P < .008 considered statistically significant.
RESULTS
Between 2015 and 2019, a total of 709 workshop and didactic presentations were given by 1,261 speakers at the annual Society of Hospital Medicine Conference. Of these, 505 (40%) were women; 756 (60%) were men. There were no missing data.
From 2015 to 2019, representation of women speakers increased from 35% of all speakers to 47% of all speakers (P = .0068). Women plenary speakers increased from 23% in 2015 to 45% in 2019 (P = .0396).
The proportion of women presenters for workshops (which have utilized an open call process throughout the study period), ranged from 43% to 53% from 2015 to 2019 with no statistically significant difference in gender distribution across years (Figure).
A greater proportion of speakers selected by an open call process were women compared to when speakers were selected by a closed call process (261 (47%) vs 244 (34%); P < .0001).
Of didactics or workshops given in a group format (N = 299), 82 (27%) were given by all-men groups and 38 (13%) were given by all-women groups. Women speakers participating in all-women group talks accounted for 21% of all women speakers; whereas men speakers participating in all-men group talks account for 26% of all men speakers (P = .02). We found that all-men group speaking opportunities did decrease from 41% of group talks in 2015 to 21% of group talks in 2019 (P = .0065).
We saw an average 3% annual increase in women speakers from 2015 to 2019, an 8% increase from 2018 to 2019 for all speakers, and an 11% increase in women speakers specific to didactic sessions. Overall conference ratings increased from a mean of 4.3 ± 0.24 in 2015 to a mean of 4.6 ± 0.14 in 2019 (n = 1,202; P < .0001; Figure).
DISCUSSION
The important findings of this study are that there has been an increase in women speakers over the last 5 years at the annual Society of Hospital Medicine Conference, that women had higher representation as speakers when open call processes were followed, and that conference scores continued to improve during the time frame studied. These findings suggest that a systematic open call process helps to support equitable speaking opportunities for men and women at a national hospital medicine conference without a negative impact on conference quality.
To recruit more diverse speakers, open call and peer review processes were used in addition to deliberate efforts at ensuring diversity in speakers. We found that over time, the proportion of women with speaking opportunities increased from 2015 to 2019. Interestingly, workshops, which had open call processes in place for the duration of the study period, had almost equal numbers of men and women presenting in all years. We also found that the number of all-men speaking groups decreased between 2015 and 2019.
A single process change can impact gender equity, but the target of true equity is expected to require additional measures such as assessment of committee structures and diversity, checklists, and reporting structures (data analysis and plans when goals not achieved).10-13 For instance, the American Society for Microbiology General Meeting was able to achieve gender equity in speakers by a multifold approach including ensuring the program committee was aware of gender statistics, increasing female representation among session convener teams, and direct instruction to try to avoid all-male sessions.11
It is important to acknowledge that these processes do require valuable resources including time. SHM has historically used committee volunteers to conduct the peer review process with each committee member reviewing 20 to 30 workshop submissions and 30 to 50 didactic sessions. While open processes with peer review seem to generate improved gender equity, ensuring processes are in place during the selection process is also key.
Several recent notable efforts to enhance gender equity and to increase diversity have been proposed. One such example of a process that may further improve gender equity was proposed by editors at the Journal of Hospital Medicine to assess current representation via demographics including gender, race, and ethnicity of authors with plans to assess patterns in the coming years.14 The American College of Physicians also published a position paper on achieving gender equity with a recommendation that organizational policies and procedures should be implemented that address implicit bias.15
Our study showed that, from 2015 to 2019, conference evaluations saw a significant increase in the score concurrently with the rise in proportion of women speakers. This finding suggests that quality does not seem to be affected by this new methodology for speaker selection and in fact this methodology may actually help improve the overall quality of the conference. To our knowledge, this is one of the first studies to concurrently evaluate speaker gender equity with conference quality.
Our study offers several strengths. This study took a pragmatic approach to understanding how processes can impact gender equity, and we were able to take advantage of the evolution of the open call system (ie workshops which have been an open call process for the duration of the study versus speaking opportunities that were not).
Our study also has several limitations. First, this study is retrospective in nature and thus other processes could have contributed to the improved gender equity, such as an organization’s priorities over time. During this study period, the SHM conference saw an average 3% increase annually in women speakers and an increase of 8% from 2018 to 2019 for all speakers compared to national trends of approximately 1%,6 which suggests that the open call processes in place could be contributing to the overall increases seen. Similarly, because of the retrospective nature of the study, we cannot be certain that the improvements in conference scores were directly the result of improved gender equity, although it does suggest that the improvements in gender equity did not have an adverse impact on the scores. We also did not assess how the composition of selection committee members for the meeting could have impacted the overall composition of the speakers. Our study looked at diversity only from the perspective of gender in a binary fashion, and thus additional studies are needed to assess how to improve diversity overall. It is unclear how this new open call for speakers affects race and ethnic diversity specifically. Identifying gender for the purposes of this study was facilitated by speakers providing their own biographies and the respective pronouns used in those biographies, and thus gender was easier to ascertain than race and ethnicity, which are not as readily available. For organizations to understand their diversity, equity, and inclusion efforts, enhancing the ability to fairly track and measure diversity will be key. Lastly, understanding of the exact composition of hospitalists from both a gender and race/ethnicity perspective is lacking. Studies have suggested that, based upon those surveyed or studied, there is a fairly equal balance of men and women albeit in academic groups.3
CONCLUSIONS
An open call approach to speakers at a national hospitalist conference seems to have contributed to improvements regarding gender equity in speaking opportunities with a concurrent improvement in overall rating of the conference. The open call system is a potential mechanism that other institutions and organizations could employ to enhance their diversity efforts.
Acknowledgments
Society of Hospital Medicine Diversity, Equity, Inclusion Special Interest Group
Work Group for SPEAK UP: Marisha Burden, MD, Daniel Cabrera, MD, Amira del Pino-Jones, MD, Areeba Kara, MD, Angela Keniston, MSPH, Keshav Khanijow, MD, Flora Kisuule, MD, Chiara Mandel, Benji Mathews, MD, David Paje, MD, Stephan Papp, MD, Snehal Patel, MD, Suchita Shah Sata, MD, Dustin Smith, MD, Kevin Vuernick
1. Weaver AC, Wetterneck TB, Whelan CT, Hinami K. A matter of priorities? Exploring the persistent gender pay gap in hospital medicine. J Hosp Med. 2015;10(8):486-490. https://doi.org/10.1002/jhm.2400.
2. Jena AB, Olenski AR, Blumenthal DM. Sex differences in physician salary in US public medical schools. JAMA Intern Med. 2016;176(9):1294-1304. https://doi.org/10.1001/jamainternmed.2016.3284.
3. Burden M, Frank MG, Keniston A, et al. Gender disparities in leadership and scholarly productivity of academic hospitalists. J Hosp Med. 2015;10(8):481-485. https://doi.org/10.1002/jhm.2340.
4. Silver JK, Ghalib R, Poorman JA, et al. Analysis of gender equity in leadership of physician-focused medical specialty societies, 2008-2017. JAMA Intern Med. 2019;179(3):433-435. https://doi.org/10.1001/jamainternmed.2018.5303.
5. Jena AB, Khullar D, Ho O, Olenski AR, Blumenthal DM. Sex differences in academic rank in US medical schools in 2014. JAMA. 2015;314(11):1149-1158. https://doi.org/10.1001/jama.2015.10680.
6. Ruzycki SM, Fletcher S, Earp M, Bharwani A, Lithgow KC. Trends in the Proportion of Female Speakers at Medical Conferences in the United States and in Canada, 2007 to 2017. JAMA Netw Open. 2019;2(4):e192103. https://doi.org/10.1001/jamanetworkopen.2019.2103
7. Reid MB, Misky GJ, Harrison RA, Sharpe B, Auerbach A, Glasheen JJ. Mentorship, productivity, and promotion among academic hospitalists. J Gen Intern Med. 2012;27(1):23-27. https://doi.org/10.1007/s11606-011-1892-5.
8. Today’s Hospitalist 2018 Compensation and Career Survey Results. https://www.todayshospitalist.com/salary-survey-results/. Accessed September 28, 2019.
9. Harris PA, Taylor R, Thielke R, Payne J, Gonzalez N, Conde JG. Research electronic data capture (REDCap)--a metadata-driven methodology and workflow process for providing translational research informatics support. J Biomed Inform. 2009;42(2):377-381. https://doi.org/10.1016/j.jbi.2008.08.010.
10. Burden M, del Pino-Jones A, Shafer M, Sheth S, Rexrode K. Association of American Medical Colleagues (AAMC) Group on Women in Medicine and Science. Recruitment Toolkit: https://www.aamc.org/download/492864/data/equityinrecruitmenttoolkit.pdf. Accessed July 27, 2019.
11. Casadevall A. Achieving speaker gender equity at the american society for microbiology general meeting. MBio. 2015;6:e01146. https://doi.org/10.1128/mBio.01146-15.
12. Westring A, McDonald JM, Carr P, Grisso JA. An integrated framework for gender equity in academic medicine. Acad Med. 2016;91(8):1041-1044. https://doi.org/10.1097/ACM.0000000000001275.
13. Martin JL. Ten simple rules to achieve conference speaker gender balance. PLoS Comput Biol. 2014;10(11):e1003903. https://doi.org/10.1371/journal.pcbi.1003903.
14. Shah SS, Shaughnessy EE, Spector ND. Leading by example: how medical journals can improve representation in academic medicine. J Hosp Med. 2019;14(7):393. https://doi.org/10.12788/jhm.3247.
15. Butkus R, Serchen J, Moyer DV, et al. Achieving gender equity in physician compensation and career advancement: a position paper of the American College of Physicians. Ann Intern Med. 2018;168:721-723. https://doi.org/10.7326/M17-3438.
1. Weaver AC, Wetterneck TB, Whelan CT, Hinami K. A matter of priorities? Exploring the persistent gender pay gap in hospital medicine. J Hosp Med. 2015;10(8):486-490. https://doi.org/10.1002/jhm.2400.
2. Jena AB, Olenski AR, Blumenthal DM. Sex differences in physician salary in US public medical schools. JAMA Intern Med. 2016;176(9):1294-1304. https://doi.org/10.1001/jamainternmed.2016.3284.
3. Burden M, Frank MG, Keniston A, et al. Gender disparities in leadership and scholarly productivity of academic hospitalists. J Hosp Med. 2015;10(8):481-485. https://doi.org/10.1002/jhm.2340.
4. Silver JK, Ghalib R, Poorman JA, et al. Analysis of gender equity in leadership of physician-focused medical specialty societies, 2008-2017. JAMA Intern Med. 2019;179(3):433-435. https://doi.org/10.1001/jamainternmed.2018.5303.
5. Jena AB, Khullar D, Ho O, Olenski AR, Blumenthal DM. Sex differences in academic rank in US medical schools in 2014. JAMA. 2015;314(11):1149-1158. https://doi.org/10.1001/jama.2015.10680.
6. Ruzycki SM, Fletcher S, Earp M, Bharwani A, Lithgow KC. Trends in the Proportion of Female Speakers at Medical Conferences in the United States and in Canada, 2007 to 2017. JAMA Netw Open. 2019;2(4):e192103. https://doi.org/10.1001/jamanetworkopen.2019.2103
7. Reid MB, Misky GJ, Harrison RA, Sharpe B, Auerbach A, Glasheen JJ. Mentorship, productivity, and promotion among academic hospitalists. J Gen Intern Med. 2012;27(1):23-27. https://doi.org/10.1007/s11606-011-1892-5.
8. Today’s Hospitalist 2018 Compensation and Career Survey Results. https://www.todayshospitalist.com/salary-survey-results/. Accessed September 28, 2019.
9. Harris PA, Taylor R, Thielke R, Payne J, Gonzalez N, Conde JG. Research electronic data capture (REDCap)--a metadata-driven methodology and workflow process for providing translational research informatics support. J Biomed Inform. 2009;42(2):377-381. https://doi.org/10.1016/j.jbi.2008.08.010.
10. Burden M, del Pino-Jones A, Shafer M, Sheth S, Rexrode K. Association of American Medical Colleagues (AAMC) Group on Women in Medicine and Science. Recruitment Toolkit: https://www.aamc.org/download/492864/data/equityinrecruitmenttoolkit.pdf. Accessed July 27, 2019.
11. Casadevall A. Achieving speaker gender equity at the american society for microbiology general meeting. MBio. 2015;6:e01146. https://doi.org/10.1128/mBio.01146-15.
12. Westring A, McDonald JM, Carr P, Grisso JA. An integrated framework for gender equity in academic medicine. Acad Med. 2016;91(8):1041-1044. https://doi.org/10.1097/ACM.0000000000001275.
13. Martin JL. Ten simple rules to achieve conference speaker gender balance. PLoS Comput Biol. 2014;10(11):e1003903. https://doi.org/10.1371/journal.pcbi.1003903.
14. Shah SS, Shaughnessy EE, Spector ND. Leading by example: how medical journals can improve representation in academic medicine. J Hosp Med. 2019;14(7):393. https://doi.org/10.12788/jhm.3247.
15. Butkus R, Serchen J, Moyer DV, et al. Achieving gender equity in physician compensation and career advancement: a position paper of the American College of Physicians. Ann Intern Med. 2018;168:721-723. https://doi.org/10.7326/M17-3438.
© 2020 Society of Hospital Medicine
What I Learned From SARS in 2003 That Will Help Me Cope With COVID-19 in 2020
On March 25, 2003, I was in Vancouver at my niece’s bat mitzvah when I saw a picture of my hospital in Toronto on the television news; a story about SARS patients in Toronto. Until then, SARS had been a distant event happening in mainland China and Hong Kong; it had been something that seemed very far away and theoretical. When I returned to Toronto, we had clusters of cases in several hospitals and healthcare workers were falling ill. I was the Physician in Chief at one of those hospitals and was responsible for the clinical care delivered by physicians in the Department of Medicine. So the burden of figuring out what we were going to do fell on me and the other members of the hospital leadership team.
SARS IN 2003
As the outbreak evolved, we only knew a few things. It was a respiratory infection, likely viral, with a very high mortality rate, compared with most other viral respiratory infections. We learned the hard way that, while it was mostly transmitted by droplets, some patients were able to widely transmit it through the air, and therefore likely through ventilation systems. We knew that most infections were occurring in hospitals but there was also community spread at events like funerals. We had no test to confirm the presence of the virus and, indeed, only figured out it was a coronavirus well into the outbreak. Diagnoses were made using clinical criteria; this uncertainty was a major source of anxiety about potential community spread without direct links to known cases. We had no idea how long it was going to last, nor did we know how it would end. We were entering uncharted territory.
Decisions had to be made. Which patients needed isolation, and which did not? We made mistakes early on that caused hundreds of healthcare workers and people to be quarantined (complete isolation) for 10 days; this was a difficult situation for them, their families, and the people who had to replace them in the workplace.
Within a very short period we changed our way of life in hospitals. We screened everyone who entered with questionnaires and measured their temperatures. Once entering the hospital, we all wore N95 masks in public spaces and when in a room with another person—not just patients. We all got sore throats from wearing the masks 10 hours a day. All patients were placed in respiratory precautions, which meant that, any time we entered their rooms, we had to don all the personal protective equipment (PPE). Yet we didn’t run out of supplies. When a member of a provincial leadership team fell ill with SARS shortly after attending an in-person meeting of the committee, all the other members went into quarantine. As a result, we stopped having leadership team meetings in person, and mostly stayed in our own offices, communicating by phone and email.
The hospital took on a bizarre atmosphere: everyone in masks and little face-to-face contact. Yet outside the hospital, life went on mostly as normal. Some people wore masks on the street, but public events and businesses stayed open. Some healthcare workers were shunned in the community out of fear. But I went to another bat mitzvah and even a Stanley Cup playoff game at the height of the outbreak. Only healthcare workers were asked to stop meeting in large groups. The contrast for me was striking.
The Ontario Ministry of Health started a daily noon hour phone conference call; one physician and one administrator from every hospital in the province were on the call. I attended those for my hospital and, because I knew or taught many of the people on the line, was quickly asked to chair the calls. They were incredibly important and were a source of information exchange and emotional support for all of us. Before each call, I spoke with a person from Toronto Public Health who updated me on the number of cases and deaths. I needed to absorb that information before the calls to maintain my composure when she told the rest of the group. At times I could hear the fear in people’s voices as they described the clinical course of their patients.
Because I chaired the calls, I was asked to coordinate the study that documented the clinical outcomes of all the patients in the hopes that we could distinguish it from other common respiratory syndromes. With the help of my colleagues in the 11 hospitals that treated SARS patients, the ethics review boards, medical records personnel who copied the charts, Christopher Booth, MD, (a second- year resident at the time who headed the study), and a few medical students we were able to go from the idea to do the study to electronic publication in JAMA in 30 days.1 It was JAMA’s first experience with rapid review, and the editors there were very helpful. Working on this study was very therapeutic; it allowed me to feel I was doing something that could help.
I was scared—both for my own health and the health of my family, but also terribly frightened for the health of the people who worked here. When I went home every night, I looked at the people on the street and wondered how many would still be there a few months later. And then it all ended. (Actually, it ended twice; we let up a bit too early because we so wanted it to be over.)
COVID-19 IN 2020
The COVID-19 pandemic has many similarities, but there are also significant differences. The most obvious is that because there is more community spread, life outside the hospital is much more severely disrupted. Countries have responded by sliding into more and more practices that try to limit person-to-person spread. First travel restrictions from other countries, then moral suasion to promote social distancing (which is really just physical distancing), then closing schools and nonessential businesses, and finally complete lock downs.
These events have spurred panic buying of some items (hand sanitizer, toilet paper, masks), and the fear of major disruptions of the supply chain for things like food. SARS was much more limited in its overall economic effect, though the WHO precautionary travel advisory against nonessential travel to Toronto, which lasted for only 1 week, resulted in a long-lasting reduction in tourism and a hit to the theatre business in our city.
The internet and social media have made it easier to disseminate valuable information and instructions, while at the same time easier to spread false information. But we had a lot of false information during SARS, too. One of the biggest differences for the United States (which was almost unaffected by SARS) is that the current extreme political divide creates two separate tracks of information and beliefs. A united message is very important.
Finally, the shortage of PPE in some jurisdictions, which was not an issue in Toronto during SARS, has severely heightened the fear for healthcare workers. In 2003, we also had lots of discussion about the tension between our professional duty and the safety of healthcare workers and their families (many of us separated ourselves from our families in our own homes while working clinically). To my recollection, two nurses and one physician died of SARS in Toronto. But when hospitals actually run out of PPE—something that is happening with COVID-19—those discussions take on a much more ominous tone.
LESSONS LEARNED
In my opinion, SARS was a dry run for us in Toronto and the other places in the world that it affected (Taiwan, Hong Kong, Singapore); one that helped us prepare in advance and will help us cope with COVID-19. But what did I personally learn from my SARS experience?
First, I learned that accurate information in these kinds of situations is hard to come by. We heard lots of rumors from people all over the world. But when I found that it was very difficult for me to figure out exactly what was going on in my own hospital (eg, who was in contact with people who fell ill or went into quarantine, how patients were faring), I realized that figuring out what was happening half way around the world from news reports was near impossible. I learned to wait for official announcements.
Second, I learned that talking to my colleagues was both therapeutic—providing emotional support and an outlet for feelings—and anxiety provoking when we overreacted to rumors.
Third, I learned that, like others, I was susceptible to exhibiting obsessive behaviors in an attempt to establish control over uncertainty. Constantly washing my hands, checking my temperature, and seeking reassuring facts from others only worked to calm me for a few minutes. And then I felt the need to do it again. This time I find myself checking my twitter account constantly; half afraid I will see something frightening, half looking for good news from people I trust. I now recognize this behavior and it helps me contain it.
Fourth, I learned that events that occurred remotely had much less effect on everyone than those that occurred close by. Having two people I knew get SARS, and then learning they recovered was perhaps the most meaningful event for me during the entire episode.
Finally, I learned that in the end I and the people I care about survived—nothing bad happened to us. The world did not end after SARS. It took me about a year, including some time with a terrific psychiatrist, to realize I was safe after all. And that realization is what I am most hanging on to today.
Acknowledgments
Sanjay Saint (University of Michigan), Christopher Booth (Queens University), and Sagar Rohailla (University of Toronto) provided comments on an earlier draft. None were compensated for doing so.
1. Booth C, Matukas LM, Tomlinson GA, et al. Clinical features and short-term outcomes of 144 patients with SARS in the greater Toronto area. JAMA. 2003;289(21):2801-2809. https://doi.org/10.1001/jama.289.21.JOC30885.
On March 25, 2003, I was in Vancouver at my niece’s bat mitzvah when I saw a picture of my hospital in Toronto on the television news; a story about SARS patients in Toronto. Until then, SARS had been a distant event happening in mainland China and Hong Kong; it had been something that seemed very far away and theoretical. When I returned to Toronto, we had clusters of cases in several hospitals and healthcare workers were falling ill. I was the Physician in Chief at one of those hospitals and was responsible for the clinical care delivered by physicians in the Department of Medicine. So the burden of figuring out what we were going to do fell on me and the other members of the hospital leadership team.
SARS IN 2003
As the outbreak evolved, we only knew a few things. It was a respiratory infection, likely viral, with a very high mortality rate, compared with most other viral respiratory infections. We learned the hard way that, while it was mostly transmitted by droplets, some patients were able to widely transmit it through the air, and therefore likely through ventilation systems. We knew that most infections were occurring in hospitals but there was also community spread at events like funerals. We had no test to confirm the presence of the virus and, indeed, only figured out it was a coronavirus well into the outbreak. Diagnoses were made using clinical criteria; this uncertainty was a major source of anxiety about potential community spread without direct links to known cases. We had no idea how long it was going to last, nor did we know how it would end. We were entering uncharted territory.
Decisions had to be made. Which patients needed isolation, and which did not? We made mistakes early on that caused hundreds of healthcare workers and people to be quarantined (complete isolation) for 10 days; this was a difficult situation for them, their families, and the people who had to replace them in the workplace.
Within a very short period we changed our way of life in hospitals. We screened everyone who entered with questionnaires and measured their temperatures. Once entering the hospital, we all wore N95 masks in public spaces and when in a room with another person—not just patients. We all got sore throats from wearing the masks 10 hours a day. All patients were placed in respiratory precautions, which meant that, any time we entered their rooms, we had to don all the personal protective equipment (PPE). Yet we didn’t run out of supplies. When a member of a provincial leadership team fell ill with SARS shortly after attending an in-person meeting of the committee, all the other members went into quarantine. As a result, we stopped having leadership team meetings in person, and mostly stayed in our own offices, communicating by phone and email.
The hospital took on a bizarre atmosphere: everyone in masks and little face-to-face contact. Yet outside the hospital, life went on mostly as normal. Some people wore masks on the street, but public events and businesses stayed open. Some healthcare workers were shunned in the community out of fear. But I went to another bat mitzvah and even a Stanley Cup playoff game at the height of the outbreak. Only healthcare workers were asked to stop meeting in large groups. The contrast for me was striking.
The Ontario Ministry of Health started a daily noon hour phone conference call; one physician and one administrator from every hospital in the province were on the call. I attended those for my hospital and, because I knew or taught many of the people on the line, was quickly asked to chair the calls. They were incredibly important and were a source of information exchange and emotional support for all of us. Before each call, I spoke with a person from Toronto Public Health who updated me on the number of cases and deaths. I needed to absorb that information before the calls to maintain my composure when she told the rest of the group. At times I could hear the fear in people’s voices as they described the clinical course of their patients.
Because I chaired the calls, I was asked to coordinate the study that documented the clinical outcomes of all the patients in the hopes that we could distinguish it from other common respiratory syndromes. With the help of my colleagues in the 11 hospitals that treated SARS patients, the ethics review boards, medical records personnel who copied the charts, Christopher Booth, MD, (a second- year resident at the time who headed the study), and a few medical students we were able to go from the idea to do the study to electronic publication in JAMA in 30 days.1 It was JAMA’s first experience with rapid review, and the editors there were very helpful. Working on this study was very therapeutic; it allowed me to feel I was doing something that could help.
I was scared—both for my own health and the health of my family, but also terribly frightened for the health of the people who worked here. When I went home every night, I looked at the people on the street and wondered how many would still be there a few months later. And then it all ended. (Actually, it ended twice; we let up a bit too early because we so wanted it to be over.)
COVID-19 IN 2020
The COVID-19 pandemic has many similarities, but there are also significant differences. The most obvious is that because there is more community spread, life outside the hospital is much more severely disrupted. Countries have responded by sliding into more and more practices that try to limit person-to-person spread. First travel restrictions from other countries, then moral suasion to promote social distancing (which is really just physical distancing), then closing schools and nonessential businesses, and finally complete lock downs.
These events have spurred panic buying of some items (hand sanitizer, toilet paper, masks), and the fear of major disruptions of the supply chain for things like food. SARS was much more limited in its overall economic effect, though the WHO precautionary travel advisory against nonessential travel to Toronto, which lasted for only 1 week, resulted in a long-lasting reduction in tourism and a hit to the theatre business in our city.
The internet and social media have made it easier to disseminate valuable information and instructions, while at the same time easier to spread false information. But we had a lot of false information during SARS, too. One of the biggest differences for the United States (which was almost unaffected by SARS) is that the current extreme political divide creates two separate tracks of information and beliefs. A united message is very important.
Finally, the shortage of PPE in some jurisdictions, which was not an issue in Toronto during SARS, has severely heightened the fear for healthcare workers. In 2003, we also had lots of discussion about the tension between our professional duty and the safety of healthcare workers and their families (many of us separated ourselves from our families in our own homes while working clinically). To my recollection, two nurses and one physician died of SARS in Toronto. But when hospitals actually run out of PPE—something that is happening with COVID-19—those discussions take on a much more ominous tone.
LESSONS LEARNED
In my opinion, SARS was a dry run for us in Toronto and the other places in the world that it affected (Taiwan, Hong Kong, Singapore); one that helped us prepare in advance and will help us cope with COVID-19. But what did I personally learn from my SARS experience?
First, I learned that accurate information in these kinds of situations is hard to come by. We heard lots of rumors from people all over the world. But when I found that it was very difficult for me to figure out exactly what was going on in my own hospital (eg, who was in contact with people who fell ill or went into quarantine, how patients were faring), I realized that figuring out what was happening half way around the world from news reports was near impossible. I learned to wait for official announcements.
Second, I learned that talking to my colleagues was both therapeutic—providing emotional support and an outlet for feelings—and anxiety provoking when we overreacted to rumors.
Third, I learned that, like others, I was susceptible to exhibiting obsessive behaviors in an attempt to establish control over uncertainty. Constantly washing my hands, checking my temperature, and seeking reassuring facts from others only worked to calm me for a few minutes. And then I felt the need to do it again. This time I find myself checking my twitter account constantly; half afraid I will see something frightening, half looking for good news from people I trust. I now recognize this behavior and it helps me contain it.
Fourth, I learned that events that occurred remotely had much less effect on everyone than those that occurred close by. Having two people I knew get SARS, and then learning they recovered was perhaps the most meaningful event for me during the entire episode.
Finally, I learned that in the end I and the people I care about survived—nothing bad happened to us. The world did not end after SARS. It took me about a year, including some time with a terrific psychiatrist, to realize I was safe after all. And that realization is what I am most hanging on to today.
Acknowledgments
Sanjay Saint (University of Michigan), Christopher Booth (Queens University), and Sagar Rohailla (University of Toronto) provided comments on an earlier draft. None were compensated for doing so.
On March 25, 2003, I was in Vancouver at my niece’s bat mitzvah when I saw a picture of my hospital in Toronto on the television news; a story about SARS patients in Toronto. Until then, SARS had been a distant event happening in mainland China and Hong Kong; it had been something that seemed very far away and theoretical. When I returned to Toronto, we had clusters of cases in several hospitals and healthcare workers were falling ill. I was the Physician in Chief at one of those hospitals and was responsible for the clinical care delivered by physicians in the Department of Medicine. So the burden of figuring out what we were going to do fell on me and the other members of the hospital leadership team.
SARS IN 2003
As the outbreak evolved, we only knew a few things. It was a respiratory infection, likely viral, with a very high mortality rate, compared with most other viral respiratory infections. We learned the hard way that, while it was mostly transmitted by droplets, some patients were able to widely transmit it through the air, and therefore likely through ventilation systems. We knew that most infections were occurring in hospitals but there was also community spread at events like funerals. We had no test to confirm the presence of the virus and, indeed, only figured out it was a coronavirus well into the outbreak. Diagnoses were made using clinical criteria; this uncertainty was a major source of anxiety about potential community spread without direct links to known cases. We had no idea how long it was going to last, nor did we know how it would end. We were entering uncharted territory.
Decisions had to be made. Which patients needed isolation, and which did not? We made mistakes early on that caused hundreds of healthcare workers and people to be quarantined (complete isolation) for 10 days; this was a difficult situation for them, their families, and the people who had to replace them in the workplace.
Within a very short period we changed our way of life in hospitals. We screened everyone who entered with questionnaires and measured their temperatures. Once entering the hospital, we all wore N95 masks in public spaces and when in a room with another person—not just patients. We all got sore throats from wearing the masks 10 hours a day. All patients were placed in respiratory precautions, which meant that, any time we entered their rooms, we had to don all the personal protective equipment (PPE). Yet we didn’t run out of supplies. When a member of a provincial leadership team fell ill with SARS shortly after attending an in-person meeting of the committee, all the other members went into quarantine. As a result, we stopped having leadership team meetings in person, and mostly stayed in our own offices, communicating by phone and email.
The hospital took on a bizarre atmosphere: everyone in masks and little face-to-face contact. Yet outside the hospital, life went on mostly as normal. Some people wore masks on the street, but public events and businesses stayed open. Some healthcare workers were shunned in the community out of fear. But I went to another bat mitzvah and even a Stanley Cup playoff game at the height of the outbreak. Only healthcare workers were asked to stop meeting in large groups. The contrast for me was striking.
The Ontario Ministry of Health started a daily noon hour phone conference call; one physician and one administrator from every hospital in the province were on the call. I attended those for my hospital and, because I knew or taught many of the people on the line, was quickly asked to chair the calls. They were incredibly important and were a source of information exchange and emotional support for all of us. Before each call, I spoke with a person from Toronto Public Health who updated me on the number of cases and deaths. I needed to absorb that information before the calls to maintain my composure when she told the rest of the group. At times I could hear the fear in people’s voices as they described the clinical course of their patients.
Because I chaired the calls, I was asked to coordinate the study that documented the clinical outcomes of all the patients in the hopes that we could distinguish it from other common respiratory syndromes. With the help of my colleagues in the 11 hospitals that treated SARS patients, the ethics review boards, medical records personnel who copied the charts, Christopher Booth, MD, (a second- year resident at the time who headed the study), and a few medical students we were able to go from the idea to do the study to electronic publication in JAMA in 30 days.1 It was JAMA’s first experience with rapid review, and the editors there were very helpful. Working on this study was very therapeutic; it allowed me to feel I was doing something that could help.
I was scared—both for my own health and the health of my family, but also terribly frightened for the health of the people who worked here. When I went home every night, I looked at the people on the street and wondered how many would still be there a few months later. And then it all ended. (Actually, it ended twice; we let up a bit too early because we so wanted it to be over.)
COVID-19 IN 2020
The COVID-19 pandemic has many similarities, but there are also significant differences. The most obvious is that because there is more community spread, life outside the hospital is much more severely disrupted. Countries have responded by sliding into more and more practices that try to limit person-to-person spread. First travel restrictions from other countries, then moral suasion to promote social distancing (which is really just physical distancing), then closing schools and nonessential businesses, and finally complete lock downs.
These events have spurred panic buying of some items (hand sanitizer, toilet paper, masks), and the fear of major disruptions of the supply chain for things like food. SARS was much more limited in its overall economic effect, though the WHO precautionary travel advisory against nonessential travel to Toronto, which lasted for only 1 week, resulted in a long-lasting reduction in tourism and a hit to the theatre business in our city.
The internet and social media have made it easier to disseminate valuable information and instructions, while at the same time easier to spread false information. But we had a lot of false information during SARS, too. One of the biggest differences for the United States (which was almost unaffected by SARS) is that the current extreme political divide creates two separate tracks of information and beliefs. A united message is very important.
Finally, the shortage of PPE in some jurisdictions, which was not an issue in Toronto during SARS, has severely heightened the fear for healthcare workers. In 2003, we also had lots of discussion about the tension between our professional duty and the safety of healthcare workers and their families (many of us separated ourselves from our families in our own homes while working clinically). To my recollection, two nurses and one physician died of SARS in Toronto. But when hospitals actually run out of PPE—something that is happening with COVID-19—those discussions take on a much more ominous tone.
LESSONS LEARNED
In my opinion, SARS was a dry run for us in Toronto and the other places in the world that it affected (Taiwan, Hong Kong, Singapore); one that helped us prepare in advance and will help us cope with COVID-19. But what did I personally learn from my SARS experience?
First, I learned that accurate information in these kinds of situations is hard to come by. We heard lots of rumors from people all over the world. But when I found that it was very difficult for me to figure out exactly what was going on in my own hospital (eg, who was in contact with people who fell ill or went into quarantine, how patients were faring), I realized that figuring out what was happening half way around the world from news reports was near impossible. I learned to wait for official announcements.
Second, I learned that talking to my colleagues was both therapeutic—providing emotional support and an outlet for feelings—and anxiety provoking when we overreacted to rumors.
Third, I learned that, like others, I was susceptible to exhibiting obsessive behaviors in an attempt to establish control over uncertainty. Constantly washing my hands, checking my temperature, and seeking reassuring facts from others only worked to calm me for a few minutes. And then I felt the need to do it again. This time I find myself checking my twitter account constantly; half afraid I will see something frightening, half looking for good news from people I trust. I now recognize this behavior and it helps me contain it.
Fourth, I learned that events that occurred remotely had much less effect on everyone than those that occurred close by. Having two people I knew get SARS, and then learning they recovered was perhaps the most meaningful event for me during the entire episode.
Finally, I learned that in the end I and the people I care about survived—nothing bad happened to us. The world did not end after SARS. It took me about a year, including some time with a terrific psychiatrist, to realize I was safe after all. And that realization is what I am most hanging on to today.
Acknowledgments
Sanjay Saint (University of Michigan), Christopher Booth (Queens University), and Sagar Rohailla (University of Toronto) provided comments on an earlier draft. None were compensated for doing so.
1. Booth C, Matukas LM, Tomlinson GA, et al. Clinical features and short-term outcomes of 144 patients with SARS in the greater Toronto area. JAMA. 2003;289(21):2801-2809. https://doi.org/10.1001/jama.289.21.JOC30885.
1. Booth C, Matukas LM, Tomlinson GA, et al. Clinical features and short-term outcomes of 144 patients with SARS in the greater Toronto area. JAMA. 2003;289(21):2801-2809. https://doi.org/10.1001/jama.289.21.JOC30885.
© 2020 Society of Hospital Medicine
Clinical Progress Note: Perioperative Pain Control in Hospitalized Pediatric Patients
Pediatric hospitalists play an increasingly significant role in perioperative pain management.1 Advances in pediatric surgical comanagement may improve quality of care and reduce the length of hospitalization.2 This review is based on queries of the PubMed and Cochrane databases between January 1, 2014, and July 15, 2019, using the search terms “perioperative pain management,” “postoperative pain,” “pediatric,” and “children.” In addition, the authors reviewed key position statements from the American Academy of Pediatrics (AAP), the American Pain Society (APS), the Centers for Disease Control and Prevention (CDC), and the Society of Hospital Medicine (SHM) regarding pain management.3 This update is intended to be relevant for practicing pediatric hospitalists, with a focus on recently expanded options for pain management and judicious opioid use in hospitalized children.
PERIOPERATIVE PAIN MANAGEMENT
Postoperative pain management begins preoperatively according to the concept of the perioperative surgical home (PSH).4 The preoperative history should identify the patient’s previous positive (eg, good pain control) and negative (eg, adverse reactions) experiences with pain medications. Family and patient expectations should be discussed regarding types and sources of pain, pain duration, exacerbating/alleviating factors, and modalities available for realistic pain control because preoperative information can limit anxiety and improve outcomes. Pain specialists can perform risk assessments preoperatively and develop plans to address pharmacologic tolerance, withdrawal, and opioid-induced hyperalgesia after surgery.5 Children with chronic pain and on preoperative opioids may require more analgesia for a longer duration postoperatively. Early recognition of variability of patient’s pain perception and differences in responses to pain need to be clearly communicated across the disciplines in a collaborative model of care.
Children with medical complexity and/or cognitive, emotional, or behavioral impairments may benefit from preoperative psychosocial treatments and utilization of pain self-management training and strategies that could further reduce anxiety and optimize postoperative care because patient and parental preoperative anxiety may be associated with adverse outcomes. Validated pain assessment tools like Revised FLACC (Face, Leg, Activity, Cry, and Consolability) Scale and Individualized Numeric Rating Scale could be particularly useful in children with limitations in communication or altered pain perception; therefore, medical teams and family members should discuss their utilization preoperatively.
MULTIMODAL ANALGESIA
Multimodal analgesia (MMA) is a strategy that synergistically uses pharmacologic and nonpharmacologic modalities to target pain at multiple points of the pain processing pathway (Table).6 MMA can optimize pain control by addressing different types of pain (eg, incisional pain, muscle spasm, or neuropathic pain), expedite recovery, reduce potential pharmacologic side effects, and decrease opioid consumption. Patients taking opioids are at an increased risk of developing opioid-related side effects such as respiratory depression, medication tolerance, and anxiety, with resultant longer hospital stay, increased readmissions, and higher costs of care.7 Treatment for postoperative pain should prioritize appropriately dosed and precisely scheduled MMA before opioid-focused analgesia with the goals of decreasing opioid-related adverse effects, intentional misuse, diversion, and accidental ingestions. The AAP, APS, CDC, and SHM endorse the use of MMA and recommend nonpharmacologic measures and regional anesthesia.8,9 The most used modalities in MMA are discussed below.
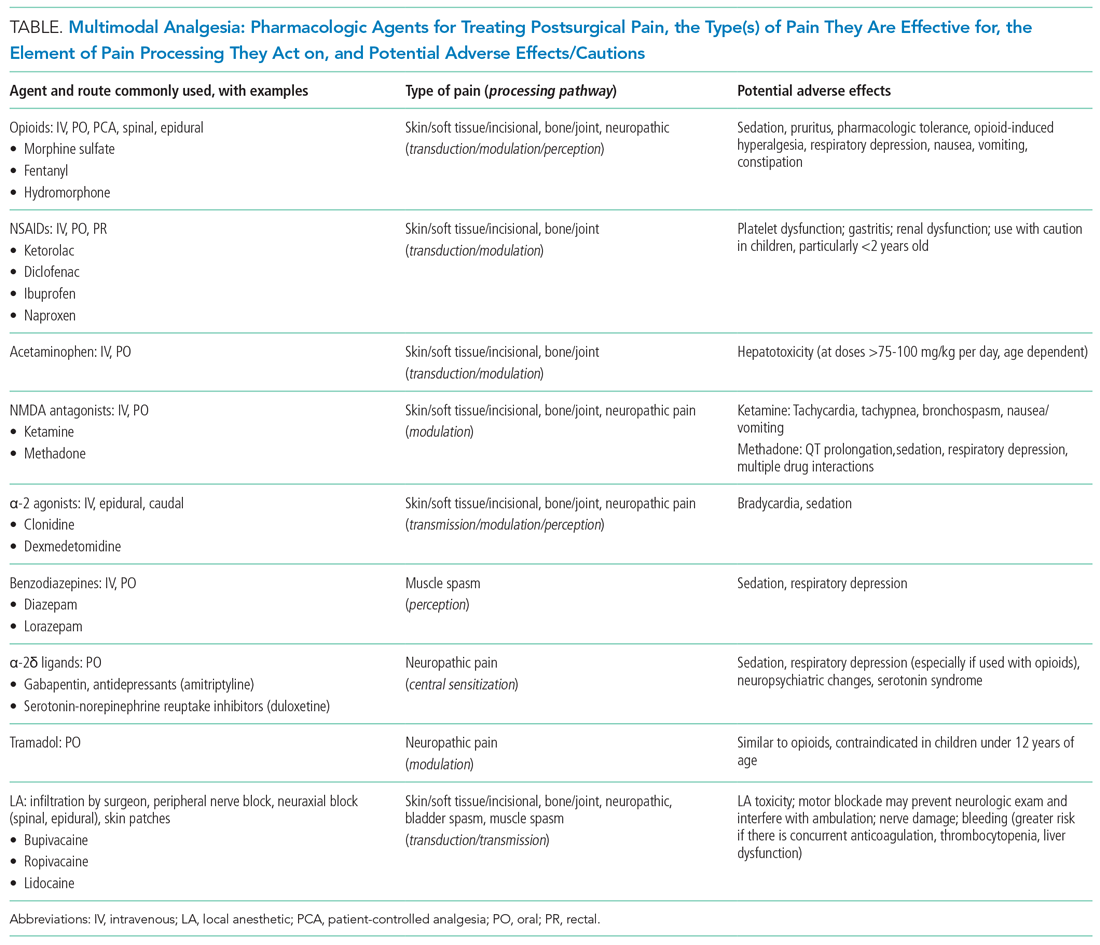
Acetaminophen
Acetaminophen has central-acting analgesic and antipyretic properties and readily crosses the blood brain barrier, which makes it particularly useful in spine and neurological surgeries. Oral administration is preferred when feasible. The AAP recommends refraining from rectal administration of acetaminophen as analgesia in children because of concerns about toxic effects and erratic, variable absorption.10 A systematic review of six studies found no benefit in pain control between intravenous (IV) and oral (PO) administration of acetaminophen in adults.11 There is a paucity of studies in children comparing PO with IV acetaminophen perioperative efficacy. Children may benefit from IV formulations in the early postoperative period, in cases with frequent nausea and vomiting, and in those with oral medication intolerance. Since infants have greater risk of respiratory depression from opioids, IV acetaminophen may have utility in this age group. Because of the cost associated with IV formulation, some institutions restrict IV acetaminophen. However, rapidly well-controlled pain and minimization of opioid-related side effects with shorter hospital stays may lower healthcare costs despite the cost of acetaminophen itself.
NSAIDs
NSAIDs possess anti-inflammatory properties through the inhibition of cyclooxygenase and blockade of prostaglandin production. NSAID risks include bleeding, renal and gastrointestinal toxicities, and potentially delayed wound and bone healing. Ketorolac is an NSAID that continues to be widely used with demonstrated opioid-sparing effects. Many retrospective studies including large numbers of pediatric patients have not demonstrated increased risks of bleeding nor poor wound healing with short postoperative use. A Cochrane review, however, concluded that there is insufficient data to either support or reject the efficacy or safety of ketorolac for postoperative pain treatment in children, mostly because of the very low quality of evidence.12
Regional Anesthesia
Regional anesthesia, which includes central (spinal/epidural/caudal) and peripheral blocks, decreases postoperative pain and opioid-associated side effects. Blocks typically consist of local anesthetic with or without the addition of adjuncts (eg, clonidine, dexamethasone). Regional anesthesia may also improve pulmonary function, compared with that of nonregional MMA use, in patients who have thoracic or upper abdominal surgeries. While having broad applications, the utility of regional anesthesia is greatest in preterm infants/neonates and in those with underlying respiratory pathology. A systematic review of randomized controlled trials demonstrated that regional anesthesia decreased opioid consumption and minimized postoperative pain with no significant complications attributed to its use.13 Additional studies are needed to better delineate specific surgical procedures and subpopulations of pediatric patients in which regional anesthesia may provide the most benefit.
Gabapentinoids
Children receiving gabapentinoids perioperatively have been shown to have fewer adverse reactions, decreased opioid consumption, and less anxiety, as well as improved pain scores. Gabapentin is increasingly being utilized for children with idiopathic scoliosis undergoing posterior spinal fusion, and there is some evidence for improving pain control and reducing opioid use. However, a recent systematic review found a paucity of data supporting its clinical use.14 Both gabapentin and pregabalin may further increase risks of respiratory depression, especially in synergy with opioids and benzodiazepines.
Opioids
Opioids should be used with caution in pediatric patients and are reserved primarily for the management of severe acute pain. The shortest duration of the lowest effective dose of opioids should be encouraged. Patient-controlled opioid analgesia (PCA) offers benefits when parenteral postoperative analgesia is indicated: It maximizes pain relief, minimizes risk of overdose, and improves psychological well-being through self-administration of pain medicines. Basal-infusion PCA should not be routinely used because it is associated with nausea, vomiting, and respiratory depression without having superior analgesia compared with demand use only. Monitoring of side stream end-tidal capnography can readily detect respiratory depression, especially if opioids, benzodiazepines, gabapentinoids, and diphenhydramine are used concomitantly. Patient education regarding opioid use, side effects, safe storage, and disposal practices is imperative because significant amounts of opioids remain in households after completion of treatment for pain and because opioid diversion and accidental ingestions account for significant morbidity. Providers need to balance efficient pain management with opioid stewardship, complying with state and federal policies to limit harm related to opioid diversion.15
Nonpharmacological Modalities
The use of nonpharmacologic therapies, along with pharmacologic modalities, for perioperative pain management has been shown to decrease opioid use and opioid-related side effects. Trials of acupressure have demonstrated improvement in nausea and vomiting, sleep quality, and pain and anxiety scores. Nonpharmacologic treatments currently serve as a complementary approach for pain and anxiety management in the perioperative setting including acupuncture, acupressure, osteopathic manipulative treatment, massage, meditation, biofeedback, hypnotherapy, and physical/occupational, relaxation, cognitive-behavioral, chiropractic, music, and art therapies. The Joint Commission suggests consideration of such modalities by hospitals.
FUTURE CONSIDERATIONS
Pediatric hospitalists have been traditionally involved in research and patient care improvements and should continue to actively contribute to establishing evidence-based guidelines for the treatment of acute postoperative pain in hospitalized children and adolescents. The sparsity of high-quality evidence prompts the need for more research. A standardized approach to perioperative pain management in the form of checklists, pathways, and protocols for specific procedures may be useful to educate providers and patients, while also standardizing available evidence-based interventions (eg, pediatric Enhanced Recovery After Surgery [ERAS] protocols).
CONCLUSION
Combining multimodal pharmacologic and integrative nonpharmacologic modalities can decrease opioid use and related side effects and improve the perioperative care of hospitalized children. Pediatric hospitalists have an opportunity to optimize care preoperatively, practice multimodal analgesia, and contribute to reducing risk of opioid diversion post operatively.
1. Society of Hospital Medicine Co-Management Advisory Panel. A white paper on a guide to hospitalist/orthopedic surgery co-management. http://tools.hospitalmedicine.org/Implementation/Co-ManagementWhitePaper-final_5-10-10.pdf. Accessed October 11, 2019.
2. Rappaport DI, Rosenberg RE, Shaughnessy EE, et al. Pediatric hospitalist comanagement of surgical patients: Structural, quality, and financial considerations. J Hosp Med. 2014;9(11):737-742. https://doi.org/10.1002/jhm.2266.
3. Evidence-Based Nonpharmacologic Strategies for Comprehensive Pain Care: The Consortium Pain Task Force White Paper. http://www.nonpharmpaincare.org. Accessed on October 11, 2019.
4. Vetter TR, Kain ZN. Role of perioperative surgical home in optimizing the perioperative use of opioids. Anesth Analg. 2017;125(5):1653-1657. https://doi.org/10.1213/ANE.0000000000002280.
5. Edwards DA, Hedrick TL, Jayaram J, et al. American Society for Enhanced Recovery and Perioperative Quality Initiative joint consensus statement on perioperative management of patients on preoperative opioid therapy. Anesth Analg. 2019;129(2):553-566. http://doi.org/10.1213/ANE.0000000000004018.
6. Micromedex (electronic version). IBM Watson Health. Greenwood Village, Colorado, USA. https://www.micromedexsolutions.com. Accessed October 10, 2019.
7. Chou R, Gordon DB, de Leon-Casasola OA, et al. Management of postoperative pain: A clinical practice guideline from the American Pain Society, the American Society of Regional Anesthesia and Pain Medicine, and the American Society of Anesthesiologists’ Committee on Regional Anesthesia, Executive Committee, and Administrative Council. J Pain. 2016;17(2):131-157. https://doi.org/10.1016/j.jpain.2015.12.008.
8. Herzig SJ, Mosher HJ, Calcaterra SL, Jena AB, Nuckols TK. Improving the safety of opioid use for acute noncancer pain in hospitalized adults: A consensus statement from the Society of Hospital Medicine. J Hosp Med. 2018;3(4):263-266. https://doi.org/10.12788/jhm.2980.
9. Dowell D, Haegerich TM, Chou R. CDC guideline for prescribing opioids for chronic pain – United States, 2016. JAMA. 2016;315(15):1624-1645. https://doi.org/10.1001/jama.2016.1464.
10. American Academy of Pediatrics Committee on Drugs. Acetaminophen toxicity in children. Pediatrics. 2001;108 (4):1020-1024. https://doi.org/10.1542/peds.108.4.1020.
11. Jibril F, Sharaby S, Mohamed A, Wilby, KJ. Intravenous versus oral acetaminophen for pain: Systemic review of current evidence to support clinical decision-making. Can J Hosp Pharm. 2015;68(3):238-247. https://doi.org/10.4212/cjhp.v68i3.1458.
12. McNicol ED, Rowe E, Cooper TE. Ketorolac for postoperative pain in children. Cochrane Database Syst Rev. 2018;7(7). https://doi.org/10.1002/14651858.CD012294.pub2.
13. Kendall MC, Castro Alves LJ, Suh EI, McCormick ZL, De Oliveira GS. Regional anesthesia to ameliorate postoperative analgesia outcomes in pediatric surgical patients: an updated systematic review of randomized controlled trials. Local Reg Anesth. 2018;11:91-109. https://doi.org/10.2147/LRA.S185554.
14. Egunsola 0, Wylie CE, Chitty KM, et al. Systematic review of the efficacy and safety of gabapentin and pregabalin for pain in children and adolescents. Anesth Analg. 2019;128(4):811-819. https://doi.org/10.1213/ANE.0000000000003936.
15. Harbaugh C, Gadepalli SK. Pediatric postoperative opioid prescribing and the opioid crisis. Curr Opin Pediatr. 2019;31(3):377-385. https://doi.org/10.1097/MOP.0000000000000768.
Pediatric hospitalists play an increasingly significant role in perioperative pain management.1 Advances in pediatric surgical comanagement may improve quality of care and reduce the length of hospitalization.2 This review is based on queries of the PubMed and Cochrane databases between January 1, 2014, and July 15, 2019, using the search terms “perioperative pain management,” “postoperative pain,” “pediatric,” and “children.” In addition, the authors reviewed key position statements from the American Academy of Pediatrics (AAP), the American Pain Society (APS), the Centers for Disease Control and Prevention (CDC), and the Society of Hospital Medicine (SHM) regarding pain management.3 This update is intended to be relevant for practicing pediatric hospitalists, with a focus on recently expanded options for pain management and judicious opioid use in hospitalized children.
PERIOPERATIVE PAIN MANAGEMENT
Postoperative pain management begins preoperatively according to the concept of the perioperative surgical home (PSH).4 The preoperative history should identify the patient’s previous positive (eg, good pain control) and negative (eg, adverse reactions) experiences with pain medications. Family and patient expectations should be discussed regarding types and sources of pain, pain duration, exacerbating/alleviating factors, and modalities available for realistic pain control because preoperative information can limit anxiety and improve outcomes. Pain specialists can perform risk assessments preoperatively and develop plans to address pharmacologic tolerance, withdrawal, and opioid-induced hyperalgesia after surgery.5 Children with chronic pain and on preoperative opioids may require more analgesia for a longer duration postoperatively. Early recognition of variability of patient’s pain perception and differences in responses to pain need to be clearly communicated across the disciplines in a collaborative model of care.
Children with medical complexity and/or cognitive, emotional, or behavioral impairments may benefit from preoperative psychosocial treatments and utilization of pain self-management training and strategies that could further reduce anxiety and optimize postoperative care because patient and parental preoperative anxiety may be associated with adverse outcomes. Validated pain assessment tools like Revised FLACC (Face, Leg, Activity, Cry, and Consolability) Scale and Individualized Numeric Rating Scale could be particularly useful in children with limitations in communication or altered pain perception; therefore, medical teams and family members should discuss their utilization preoperatively.
MULTIMODAL ANALGESIA
Multimodal analgesia (MMA) is a strategy that synergistically uses pharmacologic and nonpharmacologic modalities to target pain at multiple points of the pain processing pathway (Table).6 MMA can optimize pain control by addressing different types of pain (eg, incisional pain, muscle spasm, or neuropathic pain), expedite recovery, reduce potential pharmacologic side effects, and decrease opioid consumption. Patients taking opioids are at an increased risk of developing opioid-related side effects such as respiratory depression, medication tolerance, and anxiety, with resultant longer hospital stay, increased readmissions, and higher costs of care.7 Treatment for postoperative pain should prioritize appropriately dosed and precisely scheduled MMA before opioid-focused analgesia with the goals of decreasing opioid-related adverse effects, intentional misuse, diversion, and accidental ingestions. The AAP, APS, CDC, and SHM endorse the use of MMA and recommend nonpharmacologic measures and regional anesthesia.8,9 The most used modalities in MMA are discussed below.
Acetaminophen
Acetaminophen has central-acting analgesic and antipyretic properties and readily crosses the blood brain barrier, which makes it particularly useful in spine and neurological surgeries. Oral administration is preferred when feasible. The AAP recommends refraining from rectal administration of acetaminophen as analgesia in children because of concerns about toxic effects and erratic, variable absorption.10 A systematic review of six studies found no benefit in pain control between intravenous (IV) and oral (PO) administration of acetaminophen in adults.11 There is a paucity of studies in children comparing PO with IV acetaminophen perioperative efficacy. Children may benefit from IV formulations in the early postoperative period, in cases with frequent nausea and vomiting, and in those with oral medication intolerance. Since infants have greater risk of respiratory depression from opioids, IV acetaminophen may have utility in this age group. Because of the cost associated with IV formulation, some institutions restrict IV acetaminophen. However, rapidly well-controlled pain and minimization of opioid-related side effects with shorter hospital stays may lower healthcare costs despite the cost of acetaminophen itself.
NSAIDs
NSAIDs possess anti-inflammatory properties through the inhibition of cyclooxygenase and blockade of prostaglandin production. NSAID risks include bleeding, renal and gastrointestinal toxicities, and potentially delayed wound and bone healing. Ketorolac is an NSAID that continues to be widely used with demonstrated opioid-sparing effects. Many retrospective studies including large numbers of pediatric patients have not demonstrated increased risks of bleeding nor poor wound healing with short postoperative use. A Cochrane review, however, concluded that there is insufficient data to either support or reject the efficacy or safety of ketorolac for postoperative pain treatment in children, mostly because of the very low quality of evidence.12
Regional Anesthesia
Regional anesthesia, which includes central (spinal/epidural/caudal) and peripheral blocks, decreases postoperative pain and opioid-associated side effects. Blocks typically consist of local anesthetic with or without the addition of adjuncts (eg, clonidine, dexamethasone). Regional anesthesia may also improve pulmonary function, compared with that of nonregional MMA use, in patients who have thoracic or upper abdominal surgeries. While having broad applications, the utility of regional anesthesia is greatest in preterm infants/neonates and in those with underlying respiratory pathology. A systematic review of randomized controlled trials demonstrated that regional anesthesia decreased opioid consumption and minimized postoperative pain with no significant complications attributed to its use.13 Additional studies are needed to better delineate specific surgical procedures and subpopulations of pediatric patients in which regional anesthesia may provide the most benefit.
Gabapentinoids
Children receiving gabapentinoids perioperatively have been shown to have fewer adverse reactions, decreased opioid consumption, and less anxiety, as well as improved pain scores. Gabapentin is increasingly being utilized for children with idiopathic scoliosis undergoing posterior spinal fusion, and there is some evidence for improving pain control and reducing opioid use. However, a recent systematic review found a paucity of data supporting its clinical use.14 Both gabapentin and pregabalin may further increase risks of respiratory depression, especially in synergy with opioids and benzodiazepines.
Opioids
Opioids should be used with caution in pediatric patients and are reserved primarily for the management of severe acute pain. The shortest duration of the lowest effective dose of opioids should be encouraged. Patient-controlled opioid analgesia (PCA) offers benefits when parenteral postoperative analgesia is indicated: It maximizes pain relief, minimizes risk of overdose, and improves psychological well-being through self-administration of pain medicines. Basal-infusion PCA should not be routinely used because it is associated with nausea, vomiting, and respiratory depression without having superior analgesia compared with demand use only. Monitoring of side stream end-tidal capnography can readily detect respiratory depression, especially if opioids, benzodiazepines, gabapentinoids, and diphenhydramine are used concomitantly. Patient education regarding opioid use, side effects, safe storage, and disposal practices is imperative because significant amounts of opioids remain in households after completion of treatment for pain and because opioid diversion and accidental ingestions account for significant morbidity. Providers need to balance efficient pain management with opioid stewardship, complying with state and federal policies to limit harm related to opioid diversion.15
Nonpharmacological Modalities
The use of nonpharmacologic therapies, along with pharmacologic modalities, for perioperative pain management has been shown to decrease opioid use and opioid-related side effects. Trials of acupressure have demonstrated improvement in nausea and vomiting, sleep quality, and pain and anxiety scores. Nonpharmacologic treatments currently serve as a complementary approach for pain and anxiety management in the perioperative setting including acupuncture, acupressure, osteopathic manipulative treatment, massage, meditation, biofeedback, hypnotherapy, and physical/occupational, relaxation, cognitive-behavioral, chiropractic, music, and art therapies. The Joint Commission suggests consideration of such modalities by hospitals.
FUTURE CONSIDERATIONS
Pediatric hospitalists have been traditionally involved in research and patient care improvements and should continue to actively contribute to establishing evidence-based guidelines for the treatment of acute postoperative pain in hospitalized children and adolescents. The sparsity of high-quality evidence prompts the need for more research. A standardized approach to perioperative pain management in the form of checklists, pathways, and protocols for specific procedures may be useful to educate providers and patients, while also standardizing available evidence-based interventions (eg, pediatric Enhanced Recovery After Surgery [ERAS] protocols).
CONCLUSION
Combining multimodal pharmacologic and integrative nonpharmacologic modalities can decrease opioid use and related side effects and improve the perioperative care of hospitalized children. Pediatric hospitalists have an opportunity to optimize care preoperatively, practice multimodal analgesia, and contribute to reducing risk of opioid diversion post operatively.
Pediatric hospitalists play an increasingly significant role in perioperative pain management.1 Advances in pediatric surgical comanagement may improve quality of care and reduce the length of hospitalization.2 This review is based on queries of the PubMed and Cochrane databases between January 1, 2014, and July 15, 2019, using the search terms “perioperative pain management,” “postoperative pain,” “pediatric,” and “children.” In addition, the authors reviewed key position statements from the American Academy of Pediatrics (AAP), the American Pain Society (APS), the Centers for Disease Control and Prevention (CDC), and the Society of Hospital Medicine (SHM) regarding pain management.3 This update is intended to be relevant for practicing pediatric hospitalists, with a focus on recently expanded options for pain management and judicious opioid use in hospitalized children.
PERIOPERATIVE PAIN MANAGEMENT
Postoperative pain management begins preoperatively according to the concept of the perioperative surgical home (PSH).4 The preoperative history should identify the patient’s previous positive (eg, good pain control) and negative (eg, adverse reactions) experiences with pain medications. Family and patient expectations should be discussed regarding types and sources of pain, pain duration, exacerbating/alleviating factors, and modalities available for realistic pain control because preoperative information can limit anxiety and improve outcomes. Pain specialists can perform risk assessments preoperatively and develop plans to address pharmacologic tolerance, withdrawal, and opioid-induced hyperalgesia after surgery.5 Children with chronic pain and on preoperative opioids may require more analgesia for a longer duration postoperatively. Early recognition of variability of patient’s pain perception and differences in responses to pain need to be clearly communicated across the disciplines in a collaborative model of care.
Children with medical complexity and/or cognitive, emotional, or behavioral impairments may benefit from preoperative psychosocial treatments and utilization of pain self-management training and strategies that could further reduce anxiety and optimize postoperative care because patient and parental preoperative anxiety may be associated with adverse outcomes. Validated pain assessment tools like Revised FLACC (Face, Leg, Activity, Cry, and Consolability) Scale and Individualized Numeric Rating Scale could be particularly useful in children with limitations in communication or altered pain perception; therefore, medical teams and family members should discuss their utilization preoperatively.
MULTIMODAL ANALGESIA
Multimodal analgesia (MMA) is a strategy that synergistically uses pharmacologic and nonpharmacologic modalities to target pain at multiple points of the pain processing pathway (Table).6 MMA can optimize pain control by addressing different types of pain (eg, incisional pain, muscle spasm, or neuropathic pain), expedite recovery, reduce potential pharmacologic side effects, and decrease opioid consumption. Patients taking opioids are at an increased risk of developing opioid-related side effects such as respiratory depression, medication tolerance, and anxiety, with resultant longer hospital stay, increased readmissions, and higher costs of care.7 Treatment for postoperative pain should prioritize appropriately dosed and precisely scheduled MMA before opioid-focused analgesia with the goals of decreasing opioid-related adverse effects, intentional misuse, diversion, and accidental ingestions. The AAP, APS, CDC, and SHM endorse the use of MMA and recommend nonpharmacologic measures and regional anesthesia.8,9 The most used modalities in MMA are discussed below.
Acetaminophen
Acetaminophen has central-acting analgesic and antipyretic properties and readily crosses the blood brain barrier, which makes it particularly useful in spine and neurological surgeries. Oral administration is preferred when feasible. The AAP recommends refraining from rectal administration of acetaminophen as analgesia in children because of concerns about toxic effects and erratic, variable absorption.10 A systematic review of six studies found no benefit in pain control between intravenous (IV) and oral (PO) administration of acetaminophen in adults.11 There is a paucity of studies in children comparing PO with IV acetaminophen perioperative efficacy. Children may benefit from IV formulations in the early postoperative period, in cases with frequent nausea and vomiting, and in those with oral medication intolerance. Since infants have greater risk of respiratory depression from opioids, IV acetaminophen may have utility in this age group. Because of the cost associated with IV formulation, some institutions restrict IV acetaminophen. However, rapidly well-controlled pain and minimization of opioid-related side effects with shorter hospital stays may lower healthcare costs despite the cost of acetaminophen itself.
NSAIDs
NSAIDs possess anti-inflammatory properties through the inhibition of cyclooxygenase and blockade of prostaglandin production. NSAID risks include bleeding, renal and gastrointestinal toxicities, and potentially delayed wound and bone healing. Ketorolac is an NSAID that continues to be widely used with demonstrated opioid-sparing effects. Many retrospective studies including large numbers of pediatric patients have not demonstrated increased risks of bleeding nor poor wound healing with short postoperative use. A Cochrane review, however, concluded that there is insufficient data to either support or reject the efficacy or safety of ketorolac for postoperative pain treatment in children, mostly because of the very low quality of evidence.12
Regional Anesthesia
Regional anesthesia, which includes central (spinal/epidural/caudal) and peripheral blocks, decreases postoperative pain and opioid-associated side effects. Blocks typically consist of local anesthetic with or without the addition of adjuncts (eg, clonidine, dexamethasone). Regional anesthesia may also improve pulmonary function, compared with that of nonregional MMA use, in patients who have thoracic or upper abdominal surgeries. While having broad applications, the utility of regional anesthesia is greatest in preterm infants/neonates and in those with underlying respiratory pathology. A systematic review of randomized controlled trials demonstrated that regional anesthesia decreased opioid consumption and minimized postoperative pain with no significant complications attributed to its use.13 Additional studies are needed to better delineate specific surgical procedures and subpopulations of pediatric patients in which regional anesthesia may provide the most benefit.
Gabapentinoids
Children receiving gabapentinoids perioperatively have been shown to have fewer adverse reactions, decreased opioid consumption, and less anxiety, as well as improved pain scores. Gabapentin is increasingly being utilized for children with idiopathic scoliosis undergoing posterior spinal fusion, and there is some evidence for improving pain control and reducing opioid use. However, a recent systematic review found a paucity of data supporting its clinical use.14 Both gabapentin and pregabalin may further increase risks of respiratory depression, especially in synergy with opioids and benzodiazepines.
Opioids
Opioids should be used with caution in pediatric patients and are reserved primarily for the management of severe acute pain. The shortest duration of the lowest effective dose of opioids should be encouraged. Patient-controlled opioid analgesia (PCA) offers benefits when parenteral postoperative analgesia is indicated: It maximizes pain relief, minimizes risk of overdose, and improves psychological well-being through self-administration of pain medicines. Basal-infusion PCA should not be routinely used because it is associated with nausea, vomiting, and respiratory depression without having superior analgesia compared with demand use only. Monitoring of side stream end-tidal capnography can readily detect respiratory depression, especially if opioids, benzodiazepines, gabapentinoids, and diphenhydramine are used concomitantly. Patient education regarding opioid use, side effects, safe storage, and disposal practices is imperative because significant amounts of opioids remain in households after completion of treatment for pain and because opioid diversion and accidental ingestions account for significant morbidity. Providers need to balance efficient pain management with opioid stewardship, complying with state and federal policies to limit harm related to opioid diversion.15
Nonpharmacological Modalities
The use of nonpharmacologic therapies, along with pharmacologic modalities, for perioperative pain management has been shown to decrease opioid use and opioid-related side effects. Trials of acupressure have demonstrated improvement in nausea and vomiting, sleep quality, and pain and anxiety scores. Nonpharmacologic treatments currently serve as a complementary approach for pain and anxiety management in the perioperative setting including acupuncture, acupressure, osteopathic manipulative treatment, massage, meditation, biofeedback, hypnotherapy, and physical/occupational, relaxation, cognitive-behavioral, chiropractic, music, and art therapies. The Joint Commission suggests consideration of such modalities by hospitals.
FUTURE CONSIDERATIONS
Pediatric hospitalists have been traditionally involved in research and patient care improvements and should continue to actively contribute to establishing evidence-based guidelines for the treatment of acute postoperative pain in hospitalized children and adolescents. The sparsity of high-quality evidence prompts the need for more research. A standardized approach to perioperative pain management in the form of checklists, pathways, and protocols for specific procedures may be useful to educate providers and patients, while also standardizing available evidence-based interventions (eg, pediatric Enhanced Recovery After Surgery [ERAS] protocols).
CONCLUSION
Combining multimodal pharmacologic and integrative nonpharmacologic modalities can decrease opioid use and related side effects and improve the perioperative care of hospitalized children. Pediatric hospitalists have an opportunity to optimize care preoperatively, practice multimodal analgesia, and contribute to reducing risk of opioid diversion post operatively.
1. Society of Hospital Medicine Co-Management Advisory Panel. A white paper on a guide to hospitalist/orthopedic surgery co-management. http://tools.hospitalmedicine.org/Implementation/Co-ManagementWhitePaper-final_5-10-10.pdf. Accessed October 11, 2019.
2. Rappaport DI, Rosenberg RE, Shaughnessy EE, et al. Pediatric hospitalist comanagement of surgical patients: Structural, quality, and financial considerations. J Hosp Med. 2014;9(11):737-742. https://doi.org/10.1002/jhm.2266.
3. Evidence-Based Nonpharmacologic Strategies for Comprehensive Pain Care: The Consortium Pain Task Force White Paper. http://www.nonpharmpaincare.org. Accessed on October 11, 2019.
4. Vetter TR, Kain ZN. Role of perioperative surgical home in optimizing the perioperative use of opioids. Anesth Analg. 2017;125(5):1653-1657. https://doi.org/10.1213/ANE.0000000000002280.
5. Edwards DA, Hedrick TL, Jayaram J, et al. American Society for Enhanced Recovery and Perioperative Quality Initiative joint consensus statement on perioperative management of patients on preoperative opioid therapy. Anesth Analg. 2019;129(2):553-566. http://doi.org/10.1213/ANE.0000000000004018.
6. Micromedex (electronic version). IBM Watson Health. Greenwood Village, Colorado, USA. https://www.micromedexsolutions.com. Accessed October 10, 2019.
7. Chou R, Gordon DB, de Leon-Casasola OA, et al. Management of postoperative pain: A clinical practice guideline from the American Pain Society, the American Society of Regional Anesthesia and Pain Medicine, and the American Society of Anesthesiologists’ Committee on Regional Anesthesia, Executive Committee, and Administrative Council. J Pain. 2016;17(2):131-157. https://doi.org/10.1016/j.jpain.2015.12.008.
8. Herzig SJ, Mosher HJ, Calcaterra SL, Jena AB, Nuckols TK. Improving the safety of opioid use for acute noncancer pain in hospitalized adults: A consensus statement from the Society of Hospital Medicine. J Hosp Med. 2018;3(4):263-266. https://doi.org/10.12788/jhm.2980.
9. Dowell D, Haegerich TM, Chou R. CDC guideline for prescribing opioids for chronic pain – United States, 2016. JAMA. 2016;315(15):1624-1645. https://doi.org/10.1001/jama.2016.1464.
10. American Academy of Pediatrics Committee on Drugs. Acetaminophen toxicity in children. Pediatrics. 2001;108 (4):1020-1024. https://doi.org/10.1542/peds.108.4.1020.
11. Jibril F, Sharaby S, Mohamed A, Wilby, KJ. Intravenous versus oral acetaminophen for pain: Systemic review of current evidence to support clinical decision-making. Can J Hosp Pharm. 2015;68(3):238-247. https://doi.org/10.4212/cjhp.v68i3.1458.
12. McNicol ED, Rowe E, Cooper TE. Ketorolac for postoperative pain in children. Cochrane Database Syst Rev. 2018;7(7). https://doi.org/10.1002/14651858.CD012294.pub2.
13. Kendall MC, Castro Alves LJ, Suh EI, McCormick ZL, De Oliveira GS. Regional anesthesia to ameliorate postoperative analgesia outcomes in pediatric surgical patients: an updated systematic review of randomized controlled trials. Local Reg Anesth. 2018;11:91-109. https://doi.org/10.2147/LRA.S185554.
14. Egunsola 0, Wylie CE, Chitty KM, et al. Systematic review of the efficacy and safety of gabapentin and pregabalin for pain in children and adolescents. Anesth Analg. 2019;128(4):811-819. https://doi.org/10.1213/ANE.0000000000003936.
15. Harbaugh C, Gadepalli SK. Pediatric postoperative opioid prescribing and the opioid crisis. Curr Opin Pediatr. 2019;31(3):377-385. https://doi.org/10.1097/MOP.0000000000000768.
1. Society of Hospital Medicine Co-Management Advisory Panel. A white paper on a guide to hospitalist/orthopedic surgery co-management. http://tools.hospitalmedicine.org/Implementation/Co-ManagementWhitePaper-final_5-10-10.pdf. Accessed October 11, 2019.
2. Rappaport DI, Rosenberg RE, Shaughnessy EE, et al. Pediatric hospitalist comanagement of surgical patients: Structural, quality, and financial considerations. J Hosp Med. 2014;9(11):737-742. https://doi.org/10.1002/jhm.2266.
3. Evidence-Based Nonpharmacologic Strategies for Comprehensive Pain Care: The Consortium Pain Task Force White Paper. http://www.nonpharmpaincare.org. Accessed on October 11, 2019.
4. Vetter TR, Kain ZN. Role of perioperative surgical home in optimizing the perioperative use of opioids. Anesth Analg. 2017;125(5):1653-1657. https://doi.org/10.1213/ANE.0000000000002280.
5. Edwards DA, Hedrick TL, Jayaram J, et al. American Society for Enhanced Recovery and Perioperative Quality Initiative joint consensus statement on perioperative management of patients on preoperative opioid therapy. Anesth Analg. 2019;129(2):553-566. http://doi.org/10.1213/ANE.0000000000004018.
6. Micromedex (electronic version). IBM Watson Health. Greenwood Village, Colorado, USA. https://www.micromedexsolutions.com. Accessed October 10, 2019.
7. Chou R, Gordon DB, de Leon-Casasola OA, et al. Management of postoperative pain: A clinical practice guideline from the American Pain Society, the American Society of Regional Anesthesia and Pain Medicine, and the American Society of Anesthesiologists’ Committee on Regional Anesthesia, Executive Committee, and Administrative Council. J Pain. 2016;17(2):131-157. https://doi.org/10.1016/j.jpain.2015.12.008.
8. Herzig SJ, Mosher HJ, Calcaterra SL, Jena AB, Nuckols TK. Improving the safety of opioid use for acute noncancer pain in hospitalized adults: A consensus statement from the Society of Hospital Medicine. J Hosp Med. 2018;3(4):263-266. https://doi.org/10.12788/jhm.2980.
9. Dowell D, Haegerich TM, Chou R. CDC guideline for prescribing opioids for chronic pain – United States, 2016. JAMA. 2016;315(15):1624-1645. https://doi.org/10.1001/jama.2016.1464.
10. American Academy of Pediatrics Committee on Drugs. Acetaminophen toxicity in children. Pediatrics. 2001;108 (4):1020-1024. https://doi.org/10.1542/peds.108.4.1020.
11. Jibril F, Sharaby S, Mohamed A, Wilby, KJ. Intravenous versus oral acetaminophen for pain: Systemic review of current evidence to support clinical decision-making. Can J Hosp Pharm. 2015;68(3):238-247. https://doi.org/10.4212/cjhp.v68i3.1458.
12. McNicol ED, Rowe E, Cooper TE. Ketorolac for postoperative pain in children. Cochrane Database Syst Rev. 2018;7(7). https://doi.org/10.1002/14651858.CD012294.pub2.
13. Kendall MC, Castro Alves LJ, Suh EI, McCormick ZL, De Oliveira GS. Regional anesthesia to ameliorate postoperative analgesia outcomes in pediatric surgical patients: an updated systematic review of randomized controlled trials. Local Reg Anesth. 2018;11:91-109. https://doi.org/10.2147/LRA.S185554.
14. Egunsola 0, Wylie CE, Chitty KM, et al. Systematic review of the efficacy and safety of gabapentin and pregabalin for pain in children and adolescents. Anesth Analg. 2019;128(4):811-819. https://doi.org/10.1213/ANE.0000000000003936.
15. Harbaugh C, Gadepalli SK. Pediatric postoperative opioid prescribing and the opioid crisis. Curr Opin Pediatr. 2019;31(3):377-385. https://doi.org/10.1097/MOP.0000000000000768.
© 2020 Society of Hospital Medicine
Nationwide Hospital Performance on Publicly Reported Episode Spending Measures
Amid the continued shift from fee-for-service toward value-based payment, policymakers such as the Centers for Medicare & Medicaid Services have initiated strategies to contain spending on episodes of care. This episode focus has led to nationwide implementation of payment models such as bundled payments, which hold hospitals accountable for quality and costs across procedure-based (eg, coronary artery bypass surgery) and condition-based (eg, congestive heart failure) episodes, which begin with hospitalization and encompass subsequent hospital and postdischarge care.
Simultaneously, Medicare has increased its emphasis on similarly designed episodes of care (eg, those spanning hospitalization and postdischarge care) using other strategies, such as public reporting and use of episode-based measures to evaluate hospital cost performance. In 2017, Medicare trialed the implementation of six Clinical Episode-Based Payment (CEBP) measures in the national Hospital Inpatient Quality Reporting Program in order to assess hospital and clinician spending on procedure and condition episodes.1,2
CEBP measures reflect episode-specific spending, conveying “how expensive a hospital is” by capturing facility and professional payments for a given episode spanning between 3 days prior to hospitalization and 30 days following discharge. Given standard payment rates used in Medicare, the variation in episode spending reflects differences in quantity and type of services utilized within an episode. Medicare has specified episode-related services and designed CEBP measures via logic and definition rules informed by a combination of claims and procedures-based grouping, as well as by physician input. For example, the CEBP measure for cellulitis encompasses services related to diagnosing and treating the infection within the episode window, but not unrelated services such as eye exams for coexisting glaucoma. To increase clinical salience, CEBP measures are subdivided to reflect differing complexity when possible. For instance, cellulitis measures are divided into episodes with or without major complications or comorbidities and further subdivided into subtypes for episodes reflecting cellulitis in patients with diabetes, patients with decubitus ulcers, or neither.
CEBPs are similar to other spending measures used in payment programs, such as the Medicare Spending Per Beneficiary, but are more clinically relevant because their focus on episodes more closely reflects clinical practice. CEBPs and Medicare Spending Per Beneficiary have similar designs (eg, same episode windows) and purpose (eg, to capture the cost efficiency of hospital care).3 However, unlike CEBPs, Medicare Spending Per Beneficiary is a “global” measure that summarizes a hospital’s cost efficiency aggregated across all inpatient episodes rather than represent it based on specific conditions or procedures.4 The limitations of publicly reported global hospital measures—for instance, the poor correlation between hospital performance on distinct publicly reported quality measures5—highlight the potential utility of episode-specific spending measures such as CEBP.
Compared with episode-based payment models, initiatives such as CEBP measures have gone largely unstudied. However, they represent signals of Medicare’s growing commitment to addressing care episodes, tested without potentially tedious rulemaking required to change payment. In fact, publicly reported episode spending measures offer policymakers several interrelated benefits: the ability to rapidly evaluate performance at a large number of hospitals (eg, Medicare scaling up CEBP measures among all eligible hospitals nationwide), the option of leveraging publicly reported feedback to prompt clinical improvements (eg, by including CEBP measures in the Hospital Inpatient Quality Reporting Program), and the platform for developing and testing promising spending measures for subsequent use in formal payment models (eg, by using CEBP measures that possess large variation or cost-reduction opportunities in future bundled payment programs).
Despite these benefits, little is known about hospital performance on publicly reported episode-specific spending measures. We addressed this knowledge gap by providing what is, to our knowledge, the first nationwide description of hospital performance on such measures. We also evaluated which episode components accounted for spending variation in procedural vs condition episodes, examined whether CEBP measures can be used to effectively identify high- vs low-cost hospitals, and compared spending performance on CEBPs vs Medicare Spending Per Beneficiary.
METHODS
Data and Study Sample
We utilized publicly available data from Hospital Compare, which include information about hospital-level CEBP and Medicare Spending Per Beneficiary performance for Medicare-certified acute care hospitals nationwide.5 Our analysis evaluated the six CEBP measures tested by Medicare in 2017: three conditions (cellulitis, kidney/urinary tract infection [UTI], gastrointestinal hemorrhage) and three procedures (spinal fusion, cholecystectomy and common duct exploration, and aortic aneurysm repair). Per Medicare rules, CEBP measures are calculated only for hospitals with requisite volume for targeted conditions (minimum of 40 episodes) and procedures (minimum of 25 episodes) and are reported on Hospital Compare in risk-adjusted (eg, for age, hierarchical condition categories in alignment with existing Medicare methodology) and payment-standardized form (ie, accounts for wage index, medical education, disproportionate share hospital payments) . Each CEBP encompasses episodes with or without major complications/comorbidities.
For each hospital, CEBP spending is reported as average total episode spending, as well as average spending on specific components. We grouped components into three groups: hospitalization, skilled nursing facility (SNF) use, and other (encompassing postdischarge readmissions, emergency department visits, and home health agency use), with a focus on SNF given existing evidence from episode-based payment models about the opportunity for savings from reduced SNF care. Hospital Compare also provides information about the national CEBP measure performance (ie, average spending for a given episode type among all eligible hospitals nationwide).
Hospital Groups
To evaluate hospitals’ CEBP performance for specific episode types, we categorized hospitals as either “below average spending” if their average episode spending was below the national average or “above average spending” if spending was above the national average. According to this approach, a hospital could have below average spending for some episodes but above average spending for others.
To compare hospitals across episode types simultaneously, we categorized hospitals as “low cost” if episode spending was below the national average for all applicable measures, “high cost” if episode spending was above the national average for all applicable measures, or “mixed cost” if episode spending was above the national average for some measures and below for others.
We also conducted sensitivity analyses using alternative hospital group definitions. For comparisons of specific episode types, we categorized hospitals as “high spending” (top quartile of average episode spending among eligible hospitals) or “other spending” (all others). For comparisons across all episode types, we focused on SNF care and categorized hospitals as “high SNF cost” (top quartile of episode spending attributed to SNF care) and “other SNF cost” (all others). We applied a similar approach to Medicare Spending Per Beneficiary, categorizing hospitals as either “low MSPB cost” if their episode spending was below the national average for Medicare Spending Per Beneficiary or “high MSPB cost” if not.
Statistical Analysis
We assessed variation by describing the distribution of total episode spending across eligible hospitals for each individual episode type, as well as the proportion of spending attributed to SNF care across all episode types. We reported the difference between the 10th and 90th percentile for each distribution to quantify variation. To evaluate how individual episode components contributed to overall spending variation, we used linear regression and applied analysis of variance to each episode component. Specifically, we regressed episode spending on each episode component (hospital, SNF, other) separately and used these results to generate predicted episode spending values for each hospital based on its value for each spending component. We then calculated the differen-ces (ie, residuals) between predicted and actual total episode spending values. We plotted residuals for each component, with lower residual plot variation (ie, a flatter curve) representing larger contribution of a spending component to overall spending variation.
Pearson correlation coefficients were used to assess within-hospital CEBP correlation (ie, the extent to which performance was hospital specific). We evaluated if and how components of spending varied across hospitals by comparing spending groups (for individual episode types) and cost groups (for all episode types). To test the robustness of these categories, we conducted sensitivity analyses using high spending vs other spending groups (for individual episode types) and high SNF cost vs low SNF cost groups (for all episode types).
To assess concordance between CEBP and Medicare Spending Per Beneficiary, we cross tabulated hospital CEBP performance (high vs low vs mixed cost) and Medicare Spending Per Beneficiary performance (high vs low MSPB cost). This approached allowed us to quantify the number of hospitals that have concordant performance for both types of spending measures (ie, high cost or low cost on both) and the number with discordant performance (eg, high cost on one spending measure but low cost on the other). We used Pearson correlation coefficients to assess correlation between CEBP and Medicare Spending Per Beneficiary, with evaluation of CEBP performance in aggregate form (ie, hospitals’ average CEBP performance across all eligible episode types) and by individual episode types.
Chi-square and Kruskal-Wallis tests were used to compare categorical and continuous variables, respectively. To compare spending amounts, we evaluated the distribution of total episode spending (Appendix Figure 1) and used ordinary least squares regression with spending as the dependent variable and hospital group, episode components, and their interaction as independent variables. Because CEBP dollar amounts are reported through Hospital Compare on a risk-adjusted and payment-standardized basis, no additional adjustments were applied. Analyses were performed using SAS version 9.4 (SAS Institute; Cary, NC) and all tests of significance were two-tailed at alpha=0.05.
RESULTS
Of 3,129 hospitals, 1,778 achieved minimum thresholds and had CEBPs calculated for at least one of the six CEBP episode types.
Variation in CEBP Performance
For each episode type, spending varied across eligible hospitals (Appendix Figure 2). In particular, the difference between the 10th and 90th percentile values for cellulitis, kidney/UTI, and gastrointestinal hemorrhage were $2,873, $3,514, and $2,982, respectively. Differences were greater for procedural episodes of aortic aneurysm ($17,860), spinal fusion ($11,893), and cholecystectomy ($3,689). Evaluated across all episode types, the proportion of episode spending attributed to SNF care also varied across hospitals (Appendix Figure 3), with a difference of 24.7% between the 10th (4.5%) and 90th (29.2%) percentile values.
Residual plots demonstrated differences in which episode components accounted for variation in overall spending. For aortic aneurysm episodes, variation in the SNF episode component best explained variation in episode spending and thus had the lowest residual plot variation, followed by other and hospital components (Figure). Similar patterns were observed for spinal fusion and cholecystectomy episodes. In contrast, for cellulitis episodes, all three components had comparable residual-plot variation, which indicates that the variation in the components explained episode spending variation similarly (Figure)—a pattern reflected in kidney/UTI and gastrointestinal hemorrhage episodes.
Correlation in Performance on CEBP Measures
Across hospitals in our sample, within-hospital correlations were generally low (Appendix Table 1). In particular, correlations ranged from
CEBP Performance by Hospital Groups
Overall spending on specific episode types varied across hospital groups (Table). Spending for aortic aneurysm episodes was $42,633 at hospitals with above average spending and $37,730 at those with below average spending, while spending for spinal fusion episodes was $39,231 at those with above average spending and $34,832 at those with below average spending. In comparison, spending at hospitals deemed above and below average spending for cellulitis episodes was $10,763 and $9,064, respectively, and $11,223 and $9,161 at hospitals deemed above and below average spending for kidney/UTI episodes, respectively.
Spending on specific episode components also differed by hospital group (Table). Though the magnitude of absolute spending amounts and differences varied by specific episode, hospitals with above average spending tended to spend more on SNF than did those with below average spending. For example, hospitals with above average spending for cellulitis episodes spent an average of $2,564 on SNF (24% of overall episode spending) vs $1,293 (14% of episode spending) among those with below average spending. Similarly, hospitals with above and below average spending for kidney/UTI episodes spent $4,068 (36% of episode spending) and $2,232 (24% of episode spending) on SNF, respectively (P < .001 for both episode types). Findings were qualitatively similar in sensitivity analyses (Appendix Table 2).
Among hospitals in our sample, we categorized 481 as high cost (27%), 452 as low cost (25%), and 845 as mixed cost (48%), with hospital groups distributed broadly nationwide (Appendix Figure 4). Evaluated on performance across all six episode types, hospital groups also demonstrated differences in spending by cost components (Table). In particular, spending in SNF ranged from 18.1% of overall episode spending among high-cost hospitals to 10.7% among mixed-cost hospitals and 9.2% among low-cost hospitals. Additionally, spending on hospitalization accounted for 83.3% of overall episode spending among low-cost hospitals, compared with 81.2% and 73.4% among mixed-cost and high-cost hospitals, respectively (P < .001). Comparisons were qualitatively similar in sensitivity analyses (Appendix Table 3).
Comparison of CEBP and Medicare Spending Per Beneficiary Performance
Correlation between Medicare Spending Per Beneficiary and aggregated CEBPs was 0.42 and, for individual episode types, ranged between 0.14 and 0.36 (Appendix Table 2). There was low concordance between hospital performance on CEBP and Medicare Spending Per Beneficiary. Across all eligible hospitals, only 16.3% (290/1778) had positive concordance between performance on the two measure types (ie, low cost for both), while 16.5% (293/1778) had negative concordance (ie, high cost for both). There was discordant performance in most instances (67.2%; 1195/1778), which reflecting favorable performance on one measure type but not the other.
DISCUSSION
To our knowledge, this study is the first to describe hospitals’ episode-specific spending performance nationwide. It demonstrated significant variation across hospitals driven by different episode components for different episode types. It also showed low correlation between individual episode spending measures and poor concordance between episode-specific and global hospital spending measures. Two practice and policy implications are noteworthy.
First, our findings corroborate and build upon evidence from bundled payment programs about the opportunity for hospitals to improve their cost efficiency. Findings from bundled payment evaluations of surgical episodes suggest that the major area for cost savings is in the reduction of institutional post-acute care use such as that of SNFs.7-9 We demonstrated similar opportunity in a national sample of hospitals, finding that, for the three evaluated procedural CEBPs, SNF care accounted for more variation in overall episode spending than did other components. While variation may imply opportunity for greater efficiency and standardization, it is important to note that variation itself is not inherently problematic. Additional studies are needed to distinguish between warranted and unwarranted variation in procedural episodes, as well as identify strategies for reducing the latter.
Though bundled payment evaluations have predominantly emphasized procedural episodes, existing evidence suggests that participation in medical condition bundles has not been associated with cost savings or utilization changes.7-15 Findings from our analysis of variance—that there appear to be smaller variation-reduction opportunities for condition episodes than for procedural episodes—offer insight into this issue. Existing episodes are initiated by hospitalization and extend into the postacute period, a design that may not afford substantial post-acute care savings opportunities for condition episodes. This is an important insight as policymakers consider how to best design condition-based episodes in the future (eg, whether to use non–hospital based episode triggers). Future work should evaluate whether our findings reflect inherent differences between condition and procedural episodes16 or whether interventions can still optimize SNF care for these episodes despite smaller variation.
Second, our results highlight the potential limitations of global performance measures such as Medicare Spending Per Beneficiary. As a general measure of hospital spending, Medicare Spending Per Beneficiary is based on the premise that hospitals can be categorized as high or low cost with consideration of all inpatient episodic care. However, our analyses suggest that hospitals may be high cost for certain episodes and low cost for others—a fact highlighted by the low correlation and high discordance observed between hospital CEBP and Medicare Spending Per Beneficiary performance. Because overarching measures may miss spending differen-ces related to underlying clinical scenarios, episode-specific spending measures would provide important perspective and complements to global measures for assessing hospital cost performance, particularly in an era of value-based payments. Policymakers should consider prioritizing the development and implementation of such measures.
Our study has limitations. First, it is descriptive in nature, and future work should evaluate the association between episode-specific spending measure performance and clinical and quality outcomes. Second, we evaluated all CEBP-eligible hospitals nationwide to provide a broad view of episode-specific spending. However, future studies should assess performance among hospital subtypes, such as vertically integrated or safety-net organizations, because they may be more or less able to perform on these spending measures. Third, though findings may not be generalizable to other clinical episodes, our results were qualitatively consistent across episode types and broadly consistent with evidence from episode-based payment models. Fourth, we analyzed cost from the perspective of utilization and did not incorporate price considerations, which may be more relevant for commercial insurers than it is for Medicare.
Nonetheless, the emergence of CEBPs reflects the ongoing shift in policymaker attention toward episode-specific spending. In particular, though further scale or use of CEBP measures has been put on hold amid other payment reform changes, their nationwide implementation in 2017 signals Medicare’s broad interest in evaluating all hospitals on episode-specific spending efficiency, in addition to other facets of spending, quality, safety, and patient experience. Importantly, such efforts complement other ongoing nationwide initiatives for emphasizing episode spending, such as use of episode-based cost measures within the Merit-Based Incentive Payment System17 to score clinicians and groups in part based on their episode-specific spending efficiency. Insight about episode spending performance could help hospitals prepare for environments with increasing focus on episode spending and as policymakers incorporate this perspective into quality and value-based payment policies.
1. Centers for Medicare & Medicaid Services. Fiscal Year 2019 Clinical Episode-Based Payment Measures Overview. https://www.qualityreportingcenter.com/globalassets/migrated-pdf/cepb_slides_npc-6.17.2018_5.22.18_vfinal508.pdf. Accessed November 26, 2019.
2. Centers for Medicare & Medicaid Services. Hospital Inpatient Quality Reporting Program. https://www.cms.gov/Medicare/Quality-Initiatives-Patient-Assessment-Instruments/HospitalQualityInits/HospitalRHQDAPU.html. Accessed November 23, 2019.
3. Centers for Medicare & Medicaid Services. Medicare Spending Per Beneficiary (MSPB) Spending Breakdown by Claim Type. https://www.cms.gov/Medicare/Quality-Initiatives-Patient-Assessment-Instruments/hospital-value-based-purchasing/Downloads/Fact-Sheet-MSPB-Spending-Breakdowns-by-Claim-Type-Dec-2014.pdf. Accessed November 25, 2019.
4. Hu J, Jordan J, Rubinfeld I, Schreiber M, Waterman B, Nerenz D. Correlations among hospital quality measure: What “Hospital Compare” data tell us. Am J Med Qual. 2017;32(6):605-610. https://doi.org/10.1177/1062860616684012.
5. Centers for Medicare & Medicaid Services. Hospital Compare datasets. https://data.medicare.gov/data/hospital-compare. Accessed November 26, 2019.
6. American Hospital Association. AHA Data Products. https://www.aha.org/data-insights/aha-data-products. Accessed November 25, 2019.
7. Dummit LA, Kahvecioglu D, Marrufo G, et al. Bundled payment initiative and payments and quality outcomes for lower extremity joint replacement episodes. JAMA. 2016; 316(12):1267-1278. https://doi.org/10.1001/jama.2016.12717.
8. Finkelstein A, Ji Y, Mahoney N, Skinner J. Mandatory medicare bundled payment program for lower extremity joint replacement and discharge to institutional postacute care: Interim analysis of the first year of a 5-year randomized trial. JAMA. 2018;320(9):892-900. https://doi.org/10.1001/jama.2018.12346.
9. Navathe AS, Troxel AB, Liao JM, et al. Cost of joint replacement using bundled payment models. JAMA Intern Med. 2017;177(2):214-222. https://doi.org/10.1001/jamainternmed.2016.8263.
10. Liao JM, Emanuel EJ, Polsky DE, et al. National representativeness of hospitals and markets in Medicare’s mandatory bundled payment program. Health Aff. 2019;38(1):44-53.
11. Barnett ML, Wilcock A, McWilliams JM, et al. Two-year evaluation of mandatory bundled payments for joint replacement. N Engl J Med. 2019;380(3):252-262. https://doi.org/10.1056/NEJMsa1809010.
12. Navathe AS, Liao JM, Polsky D, et al. Comparison of hospitals participating in Medicare’s voluntary and mandatory orthopedic bundle programs. Health Aff. 2018;37(6):854-863. https://www.doi.org/10.1377/hlthaff.2017.1358.
13. Joynt Maddox KE, Orav EJ, Zheng J, Epstein AM. Participation and Dropout in the Bundled Payments for Care Improvement Initiative. JAMA. 2018;319(2):191-193. https://doi.org/10.1001/jama.2017.14771.
14. Navathe AS, Liao JM, Dykstra SE, et al. Association of hospital participation in a Medicare bundled payment program with volume and case mix of lower extremity joint replacement episodes. JAMA. 2018;320(9):901-910. https://doi.org/10.1001/jama.2018.12345.
15. Joynt Maddox KE, Orav EJ, Epstein AM. Medicare’s bundled payments initiative for medical conditions. N Engl J Med. 2018;379(18):e33. https://doi.org/10.1056/NEJMc1811049.
16. Navathe AS, Shan E, Liao JM. What have we learned about bundling medical conditions? Health Affairs Blog. https://www.healthaffairs.org/do/10.1377/hblog20180828.844613/full/. Accessed November 25, 2019.
17. Centers for Medicare & Medicaid Services. MACRA. https://www.cms.gov/medicare/quality-initiatives-patient-assessment-instruments/value-based-programs/macra-mips-and-apms/macra-mips-and-apms.html. Accessed November 26, 2019.
Amid the continued shift from fee-for-service toward value-based payment, policymakers such as the Centers for Medicare & Medicaid Services have initiated strategies to contain spending on episodes of care. This episode focus has led to nationwide implementation of payment models such as bundled payments, which hold hospitals accountable for quality and costs across procedure-based (eg, coronary artery bypass surgery) and condition-based (eg, congestive heart failure) episodes, which begin with hospitalization and encompass subsequent hospital and postdischarge care.
Simultaneously, Medicare has increased its emphasis on similarly designed episodes of care (eg, those spanning hospitalization and postdischarge care) using other strategies, such as public reporting and use of episode-based measures to evaluate hospital cost performance. In 2017, Medicare trialed the implementation of six Clinical Episode-Based Payment (CEBP) measures in the national Hospital Inpatient Quality Reporting Program in order to assess hospital and clinician spending on procedure and condition episodes.1,2
CEBP measures reflect episode-specific spending, conveying “how expensive a hospital is” by capturing facility and professional payments for a given episode spanning between 3 days prior to hospitalization and 30 days following discharge. Given standard payment rates used in Medicare, the variation in episode spending reflects differences in quantity and type of services utilized within an episode. Medicare has specified episode-related services and designed CEBP measures via logic and definition rules informed by a combination of claims and procedures-based grouping, as well as by physician input. For example, the CEBP measure for cellulitis encompasses services related to diagnosing and treating the infection within the episode window, but not unrelated services such as eye exams for coexisting glaucoma. To increase clinical salience, CEBP measures are subdivided to reflect differing complexity when possible. For instance, cellulitis measures are divided into episodes with or without major complications or comorbidities and further subdivided into subtypes for episodes reflecting cellulitis in patients with diabetes, patients with decubitus ulcers, or neither.
CEBPs are similar to other spending measures used in payment programs, such as the Medicare Spending Per Beneficiary, but are more clinically relevant because their focus on episodes more closely reflects clinical practice. CEBPs and Medicare Spending Per Beneficiary have similar designs (eg, same episode windows) and purpose (eg, to capture the cost efficiency of hospital care).3 However, unlike CEBPs, Medicare Spending Per Beneficiary is a “global” measure that summarizes a hospital’s cost efficiency aggregated across all inpatient episodes rather than represent it based on specific conditions or procedures.4 The limitations of publicly reported global hospital measures—for instance, the poor correlation between hospital performance on distinct publicly reported quality measures5—highlight the potential utility of episode-specific spending measures such as CEBP.
Compared with episode-based payment models, initiatives such as CEBP measures have gone largely unstudied. However, they represent signals of Medicare’s growing commitment to addressing care episodes, tested without potentially tedious rulemaking required to change payment. In fact, publicly reported episode spending measures offer policymakers several interrelated benefits: the ability to rapidly evaluate performance at a large number of hospitals (eg, Medicare scaling up CEBP measures among all eligible hospitals nationwide), the option of leveraging publicly reported feedback to prompt clinical improvements (eg, by including CEBP measures in the Hospital Inpatient Quality Reporting Program), and the platform for developing and testing promising spending measures for subsequent use in formal payment models (eg, by using CEBP measures that possess large variation or cost-reduction opportunities in future bundled payment programs).
Despite these benefits, little is known about hospital performance on publicly reported episode-specific spending measures. We addressed this knowledge gap by providing what is, to our knowledge, the first nationwide description of hospital performance on such measures. We also evaluated which episode components accounted for spending variation in procedural vs condition episodes, examined whether CEBP measures can be used to effectively identify high- vs low-cost hospitals, and compared spending performance on CEBPs vs Medicare Spending Per Beneficiary.
METHODS
Data and Study Sample
We utilized publicly available data from Hospital Compare, which include information about hospital-level CEBP and Medicare Spending Per Beneficiary performance for Medicare-certified acute care hospitals nationwide.5 Our analysis evaluated the six CEBP measures tested by Medicare in 2017: three conditions (cellulitis, kidney/urinary tract infection [UTI], gastrointestinal hemorrhage) and three procedures (spinal fusion, cholecystectomy and common duct exploration, and aortic aneurysm repair). Per Medicare rules, CEBP measures are calculated only for hospitals with requisite volume for targeted conditions (minimum of 40 episodes) and procedures (minimum of 25 episodes) and are reported on Hospital Compare in risk-adjusted (eg, for age, hierarchical condition categories in alignment with existing Medicare methodology) and payment-standardized form (ie, accounts for wage index, medical education, disproportionate share hospital payments) . Each CEBP encompasses episodes with or without major complications/comorbidities.
For each hospital, CEBP spending is reported as average total episode spending, as well as average spending on specific components. We grouped components into three groups: hospitalization, skilled nursing facility (SNF) use, and other (encompassing postdischarge readmissions, emergency department visits, and home health agency use), with a focus on SNF given existing evidence from episode-based payment models about the opportunity for savings from reduced SNF care. Hospital Compare also provides information about the national CEBP measure performance (ie, average spending for a given episode type among all eligible hospitals nationwide).
Hospital Groups
To evaluate hospitals’ CEBP performance for specific episode types, we categorized hospitals as either “below average spending” if their average episode spending was below the national average or “above average spending” if spending was above the national average. According to this approach, a hospital could have below average spending for some episodes but above average spending for others.
To compare hospitals across episode types simultaneously, we categorized hospitals as “low cost” if episode spending was below the national average for all applicable measures, “high cost” if episode spending was above the national average for all applicable measures, or “mixed cost” if episode spending was above the national average for some measures and below for others.
We also conducted sensitivity analyses using alternative hospital group definitions. For comparisons of specific episode types, we categorized hospitals as “high spending” (top quartile of average episode spending among eligible hospitals) or “other spending” (all others). For comparisons across all episode types, we focused on SNF care and categorized hospitals as “high SNF cost” (top quartile of episode spending attributed to SNF care) and “other SNF cost” (all others). We applied a similar approach to Medicare Spending Per Beneficiary, categorizing hospitals as either “low MSPB cost” if their episode spending was below the national average for Medicare Spending Per Beneficiary or “high MSPB cost” if not.
Statistical Analysis
We assessed variation by describing the distribution of total episode spending across eligible hospitals for each individual episode type, as well as the proportion of spending attributed to SNF care across all episode types. We reported the difference between the 10th and 90th percentile for each distribution to quantify variation. To evaluate how individual episode components contributed to overall spending variation, we used linear regression and applied analysis of variance to each episode component. Specifically, we regressed episode spending on each episode component (hospital, SNF, other) separately and used these results to generate predicted episode spending values for each hospital based on its value for each spending component. We then calculated the differen-ces (ie, residuals) between predicted and actual total episode spending values. We plotted residuals for each component, with lower residual plot variation (ie, a flatter curve) representing larger contribution of a spending component to overall spending variation.
Pearson correlation coefficients were used to assess within-hospital CEBP correlation (ie, the extent to which performance was hospital specific). We evaluated if and how components of spending varied across hospitals by comparing spending groups (for individual episode types) and cost groups (for all episode types). To test the robustness of these categories, we conducted sensitivity analyses using high spending vs other spending groups (for individual episode types) and high SNF cost vs low SNF cost groups (for all episode types).
To assess concordance between CEBP and Medicare Spending Per Beneficiary, we cross tabulated hospital CEBP performance (high vs low vs mixed cost) and Medicare Spending Per Beneficiary performance (high vs low MSPB cost). This approached allowed us to quantify the number of hospitals that have concordant performance for both types of spending measures (ie, high cost or low cost on both) and the number with discordant performance (eg, high cost on one spending measure but low cost on the other). We used Pearson correlation coefficients to assess correlation between CEBP and Medicare Spending Per Beneficiary, with evaluation of CEBP performance in aggregate form (ie, hospitals’ average CEBP performance across all eligible episode types) and by individual episode types.
Chi-square and Kruskal-Wallis tests were used to compare categorical and continuous variables, respectively. To compare spending amounts, we evaluated the distribution of total episode spending (Appendix Figure 1) and used ordinary least squares regression with spending as the dependent variable and hospital group, episode components, and their interaction as independent variables. Because CEBP dollar amounts are reported through Hospital Compare on a risk-adjusted and payment-standardized basis, no additional adjustments were applied. Analyses were performed using SAS version 9.4 (SAS Institute; Cary, NC) and all tests of significance were two-tailed at alpha=0.05.
RESULTS
Of 3,129 hospitals, 1,778 achieved minimum thresholds and had CEBPs calculated for at least one of the six CEBP episode types.
Variation in CEBP Performance
For each episode type, spending varied across eligible hospitals (Appendix Figure 2). In particular, the difference between the 10th and 90th percentile values for cellulitis, kidney/UTI, and gastrointestinal hemorrhage were $2,873, $3,514, and $2,982, respectively. Differences were greater for procedural episodes of aortic aneurysm ($17,860), spinal fusion ($11,893), and cholecystectomy ($3,689). Evaluated across all episode types, the proportion of episode spending attributed to SNF care also varied across hospitals (Appendix Figure 3), with a difference of 24.7% between the 10th (4.5%) and 90th (29.2%) percentile values.
Residual plots demonstrated differences in which episode components accounted for variation in overall spending. For aortic aneurysm episodes, variation in the SNF episode component best explained variation in episode spending and thus had the lowest residual plot variation, followed by other and hospital components (Figure). Similar patterns were observed for spinal fusion and cholecystectomy episodes. In contrast, for cellulitis episodes, all three components had comparable residual-plot variation, which indicates that the variation in the components explained episode spending variation similarly (Figure)—a pattern reflected in kidney/UTI and gastrointestinal hemorrhage episodes.
Correlation in Performance on CEBP Measures
Across hospitals in our sample, within-hospital correlations were generally low (Appendix Table 1). In particular, correlations ranged from
CEBP Performance by Hospital Groups
Overall spending on specific episode types varied across hospital groups (Table). Spending for aortic aneurysm episodes was $42,633 at hospitals with above average spending and $37,730 at those with below average spending, while spending for spinal fusion episodes was $39,231 at those with above average spending and $34,832 at those with below average spending. In comparison, spending at hospitals deemed above and below average spending for cellulitis episodes was $10,763 and $9,064, respectively, and $11,223 and $9,161 at hospitals deemed above and below average spending for kidney/UTI episodes, respectively.
Spending on specific episode components also differed by hospital group (Table). Though the magnitude of absolute spending amounts and differences varied by specific episode, hospitals with above average spending tended to spend more on SNF than did those with below average spending. For example, hospitals with above average spending for cellulitis episodes spent an average of $2,564 on SNF (24% of overall episode spending) vs $1,293 (14% of episode spending) among those with below average spending. Similarly, hospitals with above and below average spending for kidney/UTI episodes spent $4,068 (36% of episode spending) and $2,232 (24% of episode spending) on SNF, respectively (P < .001 for both episode types). Findings were qualitatively similar in sensitivity analyses (Appendix Table 2).
Among hospitals in our sample, we categorized 481 as high cost (27%), 452 as low cost (25%), and 845 as mixed cost (48%), with hospital groups distributed broadly nationwide (Appendix Figure 4). Evaluated on performance across all six episode types, hospital groups also demonstrated differences in spending by cost components (Table). In particular, spending in SNF ranged from 18.1% of overall episode spending among high-cost hospitals to 10.7% among mixed-cost hospitals and 9.2% among low-cost hospitals. Additionally, spending on hospitalization accounted for 83.3% of overall episode spending among low-cost hospitals, compared with 81.2% and 73.4% among mixed-cost and high-cost hospitals, respectively (P < .001). Comparisons were qualitatively similar in sensitivity analyses (Appendix Table 3).
Comparison of CEBP and Medicare Spending Per Beneficiary Performance
Correlation between Medicare Spending Per Beneficiary and aggregated CEBPs was 0.42 and, for individual episode types, ranged between 0.14 and 0.36 (Appendix Table 2). There was low concordance between hospital performance on CEBP and Medicare Spending Per Beneficiary. Across all eligible hospitals, only 16.3% (290/1778) had positive concordance between performance on the two measure types (ie, low cost for both), while 16.5% (293/1778) had negative concordance (ie, high cost for both). There was discordant performance in most instances (67.2%; 1195/1778), which reflecting favorable performance on one measure type but not the other.
DISCUSSION
To our knowledge, this study is the first to describe hospitals’ episode-specific spending performance nationwide. It demonstrated significant variation across hospitals driven by different episode components for different episode types. It also showed low correlation between individual episode spending measures and poor concordance between episode-specific and global hospital spending measures. Two practice and policy implications are noteworthy.
First, our findings corroborate and build upon evidence from bundled payment programs about the opportunity for hospitals to improve their cost efficiency. Findings from bundled payment evaluations of surgical episodes suggest that the major area for cost savings is in the reduction of institutional post-acute care use such as that of SNFs.7-9 We demonstrated similar opportunity in a national sample of hospitals, finding that, for the three evaluated procedural CEBPs, SNF care accounted for more variation in overall episode spending than did other components. While variation may imply opportunity for greater efficiency and standardization, it is important to note that variation itself is not inherently problematic. Additional studies are needed to distinguish between warranted and unwarranted variation in procedural episodes, as well as identify strategies for reducing the latter.
Though bundled payment evaluations have predominantly emphasized procedural episodes, existing evidence suggests that participation in medical condition bundles has not been associated with cost savings or utilization changes.7-15 Findings from our analysis of variance—that there appear to be smaller variation-reduction opportunities for condition episodes than for procedural episodes—offer insight into this issue. Existing episodes are initiated by hospitalization and extend into the postacute period, a design that may not afford substantial post-acute care savings opportunities for condition episodes. This is an important insight as policymakers consider how to best design condition-based episodes in the future (eg, whether to use non–hospital based episode triggers). Future work should evaluate whether our findings reflect inherent differences between condition and procedural episodes16 or whether interventions can still optimize SNF care for these episodes despite smaller variation.
Second, our results highlight the potential limitations of global performance measures such as Medicare Spending Per Beneficiary. As a general measure of hospital spending, Medicare Spending Per Beneficiary is based on the premise that hospitals can be categorized as high or low cost with consideration of all inpatient episodic care. However, our analyses suggest that hospitals may be high cost for certain episodes and low cost for others—a fact highlighted by the low correlation and high discordance observed between hospital CEBP and Medicare Spending Per Beneficiary performance. Because overarching measures may miss spending differen-ces related to underlying clinical scenarios, episode-specific spending measures would provide important perspective and complements to global measures for assessing hospital cost performance, particularly in an era of value-based payments. Policymakers should consider prioritizing the development and implementation of such measures.
Our study has limitations. First, it is descriptive in nature, and future work should evaluate the association between episode-specific spending measure performance and clinical and quality outcomes. Second, we evaluated all CEBP-eligible hospitals nationwide to provide a broad view of episode-specific spending. However, future studies should assess performance among hospital subtypes, such as vertically integrated or safety-net organizations, because they may be more or less able to perform on these spending measures. Third, though findings may not be generalizable to other clinical episodes, our results were qualitatively consistent across episode types and broadly consistent with evidence from episode-based payment models. Fourth, we analyzed cost from the perspective of utilization and did not incorporate price considerations, which may be more relevant for commercial insurers than it is for Medicare.
Nonetheless, the emergence of CEBPs reflects the ongoing shift in policymaker attention toward episode-specific spending. In particular, though further scale or use of CEBP measures has been put on hold amid other payment reform changes, their nationwide implementation in 2017 signals Medicare’s broad interest in evaluating all hospitals on episode-specific spending efficiency, in addition to other facets of spending, quality, safety, and patient experience. Importantly, such efforts complement other ongoing nationwide initiatives for emphasizing episode spending, such as use of episode-based cost measures within the Merit-Based Incentive Payment System17 to score clinicians and groups in part based on their episode-specific spending efficiency. Insight about episode spending performance could help hospitals prepare for environments with increasing focus on episode spending and as policymakers incorporate this perspective into quality and value-based payment policies.
Amid the continued shift from fee-for-service toward value-based payment, policymakers such as the Centers for Medicare & Medicaid Services have initiated strategies to contain spending on episodes of care. This episode focus has led to nationwide implementation of payment models such as bundled payments, which hold hospitals accountable for quality and costs across procedure-based (eg, coronary artery bypass surgery) and condition-based (eg, congestive heart failure) episodes, which begin with hospitalization and encompass subsequent hospital and postdischarge care.
Simultaneously, Medicare has increased its emphasis on similarly designed episodes of care (eg, those spanning hospitalization and postdischarge care) using other strategies, such as public reporting and use of episode-based measures to evaluate hospital cost performance. In 2017, Medicare trialed the implementation of six Clinical Episode-Based Payment (CEBP) measures in the national Hospital Inpatient Quality Reporting Program in order to assess hospital and clinician spending on procedure and condition episodes.1,2
CEBP measures reflect episode-specific spending, conveying “how expensive a hospital is” by capturing facility and professional payments for a given episode spanning between 3 days prior to hospitalization and 30 days following discharge. Given standard payment rates used in Medicare, the variation in episode spending reflects differences in quantity and type of services utilized within an episode. Medicare has specified episode-related services and designed CEBP measures via logic and definition rules informed by a combination of claims and procedures-based grouping, as well as by physician input. For example, the CEBP measure for cellulitis encompasses services related to diagnosing and treating the infection within the episode window, but not unrelated services such as eye exams for coexisting glaucoma. To increase clinical salience, CEBP measures are subdivided to reflect differing complexity when possible. For instance, cellulitis measures are divided into episodes with or without major complications or comorbidities and further subdivided into subtypes for episodes reflecting cellulitis in patients with diabetes, patients with decubitus ulcers, or neither.
CEBPs are similar to other spending measures used in payment programs, such as the Medicare Spending Per Beneficiary, but are more clinically relevant because their focus on episodes more closely reflects clinical practice. CEBPs and Medicare Spending Per Beneficiary have similar designs (eg, same episode windows) and purpose (eg, to capture the cost efficiency of hospital care).3 However, unlike CEBPs, Medicare Spending Per Beneficiary is a “global” measure that summarizes a hospital’s cost efficiency aggregated across all inpatient episodes rather than represent it based on specific conditions or procedures.4 The limitations of publicly reported global hospital measures—for instance, the poor correlation between hospital performance on distinct publicly reported quality measures5—highlight the potential utility of episode-specific spending measures such as CEBP.
Compared with episode-based payment models, initiatives such as CEBP measures have gone largely unstudied. However, they represent signals of Medicare’s growing commitment to addressing care episodes, tested without potentially tedious rulemaking required to change payment. In fact, publicly reported episode spending measures offer policymakers several interrelated benefits: the ability to rapidly evaluate performance at a large number of hospitals (eg, Medicare scaling up CEBP measures among all eligible hospitals nationwide), the option of leveraging publicly reported feedback to prompt clinical improvements (eg, by including CEBP measures in the Hospital Inpatient Quality Reporting Program), and the platform for developing and testing promising spending measures for subsequent use in formal payment models (eg, by using CEBP measures that possess large variation or cost-reduction opportunities in future bundled payment programs).
Despite these benefits, little is known about hospital performance on publicly reported episode-specific spending measures. We addressed this knowledge gap by providing what is, to our knowledge, the first nationwide description of hospital performance on such measures. We also evaluated which episode components accounted for spending variation in procedural vs condition episodes, examined whether CEBP measures can be used to effectively identify high- vs low-cost hospitals, and compared spending performance on CEBPs vs Medicare Spending Per Beneficiary.
METHODS
Data and Study Sample
We utilized publicly available data from Hospital Compare, which include information about hospital-level CEBP and Medicare Spending Per Beneficiary performance for Medicare-certified acute care hospitals nationwide.5 Our analysis evaluated the six CEBP measures tested by Medicare in 2017: three conditions (cellulitis, kidney/urinary tract infection [UTI], gastrointestinal hemorrhage) and three procedures (spinal fusion, cholecystectomy and common duct exploration, and aortic aneurysm repair). Per Medicare rules, CEBP measures are calculated only for hospitals with requisite volume for targeted conditions (minimum of 40 episodes) and procedures (minimum of 25 episodes) and are reported on Hospital Compare in risk-adjusted (eg, for age, hierarchical condition categories in alignment with existing Medicare methodology) and payment-standardized form (ie, accounts for wage index, medical education, disproportionate share hospital payments) . Each CEBP encompasses episodes with or without major complications/comorbidities.
For each hospital, CEBP spending is reported as average total episode spending, as well as average spending on specific components. We grouped components into three groups: hospitalization, skilled nursing facility (SNF) use, and other (encompassing postdischarge readmissions, emergency department visits, and home health agency use), with a focus on SNF given existing evidence from episode-based payment models about the opportunity for savings from reduced SNF care. Hospital Compare also provides information about the national CEBP measure performance (ie, average spending for a given episode type among all eligible hospitals nationwide).
Hospital Groups
To evaluate hospitals’ CEBP performance for specific episode types, we categorized hospitals as either “below average spending” if their average episode spending was below the national average or “above average spending” if spending was above the national average. According to this approach, a hospital could have below average spending for some episodes but above average spending for others.
To compare hospitals across episode types simultaneously, we categorized hospitals as “low cost” if episode spending was below the national average for all applicable measures, “high cost” if episode spending was above the national average for all applicable measures, or “mixed cost” if episode spending was above the national average for some measures and below for others.
We also conducted sensitivity analyses using alternative hospital group definitions. For comparisons of specific episode types, we categorized hospitals as “high spending” (top quartile of average episode spending among eligible hospitals) or “other spending” (all others). For comparisons across all episode types, we focused on SNF care and categorized hospitals as “high SNF cost” (top quartile of episode spending attributed to SNF care) and “other SNF cost” (all others). We applied a similar approach to Medicare Spending Per Beneficiary, categorizing hospitals as either “low MSPB cost” if their episode spending was below the national average for Medicare Spending Per Beneficiary or “high MSPB cost” if not.
Statistical Analysis
We assessed variation by describing the distribution of total episode spending across eligible hospitals for each individual episode type, as well as the proportion of spending attributed to SNF care across all episode types. We reported the difference between the 10th and 90th percentile for each distribution to quantify variation. To evaluate how individual episode components contributed to overall spending variation, we used linear regression and applied analysis of variance to each episode component. Specifically, we regressed episode spending on each episode component (hospital, SNF, other) separately and used these results to generate predicted episode spending values for each hospital based on its value for each spending component. We then calculated the differen-ces (ie, residuals) between predicted and actual total episode spending values. We plotted residuals for each component, with lower residual plot variation (ie, a flatter curve) representing larger contribution of a spending component to overall spending variation.
Pearson correlation coefficients were used to assess within-hospital CEBP correlation (ie, the extent to which performance was hospital specific). We evaluated if and how components of spending varied across hospitals by comparing spending groups (for individual episode types) and cost groups (for all episode types). To test the robustness of these categories, we conducted sensitivity analyses using high spending vs other spending groups (for individual episode types) and high SNF cost vs low SNF cost groups (for all episode types).
To assess concordance between CEBP and Medicare Spending Per Beneficiary, we cross tabulated hospital CEBP performance (high vs low vs mixed cost) and Medicare Spending Per Beneficiary performance (high vs low MSPB cost). This approached allowed us to quantify the number of hospitals that have concordant performance for both types of spending measures (ie, high cost or low cost on both) and the number with discordant performance (eg, high cost on one spending measure but low cost on the other). We used Pearson correlation coefficients to assess correlation between CEBP and Medicare Spending Per Beneficiary, with evaluation of CEBP performance in aggregate form (ie, hospitals’ average CEBP performance across all eligible episode types) and by individual episode types.
Chi-square and Kruskal-Wallis tests were used to compare categorical and continuous variables, respectively. To compare spending amounts, we evaluated the distribution of total episode spending (Appendix Figure 1) and used ordinary least squares regression with spending as the dependent variable and hospital group, episode components, and their interaction as independent variables. Because CEBP dollar amounts are reported through Hospital Compare on a risk-adjusted and payment-standardized basis, no additional adjustments were applied. Analyses were performed using SAS version 9.4 (SAS Institute; Cary, NC) and all tests of significance were two-tailed at alpha=0.05.
RESULTS
Of 3,129 hospitals, 1,778 achieved minimum thresholds and had CEBPs calculated for at least one of the six CEBP episode types.
Variation in CEBP Performance
For each episode type, spending varied across eligible hospitals (Appendix Figure 2). In particular, the difference between the 10th and 90th percentile values for cellulitis, kidney/UTI, and gastrointestinal hemorrhage were $2,873, $3,514, and $2,982, respectively. Differences were greater for procedural episodes of aortic aneurysm ($17,860), spinal fusion ($11,893), and cholecystectomy ($3,689). Evaluated across all episode types, the proportion of episode spending attributed to SNF care also varied across hospitals (Appendix Figure 3), with a difference of 24.7% between the 10th (4.5%) and 90th (29.2%) percentile values.
Residual plots demonstrated differences in which episode components accounted for variation in overall spending. For aortic aneurysm episodes, variation in the SNF episode component best explained variation in episode spending and thus had the lowest residual plot variation, followed by other and hospital components (Figure). Similar patterns were observed for spinal fusion and cholecystectomy episodes. In contrast, for cellulitis episodes, all three components had comparable residual-plot variation, which indicates that the variation in the components explained episode spending variation similarly (Figure)—a pattern reflected in kidney/UTI and gastrointestinal hemorrhage episodes.
Correlation in Performance on CEBP Measures
Across hospitals in our sample, within-hospital correlations were generally low (Appendix Table 1). In particular, correlations ranged from
CEBP Performance by Hospital Groups
Overall spending on specific episode types varied across hospital groups (Table). Spending for aortic aneurysm episodes was $42,633 at hospitals with above average spending and $37,730 at those with below average spending, while spending for spinal fusion episodes was $39,231 at those with above average spending and $34,832 at those with below average spending. In comparison, spending at hospitals deemed above and below average spending for cellulitis episodes was $10,763 and $9,064, respectively, and $11,223 and $9,161 at hospitals deemed above and below average spending for kidney/UTI episodes, respectively.
Spending on specific episode components also differed by hospital group (Table). Though the magnitude of absolute spending amounts and differences varied by specific episode, hospitals with above average spending tended to spend more on SNF than did those with below average spending. For example, hospitals with above average spending for cellulitis episodes spent an average of $2,564 on SNF (24% of overall episode spending) vs $1,293 (14% of episode spending) among those with below average spending. Similarly, hospitals with above and below average spending for kidney/UTI episodes spent $4,068 (36% of episode spending) and $2,232 (24% of episode spending) on SNF, respectively (P < .001 for both episode types). Findings were qualitatively similar in sensitivity analyses (Appendix Table 2).
Among hospitals in our sample, we categorized 481 as high cost (27%), 452 as low cost (25%), and 845 as mixed cost (48%), with hospital groups distributed broadly nationwide (Appendix Figure 4). Evaluated on performance across all six episode types, hospital groups also demonstrated differences in spending by cost components (Table). In particular, spending in SNF ranged from 18.1% of overall episode spending among high-cost hospitals to 10.7% among mixed-cost hospitals and 9.2% among low-cost hospitals. Additionally, spending on hospitalization accounted for 83.3% of overall episode spending among low-cost hospitals, compared with 81.2% and 73.4% among mixed-cost and high-cost hospitals, respectively (P < .001). Comparisons were qualitatively similar in sensitivity analyses (Appendix Table 3).
Comparison of CEBP and Medicare Spending Per Beneficiary Performance
Correlation between Medicare Spending Per Beneficiary and aggregated CEBPs was 0.42 and, for individual episode types, ranged between 0.14 and 0.36 (Appendix Table 2). There was low concordance between hospital performance on CEBP and Medicare Spending Per Beneficiary. Across all eligible hospitals, only 16.3% (290/1778) had positive concordance between performance on the two measure types (ie, low cost for both), while 16.5% (293/1778) had negative concordance (ie, high cost for both). There was discordant performance in most instances (67.2%; 1195/1778), which reflecting favorable performance on one measure type but not the other.
DISCUSSION
To our knowledge, this study is the first to describe hospitals’ episode-specific spending performance nationwide. It demonstrated significant variation across hospitals driven by different episode components for different episode types. It also showed low correlation between individual episode spending measures and poor concordance between episode-specific and global hospital spending measures. Two practice and policy implications are noteworthy.
First, our findings corroborate and build upon evidence from bundled payment programs about the opportunity for hospitals to improve their cost efficiency. Findings from bundled payment evaluations of surgical episodes suggest that the major area for cost savings is in the reduction of institutional post-acute care use such as that of SNFs.7-9 We demonstrated similar opportunity in a national sample of hospitals, finding that, for the three evaluated procedural CEBPs, SNF care accounted for more variation in overall episode spending than did other components. While variation may imply opportunity for greater efficiency and standardization, it is important to note that variation itself is not inherently problematic. Additional studies are needed to distinguish between warranted and unwarranted variation in procedural episodes, as well as identify strategies for reducing the latter.
Though bundled payment evaluations have predominantly emphasized procedural episodes, existing evidence suggests that participation in medical condition bundles has not been associated with cost savings or utilization changes.7-15 Findings from our analysis of variance—that there appear to be smaller variation-reduction opportunities for condition episodes than for procedural episodes—offer insight into this issue. Existing episodes are initiated by hospitalization and extend into the postacute period, a design that may not afford substantial post-acute care savings opportunities for condition episodes. This is an important insight as policymakers consider how to best design condition-based episodes in the future (eg, whether to use non–hospital based episode triggers). Future work should evaluate whether our findings reflect inherent differences between condition and procedural episodes16 or whether interventions can still optimize SNF care for these episodes despite smaller variation.
Second, our results highlight the potential limitations of global performance measures such as Medicare Spending Per Beneficiary. As a general measure of hospital spending, Medicare Spending Per Beneficiary is based on the premise that hospitals can be categorized as high or low cost with consideration of all inpatient episodic care. However, our analyses suggest that hospitals may be high cost for certain episodes and low cost for others—a fact highlighted by the low correlation and high discordance observed between hospital CEBP and Medicare Spending Per Beneficiary performance. Because overarching measures may miss spending differen-ces related to underlying clinical scenarios, episode-specific spending measures would provide important perspective and complements to global measures for assessing hospital cost performance, particularly in an era of value-based payments. Policymakers should consider prioritizing the development and implementation of such measures.
Our study has limitations. First, it is descriptive in nature, and future work should evaluate the association between episode-specific spending measure performance and clinical and quality outcomes. Second, we evaluated all CEBP-eligible hospitals nationwide to provide a broad view of episode-specific spending. However, future studies should assess performance among hospital subtypes, such as vertically integrated or safety-net organizations, because they may be more or less able to perform on these spending measures. Third, though findings may not be generalizable to other clinical episodes, our results were qualitatively consistent across episode types and broadly consistent with evidence from episode-based payment models. Fourth, we analyzed cost from the perspective of utilization and did not incorporate price considerations, which may be more relevant for commercial insurers than it is for Medicare.
Nonetheless, the emergence of CEBPs reflects the ongoing shift in policymaker attention toward episode-specific spending. In particular, though further scale or use of CEBP measures has been put on hold amid other payment reform changes, their nationwide implementation in 2017 signals Medicare’s broad interest in evaluating all hospitals on episode-specific spending efficiency, in addition to other facets of spending, quality, safety, and patient experience. Importantly, such efforts complement other ongoing nationwide initiatives for emphasizing episode spending, such as use of episode-based cost measures within the Merit-Based Incentive Payment System17 to score clinicians and groups in part based on their episode-specific spending efficiency. Insight about episode spending performance could help hospitals prepare for environments with increasing focus on episode spending and as policymakers incorporate this perspective into quality and value-based payment policies.
1. Centers for Medicare & Medicaid Services. Fiscal Year 2019 Clinical Episode-Based Payment Measures Overview. https://www.qualityreportingcenter.com/globalassets/migrated-pdf/cepb_slides_npc-6.17.2018_5.22.18_vfinal508.pdf. Accessed November 26, 2019.
2. Centers for Medicare & Medicaid Services. Hospital Inpatient Quality Reporting Program. https://www.cms.gov/Medicare/Quality-Initiatives-Patient-Assessment-Instruments/HospitalQualityInits/HospitalRHQDAPU.html. Accessed November 23, 2019.
3. Centers for Medicare & Medicaid Services. Medicare Spending Per Beneficiary (MSPB) Spending Breakdown by Claim Type. https://www.cms.gov/Medicare/Quality-Initiatives-Patient-Assessment-Instruments/hospital-value-based-purchasing/Downloads/Fact-Sheet-MSPB-Spending-Breakdowns-by-Claim-Type-Dec-2014.pdf. Accessed November 25, 2019.
4. Hu J, Jordan J, Rubinfeld I, Schreiber M, Waterman B, Nerenz D. Correlations among hospital quality measure: What “Hospital Compare” data tell us. Am J Med Qual. 2017;32(6):605-610. https://doi.org/10.1177/1062860616684012.
5. Centers for Medicare & Medicaid Services. Hospital Compare datasets. https://data.medicare.gov/data/hospital-compare. Accessed November 26, 2019.
6. American Hospital Association. AHA Data Products. https://www.aha.org/data-insights/aha-data-products. Accessed November 25, 2019.
7. Dummit LA, Kahvecioglu D, Marrufo G, et al. Bundled payment initiative and payments and quality outcomes for lower extremity joint replacement episodes. JAMA. 2016; 316(12):1267-1278. https://doi.org/10.1001/jama.2016.12717.
8. Finkelstein A, Ji Y, Mahoney N, Skinner J. Mandatory medicare bundled payment program for lower extremity joint replacement and discharge to institutional postacute care: Interim analysis of the first year of a 5-year randomized trial. JAMA. 2018;320(9):892-900. https://doi.org/10.1001/jama.2018.12346.
9. Navathe AS, Troxel AB, Liao JM, et al. Cost of joint replacement using bundled payment models. JAMA Intern Med. 2017;177(2):214-222. https://doi.org/10.1001/jamainternmed.2016.8263.
10. Liao JM, Emanuel EJ, Polsky DE, et al. National representativeness of hospitals and markets in Medicare’s mandatory bundled payment program. Health Aff. 2019;38(1):44-53.
11. Barnett ML, Wilcock A, McWilliams JM, et al. Two-year evaluation of mandatory bundled payments for joint replacement. N Engl J Med. 2019;380(3):252-262. https://doi.org/10.1056/NEJMsa1809010.
12. Navathe AS, Liao JM, Polsky D, et al. Comparison of hospitals participating in Medicare’s voluntary and mandatory orthopedic bundle programs. Health Aff. 2018;37(6):854-863. https://www.doi.org/10.1377/hlthaff.2017.1358.
13. Joynt Maddox KE, Orav EJ, Zheng J, Epstein AM. Participation and Dropout in the Bundled Payments for Care Improvement Initiative. JAMA. 2018;319(2):191-193. https://doi.org/10.1001/jama.2017.14771.
14. Navathe AS, Liao JM, Dykstra SE, et al. Association of hospital participation in a Medicare bundled payment program with volume and case mix of lower extremity joint replacement episodes. JAMA. 2018;320(9):901-910. https://doi.org/10.1001/jama.2018.12345.
15. Joynt Maddox KE, Orav EJ, Epstein AM. Medicare’s bundled payments initiative for medical conditions. N Engl J Med. 2018;379(18):e33. https://doi.org/10.1056/NEJMc1811049.
16. Navathe AS, Shan E, Liao JM. What have we learned about bundling medical conditions? Health Affairs Blog. https://www.healthaffairs.org/do/10.1377/hblog20180828.844613/full/. Accessed November 25, 2019.
17. Centers for Medicare & Medicaid Services. MACRA. https://www.cms.gov/medicare/quality-initiatives-patient-assessment-instruments/value-based-programs/macra-mips-and-apms/macra-mips-and-apms.html. Accessed November 26, 2019.
1. Centers for Medicare & Medicaid Services. Fiscal Year 2019 Clinical Episode-Based Payment Measures Overview. https://www.qualityreportingcenter.com/globalassets/migrated-pdf/cepb_slides_npc-6.17.2018_5.22.18_vfinal508.pdf. Accessed November 26, 2019.
2. Centers for Medicare & Medicaid Services. Hospital Inpatient Quality Reporting Program. https://www.cms.gov/Medicare/Quality-Initiatives-Patient-Assessment-Instruments/HospitalQualityInits/HospitalRHQDAPU.html. Accessed November 23, 2019.
3. Centers for Medicare & Medicaid Services. Medicare Spending Per Beneficiary (MSPB) Spending Breakdown by Claim Type. https://www.cms.gov/Medicare/Quality-Initiatives-Patient-Assessment-Instruments/hospital-value-based-purchasing/Downloads/Fact-Sheet-MSPB-Spending-Breakdowns-by-Claim-Type-Dec-2014.pdf. Accessed November 25, 2019.
4. Hu J, Jordan J, Rubinfeld I, Schreiber M, Waterman B, Nerenz D. Correlations among hospital quality measure: What “Hospital Compare” data tell us. Am J Med Qual. 2017;32(6):605-610. https://doi.org/10.1177/1062860616684012.
5. Centers for Medicare & Medicaid Services. Hospital Compare datasets. https://data.medicare.gov/data/hospital-compare. Accessed November 26, 2019.
6. American Hospital Association. AHA Data Products. https://www.aha.org/data-insights/aha-data-products. Accessed November 25, 2019.
7. Dummit LA, Kahvecioglu D, Marrufo G, et al. Bundled payment initiative and payments and quality outcomes for lower extremity joint replacement episodes. JAMA. 2016; 316(12):1267-1278. https://doi.org/10.1001/jama.2016.12717.
8. Finkelstein A, Ji Y, Mahoney N, Skinner J. Mandatory medicare bundled payment program for lower extremity joint replacement and discharge to institutional postacute care: Interim analysis of the first year of a 5-year randomized trial. JAMA. 2018;320(9):892-900. https://doi.org/10.1001/jama.2018.12346.
9. Navathe AS, Troxel AB, Liao JM, et al. Cost of joint replacement using bundled payment models. JAMA Intern Med. 2017;177(2):214-222. https://doi.org/10.1001/jamainternmed.2016.8263.
10. Liao JM, Emanuel EJ, Polsky DE, et al. National representativeness of hospitals and markets in Medicare’s mandatory bundled payment program. Health Aff. 2019;38(1):44-53.
11. Barnett ML, Wilcock A, McWilliams JM, et al. Two-year evaluation of mandatory bundled payments for joint replacement. N Engl J Med. 2019;380(3):252-262. https://doi.org/10.1056/NEJMsa1809010.
12. Navathe AS, Liao JM, Polsky D, et al. Comparison of hospitals participating in Medicare’s voluntary and mandatory orthopedic bundle programs. Health Aff. 2018;37(6):854-863. https://www.doi.org/10.1377/hlthaff.2017.1358.
13. Joynt Maddox KE, Orav EJ, Zheng J, Epstein AM. Participation and Dropout in the Bundled Payments for Care Improvement Initiative. JAMA. 2018;319(2):191-193. https://doi.org/10.1001/jama.2017.14771.
14. Navathe AS, Liao JM, Dykstra SE, et al. Association of hospital participation in a Medicare bundled payment program with volume and case mix of lower extremity joint replacement episodes. JAMA. 2018;320(9):901-910. https://doi.org/10.1001/jama.2018.12345.
15. Joynt Maddox KE, Orav EJ, Epstein AM. Medicare’s bundled payments initiative for medical conditions. N Engl J Med. 2018;379(18):e33. https://doi.org/10.1056/NEJMc1811049.
16. Navathe AS, Shan E, Liao JM. What have we learned about bundling medical conditions? Health Affairs Blog. https://www.healthaffairs.org/do/10.1377/hblog20180828.844613/full/. Accessed November 25, 2019.
17. Centers for Medicare & Medicaid Services. MACRA. https://www.cms.gov/medicare/quality-initiatives-patient-assessment-instruments/value-based-programs/macra-mips-and-apms/macra-mips-and-apms.html. Accessed November 26, 2019.
© 2020 Society of Hospital Medicine
The History of Pediatric Hospital Medicine in the United States, 1996-2019
In 1996, internists Robert Wachter, MD, and Lee Goldman, MD, MPH, coined the term “hospitalist” and predicted an “emerging role in the American health care system.”1 Pediatrics was not far behind: In 1999, Dr Wachter joined Paul Bellet, MD, in authoring an article describing the movement within pediatrics.2 An accompanying editorial, coauthored by a pediatric hospitalist and an office-based practitioner, attempted to answer which was “better” for a hospitalized child: A practitioner who knew the child and family or a hospitalist who might be more knowledgeable about the disease, its inpatient management, and how to get things done in the hospital?3 The authors could not answer which model was better for an individual child with an invested primary pediatrician, but concluded that hospitalists have the potential to improve care for all children in the hospital—the future promise of Pediatric Hospital Medicine (PHM). This article traces the growth of PHM from 1996 to the present, highlighting developments that fueled the hospital movement in general and PHM in particular (Table).
REGULATIONS FOSTER OPPORTUNITIES FOR HOSPITALISTS
In the 7 years after the article by Drs Wachter and Goldman, a series of regulations fostered the adoption of hospitalists in teaching hospitals. The first was the reissuance in 1997 of Intermediary Letter 372, which specifies the requirements for attending physicians to bill Medicare.4 The common practice of jotting “agree with above” and cosigning resident notes was no longer sufficient: Attendings had to document that they personally provided services to patients beyond those of residents. As a demonstration of enforcement, records at the Hospital of the University of Pennsylvania in Philadelphia were audited, and a bill for $30 million for overpayments and penalties was issued.4 Teaching hospitals took notice and instituted mechanisms to assure compliance with IL-372, not limited to patients insured by Medicare. The obvious effect on faculty was the requirement of considerably more time and involvement in direct patient care.
Later in the 1990s, the Accreditation Council for Graduate Medical Education (ACGME) introduced a new direction termed the Outcome Project, which led to two novel trainee competency domains: practice-based improvement and systems-based practice.5 The focus on quality improvement, patient safety, and systems was reinforced by two Institute of Medicine publications, To Err Is Human: Building a Safer Health System6 and Crossing the Quality Chasm: A New Health Care System for the 21st Century.7 Hospitalists had the opportunity to impact both patient care and the education of learners in two ways: Directly, by more actively participating in and closely supervising clinical care (per IL-372) and, indirectly, by improving hospital systems.
In 2003, the ACGME extended work hour restrictions implemented in New York State to the national level.8 The new requirements were intended to improve patient safety and increase trainee supervision, but also had the effect of reducing trainees’ clinical experience. While responses of teaching institutions varied, training program changes generated an increased role for hospitalists.9
These changes occurred on a backdrop of changing models of healthcare payment that provided incentive to shorten length of stay (LOS) and shift care from inpatient to ambulatory settings, which increased the acuity and complexity of hospitalized patients. The pressure to increase efficiency and decrease LOS affected faculty, residents, and practitioners in the community. Managing care of inpatients from a distance became more difficult; rounding more than once a day was often required and was disruptive and inefficient, particularly for community practitioners who might have only one or two patients in the hospital. Moreover, the hospital electronic medical record (EMR) became an additional barrier for many practitioners to continue to provide hospital-based care. Systems often differed from those used in their offices, and even when this was not the case, using and maintaining efficiency in the different components of the EMR was difficult. The conversion from paper to electronic documentation and ordering may have contributed to some practitioners relinquishing care of their patients to hospitalists.
PEDIATRIC HOSPITAL MEDICINE: THREE PARENT ORGANIZATIONS
The development of PHM was aided by support from three separate organizations, each with a different role: the Society of Hospital Medicine (SHM), the American Academy of Pediatrics (AAP), and the Academic Pediatric Association (APA). SHM was founded the year after the article by Drs Wachter and Goldman as the “National Association of Inpatient Physicians.” The name was changed to Society of Hospital Medicine in 2003 to reflect the evolving field of hospital medicine. While the organization is largely comprised of internists, a pediatrician has been on its board since 1998, and a pediatrics committee (now Special Interest Group, SIG) has been in existence since 1999. (Appendix Tables 1a and 1b; Appendix Figures 1a and 1b). In 2005, an SHM task force was formed to define PHM-specific Core Competencies that could serve as a basis for curriculum building and a definition of the field. These inaugural PHM Core Competencies were endorsed by all three societies; published in 2010 in SHM’s flagship journal, the Journal of Hospital Medicine10; and were recently revised to reflect changes to the field in the past decade.11 SHM has provided valuable opportunities for hospitalists to develop knowledge and skills, particularly in matters related to healthcare operations and leadership, and it serves as a way to keep PHM connected with the larger hospital medicine community.
The AAP initiated its efforts to engage hospitalists in 1998 with the creation of a Provisional Section on Hospital Medicine (SOHM) that became a full section a year later. (Appendix Table 2; Appendix Figure 2) The SOHM listserv®, created in 2000, became a major vehicle for communication among hospitalists—including individuals who are not members of the SOHM—with more than 4,000 subscribers currently. Of the SOHM achievements noted in the Table, one deserves special mention: In 2006, SOHM formally recognized the large number of hospitalists in community hospitals and established a subsection with Karen Kingry Olson, MD, as inaugural leader. Many of the hospitalists in these sites provide care not only to children on inpatient units but also in areas such as the nursery, delivery room, and emergency department, functioning “like water on pavement—filling all the cracks in the hospital,” as Eric Biondi, MD, MS, puts it.12 It is a credit to the AAP and the PHM community that individuals from community hospitals have specifically been afforded leadership roles. SOHM membership has grown considerably from around 100 at inception to 2,700 in 2019. Participation in the AAP keeps PHM connected to the larger pediatrics community.
The APA established a Hospital and Inpatient Medicine SIG in 2001, the name of which was changed to Hospital Medicine SIG in 2004 (Appendix Table 3; Appendix Figure 3; Note: There had been an Inpatient General Pediatricians SIG in 1992, before the term hospitalist was coined, but it only met once.) In 2003, APA was the first national pediatrics organization to sponsor a PHM meeting. The meeting attracted 130 registrants and was considered successful enough to warrant another meeting in 2005, this time with SHM and AAP joining as co
CONSOLIDATION OF PEDIATRIC HOSPITAL MEDICINE
In 2009, PHM leaders within SHM, APA, and AAP held a pivotal strategic planning “roundtable” to discuss the future of the field.14 A vision statement was developed, serving as a guide to the tasks needed to achieve the vision: “Pediatric hospitalists will transform the delivery of hospital care for children.” Five areas were considered: clinical, quality, research, workforce, and structure. Clinical practice was defined as including both “direct patient care and leadership of the inpatient service.” It was recognized that standardizing, disseminating, and increasing knowledge to improve clinical care was important, but so, too, was taking on leadership roles to improve systems and extend into areas such as sedation. Quality improvement was identified as the measure by which the value of PHM would be assessed. To further efforts in this area, a PHM Quality Improvement (QI) Collaborative work group was created. Research was clearly a necessary component to establish and advance the field. The Children’s Hospital Association had launched the Pediatric Health Information System (PHIS) database in 1993, and PHIS began to flourish as a research database when Samir Shah, MD, MSCE, and Matt Hall, PhD, headed the Research Groups in 2007. Discussions to form an independent research network began in 2001, and, in 2002, the Pediatric Research in Inpatient Settings network (PRIS) was launched, led by Christopher Landrigan, MD, MPH.15 The APA provided organization support in 2006, but a redesign was considered necessary to further move the research initiative forward.15 A Research Leadership Task Force was created, resulting in a new PRIS Network Executive Council, chaired by Rajendu Srivastava, MD, MPH, until 2016, when Karen Wilson, MD, MPH, became chair. Clinical and workforce issues focused on the need to supplement residency training with added skills and knowledge to practice as a pediatric hospitalist. An Education Task Force was created, charged with developing “an educational plan supporting the PHM Core Competencies and addressing hospitalist training needs, including the role as formal educators.” The task force was headed by Mary Ottolini, MD, MPH, MEd, who was aided by Jennifer Maniscalco, MD, MPH, MAcM. Regarding structure of PHM, the decision was made not to develop an independent society but to continue to function within and benefit from the resources of SHM, AAP, and APA, with a Joint Council on Pediatric Hospital Medicine (JCPHM). Established in 2011, the JCPHM included representatives of the AAP, APA, SHM, PRIS, VIP, community hospitals, and the Education Task Force. Erin Stucky Fisher, MD, MHM, served as the first chair. The JCPHM was replaced in the fall of 2016 by a Consortium on PHM, which consists of the chairs and chair elects of the AAP SOHM, the APA Hospital Medicine SIG, and the SHM pediatrics committee. The leadership rotates annually among the three organizations.
PATH TO SUBSPECIALTY STATUS
The American Board of Pediatrics (ABP) recognized the growing field of PHM and, through its foundation, commissioned a series of studies, the first of which was published in 2006 entitled “Hospitalists in children’s hospitals: What we know now and what we need to know.”16 It was not clear whether the PHM community would pursue subspecialty certification. The leaders of the 2009 “roundtable” meeting commissioned a Strategic Planning Committee (STP) led by Christopher Maloney, MD, PhD, and Suzanne Swanson Mendez, MD, to evaluate the best course of action: traditional ABP subspecialty certification, hospital medicine residency track (with or without additional fellowship), Recognition of Focused Practice (as implemented by the American Board of Internal Medicine and American Board of Family Medicine), mandatory mentorship program, or status quo with option for specialized training. There was considerable discussion of the alternatives in the PHM community. In 2012, the STP shared the results of Strengths-Weaknesses-Opportunities-Threats analyses—but did not issue a recommendation.17 The following year, a National PHM Leaders Conference was held to consider the various options. Participants concluded that the best path forward was to pursue subspecialty certification with a requirement for 2 years of fellowship (after a time-limited period for practice pathway eligibility). Two years of fellowship was a departure from the ABP’s standard 3 years, but seemed acceptable based on the expectation that the research component would be integrated with clinical activities (eg, QI), rather than separate bench research. The ABP Initiative on Subspecialty Clinical Training and Certification had recommended flexibility in the duration of fellowships,18 and PHM became the first discipline to take advantage of such flexibility. Following an 18-month review of multiple considerations, the ABP concluded that “children will be better served by establishing the discipline as a new subspecialty.”19
The decision to pursue subspecialty certification was not unanimously embraced by the PHM community, with particular concerns expressed regarding the impact on Med-Peds hospitalists and the future in community hospitals. These were considered by the individuals writing the formal proposal to the ABP, but have not been resolved. Moreover, criteria for eligibility for the certifying examination under the Practice Pathway (“grandparenting”) evoked controversy,20 addressed by the ABP. 21 The first subspecialty certifying examination was ultimately administered to ~1,500 pediatric hospitalists in 2019.
THE ONGOING EVOLUTION OF PEDIATRIC HOSPITAL MEDICINE
It is clear that PHM has established itself as a field, with networks for research and quality improvement, more than 50 fellowship programs, divisions in prestigious departments of pediatrics and children’s hospitals, devoted journals and textbooks, and a well-attended annual meeting. PHM has set standards for the core competencies in PHM,11, 12 for pediatric hospitalist programs,22, 23 for coordinating the hospital care of children,24, 25 for the curricular framework of fellowships,26 and for the Entrustable Professional Activities expected of a hospitalist.27 The vision for the future is that continued efforts in research, quality and systems improvement, and clinical care will, in fact, result in significant benefits for all hospitalized children. Such was the promise of PHM in the 1990s and remains so in 2019.
Acknowledgments
For prompting the project: Rachel Marek. For additions, corrections, and confirmations: David Alexander, Niccole Alexander, Paul Bellet, David Bertoch, Douglas Carlson, Laura Degnon, Kimberly Durham, Barrett Fromme, Sandy Gage, Matthew Garber, Karen Jerardi, Christopher Landrigan, Gail McGuinness, Jennifer Maniscalco, Sandy Melzer, Vineeta Mittal, Karen Kingry Olson, Mary Ottolini, Jack Percelay, Kris Rehm, Michael Ruhlen, Samir Shah, Suzanne Woods, and David Zipes.
Disclosures
The authors have nothing to disclose.
1. Wachter RM, Goldman L. The emerging role of “hospitalists” in the American health care system. N Engl J Med. 1996;335:514-517. https://doi.org/10.1056/NEJM199608153350713.
2. Bellet PS, Wachter RM. The hospitalist movement and its implications for the care of hospitalized children. Pediatrics. 1999;103(2):473-477. https://doi.org/10.1542/peds.103.2.473.
3. Roberts KB, Rappo P. A hospitalist movement? Where to? Pediatrics. 1999;103(2):497. https://doi.org/10.1542/peds.103.2.497.
4. Cohen JJ, Dickler RM. Auditing the Medicare-billing practices of teaching physicians—Welcome accountability, unfair approach. N Engl J Med. 1997;336(18):1317-1320. https://doi.org/10.1056/NEJM199705013361811.
5. Swing SR. The ACGME outcome project: Retrospective and prospective. Med Teach. 2007;29(7):648-654. https://doi.org/10.1080/01421590701392903.
6. Institute of Medicine. To Err is Human: Building a Safer Health System. Washington, DC: The National Academies Press; 2000.
7. Committee on Quality Health Care in America, Institute of Medicine. Crossing the Quality Chasm: A New Health System for the 21st Century. Washington, DC: National Academy Press; 2001.
8. Accreditation Council for Graduate Medical Education. History of Duty Hours. Available at https://www.acgme.org/What-We-Do/Accreditation/Clinical-Experience-and-Education-formerly-Duty-Hours/History-of-Duty-Hours. Accessed January 16, 2020.
9. Oshimura JM, Sperring J, Bauer BD, Carroll AE, Rauch DA. Changes in inpatient staffing following implementation of new residency work hours. J Hosp Med. 2014;9(10):640-645. https://doi.org/10.1002/jhm.2242.
10. Stucky ER, Maniscalco J, Ottolini MC, et al. The Pediatric Hospital Medicine Core Competencies supplement: A framework for curriculum development by the Society of Hospital Medicine with acknowledgement to pediatric hospitalists from the American Academy of Pediatrics and the Academic Pediatric Association. J Hosp Med. 2010;5(Suppl 2):i-xv, 1-114. https://doi.org/10.1002/jhm.776.
11. Gage S, Maniscalco J, Fisher E. The Pediatric Hospital Medicine Core Competencies [published online first ahead of print April XX, 2020].
12. Blum K. Raising the profile of hospital medicine. Hopkins Children’s. 2018 Spring, p 32. https://www.hopkinsmedicine.org/johns-hopkins-childrens-center/_documents/_publications/hopkins_childrens_magazine_spring2018.pdf. Accessed January 16, 2020.
13. Roberts K, Stein R, Cheng T. The Academic Pediatric Association: The first fifty years. Acad Pediatr. 2011;11:173-180. https://doi.org/10.1016/j.acap.2011.02.001.
14. Rauch DA, Lye PS, Carlson D, et al. Pediatric Hospital Medicine: A strategic planning roundtable to chart the future. J Hosp Med. 2012;7(4):329-334. https://doi.org/10.1002/jhm.950.
15. Srivastava R, Landrigan CP. Development of the Pediatric Research in Inpatient Settings (PRIS) Network: Lessons learned. J Hosp Med. 2012;7(8)661-664. https://doi.org/10.1002/jhm.1972.
16. Freed GL, Uren RL. Hospitalists in children’s hospitals: What we know now and what we need to know. J Pediatr. 2006;148(3):296-299. https://doi.org/10.1016/j.jpeds.2005.12.048.
17. Maloney CG, Mendez SS, Quinonez RA, et al. The Strategic Planning Committee report: The first step in a journey to recognize pediatric hospital medicine as a distinct discipline. Hosp Pediatr. 2012;2(4):187-190. https://doi.org/10.1542/hpeds.2012-0048.
18. Stevenson DK, McGuiness GA, Bancroft JD, et al. The Initiative on Subspecialty Clinical Training and Certification (SCTC): Background and recommendations. Pediatrics. 2014;133(Suppl 2):S53-S57. https://doi.org/10.1542/peds.2013-3861C.
19. Barrett DJ, McGuinness GA, Cunha CA, et al. Pediatric hospital medicine: A proposed new subspecialty. Pediatrics. 2017;139(3):e20161823. https://doi.org/10.1542/peds.2016-1823.
20. Chang WW, Hopkins AM, Rehm KP, Gage SL, Shen M. Society of Hospital Medicine position on the American Board of Pediatrics response to the hospital medicine petition. J Hosp Med. 2019;14(10):589-590. https://doi.org/10.12788/jhm.3326.
21. Nichols DG, Woods SK. The American Board of Pediatrics response to the pediatric hospital medicine petition. J Hosp Med. 2019:14:E1-E3. https://doi.org/10.12788/jhm.3322.
22. American Academy of Pediatrics Section on Hospital Medicine. Guiding principles for pediatric hospitalist programs. Pediatrics. 2005;115:1101-1102.
23. American Academy of Pediatrics Section on Hospital Medicine. Guiding principles for pediatric hospitalist programs. Pediatrics. 2013;132(4):782-786. https://doi.org/10.1542/peds.2013-2269.
24. Lye PS, American Academy of Pediatrics Committee on Hospital Care, Section on Hospital Medicine. Clinical report—physicians’ roles in coordinating care of hospitalized children. Pediatrics. 2010;126(4):829-832.
25. Rauch DA, American Academy of Pediatrics Committee on Hospital Care, Section on Hospital Medicine. Physician’s role in coordinating care of hospitalized children. Pediatrics. 2018;142(2):e20181503. https://doi.org/10.1542/peds.2018-1503.
26. Jerardi KE, Fisher ER, Rassbach C, et al; on behalf of the Council of Pediatric Hospital Medicine Fellowship Directors. Development of a curricular framework for pediatric hospital medicine fellowships. Pediatrics. 2019;140(1):e20170698. https://doi.org/10.1542/peds.2017-0698.
27. American Board of Pediatrics. Pediatric hospital medicine entrustable professional activities. https://www.abp.org/subspecialty-epas#Hospitalist%20Medicine. Accessed August 31, 2019.
28. Perkin RM, Swift JD, Newton DA (Eds). Pediatric Hospital Medicine: Textbook of Inpatient Management. Philadelphia, PA: Lippincott Williams & Wilkins; 2003.
29. Frank F, Shah SS, Catallozzi M, Zaoutis L (Eds). The Philadelphia Guide: Inpatient Pediatrics. Philadelphia, PA: Lippincott Williams & Wilkins; 2005.
30. Zaoutis L, Chiang V (Eds). Comprehensive Pediatric Hospital Medicine. Philadelphia, PA: Mosby; 2007.
31. Rauch DA, Gershel J (Eds). Caring for the Hospitalized Child: A Handbook of Inpatient Pediatrics. Elk Grove Village, IL: American Academy of Pediatrics; 2013.
32. Rauch DA. Tribute to Jennifer Daru, MD. Hosp Pediatr. 2011;4(4):267-268.
In 1996, internists Robert Wachter, MD, and Lee Goldman, MD, MPH, coined the term “hospitalist” and predicted an “emerging role in the American health care system.”1 Pediatrics was not far behind: In 1999, Dr Wachter joined Paul Bellet, MD, in authoring an article describing the movement within pediatrics.2 An accompanying editorial, coauthored by a pediatric hospitalist and an office-based practitioner, attempted to answer which was “better” for a hospitalized child: A practitioner who knew the child and family or a hospitalist who might be more knowledgeable about the disease, its inpatient management, and how to get things done in the hospital?3 The authors could not answer which model was better for an individual child with an invested primary pediatrician, but concluded that hospitalists have the potential to improve care for all children in the hospital—the future promise of Pediatric Hospital Medicine (PHM). This article traces the growth of PHM from 1996 to the present, highlighting developments that fueled the hospital movement in general and PHM in particular (Table).
REGULATIONS FOSTER OPPORTUNITIES FOR HOSPITALISTS
In the 7 years after the article by Drs Wachter and Goldman, a series of regulations fostered the adoption of hospitalists in teaching hospitals. The first was the reissuance in 1997 of Intermediary Letter 372, which specifies the requirements for attending physicians to bill Medicare.4 The common practice of jotting “agree with above” and cosigning resident notes was no longer sufficient: Attendings had to document that they personally provided services to patients beyond those of residents. As a demonstration of enforcement, records at the Hospital of the University of Pennsylvania in Philadelphia were audited, and a bill for $30 million for overpayments and penalties was issued.4 Teaching hospitals took notice and instituted mechanisms to assure compliance with IL-372, not limited to patients insured by Medicare. The obvious effect on faculty was the requirement of considerably more time and involvement in direct patient care.
Later in the 1990s, the Accreditation Council for Graduate Medical Education (ACGME) introduced a new direction termed the Outcome Project, which led to two novel trainee competency domains: practice-based improvement and systems-based practice.5 The focus on quality improvement, patient safety, and systems was reinforced by two Institute of Medicine publications, To Err Is Human: Building a Safer Health System6 and Crossing the Quality Chasm: A New Health Care System for the 21st Century.7 Hospitalists had the opportunity to impact both patient care and the education of learners in two ways: Directly, by more actively participating in and closely supervising clinical care (per IL-372) and, indirectly, by improving hospital systems.
In 2003, the ACGME extended work hour restrictions implemented in New York State to the national level.8 The new requirements were intended to improve patient safety and increase trainee supervision, but also had the effect of reducing trainees’ clinical experience. While responses of teaching institutions varied, training program changes generated an increased role for hospitalists.9
These changes occurred on a backdrop of changing models of healthcare payment that provided incentive to shorten length of stay (LOS) and shift care from inpatient to ambulatory settings, which increased the acuity and complexity of hospitalized patients. The pressure to increase efficiency and decrease LOS affected faculty, residents, and practitioners in the community. Managing care of inpatients from a distance became more difficult; rounding more than once a day was often required and was disruptive and inefficient, particularly for community practitioners who might have only one or two patients in the hospital. Moreover, the hospital electronic medical record (EMR) became an additional barrier for many practitioners to continue to provide hospital-based care. Systems often differed from those used in their offices, and even when this was not the case, using and maintaining efficiency in the different components of the EMR was difficult. The conversion from paper to electronic documentation and ordering may have contributed to some practitioners relinquishing care of their patients to hospitalists.
PEDIATRIC HOSPITAL MEDICINE: THREE PARENT ORGANIZATIONS
The development of PHM was aided by support from three separate organizations, each with a different role: the Society of Hospital Medicine (SHM), the American Academy of Pediatrics (AAP), and the Academic Pediatric Association (APA). SHM was founded the year after the article by Drs Wachter and Goldman as the “National Association of Inpatient Physicians.” The name was changed to Society of Hospital Medicine in 2003 to reflect the evolving field of hospital medicine. While the organization is largely comprised of internists, a pediatrician has been on its board since 1998, and a pediatrics committee (now Special Interest Group, SIG) has been in existence since 1999. (Appendix Tables 1a and 1b; Appendix Figures 1a and 1b). In 2005, an SHM task force was formed to define PHM-specific Core Competencies that could serve as a basis for curriculum building and a definition of the field. These inaugural PHM Core Competencies were endorsed by all three societies; published in 2010 in SHM’s flagship journal, the Journal of Hospital Medicine10; and were recently revised to reflect changes to the field in the past decade.11 SHM has provided valuable opportunities for hospitalists to develop knowledge and skills, particularly in matters related to healthcare operations and leadership, and it serves as a way to keep PHM connected with the larger hospital medicine community.
The AAP initiated its efforts to engage hospitalists in 1998 with the creation of a Provisional Section on Hospital Medicine (SOHM) that became a full section a year later. (Appendix Table 2; Appendix Figure 2) The SOHM listserv®, created in 2000, became a major vehicle for communication among hospitalists—including individuals who are not members of the SOHM—with more than 4,000 subscribers currently. Of the SOHM achievements noted in the Table, one deserves special mention: In 2006, SOHM formally recognized the large number of hospitalists in community hospitals and established a subsection with Karen Kingry Olson, MD, as inaugural leader. Many of the hospitalists in these sites provide care not only to children on inpatient units but also in areas such as the nursery, delivery room, and emergency department, functioning “like water on pavement—filling all the cracks in the hospital,” as Eric Biondi, MD, MS, puts it.12 It is a credit to the AAP and the PHM community that individuals from community hospitals have specifically been afforded leadership roles. SOHM membership has grown considerably from around 100 at inception to 2,700 in 2019. Participation in the AAP keeps PHM connected to the larger pediatrics community.
The APA established a Hospital and Inpatient Medicine SIG in 2001, the name of which was changed to Hospital Medicine SIG in 2004 (Appendix Table 3; Appendix Figure 3; Note: There had been an Inpatient General Pediatricians SIG in 1992, before the term hospitalist was coined, but it only met once.) In 2003, APA was the first national pediatrics organization to sponsor a PHM meeting. The meeting attracted 130 registrants and was considered successful enough to warrant another meeting in 2005, this time with SHM and AAP joining as co
CONSOLIDATION OF PEDIATRIC HOSPITAL MEDICINE
In 2009, PHM leaders within SHM, APA, and AAP held a pivotal strategic planning “roundtable” to discuss the future of the field.14 A vision statement was developed, serving as a guide to the tasks needed to achieve the vision: “Pediatric hospitalists will transform the delivery of hospital care for children.” Five areas were considered: clinical, quality, research, workforce, and structure. Clinical practice was defined as including both “direct patient care and leadership of the inpatient service.” It was recognized that standardizing, disseminating, and increasing knowledge to improve clinical care was important, but so, too, was taking on leadership roles to improve systems and extend into areas such as sedation. Quality improvement was identified as the measure by which the value of PHM would be assessed. To further efforts in this area, a PHM Quality Improvement (QI) Collaborative work group was created. Research was clearly a necessary component to establish and advance the field. The Children’s Hospital Association had launched the Pediatric Health Information System (PHIS) database in 1993, and PHIS began to flourish as a research database when Samir Shah, MD, MSCE, and Matt Hall, PhD, headed the Research Groups in 2007. Discussions to form an independent research network began in 2001, and, in 2002, the Pediatric Research in Inpatient Settings network (PRIS) was launched, led by Christopher Landrigan, MD, MPH.15 The APA provided organization support in 2006, but a redesign was considered necessary to further move the research initiative forward.15 A Research Leadership Task Force was created, resulting in a new PRIS Network Executive Council, chaired by Rajendu Srivastava, MD, MPH, until 2016, when Karen Wilson, MD, MPH, became chair. Clinical and workforce issues focused on the need to supplement residency training with added skills and knowledge to practice as a pediatric hospitalist. An Education Task Force was created, charged with developing “an educational plan supporting the PHM Core Competencies and addressing hospitalist training needs, including the role as formal educators.” The task force was headed by Mary Ottolini, MD, MPH, MEd, who was aided by Jennifer Maniscalco, MD, MPH, MAcM. Regarding structure of PHM, the decision was made not to develop an independent society but to continue to function within and benefit from the resources of SHM, AAP, and APA, with a Joint Council on Pediatric Hospital Medicine (JCPHM). Established in 2011, the JCPHM included representatives of the AAP, APA, SHM, PRIS, VIP, community hospitals, and the Education Task Force. Erin Stucky Fisher, MD, MHM, served as the first chair. The JCPHM was replaced in the fall of 2016 by a Consortium on PHM, which consists of the chairs and chair elects of the AAP SOHM, the APA Hospital Medicine SIG, and the SHM pediatrics committee. The leadership rotates annually among the three organizations.
PATH TO SUBSPECIALTY STATUS
The American Board of Pediatrics (ABP) recognized the growing field of PHM and, through its foundation, commissioned a series of studies, the first of which was published in 2006 entitled “Hospitalists in children’s hospitals: What we know now and what we need to know.”16 It was not clear whether the PHM community would pursue subspecialty certification. The leaders of the 2009 “roundtable” meeting commissioned a Strategic Planning Committee (STP) led by Christopher Maloney, MD, PhD, and Suzanne Swanson Mendez, MD, to evaluate the best course of action: traditional ABP subspecialty certification, hospital medicine residency track (with or without additional fellowship), Recognition of Focused Practice (as implemented by the American Board of Internal Medicine and American Board of Family Medicine), mandatory mentorship program, or status quo with option for specialized training. There was considerable discussion of the alternatives in the PHM community. In 2012, the STP shared the results of Strengths-Weaknesses-Opportunities-Threats analyses—but did not issue a recommendation.17 The following year, a National PHM Leaders Conference was held to consider the various options. Participants concluded that the best path forward was to pursue subspecialty certification with a requirement for 2 years of fellowship (after a time-limited period for practice pathway eligibility). Two years of fellowship was a departure from the ABP’s standard 3 years, but seemed acceptable based on the expectation that the research component would be integrated with clinical activities (eg, QI), rather than separate bench research. The ABP Initiative on Subspecialty Clinical Training and Certification had recommended flexibility in the duration of fellowships,18 and PHM became the first discipline to take advantage of such flexibility. Following an 18-month review of multiple considerations, the ABP concluded that “children will be better served by establishing the discipline as a new subspecialty.”19
The decision to pursue subspecialty certification was not unanimously embraced by the PHM community, with particular concerns expressed regarding the impact on Med-Peds hospitalists and the future in community hospitals. These were considered by the individuals writing the formal proposal to the ABP, but have not been resolved. Moreover, criteria for eligibility for the certifying examination under the Practice Pathway (“grandparenting”) evoked controversy,20 addressed by the ABP. 21 The first subspecialty certifying examination was ultimately administered to ~1,500 pediatric hospitalists in 2019.
THE ONGOING EVOLUTION OF PEDIATRIC HOSPITAL MEDICINE
It is clear that PHM has established itself as a field, with networks for research and quality improvement, more than 50 fellowship programs, divisions in prestigious departments of pediatrics and children’s hospitals, devoted journals and textbooks, and a well-attended annual meeting. PHM has set standards for the core competencies in PHM,11, 12 for pediatric hospitalist programs,22, 23 for coordinating the hospital care of children,24, 25 for the curricular framework of fellowships,26 and for the Entrustable Professional Activities expected of a hospitalist.27 The vision for the future is that continued efforts in research, quality and systems improvement, and clinical care will, in fact, result in significant benefits for all hospitalized children. Such was the promise of PHM in the 1990s and remains so in 2019.
Acknowledgments
For prompting the project: Rachel Marek. For additions, corrections, and confirmations: David Alexander, Niccole Alexander, Paul Bellet, David Bertoch, Douglas Carlson, Laura Degnon, Kimberly Durham, Barrett Fromme, Sandy Gage, Matthew Garber, Karen Jerardi, Christopher Landrigan, Gail McGuinness, Jennifer Maniscalco, Sandy Melzer, Vineeta Mittal, Karen Kingry Olson, Mary Ottolini, Jack Percelay, Kris Rehm, Michael Ruhlen, Samir Shah, Suzanne Woods, and David Zipes.
Disclosures
The authors have nothing to disclose.
In 1996, internists Robert Wachter, MD, and Lee Goldman, MD, MPH, coined the term “hospitalist” and predicted an “emerging role in the American health care system.”1 Pediatrics was not far behind: In 1999, Dr Wachter joined Paul Bellet, MD, in authoring an article describing the movement within pediatrics.2 An accompanying editorial, coauthored by a pediatric hospitalist and an office-based practitioner, attempted to answer which was “better” for a hospitalized child: A practitioner who knew the child and family or a hospitalist who might be more knowledgeable about the disease, its inpatient management, and how to get things done in the hospital?3 The authors could not answer which model was better for an individual child with an invested primary pediatrician, but concluded that hospitalists have the potential to improve care for all children in the hospital—the future promise of Pediatric Hospital Medicine (PHM). This article traces the growth of PHM from 1996 to the present, highlighting developments that fueled the hospital movement in general and PHM in particular (Table).
REGULATIONS FOSTER OPPORTUNITIES FOR HOSPITALISTS
In the 7 years after the article by Drs Wachter and Goldman, a series of regulations fostered the adoption of hospitalists in teaching hospitals. The first was the reissuance in 1997 of Intermediary Letter 372, which specifies the requirements for attending physicians to bill Medicare.4 The common practice of jotting “agree with above” and cosigning resident notes was no longer sufficient: Attendings had to document that they personally provided services to patients beyond those of residents. As a demonstration of enforcement, records at the Hospital of the University of Pennsylvania in Philadelphia were audited, and a bill for $30 million for overpayments and penalties was issued.4 Teaching hospitals took notice and instituted mechanisms to assure compliance with IL-372, not limited to patients insured by Medicare. The obvious effect on faculty was the requirement of considerably more time and involvement in direct patient care.
Later in the 1990s, the Accreditation Council for Graduate Medical Education (ACGME) introduced a new direction termed the Outcome Project, which led to two novel trainee competency domains: practice-based improvement and systems-based practice.5 The focus on quality improvement, patient safety, and systems was reinforced by two Institute of Medicine publications, To Err Is Human: Building a Safer Health System6 and Crossing the Quality Chasm: A New Health Care System for the 21st Century.7 Hospitalists had the opportunity to impact both patient care and the education of learners in two ways: Directly, by more actively participating in and closely supervising clinical care (per IL-372) and, indirectly, by improving hospital systems.
In 2003, the ACGME extended work hour restrictions implemented in New York State to the national level.8 The new requirements were intended to improve patient safety and increase trainee supervision, but also had the effect of reducing trainees’ clinical experience. While responses of teaching institutions varied, training program changes generated an increased role for hospitalists.9
These changes occurred on a backdrop of changing models of healthcare payment that provided incentive to shorten length of stay (LOS) and shift care from inpatient to ambulatory settings, which increased the acuity and complexity of hospitalized patients. The pressure to increase efficiency and decrease LOS affected faculty, residents, and practitioners in the community. Managing care of inpatients from a distance became more difficult; rounding more than once a day was often required and was disruptive and inefficient, particularly for community practitioners who might have only one or two patients in the hospital. Moreover, the hospital electronic medical record (EMR) became an additional barrier for many practitioners to continue to provide hospital-based care. Systems often differed from those used in their offices, and even when this was not the case, using and maintaining efficiency in the different components of the EMR was difficult. The conversion from paper to electronic documentation and ordering may have contributed to some practitioners relinquishing care of their patients to hospitalists.
PEDIATRIC HOSPITAL MEDICINE: THREE PARENT ORGANIZATIONS
The development of PHM was aided by support from three separate organizations, each with a different role: the Society of Hospital Medicine (SHM), the American Academy of Pediatrics (AAP), and the Academic Pediatric Association (APA). SHM was founded the year after the article by Drs Wachter and Goldman as the “National Association of Inpatient Physicians.” The name was changed to Society of Hospital Medicine in 2003 to reflect the evolving field of hospital medicine. While the organization is largely comprised of internists, a pediatrician has been on its board since 1998, and a pediatrics committee (now Special Interest Group, SIG) has been in existence since 1999. (Appendix Tables 1a and 1b; Appendix Figures 1a and 1b). In 2005, an SHM task force was formed to define PHM-specific Core Competencies that could serve as a basis for curriculum building and a definition of the field. These inaugural PHM Core Competencies were endorsed by all three societies; published in 2010 in SHM’s flagship journal, the Journal of Hospital Medicine10; and were recently revised to reflect changes to the field in the past decade.11 SHM has provided valuable opportunities for hospitalists to develop knowledge and skills, particularly in matters related to healthcare operations and leadership, and it serves as a way to keep PHM connected with the larger hospital medicine community.
The AAP initiated its efforts to engage hospitalists in 1998 with the creation of a Provisional Section on Hospital Medicine (SOHM) that became a full section a year later. (Appendix Table 2; Appendix Figure 2) The SOHM listserv®, created in 2000, became a major vehicle for communication among hospitalists—including individuals who are not members of the SOHM—with more than 4,000 subscribers currently. Of the SOHM achievements noted in the Table, one deserves special mention: In 2006, SOHM formally recognized the large number of hospitalists in community hospitals and established a subsection with Karen Kingry Olson, MD, as inaugural leader. Many of the hospitalists in these sites provide care not only to children on inpatient units but also in areas such as the nursery, delivery room, and emergency department, functioning “like water on pavement—filling all the cracks in the hospital,” as Eric Biondi, MD, MS, puts it.12 It is a credit to the AAP and the PHM community that individuals from community hospitals have specifically been afforded leadership roles. SOHM membership has grown considerably from around 100 at inception to 2,700 in 2019. Participation in the AAP keeps PHM connected to the larger pediatrics community.
The APA established a Hospital and Inpatient Medicine SIG in 2001, the name of which was changed to Hospital Medicine SIG in 2004 (Appendix Table 3; Appendix Figure 3; Note: There had been an Inpatient General Pediatricians SIG in 1992, before the term hospitalist was coined, but it only met once.) In 2003, APA was the first national pediatrics organization to sponsor a PHM meeting. The meeting attracted 130 registrants and was considered successful enough to warrant another meeting in 2005, this time with SHM and AAP joining as co
CONSOLIDATION OF PEDIATRIC HOSPITAL MEDICINE
In 2009, PHM leaders within SHM, APA, and AAP held a pivotal strategic planning “roundtable” to discuss the future of the field.14 A vision statement was developed, serving as a guide to the tasks needed to achieve the vision: “Pediatric hospitalists will transform the delivery of hospital care for children.” Five areas were considered: clinical, quality, research, workforce, and structure. Clinical practice was defined as including both “direct patient care and leadership of the inpatient service.” It was recognized that standardizing, disseminating, and increasing knowledge to improve clinical care was important, but so, too, was taking on leadership roles to improve systems and extend into areas such as sedation. Quality improvement was identified as the measure by which the value of PHM would be assessed. To further efforts in this area, a PHM Quality Improvement (QI) Collaborative work group was created. Research was clearly a necessary component to establish and advance the field. The Children’s Hospital Association had launched the Pediatric Health Information System (PHIS) database in 1993, and PHIS began to flourish as a research database when Samir Shah, MD, MSCE, and Matt Hall, PhD, headed the Research Groups in 2007. Discussions to form an independent research network began in 2001, and, in 2002, the Pediatric Research in Inpatient Settings network (PRIS) was launched, led by Christopher Landrigan, MD, MPH.15 The APA provided organization support in 2006, but a redesign was considered necessary to further move the research initiative forward.15 A Research Leadership Task Force was created, resulting in a new PRIS Network Executive Council, chaired by Rajendu Srivastava, MD, MPH, until 2016, when Karen Wilson, MD, MPH, became chair. Clinical and workforce issues focused on the need to supplement residency training with added skills and knowledge to practice as a pediatric hospitalist. An Education Task Force was created, charged with developing “an educational plan supporting the PHM Core Competencies and addressing hospitalist training needs, including the role as formal educators.” The task force was headed by Mary Ottolini, MD, MPH, MEd, who was aided by Jennifer Maniscalco, MD, MPH, MAcM. Regarding structure of PHM, the decision was made not to develop an independent society but to continue to function within and benefit from the resources of SHM, AAP, and APA, with a Joint Council on Pediatric Hospital Medicine (JCPHM). Established in 2011, the JCPHM included representatives of the AAP, APA, SHM, PRIS, VIP, community hospitals, and the Education Task Force. Erin Stucky Fisher, MD, MHM, served as the first chair. The JCPHM was replaced in the fall of 2016 by a Consortium on PHM, which consists of the chairs and chair elects of the AAP SOHM, the APA Hospital Medicine SIG, and the SHM pediatrics committee. The leadership rotates annually among the three organizations.
PATH TO SUBSPECIALTY STATUS
The American Board of Pediatrics (ABP) recognized the growing field of PHM and, through its foundation, commissioned a series of studies, the first of which was published in 2006 entitled “Hospitalists in children’s hospitals: What we know now and what we need to know.”16 It was not clear whether the PHM community would pursue subspecialty certification. The leaders of the 2009 “roundtable” meeting commissioned a Strategic Planning Committee (STP) led by Christopher Maloney, MD, PhD, and Suzanne Swanson Mendez, MD, to evaluate the best course of action: traditional ABP subspecialty certification, hospital medicine residency track (with or without additional fellowship), Recognition of Focused Practice (as implemented by the American Board of Internal Medicine and American Board of Family Medicine), mandatory mentorship program, or status quo with option for specialized training. There was considerable discussion of the alternatives in the PHM community. In 2012, the STP shared the results of Strengths-Weaknesses-Opportunities-Threats analyses—but did not issue a recommendation.17 The following year, a National PHM Leaders Conference was held to consider the various options. Participants concluded that the best path forward was to pursue subspecialty certification with a requirement for 2 years of fellowship (after a time-limited period for practice pathway eligibility). Two years of fellowship was a departure from the ABP’s standard 3 years, but seemed acceptable based on the expectation that the research component would be integrated with clinical activities (eg, QI), rather than separate bench research. The ABP Initiative on Subspecialty Clinical Training and Certification had recommended flexibility in the duration of fellowships,18 and PHM became the first discipline to take advantage of such flexibility. Following an 18-month review of multiple considerations, the ABP concluded that “children will be better served by establishing the discipline as a new subspecialty.”19
The decision to pursue subspecialty certification was not unanimously embraced by the PHM community, with particular concerns expressed regarding the impact on Med-Peds hospitalists and the future in community hospitals. These were considered by the individuals writing the formal proposal to the ABP, but have not been resolved. Moreover, criteria for eligibility for the certifying examination under the Practice Pathway (“grandparenting”) evoked controversy,20 addressed by the ABP. 21 The first subspecialty certifying examination was ultimately administered to ~1,500 pediatric hospitalists in 2019.
THE ONGOING EVOLUTION OF PEDIATRIC HOSPITAL MEDICINE
It is clear that PHM has established itself as a field, with networks for research and quality improvement, more than 50 fellowship programs, divisions in prestigious departments of pediatrics and children’s hospitals, devoted journals and textbooks, and a well-attended annual meeting. PHM has set standards for the core competencies in PHM,11, 12 for pediatric hospitalist programs,22, 23 for coordinating the hospital care of children,24, 25 for the curricular framework of fellowships,26 and for the Entrustable Professional Activities expected of a hospitalist.27 The vision for the future is that continued efforts in research, quality and systems improvement, and clinical care will, in fact, result in significant benefits for all hospitalized children. Such was the promise of PHM in the 1990s and remains so in 2019.
Acknowledgments
For prompting the project: Rachel Marek. For additions, corrections, and confirmations: David Alexander, Niccole Alexander, Paul Bellet, David Bertoch, Douglas Carlson, Laura Degnon, Kimberly Durham, Barrett Fromme, Sandy Gage, Matthew Garber, Karen Jerardi, Christopher Landrigan, Gail McGuinness, Jennifer Maniscalco, Sandy Melzer, Vineeta Mittal, Karen Kingry Olson, Mary Ottolini, Jack Percelay, Kris Rehm, Michael Ruhlen, Samir Shah, Suzanne Woods, and David Zipes.
Disclosures
The authors have nothing to disclose.
1. Wachter RM, Goldman L. The emerging role of “hospitalists” in the American health care system. N Engl J Med. 1996;335:514-517. https://doi.org/10.1056/NEJM199608153350713.
2. Bellet PS, Wachter RM. The hospitalist movement and its implications for the care of hospitalized children. Pediatrics. 1999;103(2):473-477. https://doi.org/10.1542/peds.103.2.473.
3. Roberts KB, Rappo P. A hospitalist movement? Where to? Pediatrics. 1999;103(2):497. https://doi.org/10.1542/peds.103.2.497.
4. Cohen JJ, Dickler RM. Auditing the Medicare-billing practices of teaching physicians—Welcome accountability, unfair approach. N Engl J Med. 1997;336(18):1317-1320. https://doi.org/10.1056/NEJM199705013361811.
5. Swing SR. The ACGME outcome project: Retrospective and prospective. Med Teach. 2007;29(7):648-654. https://doi.org/10.1080/01421590701392903.
6. Institute of Medicine. To Err is Human: Building a Safer Health System. Washington, DC: The National Academies Press; 2000.
7. Committee on Quality Health Care in America, Institute of Medicine. Crossing the Quality Chasm: A New Health System for the 21st Century. Washington, DC: National Academy Press; 2001.
8. Accreditation Council for Graduate Medical Education. History of Duty Hours. Available at https://www.acgme.org/What-We-Do/Accreditation/Clinical-Experience-and-Education-formerly-Duty-Hours/History-of-Duty-Hours. Accessed January 16, 2020.
9. Oshimura JM, Sperring J, Bauer BD, Carroll AE, Rauch DA. Changes in inpatient staffing following implementation of new residency work hours. J Hosp Med. 2014;9(10):640-645. https://doi.org/10.1002/jhm.2242.
10. Stucky ER, Maniscalco J, Ottolini MC, et al. The Pediatric Hospital Medicine Core Competencies supplement: A framework for curriculum development by the Society of Hospital Medicine with acknowledgement to pediatric hospitalists from the American Academy of Pediatrics and the Academic Pediatric Association. J Hosp Med. 2010;5(Suppl 2):i-xv, 1-114. https://doi.org/10.1002/jhm.776.
11. Gage S, Maniscalco J, Fisher E. The Pediatric Hospital Medicine Core Competencies [published online first ahead of print April XX, 2020].
12. Blum K. Raising the profile of hospital medicine. Hopkins Children’s. 2018 Spring, p 32. https://www.hopkinsmedicine.org/johns-hopkins-childrens-center/_documents/_publications/hopkins_childrens_magazine_spring2018.pdf. Accessed January 16, 2020.
13. Roberts K, Stein R, Cheng T. The Academic Pediatric Association: The first fifty years. Acad Pediatr. 2011;11:173-180. https://doi.org/10.1016/j.acap.2011.02.001.
14. Rauch DA, Lye PS, Carlson D, et al. Pediatric Hospital Medicine: A strategic planning roundtable to chart the future. J Hosp Med. 2012;7(4):329-334. https://doi.org/10.1002/jhm.950.
15. Srivastava R, Landrigan CP. Development of the Pediatric Research in Inpatient Settings (PRIS) Network: Lessons learned. J Hosp Med. 2012;7(8)661-664. https://doi.org/10.1002/jhm.1972.
16. Freed GL, Uren RL. Hospitalists in children’s hospitals: What we know now and what we need to know. J Pediatr. 2006;148(3):296-299. https://doi.org/10.1016/j.jpeds.2005.12.048.
17. Maloney CG, Mendez SS, Quinonez RA, et al. The Strategic Planning Committee report: The first step in a journey to recognize pediatric hospital medicine as a distinct discipline. Hosp Pediatr. 2012;2(4):187-190. https://doi.org/10.1542/hpeds.2012-0048.
18. Stevenson DK, McGuiness GA, Bancroft JD, et al. The Initiative on Subspecialty Clinical Training and Certification (SCTC): Background and recommendations. Pediatrics. 2014;133(Suppl 2):S53-S57. https://doi.org/10.1542/peds.2013-3861C.
19. Barrett DJ, McGuinness GA, Cunha CA, et al. Pediatric hospital medicine: A proposed new subspecialty. Pediatrics. 2017;139(3):e20161823. https://doi.org/10.1542/peds.2016-1823.
20. Chang WW, Hopkins AM, Rehm KP, Gage SL, Shen M. Society of Hospital Medicine position on the American Board of Pediatrics response to the hospital medicine petition. J Hosp Med. 2019;14(10):589-590. https://doi.org/10.12788/jhm.3326.
21. Nichols DG, Woods SK. The American Board of Pediatrics response to the pediatric hospital medicine petition. J Hosp Med. 2019:14:E1-E3. https://doi.org/10.12788/jhm.3322.
22. American Academy of Pediatrics Section on Hospital Medicine. Guiding principles for pediatric hospitalist programs. Pediatrics. 2005;115:1101-1102.
23. American Academy of Pediatrics Section on Hospital Medicine. Guiding principles for pediatric hospitalist programs. Pediatrics. 2013;132(4):782-786. https://doi.org/10.1542/peds.2013-2269.
24. Lye PS, American Academy of Pediatrics Committee on Hospital Care, Section on Hospital Medicine. Clinical report—physicians’ roles in coordinating care of hospitalized children. Pediatrics. 2010;126(4):829-832.
25. Rauch DA, American Academy of Pediatrics Committee on Hospital Care, Section on Hospital Medicine. Physician’s role in coordinating care of hospitalized children. Pediatrics. 2018;142(2):e20181503. https://doi.org/10.1542/peds.2018-1503.
26. Jerardi KE, Fisher ER, Rassbach C, et al; on behalf of the Council of Pediatric Hospital Medicine Fellowship Directors. Development of a curricular framework for pediatric hospital medicine fellowships. Pediatrics. 2019;140(1):e20170698. https://doi.org/10.1542/peds.2017-0698.
27. American Board of Pediatrics. Pediatric hospital medicine entrustable professional activities. https://www.abp.org/subspecialty-epas#Hospitalist%20Medicine. Accessed August 31, 2019.
28. Perkin RM, Swift JD, Newton DA (Eds). Pediatric Hospital Medicine: Textbook of Inpatient Management. Philadelphia, PA: Lippincott Williams & Wilkins; 2003.
29. Frank F, Shah SS, Catallozzi M, Zaoutis L (Eds). The Philadelphia Guide: Inpatient Pediatrics. Philadelphia, PA: Lippincott Williams & Wilkins; 2005.
30. Zaoutis L, Chiang V (Eds). Comprehensive Pediatric Hospital Medicine. Philadelphia, PA: Mosby; 2007.
31. Rauch DA, Gershel J (Eds). Caring for the Hospitalized Child: A Handbook of Inpatient Pediatrics. Elk Grove Village, IL: American Academy of Pediatrics; 2013.
32. Rauch DA. Tribute to Jennifer Daru, MD. Hosp Pediatr. 2011;4(4):267-268.
1. Wachter RM, Goldman L. The emerging role of “hospitalists” in the American health care system. N Engl J Med. 1996;335:514-517. https://doi.org/10.1056/NEJM199608153350713.
2. Bellet PS, Wachter RM. The hospitalist movement and its implications for the care of hospitalized children. Pediatrics. 1999;103(2):473-477. https://doi.org/10.1542/peds.103.2.473.
3. Roberts KB, Rappo P. A hospitalist movement? Where to? Pediatrics. 1999;103(2):497. https://doi.org/10.1542/peds.103.2.497.
4. Cohen JJ, Dickler RM. Auditing the Medicare-billing practices of teaching physicians—Welcome accountability, unfair approach. N Engl J Med. 1997;336(18):1317-1320. https://doi.org/10.1056/NEJM199705013361811.
5. Swing SR. The ACGME outcome project: Retrospective and prospective. Med Teach. 2007;29(7):648-654. https://doi.org/10.1080/01421590701392903.
6. Institute of Medicine. To Err is Human: Building a Safer Health System. Washington, DC: The National Academies Press; 2000.
7. Committee on Quality Health Care in America, Institute of Medicine. Crossing the Quality Chasm: A New Health System for the 21st Century. Washington, DC: National Academy Press; 2001.
8. Accreditation Council for Graduate Medical Education. History of Duty Hours. Available at https://www.acgme.org/What-We-Do/Accreditation/Clinical-Experience-and-Education-formerly-Duty-Hours/History-of-Duty-Hours. Accessed January 16, 2020.
9. Oshimura JM, Sperring J, Bauer BD, Carroll AE, Rauch DA. Changes in inpatient staffing following implementation of new residency work hours. J Hosp Med. 2014;9(10):640-645. https://doi.org/10.1002/jhm.2242.
10. Stucky ER, Maniscalco J, Ottolini MC, et al. The Pediatric Hospital Medicine Core Competencies supplement: A framework for curriculum development by the Society of Hospital Medicine with acknowledgement to pediatric hospitalists from the American Academy of Pediatrics and the Academic Pediatric Association. J Hosp Med. 2010;5(Suppl 2):i-xv, 1-114. https://doi.org/10.1002/jhm.776.
11. Gage S, Maniscalco J, Fisher E. The Pediatric Hospital Medicine Core Competencies [published online first ahead of print April XX, 2020].
12. Blum K. Raising the profile of hospital medicine. Hopkins Children’s. 2018 Spring, p 32. https://www.hopkinsmedicine.org/johns-hopkins-childrens-center/_documents/_publications/hopkins_childrens_magazine_spring2018.pdf. Accessed January 16, 2020.
13. Roberts K, Stein R, Cheng T. The Academic Pediatric Association: The first fifty years. Acad Pediatr. 2011;11:173-180. https://doi.org/10.1016/j.acap.2011.02.001.
14. Rauch DA, Lye PS, Carlson D, et al. Pediatric Hospital Medicine: A strategic planning roundtable to chart the future. J Hosp Med. 2012;7(4):329-334. https://doi.org/10.1002/jhm.950.
15. Srivastava R, Landrigan CP. Development of the Pediatric Research in Inpatient Settings (PRIS) Network: Lessons learned. J Hosp Med. 2012;7(8)661-664. https://doi.org/10.1002/jhm.1972.
16. Freed GL, Uren RL. Hospitalists in children’s hospitals: What we know now and what we need to know. J Pediatr. 2006;148(3):296-299. https://doi.org/10.1016/j.jpeds.2005.12.048.
17. Maloney CG, Mendez SS, Quinonez RA, et al. The Strategic Planning Committee report: The first step in a journey to recognize pediatric hospital medicine as a distinct discipline. Hosp Pediatr. 2012;2(4):187-190. https://doi.org/10.1542/hpeds.2012-0048.
18. Stevenson DK, McGuiness GA, Bancroft JD, et al. The Initiative on Subspecialty Clinical Training and Certification (SCTC): Background and recommendations. Pediatrics. 2014;133(Suppl 2):S53-S57. https://doi.org/10.1542/peds.2013-3861C.
19. Barrett DJ, McGuinness GA, Cunha CA, et al. Pediatric hospital medicine: A proposed new subspecialty. Pediatrics. 2017;139(3):e20161823. https://doi.org/10.1542/peds.2016-1823.
20. Chang WW, Hopkins AM, Rehm KP, Gage SL, Shen M. Society of Hospital Medicine position on the American Board of Pediatrics response to the hospital medicine petition. J Hosp Med. 2019;14(10):589-590. https://doi.org/10.12788/jhm.3326.
21. Nichols DG, Woods SK. The American Board of Pediatrics response to the pediatric hospital medicine petition. J Hosp Med. 2019:14:E1-E3. https://doi.org/10.12788/jhm.3322.
22. American Academy of Pediatrics Section on Hospital Medicine. Guiding principles for pediatric hospitalist programs. Pediatrics. 2005;115:1101-1102.
23. American Academy of Pediatrics Section on Hospital Medicine. Guiding principles for pediatric hospitalist programs. Pediatrics. 2013;132(4):782-786. https://doi.org/10.1542/peds.2013-2269.
24. Lye PS, American Academy of Pediatrics Committee on Hospital Care, Section on Hospital Medicine. Clinical report—physicians’ roles in coordinating care of hospitalized children. Pediatrics. 2010;126(4):829-832.
25. Rauch DA, American Academy of Pediatrics Committee on Hospital Care, Section on Hospital Medicine. Physician’s role in coordinating care of hospitalized children. Pediatrics. 2018;142(2):e20181503. https://doi.org/10.1542/peds.2018-1503.
26. Jerardi KE, Fisher ER, Rassbach C, et al; on behalf of the Council of Pediatric Hospital Medicine Fellowship Directors. Development of a curricular framework for pediatric hospital medicine fellowships. Pediatrics. 2019;140(1):e20170698. https://doi.org/10.1542/peds.2017-0698.
27. American Board of Pediatrics. Pediatric hospital medicine entrustable professional activities. https://www.abp.org/subspecialty-epas#Hospitalist%20Medicine. Accessed August 31, 2019.
28. Perkin RM, Swift JD, Newton DA (Eds). Pediatric Hospital Medicine: Textbook of Inpatient Management. Philadelphia, PA: Lippincott Williams & Wilkins; 2003.
29. Frank F, Shah SS, Catallozzi M, Zaoutis L (Eds). The Philadelphia Guide: Inpatient Pediatrics. Philadelphia, PA: Lippincott Williams & Wilkins; 2005.
30. Zaoutis L, Chiang V (Eds). Comprehensive Pediatric Hospital Medicine. Philadelphia, PA: Mosby; 2007.
31. Rauch DA, Gershel J (Eds). Caring for the Hospitalized Child: A Handbook of Inpatient Pediatrics. Elk Grove Village, IL: American Academy of Pediatrics; 2013.
32. Rauch DA. Tribute to Jennifer Daru, MD. Hosp Pediatr. 2011;4(4):267-268.
© 2020 Society of Hospital Medicine
Methodological Progress Note: Classification and Regression Tree Analysis
Machine-learning is a type of artificial intelligence in which systems automatically learn and improve from experience without being explicitly programmed. Classification and Regression Tree (CART) analysis is a machine-learning algorithm that was developed to visually classify or segment populations into subgroups with similar characteristics and outcomes. CART analysis is a decision tree methodology that was initially developed in the 1960s for use in product marketing.1 Since then, a number of health disciplines have used it to isolate patient subgroups from larger populations to guide clinical decision-making by better identifying those most likely to benefit.2 The clinical utility of CART mirrors how most clinicians think, which is not in terms of coefficients (ie, regression output) but rather in terms of categories or classifications (eg, low vs high risk).
In this issue of the Journal of Hospital Medicine, Young and colleagues use classification trees to predict discharge placement (postacute care facility vs home) based on a patient’s hospital admission characteristics and mobility score. The resulting decision tree indicates that patients with the lowest mobility scores, as well as those 65 years and older, were most likely to be discharged to postacute care facilities.3 In this review, we orient the reader to the basics of CART analysis, discuss important intricacies, and weigh its pros, cons, and application as a statistical tool.
WHAT IS CART ANALYSIS?
CART is a nonparametric (ie, makes no assumptions about data distribution) statistical tool that identifies subgroups within a population whose members share common characteristics as defined by the independent variables included in the model. CART analysis is unique in that it yields a visual output of the data in the form of a multisegmented structure that resembles the branches of a tree (Figure). CART analysis consists of four basic steps: (1) tree-building (including splitting criteria and estimation of classification error), (2) stopping the tree-building process, (3) tree “pruning,” and (4) tree selection.
In general, CART analysis begins with a single “node” or group, which contains the entire sample population. This is referred to as the “parent node.” The CART procedure simultaneously examines all available independent variables and selects one that results in two groups that are the most distinct with respect to the outcome variable of interest. In Young et al’s example, posthospital discharge placement is the outcome.3 This parent node then branches into two “child nodes” according to the independent variable that was selected. Within each of these “child nodes,” the tree-growing methodology recursively assesses each of the remaining independent variables to determine which will result in the best split according to the chosen splitting criterion.2 Each subsequent “child node” will become a “parent node” to the two groups in which it splits. This process is repeated on the data in each subsequent “child node” and is stopped once a predefined stopping point is reached. Notably, while division into two groups is the most common application of CART modeling, there are models that can split data into more than two child nodes.
Since CART outcomes can be heavily dependent on the data being used (eg, electronic health records or administrative data), it is important to attempt to confirm results in a similar, but different, study cohort. Because obtaining separate data sources with similar cohorts can be difficult, many investigators using CART will utilize a “split sample approach” in which study data are split into separate training and validation sets.4 In the training set, which frequently comprises two-thirds of the available data, the algorithm is tested in exploratory analysis. Once the algorithm is defined and agreed upon, it is retested within a validation set, constructed from the remaining one-third of data. This approach, which Young et al utilize,3 allows for improved confidence and reduced risk of bias in the findings and allows for some degree of external validation. Further, the split sample approach supports more reliable measures of predictive accuracy: in Young et al’s case, the proportion of correctly classified patients discharged to a postacute care facility (sensitivity: 58%, 95% CI 49-68%) and the proportion of correctly classified patients discharged home (specificity: 84%, 95% CI 78-90%). Despite these advantages, the split sample approach is not universally used.
Classification Versus Regression Trees
While commonly grouped together, CARTs can be distinguished from one another based on the dependent, or outcome, variable. Categorical outcome variables require the use of a classification tree, while continuous outcomes utilize regression trees. Of note, the independent, or predictor, variables can be any combination of categorical or continuous variables. However, splitting at each node creates categorical output when using CART algorithms.
Splitting Criteria
The splitting of each node is based on reducing the degree of “impurity” (heterogeneity with respect to the outcome variable) within each node. For example, a node that has no impurity will have a zero error rate labeling its binary outcomes. While CART works well with categorical variables, continuous variables (eg, age) can also be assessed, though only with certain algorithms. Several different splitting criteria exist, each of which attempt to maximize the differences within each child node. While beyond the scope of this review, examples of popular splitting criteria are Gini, entropy, and minimum error.5
Stopping Rules
To manage the size of a tree, CART analysis allows for predefined stopping rules to minimize the extent of growth while also establishing a minimal degree of statistical difference between nodes that is considered meaningful. To accomplish this task, two stopping rules are often used. The first defines the minimum number of observations in child, or “terminal,” nodes. The second defines the maximum number of levels a tree may grow, thus allowing the investigator to decide the total number of predictor variables that can define a terminal node. While several other stopping rules exist, these are the most commonly utilized.
Pruning
To avoid missing important associations due to premature stoppage, investigators may use another mechanism to limit tree growth called “pruning.” For pruning, the first step is to grow a considerably large tree that includes many levels or nodes, possibly to the point where there are just a few observations per terminal node. Then, similar to the residual sum of squares in a regression, the investigator can calculate a misclassification cost (ie, goodness of fit) and select the tree with the smallest cost.2 Of note, stopping rules and pruning can be used simultaneously.
Classification Error
Similar to other forms of statistical inference it remains important to understand the uncertainty within the inference. In regression modeling, for example, classification errors can be calculated using standard errors of the parameter estimates. In CART analysis, because random samples from a population may produce different trees, measures of variability can be more complicated. One strategy is to generate a tree from a test sample and then use the remaining data to calculate a measure of the misclassification cost (a measure of how much additional accuracy a split must add to the entire tree to warrant the additional complexity). Alternatively, a “k-fold cross-validation” can be performed in which the data is broken down into k subsets from which a tree is created using all data except for one of the subsets. The computed tree is then applied to the remaining subset to determine a misclassification cost. These classification costs are important as they also impact the stopping and pruning processes. Ultimately, a final tree, which best limits classification errors, is selected.
WHEN WOULD YOU USE CART ANALYSIS?
This method can be useful in multiple settings in which an investigator wants to characterize a subpopulation from a larger cohort. Adaptation of this could include, but is not limited to, risk stratification,6 diagnostics,7 and patient identification for medical interventions.8 Moreover, CART analysis has the added benefit of creating visually interpretable predictive models that can be utilized for front-line clinical decision making.9,10
STRENGTHS OF CART ANALYSIS
CART analysis has been shown to have several advantages over other commonly used modeling methods. First, it is a nonparametric model that can handle highly skewed data and does not require that the predictor, or predictors, takes on a predetermined form (allowing them to be constructed from the data). This is helpful as many clinical variables can have wide degrees of variance.
Unlike other modeling techniques, CART can identify higher-order interactions between multiple variables, meaning it can handle interactions that occur whenever one variable affects the nature of an interaction between two other variables. Further, CART can handle multiple correlated independent variables, something logistic regression models classically cannot do.
From a clinical standpoint, the “logic” of the visual-based CART output can be easier to interpret than the probabilistic output (eg, odds ratio) associated with logistic regression modeling, making it more practical, applicable, and easier for clinicians to adopt.10,12 Finally, CART software is easy to use for those who do not have strong statistical backgrounds, and it is less resource intensive than other statistical methods.2
LIMITATIONS OF CART ANALYSIS
Despite these features, CART does have several disadvantages. First, due to the ease with which CART analysis can be performed, “data dredging” can be a significant concern. Its ideal use is with a priori consideration of independent variables.2 Second, while CART is most beneficial in describing links and cutoffs between variables, it may not be useful for hypothesis testing.2 Third, large data sets are needed to perform CART, especially if the investigator is using the split sample approach mentioned above.11 Finally, while CART is the most utilized decision tree methodology, several other types of decision tree methods exist: C4.5, CRUISE, Quick, Unbiased, Efficient Statistical Trees, Chi-square-Automatic-Interaction-Detection, and others. Many of these allow for splitting into more than two groups and have other features that may be more advantageous to one’s analysis.13
WHY DID THE AUTHORS USE CART?
Decision trees offer simple, interpretable results of multiple factors that can be easily applied to clinical scenarios. In this case, the authors specifically used classification tree analysis to take advantage of CART’s machine-learning ability to consider higher-order interactions to build their model—as they lacked a priori evidence to help guide them in traditional (ie, logistic regression) model construction. Furthermore, CART analysis created an output that logically and visually illustrates which combination of characteristics is most associated with discharge placement and can potentially be utilized to help facilitate discharge planning in future hospitalized patients. To sum up, this machine-learning methodology allowed the investigators to determine which variables taken together were the most suitable in predicting their outcome of interest and present these findings in a manner that busy clinicians can interpret and apply.
1. Magee JF. Decision Trees for Decision Making. Harvard Business Review. 1964. https://hbr.org/1964/07/decision-trees-for-decision-making. Accessed August 26, 2019.
2. Lemon SC, Roy J, Clark MA, Friedmann PD, Rakowski W. Classification and regression tree analysis in public health: methodological review and comparison with logistic regression. Ann Behav Med. 2003;26(3):172-181. https://doi.org/10.1207/S15324796ABM2603_02
3. Young D, Colantuoni E, Seltzer D, et al. Prediction of disposition within 48-hours of hospital admission using patient mobility scores. J Hosp Med. 2020;15(9):540-543. https://doi.org/10.12788/jhm.3332
4. Rajkomar A, Dean J, Kohane I. Machine learning in medicine. N Engl J Med. 2019;380(14):1347-1358. https://doi.org/10.1056/NEJMra1814259
5. Zhang H, Singer B. Recursive Partitioning in the Health Sciences. New York: Springer-Verlag; 1999. https://www.springer.com/gp/book/9781475730272. Accessed August 24, 2019.
6. Fonarow GC, Adams KF, Abraham WT, Yancy CW, Boscardin WJ, for the ADHERE Scientific Advisory Committee SG. Risk stratification for in-hospital mortality in acutely decompensated heart failure: classification and regression tree analysis. JAMA. 2005;293(5):572-580. https://doi.org/10.1001/jama.293.5.572
7. Hess KR, Abbruzzese MC, Lenzi R, Raber MN, Abbruzzese JL. Classification and regression tree analysis of 1000 consecutive patients with unknown primary carcinoma. Clin Cancer Res. 1999;5(11):3403-3410.
8. Garzotto M, Beer TM, Hudson RG, et al. Improved detection of prostate cancer using classification and regression tree analysis. J Clin Oncol. 2005;23(19):4322-4329. https://doi.org/10.1200/JCO.2005.11.136
9. Hong W, Dong L, Huang Q, Wu W, Wu J, Wang Y. Prediction of severe acute pancreatitis using classification and regression tree analysis. Dig Dis Sci. 2011;56(12):3664-3671. https://doi.org/10.1007/s10620-011-1849-x
10. Lewis RJ. An Introduction to Classification and Regression Tree (CART) Analysis. Proceedings of Annual Meeting of the Society for Academic Emergency Medicine, San Francisco, CA, USA, May 22-25, 2000; pp. 1–14.
11. Perlich C, Provost F, Simonoff JS. Tree induction vs logistic regression: a learning-curve analysis. J Mach Learn Res. 2003;4(Jun):211-255. https://doi.org/10.1162/153244304322972694
12. Woolever D. The art and science of clinical decision making. Fam Pract Manag. 2008;15(5):31-36.
13. Loh WY. Classification and regression trees. Wires Data Min Know Disc. 2011;1(1):14-23. https://doi.org/10.1002/widm.8
Machine-learning is a type of artificial intelligence in which systems automatically learn and improve from experience without being explicitly programmed. Classification and Regression Tree (CART) analysis is a machine-learning algorithm that was developed to visually classify or segment populations into subgroups with similar characteristics and outcomes. CART analysis is a decision tree methodology that was initially developed in the 1960s for use in product marketing.1 Since then, a number of health disciplines have used it to isolate patient subgroups from larger populations to guide clinical decision-making by better identifying those most likely to benefit.2 The clinical utility of CART mirrors how most clinicians think, which is not in terms of coefficients (ie, regression output) but rather in terms of categories or classifications (eg, low vs high risk).
In this issue of the Journal of Hospital Medicine, Young and colleagues use classification trees to predict discharge placement (postacute care facility vs home) based on a patient’s hospital admission characteristics and mobility score. The resulting decision tree indicates that patients with the lowest mobility scores, as well as those 65 years and older, were most likely to be discharged to postacute care facilities.3 In this review, we orient the reader to the basics of CART analysis, discuss important intricacies, and weigh its pros, cons, and application as a statistical tool.
WHAT IS CART ANALYSIS?
CART is a nonparametric (ie, makes no assumptions about data distribution) statistical tool that identifies subgroups within a population whose members share common characteristics as defined by the independent variables included in the model. CART analysis is unique in that it yields a visual output of the data in the form of a multisegmented structure that resembles the branches of a tree (Figure). CART analysis consists of four basic steps: (1) tree-building (including splitting criteria and estimation of classification error), (2) stopping the tree-building process, (3) tree “pruning,” and (4) tree selection.
In general, CART analysis begins with a single “node” or group, which contains the entire sample population. This is referred to as the “parent node.” The CART procedure simultaneously examines all available independent variables and selects one that results in two groups that are the most distinct with respect to the outcome variable of interest. In Young et al’s example, posthospital discharge placement is the outcome.3 This parent node then branches into two “child nodes” according to the independent variable that was selected. Within each of these “child nodes,” the tree-growing methodology recursively assesses each of the remaining independent variables to determine which will result in the best split according to the chosen splitting criterion.2 Each subsequent “child node” will become a “parent node” to the two groups in which it splits. This process is repeated on the data in each subsequent “child node” and is stopped once a predefined stopping point is reached. Notably, while division into two groups is the most common application of CART modeling, there are models that can split data into more than two child nodes.
Since CART outcomes can be heavily dependent on the data being used (eg, electronic health records or administrative data), it is important to attempt to confirm results in a similar, but different, study cohort. Because obtaining separate data sources with similar cohorts can be difficult, many investigators using CART will utilize a “split sample approach” in which study data are split into separate training and validation sets.4 In the training set, which frequently comprises two-thirds of the available data, the algorithm is tested in exploratory analysis. Once the algorithm is defined and agreed upon, it is retested within a validation set, constructed from the remaining one-third of data. This approach, which Young et al utilize,3 allows for improved confidence and reduced risk of bias in the findings and allows for some degree of external validation. Further, the split sample approach supports more reliable measures of predictive accuracy: in Young et al’s case, the proportion of correctly classified patients discharged to a postacute care facility (sensitivity: 58%, 95% CI 49-68%) and the proportion of correctly classified patients discharged home (specificity: 84%, 95% CI 78-90%). Despite these advantages, the split sample approach is not universally used.
Classification Versus Regression Trees
While commonly grouped together, CARTs can be distinguished from one another based on the dependent, or outcome, variable. Categorical outcome variables require the use of a classification tree, while continuous outcomes utilize regression trees. Of note, the independent, or predictor, variables can be any combination of categorical or continuous variables. However, splitting at each node creates categorical output when using CART algorithms.
Splitting Criteria
The splitting of each node is based on reducing the degree of “impurity” (heterogeneity with respect to the outcome variable) within each node. For example, a node that has no impurity will have a zero error rate labeling its binary outcomes. While CART works well with categorical variables, continuous variables (eg, age) can also be assessed, though only with certain algorithms. Several different splitting criteria exist, each of which attempt to maximize the differences within each child node. While beyond the scope of this review, examples of popular splitting criteria are Gini, entropy, and minimum error.5
Stopping Rules
To manage the size of a tree, CART analysis allows for predefined stopping rules to minimize the extent of growth while also establishing a minimal degree of statistical difference between nodes that is considered meaningful. To accomplish this task, two stopping rules are often used. The first defines the minimum number of observations in child, or “terminal,” nodes. The second defines the maximum number of levels a tree may grow, thus allowing the investigator to decide the total number of predictor variables that can define a terminal node. While several other stopping rules exist, these are the most commonly utilized.
Pruning
To avoid missing important associations due to premature stoppage, investigators may use another mechanism to limit tree growth called “pruning.” For pruning, the first step is to grow a considerably large tree that includes many levels or nodes, possibly to the point where there are just a few observations per terminal node. Then, similar to the residual sum of squares in a regression, the investigator can calculate a misclassification cost (ie, goodness of fit) and select the tree with the smallest cost.2 Of note, stopping rules and pruning can be used simultaneously.
Classification Error
Similar to other forms of statistical inference it remains important to understand the uncertainty within the inference. In regression modeling, for example, classification errors can be calculated using standard errors of the parameter estimates. In CART analysis, because random samples from a population may produce different trees, measures of variability can be more complicated. One strategy is to generate a tree from a test sample and then use the remaining data to calculate a measure of the misclassification cost (a measure of how much additional accuracy a split must add to the entire tree to warrant the additional complexity). Alternatively, a “k-fold cross-validation” can be performed in which the data is broken down into k subsets from which a tree is created using all data except for one of the subsets. The computed tree is then applied to the remaining subset to determine a misclassification cost. These classification costs are important as they also impact the stopping and pruning processes. Ultimately, a final tree, which best limits classification errors, is selected.
WHEN WOULD YOU USE CART ANALYSIS?
This method can be useful in multiple settings in which an investigator wants to characterize a subpopulation from a larger cohort. Adaptation of this could include, but is not limited to, risk stratification,6 diagnostics,7 and patient identification for medical interventions.8 Moreover, CART analysis has the added benefit of creating visually interpretable predictive models that can be utilized for front-line clinical decision making.9,10
STRENGTHS OF CART ANALYSIS
CART analysis has been shown to have several advantages over other commonly used modeling methods. First, it is a nonparametric model that can handle highly skewed data and does not require that the predictor, or predictors, takes on a predetermined form (allowing them to be constructed from the data). This is helpful as many clinical variables can have wide degrees of variance.
Unlike other modeling techniques, CART can identify higher-order interactions between multiple variables, meaning it can handle interactions that occur whenever one variable affects the nature of an interaction between two other variables. Further, CART can handle multiple correlated independent variables, something logistic regression models classically cannot do.
From a clinical standpoint, the “logic” of the visual-based CART output can be easier to interpret than the probabilistic output (eg, odds ratio) associated with logistic regression modeling, making it more practical, applicable, and easier for clinicians to adopt.10,12 Finally, CART software is easy to use for those who do not have strong statistical backgrounds, and it is less resource intensive than other statistical methods.2
LIMITATIONS OF CART ANALYSIS
Despite these features, CART does have several disadvantages. First, due to the ease with which CART analysis can be performed, “data dredging” can be a significant concern. Its ideal use is with a priori consideration of independent variables.2 Second, while CART is most beneficial in describing links and cutoffs between variables, it may not be useful for hypothesis testing.2 Third, large data sets are needed to perform CART, especially if the investigator is using the split sample approach mentioned above.11 Finally, while CART is the most utilized decision tree methodology, several other types of decision tree methods exist: C4.5, CRUISE, Quick, Unbiased, Efficient Statistical Trees, Chi-square-Automatic-Interaction-Detection, and others. Many of these allow for splitting into more than two groups and have other features that may be more advantageous to one’s analysis.13
WHY DID THE AUTHORS USE CART?
Decision trees offer simple, interpretable results of multiple factors that can be easily applied to clinical scenarios. In this case, the authors specifically used classification tree analysis to take advantage of CART’s machine-learning ability to consider higher-order interactions to build their model—as they lacked a priori evidence to help guide them in traditional (ie, logistic regression) model construction. Furthermore, CART analysis created an output that logically and visually illustrates which combination of characteristics is most associated with discharge placement and can potentially be utilized to help facilitate discharge planning in future hospitalized patients. To sum up, this machine-learning methodology allowed the investigators to determine which variables taken together were the most suitable in predicting their outcome of interest and present these findings in a manner that busy clinicians can interpret and apply.
Machine-learning is a type of artificial intelligence in which systems automatically learn and improve from experience without being explicitly programmed. Classification and Regression Tree (CART) analysis is a machine-learning algorithm that was developed to visually classify or segment populations into subgroups with similar characteristics and outcomes. CART analysis is a decision tree methodology that was initially developed in the 1960s for use in product marketing.1 Since then, a number of health disciplines have used it to isolate patient subgroups from larger populations to guide clinical decision-making by better identifying those most likely to benefit.2 The clinical utility of CART mirrors how most clinicians think, which is not in terms of coefficients (ie, regression output) but rather in terms of categories or classifications (eg, low vs high risk).
In this issue of the Journal of Hospital Medicine, Young and colleagues use classification trees to predict discharge placement (postacute care facility vs home) based on a patient’s hospital admission characteristics and mobility score. The resulting decision tree indicates that patients with the lowest mobility scores, as well as those 65 years and older, were most likely to be discharged to postacute care facilities.3 In this review, we orient the reader to the basics of CART analysis, discuss important intricacies, and weigh its pros, cons, and application as a statistical tool.
WHAT IS CART ANALYSIS?
CART is a nonparametric (ie, makes no assumptions about data distribution) statistical tool that identifies subgroups within a population whose members share common characteristics as defined by the independent variables included in the model. CART analysis is unique in that it yields a visual output of the data in the form of a multisegmented structure that resembles the branches of a tree (Figure). CART analysis consists of four basic steps: (1) tree-building (including splitting criteria and estimation of classification error), (2) stopping the tree-building process, (3) tree “pruning,” and (4) tree selection.
In general, CART analysis begins with a single “node” or group, which contains the entire sample population. This is referred to as the “parent node.” The CART procedure simultaneously examines all available independent variables and selects one that results in two groups that are the most distinct with respect to the outcome variable of interest. In Young et al’s example, posthospital discharge placement is the outcome.3 This parent node then branches into two “child nodes” according to the independent variable that was selected. Within each of these “child nodes,” the tree-growing methodology recursively assesses each of the remaining independent variables to determine which will result in the best split according to the chosen splitting criterion.2 Each subsequent “child node” will become a “parent node” to the two groups in which it splits. This process is repeated on the data in each subsequent “child node” and is stopped once a predefined stopping point is reached. Notably, while division into two groups is the most common application of CART modeling, there are models that can split data into more than two child nodes.
Since CART outcomes can be heavily dependent on the data being used (eg, electronic health records or administrative data), it is important to attempt to confirm results in a similar, but different, study cohort. Because obtaining separate data sources with similar cohorts can be difficult, many investigators using CART will utilize a “split sample approach” in which study data are split into separate training and validation sets.4 In the training set, which frequently comprises two-thirds of the available data, the algorithm is tested in exploratory analysis. Once the algorithm is defined and agreed upon, it is retested within a validation set, constructed from the remaining one-third of data. This approach, which Young et al utilize,3 allows for improved confidence and reduced risk of bias in the findings and allows for some degree of external validation. Further, the split sample approach supports more reliable measures of predictive accuracy: in Young et al’s case, the proportion of correctly classified patients discharged to a postacute care facility (sensitivity: 58%, 95% CI 49-68%) and the proportion of correctly classified patients discharged home (specificity: 84%, 95% CI 78-90%). Despite these advantages, the split sample approach is not universally used.
Classification Versus Regression Trees
While commonly grouped together, CARTs can be distinguished from one another based on the dependent, or outcome, variable. Categorical outcome variables require the use of a classification tree, while continuous outcomes utilize regression trees. Of note, the independent, or predictor, variables can be any combination of categorical or continuous variables. However, splitting at each node creates categorical output when using CART algorithms.
Splitting Criteria
The splitting of each node is based on reducing the degree of “impurity” (heterogeneity with respect to the outcome variable) within each node. For example, a node that has no impurity will have a zero error rate labeling its binary outcomes. While CART works well with categorical variables, continuous variables (eg, age) can also be assessed, though only with certain algorithms. Several different splitting criteria exist, each of which attempt to maximize the differences within each child node. While beyond the scope of this review, examples of popular splitting criteria are Gini, entropy, and minimum error.5
Stopping Rules
To manage the size of a tree, CART analysis allows for predefined stopping rules to minimize the extent of growth while also establishing a minimal degree of statistical difference between nodes that is considered meaningful. To accomplish this task, two stopping rules are often used. The first defines the minimum number of observations in child, or “terminal,” nodes. The second defines the maximum number of levels a tree may grow, thus allowing the investigator to decide the total number of predictor variables that can define a terminal node. While several other stopping rules exist, these are the most commonly utilized.
Pruning
To avoid missing important associations due to premature stoppage, investigators may use another mechanism to limit tree growth called “pruning.” For pruning, the first step is to grow a considerably large tree that includes many levels or nodes, possibly to the point where there are just a few observations per terminal node. Then, similar to the residual sum of squares in a regression, the investigator can calculate a misclassification cost (ie, goodness of fit) and select the tree with the smallest cost.2 Of note, stopping rules and pruning can be used simultaneously.
Classification Error
Similar to other forms of statistical inference it remains important to understand the uncertainty within the inference. In regression modeling, for example, classification errors can be calculated using standard errors of the parameter estimates. In CART analysis, because random samples from a population may produce different trees, measures of variability can be more complicated. One strategy is to generate a tree from a test sample and then use the remaining data to calculate a measure of the misclassification cost (a measure of how much additional accuracy a split must add to the entire tree to warrant the additional complexity). Alternatively, a “k-fold cross-validation” can be performed in which the data is broken down into k subsets from which a tree is created using all data except for one of the subsets. The computed tree is then applied to the remaining subset to determine a misclassification cost. These classification costs are important as they also impact the stopping and pruning processes. Ultimately, a final tree, which best limits classification errors, is selected.
WHEN WOULD YOU USE CART ANALYSIS?
This method can be useful in multiple settings in which an investigator wants to characterize a subpopulation from a larger cohort. Adaptation of this could include, but is not limited to, risk stratification,6 diagnostics,7 and patient identification for medical interventions.8 Moreover, CART analysis has the added benefit of creating visually interpretable predictive models that can be utilized for front-line clinical decision making.9,10
STRENGTHS OF CART ANALYSIS
CART analysis has been shown to have several advantages over other commonly used modeling methods. First, it is a nonparametric model that can handle highly skewed data and does not require that the predictor, or predictors, takes on a predetermined form (allowing them to be constructed from the data). This is helpful as many clinical variables can have wide degrees of variance.
Unlike other modeling techniques, CART can identify higher-order interactions between multiple variables, meaning it can handle interactions that occur whenever one variable affects the nature of an interaction between two other variables. Further, CART can handle multiple correlated independent variables, something logistic regression models classically cannot do.
From a clinical standpoint, the “logic” of the visual-based CART output can be easier to interpret than the probabilistic output (eg, odds ratio) associated with logistic regression modeling, making it more practical, applicable, and easier for clinicians to adopt.10,12 Finally, CART software is easy to use for those who do not have strong statistical backgrounds, and it is less resource intensive than other statistical methods.2
LIMITATIONS OF CART ANALYSIS
Despite these features, CART does have several disadvantages. First, due to the ease with which CART analysis can be performed, “data dredging” can be a significant concern. Its ideal use is with a priori consideration of independent variables.2 Second, while CART is most beneficial in describing links and cutoffs between variables, it may not be useful for hypothesis testing.2 Third, large data sets are needed to perform CART, especially if the investigator is using the split sample approach mentioned above.11 Finally, while CART is the most utilized decision tree methodology, several other types of decision tree methods exist: C4.5, CRUISE, Quick, Unbiased, Efficient Statistical Trees, Chi-square-Automatic-Interaction-Detection, and others. Many of these allow for splitting into more than two groups and have other features that may be more advantageous to one’s analysis.13
WHY DID THE AUTHORS USE CART?
Decision trees offer simple, interpretable results of multiple factors that can be easily applied to clinical scenarios. In this case, the authors specifically used classification tree analysis to take advantage of CART’s machine-learning ability to consider higher-order interactions to build their model—as they lacked a priori evidence to help guide them in traditional (ie, logistic regression) model construction. Furthermore, CART analysis created an output that logically and visually illustrates which combination of characteristics is most associated with discharge placement and can potentially be utilized to help facilitate discharge planning in future hospitalized patients. To sum up, this machine-learning methodology allowed the investigators to determine which variables taken together were the most suitable in predicting their outcome of interest and present these findings in a manner that busy clinicians can interpret and apply.
1. Magee JF. Decision Trees for Decision Making. Harvard Business Review. 1964. https://hbr.org/1964/07/decision-trees-for-decision-making. Accessed August 26, 2019.
2. Lemon SC, Roy J, Clark MA, Friedmann PD, Rakowski W. Classification and regression tree analysis in public health: methodological review and comparison with logistic regression. Ann Behav Med. 2003;26(3):172-181. https://doi.org/10.1207/S15324796ABM2603_02
3. Young D, Colantuoni E, Seltzer D, et al. Prediction of disposition within 48-hours of hospital admission using patient mobility scores. J Hosp Med. 2020;15(9):540-543. https://doi.org/10.12788/jhm.3332
4. Rajkomar A, Dean J, Kohane I. Machine learning in medicine. N Engl J Med. 2019;380(14):1347-1358. https://doi.org/10.1056/NEJMra1814259
5. Zhang H, Singer B. Recursive Partitioning in the Health Sciences. New York: Springer-Verlag; 1999. https://www.springer.com/gp/book/9781475730272. Accessed August 24, 2019.
6. Fonarow GC, Adams KF, Abraham WT, Yancy CW, Boscardin WJ, for the ADHERE Scientific Advisory Committee SG. Risk stratification for in-hospital mortality in acutely decompensated heart failure: classification and regression tree analysis. JAMA. 2005;293(5):572-580. https://doi.org/10.1001/jama.293.5.572
7. Hess KR, Abbruzzese MC, Lenzi R, Raber MN, Abbruzzese JL. Classification and regression tree analysis of 1000 consecutive patients with unknown primary carcinoma. Clin Cancer Res. 1999;5(11):3403-3410.
8. Garzotto M, Beer TM, Hudson RG, et al. Improved detection of prostate cancer using classification and regression tree analysis. J Clin Oncol. 2005;23(19):4322-4329. https://doi.org/10.1200/JCO.2005.11.136
9. Hong W, Dong L, Huang Q, Wu W, Wu J, Wang Y. Prediction of severe acute pancreatitis using classification and regression tree analysis. Dig Dis Sci. 2011;56(12):3664-3671. https://doi.org/10.1007/s10620-011-1849-x
10. Lewis RJ. An Introduction to Classification and Regression Tree (CART) Analysis. Proceedings of Annual Meeting of the Society for Academic Emergency Medicine, San Francisco, CA, USA, May 22-25, 2000; pp. 1–14.
11. Perlich C, Provost F, Simonoff JS. Tree induction vs logistic regression: a learning-curve analysis. J Mach Learn Res. 2003;4(Jun):211-255. https://doi.org/10.1162/153244304322972694
12. Woolever D. The art and science of clinical decision making. Fam Pract Manag. 2008;15(5):31-36.
13. Loh WY. Classification and regression trees. Wires Data Min Know Disc. 2011;1(1):14-23. https://doi.org/10.1002/widm.8
1. Magee JF. Decision Trees for Decision Making. Harvard Business Review. 1964. https://hbr.org/1964/07/decision-trees-for-decision-making. Accessed August 26, 2019.
2. Lemon SC, Roy J, Clark MA, Friedmann PD, Rakowski W. Classification and regression tree analysis in public health: methodological review and comparison with logistic regression. Ann Behav Med. 2003;26(3):172-181. https://doi.org/10.1207/S15324796ABM2603_02
3. Young D, Colantuoni E, Seltzer D, et al. Prediction of disposition within 48-hours of hospital admission using patient mobility scores. J Hosp Med. 2020;15(9):540-543. https://doi.org/10.12788/jhm.3332
4. Rajkomar A, Dean J, Kohane I. Machine learning in medicine. N Engl J Med. 2019;380(14):1347-1358. https://doi.org/10.1056/NEJMra1814259
5. Zhang H, Singer B. Recursive Partitioning in the Health Sciences. New York: Springer-Verlag; 1999. https://www.springer.com/gp/book/9781475730272. Accessed August 24, 2019.
6. Fonarow GC, Adams KF, Abraham WT, Yancy CW, Boscardin WJ, for the ADHERE Scientific Advisory Committee SG. Risk stratification for in-hospital mortality in acutely decompensated heart failure: classification and regression tree analysis. JAMA. 2005;293(5):572-580. https://doi.org/10.1001/jama.293.5.572
7. Hess KR, Abbruzzese MC, Lenzi R, Raber MN, Abbruzzese JL. Classification and regression tree analysis of 1000 consecutive patients with unknown primary carcinoma. Clin Cancer Res. 1999;5(11):3403-3410.
8. Garzotto M, Beer TM, Hudson RG, et al. Improved detection of prostate cancer using classification and regression tree analysis. J Clin Oncol. 2005;23(19):4322-4329. https://doi.org/10.1200/JCO.2005.11.136
9. Hong W, Dong L, Huang Q, Wu W, Wu J, Wang Y. Prediction of severe acute pancreatitis using classification and regression tree analysis. Dig Dis Sci. 2011;56(12):3664-3671. https://doi.org/10.1007/s10620-011-1849-x
10. Lewis RJ. An Introduction to Classification and Regression Tree (CART) Analysis. Proceedings of Annual Meeting of the Society for Academic Emergency Medicine, San Francisco, CA, USA, May 22-25, 2000; pp. 1–14.
11. Perlich C, Provost F, Simonoff JS. Tree induction vs logistic regression: a learning-curve analysis. J Mach Learn Res. 2003;4(Jun):211-255. https://doi.org/10.1162/153244304322972694
12. Woolever D. The art and science of clinical decision making. Fam Pract Manag. 2008;15(5):31-36.
13. Loh WY. Classification and regression trees. Wires Data Min Know Disc. 2011;1(1):14-23. https://doi.org/10.1002/widm.8
© 2020 Society of Hospital Medicine
Two-Year Experience of 14 French Pigtail Catheters Placed by Procedure-Focused Hospitalists
Over the last 15 years, studies have demonstrated the efficacy of small-bore chest tubes (SBCTs), or pigtail catheters (PCs, most commonly ≤14 French), in treating pneumothorax (PTX),1-5 traumatic hemothorax (THTX), hemopneumothorax (HPTX),6,7 parapneumonic effusions (PPEs),8,9 pleural infections,10 and symptomatic malignant pleural effusions.11 A randomized, controlled trial also showed that PC placement resulted in better pain scores, compared with large-bore chest tubes (LBCTs), for traumatic PTX.5 The British Thoracic Society does state that LBCTs may be needed for PTXs with very large air leaks, especially postoperatively. Further, LBCTs may be indicated if small-bore drainage fails, but otherwise they recommend PCs as first-line therapy for PTX, free flowing pleural effusions, and pleural infections.12
BEDSIDE PROCEDURE SERVICE DEVELOPMENT
The Medical College of Wisconsin (MCW) provides hospitalist services to
BPS Pigtail Catheter Training
CT surgery initially trained the BPS director in PC placement using the Seldinger technique in 2015. The director’s training period with CT surgery included direct observation by CT surgery providers for 5 PC placements. Prior to placing PCs, the director had performed approximately 400 ultrasound-guided thoracenteses. The BPS director then independently trained the remaining BPS and has placed or supervised over half of the service’s 124 PCs. Initial credentialing for each BPS physician requires 5 PC placements and 20 thoracenteses under direct supervision of credentialed BPS members. Credentialing is maintained by BPS physicians completing 3 PCs and 15 thoracenteses per year.
Newly credentialed providers are capable of independently placing most PCs. However, the requirements for credentialing are minimal and newly credentialed physicians still encounter PC placements with challenging factors not addressed in their training, such as anterior approach, small effusions, atypical effusion location, mild to moderate coagulopathy, recent therapeutic anticoagulation, and large body habitus. To address these challenges, the BPS has instituted an “on call” system. This system is typically staffed by the BPS director or associate director, already attending on a separate medical service. When needed, the “on call” physician will supervise the newer BPS members to ensure safety while the less experienced physician places the PC. Although rare, if an “on call” member is not available, then it is the practice of the BPS to recommend IR for PC placement.
BPS Operation
Daily BPS operation consists of one attending hospitalist, two internal medicine residents, and a third-year medical student. PCs are placed primarily (95%) by the attending on service under ultrasound guidance using the Seldinger technique with lidocaine for anesthetic. For all PC consults, the attending BPS physician reviews the indication prior to placement. If not a direct consult from surgical services, most PC consults are appropriate referrals to the service after the primary medicine service has consulted CT-surgery or p ulmonary consult teams. After review, the primary role of the BPS is assessing safety of PC placement, including whether the patient can tolerate PC placement without procedural sedation. The BPS’s additional standards for safe PC placement are listed in Table 1.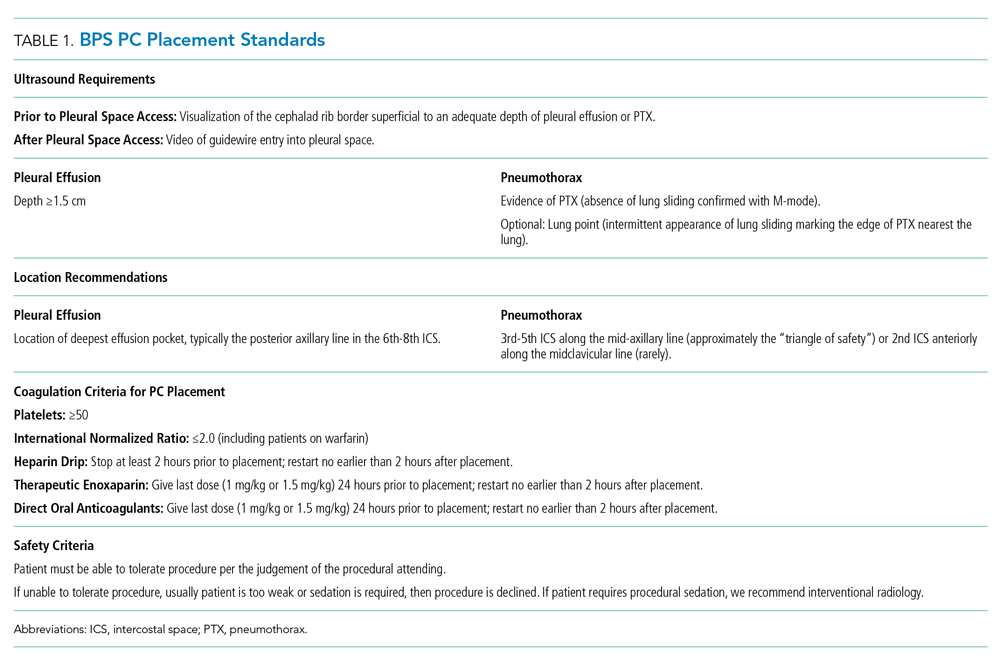
Additionally, it is not routine practice of the BPS to recommend PC placement when consulted for a thoracentesis. The exception to this rule is patients whose PPE sonographic imaging demonstrates loculation or septations. This is consistent with the latest review on pleural disease.13 In addition, the institution’s CT surgery services prefer to initially treat septated PPEs with PCs and fibrinolytic therapy rather than immediate video-assisted thoracoscopic surgery (VATS).
The BPS operates a partnership with CT surgery in which, after successful PC placement, CT surgery manages the PC immediately and until removal including the negative pressure applied and need for fibrinolytic therapy. CT surgery also determines if secondary therapy, commonly second PC or VATS, is required. After PC placement, a portable chest x-ray (CXR) is taken and then BPS follows the patient in person the following day to note any insertion-related complications (IRCs).
In this paper, data on the consults to the BPS for PC placement over a 2-year period are presented. Primary outcomes included numbers of and indications for PCs consulted—attempted or not attempted—consulting services, IRCs, unsuccessful attempts (UAs), and adverse outcomes (AOs). PC duration, fluid drainage, need for fibrinolytic therapy, or need for secondary therapy were not measured because these decisions were managed by the CT surgery service.
PATIENTS AND METHODS
Institutional review board approval of this retrospective study was granted by MCW/Froedtert Hospital Institutional Review Board #5 on January 14, 2019 (MCW IRB #PRO00033496). Adult patients hospitalized at Froedtert Hospital whose primary team determined they would clinically benefit from a PC and consulted the BPS service for placement were included. There were no exclusion criteria.
The authors conducted a retrospective review of two secure BPS databases. The first database is a record of all procedure consults, while the second database contains information about all attempted PCs. Initial review of the BPS’s consult database found 142 PC consults. Consults were classified as “declined” or “attempted.”
RESULTS
Over a 2-year period, the BPS was consulted to place 142 PCs. After resolution of the 3 discrepancies, total consults remained 142, PC attempts totaled 124 (87.3%), and declined consults totaled 18 (12.7%).
The 18 declined consults were not performed for reasons relating to procedural safety. These included 15 (83.3%) for insufficient fluid depth, 1 (5.6%) poor window for PTX, and 1 (5.6%) patient unstable per BPS attending judgement. One (5.6%) final consult had a previous drain in same hemithorax that resumed functioning.
The manual chart review of procedures performed 48 hours after declined PC consults found only 3 of 17 (17.6%) patients received a PC within the subsequent 48 hours. The 18th patient was unable to be followed in our electronic medical record because his medical record number was recorded incorrectly.
The remaining 124 consults were deemed safe for PC placement. Indications for PC placement varied; the most common indications were complicated effusion (36.3%), large or recurrent effusions (21.8%), PTX (17%), and hemothorax (HTX; 17%). The most common teams who consulted the BPS for PC were medicine/hospitalists (42.7%) and CT surgery (40.3%).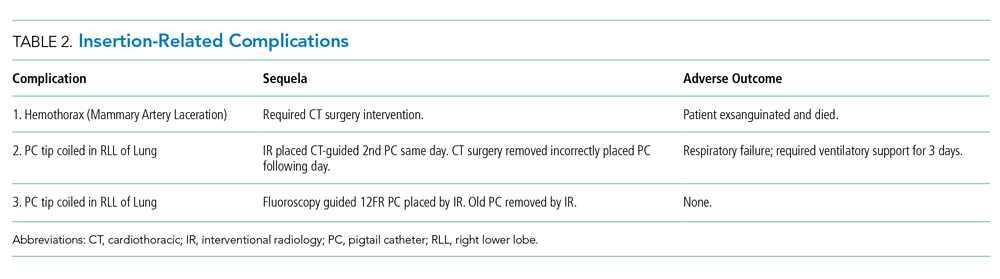
Three UAs were charted in the database, but on review it was determined that only 2 (1.6%) qualified as UAs (Table 3). A PC was attempted with the UA patient No. 3 for a loculated apical PTX. It is clear in the procedure note that the pleural space was accessed, air was appropriately drained, and a PC was advanced safely into the pleural space; however, the PC then stopped draining air. CXR interpretation also noted “pneumothorax described on prior exam is less evident.” Because the pleural space was accessed safely and had a partially therapeutic response, we do not count this PC placement as a UA. The PC may count as “failed,” but determination of a “failure rate” is not the intent of this paper. This point is further discussed in the Discussion section.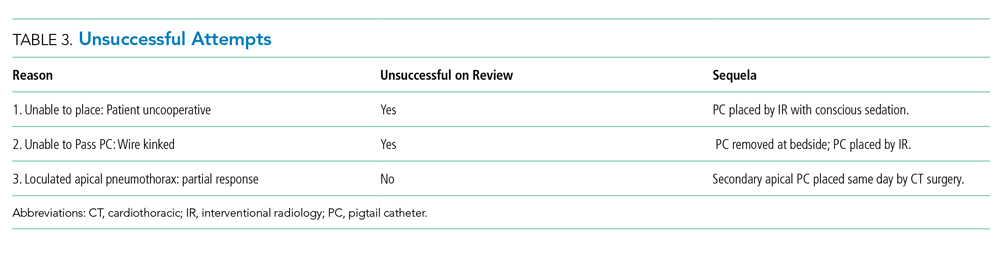
In addition, chart review demonstrated that UA patient No. 3 required intubation within the 24-hour period after our PC attempt, which is an AO. Approximately 10 hours after our PC was placed and removed, CT surgery placed a second PC, and 3 hours after their PC placement, the patient was intubated with subsequent bronchoscopy. The patient was extubated after only 17 hours. This sequence of events suggests mucus plugging as a more likely cause for respiratory failure than our PC attempt, but we have included it as an AO given the time frame.
Overall, the AO rate was low. Out of 124 attempted PC placements only 3 (2.4%) had an AO, and as noted above, it is believed that 2 of these patients had an AO caused by other medical problems rather than by PC placement.
DISCUSSION
To our knowledge, this is the first report of the experience of procedure-focused hospitalists with PC placement in a partnership with CT surgery. We believe that, at high volume, tertiary care centers similar to Froedtert Hospital, internal medicine–trained, procedure-focused hospitalists can serve as adjuncts to surgery, pulmonary, and IR services in the placement of PCs in hospitalized patients that do not require procedural sedation.
Given the development of this service and the nature of its shared operations with CT surgery, we do not believe that the BPS has an appropriate comparison in the literature; however, the IRCs are similar to previous papers describing PC placement.5-7,14 Notably, the IRC and AO rates were low, both 2.4%, which indicates safe placement of PCs. Kulvatunyou et al and Bauman et al reported on PC placement from a surgical perspective and reported IRC rates of 4%-10%.5-7,14 These higher IRC rates likely have a few reasons. First, Kulvatunyou et al and Bauman et al did not use ultrasound guidance. Use of ultrasound guidance may have significantly lowered their IRC rate. Second, the definition of IRC used by Kulvatunyou et al and Bauman et al included dislodgements, but we do not believe this to be an IRC. Dislodgements can happen for several reasons, frequently a result of patient movement or forgetfulness, not because of improper placement. Third, the PCs with this BPS are placed primarily by attending physicians. Resident roles on our BPS in PC placement are primarily as assistants, whereas Kulvatunyou et al and Bauman et al note that both attendings and residents, under attending supervision, placed PCs; however, it is not clear what percentage of PCs were placed by attendings or residents in their studies. Finally, this BPS’s IRCs are self-reported, so they could be perceived as falsely low, but given the small number of physicians involved in the group and its standardized follow-up, we do not suspect this is truly contributing to the low rates.
Other complication rates regarding the use of wire-guided SBCTs and PCs range from 0% to 42%15-20; however, several differences including tube size, physician training, and PC indication make these studies imperfect comparisons. The most notable difference in our opinion is the variable definition, or lack of definition, of a complication. One study did not define their complications,19 while other studies list subjective measures like pain,16,20 cough,16 bleeding, 16,20 and hematomas4,15 as complications. We believe that the lack of consensus definition for PC complication or IRC contributes to the large range of complication rates in the literature. This problem is likely not unique to PC placement, but is instead true across all bedside procedures. In a shared-practice model between hospitalists and CT surgeons, we believe the definition of IRC in this paper is adequate in capturing most complications. The only complication we are currently unable to track well is infection. We consider other items discussed previously, such as pain, cough (often from lung re-expansion), minor bleeding, and even small hematomas, to be a part of the procedure and not a complication.
Finally, regarding the IRCs and associated death, this was a tragic event. Complications for all of the BPS’s procedures are infrequent (0.35% over the same time period) and reviewed between the BPS director and the attending who performed the procedure; in addition, given this mortality, the case was reviewed immediately in detail with our CT surgery colleagues. On review, it was easy to determine that the operator had found a clear lung tip and sonographic signs of PTX; however, CXR review did demonstrate a medial placement of the PC. This was judged to be a poor placement location (even with imaging demonstrating PTX in that area) given the well-known “triangle of safety” defined by the British Thoracic Society.12
After review, the primary emphasis for PC placement was safe location. The BPS now strives to place PCs for PTX only in the “triangle of safety.” The BPS believe that most PTXs can be addressed with this placement. In the rare case of a PTX requiring an anterior approach, only the BPS director currently places apical PCs for PTX while on service or “on call.” He discusses the placement with pulmonary and CT surgery directly to determine that the PC is of absolute necessity.
Given the focus on appropriate location, no formal changes were made to the procedural imaging practice described in Table 1. We realize that vascular imaging would seem necessary after this patient’s mammary artery laceration; however, safe location, in addition to the BPS’s current image requirements, is believed to minimize this risk. We feel the imaging criteria align with recommendation No. 5 of the Society of Hospital Medicine’s Position Statement for Ultrasound Guidance for Adult Thoracentesis.21 Some BPS members use vascular ultrasound imaging to confirm absence of vascularity, but it is not required and occasionally not possible, such as in the occasional case of PTX with subcutaneous emphysema.
The UA rate is low without a natural comparator in the literature. It is important to clarify the difference between the UAs and the frequently mentioned “failure rate” (FR) in Kulvatunyou et al and Bauman et al6,7,14 We classify UAs as the inability, for any reason, to access the pleural space and insert a PC. At this stage, these UAs appear to reflect the service’s new experience with PC placement and inability to provide procedural sedation. Kulvatunyou et al and Bauman et al’s FR is defined as an initial PC successfully placed into the pleural space that then required a second PC or intervention (frequently VATS) to resolve the PTX or retained HTX.
We believe calculating the failure rate will be helpful in demonstrating the value of our BPS and our shared-practice model. We look forward to publishing this and other future research, including determination of the cost and time saved by the BPS for PCs and other procedures.
Limitations of this study include its retrospective nature, results from a single center’s experience, and lack of a comparison group.
Our institution feels that there is great benefit in having a BPS operated by procedure-focused hospitalists. It would also be important to determine if our model can be replicated by another institution.
Acknowledgments
The authors thank CT surgery for helping to develop this shared-practice model and to both CT surgery and IR physicians here at the Medical College of Wisconsin and Froedtert Hospital who assist us with both IRCs and UAs of pigtail catheters.
The authors also thank Dr. Ricardo Franco-Sadud for his oversight and thoughtful improvements to the paper.
1. Chang SH, Kang YN, Chiu HY, Chiu YH. A Systematic Review and Meta-Analysis Comparing Pigtail Catheter and Chest Tube as the Initial Treatment for Pneumothorax. Chest. 2018;153(5):1201-1212. https://doi.org/10.1016/j.chest.2018.01.048.
2. Voisin F, Sohier L, Rochas Y, et al. Ambulatory management of large spontaneous pneumothorax with pigtail catheters. Ann Emerg Med. 2014;64(3):222-228. https://doi.org/10.1016/j.annemergmed.2013.12.017.
3. Lin YC, Tu CY, Liang SJ, et al. Pigtail catheter for the management of pneumothorax in mechanically ventilated patients. Am J Emerg Med. 2010;28(4):466-471. https://doi.org/10.1016/j.ajem.2009.01.033.
4. Tsai WK, Chen W, Lee JC, et al. Pigtail catheters vs large-bore chest tubes for management of secondary spontaneous pneumothoraces in adults. Am J Emerg Med. 2006;24(7):795-800. https://doi.org/10.1016/j.ajem.2006.04.006.
5. Kulvatunyou N, Erickson L, Vijayasekaran A, et al. Randomized clinical trial of pigtail catheter versus chest tube in injured patients with uncomplicated traumatic pneumothorax. Br J Surg. 2014;101(2):17-22. https://doi.org/10.1002/bjs.9377.
6. Kulvatunyou N, Joseph B, Friese RS, et al. 14 French pigtail catheters placed by surgeons to drain blood on trauma patients: is 14-Fr too small? J Trauma Acute Care Surg. 2012;73(6):1423-1427. https://doi.org/10.1097/TA.0b013e318271c1c7.
7. Bauman ZM, Kulvatunyou N, Joseph B, et al. A Prospective Study of 7-Year Experience Using Percutaneous 14-French Pigtail Catheters for Traumatic Hemothorax/Hemopneumothorax at a Level-1 Trauma Center: Size Still Does Not Matter. World J Surg. 2018;42(1):107-113. https://doi.org/10.1007/s00268-017-4168-3.
8. Fysh ET, Smith NA, Lee YC. Optimal chest drain size: the rise of the small-bore pleural catheter. Semin Respir Crit Care Med. 2010;31(6):760-768. https://doi.org/10.1055/s-0030-1269836.
9. Ozkan OS, Ozmen MN, Akhan O. Percutaneous management of parapneumonic effusions. Eur J Radiol. 2005;55(3):311-320. https://doi.org/10.1016/j.ejrad.2005.03.004.
10. Rahman NM, Maskell NA, Davies CW, et al. The relationship between chest tube size and clinical outcome in pleural infection. Chest. 2010;137(3):536-543. https://doi.org/10.1378/chest.09-1044.
11. Saffran L, Ost DE, Fein AM, Schiff MJ. Outpatient pleurodesis of malignant pleural effusions using a small-bore pigtail catheter. Chest. 2000;118(2):417-421. https://doi.org/10.1378/chest.118.2.417.
12. Havelock T, Teoh R, Laws D, Gleeson F, Group BPDG. Pleural procedures and thoracic ultrasound: British Thoracic Society Pleural Disease Guideline 2010. Thorax. 2010;65 Suppl 2:ii61-76. https://doi.org/10.1136/thx.2010.137026.
13. Feller-Kopman D, Light R. Pleural disease. N Engl J Med. 2018;378(8):740-751. https://doi.org/10.1056/NEJMra1403503.
14. Kulvatunyou N, Vijayasekaran A, Hansen A, et al. Two-year experience of using pigtail catheters to treat traumatic pneumothorax: A changing trend. J Trauma. 2011;71(5):1104-1107; discussion 1107. https://doi.org/10.1097/TA.0b013e31822dd130.
15. Cantin L, Chartrand-Lefebvre C, Lepanto L, et al. Chest tube drainage under radiological guidance for pleural effusion and pneumothorax in a tertiary care university teaching hospital: Review of 51 cases. Can Respir J. 2005;12(1):29-33. https://doi.org/10.1155/2005/498709.
16. Horsley A, Jones L, White J, Henry M. Efficacy and complications of small-bore, wire-guided chest drains. Chest. 2006;130(6):1857-1863. https://doi.org/10.1378/chest.130.6.1857.
17. Merriam MA, Cronan JJ, Dorfman GS, Lambiase RE, Haas RA. Radiographically guided percutaneous catheter drainage of pleural fluid collections. Am J Roentgenol. 1988;151(6):1113-1116. https://doi.org/10.2214/ajr.151.6.1113.
18. Petel D, Li P, Emil S. Percutaneous pigtail catheter versus tube thoracostomy for pediatric empyema: A comparison of outcomes. Surgery. 2013;154(4):655-660; discussion 660-651. https://doi.org/10.1016/j.surg.2013.04.032.
19. Gammie JS, Banks MC, Fuhrman CR, et al. The pigtail catheter for pleural drainage: a less invasive alternative to tube thoracostomy. JSLS. 1999;3(1):57-61.
20. Davies HE, Merchant S, McGown A. A study of the complications of small bore ‘Seldinger’ intercostal chest drains. Respirology. 2008;13(4):603-607. https://doi.org/10.1111/j.1440-1843.2008.01296.x.
21. Dancel R, Schnobrich D, Puri N, et al. Recommendations on the Use of Ultrasound Guidance for Adult Thoracentesis: A Position Statement of the Society of Hospital Medicine. J Hosp Med. 2018;13(2):126-135. https://doi.org/10.12788/jhm.2940.
Over the last 15 years, studies have demonstrated the efficacy of small-bore chest tubes (SBCTs), or pigtail catheters (PCs, most commonly ≤14 French), in treating pneumothorax (PTX),1-5 traumatic hemothorax (THTX), hemopneumothorax (HPTX),6,7 parapneumonic effusions (PPEs),8,9 pleural infections,10 and symptomatic malignant pleural effusions.11 A randomized, controlled trial also showed that PC placement resulted in better pain scores, compared with large-bore chest tubes (LBCTs), for traumatic PTX.5 The British Thoracic Society does state that LBCTs may be needed for PTXs with very large air leaks, especially postoperatively. Further, LBCTs may be indicated if small-bore drainage fails, but otherwise they recommend PCs as first-line therapy for PTX, free flowing pleural effusions, and pleural infections.12
BEDSIDE PROCEDURE SERVICE DEVELOPMENT
The Medical College of Wisconsin (MCW) provides hospitalist services to
BPS Pigtail Catheter Training
CT surgery initially trained the BPS director in PC placement using the Seldinger technique in 2015. The director’s training period with CT surgery included direct observation by CT surgery providers for 5 PC placements. Prior to placing PCs, the director had performed approximately 400 ultrasound-guided thoracenteses. The BPS director then independently trained the remaining BPS and has placed or supervised over half of the service’s 124 PCs. Initial credentialing for each BPS physician requires 5 PC placements and 20 thoracenteses under direct supervision of credentialed BPS members. Credentialing is maintained by BPS physicians completing 3 PCs and 15 thoracenteses per year.
Newly credentialed providers are capable of independently placing most PCs. However, the requirements for credentialing are minimal and newly credentialed physicians still encounter PC placements with challenging factors not addressed in their training, such as anterior approach, small effusions, atypical effusion location, mild to moderate coagulopathy, recent therapeutic anticoagulation, and large body habitus. To address these challenges, the BPS has instituted an “on call” system. This system is typically staffed by the BPS director or associate director, already attending on a separate medical service. When needed, the “on call” physician will supervise the newer BPS members to ensure safety while the less experienced physician places the PC. Although rare, if an “on call” member is not available, then it is the practice of the BPS to recommend IR for PC placement.
BPS Operation
Daily BPS operation consists of one attending hospitalist, two internal medicine residents, and a third-year medical student. PCs are placed primarily (95%) by the attending on service under ultrasound guidance using the Seldinger technique with lidocaine for anesthetic. For all PC consults, the attending BPS physician reviews the indication prior to placement. If not a direct consult from surgical services, most PC consults are appropriate referrals to the service after the primary medicine service has consulted CT-surgery or p ulmonary consult teams. After review, the primary role of the BPS is assessing safety of PC placement, including whether the patient can tolerate PC placement without procedural sedation. The BPS’s additional standards for safe PC placement are listed in Table 1.
Additionally, it is not routine practice of the BPS to recommend PC placement when consulted for a thoracentesis. The exception to this rule is patients whose PPE sonographic imaging demonstrates loculation or septations. This is consistent with the latest review on pleural disease.13 In addition, the institution’s CT surgery services prefer to initially treat septated PPEs with PCs and fibrinolytic therapy rather than immediate video-assisted thoracoscopic surgery (VATS).
The BPS operates a partnership with CT surgery in which, after successful PC placement, CT surgery manages the PC immediately and until removal including the negative pressure applied and need for fibrinolytic therapy. CT surgery also determines if secondary therapy, commonly second PC or VATS, is required. After PC placement, a portable chest x-ray (CXR) is taken and then BPS follows the patient in person the following day to note any insertion-related complications (IRCs).
In this paper, data on the consults to the BPS for PC placement over a 2-year period are presented. Primary outcomes included numbers of and indications for PCs consulted—attempted or not attempted—consulting services, IRCs, unsuccessful attempts (UAs), and adverse outcomes (AOs). PC duration, fluid drainage, need for fibrinolytic therapy, or need for secondary therapy were not measured because these decisions were managed by the CT surgery service.
PATIENTS AND METHODS
Institutional review board approval of this retrospective study was granted by MCW/Froedtert Hospital Institutional Review Board #5 on January 14, 2019 (MCW IRB #PRO00033496). Adult patients hospitalized at Froedtert Hospital whose primary team determined they would clinically benefit from a PC and consulted the BPS service for placement were included. There were no exclusion criteria.
The authors conducted a retrospective review of two secure BPS databases. The first database is a record of all procedure consults, while the second database contains information about all attempted PCs. Initial review of the BPS’s consult database found 142 PC consults. Consults were classified as “declined” or “attempted.”
RESULTS
Over a 2-year period, the BPS was consulted to place 142 PCs. After resolution of the 3 discrepancies, total consults remained 142, PC attempts totaled 124 (87.3%), and declined consults totaled 18 (12.7%).
The 18 declined consults were not performed for reasons relating to procedural safety. These included 15 (83.3%) for insufficient fluid depth, 1 (5.6%) poor window for PTX, and 1 (5.6%) patient unstable per BPS attending judgement. One (5.6%) final consult had a previous drain in same hemithorax that resumed functioning.
The manual chart review of procedures performed 48 hours after declined PC consults found only 3 of 17 (17.6%) patients received a PC within the subsequent 48 hours. The 18th patient was unable to be followed in our electronic medical record because his medical record number was recorded incorrectly.
The remaining 124 consults were deemed safe for PC placement. Indications for PC placement varied; the most common indications were complicated effusion (36.3%), large or recurrent effusions (21.8%), PTX (17%), and hemothorax (HTX; 17%). The most common teams who consulted the BPS for PC were medicine/hospitalists (42.7%) and CT surgery (40.3%).
Three UAs were charted in the database, but on review it was determined that only 2 (1.6%) qualified as UAs (Table 3). A PC was attempted with the UA patient No. 3 for a loculated apical PTX. It is clear in the procedure note that the pleural space was accessed, air was appropriately drained, and a PC was advanced safely into the pleural space; however, the PC then stopped draining air. CXR interpretation also noted “pneumothorax described on prior exam is less evident.” Because the pleural space was accessed safely and had a partially therapeutic response, we do not count this PC placement as a UA. The PC may count as “failed,” but determination of a “failure rate” is not the intent of this paper. This point is further discussed in the Discussion section.
In addition, chart review demonstrated that UA patient No. 3 required intubation within the 24-hour period after our PC attempt, which is an AO. Approximately 10 hours after our PC was placed and removed, CT surgery placed a second PC, and 3 hours after their PC placement, the patient was intubated with subsequent bronchoscopy. The patient was extubated after only 17 hours. This sequence of events suggests mucus plugging as a more likely cause for respiratory failure than our PC attempt, but we have included it as an AO given the time frame.
Overall, the AO rate was low. Out of 124 attempted PC placements only 3 (2.4%) had an AO, and as noted above, it is believed that 2 of these patients had an AO caused by other medical problems rather than by PC placement.
DISCUSSION
To our knowledge, this is the first report of the experience of procedure-focused hospitalists with PC placement in a partnership with CT surgery. We believe that, at high volume, tertiary care centers similar to Froedtert Hospital, internal medicine–trained, procedure-focused hospitalists can serve as adjuncts to surgery, pulmonary, and IR services in the placement of PCs in hospitalized patients that do not require procedural sedation.
Given the development of this service and the nature of its shared operations with CT surgery, we do not believe that the BPS has an appropriate comparison in the literature; however, the IRCs are similar to previous papers describing PC placement.5-7,14 Notably, the IRC and AO rates were low, both 2.4%, which indicates safe placement of PCs. Kulvatunyou et al and Bauman et al reported on PC placement from a surgical perspective and reported IRC rates of 4%-10%.5-7,14 These higher IRC rates likely have a few reasons. First, Kulvatunyou et al and Bauman et al did not use ultrasound guidance. Use of ultrasound guidance may have significantly lowered their IRC rate. Second, the definition of IRC used by Kulvatunyou et al and Bauman et al included dislodgements, but we do not believe this to be an IRC. Dislodgements can happen for several reasons, frequently a result of patient movement or forgetfulness, not because of improper placement. Third, the PCs with this BPS are placed primarily by attending physicians. Resident roles on our BPS in PC placement are primarily as assistants, whereas Kulvatunyou et al and Bauman et al note that both attendings and residents, under attending supervision, placed PCs; however, it is not clear what percentage of PCs were placed by attendings or residents in their studies. Finally, this BPS’s IRCs are self-reported, so they could be perceived as falsely low, but given the small number of physicians involved in the group and its standardized follow-up, we do not suspect this is truly contributing to the low rates.
Other complication rates regarding the use of wire-guided SBCTs and PCs range from 0% to 42%15-20; however, several differences including tube size, physician training, and PC indication make these studies imperfect comparisons. The most notable difference in our opinion is the variable definition, or lack of definition, of a complication. One study did not define their complications,19 while other studies list subjective measures like pain,16,20 cough,16 bleeding, 16,20 and hematomas4,15 as complications. We believe that the lack of consensus definition for PC complication or IRC contributes to the large range of complication rates in the literature. This problem is likely not unique to PC placement, but is instead true across all bedside procedures. In a shared-practice model between hospitalists and CT surgeons, we believe the definition of IRC in this paper is adequate in capturing most complications. The only complication we are currently unable to track well is infection. We consider other items discussed previously, such as pain, cough (often from lung re-expansion), minor bleeding, and even small hematomas, to be a part of the procedure and not a complication.
Finally, regarding the IRCs and associated death, this was a tragic event. Complications for all of the BPS’s procedures are infrequent (0.35% over the same time period) and reviewed between the BPS director and the attending who performed the procedure; in addition, given this mortality, the case was reviewed immediately in detail with our CT surgery colleagues. On review, it was easy to determine that the operator had found a clear lung tip and sonographic signs of PTX; however, CXR review did demonstrate a medial placement of the PC. This was judged to be a poor placement location (even with imaging demonstrating PTX in that area) given the well-known “triangle of safety” defined by the British Thoracic Society.12
After review, the primary emphasis for PC placement was safe location. The BPS now strives to place PCs for PTX only in the “triangle of safety.” The BPS believe that most PTXs can be addressed with this placement. In the rare case of a PTX requiring an anterior approach, only the BPS director currently places apical PCs for PTX while on service or “on call.” He discusses the placement with pulmonary and CT surgery directly to determine that the PC is of absolute necessity.
Given the focus on appropriate location, no formal changes were made to the procedural imaging practice described in Table 1. We realize that vascular imaging would seem necessary after this patient’s mammary artery laceration; however, safe location, in addition to the BPS’s current image requirements, is believed to minimize this risk. We feel the imaging criteria align with recommendation No. 5 of the Society of Hospital Medicine’s Position Statement for Ultrasound Guidance for Adult Thoracentesis.21 Some BPS members use vascular ultrasound imaging to confirm absence of vascularity, but it is not required and occasionally not possible, such as in the occasional case of PTX with subcutaneous emphysema.
The UA rate is low without a natural comparator in the literature. It is important to clarify the difference between the UAs and the frequently mentioned “failure rate” (FR) in Kulvatunyou et al and Bauman et al6,7,14 We classify UAs as the inability, for any reason, to access the pleural space and insert a PC. At this stage, these UAs appear to reflect the service’s new experience with PC placement and inability to provide procedural sedation. Kulvatunyou et al and Bauman et al’s FR is defined as an initial PC successfully placed into the pleural space that then required a second PC or intervention (frequently VATS) to resolve the PTX or retained HTX.
We believe calculating the failure rate will be helpful in demonstrating the value of our BPS and our shared-practice model. We look forward to publishing this and other future research, including determination of the cost and time saved by the BPS for PCs and other procedures.
Limitations of this study include its retrospective nature, results from a single center’s experience, and lack of a comparison group.
Our institution feels that there is great benefit in having a BPS operated by procedure-focused hospitalists. It would also be important to determine if our model can be replicated by another institution.
Acknowledgments
The authors thank CT surgery for helping to develop this shared-practice model and to both CT surgery and IR physicians here at the Medical College of Wisconsin and Froedtert Hospital who assist us with both IRCs and UAs of pigtail catheters.
The authors also thank Dr. Ricardo Franco-Sadud for his oversight and thoughtful improvements to the paper.
Over the last 15 years, studies have demonstrated the efficacy of small-bore chest tubes (SBCTs), or pigtail catheters (PCs, most commonly ≤14 French), in treating pneumothorax (PTX),1-5 traumatic hemothorax (THTX), hemopneumothorax (HPTX),6,7 parapneumonic effusions (PPEs),8,9 pleural infections,10 and symptomatic malignant pleural effusions.11 A randomized, controlled trial also showed that PC placement resulted in better pain scores, compared with large-bore chest tubes (LBCTs), for traumatic PTX.5 The British Thoracic Society does state that LBCTs may be needed for PTXs with very large air leaks, especially postoperatively. Further, LBCTs may be indicated if small-bore drainage fails, but otherwise they recommend PCs as first-line therapy for PTX, free flowing pleural effusions, and pleural infections.12
BEDSIDE PROCEDURE SERVICE DEVELOPMENT
The Medical College of Wisconsin (MCW) provides hospitalist services to
BPS Pigtail Catheter Training
CT surgery initially trained the BPS director in PC placement using the Seldinger technique in 2015. The director’s training period with CT surgery included direct observation by CT surgery providers for 5 PC placements. Prior to placing PCs, the director had performed approximately 400 ultrasound-guided thoracenteses. The BPS director then independently trained the remaining BPS and has placed or supervised over half of the service’s 124 PCs. Initial credentialing for each BPS physician requires 5 PC placements and 20 thoracenteses under direct supervision of credentialed BPS members. Credentialing is maintained by BPS physicians completing 3 PCs and 15 thoracenteses per year.
Newly credentialed providers are capable of independently placing most PCs. However, the requirements for credentialing are minimal and newly credentialed physicians still encounter PC placements with challenging factors not addressed in their training, such as anterior approach, small effusions, atypical effusion location, mild to moderate coagulopathy, recent therapeutic anticoagulation, and large body habitus. To address these challenges, the BPS has instituted an “on call” system. This system is typically staffed by the BPS director or associate director, already attending on a separate medical service. When needed, the “on call” physician will supervise the newer BPS members to ensure safety while the less experienced physician places the PC. Although rare, if an “on call” member is not available, then it is the practice of the BPS to recommend IR for PC placement.
BPS Operation
Daily BPS operation consists of one attending hospitalist, two internal medicine residents, and a third-year medical student. PCs are placed primarily (95%) by the attending on service under ultrasound guidance using the Seldinger technique with lidocaine for anesthetic. For all PC consults, the attending BPS physician reviews the indication prior to placement. If not a direct consult from surgical services, most PC consults are appropriate referrals to the service after the primary medicine service has consulted CT-surgery or p ulmonary consult teams. After review, the primary role of the BPS is assessing safety of PC placement, including whether the patient can tolerate PC placement without procedural sedation. The BPS’s additional standards for safe PC placement are listed in Table 1.
Additionally, it is not routine practice of the BPS to recommend PC placement when consulted for a thoracentesis. The exception to this rule is patients whose PPE sonographic imaging demonstrates loculation or septations. This is consistent with the latest review on pleural disease.13 In addition, the institution’s CT surgery services prefer to initially treat septated PPEs with PCs and fibrinolytic therapy rather than immediate video-assisted thoracoscopic surgery (VATS).
The BPS operates a partnership with CT surgery in which, after successful PC placement, CT surgery manages the PC immediately and until removal including the negative pressure applied and need for fibrinolytic therapy. CT surgery also determines if secondary therapy, commonly second PC or VATS, is required. After PC placement, a portable chest x-ray (CXR) is taken and then BPS follows the patient in person the following day to note any insertion-related complications (IRCs).
In this paper, data on the consults to the BPS for PC placement over a 2-year period are presented. Primary outcomes included numbers of and indications for PCs consulted—attempted or not attempted—consulting services, IRCs, unsuccessful attempts (UAs), and adverse outcomes (AOs). PC duration, fluid drainage, need for fibrinolytic therapy, or need for secondary therapy were not measured because these decisions were managed by the CT surgery service.
PATIENTS AND METHODS
Institutional review board approval of this retrospective study was granted by MCW/Froedtert Hospital Institutional Review Board #5 on January 14, 2019 (MCW IRB #PRO00033496). Adult patients hospitalized at Froedtert Hospital whose primary team determined they would clinically benefit from a PC and consulted the BPS service for placement were included. There were no exclusion criteria.
The authors conducted a retrospective review of two secure BPS databases. The first database is a record of all procedure consults, while the second database contains information about all attempted PCs. Initial review of the BPS’s consult database found 142 PC consults. Consults were classified as “declined” or “attempted.”
RESULTS
Over a 2-year period, the BPS was consulted to place 142 PCs. After resolution of the 3 discrepancies, total consults remained 142, PC attempts totaled 124 (87.3%), and declined consults totaled 18 (12.7%).
The 18 declined consults were not performed for reasons relating to procedural safety. These included 15 (83.3%) for insufficient fluid depth, 1 (5.6%) poor window for PTX, and 1 (5.6%) patient unstable per BPS attending judgement. One (5.6%) final consult had a previous drain in same hemithorax that resumed functioning.
The manual chart review of procedures performed 48 hours after declined PC consults found only 3 of 17 (17.6%) patients received a PC within the subsequent 48 hours. The 18th patient was unable to be followed in our electronic medical record because his medical record number was recorded incorrectly.
The remaining 124 consults were deemed safe for PC placement. Indications for PC placement varied; the most common indications were complicated effusion (36.3%), large or recurrent effusions (21.8%), PTX (17%), and hemothorax (HTX; 17%). The most common teams who consulted the BPS for PC were medicine/hospitalists (42.7%) and CT surgery (40.3%).
Three UAs were charted in the database, but on review it was determined that only 2 (1.6%) qualified as UAs (Table 3). A PC was attempted with the UA patient No. 3 for a loculated apical PTX. It is clear in the procedure note that the pleural space was accessed, air was appropriately drained, and a PC was advanced safely into the pleural space; however, the PC then stopped draining air. CXR interpretation also noted “pneumothorax described on prior exam is less evident.” Because the pleural space was accessed safely and had a partially therapeutic response, we do not count this PC placement as a UA. The PC may count as “failed,” but determination of a “failure rate” is not the intent of this paper. This point is further discussed in the Discussion section.
In addition, chart review demonstrated that UA patient No. 3 required intubation within the 24-hour period after our PC attempt, which is an AO. Approximately 10 hours after our PC was placed and removed, CT surgery placed a second PC, and 3 hours after their PC placement, the patient was intubated with subsequent bronchoscopy. The patient was extubated after only 17 hours. This sequence of events suggests mucus plugging as a more likely cause for respiratory failure than our PC attempt, but we have included it as an AO given the time frame.
Overall, the AO rate was low. Out of 124 attempted PC placements only 3 (2.4%) had an AO, and as noted above, it is believed that 2 of these patients had an AO caused by other medical problems rather than by PC placement.
DISCUSSION
To our knowledge, this is the first report of the experience of procedure-focused hospitalists with PC placement in a partnership with CT surgery. We believe that, at high volume, tertiary care centers similar to Froedtert Hospital, internal medicine–trained, procedure-focused hospitalists can serve as adjuncts to surgery, pulmonary, and IR services in the placement of PCs in hospitalized patients that do not require procedural sedation.
Given the development of this service and the nature of its shared operations with CT surgery, we do not believe that the BPS has an appropriate comparison in the literature; however, the IRCs are similar to previous papers describing PC placement.5-7,14 Notably, the IRC and AO rates were low, both 2.4%, which indicates safe placement of PCs. Kulvatunyou et al and Bauman et al reported on PC placement from a surgical perspective and reported IRC rates of 4%-10%.5-7,14 These higher IRC rates likely have a few reasons. First, Kulvatunyou et al and Bauman et al did not use ultrasound guidance. Use of ultrasound guidance may have significantly lowered their IRC rate. Second, the definition of IRC used by Kulvatunyou et al and Bauman et al included dislodgements, but we do not believe this to be an IRC. Dislodgements can happen for several reasons, frequently a result of patient movement or forgetfulness, not because of improper placement. Third, the PCs with this BPS are placed primarily by attending physicians. Resident roles on our BPS in PC placement are primarily as assistants, whereas Kulvatunyou et al and Bauman et al note that both attendings and residents, under attending supervision, placed PCs; however, it is not clear what percentage of PCs were placed by attendings or residents in their studies. Finally, this BPS’s IRCs are self-reported, so they could be perceived as falsely low, but given the small number of physicians involved in the group and its standardized follow-up, we do not suspect this is truly contributing to the low rates.
Other complication rates regarding the use of wire-guided SBCTs and PCs range from 0% to 42%15-20; however, several differences including tube size, physician training, and PC indication make these studies imperfect comparisons. The most notable difference in our opinion is the variable definition, or lack of definition, of a complication. One study did not define their complications,19 while other studies list subjective measures like pain,16,20 cough,16 bleeding, 16,20 and hematomas4,15 as complications. We believe that the lack of consensus definition for PC complication or IRC contributes to the large range of complication rates in the literature. This problem is likely not unique to PC placement, but is instead true across all bedside procedures. In a shared-practice model between hospitalists and CT surgeons, we believe the definition of IRC in this paper is adequate in capturing most complications. The only complication we are currently unable to track well is infection. We consider other items discussed previously, such as pain, cough (often from lung re-expansion), minor bleeding, and even small hematomas, to be a part of the procedure and not a complication.
Finally, regarding the IRCs and associated death, this was a tragic event. Complications for all of the BPS’s procedures are infrequent (0.35% over the same time period) and reviewed between the BPS director and the attending who performed the procedure; in addition, given this mortality, the case was reviewed immediately in detail with our CT surgery colleagues. On review, it was easy to determine that the operator had found a clear lung tip and sonographic signs of PTX; however, CXR review did demonstrate a medial placement of the PC. This was judged to be a poor placement location (even with imaging demonstrating PTX in that area) given the well-known “triangle of safety” defined by the British Thoracic Society.12
After review, the primary emphasis for PC placement was safe location. The BPS now strives to place PCs for PTX only in the “triangle of safety.” The BPS believe that most PTXs can be addressed with this placement. In the rare case of a PTX requiring an anterior approach, only the BPS director currently places apical PCs for PTX while on service or “on call.” He discusses the placement with pulmonary and CT surgery directly to determine that the PC is of absolute necessity.
Given the focus on appropriate location, no formal changes were made to the procedural imaging practice described in Table 1. We realize that vascular imaging would seem necessary after this patient’s mammary artery laceration; however, safe location, in addition to the BPS’s current image requirements, is believed to minimize this risk. We feel the imaging criteria align with recommendation No. 5 of the Society of Hospital Medicine’s Position Statement for Ultrasound Guidance for Adult Thoracentesis.21 Some BPS members use vascular ultrasound imaging to confirm absence of vascularity, but it is not required and occasionally not possible, such as in the occasional case of PTX with subcutaneous emphysema.
The UA rate is low without a natural comparator in the literature. It is important to clarify the difference between the UAs and the frequently mentioned “failure rate” (FR) in Kulvatunyou et al and Bauman et al6,7,14 We classify UAs as the inability, for any reason, to access the pleural space and insert a PC. At this stage, these UAs appear to reflect the service’s new experience with PC placement and inability to provide procedural sedation. Kulvatunyou et al and Bauman et al’s FR is defined as an initial PC successfully placed into the pleural space that then required a second PC or intervention (frequently VATS) to resolve the PTX or retained HTX.
We believe calculating the failure rate will be helpful in demonstrating the value of our BPS and our shared-practice model. We look forward to publishing this and other future research, including determination of the cost and time saved by the BPS for PCs and other procedures.
Limitations of this study include its retrospective nature, results from a single center’s experience, and lack of a comparison group.
Our institution feels that there is great benefit in having a BPS operated by procedure-focused hospitalists. It would also be important to determine if our model can be replicated by another institution.
Acknowledgments
The authors thank CT surgery for helping to develop this shared-practice model and to both CT surgery and IR physicians here at the Medical College of Wisconsin and Froedtert Hospital who assist us with both IRCs and UAs of pigtail catheters.
The authors also thank Dr. Ricardo Franco-Sadud for his oversight and thoughtful improvements to the paper.
1. Chang SH, Kang YN, Chiu HY, Chiu YH. A Systematic Review and Meta-Analysis Comparing Pigtail Catheter and Chest Tube as the Initial Treatment for Pneumothorax. Chest. 2018;153(5):1201-1212. https://doi.org/10.1016/j.chest.2018.01.048.
2. Voisin F, Sohier L, Rochas Y, et al. Ambulatory management of large spontaneous pneumothorax with pigtail catheters. Ann Emerg Med. 2014;64(3):222-228. https://doi.org/10.1016/j.annemergmed.2013.12.017.
3. Lin YC, Tu CY, Liang SJ, et al. Pigtail catheter for the management of pneumothorax in mechanically ventilated patients. Am J Emerg Med. 2010;28(4):466-471. https://doi.org/10.1016/j.ajem.2009.01.033.
4. Tsai WK, Chen W, Lee JC, et al. Pigtail catheters vs large-bore chest tubes for management of secondary spontaneous pneumothoraces in adults. Am J Emerg Med. 2006;24(7):795-800. https://doi.org/10.1016/j.ajem.2006.04.006.
5. Kulvatunyou N, Erickson L, Vijayasekaran A, et al. Randomized clinical trial of pigtail catheter versus chest tube in injured patients with uncomplicated traumatic pneumothorax. Br J Surg. 2014;101(2):17-22. https://doi.org/10.1002/bjs.9377.
6. Kulvatunyou N, Joseph B, Friese RS, et al. 14 French pigtail catheters placed by surgeons to drain blood on trauma patients: is 14-Fr too small? J Trauma Acute Care Surg. 2012;73(6):1423-1427. https://doi.org/10.1097/TA.0b013e318271c1c7.
7. Bauman ZM, Kulvatunyou N, Joseph B, et al. A Prospective Study of 7-Year Experience Using Percutaneous 14-French Pigtail Catheters for Traumatic Hemothorax/Hemopneumothorax at a Level-1 Trauma Center: Size Still Does Not Matter. World J Surg. 2018;42(1):107-113. https://doi.org/10.1007/s00268-017-4168-3.
8. Fysh ET, Smith NA, Lee YC. Optimal chest drain size: the rise of the small-bore pleural catheter. Semin Respir Crit Care Med. 2010;31(6):760-768. https://doi.org/10.1055/s-0030-1269836.
9. Ozkan OS, Ozmen MN, Akhan O. Percutaneous management of parapneumonic effusions. Eur J Radiol. 2005;55(3):311-320. https://doi.org/10.1016/j.ejrad.2005.03.004.
10. Rahman NM, Maskell NA, Davies CW, et al. The relationship between chest tube size and clinical outcome in pleural infection. Chest. 2010;137(3):536-543. https://doi.org/10.1378/chest.09-1044.
11. Saffran L, Ost DE, Fein AM, Schiff MJ. Outpatient pleurodesis of malignant pleural effusions using a small-bore pigtail catheter. Chest. 2000;118(2):417-421. https://doi.org/10.1378/chest.118.2.417.
12. Havelock T, Teoh R, Laws D, Gleeson F, Group BPDG. Pleural procedures and thoracic ultrasound: British Thoracic Society Pleural Disease Guideline 2010. Thorax. 2010;65 Suppl 2:ii61-76. https://doi.org/10.1136/thx.2010.137026.
13. Feller-Kopman D, Light R. Pleural disease. N Engl J Med. 2018;378(8):740-751. https://doi.org/10.1056/NEJMra1403503.
14. Kulvatunyou N, Vijayasekaran A, Hansen A, et al. Two-year experience of using pigtail catheters to treat traumatic pneumothorax: A changing trend. J Trauma. 2011;71(5):1104-1107; discussion 1107. https://doi.org/10.1097/TA.0b013e31822dd130.
15. Cantin L, Chartrand-Lefebvre C, Lepanto L, et al. Chest tube drainage under radiological guidance for pleural effusion and pneumothorax in a tertiary care university teaching hospital: Review of 51 cases. Can Respir J. 2005;12(1):29-33. https://doi.org/10.1155/2005/498709.
16. Horsley A, Jones L, White J, Henry M. Efficacy and complications of small-bore, wire-guided chest drains. Chest. 2006;130(6):1857-1863. https://doi.org/10.1378/chest.130.6.1857.
17. Merriam MA, Cronan JJ, Dorfman GS, Lambiase RE, Haas RA. Radiographically guided percutaneous catheter drainage of pleural fluid collections. Am J Roentgenol. 1988;151(6):1113-1116. https://doi.org/10.2214/ajr.151.6.1113.
18. Petel D, Li P, Emil S. Percutaneous pigtail catheter versus tube thoracostomy for pediatric empyema: A comparison of outcomes. Surgery. 2013;154(4):655-660; discussion 660-651. https://doi.org/10.1016/j.surg.2013.04.032.
19. Gammie JS, Banks MC, Fuhrman CR, et al. The pigtail catheter for pleural drainage: a less invasive alternative to tube thoracostomy. JSLS. 1999;3(1):57-61.
20. Davies HE, Merchant S, McGown A. A study of the complications of small bore ‘Seldinger’ intercostal chest drains. Respirology. 2008;13(4):603-607. https://doi.org/10.1111/j.1440-1843.2008.01296.x.
21. Dancel R, Schnobrich D, Puri N, et al. Recommendations on the Use of Ultrasound Guidance for Adult Thoracentesis: A Position Statement of the Society of Hospital Medicine. J Hosp Med. 2018;13(2):126-135. https://doi.org/10.12788/jhm.2940.
1. Chang SH, Kang YN, Chiu HY, Chiu YH. A Systematic Review and Meta-Analysis Comparing Pigtail Catheter and Chest Tube as the Initial Treatment for Pneumothorax. Chest. 2018;153(5):1201-1212. https://doi.org/10.1016/j.chest.2018.01.048.
2. Voisin F, Sohier L, Rochas Y, et al. Ambulatory management of large spontaneous pneumothorax with pigtail catheters. Ann Emerg Med. 2014;64(3):222-228. https://doi.org/10.1016/j.annemergmed.2013.12.017.
3. Lin YC, Tu CY, Liang SJ, et al. Pigtail catheter for the management of pneumothorax in mechanically ventilated patients. Am J Emerg Med. 2010;28(4):466-471. https://doi.org/10.1016/j.ajem.2009.01.033.
4. Tsai WK, Chen W, Lee JC, et al. Pigtail catheters vs large-bore chest tubes for management of secondary spontaneous pneumothoraces in adults. Am J Emerg Med. 2006;24(7):795-800. https://doi.org/10.1016/j.ajem.2006.04.006.
5. Kulvatunyou N, Erickson L, Vijayasekaran A, et al. Randomized clinical trial of pigtail catheter versus chest tube in injured patients with uncomplicated traumatic pneumothorax. Br J Surg. 2014;101(2):17-22. https://doi.org/10.1002/bjs.9377.
6. Kulvatunyou N, Joseph B, Friese RS, et al. 14 French pigtail catheters placed by surgeons to drain blood on trauma patients: is 14-Fr too small? J Trauma Acute Care Surg. 2012;73(6):1423-1427. https://doi.org/10.1097/TA.0b013e318271c1c7.
7. Bauman ZM, Kulvatunyou N, Joseph B, et al. A Prospective Study of 7-Year Experience Using Percutaneous 14-French Pigtail Catheters for Traumatic Hemothorax/Hemopneumothorax at a Level-1 Trauma Center: Size Still Does Not Matter. World J Surg. 2018;42(1):107-113. https://doi.org/10.1007/s00268-017-4168-3.
8. Fysh ET, Smith NA, Lee YC. Optimal chest drain size: the rise of the small-bore pleural catheter. Semin Respir Crit Care Med. 2010;31(6):760-768. https://doi.org/10.1055/s-0030-1269836.
9. Ozkan OS, Ozmen MN, Akhan O. Percutaneous management of parapneumonic effusions. Eur J Radiol. 2005;55(3):311-320. https://doi.org/10.1016/j.ejrad.2005.03.004.
10. Rahman NM, Maskell NA, Davies CW, et al. The relationship between chest tube size and clinical outcome in pleural infection. Chest. 2010;137(3):536-543. https://doi.org/10.1378/chest.09-1044.
11. Saffran L, Ost DE, Fein AM, Schiff MJ. Outpatient pleurodesis of malignant pleural effusions using a small-bore pigtail catheter. Chest. 2000;118(2):417-421. https://doi.org/10.1378/chest.118.2.417.
12. Havelock T, Teoh R, Laws D, Gleeson F, Group BPDG. Pleural procedures and thoracic ultrasound: British Thoracic Society Pleural Disease Guideline 2010. Thorax. 2010;65 Suppl 2:ii61-76. https://doi.org/10.1136/thx.2010.137026.
13. Feller-Kopman D, Light R. Pleural disease. N Engl J Med. 2018;378(8):740-751. https://doi.org/10.1056/NEJMra1403503.
14. Kulvatunyou N, Vijayasekaran A, Hansen A, et al. Two-year experience of using pigtail catheters to treat traumatic pneumothorax: A changing trend. J Trauma. 2011;71(5):1104-1107; discussion 1107. https://doi.org/10.1097/TA.0b013e31822dd130.
15. Cantin L, Chartrand-Lefebvre C, Lepanto L, et al. Chest tube drainage under radiological guidance for pleural effusion and pneumothorax in a tertiary care university teaching hospital: Review of 51 cases. Can Respir J. 2005;12(1):29-33. https://doi.org/10.1155/2005/498709.
16. Horsley A, Jones L, White J, Henry M. Efficacy and complications of small-bore, wire-guided chest drains. Chest. 2006;130(6):1857-1863. https://doi.org/10.1378/chest.130.6.1857.
17. Merriam MA, Cronan JJ, Dorfman GS, Lambiase RE, Haas RA. Radiographically guided percutaneous catheter drainage of pleural fluid collections. Am J Roentgenol. 1988;151(6):1113-1116. https://doi.org/10.2214/ajr.151.6.1113.
18. Petel D, Li P, Emil S. Percutaneous pigtail catheter versus tube thoracostomy for pediatric empyema: A comparison of outcomes. Surgery. 2013;154(4):655-660; discussion 660-651. https://doi.org/10.1016/j.surg.2013.04.032.
19. Gammie JS, Banks MC, Fuhrman CR, et al. The pigtail catheter for pleural drainage: a less invasive alternative to tube thoracostomy. JSLS. 1999;3(1):57-61.
20. Davies HE, Merchant S, McGown A. A study of the complications of small bore ‘Seldinger’ intercostal chest drains. Respirology. 2008;13(4):603-607. https://doi.org/10.1111/j.1440-1843.2008.01296.x.
21. Dancel R, Schnobrich D, Puri N, et al. Recommendations on the Use of Ultrasound Guidance for Adult Thoracentesis: A Position Statement of the Society of Hospital Medicine. J Hosp Med. 2018;13(2):126-135. https://doi.org/10.12788/jhm.2940.
© 2020 Society of Hospital Medicine