User login
Comparison Shopping
My friend had a cyst removed from the end of her right fourth finger. She told me that it’s healing well and she’s happy with the doctor’s work.
"Who removed it?" I asked her.
She gave me the name of a hand surgeon at a local teaching hospital.
"Did you compare alternatives for cost?" I asked her.
She had gotten another surgical opinion, but didn’t really understand my question about cost comparison. My friend is a retired attorney who knows me well enough to realize I’m not always totally serious.
I told her about the current thrust to make consumers (i.e., patients) more cost conscious by giving them "more skin in the game" (making it worth their while to get the best deal they can, as they would when, say, buying a flat-screen TV).
When I explained to my friend what I meant, she told me she wasn’t sure how well that would work. I told her that although I have skin in the skin game, I’m not so sure either.
Changes are in the wind. I got an e-mail the other day from a patient whose leg I had recently biopsied. I had told him that the result showed a fairly large basal cell and recommended excision, suggesting either of two surgeons.
His answer was: "Thanks. I will compare their costs and let you know which one I pick."
I responded that doing that would be fine, but might be complicated by the fact that one of the surgeons does Mohs, so to compare prices he would need to consult that doctor first and find out which technique he would use.
Perhaps I shouldn’t have been put off by his e-mail, but I was. It seemed to imply that a professional recommendation is on the same plane as advice about picking a lawn mower. Is it? I was saying (or thought I was saying): "Here are two doctors whose work I know and trust." Reducing that to dollars and cents makes it something else, something less.
What it actually does is to reduce my professional opinion to shopping advice, which is in fact exactly what market-based incentives are supposed to do.
I thought of this push for cost consciousness a few months ago, when my wife had back surgery. We got several opinions: Laminectomy? Laminectomy with fusion? Even when surgeons at different hospitals recommended the same procedure, we did not ask what reimbursement rate the respective institution had negotiated with our insurer. (There are, of course, big differences, based not on quality – whatever that is – but on each hospital network’s market clout.)
The surgeon we picked arranged for several preoperative visits. At one of them the nurse said my wife would need a CT scan. We went right up one floor, and she had it done.
But should we have? There had already been an MRI. Was a CT scan really needed? And if it was, would we get the best price upstairs, or maybe across town?
Did my wife know? As a dermatologist, did I? Of course not. What would it have meant for us to say, "Hold on now, we’ve got skin in this game. We’d like to know why you need a CT scan. Is it really necessary? Is this the most cost-effective place to do it?"
Would that have been a shopping question, or a professional challenge? What would my friend’s hand surgeon have said if she asked him for a quote, or brought in one from another surgeon? Is buying surgery similar to bringing in a competitor’s coupon to Wal-Mart, or scanning a bookstore’s barcode on the Amazon app to see if they can match or beat it?
The powers shaping health care are not likely to be moved by such questions. They will point out – correctly – that medical costs are out of control, and therefore something must be done. They will therefore do something, as they are doing with electronic health records and will shortly do with ICD-10. The consequences of all these actions, intended and otherwise, remain to be seen both to doctors as providers and to all of us as consumers.
In the meantime, I have downloaded a discount coupon from the web: 10% off on any cystoscopy, but only if I act now and bring along 10 friends.
Let’s go, guys!
Dr. Rockoff practices dermatology in Brookline, Mass. To respond to this column, e-mail Dr. Rockoff at at [email protected].
My friend had a cyst removed from the end of her right fourth finger. She told me that it’s healing well and she’s happy with the doctor’s work.
"Who removed it?" I asked her.
She gave me the name of a hand surgeon at a local teaching hospital.
"Did you compare alternatives for cost?" I asked her.
She had gotten another surgical opinion, but didn’t really understand my question about cost comparison. My friend is a retired attorney who knows me well enough to realize I’m not always totally serious.
I told her about the current thrust to make consumers (i.e., patients) more cost conscious by giving them "more skin in the game" (making it worth their while to get the best deal they can, as they would when, say, buying a flat-screen TV).
When I explained to my friend what I meant, she told me she wasn’t sure how well that would work. I told her that although I have skin in the skin game, I’m not so sure either.
Changes are in the wind. I got an e-mail the other day from a patient whose leg I had recently biopsied. I had told him that the result showed a fairly large basal cell and recommended excision, suggesting either of two surgeons.
His answer was: "Thanks. I will compare their costs and let you know which one I pick."
I responded that doing that would be fine, but might be complicated by the fact that one of the surgeons does Mohs, so to compare prices he would need to consult that doctor first and find out which technique he would use.
Perhaps I shouldn’t have been put off by his e-mail, but I was. It seemed to imply that a professional recommendation is on the same plane as advice about picking a lawn mower. Is it? I was saying (or thought I was saying): "Here are two doctors whose work I know and trust." Reducing that to dollars and cents makes it something else, something less.
What it actually does is to reduce my professional opinion to shopping advice, which is in fact exactly what market-based incentives are supposed to do.
I thought of this push for cost consciousness a few months ago, when my wife had back surgery. We got several opinions: Laminectomy? Laminectomy with fusion? Even when surgeons at different hospitals recommended the same procedure, we did not ask what reimbursement rate the respective institution had negotiated with our insurer. (There are, of course, big differences, based not on quality – whatever that is – but on each hospital network’s market clout.)
The surgeon we picked arranged for several preoperative visits. At one of them the nurse said my wife would need a CT scan. We went right up one floor, and she had it done.
But should we have? There had already been an MRI. Was a CT scan really needed? And if it was, would we get the best price upstairs, or maybe across town?
Did my wife know? As a dermatologist, did I? Of course not. What would it have meant for us to say, "Hold on now, we’ve got skin in this game. We’d like to know why you need a CT scan. Is it really necessary? Is this the most cost-effective place to do it?"
Would that have been a shopping question, or a professional challenge? What would my friend’s hand surgeon have said if she asked him for a quote, or brought in one from another surgeon? Is buying surgery similar to bringing in a competitor’s coupon to Wal-Mart, or scanning a bookstore’s barcode on the Amazon app to see if they can match or beat it?
The powers shaping health care are not likely to be moved by such questions. They will point out – correctly – that medical costs are out of control, and therefore something must be done. They will therefore do something, as they are doing with electronic health records and will shortly do with ICD-10. The consequences of all these actions, intended and otherwise, remain to be seen both to doctors as providers and to all of us as consumers.
In the meantime, I have downloaded a discount coupon from the web: 10% off on any cystoscopy, but only if I act now and bring along 10 friends.
Let’s go, guys!
Dr. Rockoff practices dermatology in Brookline, Mass. To respond to this column, e-mail Dr. Rockoff at at [email protected].
My friend had a cyst removed from the end of her right fourth finger. She told me that it’s healing well and she’s happy with the doctor’s work.
"Who removed it?" I asked her.
She gave me the name of a hand surgeon at a local teaching hospital.
"Did you compare alternatives for cost?" I asked her.
She had gotten another surgical opinion, but didn’t really understand my question about cost comparison. My friend is a retired attorney who knows me well enough to realize I’m not always totally serious.
I told her about the current thrust to make consumers (i.e., patients) more cost conscious by giving them "more skin in the game" (making it worth their while to get the best deal they can, as they would when, say, buying a flat-screen TV).
When I explained to my friend what I meant, she told me she wasn’t sure how well that would work. I told her that although I have skin in the skin game, I’m not so sure either.
Changes are in the wind. I got an e-mail the other day from a patient whose leg I had recently biopsied. I had told him that the result showed a fairly large basal cell and recommended excision, suggesting either of two surgeons.
His answer was: "Thanks. I will compare their costs and let you know which one I pick."
I responded that doing that would be fine, but might be complicated by the fact that one of the surgeons does Mohs, so to compare prices he would need to consult that doctor first and find out which technique he would use.
Perhaps I shouldn’t have been put off by his e-mail, but I was. It seemed to imply that a professional recommendation is on the same plane as advice about picking a lawn mower. Is it? I was saying (or thought I was saying): "Here are two doctors whose work I know and trust." Reducing that to dollars and cents makes it something else, something less.
What it actually does is to reduce my professional opinion to shopping advice, which is in fact exactly what market-based incentives are supposed to do.
I thought of this push for cost consciousness a few months ago, when my wife had back surgery. We got several opinions: Laminectomy? Laminectomy with fusion? Even when surgeons at different hospitals recommended the same procedure, we did not ask what reimbursement rate the respective institution had negotiated with our insurer. (There are, of course, big differences, based not on quality – whatever that is – but on each hospital network’s market clout.)
The surgeon we picked arranged for several preoperative visits. At one of them the nurse said my wife would need a CT scan. We went right up one floor, and she had it done.
But should we have? There had already been an MRI. Was a CT scan really needed? And if it was, would we get the best price upstairs, or maybe across town?
Did my wife know? As a dermatologist, did I? Of course not. What would it have meant for us to say, "Hold on now, we’ve got skin in this game. We’d like to know why you need a CT scan. Is it really necessary? Is this the most cost-effective place to do it?"
Would that have been a shopping question, or a professional challenge? What would my friend’s hand surgeon have said if she asked him for a quote, or brought in one from another surgeon? Is buying surgery similar to bringing in a competitor’s coupon to Wal-Mart, or scanning a bookstore’s barcode on the Amazon app to see if they can match or beat it?
The powers shaping health care are not likely to be moved by such questions. They will point out – correctly – that medical costs are out of control, and therefore something must be done. They will therefore do something, as they are doing with electronic health records and will shortly do with ICD-10. The consequences of all these actions, intended and otherwise, remain to be seen both to doctors as providers and to all of us as consumers.
In the meantime, I have downloaded a discount coupon from the web: 10% off on any cystoscopy, but only if I act now and bring along 10 friends.
Let’s go, guys!
Dr. Rockoff practices dermatology in Brookline, Mass. To respond to this column, e-mail Dr. Rockoff at at [email protected].

Teaching to the Test
This is the time of year when teaching to the test comes to the forefront. Standardized testing is endemic in medical training. Whether you are a high school senior taking the SAT, a college student applying to take the MCAT, a medical student struggling to pass United States Medical Licensing Examination (USMLE) Step 1, or a recent residency graduate sitting for the boards, taking a test can be a very anxious time. Careers can be markedly altered by the scores on the standardized tests. The reputations of educational institutions, including medical schools and residency programs, depend on the scores. So the anxiety is understandable.
On the other hand, the public – who are the future patients of these physicians – may have a different perspective. Do these tests really evaluate and select those who will become better physicians? Will those physicians have the optimal balance of scientific knowledge and the art of caring?
That has been a source of consternation since long before computers began scoring tests. This quandary has not been lost on medical educators. The MCAT itself will be undergoing an overhaul by 2015. The goal is to have "A Better Test for Tomorrow’s Doctors." A preview guide of those changes was released in November 2011, and the revised second edition was just released in September 2012.
The MCAT’s basic science questions, which previously focused on biology, physics, and chemistry, will now include a section on the psychological, social, and biological foundations of behavior. The intent is to select a more diverse group of medical students, some of whom have studied sociology or anthropology, rather than favoring the hard science majors. There will also be a "critical analysis and reasoning skills" section of the test. In modern medicine, regurgitated, memorized facts are not as important as being able to interpret and apply them. There are other initiatives, such as the Project to Rebalance and Integrate Medical Education (PRIME), seeking to overhaul the medical curriculum.
Medical education 30 years ago involved large didactic lectures wherein a vast amount of information was transmitted from professor to student, then crammed and forgotten. Memorizing facts was considered the key to being a competent physician. The most lauded professors were frequently referred to as walking textbooks. But that is no longer adequate. Medical knowledge is now a bookshelf of textbooks, well beyond the memorization of a single person. The photographic memory aided by cute mnemonics has been supplanted by a smartphone and Google.
The provision of medical care also has evolved. Rather than a solo practitioner in an office, now a team of subspecialists, aided by nurses and allied health personnel, provide care in inpatient and outpatient settings. My role as a hospitalist is to stitch together the various patches of expertise each team member has, to form a quilt that covers all the patient’s needs. Communication between team members is crucial. Accurate and complete handoffs of information also have become vital in the shift-based environment for delivering therapy in most hospital settings.
As a patient, I was quite annoyed when, after a day of tests and procedures, I was handed a computer form to fill out. It surveyed my "experience." Did I have any trouble making the appointment? Were the hours convenient? Was the staff courteous? It contained 22 items, but only one question seemed to have anything to do with whether my physician was competent. Perhaps we are in a consumer-oriented society, and the provision of medical care needs to reflect that with Press Ganey scores. But the engineer in me still focuses on those key goals of getting the diagnosis and therapy correct. Especially when I’m the recipient!
Will changing the test produce, and importantly, maintain, a more competent physician? What are the consequences of better patient satisfaction? Not necessarily better health, according to one large study. Higher patient satisfaction was associated with less emergency department use but greater inpatient use, as well as with higher overall health care and prescription drug expenditures (Arch. Intern. Med. 2012;172:405-11).
If medical educators teach to a better test, will society simply run into a better mousetrap?
Dr. Powell is associate professor of pediatrics at St. Louis University and a pediatric hospitalist at SSM Cardinal Glennon Children’s Medical Center in St. Louis. He said he had no relevant financial disclosures. E-mail Dr. Powell at [email protected]. This column, "Beyond the White Coat," appears regularly in Pediatric News.
This is the time of year when teaching to the test comes to the forefront. Standardized testing is endemic in medical training. Whether you are a high school senior taking the SAT, a college student applying to take the MCAT, a medical student struggling to pass United States Medical Licensing Examination (USMLE) Step 1, or a recent residency graduate sitting for the boards, taking a test can be a very anxious time. Careers can be markedly altered by the scores on the standardized tests. The reputations of educational institutions, including medical schools and residency programs, depend on the scores. So the anxiety is understandable.
On the other hand, the public – who are the future patients of these physicians – may have a different perspective. Do these tests really evaluate and select those who will become better physicians? Will those physicians have the optimal balance of scientific knowledge and the art of caring?
That has been a source of consternation since long before computers began scoring tests. This quandary has not been lost on medical educators. The MCAT itself will be undergoing an overhaul by 2015. The goal is to have "A Better Test for Tomorrow’s Doctors." A preview guide of those changes was released in November 2011, and the revised second edition was just released in September 2012.
The MCAT’s basic science questions, which previously focused on biology, physics, and chemistry, will now include a section on the psychological, social, and biological foundations of behavior. The intent is to select a more diverse group of medical students, some of whom have studied sociology or anthropology, rather than favoring the hard science majors. There will also be a "critical analysis and reasoning skills" section of the test. In modern medicine, regurgitated, memorized facts are not as important as being able to interpret and apply them. There are other initiatives, such as the Project to Rebalance and Integrate Medical Education (PRIME), seeking to overhaul the medical curriculum.
Medical education 30 years ago involved large didactic lectures wherein a vast amount of information was transmitted from professor to student, then crammed and forgotten. Memorizing facts was considered the key to being a competent physician. The most lauded professors were frequently referred to as walking textbooks. But that is no longer adequate. Medical knowledge is now a bookshelf of textbooks, well beyond the memorization of a single person. The photographic memory aided by cute mnemonics has been supplanted by a smartphone and Google.
The provision of medical care also has evolved. Rather than a solo practitioner in an office, now a team of subspecialists, aided by nurses and allied health personnel, provide care in inpatient and outpatient settings. My role as a hospitalist is to stitch together the various patches of expertise each team member has, to form a quilt that covers all the patient’s needs. Communication between team members is crucial. Accurate and complete handoffs of information also have become vital in the shift-based environment for delivering therapy in most hospital settings.
As a patient, I was quite annoyed when, after a day of tests and procedures, I was handed a computer form to fill out. It surveyed my "experience." Did I have any trouble making the appointment? Were the hours convenient? Was the staff courteous? It contained 22 items, but only one question seemed to have anything to do with whether my physician was competent. Perhaps we are in a consumer-oriented society, and the provision of medical care needs to reflect that with Press Ganey scores. But the engineer in me still focuses on those key goals of getting the diagnosis and therapy correct. Especially when I’m the recipient!
Will changing the test produce, and importantly, maintain, a more competent physician? What are the consequences of better patient satisfaction? Not necessarily better health, according to one large study. Higher patient satisfaction was associated with less emergency department use but greater inpatient use, as well as with higher overall health care and prescription drug expenditures (Arch. Intern. Med. 2012;172:405-11).
If medical educators teach to a better test, will society simply run into a better mousetrap?
Dr. Powell is associate professor of pediatrics at St. Louis University and a pediatric hospitalist at SSM Cardinal Glennon Children’s Medical Center in St. Louis. He said he had no relevant financial disclosures. E-mail Dr. Powell at [email protected]. This column, "Beyond the White Coat," appears regularly in Pediatric News.
This is the time of year when teaching to the test comes to the forefront. Standardized testing is endemic in medical training. Whether you are a high school senior taking the SAT, a college student applying to take the MCAT, a medical student struggling to pass United States Medical Licensing Examination (USMLE) Step 1, or a recent residency graduate sitting for the boards, taking a test can be a very anxious time. Careers can be markedly altered by the scores on the standardized tests. The reputations of educational institutions, including medical schools and residency programs, depend on the scores. So the anxiety is understandable.
On the other hand, the public – who are the future patients of these physicians – may have a different perspective. Do these tests really evaluate and select those who will become better physicians? Will those physicians have the optimal balance of scientific knowledge and the art of caring?
That has been a source of consternation since long before computers began scoring tests. This quandary has not been lost on medical educators. The MCAT itself will be undergoing an overhaul by 2015. The goal is to have "A Better Test for Tomorrow’s Doctors." A preview guide of those changes was released in November 2011, and the revised second edition was just released in September 2012.
The MCAT’s basic science questions, which previously focused on biology, physics, and chemistry, will now include a section on the psychological, social, and biological foundations of behavior. The intent is to select a more diverse group of medical students, some of whom have studied sociology or anthropology, rather than favoring the hard science majors. There will also be a "critical analysis and reasoning skills" section of the test. In modern medicine, regurgitated, memorized facts are not as important as being able to interpret and apply them. There are other initiatives, such as the Project to Rebalance and Integrate Medical Education (PRIME), seeking to overhaul the medical curriculum.
Medical education 30 years ago involved large didactic lectures wherein a vast amount of information was transmitted from professor to student, then crammed and forgotten. Memorizing facts was considered the key to being a competent physician. The most lauded professors were frequently referred to as walking textbooks. But that is no longer adequate. Medical knowledge is now a bookshelf of textbooks, well beyond the memorization of a single person. The photographic memory aided by cute mnemonics has been supplanted by a smartphone and Google.
The provision of medical care also has evolved. Rather than a solo practitioner in an office, now a team of subspecialists, aided by nurses and allied health personnel, provide care in inpatient and outpatient settings. My role as a hospitalist is to stitch together the various patches of expertise each team member has, to form a quilt that covers all the patient’s needs. Communication between team members is crucial. Accurate and complete handoffs of information also have become vital in the shift-based environment for delivering therapy in most hospital settings.
As a patient, I was quite annoyed when, after a day of tests and procedures, I was handed a computer form to fill out. It surveyed my "experience." Did I have any trouble making the appointment? Were the hours convenient? Was the staff courteous? It contained 22 items, but only one question seemed to have anything to do with whether my physician was competent. Perhaps we are in a consumer-oriented society, and the provision of medical care needs to reflect that with Press Ganey scores. But the engineer in me still focuses on those key goals of getting the diagnosis and therapy correct. Especially when I’m the recipient!
Will changing the test produce, and importantly, maintain, a more competent physician? What are the consequences of better patient satisfaction? Not necessarily better health, according to one large study. Higher patient satisfaction was associated with less emergency department use but greater inpatient use, as well as with higher overall health care and prescription drug expenditures (Arch. Intern. Med. 2012;172:405-11).
If medical educators teach to a better test, will society simply run into a better mousetrap?
Dr. Powell is associate professor of pediatrics at St. Louis University and a pediatric hospitalist at SSM Cardinal Glennon Children’s Medical Center in St. Louis. He said he had no relevant financial disclosures. E-mail Dr. Powell at [email protected]. This column, "Beyond the White Coat," appears regularly in Pediatric News.

Medicare for Dummies
In our office lunchroom recently a pharmaceutical rep informed us of changes to one of the more common Medicare Advantage programs that many of our patients use. During this discussion it came to light that I am not alone in my woeful lack of understanding of the different Medicare plans.
Open enrollment season for Medicare started Oct. 15 and ends on Dec. 7. This means millions of Americans older than 65 years of age need to pour through hundreds of pages of documents outlining rules on copays and deductibles, formulary coverage, and changing health care rules that have resulted from enactment of the Affordable Care Act (ACA). (The official government Medicare handbook for 2013 alone is 140 pages long.)
So, in the spirit of arming this dummy (i.e., myself) and other newbie practitioners with information to help us provide better care for our patients, here is a brief distillation of Medicare, with attention to some parts that may be more relevant to rheumatologists.
People over 65 years of age are eligible for Medicare, of which there are several parts:
• Medicare Part A. This part is also known as the Hospital Insurance Program. It covers inpatient care in hospitals and skilled nursing facilities – as long as such services meet criteria for the rendering thereof, of course.
• Medicare Part B. This is the Medical Insurance Program, which covers doctors’ services, outpatient care, and physical therapy. It covers x-rays, vaccinations, chemotherapy, and other outpatient medical treatments administered in a doctor’s office. For us this means infusional agents such as infliximab and rituximab, as well as some osteoporosis drugs such as zoledronic acid, which is infused, or denosumab, which has to be administered via subcutaneous injection by a health care professional.
• Medicare Part C. This is also called the Medicare Advantage Program. Private insurers are given money by Medicare to provide services covered under Medicare Part A and Part B. For additional premiums Advantage programs can also provide Part D coverage as well as other extras like dental coverage, vision care, and health club memberships.
It was in fact a Medicare Advantage plan, administered here in Rhode Island by a national provider, that spurred this discussion. This particular plan used to cover infusions (i.e., a Part B benefit) at 100% of the cost. However, rumor has it that beginning in 2013, the insurer will start to charge patients 20% of the cost. Imagine, then, how much money our patients on office-administered biologics will have to start shelling out for their treatments. Imagine the hardship for someone who has been well controlled, for example, on infliximab for years suddenly having to come up with several hundred dollars every other month?
• Medicare Part D. This is an outpatient prescription drug benefit. Unlike Part A and Part B, Part D is not standard. Though the different Part D prescription drug plans are regulated by Medicare, they are actually designed and administered by private insurance companies, who can dictate which drugs or drug classes they cover, and at what tier they offer the drugs. An individual can have up to 40 different Part D plans to choose from, and patients are left with the tough job of figuring out which drug plan best fits their needs.
This is also relevant to us because this is how our Medicare patients pay for most prescription drugs. This is also the source of a significant coverage gap, informally and infamously known as the "doughnut hole." In general Part D beneficiaries pay a deductible and Medicare covers the rest of the drug costs. When patients have spent about $2,900 (of their own money in the form of deductibles and of government money in the form of coverage), they become responsible for 100% of their medication costs, until they reach about $4,700 in out-of-pocket spending, at which point Medicare foots most of the bill for the rest of the year. Imagine, then, how difficult it would be for a patient with RA on a biologic, which can cost up to $3,000 a month.
Incidentally, thanks to government negotiations with pharmaceutical companies, in 2012 patients were responsible for only 50% of the cost of branded drugs instead of 100%. The ACA anticipates "closing" the doughnut hole by 2020; Medicare would continue to cover part of the drug costs, leaving consumers with a responsibility for 25% instead of 100%.
This all brings to mind wise words that a patient passed on to me. She told me that when she was first diagnosed with RA many years ago, the rheumatologist who made the diagnosis advised her to always make sure she had the best health insurance possible. I continue to share that advice with my patients today.
Dr. Chan practices rheumatology in Pawtucket, R.I. E-mail her at [email protected].
In our office lunchroom recently a pharmaceutical rep informed us of changes to one of the more common Medicare Advantage programs that many of our patients use. During this discussion it came to light that I am not alone in my woeful lack of understanding of the different Medicare plans.
Open enrollment season for Medicare started Oct. 15 and ends on Dec. 7. This means millions of Americans older than 65 years of age need to pour through hundreds of pages of documents outlining rules on copays and deductibles, formulary coverage, and changing health care rules that have resulted from enactment of the Affordable Care Act (ACA). (The official government Medicare handbook for 2013 alone is 140 pages long.)
So, in the spirit of arming this dummy (i.e., myself) and other newbie practitioners with information to help us provide better care for our patients, here is a brief distillation of Medicare, with attention to some parts that may be more relevant to rheumatologists.
People over 65 years of age are eligible for Medicare, of which there are several parts:
• Medicare Part A. This part is also known as the Hospital Insurance Program. It covers inpatient care in hospitals and skilled nursing facilities – as long as such services meet criteria for the rendering thereof, of course.
• Medicare Part B. This is the Medical Insurance Program, which covers doctors’ services, outpatient care, and physical therapy. It covers x-rays, vaccinations, chemotherapy, and other outpatient medical treatments administered in a doctor’s office. For us this means infusional agents such as infliximab and rituximab, as well as some osteoporosis drugs such as zoledronic acid, which is infused, or denosumab, which has to be administered via subcutaneous injection by a health care professional.
• Medicare Part C. This is also called the Medicare Advantage Program. Private insurers are given money by Medicare to provide services covered under Medicare Part A and Part B. For additional premiums Advantage programs can also provide Part D coverage as well as other extras like dental coverage, vision care, and health club memberships.
It was in fact a Medicare Advantage plan, administered here in Rhode Island by a national provider, that spurred this discussion. This particular plan used to cover infusions (i.e., a Part B benefit) at 100% of the cost. However, rumor has it that beginning in 2013, the insurer will start to charge patients 20% of the cost. Imagine, then, how much money our patients on office-administered biologics will have to start shelling out for their treatments. Imagine the hardship for someone who has been well controlled, for example, on infliximab for years suddenly having to come up with several hundred dollars every other month?
• Medicare Part D. This is an outpatient prescription drug benefit. Unlike Part A and Part B, Part D is not standard. Though the different Part D prescription drug plans are regulated by Medicare, they are actually designed and administered by private insurance companies, who can dictate which drugs or drug classes they cover, and at what tier they offer the drugs. An individual can have up to 40 different Part D plans to choose from, and patients are left with the tough job of figuring out which drug plan best fits their needs.
This is also relevant to us because this is how our Medicare patients pay for most prescription drugs. This is also the source of a significant coverage gap, informally and infamously known as the "doughnut hole." In general Part D beneficiaries pay a deductible and Medicare covers the rest of the drug costs. When patients have spent about $2,900 (of their own money in the form of deductibles and of government money in the form of coverage), they become responsible for 100% of their medication costs, until they reach about $4,700 in out-of-pocket spending, at which point Medicare foots most of the bill for the rest of the year. Imagine, then, how difficult it would be for a patient with RA on a biologic, which can cost up to $3,000 a month.
Incidentally, thanks to government negotiations with pharmaceutical companies, in 2012 patients were responsible for only 50% of the cost of branded drugs instead of 100%. The ACA anticipates "closing" the doughnut hole by 2020; Medicare would continue to cover part of the drug costs, leaving consumers with a responsibility for 25% instead of 100%.
This all brings to mind wise words that a patient passed on to me. She told me that when she was first diagnosed with RA many years ago, the rheumatologist who made the diagnosis advised her to always make sure she had the best health insurance possible. I continue to share that advice with my patients today.
Dr. Chan practices rheumatology in Pawtucket, R.I. E-mail her at [email protected].
In our office lunchroom recently a pharmaceutical rep informed us of changes to one of the more common Medicare Advantage programs that many of our patients use. During this discussion it came to light that I am not alone in my woeful lack of understanding of the different Medicare plans.
Open enrollment season for Medicare started Oct. 15 and ends on Dec. 7. This means millions of Americans older than 65 years of age need to pour through hundreds of pages of documents outlining rules on copays and deductibles, formulary coverage, and changing health care rules that have resulted from enactment of the Affordable Care Act (ACA). (The official government Medicare handbook for 2013 alone is 140 pages long.)
So, in the spirit of arming this dummy (i.e., myself) and other newbie practitioners with information to help us provide better care for our patients, here is a brief distillation of Medicare, with attention to some parts that may be more relevant to rheumatologists.
People over 65 years of age are eligible for Medicare, of which there are several parts:
• Medicare Part A. This part is also known as the Hospital Insurance Program. It covers inpatient care in hospitals and skilled nursing facilities – as long as such services meet criteria for the rendering thereof, of course.
• Medicare Part B. This is the Medical Insurance Program, which covers doctors’ services, outpatient care, and physical therapy. It covers x-rays, vaccinations, chemotherapy, and other outpatient medical treatments administered in a doctor’s office. For us this means infusional agents such as infliximab and rituximab, as well as some osteoporosis drugs such as zoledronic acid, which is infused, or denosumab, which has to be administered via subcutaneous injection by a health care professional.
• Medicare Part C. This is also called the Medicare Advantage Program. Private insurers are given money by Medicare to provide services covered under Medicare Part A and Part B. For additional premiums Advantage programs can also provide Part D coverage as well as other extras like dental coverage, vision care, and health club memberships.
It was in fact a Medicare Advantage plan, administered here in Rhode Island by a national provider, that spurred this discussion. This particular plan used to cover infusions (i.e., a Part B benefit) at 100% of the cost. However, rumor has it that beginning in 2013, the insurer will start to charge patients 20% of the cost. Imagine, then, how much money our patients on office-administered biologics will have to start shelling out for their treatments. Imagine the hardship for someone who has been well controlled, for example, on infliximab for years suddenly having to come up with several hundred dollars every other month?
• Medicare Part D. This is an outpatient prescription drug benefit. Unlike Part A and Part B, Part D is not standard. Though the different Part D prescription drug plans are regulated by Medicare, they are actually designed and administered by private insurance companies, who can dictate which drugs or drug classes they cover, and at what tier they offer the drugs. An individual can have up to 40 different Part D plans to choose from, and patients are left with the tough job of figuring out which drug plan best fits their needs.
This is also relevant to us because this is how our Medicare patients pay for most prescription drugs. This is also the source of a significant coverage gap, informally and infamously known as the "doughnut hole." In general Part D beneficiaries pay a deductible and Medicare covers the rest of the drug costs. When patients have spent about $2,900 (of their own money in the form of deductibles and of government money in the form of coverage), they become responsible for 100% of their medication costs, until they reach about $4,700 in out-of-pocket spending, at which point Medicare foots most of the bill for the rest of the year. Imagine, then, how difficult it would be for a patient with RA on a biologic, which can cost up to $3,000 a month.
Incidentally, thanks to government negotiations with pharmaceutical companies, in 2012 patients were responsible for only 50% of the cost of branded drugs instead of 100%. The ACA anticipates "closing" the doughnut hole by 2020; Medicare would continue to cover part of the drug costs, leaving consumers with a responsibility for 25% instead of 100%.
This all brings to mind wise words that a patient passed on to me. She told me that when she was first diagnosed with RA many years ago, the rheumatologist who made the diagnosis advised her to always make sure she had the best health insurance possible. I continue to share that advice with my patients today.
Dr. Chan practices rheumatology in Pawtucket, R.I. E-mail her at [email protected].

FDA Reports Dabigatran Bleeds Don't Exceed Warfarin Bleeds
The Food and Drug Administration is satisfied that dabigatran’s bleeding risk is no greater than that of warfarin and will not change the drug’s label.
The rates of gastrointestinal and intracranial bleeding among patients who have been prescribed the anticoagulant dabigatran "do not appear to be higher" than the rates among patients who have been prescribed warfarin, according to an analysis of insurance claims and administrative data conducted by the agency.

The results of this analysis, conducted in response to postmarketing reports of bleeding among people treated with dabigatran, are "consistent with observations" in the RE-LY trial, the study of 18,000 patients that was the basis of the approval of the anticoagulant for reducing the risk of stroke and blood clots in patients with nonvalvular atrial fibrillation (AF), the FDA said in the MedWatch safety alert, released on Nov. 2. In the RE-LY study, the rates of serious bleeding was similar among those treated with dabigatran and those with warfarin (N. Engl. J. Med. 2009;361:1139-51).
The agency is evaluating different sources of data in its review of this safety issue, which is ongoing. Dabigatran, an orally administered direct thrombin inhibitor, was approved in October 2010 for reducing the risk of stroke and systemic embolism in patients with nonvalvular atrial fibrillation and is marketed as Pradaxa by Boehringer Ingelheim.
The FDA’s analysis found that the rates of bleeding were actually higher among those on warfarin, although the statement does not point this out. The FDA analyzed data from a database of nearly 100 million patients and determined that the combined incidence of intracranial and gastrointestinal hemorrhages per 100,000 days at risk was 1.8-2.6 times higher for new users of warfarin than for new users of dabigatran. When they analyzed the two events separately, they found that the incidence rate of gastrointestinal hemorrhage events per 100,000 days at risk was 1.6-2.2 times higher for new users of warfarin than for new users of dabigatran. The incidence rate of intracranial hemorrhage events per 100,000 days at risk was 2.1-3.0 times higher for new users of warfarin than for those on dabigatran.
These estimates do not account for age, medical conditions, or other differences between the patients on warfarin and dabigatran that could affect bleeding outcomes, according to the FDA. In addition, although a "large" number of reports of bleeding in treated patients were submitted to the FDA’s Adverse Events Reporting System (FAERS) after dabigatran was approved, the agency believes that a "simple comparison" between the number of postmarketing bleeding events associated with dabigatran and warfarin is "misleading" because it is likely that bleeding events associated with warfarin are under reported, since the drug has been available for so long and bleeding is a well-recognized consequence of warfarin treatment.
At this time, the FDA is not changing any recommendations on the dabigatran label and is continuing to monitor postmarketing reports of bleeding in patients on dabigatran "for evidence of inappropriate dosing, use of interacting drugs, and other clinical factors that might lead to a bleeding event," according to the statement. The recommendations in the statement include advice to clinicians that they evaluate a patient’s renal function before prescribing dabigatran, which is eliminated by the kidneys, and the dosing regimens for patients with severe renal impairment and those with a creatinine clearance above 30 mL/min.
Click here for the Medwatch safety alert. Adverse events associated with dabigatran should be reported here or to the FDA at 800-332-0178.
The Food and Drug Administration is satisfied that dabigatran’s bleeding risk is no greater than that of warfarin and will not change the drug’s label.
The rates of gastrointestinal and intracranial bleeding among patients who have been prescribed the anticoagulant dabigatran "do not appear to be higher" than the rates among patients who have been prescribed warfarin, according to an analysis of insurance claims and administrative data conducted by the agency.
The results of this analysis, conducted in response to postmarketing reports of bleeding among people treated with dabigatran, are "consistent with observations" in the RE-LY trial, the study of 18,000 patients that was the basis of the approval of the anticoagulant for reducing the risk of stroke and blood clots in patients with nonvalvular atrial fibrillation (AF), the FDA said in the MedWatch safety alert, released on Nov. 2. In the RE-LY study, the rates of serious bleeding was similar among those treated with dabigatran and those with warfarin (N. Engl. J. Med. 2009;361:1139-51).
The agency is evaluating different sources of data in its review of this safety issue, which is ongoing. Dabigatran, an orally administered direct thrombin inhibitor, was approved in October 2010 for reducing the risk of stroke and systemic embolism in patients with nonvalvular atrial fibrillation and is marketed as Pradaxa by Boehringer Ingelheim.
The FDA’s analysis found that the rates of bleeding were actually higher among those on warfarin, although the statement does not point this out. The FDA analyzed data from a database of nearly 100 million patients and determined that the combined incidence of intracranial and gastrointestinal hemorrhages per 100,000 days at risk was 1.8-2.6 times higher for new users of warfarin than for new users of dabigatran. When they analyzed the two events separately, they found that the incidence rate of gastrointestinal hemorrhage events per 100,000 days at risk was 1.6-2.2 times higher for new users of warfarin than for new users of dabigatran. The incidence rate of intracranial hemorrhage events per 100,000 days at risk was 2.1-3.0 times higher for new users of warfarin than for those on dabigatran.
These estimates do not account for age, medical conditions, or other differences between the patients on warfarin and dabigatran that could affect bleeding outcomes, according to the FDA. In addition, although a "large" number of reports of bleeding in treated patients were submitted to the FDA’s Adverse Events Reporting System (FAERS) after dabigatran was approved, the agency believes that a "simple comparison" between the number of postmarketing bleeding events associated with dabigatran and warfarin is "misleading" because it is likely that bleeding events associated with warfarin are under reported, since the drug has been available for so long and bleeding is a well-recognized consequence of warfarin treatment.
At this time, the FDA is not changing any recommendations on the dabigatran label and is continuing to monitor postmarketing reports of bleeding in patients on dabigatran "for evidence of inappropriate dosing, use of interacting drugs, and other clinical factors that might lead to a bleeding event," according to the statement. The recommendations in the statement include advice to clinicians that they evaluate a patient’s renal function before prescribing dabigatran, which is eliminated by the kidneys, and the dosing regimens for patients with severe renal impairment and those with a creatinine clearance above 30 mL/min.
Click here for the Medwatch safety alert. Adverse events associated with dabigatran should be reported here or to the FDA at 800-332-0178.
The Food and Drug Administration is satisfied that dabigatran’s bleeding risk is no greater than that of warfarin and will not change the drug’s label.
The rates of gastrointestinal and intracranial bleeding among patients who have been prescribed the anticoagulant dabigatran "do not appear to be higher" than the rates among patients who have been prescribed warfarin, according to an analysis of insurance claims and administrative data conducted by the agency.
The results of this analysis, conducted in response to postmarketing reports of bleeding among people treated with dabigatran, are "consistent with observations" in the RE-LY trial, the study of 18,000 patients that was the basis of the approval of the anticoagulant for reducing the risk of stroke and blood clots in patients with nonvalvular atrial fibrillation (AF), the FDA said in the MedWatch safety alert, released on Nov. 2. In the RE-LY study, the rates of serious bleeding was similar among those treated with dabigatran and those with warfarin (N. Engl. J. Med. 2009;361:1139-51).
The agency is evaluating different sources of data in its review of this safety issue, which is ongoing. Dabigatran, an orally administered direct thrombin inhibitor, was approved in October 2010 for reducing the risk of stroke and systemic embolism in patients with nonvalvular atrial fibrillation and is marketed as Pradaxa by Boehringer Ingelheim.
The FDA’s analysis found that the rates of bleeding were actually higher among those on warfarin, although the statement does not point this out. The FDA analyzed data from a database of nearly 100 million patients and determined that the combined incidence of intracranial and gastrointestinal hemorrhages per 100,000 days at risk was 1.8-2.6 times higher for new users of warfarin than for new users of dabigatran. When they analyzed the two events separately, they found that the incidence rate of gastrointestinal hemorrhage events per 100,000 days at risk was 1.6-2.2 times higher for new users of warfarin than for new users of dabigatran. The incidence rate of intracranial hemorrhage events per 100,000 days at risk was 2.1-3.0 times higher for new users of warfarin than for those on dabigatran.
These estimates do not account for age, medical conditions, or other differences between the patients on warfarin and dabigatran that could affect bleeding outcomes, according to the FDA. In addition, although a "large" number of reports of bleeding in treated patients were submitted to the FDA’s Adverse Events Reporting System (FAERS) after dabigatran was approved, the agency believes that a "simple comparison" between the number of postmarketing bleeding events associated with dabigatran and warfarin is "misleading" because it is likely that bleeding events associated with warfarin are under reported, since the drug has been available for so long and bleeding is a well-recognized consequence of warfarin treatment.
At this time, the FDA is not changing any recommendations on the dabigatran label and is continuing to monitor postmarketing reports of bleeding in patients on dabigatran "for evidence of inappropriate dosing, use of interacting drugs, and other clinical factors that might lead to a bleeding event," according to the statement. The recommendations in the statement include advice to clinicians that they evaluate a patient’s renal function before prescribing dabigatran, which is eliminated by the kidneys, and the dosing regimens for patients with severe renal impairment and those with a creatinine clearance above 30 mL/min.
Click here for the Medwatch safety alert. Adverse events associated with dabigatran should be reported here or to the FDA at 800-332-0178.

Counsel Patients on ATV Safety
NEW ORLEANS – Adolescents, especially those in rural areas, are likely to ride all-terrain vehicles, or ATVs, and participate in risky behavior, according to researchers who advise pediatricians to provide simple safety tips to young patients and their families.
Children under 16 continue to make up as much as a quarter of ATV-related deaths and injuries, according to national data. Although there has been a slight decline in recent years, experts say that the numbers are still too high.
Failure to use safety equipment like helmets, a lack of training, and failure to follow manufacturer safety recommendations are among the reasons for injuries in children, several studies have shown.

A survey of almost 3,000 Iowa students between ages 11 and 16 showed that nearly 85% had ridden an ATV at least a few times a year, and almost 60% of those who had been on an ATV reported having been in a crash.
"As a pediatrician, I think knowing the significant exposure children have to ATVs and their high crash incidence emphasizes the importance of our involvement in counseling families and educating them on safe practice," said Dr. Charles Jennissen, lead author of the survey and director of pediatric emergency medicine at the University of Iowa Hospitals and Clinics, Iowa City.
Growing up on a dairy farm in Central Minnesota and now working in Iowa as a pediatric emergency physician, Dr. Jennissen said he was quite familiar with ATVs and has seen his share of ATV-related injuries, not to mention losing a close family member to an ATV crash. He has published several studies on the topic.
Yet, he said he was slightly surprised by the findings from his survey.
His study showed that of those who said they had been on an ATV, more than 60% said they never or almost never wore a helmet (only 18% said they always or almost always wore a helmet), 92% said they had ridden with passengers, and 81% said they had ridden an ATV on a public road.
Dr. Jennissen said that one of his recent studies shows that 62% of all ATV-related deaths have occurred on roadways.
All-terrain vehicles were introduced in the United States about 3 decades ago for work purposes, but quickly became recreational machines for adults and children.
In 1985, the earliest year with data on atvsafety.gov, there were 250 reported deaths among all age groups and almost 106,000 injuries treated in an emergency department. In 2006, the last year for which complete data are available, those numbers rose to 833 and 147,000.
The number of reported deaths among children under 16 years old has also increased since 1990, rising from 81 to 142 in 2006. The number of emergency department visits for children rose from 22,400 to 39,300 during that period.
Meanwhile, a growing body of literature is accumulating on how dangerous these machines are, especially when children drive adult-size ATVs, said Dr. Rebeccah L. Brown, a trauma surgeon at the Cincinnati Children’s Hospital Medical Center.
A 2009 study of ATV and bicycle deaths showed that more children died annually from ATV injuries than from bicycle crashes.
Several medical associations including the American Academy of Pediatrics and the American Academy of Orthopaedic Surgeons, along with the Consumer Product Safety Commission, have called for restriction on the sale of ATVs to children (Pediatrics 2000;105:1352-4).
In a policy statement, Safe Kids USA, a global nonprofit organization focused on preventing unintentional childhood injury, said that until children "are fully licensed under state law to operate a motor vehicle, children should not operate or ride as passengers on ATVs of any size, including youth ATVs."
But the data and policies aren’t deterring adolescents from riding ATVs.
In a survey of 44 families of children who had been in an ATV crash between 2004 and 2009, Dr. Brown and her colleagues found that despite hospitalization and injuries, nearly 60% of the patients began riding again within 6 months of hospitalization.
Dr. Brown said nearly 50 families declined to participate in the survey, fearing the study would lead to legislation that would ban kids from riding ATVs.
"A lot of families see it as a family-bonding time and a fun time. They just don’t realize the danger," said Dr. Brown, who has been researching ATV injuries for more than a decade.
Her survey showed that nearly 80% of the respondents had permission to ride ATVs, and 64% were under adult supervision when they were injured.
Dr. Brown’s study also showed that none of the surveyed respondents underwent a formal ATV training course, although nearly half said they received training from a friend or relative. Only five dealers offered training.
Meanwhile, in a separate study, Dr. Jennissen and his colleagues showed that many primary care providers don’t advise their patients on ATV safety.
In an electronic survey of 218 primary care providers, 60% said they thought ATV anticipatory guidance was important for pediatric patients and their families. However, nearly 80% said they provided such counseling less than 10% of the time (J. Community Health 2012;37:968-75).
The survey also showed that families rarely ask about ATV safety; 84% of providers said they were asked about ATVs once a year or less.
"You don’t have to be an expert on ATVs, but you should be able to provide families basic safety recommendations and refer them to web sites for more detailed information," said Dr. Jennissen.
Dr. Jennissen and Dr. Brown said they had no relevant financial disclosures.
NEW ORLEANS – Adolescents, especially those in rural areas, are likely to ride all-terrain vehicles, or ATVs, and participate in risky behavior, according to researchers who advise pediatricians to provide simple safety tips to young patients and their families.
Children under 16 continue to make up as much as a quarter of ATV-related deaths and injuries, according to national data. Although there has been a slight decline in recent years, experts say that the numbers are still too high.
Failure to use safety equipment like helmets, a lack of training, and failure to follow manufacturer safety recommendations are among the reasons for injuries in children, several studies have shown.
A survey of almost 3,000 Iowa students between ages 11 and 16 showed that nearly 85% had ridden an ATV at least a few times a year, and almost 60% of those who had been on an ATV reported having been in a crash.
"As a pediatrician, I think knowing the significant exposure children have to ATVs and their high crash incidence emphasizes the importance of our involvement in counseling families and educating them on safe practice," said Dr. Charles Jennissen, lead author of the survey and director of pediatric emergency medicine at the University of Iowa Hospitals and Clinics, Iowa City.
Growing up on a dairy farm in Central Minnesota and now working in Iowa as a pediatric emergency physician, Dr. Jennissen said he was quite familiar with ATVs and has seen his share of ATV-related injuries, not to mention losing a close family member to an ATV crash. He has published several studies on the topic.
Yet, he said he was slightly surprised by the findings from his survey.
His study showed that of those who said they had been on an ATV, more than 60% said they never or almost never wore a helmet (only 18% said they always or almost always wore a helmet), 92% said they had ridden with passengers, and 81% said they had ridden an ATV on a public road.
Dr. Jennissen said that one of his recent studies shows that 62% of all ATV-related deaths have occurred on roadways.
All-terrain vehicles were introduced in the United States about 3 decades ago for work purposes, but quickly became recreational machines for adults and children.
In 1985, the earliest year with data on atvsafety.gov, there were 250 reported deaths among all age groups and almost 106,000 injuries treated in an emergency department. In 2006, the last year for which complete data are available, those numbers rose to 833 and 147,000.
The number of reported deaths among children under 16 years old has also increased since 1990, rising from 81 to 142 in 2006. The number of emergency department visits for children rose from 22,400 to 39,300 during that period.
Meanwhile, a growing body of literature is accumulating on how dangerous these machines are, especially when children drive adult-size ATVs, said Dr. Rebeccah L. Brown, a trauma surgeon at the Cincinnati Children’s Hospital Medical Center.
A 2009 study of ATV and bicycle deaths showed that more children died annually from ATV injuries than from bicycle crashes.
Several medical associations including the American Academy of Pediatrics and the American Academy of Orthopaedic Surgeons, along with the Consumer Product Safety Commission, have called for restriction on the sale of ATVs to children (Pediatrics 2000;105:1352-4).
In a policy statement, Safe Kids USA, a global nonprofit organization focused on preventing unintentional childhood injury, said that until children "are fully licensed under state law to operate a motor vehicle, children should not operate or ride as passengers on ATVs of any size, including youth ATVs."
But the data and policies aren’t deterring adolescents from riding ATVs.
In a survey of 44 families of children who had been in an ATV crash between 2004 and 2009, Dr. Brown and her colleagues found that despite hospitalization and injuries, nearly 60% of the patients began riding again within 6 months of hospitalization.
Dr. Brown said nearly 50 families declined to participate in the survey, fearing the study would lead to legislation that would ban kids from riding ATVs.
"A lot of families see it as a family-bonding time and a fun time. They just don’t realize the danger," said Dr. Brown, who has been researching ATV injuries for more than a decade.
Her survey showed that nearly 80% of the respondents had permission to ride ATVs, and 64% were under adult supervision when they were injured.
Dr. Brown’s study also showed that none of the surveyed respondents underwent a formal ATV training course, although nearly half said they received training from a friend or relative. Only five dealers offered training.
Meanwhile, in a separate study, Dr. Jennissen and his colleagues showed that many primary care providers don’t advise their patients on ATV safety.
In an electronic survey of 218 primary care providers, 60% said they thought ATV anticipatory guidance was important for pediatric patients and their families. However, nearly 80% said they provided such counseling less than 10% of the time (J. Community Health 2012;37:968-75).
The survey also showed that families rarely ask about ATV safety; 84% of providers said they were asked about ATVs once a year or less.
"You don’t have to be an expert on ATVs, but you should be able to provide families basic safety recommendations and refer them to web sites for more detailed information," said Dr. Jennissen.
Dr. Jennissen and Dr. Brown said they had no relevant financial disclosures.
NEW ORLEANS – Adolescents, especially those in rural areas, are likely to ride all-terrain vehicles, or ATVs, and participate in risky behavior, according to researchers who advise pediatricians to provide simple safety tips to young patients and their families.
Children under 16 continue to make up as much as a quarter of ATV-related deaths and injuries, according to national data. Although there has been a slight decline in recent years, experts say that the numbers are still too high.
Failure to use safety equipment like helmets, a lack of training, and failure to follow manufacturer safety recommendations are among the reasons for injuries in children, several studies have shown.
A survey of almost 3,000 Iowa students between ages 11 and 16 showed that nearly 85% had ridden an ATV at least a few times a year, and almost 60% of those who had been on an ATV reported having been in a crash.
"As a pediatrician, I think knowing the significant exposure children have to ATVs and their high crash incidence emphasizes the importance of our involvement in counseling families and educating them on safe practice," said Dr. Charles Jennissen, lead author of the survey and director of pediatric emergency medicine at the University of Iowa Hospitals and Clinics, Iowa City.
Growing up on a dairy farm in Central Minnesota and now working in Iowa as a pediatric emergency physician, Dr. Jennissen said he was quite familiar with ATVs and has seen his share of ATV-related injuries, not to mention losing a close family member to an ATV crash. He has published several studies on the topic.
Yet, he said he was slightly surprised by the findings from his survey.
His study showed that of those who said they had been on an ATV, more than 60% said they never or almost never wore a helmet (only 18% said they always or almost always wore a helmet), 92% said they had ridden with passengers, and 81% said they had ridden an ATV on a public road.
Dr. Jennissen said that one of his recent studies shows that 62% of all ATV-related deaths have occurred on roadways.
All-terrain vehicles were introduced in the United States about 3 decades ago for work purposes, but quickly became recreational machines for adults and children.
In 1985, the earliest year with data on atvsafety.gov, there were 250 reported deaths among all age groups and almost 106,000 injuries treated in an emergency department. In 2006, the last year for which complete data are available, those numbers rose to 833 and 147,000.
The number of reported deaths among children under 16 years old has also increased since 1990, rising from 81 to 142 in 2006. The number of emergency department visits for children rose from 22,400 to 39,300 during that period.
Meanwhile, a growing body of literature is accumulating on how dangerous these machines are, especially when children drive adult-size ATVs, said Dr. Rebeccah L. Brown, a trauma surgeon at the Cincinnati Children’s Hospital Medical Center.
A 2009 study of ATV and bicycle deaths showed that more children died annually from ATV injuries than from bicycle crashes.
Several medical associations including the American Academy of Pediatrics and the American Academy of Orthopaedic Surgeons, along with the Consumer Product Safety Commission, have called for restriction on the sale of ATVs to children (Pediatrics 2000;105:1352-4).
In a policy statement, Safe Kids USA, a global nonprofit organization focused on preventing unintentional childhood injury, said that until children "are fully licensed under state law to operate a motor vehicle, children should not operate or ride as passengers on ATVs of any size, including youth ATVs."
But the data and policies aren’t deterring adolescents from riding ATVs.
In a survey of 44 families of children who had been in an ATV crash between 2004 and 2009, Dr. Brown and her colleagues found that despite hospitalization and injuries, nearly 60% of the patients began riding again within 6 months of hospitalization.
Dr. Brown said nearly 50 families declined to participate in the survey, fearing the study would lead to legislation that would ban kids from riding ATVs.
"A lot of families see it as a family-bonding time and a fun time. They just don’t realize the danger," said Dr. Brown, who has been researching ATV injuries for more than a decade.
Her survey showed that nearly 80% of the respondents had permission to ride ATVs, and 64% were under adult supervision when they were injured.
Dr. Brown’s study also showed that none of the surveyed respondents underwent a formal ATV training course, although nearly half said they received training from a friend or relative. Only five dealers offered training.
Meanwhile, in a separate study, Dr. Jennissen and his colleagues showed that many primary care providers don’t advise their patients on ATV safety.
In an electronic survey of 218 primary care providers, 60% said they thought ATV anticipatory guidance was important for pediatric patients and their families. However, nearly 80% said they provided such counseling less than 10% of the time (J. Community Health 2012;37:968-75).
The survey also showed that families rarely ask about ATV safety; 84% of providers said they were asked about ATVs once a year or less.
"You don’t have to be an expert on ATVs, but you should be able to provide families basic safety recommendations and refer them to web sites for more detailed information," said Dr. Jennissen.
Dr. Jennissen and Dr. Brown said they had no relevant financial disclosures.
AT THE ANNUAL MEETING OF THE AMERICAN ACADEMY OF PEDIATRICS
Major Finding: Nearly 85% of Iowa teens had ridden an ATV at least a few times a year, and almost 60% of those who had been on an ATV reported having been in a crash.
Data Source: Data are from a study of almost 3,000 Iowa students between the ages of 11 and 16 years.
Disclosures: Dr. Jennissen and Dr. Brown said they had no relevant financial disclosures.

Acetaminophen: Effect on Drinkers' ALT Levels Appears Safe
SAN DIEGO – Giving acetaminophen to patients who reported consuming ethanol did not adversely affect markers of liver damage in a meta-analysis of randomized, controlled trials.
"One of the questions we often get asked is the role of acetaminophen in patients with liver disease," according to Dr. Kennon J. Heard, who is an emergency medicine physician at the University of Colorado and director of the Medical Toxicology Fellowship at the Rocky Mountain Poison and Drug Center, Denver.

The findings of the meta-analysis suggest that "acetaminophen is safe in alcoholics," Dr. Heard said at the annual meeting of the Society of Hospital Medicine.
The meta-analysis included five trials involving 901 subjects (including patients who reported drinking ethanol) who were randomized to receive acetaminophen or placebo.
Dr. Heard and his associates looked at daily ALT measurements out to a mean of 4 days, a time period for which most of the studies had data.
They also looked for any evidence of liver injury or dysfunction, hepatotoxicity, or death.
The alanine aminotransferase (ALT) levels changed by a mean of 0.04 IU/L after starting acetaminophen or placebo, "less than a tenth of a point in ALT," reported Dr. Heard.
"Essentially, in this group of patients who consume alcohol, if you give them acetaminophen for 4 days, you don’t see any change in their ALT," according to Dr. Heard.
The study is to be published in the journal Pharmacotherapy.
When acetaminophen consumption continued beyond 4 days, ALT levels increased in most patients who consumed alcohol but also increased in 60% of nondrinkers.
"The changes in the alcoholics look exactly like the changes in the nonalcoholics," he said.
The median increase in ALT was between 10-20 IU/L.
Among patients who drink alcohol, the highest ALT level in the acetaminophen group was 312 IU/L, "which is pretty impressive until you see that in the placebo group, somebody went up 288" IU/L, he said.
The biggest increase in ALT was in a healthy nondrinking patient on acetaminophen, whose ALT increased by 638 IU/L.
Most importantly, none of the 551 people who received acetaminophen in those trials developed an increase in International Normalized Ratio, bilirubin level, or symptomatic liver injury, Dr. Heard and his associates found.
Dr. Heard said that he and his associates are now in the process of finishing a separate study that appears to confirm that these are asymptomatic, self-limiting elevations in ALT that will go away even if people stay on acetaminophen.
Such information is valuable, he said. "It is worth knowing that if you have someone who has an ALT elevation while taking acetaminophen, it may be the cause, and it is reasonable to stop the acetaminophen and see if their ALT elevations go away rather than do an extensive work-up for hepatitis," Dr. Heard said.
SAN DIEGO – Giving acetaminophen to patients who reported consuming ethanol did not adversely affect markers of liver damage in a meta-analysis of randomized, controlled trials.
"One of the questions we often get asked is the role of acetaminophen in patients with liver disease," according to Dr. Kennon J. Heard, who is an emergency medicine physician at the University of Colorado and director of the Medical Toxicology Fellowship at the Rocky Mountain Poison and Drug Center, Denver.
The findings of the meta-analysis suggest that "acetaminophen is safe in alcoholics," Dr. Heard said at the annual meeting of the Society of Hospital Medicine.
The meta-analysis included five trials involving 901 subjects (including patients who reported drinking ethanol) who were randomized to receive acetaminophen or placebo.
Dr. Heard and his associates looked at daily ALT measurements out to a mean of 4 days, a time period for which most of the studies had data.
They also looked for any evidence of liver injury or dysfunction, hepatotoxicity, or death.
The alanine aminotransferase (ALT) levels changed by a mean of 0.04 IU/L after starting acetaminophen or placebo, "less than a tenth of a point in ALT," reported Dr. Heard.
"Essentially, in this group of patients who consume alcohol, if you give them acetaminophen for 4 days, you don’t see any change in their ALT," according to Dr. Heard.
The study is to be published in the journal Pharmacotherapy.
When acetaminophen consumption continued beyond 4 days, ALT levels increased in most patients who consumed alcohol but also increased in 60% of nondrinkers.
"The changes in the alcoholics look exactly like the changes in the nonalcoholics," he said.
The median increase in ALT was between 10-20 IU/L.
Among patients who drink alcohol, the highest ALT level in the acetaminophen group was 312 IU/L, "which is pretty impressive until you see that in the placebo group, somebody went up 288" IU/L, he said.
The biggest increase in ALT was in a healthy nondrinking patient on acetaminophen, whose ALT increased by 638 IU/L.
Most importantly, none of the 551 people who received acetaminophen in those trials developed an increase in International Normalized Ratio, bilirubin level, or symptomatic liver injury, Dr. Heard and his associates found.
Dr. Heard said that he and his associates are now in the process of finishing a separate study that appears to confirm that these are asymptomatic, self-limiting elevations in ALT that will go away even if people stay on acetaminophen.
Such information is valuable, he said. "It is worth knowing that if you have someone who has an ALT elevation while taking acetaminophen, it may be the cause, and it is reasonable to stop the acetaminophen and see if their ALT elevations go away rather than do an extensive work-up for hepatitis," Dr. Heard said.
SAN DIEGO – Giving acetaminophen to patients who reported consuming ethanol did not adversely affect markers of liver damage in a meta-analysis of randomized, controlled trials.
"One of the questions we often get asked is the role of acetaminophen in patients with liver disease," according to Dr. Kennon J. Heard, who is an emergency medicine physician at the University of Colorado and director of the Medical Toxicology Fellowship at the Rocky Mountain Poison and Drug Center, Denver.
The findings of the meta-analysis suggest that "acetaminophen is safe in alcoholics," Dr. Heard said at the annual meeting of the Society of Hospital Medicine.
The meta-analysis included five trials involving 901 subjects (including patients who reported drinking ethanol) who were randomized to receive acetaminophen or placebo.
Dr. Heard and his associates looked at daily ALT measurements out to a mean of 4 days, a time period for which most of the studies had data.
They also looked for any evidence of liver injury or dysfunction, hepatotoxicity, or death.
The alanine aminotransferase (ALT) levels changed by a mean of 0.04 IU/L after starting acetaminophen or placebo, "less than a tenth of a point in ALT," reported Dr. Heard.
"Essentially, in this group of patients who consume alcohol, if you give them acetaminophen for 4 days, you don’t see any change in their ALT," according to Dr. Heard.
The study is to be published in the journal Pharmacotherapy.
When acetaminophen consumption continued beyond 4 days, ALT levels increased in most patients who consumed alcohol but also increased in 60% of nondrinkers.
"The changes in the alcoholics look exactly like the changes in the nonalcoholics," he said.
The median increase in ALT was between 10-20 IU/L.
Among patients who drink alcohol, the highest ALT level in the acetaminophen group was 312 IU/L, "which is pretty impressive until you see that in the placebo group, somebody went up 288" IU/L, he said.
The biggest increase in ALT was in a healthy nondrinking patient on acetaminophen, whose ALT increased by 638 IU/L.
Most importantly, none of the 551 people who received acetaminophen in those trials developed an increase in International Normalized Ratio, bilirubin level, or symptomatic liver injury, Dr. Heard and his associates found.
Dr. Heard said that he and his associates are now in the process of finishing a separate study that appears to confirm that these are asymptomatic, self-limiting elevations in ALT that will go away even if people stay on acetaminophen.
Such information is valuable, he said. "It is worth knowing that if you have someone who has an ALT elevation while taking acetaminophen, it may be the cause, and it is reasonable to stop the acetaminophen and see if their ALT elevations go away rather than do an extensive work-up for hepatitis," Dr. Heard said.
Major Finding: ALT levels changed by a median of 0.04 IU/L in alcohol drinkers and nondrinkers after taking acetaminophen for 4 days, with no significant difference between subjects on acetaminophen or placebo.
Data Source: The meta-analysis of five randomized, controlled trials included 901 subjects.
Disclosures: Dr. Heard has been a consultant or received research grants from Cadence Pharmaceuticals, McNeil Consumer Healthcare, and Cumberland Pharmaceuticals.

Pneumonia Prevalence Highest of Health Care-Associated Infections
SAN DIEGO – The overall prevalence of health care–associated infections among inpatients in the United States stands at 4%, with the most common types of infections being a combination of pneumonia and lower respiratory infections.
Those are key preliminary findings from the Centers for Disease Control and Prevention’s first large-scale health care–associated infection (HAI) prevalence survey in more than 30 years, Dr. Shelley S. Magill reported during IDWeek 2012, the combined annual meetings of the Infectious Diseases Society of America, the Society for Healthcare Epidemiology of America, the HIV Medicine Association, and the Pediatric Infectious Diseases Society.
The data "can help us better understand the factors that influence HAI prevalence," said Dr. Magill of the division of health care quality promotion at the Centers for Disease Control and Prevention, Atlanta. "We can also clarify the burden of different HAI types and pathogens across the hospital, which can suggest areas to target for prevention."
The phase 3 survey was conducted in 2011 in 183 hospitals in 10 states: California, Colorado, Connecticut, Georgia, Maryland, Minnesota, New Mexico, New York, Oregon, and Tennessee. Dr. Magill reported results from 11,282 patients who were surveyed in the 183 hospitals. Of these, 452 patients had HAIs, for a prevalence of 4%.
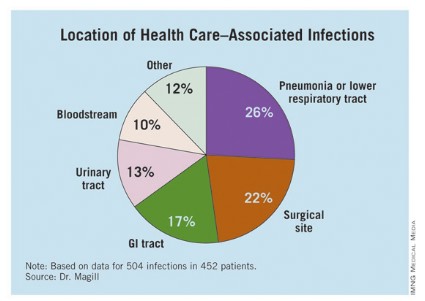
The researchers identified 504 HAIs in the 452 patients. Of these, the highest proportion (26%) were pneumonia or lower respiratory infections. "Of the pneumonia events, 39% were ventilator-associated infections," Dr. Magill said.
Surgical-site infections were the second most common infection type, representing 22% of all HAIs, followed by GI infections (17%), urinary tract infections (13%), and bloodstream infections (10%). "About two-third of UTIs were catheter associated and about 84% of the bloodstream infections were central-line associated," Dr. Magill noted.
Other infections made up the remaining 12% of HAIs.
Dr. Magill also reported that 56% of HAIs were attributed to non-ICU locations in the hospital while 53% were not directly associated with a device or with a procedure.
After multivariable regression analysis, patients with the following factors were at higher risk of having HAIs:
• Older age (risk ratio, 4.60 for patients older than age 77 compared with patients younger than 3 months old).
• Inpatient in a large hospital – defined as having 400 or more beds (RR, 1.24).
• Inpatient in a critical care unit (RR ,1.96 compared with all other units),
• Inpatient for more than 2 weeks at the time of the survey (RR, 26.09 compared with patients in the hospital for 3 days or fewer).
Pathogens were reported for 372 of the 504 HAIs. Clostridium difficile was the most common pathogen, accounting for 12% of all HAIs that were identified. Staphylococcus aureus was the second most common pathogen (11%; about half of these cases were methicillin-resistant S. aureus), followed by Klebsiella pneumoniae and Klebsiella oxytoca (10%).
Dr. Magill acknowledged certain limitations of the survey, including the fact that a small number of patients surveyed in each hospital "make results of limited use to individual facilities," she said. "We also had a relatively small number of hospitals in 10 states participate. This survey method provides a single snapshot of HAIs based on a retrospective review of medical record data, which is sometimes not complete. Finally, we were not able to collect a lot of detailed patient information, such as underlying illnesses and severity of illness."
She and her associates are currently planning a phase 4 survey, anticipated to occur in 2014.
Dr. Magill said she had no relevant financial conflicts to disclose.
SAN DIEGO – The overall prevalence of health care–associated infections among inpatients in the United States stands at 4%, with the most common types of infections being a combination of pneumonia and lower respiratory infections.
Those are key preliminary findings from the Centers for Disease Control and Prevention’s first large-scale health care–associated infection (HAI) prevalence survey in more than 30 years, Dr. Shelley S. Magill reported during IDWeek 2012, the combined annual meetings of the Infectious Diseases Society of America, the Society for Healthcare Epidemiology of America, the HIV Medicine Association, and the Pediatric Infectious Diseases Society.
The data "can help us better understand the factors that influence HAI prevalence," said Dr. Magill of the division of health care quality promotion at the Centers for Disease Control and Prevention, Atlanta. "We can also clarify the burden of different HAI types and pathogens across the hospital, which can suggest areas to target for prevention."
The phase 3 survey was conducted in 2011 in 183 hospitals in 10 states: California, Colorado, Connecticut, Georgia, Maryland, Minnesota, New Mexico, New York, Oregon, and Tennessee. Dr. Magill reported results from 11,282 patients who were surveyed in the 183 hospitals. Of these, 452 patients had HAIs, for a prevalence of 4%.
The researchers identified 504 HAIs in the 452 patients. Of these, the highest proportion (26%) were pneumonia or lower respiratory infections. "Of the pneumonia events, 39% were ventilator-associated infections," Dr. Magill said.
Surgical-site infections were the second most common infection type, representing 22% of all HAIs, followed by GI infections (17%), urinary tract infections (13%), and bloodstream infections (10%). "About two-third of UTIs were catheter associated and about 84% of the bloodstream infections were central-line associated," Dr. Magill noted.
Other infections made up the remaining 12% of HAIs.
Dr. Magill also reported that 56% of HAIs were attributed to non-ICU locations in the hospital while 53% were not directly associated with a device or with a procedure.
After multivariable regression analysis, patients with the following factors were at higher risk of having HAIs:
• Older age (risk ratio, 4.60 for patients older than age 77 compared with patients younger than 3 months old).
• Inpatient in a large hospital – defined as having 400 or more beds (RR, 1.24).
• Inpatient in a critical care unit (RR ,1.96 compared with all other units),
• Inpatient for more than 2 weeks at the time of the survey (RR, 26.09 compared with patients in the hospital for 3 days or fewer).
Pathogens were reported for 372 of the 504 HAIs. Clostridium difficile was the most common pathogen, accounting for 12% of all HAIs that were identified. Staphylococcus aureus was the second most common pathogen (11%; about half of these cases were methicillin-resistant S. aureus), followed by Klebsiella pneumoniae and Klebsiella oxytoca (10%).
Dr. Magill acknowledged certain limitations of the survey, including the fact that a small number of patients surveyed in each hospital "make results of limited use to individual facilities," she said. "We also had a relatively small number of hospitals in 10 states participate. This survey method provides a single snapshot of HAIs based on a retrospective review of medical record data, which is sometimes not complete. Finally, we were not able to collect a lot of detailed patient information, such as underlying illnesses and severity of illness."
She and her associates are currently planning a phase 4 survey, anticipated to occur in 2014.
Dr. Magill said she had no relevant financial conflicts to disclose.
SAN DIEGO – The overall prevalence of health care–associated infections among inpatients in the United States stands at 4%, with the most common types of infections being a combination of pneumonia and lower respiratory infections.
Those are key preliminary findings from the Centers for Disease Control and Prevention’s first large-scale health care–associated infection (HAI) prevalence survey in more than 30 years, Dr. Shelley S. Magill reported during IDWeek 2012, the combined annual meetings of the Infectious Diseases Society of America, the Society for Healthcare Epidemiology of America, the HIV Medicine Association, and the Pediatric Infectious Diseases Society.
The data "can help us better understand the factors that influence HAI prevalence," said Dr. Magill of the division of health care quality promotion at the Centers for Disease Control and Prevention, Atlanta. "We can also clarify the burden of different HAI types and pathogens across the hospital, which can suggest areas to target for prevention."
The phase 3 survey was conducted in 2011 in 183 hospitals in 10 states: California, Colorado, Connecticut, Georgia, Maryland, Minnesota, New Mexico, New York, Oregon, and Tennessee. Dr. Magill reported results from 11,282 patients who were surveyed in the 183 hospitals. Of these, 452 patients had HAIs, for a prevalence of 4%.
The researchers identified 504 HAIs in the 452 patients. Of these, the highest proportion (26%) were pneumonia or lower respiratory infections. "Of the pneumonia events, 39% were ventilator-associated infections," Dr. Magill said.
Surgical-site infections were the second most common infection type, representing 22% of all HAIs, followed by GI infections (17%), urinary tract infections (13%), and bloodstream infections (10%). "About two-third of UTIs were catheter associated and about 84% of the bloodstream infections were central-line associated," Dr. Magill noted.
Other infections made up the remaining 12% of HAIs.
Dr. Magill also reported that 56% of HAIs were attributed to non-ICU locations in the hospital while 53% were not directly associated with a device or with a procedure.
After multivariable regression analysis, patients with the following factors were at higher risk of having HAIs:
• Older age (risk ratio, 4.60 for patients older than age 77 compared with patients younger than 3 months old).
• Inpatient in a large hospital – defined as having 400 or more beds (RR, 1.24).
• Inpatient in a critical care unit (RR ,1.96 compared with all other units),
• Inpatient for more than 2 weeks at the time of the survey (RR, 26.09 compared with patients in the hospital for 3 days or fewer).
Pathogens were reported for 372 of the 504 HAIs. Clostridium difficile was the most common pathogen, accounting for 12% of all HAIs that were identified. Staphylococcus aureus was the second most common pathogen (11%; about half of these cases were methicillin-resistant S. aureus), followed by Klebsiella pneumoniae and Klebsiella oxytoca (10%).
Dr. Magill acknowledged certain limitations of the survey, including the fact that a small number of patients surveyed in each hospital "make results of limited use to individual facilities," she said. "We also had a relatively small number of hospitals in 10 states participate. This survey method provides a single snapshot of HAIs based on a retrospective review of medical record data, which is sometimes not complete. Finally, we were not able to collect a lot of detailed patient information, such as underlying illnesses and severity of illness."
She and her associates are currently planning a phase 4 survey, anticipated to occur in 2014.
Dr. Magill said she had no relevant financial conflicts to disclose.
AT IDWEEK 2012
Major Finding: The overall prevalence of health care–associated infections among hospitalized patients nationwide was 4%.
Data Source: Preliminary results were obtained from a 2011 survey of 11,282 inpatients at 183 hospitals located in 10 states.
Disclosures: The study was conducted by the Centers for Disease Control and Prevention. Dr. Magill said she had no relevant financial conflicts to disclose.
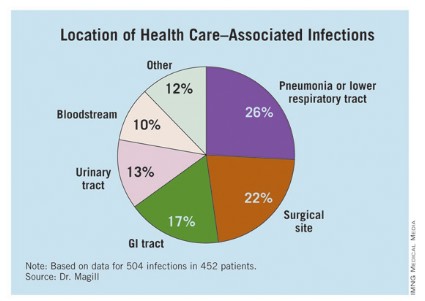
Quality Initiative Generates Widespread Improvements for Hospitals
Aligning Forces for Quality, an 18-month virtual quality collaborative launched in 16 targeted communities, generated measurable improvements for 90% of the 100 participating hospitals. The project, sponsored by the Robert Wood Johnson Foundation (www.forces4quality.org), is focused on reducing avoidable hospital readmissions; improving ED timeliness, efficiency, and patient flow; and eliminating patient-language barriers via standardized collection of data on race, ethnicity, and language preferences.
The collaborative showed 60% of participating hospitals improved 30-day readmission rates for heart failure patients, and 75% improved adherence to heart failure care standards.
“Hospitals are willing to really take stock of what they are doing well and where they could improve,” Susan Mende, BSN, MPH, of the foundation’s senior program office noted in a prepared statement.
Hospitalist William C. Cook, DO, chief of hospital medicine for the Ohio Permanente Medical Group, served as co-chair of the steering committee for transitional care for Better Care Greater Cleveland, one of the 16 community coalitions, and led two other work groups targeting care transitions. “I also had the opportunity to meet and work with Eric Coleman, MD,” of the University of Colorado Denver and creator of the widely implemented Care Transitions Program that coaches patients discharged from the hospital.
The foundation’s program promoted a vision for addressing readmissions across Dr. Cook’s region. “From the hospitalist perspective, our role is to try to make transitions as safe and predictable as possible,” Dr. Cook says.
Aligning Forces for Quality, an 18-month virtual quality collaborative launched in 16 targeted communities, generated measurable improvements for 90% of the 100 participating hospitals. The project, sponsored by the Robert Wood Johnson Foundation (www.forces4quality.org), is focused on reducing avoidable hospital readmissions; improving ED timeliness, efficiency, and patient flow; and eliminating patient-language barriers via standardized collection of data on race, ethnicity, and language preferences.
The collaborative showed 60% of participating hospitals improved 30-day readmission rates for heart failure patients, and 75% improved adherence to heart failure care standards.
“Hospitals are willing to really take stock of what they are doing well and where they could improve,” Susan Mende, BSN, MPH, of the foundation’s senior program office noted in a prepared statement.
Hospitalist William C. Cook, DO, chief of hospital medicine for the Ohio Permanente Medical Group, served as co-chair of the steering committee for transitional care for Better Care Greater Cleveland, one of the 16 community coalitions, and led two other work groups targeting care transitions. “I also had the opportunity to meet and work with Eric Coleman, MD,” of the University of Colorado Denver and creator of the widely implemented Care Transitions Program that coaches patients discharged from the hospital.
The foundation’s program promoted a vision for addressing readmissions across Dr. Cook’s region. “From the hospitalist perspective, our role is to try to make transitions as safe and predictable as possible,” Dr. Cook says.
Aligning Forces for Quality, an 18-month virtual quality collaborative launched in 16 targeted communities, generated measurable improvements for 90% of the 100 participating hospitals. The project, sponsored by the Robert Wood Johnson Foundation (www.forces4quality.org), is focused on reducing avoidable hospital readmissions; improving ED timeliness, efficiency, and patient flow; and eliminating patient-language barriers via standardized collection of data on race, ethnicity, and language preferences.
The collaborative showed 60% of participating hospitals improved 30-day readmission rates for heart failure patients, and 75% improved adherence to heart failure care standards.
“Hospitals are willing to really take stock of what they are doing well and where they could improve,” Susan Mende, BSN, MPH, of the foundation’s senior program office noted in a prepared statement.
Hospitalist William C. Cook, DO, chief of hospital medicine for the Ohio Permanente Medical Group, served as co-chair of the steering committee for transitional care for Better Care Greater Cleveland, one of the 16 community coalitions, and led two other work groups targeting care transitions. “I also had the opportunity to meet and work with Eric Coleman, MD,” of the University of Colorado Denver and creator of the widely implemented Care Transitions Program that coaches patients discharged from the hospital.
The foundation’s program promoted a vision for addressing readmissions across Dr. Cook’s region. “From the hospitalist perspective, our role is to try to make transitions as safe and predictable as possible,” Dr. Cook says.
Palliative Care Teams in 65% of Hospitals
Portion of hospitals that had palliative-care teams in 2010, according to the latest tally from the Center to Advance Palliative Care at Mount Sinai School of Medicine in New York City (www.capc.org), an increase of 148.5% from 2000. Hospitals of 300-plus beds are more likely to have a palliative-care team than those with fewer than 300 beds (87.9% vs. 56.5%).
Portion of hospitals that had palliative-care teams in 2010, according to the latest tally from the Center to Advance Palliative Care at Mount Sinai School of Medicine in New York City (www.capc.org), an increase of 148.5% from 2000. Hospitals of 300-plus beds are more likely to have a palliative-care team than those with fewer than 300 beds (87.9% vs. 56.5%).
Portion of hospitals that had palliative-care teams in 2010, according to the latest tally from the Center to Advance Palliative Care at Mount Sinai School of Medicine in New York City (www.capc.org), an increase of 148.5% from 2000. Hospitals of 300-plus beds are more likely to have a palliative-care team than those with fewer than 300 beds (87.9% vs. 56.5%).
Professional Medical Coders Increase Hospitalist Group Reimbursement
What is the hospitalist’s optimal role in professional services billing? According to Leonard Noronha, MD, who was until recently a hospitalist practicing at the University of New Mexico (UNM), “physicians often find E/M (evaluation and management) coding rules confusing and frustrating,” leading to delinquent or tardy bills. Yet some feel apprehensive about turning billing and coding decisions over to professional coders because the physician retains legal responsibility for the accuracy of coding.
In a poster presented at HM12 in San Diego, Dr. Noronha described a 2010 decision by the academic group at UNM to have coders assign service levels to physician visits, retrieving the data from typed progress notes in the medical center’s newly implemented electronic health record (EHR). There were concerns that this new approach might lead to decreased revenue, but in practice, it led to both increased charges and collections (18%) and faster bill submissions (to 14 days from 16 days). The UNM hospitalists are incentivized to submit daily patient lists and to respond promptly to documentation completion requests.
“Working in a community hospital setting for five years and then in an academic practice for four years exposed me to a variety of approaches,” Dr. Noronha says. “My opinion is that coders have degrees and professional certifications and, thus, are capable of taking on this responsibility.”
Physicians still need to review submissions within specified time frames, and the system is yet to incorporate regular audits to ensure the quality of the coding.
What is the hospitalist’s optimal role in professional services billing? According to Leonard Noronha, MD, who was until recently a hospitalist practicing at the University of New Mexico (UNM), “physicians often find E/M (evaluation and management) coding rules confusing and frustrating,” leading to delinquent or tardy bills. Yet some feel apprehensive about turning billing and coding decisions over to professional coders because the physician retains legal responsibility for the accuracy of coding.
In a poster presented at HM12 in San Diego, Dr. Noronha described a 2010 decision by the academic group at UNM to have coders assign service levels to physician visits, retrieving the data from typed progress notes in the medical center’s newly implemented electronic health record (EHR). There were concerns that this new approach might lead to decreased revenue, but in practice, it led to both increased charges and collections (18%) and faster bill submissions (to 14 days from 16 days). The UNM hospitalists are incentivized to submit daily patient lists and to respond promptly to documentation completion requests.
“Working in a community hospital setting for five years and then in an academic practice for four years exposed me to a variety of approaches,” Dr. Noronha says. “My opinion is that coders have degrees and professional certifications and, thus, are capable of taking on this responsibility.”
Physicians still need to review submissions within specified time frames, and the system is yet to incorporate regular audits to ensure the quality of the coding.
What is the hospitalist’s optimal role in professional services billing? According to Leonard Noronha, MD, who was until recently a hospitalist practicing at the University of New Mexico (UNM), “physicians often find E/M (evaluation and management) coding rules confusing and frustrating,” leading to delinquent or tardy bills. Yet some feel apprehensive about turning billing and coding decisions over to professional coders because the physician retains legal responsibility for the accuracy of coding.
In a poster presented at HM12 in San Diego, Dr. Noronha described a 2010 decision by the academic group at UNM to have coders assign service levels to physician visits, retrieving the data from typed progress notes in the medical center’s newly implemented electronic health record (EHR). There were concerns that this new approach might lead to decreased revenue, but in practice, it led to both increased charges and collections (18%) and faster bill submissions (to 14 days from 16 days). The UNM hospitalists are incentivized to submit daily patient lists and to respond promptly to documentation completion requests.
“Working in a community hospital setting for five years and then in an academic practice for four years exposed me to a variety of approaches,” Dr. Noronha says. “My opinion is that coders have degrees and professional certifications and, thus, are capable of taking on this responsibility.”
Physicians still need to review submissions within specified time frames, and the system is yet to incorporate regular audits to ensure the quality of the coding.