User login
Following the Hyperkalemia Trail: A Case Report of ECG Changes and Treatment Responses
Following the Hyperkalemia Trail: A Case Report of ECG Changes and Treatment Responses
Hyperkalemia involves elevated serum potassium levels (> 5.0 mEq/L) and represents an important electrolyte disturbance due to its potentially severe consequences, including cardiac effects that can lead to dysrhythmia and even asystole and death.1,2 In a US Medicare population, the prevalence of hyperkalemia has been estimated at 2.7% and is associated with substantial health care costs.3 The prevalence is even more marked in patients with preexisting conditions such as chronic kidney disease (CKD) and heart failure.4,5
Hyperkalemia can result from multiple factors, including impaired renal function, adrenal disease, adverse drug reactions of angiotensin-converting enzyme inhibitors (ACEIs) and other medications, and heritable mutations.6 Hyperkalemia poses a considerable clinical risk, associated with adverse outcomes such as myocardial infarction and increased mortality in patients with CKD.5,7,8 Electrocardiographic (ECG) changes associated with hyperkalemia play a vital role in guiding clinical decisions and treatment strategies.9 Understanding the pathophysiology, risk factors, and consequences of hyperkalemia, as well as the significance of ECG changes in its management, is essential for health care practitioners.
Case Presentation
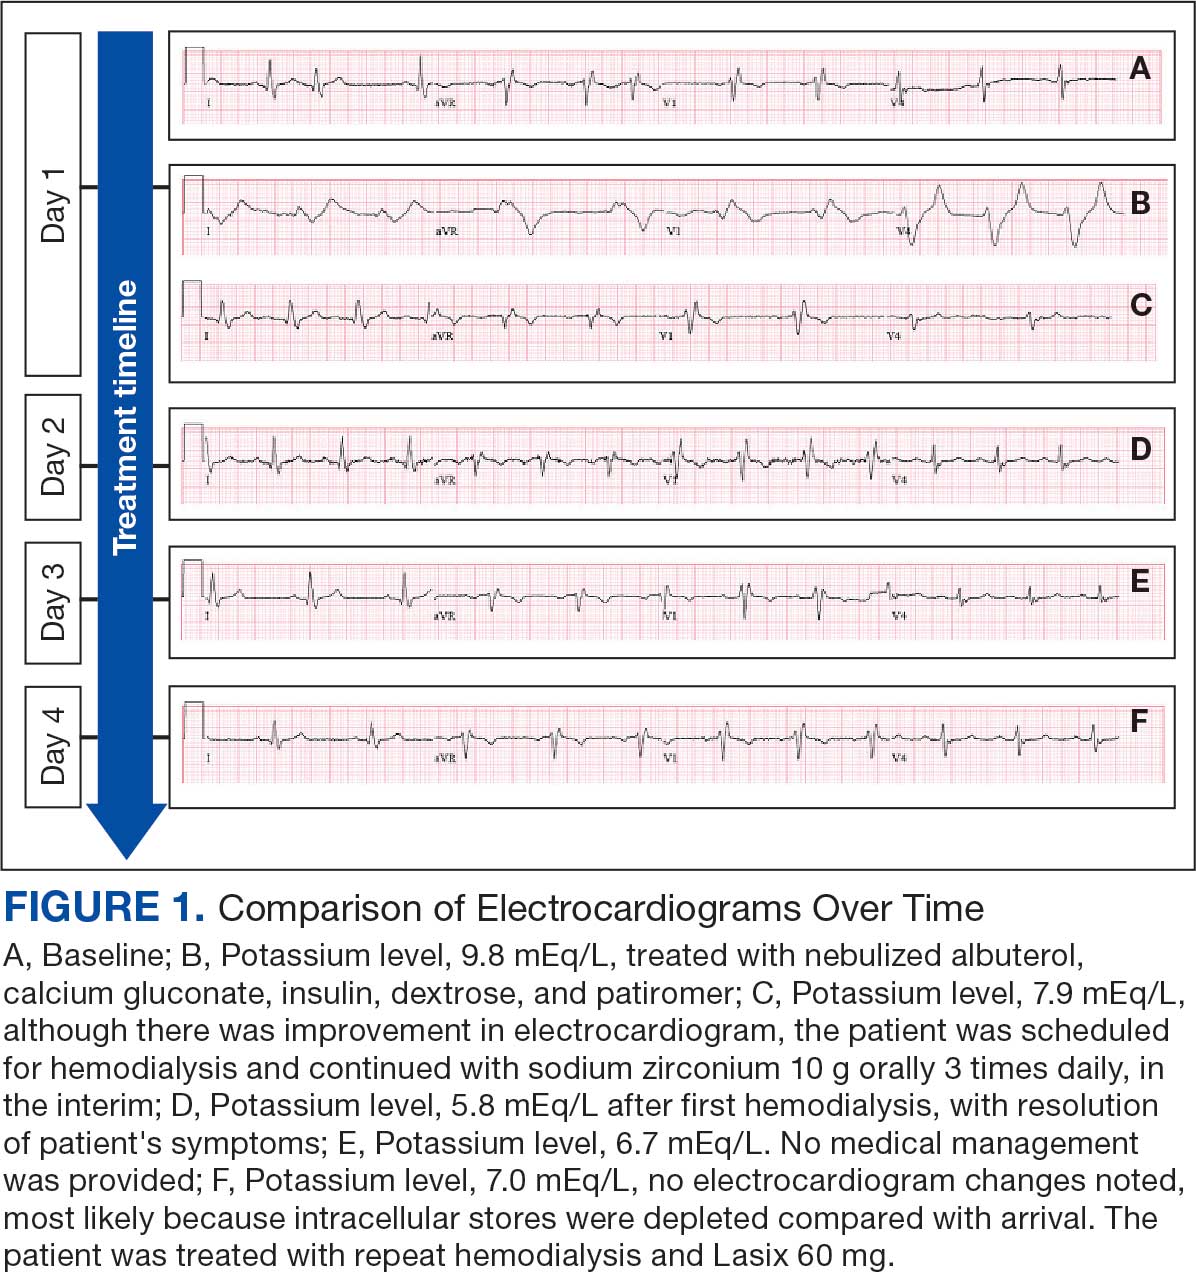
An 81-year-old Hispanic man with a history of hypertension, hypothyroidism, gout, and CKD stage 3B presented to the emergency department with progressive weakness resulting in falls and culminating in an inability to ambulate independently. Additional symptoms included nausea, diarrhea, and myalgia. His vital signs were notable for a pulse of 41 beats/min. The physical examination was remarkable for significant weakness of the bilateral upper extremities, inability to bear his own weight, and bilateral lower extremity edema. His initial ECG upon arrival showed bradycardia with wide QRS, absent P waves, and peaked T waves (Figure 1a). These findings differed from his baseline ECG taken 1 year earlier, which showed sinus rhythm with premature atrial complexes and an old right bundle branch block (Figure 1b).
Medication review revealed that the patient was currently prescribed 100 mg allopurinol daily, 2.5 mg amlodipine daily, 10 mg atorvastatin at bedtime, 4 mg doxazosin daily, 112 mcg levothyroxine daily, 100 mg losartan daily, 25 mg metoprolol daily, and 0.4 mg tamsulosin daily. The patient had also been taking over-the-counter indomethacin for knee pain.
Based on the ECG results, he was treated with 0.083%/6 mL nebulized albuterol, 4.65 Mq/250 mL saline solution intravenous (IV) calcium gluconate, 10 units IV insulin with concomitant 50%/25 mL IV dextrose and 8.4 g of oral patiromer suspension. IV furosemide was held due to concern for renal function. The decision to proceed with hemodialysis was made. Repeat laboratory tests were performed, and an ECG obtained after treatment initiation but prior to hemodialysis demonstrated improvement of rate and T wave shortening (Figure 1c). The serum potassium level dropped from 9.8 mEq/L to 7.9 mEq/L (reference range, 3.5-5.0 mEq/L) (Table 1).
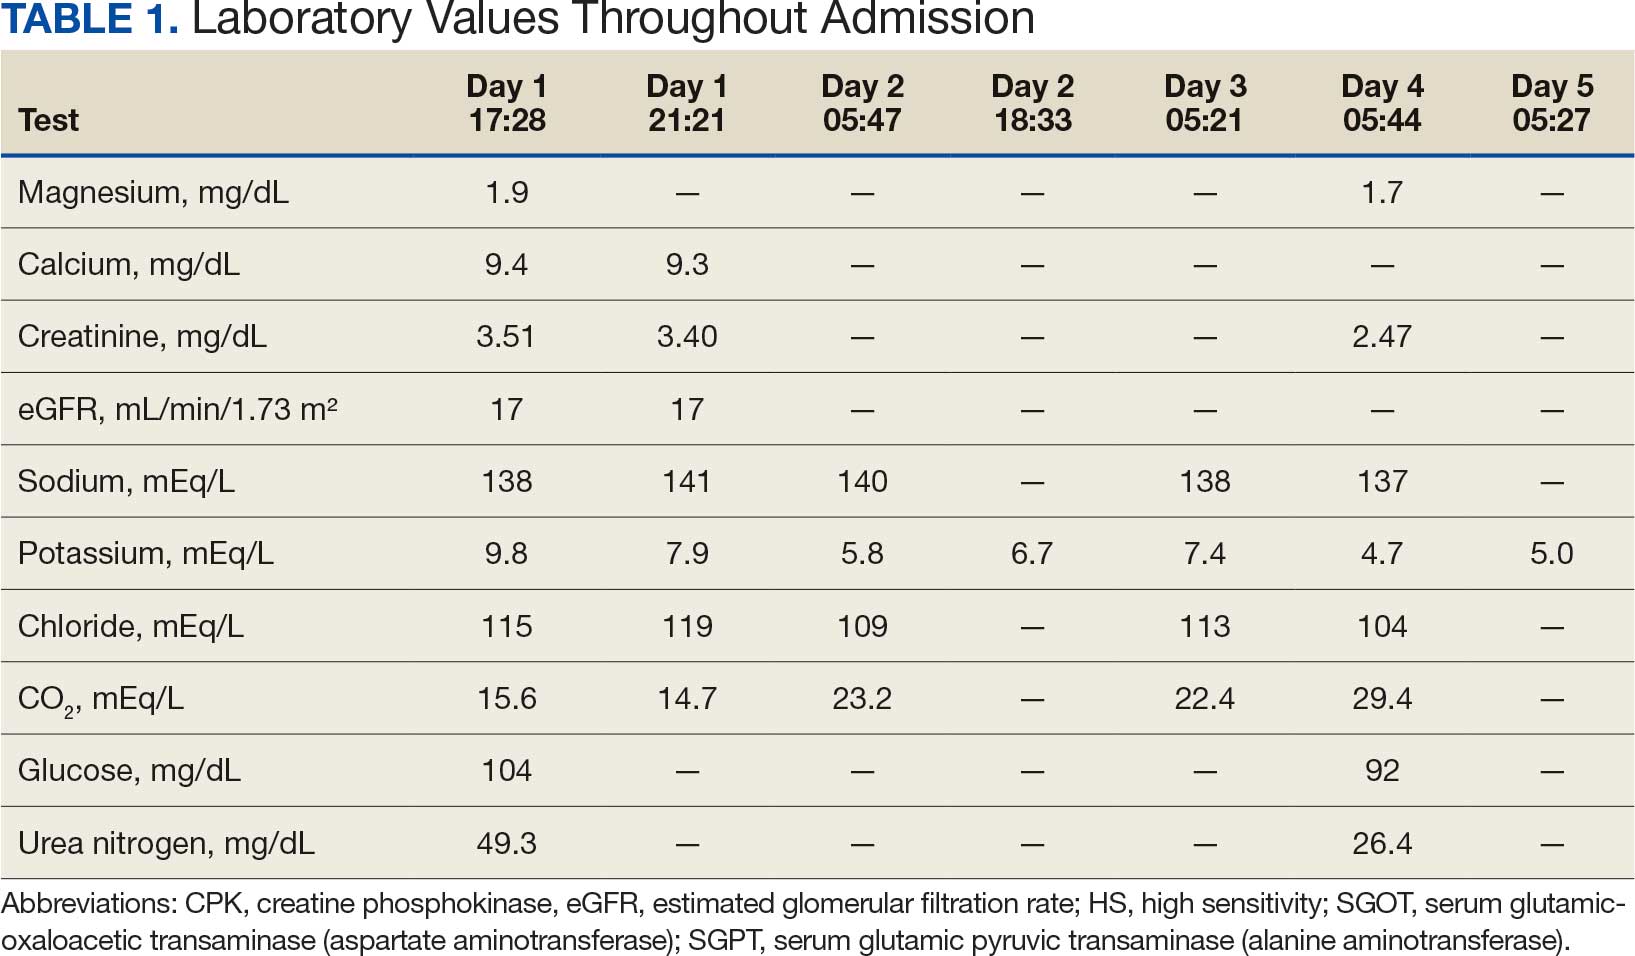
In addition to hemodialysis, sodium zirconium 10 g orally 3 times daily was added. Laboratory test results and an ECG was performed after dialysis continued to demonstrate improvement (Figure 1d). The patient’s potassium level decreased to 5.8 mEq/L, with the ECG demonstrating stability of heart rate and further improvement of the PR interval, QRS complex, and T waves.
Despite the established treatment regimen, potassium levels again rose to 6.7 mEq/L, but there were no significant changes in the ECG, and thus no medication changes were made (Figure 1e). Subsequent monitoring demonstrated a further increase in potassium to 7.4 mEq/L, with an ECG demonstrating a return to the baseline of 1 year prior. The patient underwent hemodialysis again and was given oral furosemide 60 mg every 12 hours. The potassium concentration after dialysis decreased to 4.7 mEq/L and remained stable, not going above 5.0 mEq/L on subsequent monitoring. The patient had resolution of all symptoms and was discharged.
Discussion
We have described in detail the presentation of each pathology and mechanisms of each treatment, starting with the patient’s initial condition that brought him to the emergency room—muscle weakness. Skeletal muscle weakness is a common manifestation of hyperkalemia, occurring in 20% to 40% of cases, and is more prevalent in severe elevations of potassium. Rarely, the weakness can progress to flaccid paralysis of the patient’s extremities and, in extreme cases, the diaphragm.
Muscle weakness progression occurs in a manner that resembles Guillain-Barré syndrome, starting in the lower extremities and ascending toward the upper extremities.10 This is known as secondary hyperkalemic periodic paralysis. Hyperkalemia lowers the transmembrane gradient in neurons, leading to neuronal depolarization independent of the degree of hyperkalemia. If the degree of hyperkalemia is large enough, this depolarization inactivates voltage-gated sodium channels, making neurons refractory to excitation. Electromyographical studies have shown reduction in the compounded muscle action potential.11 The transient nature of this paralysis is reflected by rapid correction of weakness and paralysis when the electrolyte disorder is corrected.
The patient in this case also presented with bradycardia. The ECG manifestations of hyperkalemia can include atrial asystole, intraventricular conduction disturbances, peaked T waves, and widened QRS complexes. However, some patients with renal insufficiency may not exhibit ECG changes despite significantly elevated serum potassium levels.12
The severity of hyperkalemia is crucial in determining the associated ECG changes, with levels > 6.0 mEq/L presenting with abnormalities.13 ECG findings alone may not always accurately reflect the severity of hyperkalemia, as up to 60% of patients with potassium levels > 6.0 mEq/L may not show ECG changes.14 Additionally, extreme hyperkalemia can lead to inconsistent ECG findings, making it challenging to rely solely on ECG for diagnosis and monitoring.8 The level of potassium that causes these effects varies widely through patient populations.
The main mechanism by which hyperkalemia affects the heart’s conduction system is through voltage differences across the conduction fibers and eventual steady-state inactivation of sodium channels. This combination of mechanisms shortens the action potential duration, allowing more cardiomyocytes to undergo synchronized depolarization. This amalgamation of cardiomyocytes repolarizing can be reflected on ECGs as peaked T waves. As the action potential decreases, there is a period during which cardiomyocytes are prone to tachyarrhythmias and ventricular fibrillation.
A reduced action potential may lead to increased rates of depolarization and thus conduction, which in some scenarios may increase heart rate. As the levels of potassium rise, intracellular accumulation impedes the entry of sodium by decreasing the cation gradient across the cell membrane. This effectively slows the sinus nodes and prolongs the QRS by slowing the overall propagation of action potentials. By this mechanism, conduction delays, blocks, or asystole are manifested. The patient in this case showed conduction delays, peaked T waves, and disappearance of P waves when he first arrived.
Hyperkalemia Treatment
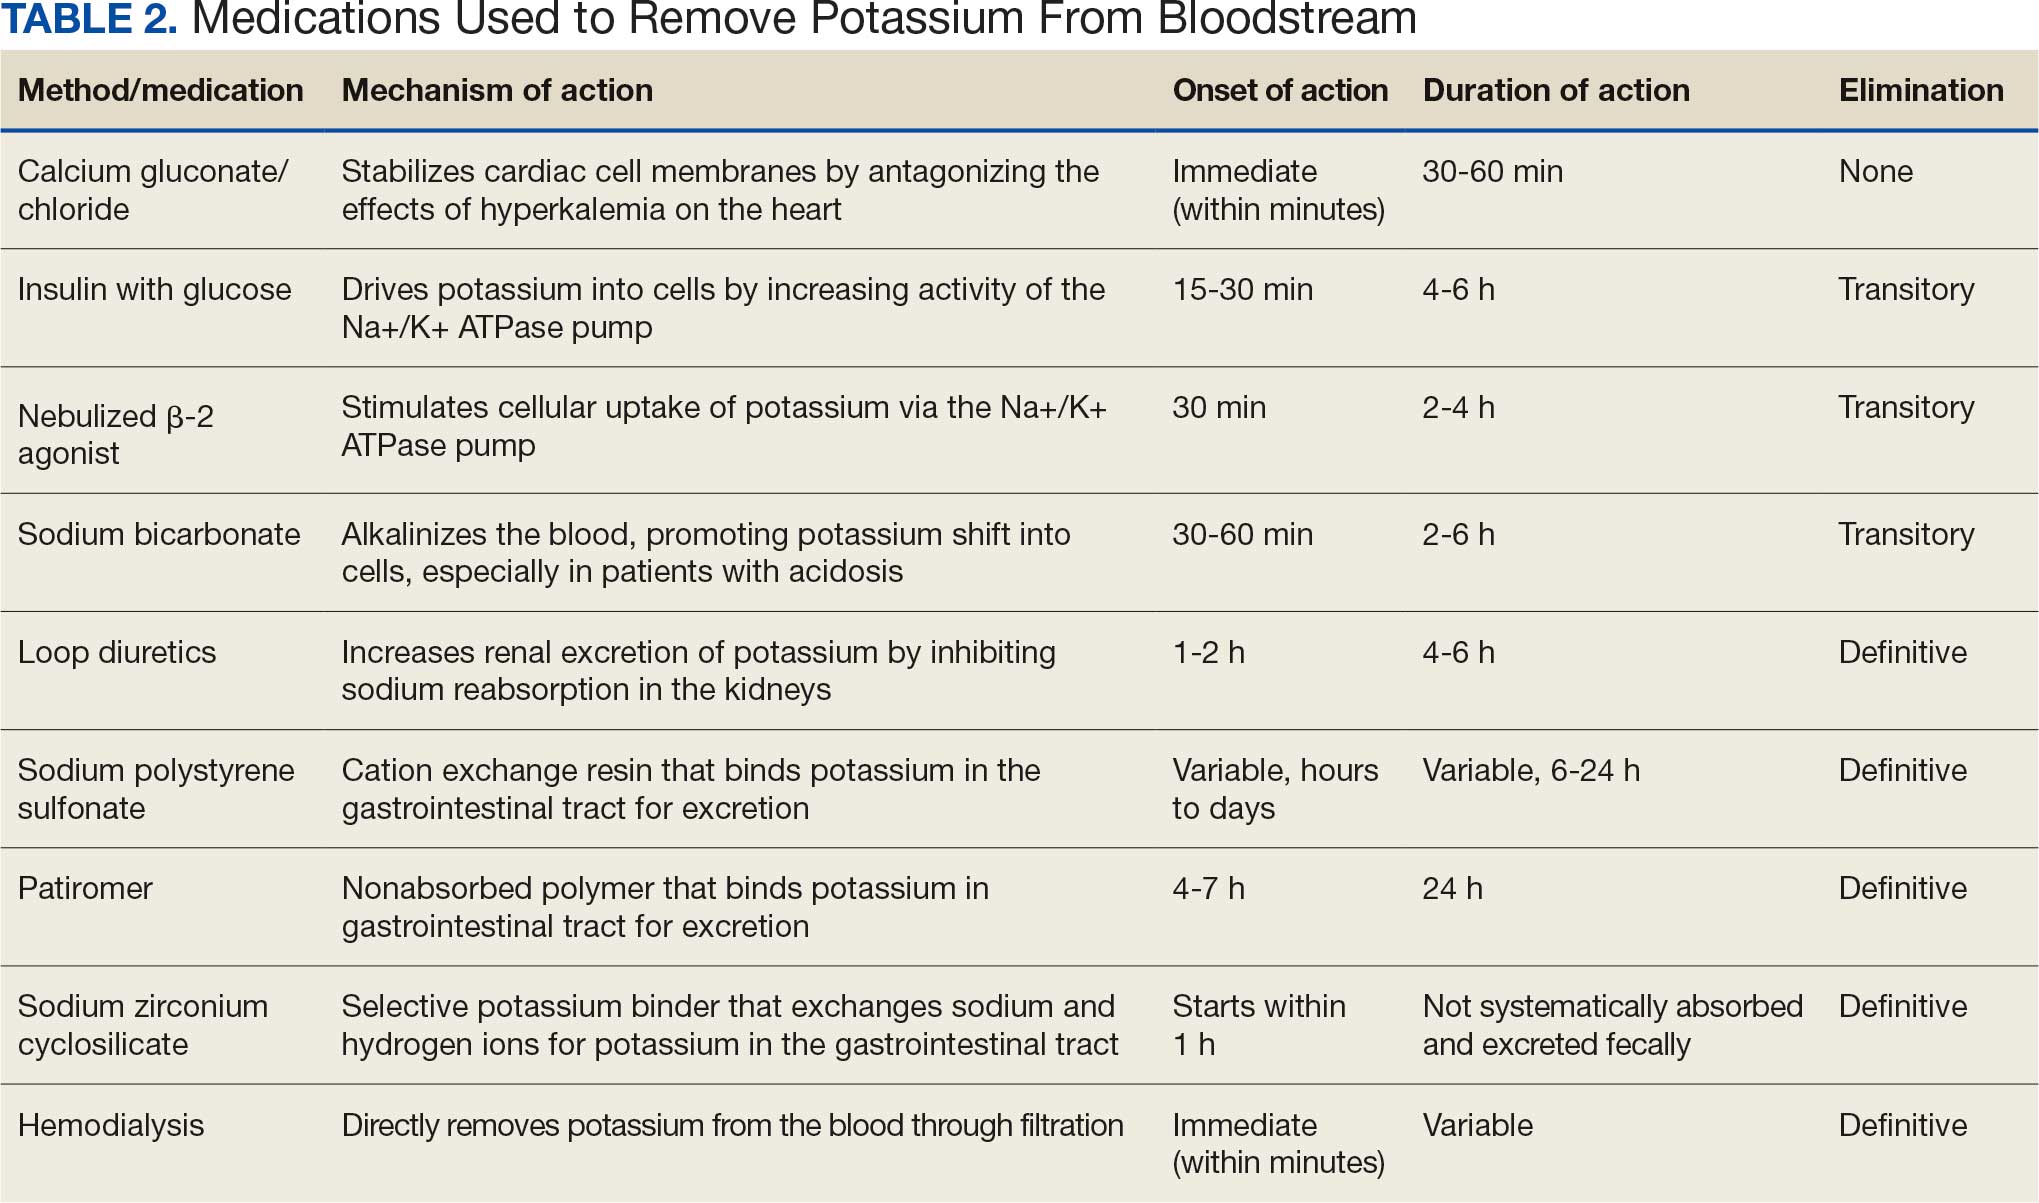
Hyperkalemia develops most commonly due to acute or chronic kidney diseases, as was the case with this patient. The patient’s hyperkalemia was also augmented by the use of nonsteroidal anti-inflammatory drugs (NSAIDs), which can directly affect renal function. A properly functioning kidney is responsible for excretion of up to 90% of ingested potassium, while the remainder is excreted through the gastrointestinal (GI) tract. Definitive treatment of hyperkalemia is mitigated primarily through these 2 organ systems. The treatment also includes transitory mechanisms of potassium reduction. The goal of each method is to preserve the action potential of cardiomyocytes and myocytes. This patient presented with acute symptomatic hyperkalemia and received various medications to acutely, transitorily, and definitively treat it.
Initial therapy included calcium gluconate, which functions to stabilize the myocardial cell membrane. Hyperkalemia decreases the resting membrane action potential of excitable cells and predisposes them to early depolarization and thus dysrhythmias. Calcium decreases the threshold potential across cells and offsets the overall gradient back to near normal levels.15 Calcium can be delivered through calcium gluconate or calcium chloride. Calcium chloride is not preferred because extravasation can cause pain, blistering and tissue ischemia. Central venous access is required, potentially delaying prompt treatment. Calcium acts rapidly after administration—within 1 to 3 minutes—but only lasts 30 to 60 minutes.16 Administration of calcium gluconate can be repeated as often as necessary, but patients must be monitored for adverse effects of calcium such as nausea, abdominal pain, polydipsia, polyuria, muscle weakness, and paresthesia. Care must be taken when patients are taking digoxin, because calcium may potentiate toxicity.17 Although calcium provides immediate benefits it does little to correct the underlying cause; other medications are required to remove potassium from the body.
Two medication classes have been proven to shift potassium intracellularly. The first are β-2 agonists, such as albuterol/levalbuterol, and the second is insulin. Both work through sodium-potassium-ATPase in a direct manner. β-2 agonists stimulate sodium-potassium-ATPase to move more potassium intracellularly, but these effects have been seen only with high doses of albuterol, typically 4× the standard dose of 0.5 mg in nebulized solutions to achieve decreases in potassium of 0.3 to 0.6 mEq/L, although some trials have reported decreases of 0.62 to 0.98 mEq/L.15,18 These potassium-lowering effects of β-2 agonist are modest, but can be seen 20 to 30 minutes after administration and persist up to 1 to 2 hours. β-2 agonists are also readily affected by β blockers, which may reduce or negate the desired effect in hyperkalemia. For these reasons, a β-2 agonist should not be given as monotherapy and should be provided as an adjuvant to more independent therapies such as insulin. Insulin binds to receptors on muscle cells and increases the quantity of sodium-potassium-ATPase and glucose transporters. With this increase in influx pumps, surrounding tissues with higher resting membrane potentials can absorb the potassium load, thereby protecting cardiomyocytes.
Potassium Removal
Three methods are currently available to remove potassium from the body: GI excretion, renal excretion, and direct removal from the bloodstream. Under normal physiologic conditions, the kidneys account for about 90% of the body’s ability to remove potassium. Loop diuretics facilitate the removal of potassium by increasing urine production and have an additional potassium-wasting effect. Although the onset of action of loop diuretics is typically 30 to 60 minutes after oral administration, their effect can last for several hours. In this patient, furosemide was introduced later in the treatment plan to manage recurring hyperkalemia by enhancing renal potassium excretion.
Potassium binders such as patiromer act in the GI tract, effectively reducing serum potassium levels although with a slower onset of action than furosemide, generally taking hours to days to exert its effect. Both medications illustrate a tailored approach to managing potassium levels, adapted to the evolving needs and renal function of the patient. The last method is using hemodialysis—by far the most rapid method to remove potassium, but also the most invasive. The different methods of treating hyperkalemia are summarized in Table 2. This patient required multiple days of hemodialysis to completely correct the electrolyte disorder. Upon discharge, the patient continued oral furosemide 40 mg daily and eventually discontinued hemodialysis due to stable renal function.
Often, after correcting an inciting event, potassium stores in the body eventually stabilize and do not require additional follow-up. Patients prone to hyperkalemia should be thoroughly educated on medications to avoid (NSAIDs, ACEIs/ARBs, trimethoprim), an adequate low potassium diet, and symptoms that may warrant medical attention.19
Conclusions
This case illustrates the importance of recognizing the spectrum of manifestations of hyperkalemia, which ranged from muscle weakness to cardiac dysrhythmias. Management strategies for the patient included stabilization of cardiac membranes, potassium shifting, and potassium removal, each tailored to the patient’s individual clinical findings.
The case further illustrates the critical role of continuous monitoring and dynamic adjustment of therapeutic strategies in response to evolving clinical and laboratory findings. The initial and subsequent ECGs, alongside laboratory tests, were instrumental in guiding the adjustments needed in the treatment regimen, ensuring both the efficacy and safety of the interventions. This proactive approach can mitigate the risk of recurrent hyperkalemia and its complications.
- Youn JH, McDonough AA. Recent advances in understanding integrative control of potassium homeostasis. Annu Rev Physiol. 2009;71:381-401. doi:10.1146/annurev.physiol.010908.163241 2.
- Simon LV, Hashmi MF, Farrell MW. Hyperkalemia. In: StatPearls. StatPearls Publishing; September 4, 2023. Accessed October 22, 2025.
- Mu F, Betts KA, Woolley JM, et al. Prevalence and economic burden of hyperkalemia in the United States Medicare population. Curr Med Res Opin. 2020;36:1333-1341. doi:10.1080/03007995.2020.1775072
- Loutradis C, Tolika P, Skodra A, et al. Prevalence of hyperkalemia in diabetic and non-diabetic patients with chronic kidney disease: a nested case-control study. Am J Nephrol. 2015;42:351-360. doi:10.1159/000442393
- Grodzinsky A, Goyal A, Gosch K, et al. Prevalence and prognosis of hyperkalemia in patients with acute myocardial infarction. Am J Med. 2016;129:858-865. doi:10.1016/j.amjmed.2016.03.008
- Hunter RW, Bailey MA. Hyperkalemia: pathophysiology, risk factors and consequences. Nephrol Dial Transplant. 2019;34(suppl 3):iii2-iii11. doi:10.1093/ndt/gfz206
- Luo J, Brunelli SM, Jensen DE, Yang A. Association between serum potassium and outcomes in patients with reduced kidney function. Clin J Am Soc Nephrol. 2016;11:90-100. doi:10.2215/CJN.01730215
- Montford JR, Linas S. How dangerous is hyperkalemia? J Am Soc Nephrol. 2017;28:3155-3165. doi:10.1681/ASN.2016121344
- Mattu A, Brady WJ, Robinson DA. Electrocardiographic manifestations of hyperkalemia. Am J Emerg Med. 2000;18:721-729. doi:10.1053/ajem.2000.7344
- Kimmons LA, Usery JB. Acute ascending muscle weakness secondary to medication-induced hyperkalemia. Case Rep Med. 2014;2014:789529. doi:10.1155/2014/789529
- Naik KR, Saroja AO, Khanpet MS. Reversible electrophysiological abnormalities in acute secondary hyperkalemic paralysis. Ann Indian Acad Neurol. 2012;15:339-343. doi:10.4103/0972-2327.104354
- Montague BT, Ouellette JR, Buller GK. Retrospective review of the frequency of ECG changes in hyperkalemia. Clin J Am Soc Nephrol. 2008;3:324-330. doi:10.2215/CJN.04611007
- Larivée NL, Michaud JB, More KM, Wilson JA, Tennankore KK. Hyperkalemia: prevalence, predictors and emerging treatments. Cardiol Ther. 2023;12:35-63. doi:10.1007/s40119-022-00289-z
- Shingarev R, Allon M. A physiologic-based approach to the treatment of acute hyperkalemia. Am J Kidney Dis. 2010;56:578-584. doi:10.1053/j.ajkd.2010.03.014
- Parham WA, Mehdirad AA, Biermann KM, Fredman CS. Hyperkalemia revisited. Tex Heart Inst J. 2006;33:40-47.
- Ng KE, Lee CS. Updated treatment options in the management of hyperkalemia. U.S. Pharmacist. February 16, 2017. Accessed October 1, 2025. www.uspharmacist.com/article/updated-treatment-options-in-the-management-of-hyperkalemia
- Quick G, Bastani B. Prolonged asystolic hyperkalemic cardiac arrest with no neurologic sequelae. Ann Emerg Med. 1994;24:305-311. doi:10.1016/s0196-0644(94)70144-x 18.
- Allon M, Dunlay R, Copkney C. Nebulized albuterol for acute hyperkalemia in patients on hemodialysis. Ann Intern Med. 1989;110:426-429. doi:10.7326/0003-4819-110-6-42619.
- Kidney Disease: Improving Global Outcomes (KDIGO) CKD Work Group. KDIGO 2024 Clinical Practice Guideline for the Evaluation and Management of Chronic Kidney Disease. Kidney Int. 2024;105(4 suppl):S117-S314. doi:10.1016/j.kint.2023.10.018
Hyperkalemia involves elevated serum potassium levels (> 5.0 mEq/L) and represents an important electrolyte disturbance due to its potentially severe consequences, including cardiac effects that can lead to dysrhythmia and even asystole and death.1,2 In a US Medicare population, the prevalence of hyperkalemia has been estimated at 2.7% and is associated with substantial health care costs.3 The prevalence is even more marked in patients with preexisting conditions such as chronic kidney disease (CKD) and heart failure.4,5
Hyperkalemia can result from multiple factors, including impaired renal function, adrenal disease, adverse drug reactions of angiotensin-converting enzyme inhibitors (ACEIs) and other medications, and heritable mutations.6 Hyperkalemia poses a considerable clinical risk, associated with adverse outcomes such as myocardial infarction and increased mortality in patients with CKD.5,7,8 Electrocardiographic (ECG) changes associated with hyperkalemia play a vital role in guiding clinical decisions and treatment strategies.9 Understanding the pathophysiology, risk factors, and consequences of hyperkalemia, as well as the significance of ECG changes in its management, is essential for health care practitioners.
Case Presentation
An 81-year-old Hispanic man with a history of hypertension, hypothyroidism, gout, and CKD stage 3B presented to the emergency department with progressive weakness resulting in falls and culminating in an inability to ambulate independently. Additional symptoms included nausea, diarrhea, and myalgia. His vital signs were notable for a pulse of 41 beats/min. The physical examination was remarkable for significant weakness of the bilateral upper extremities, inability to bear his own weight, and bilateral lower extremity edema. His initial ECG upon arrival showed bradycardia with wide QRS, absent P waves, and peaked T waves (Figure 1a). These findings differed from his baseline ECG taken 1 year earlier, which showed sinus rhythm with premature atrial complexes and an old right bundle branch block (Figure 1b).
Medication review revealed that the patient was currently prescribed 100 mg allopurinol daily, 2.5 mg amlodipine daily, 10 mg atorvastatin at bedtime, 4 mg doxazosin daily, 112 mcg levothyroxine daily, 100 mg losartan daily, 25 mg metoprolol daily, and 0.4 mg tamsulosin daily. The patient had also been taking over-the-counter indomethacin for knee pain.
Based on the ECG results, he was treated with 0.083%/6 mL nebulized albuterol, 4.65 Mq/250 mL saline solution intravenous (IV) calcium gluconate, 10 units IV insulin with concomitant 50%/25 mL IV dextrose and 8.4 g of oral patiromer suspension. IV furosemide was held due to concern for renal function. The decision to proceed with hemodialysis was made. Repeat laboratory tests were performed, and an ECG obtained after treatment initiation but prior to hemodialysis demonstrated improvement of rate and T wave shortening (Figure 1c). The serum potassium level dropped from 9.8 mEq/L to 7.9 mEq/L (reference range, 3.5-5.0 mEq/L) (Table 1).
In addition to hemodialysis, sodium zirconium 10 g orally 3 times daily was added. Laboratory test results and an ECG was performed after dialysis continued to demonstrate improvement (Figure 1d). The patient’s potassium level decreased to 5.8 mEq/L, with the ECG demonstrating stability of heart rate and further improvement of the PR interval, QRS complex, and T waves.
Despite the established treatment regimen, potassium levels again rose to 6.7 mEq/L, but there were no significant changes in the ECG, and thus no medication changes were made (Figure 1e). Subsequent monitoring demonstrated a further increase in potassium to 7.4 mEq/L, with an ECG demonstrating a return to the baseline of 1 year prior. The patient underwent hemodialysis again and was given oral furosemide 60 mg every 12 hours. The potassium concentration after dialysis decreased to 4.7 mEq/L and remained stable, not going above 5.0 mEq/L on subsequent monitoring. The patient had resolution of all symptoms and was discharged.
Discussion
We have described in detail the presentation of each pathology and mechanisms of each treatment, starting with the patient’s initial condition that brought him to the emergency room—muscle weakness. Skeletal muscle weakness is a common manifestation of hyperkalemia, occurring in 20% to 40% of cases, and is more prevalent in severe elevations of potassium. Rarely, the weakness can progress to flaccid paralysis of the patient’s extremities and, in extreme cases, the diaphragm.
Muscle weakness progression occurs in a manner that resembles Guillain-Barré syndrome, starting in the lower extremities and ascending toward the upper extremities.10 This is known as secondary hyperkalemic periodic paralysis. Hyperkalemia lowers the transmembrane gradient in neurons, leading to neuronal depolarization independent of the degree of hyperkalemia. If the degree of hyperkalemia is large enough, this depolarization inactivates voltage-gated sodium channels, making neurons refractory to excitation. Electromyographical studies have shown reduction in the compounded muscle action potential.11 The transient nature of this paralysis is reflected by rapid correction of weakness and paralysis when the electrolyte disorder is corrected.
The patient in this case also presented with bradycardia. The ECG manifestations of hyperkalemia can include atrial asystole, intraventricular conduction disturbances, peaked T waves, and widened QRS complexes. However, some patients with renal insufficiency may not exhibit ECG changes despite significantly elevated serum potassium levels.12
The severity of hyperkalemia is crucial in determining the associated ECG changes, with levels > 6.0 mEq/L presenting with abnormalities.13 ECG findings alone may not always accurately reflect the severity of hyperkalemia, as up to 60% of patients with potassium levels > 6.0 mEq/L may not show ECG changes.14 Additionally, extreme hyperkalemia can lead to inconsistent ECG findings, making it challenging to rely solely on ECG for diagnosis and monitoring.8 The level of potassium that causes these effects varies widely through patient populations.
The main mechanism by which hyperkalemia affects the heart’s conduction system is through voltage differences across the conduction fibers and eventual steady-state inactivation of sodium channels. This combination of mechanisms shortens the action potential duration, allowing more cardiomyocytes to undergo synchronized depolarization. This amalgamation of cardiomyocytes repolarizing can be reflected on ECGs as peaked T waves. As the action potential decreases, there is a period during which cardiomyocytes are prone to tachyarrhythmias and ventricular fibrillation.
A reduced action potential may lead to increased rates of depolarization and thus conduction, which in some scenarios may increase heart rate. As the levels of potassium rise, intracellular accumulation impedes the entry of sodium by decreasing the cation gradient across the cell membrane. This effectively slows the sinus nodes and prolongs the QRS by slowing the overall propagation of action potentials. By this mechanism, conduction delays, blocks, or asystole are manifested. The patient in this case showed conduction delays, peaked T waves, and disappearance of P waves when he first arrived.
Hyperkalemia Treatment
Hyperkalemia develops most commonly due to acute or chronic kidney diseases, as was the case with this patient. The patient’s hyperkalemia was also augmented by the use of nonsteroidal anti-inflammatory drugs (NSAIDs), which can directly affect renal function. A properly functioning kidney is responsible for excretion of up to 90% of ingested potassium, while the remainder is excreted through the gastrointestinal (GI) tract. Definitive treatment of hyperkalemia is mitigated primarily through these 2 organ systems. The treatment also includes transitory mechanisms of potassium reduction. The goal of each method is to preserve the action potential of cardiomyocytes and myocytes. This patient presented with acute symptomatic hyperkalemia and received various medications to acutely, transitorily, and definitively treat it.
Initial therapy included calcium gluconate, which functions to stabilize the myocardial cell membrane. Hyperkalemia decreases the resting membrane action potential of excitable cells and predisposes them to early depolarization and thus dysrhythmias. Calcium decreases the threshold potential across cells and offsets the overall gradient back to near normal levels.15 Calcium can be delivered through calcium gluconate or calcium chloride. Calcium chloride is not preferred because extravasation can cause pain, blistering and tissue ischemia. Central venous access is required, potentially delaying prompt treatment. Calcium acts rapidly after administration—within 1 to 3 minutes—but only lasts 30 to 60 minutes.16 Administration of calcium gluconate can be repeated as often as necessary, but patients must be monitored for adverse effects of calcium such as nausea, abdominal pain, polydipsia, polyuria, muscle weakness, and paresthesia. Care must be taken when patients are taking digoxin, because calcium may potentiate toxicity.17 Although calcium provides immediate benefits it does little to correct the underlying cause; other medications are required to remove potassium from the body.
Two medication classes have been proven to shift potassium intracellularly. The first are β-2 agonists, such as albuterol/levalbuterol, and the second is insulin. Both work through sodium-potassium-ATPase in a direct manner. β-2 agonists stimulate sodium-potassium-ATPase to move more potassium intracellularly, but these effects have been seen only with high doses of albuterol, typically 4× the standard dose of 0.5 mg in nebulized solutions to achieve decreases in potassium of 0.3 to 0.6 mEq/L, although some trials have reported decreases of 0.62 to 0.98 mEq/L.15,18 These potassium-lowering effects of β-2 agonist are modest, but can be seen 20 to 30 minutes after administration and persist up to 1 to 2 hours. β-2 agonists are also readily affected by β blockers, which may reduce or negate the desired effect in hyperkalemia. For these reasons, a β-2 agonist should not be given as monotherapy and should be provided as an adjuvant to more independent therapies such as insulin. Insulin binds to receptors on muscle cells and increases the quantity of sodium-potassium-ATPase and glucose transporters. With this increase in influx pumps, surrounding tissues with higher resting membrane potentials can absorb the potassium load, thereby protecting cardiomyocytes.
Potassium Removal
Three methods are currently available to remove potassium from the body: GI excretion, renal excretion, and direct removal from the bloodstream. Under normal physiologic conditions, the kidneys account for about 90% of the body’s ability to remove potassium. Loop diuretics facilitate the removal of potassium by increasing urine production and have an additional potassium-wasting effect. Although the onset of action of loop diuretics is typically 30 to 60 minutes after oral administration, their effect can last for several hours. In this patient, furosemide was introduced later in the treatment plan to manage recurring hyperkalemia by enhancing renal potassium excretion.
Potassium binders such as patiromer act in the GI tract, effectively reducing serum potassium levels although with a slower onset of action than furosemide, generally taking hours to days to exert its effect. Both medications illustrate a tailored approach to managing potassium levels, adapted to the evolving needs and renal function of the patient. The last method is using hemodialysis—by far the most rapid method to remove potassium, but also the most invasive. The different methods of treating hyperkalemia are summarized in Table 2. This patient required multiple days of hemodialysis to completely correct the electrolyte disorder. Upon discharge, the patient continued oral furosemide 40 mg daily and eventually discontinued hemodialysis due to stable renal function.
Often, after correcting an inciting event, potassium stores in the body eventually stabilize and do not require additional follow-up. Patients prone to hyperkalemia should be thoroughly educated on medications to avoid (NSAIDs, ACEIs/ARBs, trimethoprim), an adequate low potassium diet, and symptoms that may warrant medical attention.19
Conclusions
This case illustrates the importance of recognizing the spectrum of manifestations of hyperkalemia, which ranged from muscle weakness to cardiac dysrhythmias. Management strategies for the patient included stabilization of cardiac membranes, potassium shifting, and potassium removal, each tailored to the patient’s individual clinical findings.
The case further illustrates the critical role of continuous monitoring and dynamic adjustment of therapeutic strategies in response to evolving clinical and laboratory findings. The initial and subsequent ECGs, alongside laboratory tests, were instrumental in guiding the adjustments needed in the treatment regimen, ensuring both the efficacy and safety of the interventions. This proactive approach can mitigate the risk of recurrent hyperkalemia and its complications.
- Youn JH, McDonough AA. Recent advances in understanding integrative control of potassium homeostasis. Annu Rev Physiol. 2009;71:381-401. doi:10.1146/annurev.physiol.010908.163241 2.
- Simon LV, Hashmi MF, Farrell MW. Hyperkalemia. In: StatPearls. StatPearls Publishing; September 4, 2023. Accessed October 22, 2025.
- Mu F, Betts KA, Woolley JM, et al. Prevalence and economic burden of hyperkalemia in the United States Medicare population. Curr Med Res Opin. 2020;36:1333-1341. doi:10.1080/03007995.2020.1775072
- Loutradis C, Tolika P, Skodra A, et al. Prevalence of hyperkalemia in diabetic and non-diabetic patients with chronic kidney disease: a nested case-control study. Am J Nephrol. 2015;42:351-360. doi:10.1159/000442393
- Grodzinsky A, Goyal A, Gosch K, et al. Prevalence and prognosis of hyperkalemia in patients with acute myocardial infarction. Am J Med. 2016;129:858-865. doi:10.1016/j.amjmed.2016.03.008
- Hunter RW, Bailey MA. Hyperkalemia: pathophysiology, risk factors and consequences. Nephrol Dial Transplant. 2019;34(suppl 3):iii2-iii11. doi:10.1093/ndt/gfz206
- Luo J, Brunelli SM, Jensen DE, Yang A. Association between serum potassium and outcomes in patients with reduced kidney function. Clin J Am Soc Nephrol. 2016;11:90-100. doi:10.2215/CJN.01730215
- Montford JR, Linas S. How dangerous is hyperkalemia? J Am Soc Nephrol. 2017;28:3155-3165. doi:10.1681/ASN.2016121344
- Mattu A, Brady WJ, Robinson DA. Electrocardiographic manifestations of hyperkalemia. Am J Emerg Med. 2000;18:721-729. doi:10.1053/ajem.2000.7344
- Kimmons LA, Usery JB. Acute ascending muscle weakness secondary to medication-induced hyperkalemia. Case Rep Med. 2014;2014:789529. doi:10.1155/2014/789529
- Naik KR, Saroja AO, Khanpet MS. Reversible electrophysiological abnormalities in acute secondary hyperkalemic paralysis. Ann Indian Acad Neurol. 2012;15:339-343. doi:10.4103/0972-2327.104354
- Montague BT, Ouellette JR, Buller GK. Retrospective review of the frequency of ECG changes in hyperkalemia. Clin J Am Soc Nephrol. 2008;3:324-330. doi:10.2215/CJN.04611007
- Larivée NL, Michaud JB, More KM, Wilson JA, Tennankore KK. Hyperkalemia: prevalence, predictors and emerging treatments. Cardiol Ther. 2023;12:35-63. doi:10.1007/s40119-022-00289-z
- Shingarev R, Allon M. A physiologic-based approach to the treatment of acute hyperkalemia. Am J Kidney Dis. 2010;56:578-584. doi:10.1053/j.ajkd.2010.03.014
- Parham WA, Mehdirad AA, Biermann KM, Fredman CS. Hyperkalemia revisited. Tex Heart Inst J. 2006;33:40-47.
- Ng KE, Lee CS. Updated treatment options in the management of hyperkalemia. U.S. Pharmacist. February 16, 2017. Accessed October 1, 2025. www.uspharmacist.com/article/updated-treatment-options-in-the-management-of-hyperkalemia
- Quick G, Bastani B. Prolonged asystolic hyperkalemic cardiac arrest with no neurologic sequelae. Ann Emerg Med. 1994;24:305-311. doi:10.1016/s0196-0644(94)70144-x 18.
- Allon M, Dunlay R, Copkney C. Nebulized albuterol for acute hyperkalemia in patients on hemodialysis. Ann Intern Med. 1989;110:426-429. doi:10.7326/0003-4819-110-6-42619.
- Kidney Disease: Improving Global Outcomes (KDIGO) CKD Work Group. KDIGO 2024 Clinical Practice Guideline for the Evaluation and Management of Chronic Kidney Disease. Kidney Int. 2024;105(4 suppl):S117-S314. doi:10.1016/j.kint.2023.10.018
Following the Hyperkalemia Trail: A Case Report of ECG Changes and Treatment Responses
Following the Hyperkalemia Trail: A Case Report of ECG Changes and Treatment Responses

Measuring Restrictive Lung Disease Severity Using FEV1 vs TLC
Respiratory diseases have varied clinical presentations and are classified as restrictive, obstructive, mixed, or normal. Restrictive lung diseases have reduced lung volumes, either due to an alteration in lung parenchyma or a disease of the pleura, chest wall, or neuromuscular apparatus. If caused by parenchymal lung disease, restrictive lung disorders are accompanied by reduced gas transfer, which may be portrayed clinically by desaturation after exercise. Based on anatomical structures, the causes of lung volume reduction may be intrinsic or extrinsic. Intrinsic causes correspond to diseases of the lung parenchyma, such as idiopathic fibrotic diseases, connective-tissue diseases, drug-induced lung diseases, and other primary diseases of the lungs. Extrinsic causes refer to disorders outside the lungs or extra-pulmonary diseases such as neuromuscular and nonmuscular diseases of the chest wall.1 For example, obesity and myasthenia gravis can cause restrictive lung diseases, one through mechanical interference of lung expansion and the other through neuromuscular impedance of thoracic cage expansion. All these diseases eventually result in lung restriction, impaired lung function, and respiratory failure. This heterogenicity of disease makes establishing a single severity criterion difficult.
Laboratory testing, imaging studies, and examinations are important for determining the pulmonary disease and its course and progression. The pulmonary function test (PFT), which consists of multiple procedures that are performed depending on the information needed, has been an essential tool in practice for the pulmonologist. The PFT includes spirometry, lung volume measurement, respiratory muscle strength, diffusion capacity, and a broncho-provocation test. Each test has a particular role in assisting the diagnosis and/or follow-up of the patient. Spirometry is frequently used due to its range of dynamic physiological parameters, ease of use, and accessibility. It is used for the diagnosis of pulmonary symptoms, in the assessment of disability, and preoperatory evaluation, including lung resection surgery, assisting in the diagnosis, monitoring, and therapy response of pulmonary diseases.
A systematic approach to PFT interpretation is recommended by several societies, such as the American Thoracic Society (ATS) and the European Respiratory Society (ERS).2 The pulmonary function test results must be reproducible and meet established standards to ensure reliable and consistent clinical outcomes. A restrictive respiratory disease is defined by a decrease in total lung capacity (TLC) (< 5% of predicted value) and a normal forced expiratory volume in 1 second (FEV1)/forced vital capacity (FVC) ratio.2 Although other findings—such as a decrease in vital capacity—should prompt an investigation into whether the patient has a possible restrictive respiratory disease, the sole presence of this parameter is not definitive or diagnostic of a restrictive impairment.2-4 The assessment of severity is typically determined by TLC. Unfortunately, the severity of a restrictive respiratory disease and the degree of patient discomfort do not always correlate when utilizing just TLC. Pulmonary sarcoidosis, for example, is a granulomatous lung disease with a restrictive PFT pattern and a disease burden that may vary over time. Having a more consistent method of grading the severity of the restrictive lung disease may help guide treatment. The modified Medical Research Council (mMRC) scale, a 5-point dyspnea scale, is widely used in assessing the severity of dyspnea in various respiratory conditions, including chronic obstructive pulmonary disease (COPD), where its scores have been associated with patient mortality.1,5 The goal of this study was to document the associations between objective parameters obtained through PFT and other variables, with an established measurement of dyspnea to assess the severity grade of restrictive lung diseases.
Methods
This retrospective record review at the Veterans Affairs Caribbean Healthcare System (VACHS) in San Juan, Puerto Rico, wasconducted using the Veterans Health Information Systems and Technology Architecture to identify patients with a PFT, including spirometry, that indicated a restrictive ventilator pattern based on the current ATS/ERS Task Force on Lung Function Testing.2 Patients were included if they were aged ≥ 21 years, PFT with TLC ≤ 80% predicted, mMRC score documented on PFT, and documented diffusing capacity of the lung for carbon monoxide (DLCO). Patients were excluded if their FEV1/vital capacity (VC) was < 70% predicted using the largest VC, or no mMRC score was available. All patients meeting the inclusion criteria were considered regardless of comorbidities.
The PFT results of all adult patients, including those performed between June 1, 2013, and January 6, 2016, were submitted to spirometry, and lung volume measurements were analyzed. Sociodemographic information was collected, including sex, ethnicity, age, height, weight, and basal metabolic index. Other data found in PFTs, such as smoking status, smoking in packs/year, mMRC score, predicted TLC value, imaging present (chest X-ray, computed tomography), and hospitalizations and exacerbations within 1 year were collected. In addition, we examined the predicted values for FEV1, DLCO, and DLCO/VA (calculated using the Ayer equation), FVC (calculated using the Knudson equation), expiratory reserve volume, inspiratory VC, and slow VC. PaO2, PaCO2, and Alveolar-arterial gradients also were collected.6-9 Information about heart failure status was gathered through medical evaluation of notes and cardiac studies. All categorical variables were correlated with Spearman analysis and quantitative variables with average percentages. P values were calculated with analysis of variance.
Results
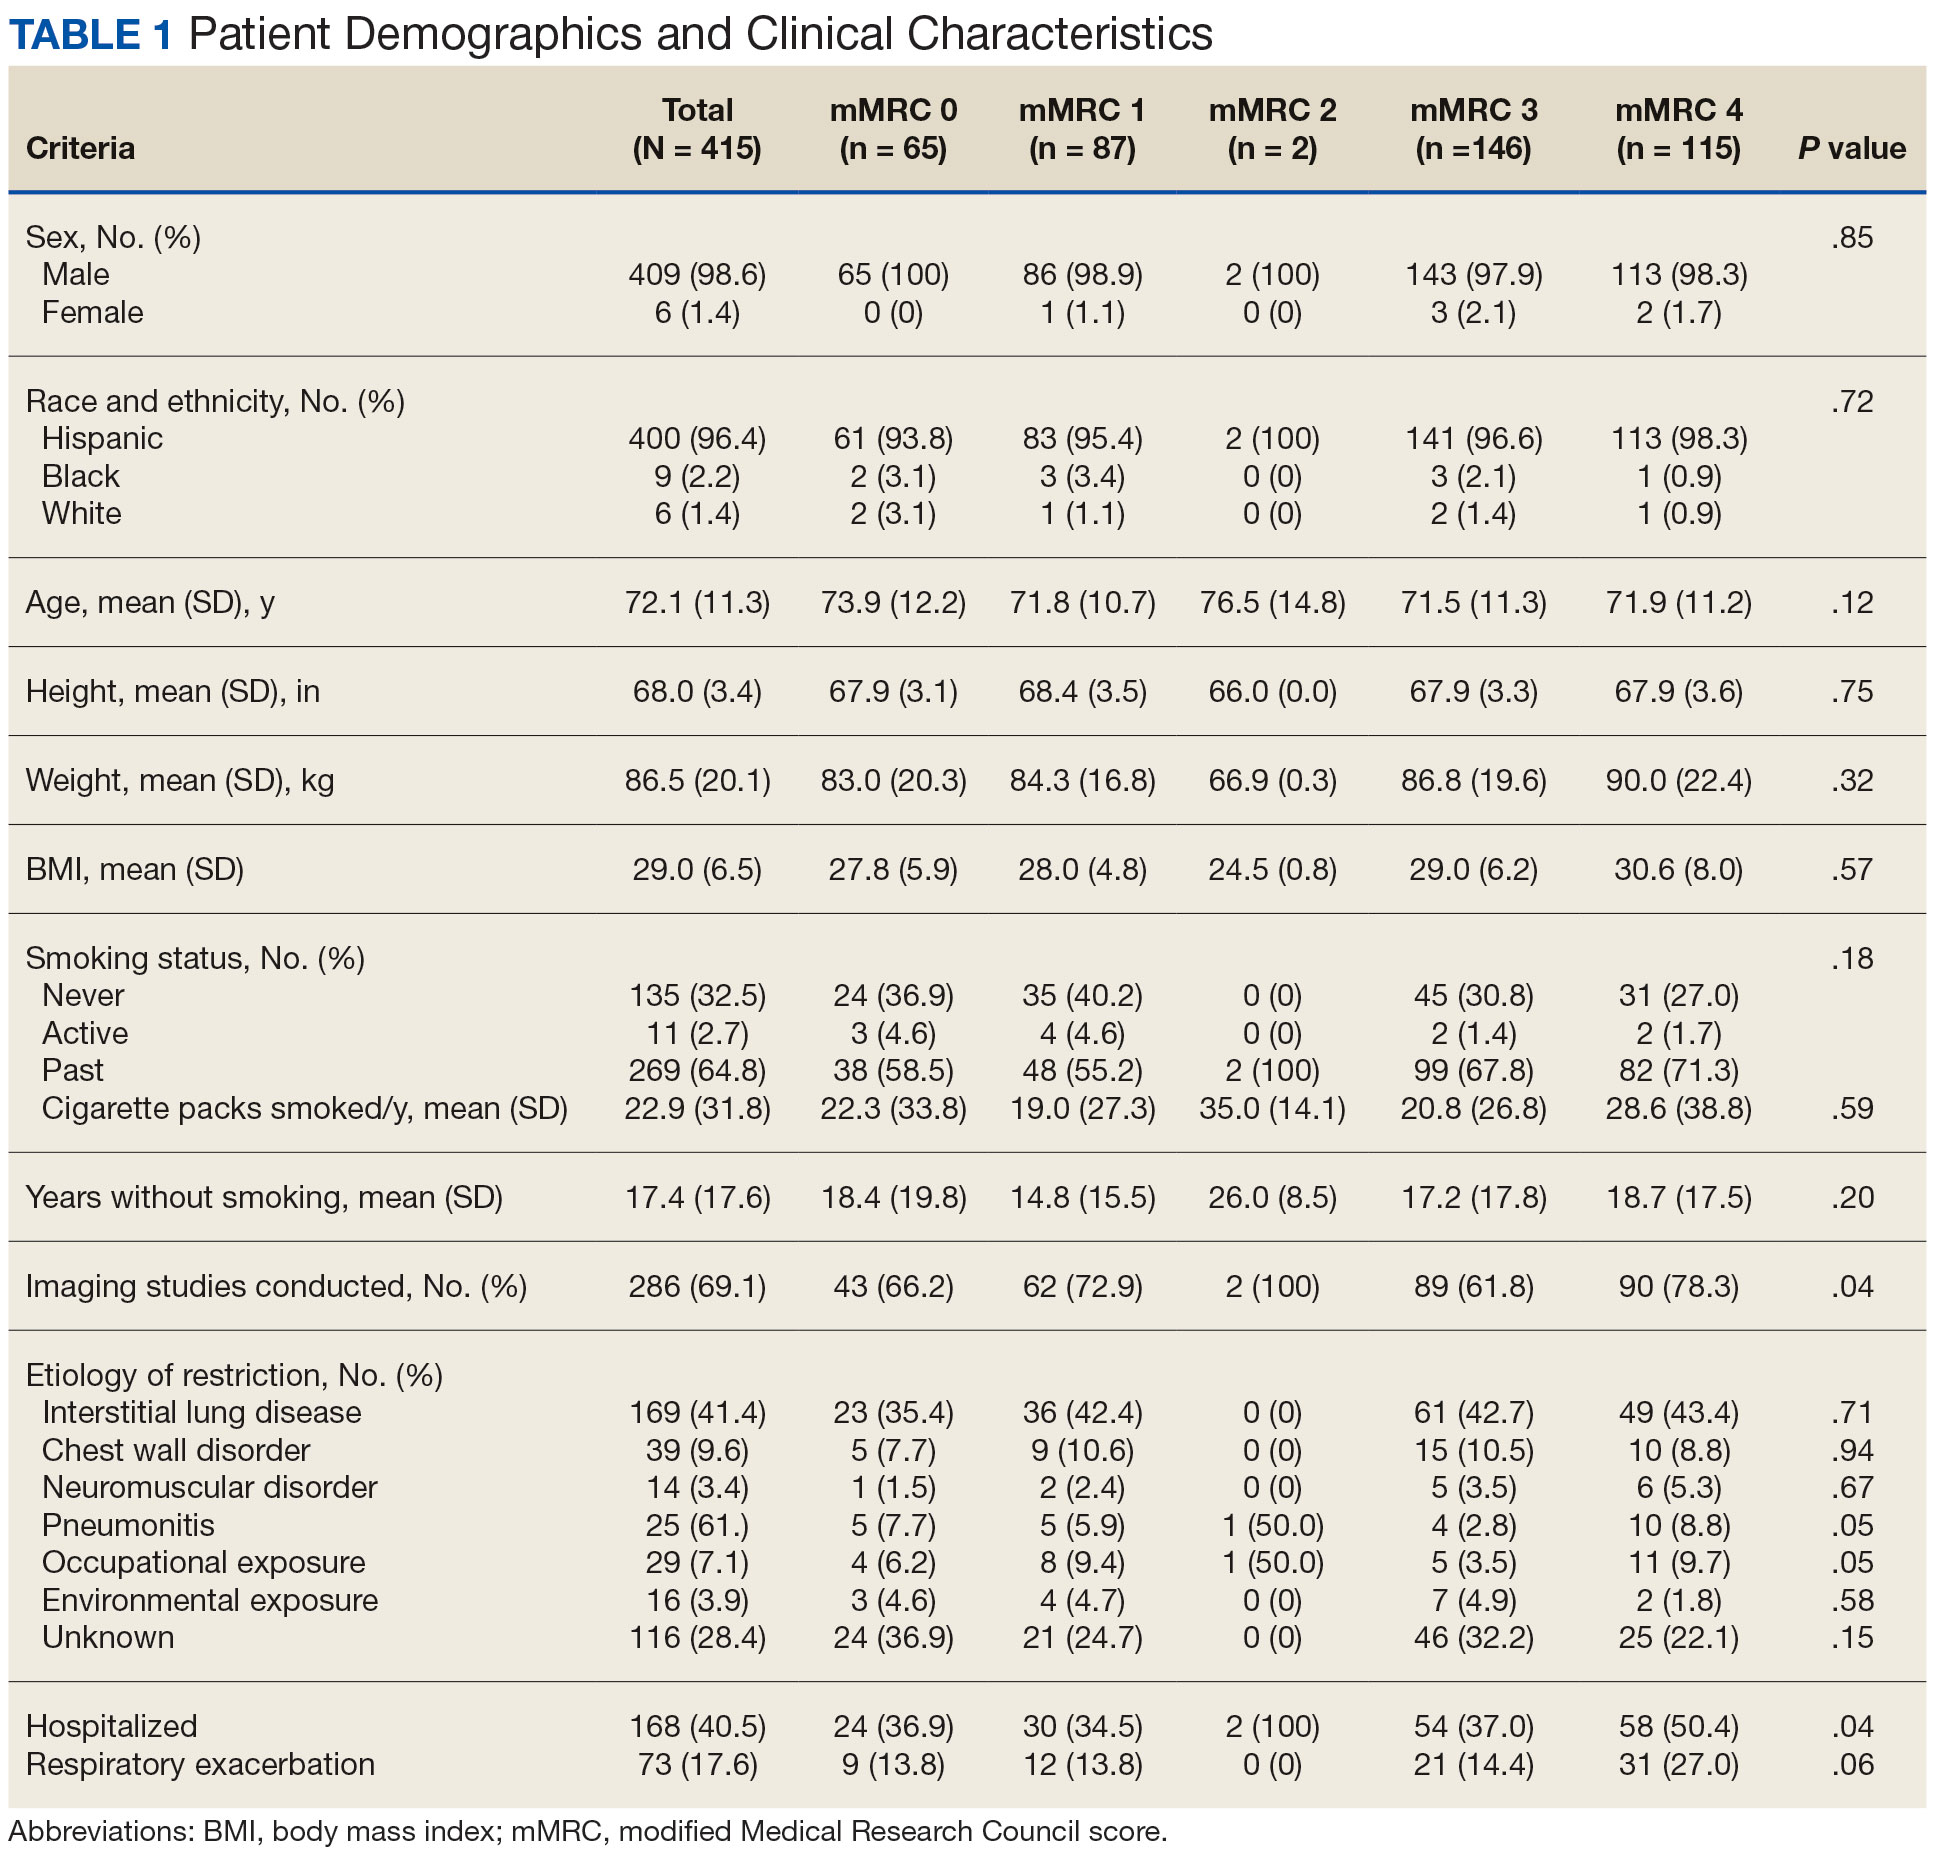
Of 6461 VACHS patient records reviewed, 415 met the inclusion criteria. Patients were divided according to their mMRC score: 65 had mMRC score of 0, 87 had an mMRC score of 1, 2 had an mMRC score of 2, 146 had an mMRC of 3, and 115 had an mMRC score of 4. The population was primarily male (98.6%) and of Hispanic ethnicity (96.4%), with a mean age of 72 years (Table 1). Most patients (n = 269, 64.0%) were prior smokers, while 135 patients (32.5%) had never smoked, and 11 (2.7%) were current smokers. At baseline, 169 patients (41.4%) had interstitial lung disease, 39 (9.6%) had chest wall disorders, 29 (7.1%) had occupational exposure, 25 (6.1%) had pneumonitis, and 14 (3.4%) had neuromuscular disorders.
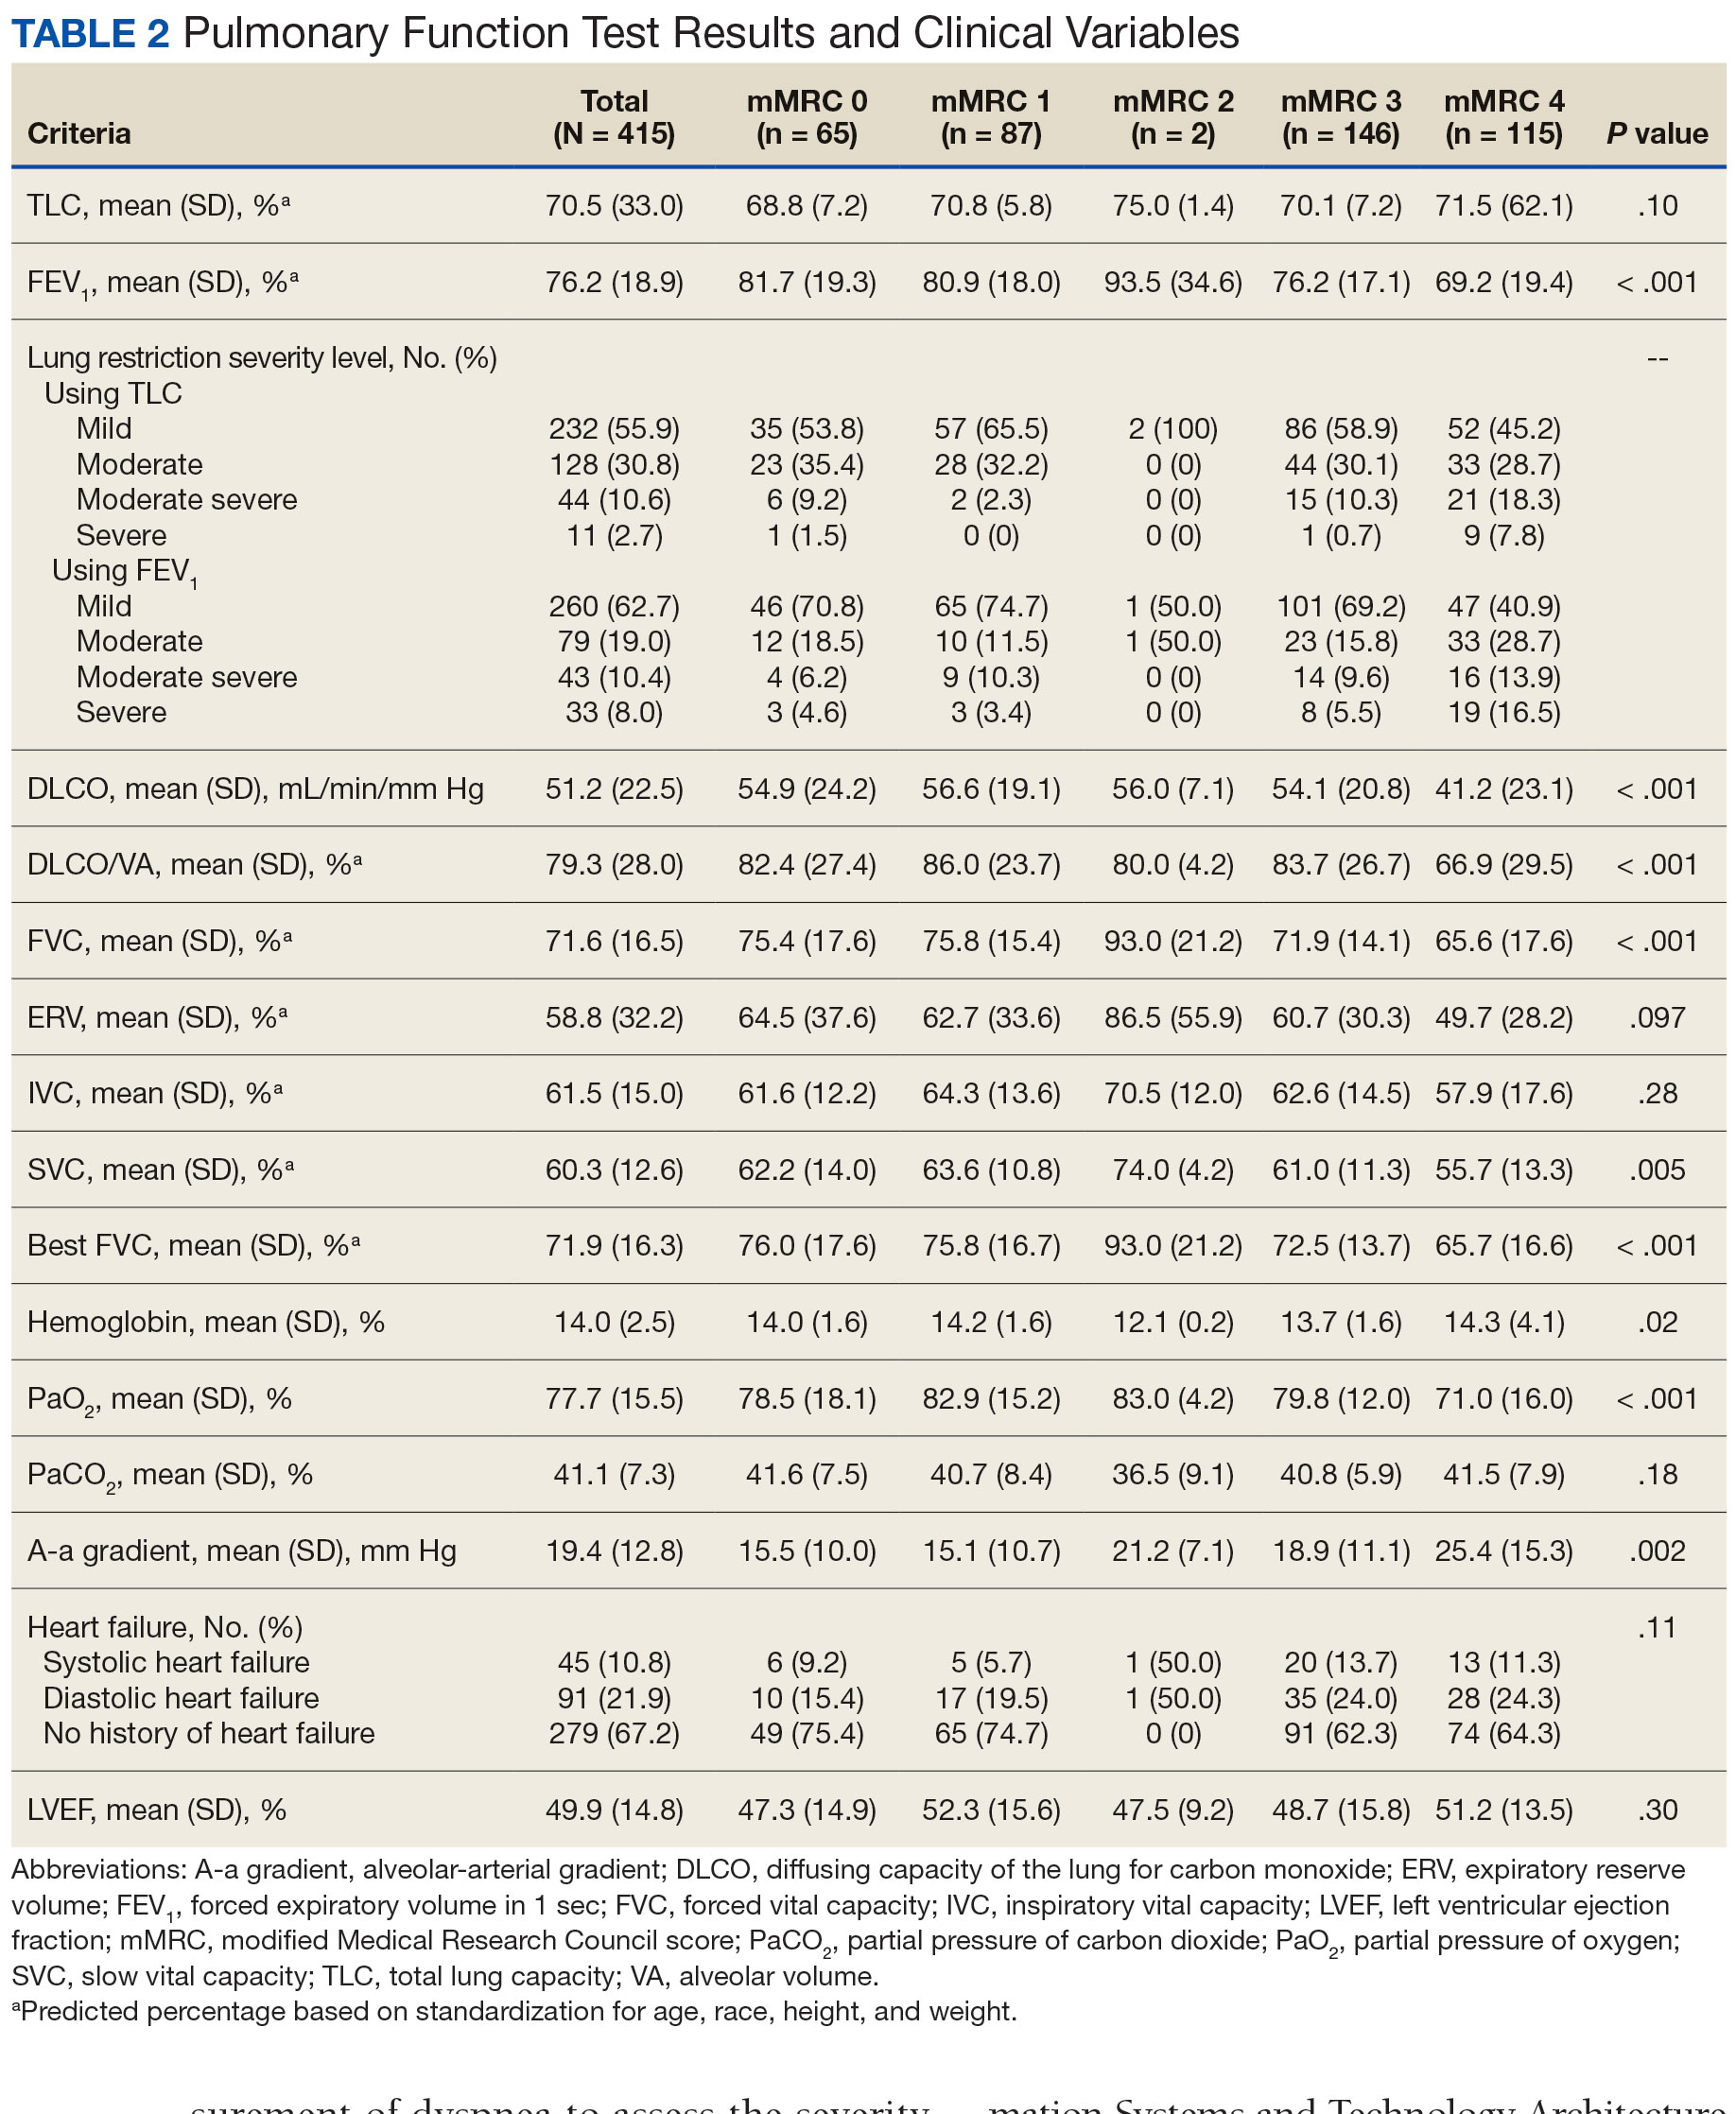
There was a statistically significant relationship between mMRC score and hospitalization and FEV1 but not TLC (Table 2). As mMRC increased, so did hospitalizations: a total of 168 patients (40.5%) were hospitalized; 24 patients (36.9%) had an mMRC score of 0, 30 patients (34.0%) had an mMRC score of 1, 2 patients (100%) had an mMRC score of 2, 54 patients (37.0%) had an mMRC score of 3, and 58 patients (50.0%) had an mMRC score of 4 (P = .04). Mean (SD) TLC values increased as mMRC scores increased. Mean (SD) TLC was 70.5% (33.0) for the entire population; 68.8% (7.2) for patients with an mMRC score of 0, 70.8% (5.8) for patients with an mMRC score of 1, 75.0% (1.4) for patients with an mMRC score of 2, 70.1% (7.2) for patients with an mMRC score of 3, and 71.5% (62.1) for patients with an mMRC score of 4 (P = .10) (Figure 1). There was an associated decrease in mean (SD) FEV1 with mMRC. Mean (SD) FEV1 was 76.2% (18.9) for the entire population; 81.7% (19.3) for patients with an mMRC score of 0, 80.9% (18) for patients with an mMRC score of 1, 93.5% (34.6) for patients with an mMRC score of 2, 76.2% (17.1) for patients with an mMRC score of 3, and 69.2% (19.4) for patients with an mMRC score of 4; (P < .001) (Figure 2).
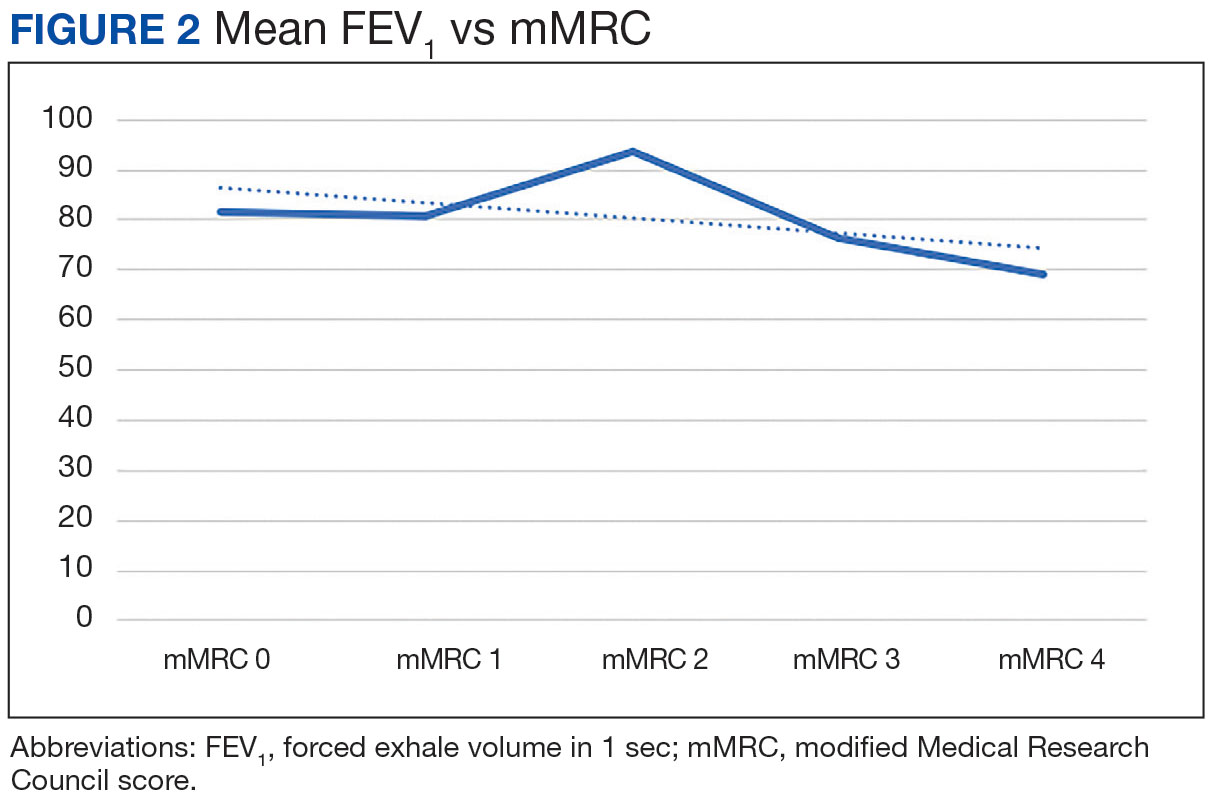
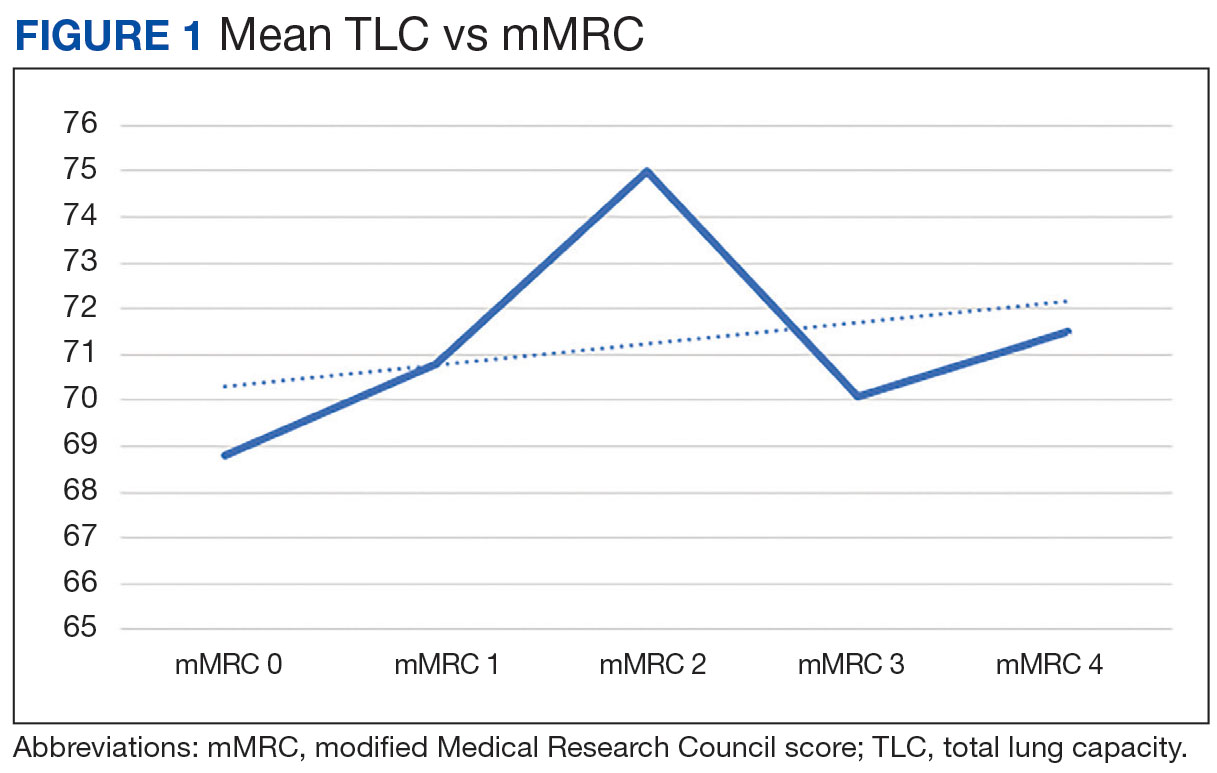
The correlation between mMRC and FEV1 (r = 0.25, P < .001) was stronger than the correlation between mMRC and TLC (r = 0.15, P < .001). The correlations for DLCO (P < .001), DLCO/VA (P < .001), hemoglobin (P < .02), and PaO2 (P < .001) were all statistically significant (P < .005), but with no strong identifiable trend.
Discussion
The patient population of this study was primarily older males of Hispanic ethnicity with a history of smoking. There was no association between body mass index or smoking status with worsening dyspnea as measured with mMRC scores. We observed no significant correlation between mMRC scores and various factors such as comorbidities including heart conditions, and epidemiological factors like the etiology of lung disease, including both intrinsic and extrinsic causes. This lack of association was anticipated, as restrictive lung diseases in our study predominantly arose from intrinsic pulmonary etiologies, such as interstitial lung disease. A difference between more hospitalizations and worsening dyspnea was identified. There was a slightly higher correlation between FEV1 and mMRC scores when compared with TLC and mMRC scores concerning worsening dyspnea, which could indicate that the use of FEV1 should be preferred over previous recommendations to use TLC.10 Other guidelines have utilized exercise capacity via the 6-minute walk test as a marker of severity with spirometry values and found that DLCO was correlated with severity.11
The latest ERS/ATS guidelines recommend z scores for grading the severity of obstructive lung diseases but do not recommend them for the diagnosis of restrictive lung diseases.12 A z score encompasses diverse variables (eg, age, sex, and ethnicity) to provide more uniform and consistent results. Other studies have been done to relate z scores to other spirometry variables with restrictive lung disease. One such study indicates the potential benefit of using FVC alone to grade restrictive lung diseases.13 There continues to be great diversity in the interpretation of pulmonary function tests, and we believe the information gathered can provide valuable insight for managing patients with restrictive lung diseases.
Limitations
Only 2 patients reported an mMRC score of 2 in our study. This may have affected statistical outcomes. It also may reveal possible deficits in the efficacy of patient education on the mMRC scale. This study was also limited by its small sample size, single center location, and the distribution of patients that reported an mMRC favored either low or high values. The patients in this study, who were all veterans, may not be representative of other patient populations.
Conclusions
There continue to be few factors associated with the physiological severity of the defective oxygen delivery and reported dyspnea of a patient with restrictive lung disease that allows for an accurate, repeatable grading of severity. Using FEV1 instead of TLC to determine the severity of a restrictive lung disease should be reconsidered. We could not find any other strong correlation among other factors studied. Further research should be conducted to continue looking for variables that more accurately depict patient dyspnea in restrictive lung disease.
Acknowledgments
This study is based upon work supported by the Veterans Affairs Caribbean Healthcare System in San Juan, Puerto Rico, and is the result of work supported by Pulmonary & Critical Care Medicine service, with resources and the use of its facilities.
1. Hegewald MJ, Crapo RO. Pulmonary function testing. In: Broaddus VC, Ernst JD, King Jr TE, eds. Murray and Nadel’s Textbook of Respiratory Medicine. 5th ed. Saunders; 2010:522-553.
2. Pellegrino R, Viegi G, Brusasco V, et al. Interpretative strategies for lung function tests. Eur Respir J. 2005;26(5):948-968. doi:10.1183/09031936.05.00035205
3. Rabe KF, Beghé B, Luppi F, Fabbri LM. Update in chronic obstructive pulmonary disease 2006. Am J Respir Crit Care Med. 2007;175(12):1222-1232. doi:10.1164/rccm.200704-586UP
4. Global Initiative for Chronic Obstructive Lung Disease (GOLD). Spirometry for health care providers Accessed April 30, 2024. https://goldcopd.org/wp-content/uploads/2016/04/GOLD_Spirometry_2010.pdf
5. Mannino DM, Holguin F, Pavlin BI, Ferdinands JM. Risk factors for prevalence of and mortality related to restriction on spirometry: findings from the First National Health and Nutrition Examination Survey and follow-up. Int J Tuberc Lung Dis. 2005;9(6):613-621.
6. Knudson RJ, Lebowitz MD, Holberg CJ, Burrows B. Changes in the normal maximal expiratory flow-volume curve with growth and aging. Am Rev Respir Dis. 1983;127(6):725-734. doi:10.1164/arrd.1983.127.6.725
7. Knudson RJ, Burrows B, Lebowitz MD. The maximal expiratory flow-volume curve: its use in the detection of ventilatory abnormalities in a population study. Am Rev Respir Dis. 1976;114(5):871-879. doi:10.1164/arrd.1976.114.5.871
8. Knudson RJ, Lebowitz MD, Burton AP, Knudson DE. The closing volume test: evaluation of nitrogen and bolus methods in a random population. Am Rev Respir Dis. 1977;115(3):423-434. doi:10.1164/arrd.1977.115.3.423
9. Ayers LN, Ginsberg ML, Fein J, Wasserman K. Diffusing capacity, specific diffusing capacity and interpretation of diffusion defects. West J Med. 1975;123(4):255-264.
10. Lung function testing: selection of reference values and interpretative strategies. American Thoracic Society. Am Rev Respir Dis. 1991;144(5):1202-1218. doi:10.1164/ajrccm/144.5.1202
11. Larson J, Wrzos K, Corazalla E, Wang Q, Kim HJ, Cho RJ. Should FEV1 be used to grade restrictive impairment? A single-center comparison of lung function parameters to 6-minute walk test in patients with restrictive lung disease. HSOA J Pulm Med Respir Res. 2023;9:082. doi:10.24966/PMRR-0177/100082
12. Stanojevic S, Kaminsky DA, Miller MR, et al. ERS/ATS technical standard on interpretive strategies for routine lung function tests. Eur Respir J. 2022;60(1):2101499. Published 2022 Jul 13. doi:10.1183/13993003.01499-2021
13. Myrberg T, Lindberg A, Eriksson B, et al. Restrictive spirometry versus restrictive lung function using the GLI reference values. Clin Physiol Funct Imaging. 2022;42(3):181-189. doi:10.1111/cpf.12745
Rebeca Vazquez-Nieves, MDa; Vanessa Fonseca-Ferrer, MDa; Juan Irizarry-Nieves, MDa; Edgardo Adorno-Fontanez, MDa; William Rodriguez-Cintron, MDa,b,c
Correspondence: Juan Irizarry-Nieves ([email protected])
aVeterans Affairs Caribbean Healthcare System, San Juan, Puerto Rico
bUniversity of Puerto Rico School of Medicine, San Juan
cUniversidad Central del Caribe School of Medicine, San Juan, Puerto Rico
 Author disclosures
The authors report no actual or potential conflicts of interest or outside sources of funding with regard to this article.
Disclaimer
The opinions expressed herein are those of the authors and do not necessarily reflect those of Federal Practitioner, Frontline Medical Communications Inc., the US Government, or any of its agencies.
Ethics and consent
All documentation was approved by the Veterans Affairs Caribbean Healthcare System institutional review board.Appropriate waivers were obtained and there are no findings of incompliance present.
Rebeca Vazquez-Nieves, MDa; Vanessa Fonseca-Ferrer, MDa; Juan Irizarry-Nieves, MDa; Edgardo Adorno-Fontanez, MDa; William Rodriguez-Cintron, MDa,b,c
Correspondence: Juan Irizarry-Nieves ([email protected])
aVeterans Affairs Caribbean Healthcare System, San Juan, Puerto Rico
bUniversity of Puerto Rico School of Medicine, San Juan
cUniversidad Central del Caribe School of Medicine, San Juan, Puerto Rico
Author disclosures
The authors report no actual or potential conflicts of interest or outside sources of funding with regard to this article.
Disclaimer
The opinions expressed herein are those of the authors and do not necessarily reflect those of Federal Practitioner, Frontline Medical Communications Inc., the US Government, or any of its agencies.
Ethics and consent
All documentation was approved by the Veterans Affairs Caribbean Healthcare System institutional review board.Appropriate waivers were obtained and there are no findings of incompliance present.
Respiratory diseases have varied clinical presentations and are classified as restrictive, obstructive, mixed, or normal. Restrictive lung diseases have reduced lung volumes, either due to an alteration in lung parenchyma or a disease of the pleura, chest wall, or neuromuscular apparatus. If caused by parenchymal lung disease, restrictive lung disorders are accompanied by reduced gas transfer, which may be portrayed clinically by desaturation after exercise. Based on anatomical structures, the causes of lung volume reduction may be intrinsic or extrinsic. Intrinsic causes correspond to diseases of the lung parenchyma, such as idiopathic fibrotic diseases, connective-tissue diseases, drug-induced lung diseases, and other primary diseases of the lungs. Extrinsic causes refer to disorders outside the lungs or extra-pulmonary diseases such as neuromuscular and nonmuscular diseases of the chest wall.1 For example, obesity and myasthenia gravis can cause restrictive lung diseases, one through mechanical interference of lung expansion and the other through neuromuscular impedance of thoracic cage expansion. All these diseases eventually result in lung restriction, impaired lung function, and respiratory failure. This heterogenicity of disease makes establishing a single severity criterion difficult.
Laboratory testing, imaging studies, and examinations are important for determining the pulmonary disease and its course and progression. The pulmonary function test (PFT), which consists of multiple procedures that are performed depending on the information needed, has been an essential tool in practice for the pulmonologist. The PFT includes spirometry, lung volume measurement, respiratory muscle strength, diffusion capacity, and a broncho-provocation test. Each test has a particular role in assisting the diagnosis and/or follow-up of the patient. Spirometry is frequently used due to its range of dynamic physiological parameters, ease of use, and accessibility. It is used for the diagnosis of pulmonary symptoms, in the assessment of disability, and preoperatory evaluation, including lung resection surgery, assisting in the diagnosis, monitoring, and therapy response of pulmonary diseases.
A systematic approach to PFT interpretation is recommended by several societies, such as the American Thoracic Society (ATS) and the European Respiratory Society (ERS).2 The pulmonary function test results must be reproducible and meet established standards to ensure reliable and consistent clinical outcomes. A restrictive respiratory disease is defined by a decrease in total lung capacity (TLC) (< 5% of predicted value) and a normal forced expiratory volume in 1 second (FEV1)/forced vital capacity (FVC) ratio.2 Although other findings—such as a decrease in vital capacity—should prompt an investigation into whether the patient has a possible restrictive respiratory disease, the sole presence of this parameter is not definitive or diagnostic of a restrictive impairment.2-4 The assessment of severity is typically determined by TLC. Unfortunately, the severity of a restrictive respiratory disease and the degree of patient discomfort do not always correlate when utilizing just TLC. Pulmonary sarcoidosis, for example, is a granulomatous lung disease with a restrictive PFT pattern and a disease burden that may vary over time. Having a more consistent method of grading the severity of the restrictive lung disease may help guide treatment. The modified Medical Research Council (mMRC) scale, a 5-point dyspnea scale, is widely used in assessing the severity of dyspnea in various respiratory conditions, including chronic obstructive pulmonary disease (COPD), where its scores have been associated with patient mortality.1,5 The goal of this study was to document the associations between objective parameters obtained through PFT and other variables, with an established measurement of dyspnea to assess the severity grade of restrictive lung diseases.
Methods
This retrospective record review at the Veterans Affairs Caribbean Healthcare System (VACHS) in San Juan, Puerto Rico, wasconducted using the Veterans Health Information Systems and Technology Architecture to identify patients with a PFT, including spirometry, that indicated a restrictive ventilator pattern based on the current ATS/ERS Task Force on Lung Function Testing.2 Patients were included if they were aged ≥ 21 years, PFT with TLC ≤ 80% predicted, mMRC score documented on PFT, and documented diffusing capacity of the lung for carbon monoxide (DLCO). Patients were excluded if their FEV1/vital capacity (VC) was < 70% predicted using the largest VC, or no mMRC score was available. All patients meeting the inclusion criteria were considered regardless of comorbidities.
The PFT results of all adult patients, including those performed between June 1, 2013, and January 6, 2016, were submitted to spirometry, and lung volume measurements were analyzed. Sociodemographic information was collected, including sex, ethnicity, age, height, weight, and basal metabolic index. Other data found in PFTs, such as smoking status, smoking in packs/year, mMRC score, predicted TLC value, imaging present (chest X-ray, computed tomography), and hospitalizations and exacerbations within 1 year were collected. In addition, we examined the predicted values for FEV1, DLCO, and DLCO/VA (calculated using the Ayer equation), FVC (calculated using the Knudson equation), expiratory reserve volume, inspiratory VC, and slow VC. PaO2, PaCO2, and Alveolar-arterial gradients also were collected.6-9 Information about heart failure status was gathered through medical evaluation of notes and cardiac studies. All categorical variables were correlated with Spearman analysis and quantitative variables with average percentages. P values were calculated with analysis of variance.
Results
Of 6461 VACHS patient records reviewed, 415 met the inclusion criteria. Patients were divided according to their mMRC score: 65 had mMRC score of 0, 87 had an mMRC score of 1, 2 had an mMRC score of 2, 146 had an mMRC of 3, and 115 had an mMRC score of 4. The population was primarily male (98.6%) and of Hispanic ethnicity (96.4%), with a mean age of 72 years (Table 1). Most patients (n = 269, 64.0%) were prior smokers, while 135 patients (32.5%) had never smoked, and 11 (2.7%) were current smokers. At baseline, 169 patients (41.4%) had interstitial lung disease, 39 (9.6%) had chest wall disorders, 29 (7.1%) had occupational exposure, 25 (6.1%) had pneumonitis, and 14 (3.4%) had neuromuscular disorders.
There was a statistically significant relationship between mMRC score and hospitalization and FEV1 but not TLC (Table 2). As mMRC increased, so did hospitalizations: a total of 168 patients (40.5%) were hospitalized; 24 patients (36.9%) had an mMRC score of 0, 30 patients (34.0%) had an mMRC score of 1, 2 patients (100%) had an mMRC score of 2, 54 patients (37.0%) had an mMRC score of 3, and 58 patients (50.0%) had an mMRC score of 4 (P = .04). Mean (SD) TLC values increased as mMRC scores increased. Mean (SD) TLC was 70.5% (33.0) for the entire population; 68.8% (7.2) for patients with an mMRC score of 0, 70.8% (5.8) for patients with an mMRC score of 1, 75.0% (1.4) for patients with an mMRC score of 2, 70.1% (7.2) for patients with an mMRC score of 3, and 71.5% (62.1) for patients with an mMRC score of 4 (P = .10) (Figure 1). There was an associated decrease in mean (SD) FEV1 with mMRC. Mean (SD) FEV1 was 76.2% (18.9) for the entire population; 81.7% (19.3) for patients with an mMRC score of 0, 80.9% (18) for patients with an mMRC score of 1, 93.5% (34.6) for patients with an mMRC score of 2, 76.2% (17.1) for patients with an mMRC score of 3, and 69.2% (19.4) for patients with an mMRC score of 4; (P < .001) (Figure 2).
The correlation between mMRC and FEV1 (r = 0.25, P < .001) was stronger than the correlation between mMRC and TLC (r = 0.15, P < .001). The correlations for DLCO (P < .001), DLCO/VA (P < .001), hemoglobin (P < .02), and PaO2 (P < .001) were all statistically significant (P < .005), but with no strong identifiable trend.
Discussion
The patient population of this study was primarily older males of Hispanic ethnicity with a history of smoking. There was no association between body mass index or smoking status with worsening dyspnea as measured with mMRC scores. We observed no significant correlation between mMRC scores and various factors such as comorbidities including heart conditions, and epidemiological factors like the etiology of lung disease, including both intrinsic and extrinsic causes. This lack of association was anticipated, as restrictive lung diseases in our study predominantly arose from intrinsic pulmonary etiologies, such as interstitial lung disease. A difference between more hospitalizations and worsening dyspnea was identified. There was a slightly higher correlation between FEV1 and mMRC scores when compared with TLC and mMRC scores concerning worsening dyspnea, which could indicate that the use of FEV1 should be preferred over previous recommendations to use TLC.10 Other guidelines have utilized exercise capacity via the 6-minute walk test as a marker of severity with spirometry values and found that DLCO was correlated with severity.11
The latest ERS/ATS guidelines recommend z scores for grading the severity of obstructive lung diseases but do not recommend them for the diagnosis of restrictive lung diseases.12 A z score encompasses diverse variables (eg, age, sex, and ethnicity) to provide more uniform and consistent results. Other studies have been done to relate z scores to other spirometry variables with restrictive lung disease. One such study indicates the potential benefit of using FVC alone to grade restrictive lung diseases.13 There continues to be great diversity in the interpretation of pulmonary function tests, and we believe the information gathered can provide valuable insight for managing patients with restrictive lung diseases.
Limitations
Only 2 patients reported an mMRC score of 2 in our study. This may have affected statistical outcomes. It also may reveal possible deficits in the efficacy of patient education on the mMRC scale. This study was also limited by its small sample size, single center location, and the distribution of patients that reported an mMRC favored either low or high values. The patients in this study, who were all veterans, may not be representative of other patient populations.
Conclusions
There continue to be few factors associated with the physiological severity of the defective oxygen delivery and reported dyspnea of a patient with restrictive lung disease that allows for an accurate, repeatable grading of severity. Using FEV1 instead of TLC to determine the severity of a restrictive lung disease should be reconsidered. We could not find any other strong correlation among other factors studied. Further research should be conducted to continue looking for variables that more accurately depict patient dyspnea in restrictive lung disease.
Acknowledgments
This study is based upon work supported by the Veterans Affairs Caribbean Healthcare System in San Juan, Puerto Rico, and is the result of work supported by Pulmonary & Critical Care Medicine service, with resources and the use of its facilities.
1. Hegewald MJ, Crapo RO. Pulmonary function testing. In: Broaddus VC, Ernst JD, King Jr TE, eds. Murray and Nadel’s Textbook of Respiratory Medicine. 5th ed. Saunders; 2010:522-553.
2. Pellegrino R, Viegi G, Brusasco V, et al. Interpretative strategies for lung function tests. Eur Respir J. 2005;26(5):948-968. doi:10.1183/09031936.05.00035205
3. Rabe KF, Beghé B, Luppi F, Fabbri LM. Update in chronic obstructive pulmonary disease 2006. Am J Respir Crit Care Med. 2007;175(12):1222-1232. doi:10.1164/rccm.200704-586UP
4. Global Initiative for Chronic Obstructive Lung Disease (GOLD). Spirometry for health care providers Accessed April 30, 2024. https://goldcopd.org/wp-content/uploads/2016/04/GOLD_Spirometry_2010.pdf
5. Mannino DM, Holguin F, Pavlin BI, Ferdinands JM. Risk factors for prevalence of and mortality related to restriction on spirometry: findings from the First National Health and Nutrition Examination Survey and follow-up. Int J Tuberc Lung Dis. 2005;9(6):613-621.
6. Knudson RJ, Lebowitz MD, Holberg CJ, Burrows B. Changes in the normal maximal expiratory flow-volume curve with growth and aging. Am Rev Respir Dis. 1983;127(6):725-734. doi:10.1164/arrd.1983.127.6.725
7. Knudson RJ, Burrows B, Lebowitz MD. The maximal expiratory flow-volume curve: its use in the detection of ventilatory abnormalities in a population study. Am Rev Respir Dis. 1976;114(5):871-879. doi:10.1164/arrd.1976.114.5.871
8. Knudson RJ, Lebowitz MD, Burton AP, Knudson DE. The closing volume test: evaluation of nitrogen and bolus methods in a random population. Am Rev Respir Dis. 1977;115(3):423-434. doi:10.1164/arrd.1977.115.3.423
9. Ayers LN, Ginsberg ML, Fein J, Wasserman K. Diffusing capacity, specific diffusing capacity and interpretation of diffusion defects. West J Med. 1975;123(4):255-264.
10. Lung function testing: selection of reference values and interpretative strategies. American Thoracic Society. Am Rev Respir Dis. 1991;144(5):1202-1218. doi:10.1164/ajrccm/144.5.1202
11. Larson J, Wrzos K, Corazalla E, Wang Q, Kim HJ, Cho RJ. Should FEV1 be used to grade restrictive impairment? A single-center comparison of lung function parameters to 6-minute walk test in patients with restrictive lung disease. HSOA J Pulm Med Respir Res. 2023;9:082. doi:10.24966/PMRR-0177/100082
12. Stanojevic S, Kaminsky DA, Miller MR, et al. ERS/ATS technical standard on interpretive strategies for routine lung function tests. Eur Respir J. 2022;60(1):2101499. Published 2022 Jul 13. doi:10.1183/13993003.01499-2021
13. Myrberg T, Lindberg A, Eriksson B, et al. Restrictive spirometry versus restrictive lung function using the GLI reference values. Clin Physiol Funct Imaging. 2022;42(3):181-189. doi:10.1111/cpf.12745