User login
Cardiology News is an independent news source that provides cardiologists with timely and relevant news and commentary about clinical developments and the impact of health care policy on cardiology and the cardiologist's practice. Cardiology News Digital Network is the online destination and multimedia properties of Cardiology News, the independent news publication for cardiologists. Cardiology news is the leading source of news and commentary about clinical developments in cardiology as well as health care policy and regulations that affect the cardiologist's practice. Cardiology News Digital Network is owned by Frontline Medical Communications.
New AHA statement on pediatric primary hypertension issued
the American Heart Association said in a new scientific statement.
“Children can have secondary hypertension that is caused by an underlying condition such as chronic kidney disease, endocrine disorders, cardiac anomalies, and some syndromes. However, primary hypertension is now recognized as the most common type of hypertension in childhood,” Bonita Falkner, MD, chair of the writing group and emeritus professor of medicine and pediatrics, Thomas Jefferson University, Philadelphia, said in an interview.
And hypertensive children are “highly likely” to become hypertensive adults and to have measurable target organ injury, particularly left ventricular hypertrophy and vascular stiffening, the writing group noted.
The AHA statement on primary pediatric hypertension was published online in Hypertension.
Primary or essential hypertension occurs in up to 5% of children and adolescents in the United States and other countries.
The American Academy of Pediatrics (AAP), European Society of Hypertension and Hypertension Canada all define hypertension as repeated BP readings at or above the 95th percentile for children, but the thresholds differ by age.
The AAP adopts 130/80 mm Hg starting at age 13 years; the European Society of Hypertension adopts 140/90 mm Hg starting at age 16 years; and Hypertension Canada adopts 120/80 mm Hg for those aged 6-11 years and 130/85 mm Hg for those aged 12-17 years.
Adolescents entering adulthood with a BP < 120/80 mm Hg is an optimal goal, the writing group advised.
They recommend that health care professionals be trained on evidence-based methods to obtain accurate and reliable BP values with either auscultatory or oscillometric methods.
When the initial BP measurement is abnormal, repeat measurement by auscultation is recommended, within the same visit if possible, and then within weeks if the screening BP is hypertensive, or months if the screening BP is elevated.
Because BP levels are variable, even within a single visit, “best practice” is to obtain up to three BP measurements and to record the average of the latter two measurements unless the first measurement is normal, the writing group said. Further confirmation of diagnosis of hypertension can be obtained with 24-hour ambulatory BP monitoring (ABPM).
“Primary hypertension in youth is difficult to recognize in asymptomatic, otherwise healthy youth. There is now evidence that children and adolescents with primary hypertension may also have cardiac and vascular injury due to the hypertension,” Dr. Falkner told this news organization.
“If not identified and treated, the condition can progress to hypertension in young adulthood with heightened risk of premature cardiovascular events,” Dr. Falkner said.
The writing group said “primordial prevention” is an important public health goal because a population with lower BP will have fewer comorbidities related to hypertension and CVD.
Modifiable risk factors for primary hypertension in childhood include obesity, physical inactivity and poor diet/nutrition, disturbed sleep patterns, and environmental stress.
A healthy lifestyle in childhood – including eating healthy food, encouraging physical activity that leads to improved physical fitness and healthy sleep, and avoiding the development of obesity – may help mitigate the risk of hypertension in childhood, the writing group noted.
Looking ahead, they said efforts to improve recognition and diagnosis of high BP in children, as well as clinical trials to evaluate medical treatment and recommend public health initiatives, are all vital to combat rising rates of primary hypertension in children.
This scientific statement was prepared by the volunteer writing group on behalf of the American Heart Association’s Council on Hypertension, the Council on Lifelong Congenital Heart Disease and Heart Health in the Young, the Council on Kidney in Cardiovascular Disease, the Council on Lifestyle and Cardiometabolic Health, and the Council on Cardiovascular and Stroke Nursing.
A version of this article first appeared on Medscape.com.
FROM HYPERTENSION
Specific brain damage links hypertension to cognitive impairment
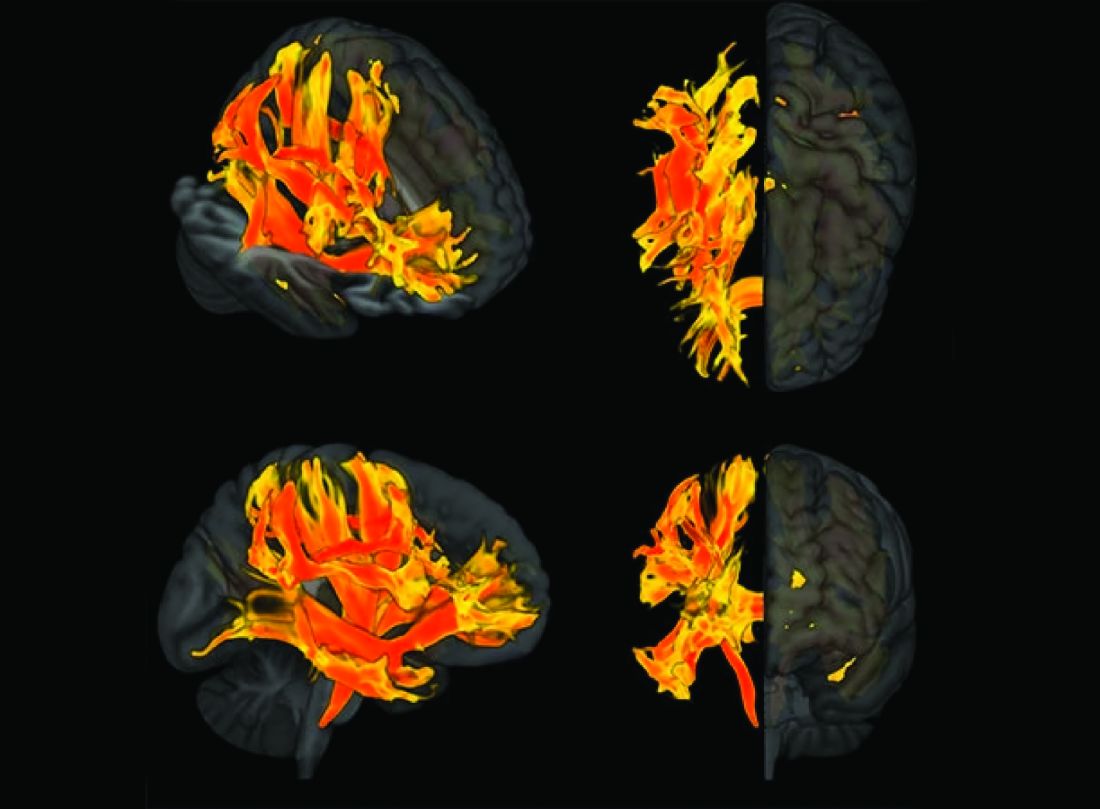
Researchers have identified specific regions of the brain that appear to be damaged by high blood pressure. The finding may explain the link between hypertension and cognitive impairment.
They used genetic information from genome-wide association studies (GWASs) and MRI scans of the brain to study the relationship between hypertension, changes in brain structures, and cognitive impairment. Using Mendelian randomization techniques, they identified nine brain structures related to cognitive impairment that are affected by blood pressure.
“We knew before that raised blood pressure was related to changes in the brain, but our research has narrowed down the changes to those that appear to be potentially causally related to cognitive impairment,” senior author Tomasz Guzik, professor of cardiovascular medicine, at the University of Edinburgh and of the Jagiellonian University, Krakow, Poland, told this news organization.
“Our study confirms a potentially causal relationship between raised blood pressure and cognitive impairment, emphasizing the importance of preventing and treating hypertension,” Prof. Guzik noted.
“But it also identifies the brain culprits of this relationship,” he added.
In the future, it may be possible to assess these nine brain structures in people with high blood pressure to identify those at increased risk of developing cognitive impairment, he said. “These patients may need more intensive care for their blood pressure. We can also investigate these brain structures for potential signaling pathways and molecular changes to see if we can find new targets for treatment to prevent cognitive impairment.”
For this report, the investigators married together different research datasets to identify brain structures potentially responsible for the effects of blood pressure on cognitive function, using results from previous GWASs and observational data from 39,000 people in the UK Biobank registry for whom brain MRI data were available.
First, they mapped brain structures potentially influenced by blood pressure in midlife using MRI scans from people in the UK Biobank registry. Then they examined the relationship between blood pressure and cognitive function in the UK Biobank registry. Next, of the brain structures affected by blood pressure, they identified those that are causally linked to cognitive impairment.
This was possible thanks to genetic markers coding for increased blood pressure, brain structure imaging phenotypes, and those coding for cognitive impairment that could be used in Mendelian randomization studies.
“We looked at 3935 brain magnetic resonance imaging–derived phenotypes in the brain and cognitive function defined by fluid intelligence score to identify genetically predicted causal relationships,” Prof. Guzik said.
They identified 200 brain structures that were causally affected by systolic blood pressure. Of these, nine were also causally related to cognitive impairment. The results were validated in a second prospective cohort of patients with hypertension.
“Some of these structures, including putamen and the white matter regions spanning between the anterior corona radiata, anterior thalamic radiation, and anterior limb of the internal capsule, may represent the target brain regions at which systolic blood pressure acts on cognitive function,” the authors comment.
In an accompanying editorial, Ernesto Schiffrin, MD, and James Engert, PhD, McGill University, Montreal, say that further mechanistic studies of the effects of blood pressure on cognitive function are required to determine precise causal pathways and the roles of relevant brain regions.
“Eventually, biomarkers could be developed to inform antihypertensive trials. Whether clinical trials targeting the specific brain structures will be feasible or if specific antihypertensives could be found that target specific structures remains to be demonstrated,” they write.
“Thus, these new studies could lead to an understanding of the signaling pathways that explain how these structures relate vascular damage to cognitive impairment in hypertension, and contribute to the development of novel interventions to more successfully address the scourge of cognitive decline and dementia in the future,” the editorialists conclude.
The study was funded by the European Research Council, the British Heart Foundation, and the Italian Ministry of Health.
A version of this article first appeared on Medscape.com.
AHA, ACC push supervised exercise training for HFpEF
A statement released by the American Heart Association and the American College of Cardiology advocates use of supervised exercise training in patients with heart failure with preserved ejection fraction (HFpEF), as well as coverage for these services by third-party payers.
The authors hope to boost the stature of supervised exercise training (SET) in HFpEF among practitioners and show Medicare and insurers that it deserves reimbursement. Currently, they noted, clinicians tend to recognize exercise as therapy more in HF with reduced ejection fraction (HFrEF). And Medicare covers exercise training within broader cardiac rehabilitation programs for patients with HFrEF but not HFpEF.
Yet exercise has been broadly effective in HFpEF clinical trials, as outlined in the document. And there are good mechanistic reasons to believe that patients with the disorder can gain as much or more from SET than those with HFrEF.
“The signals for improvement from exercise training, in symptoms and objective measures of exercise capacity, are considerably larger for HFpEF than for HFrEF,” Dalane W. Kitzman, MD, Wake Forest University, Winston-Salem, N.C., said in an interview.
So, it’s a bit of a paradox that clinicians don’t prescribe it as often in HFpEF, probably because of the lack of reimbursement but also from less “awareness” and understanding of the disease itself, he proposed.
Dr. Kitzman is senior author on the statement sponsored by the AHA and the ACC. It was published in the societies’ flagship journals Circulation and the Journal of the American College of Cardiology. The statement was also endorsed by the Heart Failure Society of America, the American Association of Cardiovascular and Pulmonary Rehabilitation, and the American Association of Heart Failure Nurses.
Carefully chosen words
The statement makes its case in HFpEF specifically for SET rather than cardiac rehabilitation, the latter typically a comprehensive program that goes beyond exercise, Dr. Kitzman noted. And SET is closer to the exercise interventions used in the supportive HFpEF trials.
“Also, Medicare in recent years has approved something called ‘supervised exercise training’ for other disorders, such as peripheral artery disease.” So, the document specifies SET “to be fully aligned with the evidence base,” he said, as well as “align it with a type of treatment that Medicare has a precedent for approving for other disorders.”
Data and physiologic basis
Core features of the AHA/ACC statement is its review of HFpEF exercise physiology, survey of randomized trials supporting SET in the disease, and characterization of exercise as an especially suitable pleiotropic therapy.
Increasingly, “HFpEF is now accepted as a systemic disorder that affects and impacts all organs,” Dr. Kitzman observed. “With a systemic multiorgan disorder, it would make sense that a broad treatment like exercise might be just the right thing. We think that’s the reason that its benefits are really quite large in magnitude.”
The document notes that exercise seems “potentially well suited for the treatment of both the cardiac and, in particular, the extracardiac abnormalities that contribute to exercise intolerance in HFpEF.”
Its effects in the disorder are “anti-inflammatory, rheological, lipid lowering, antihypertensive, positive inotropic, positive lusitropic, negative chronotropic, vasodilation, diuretic, weight-reducing, hypoglycemic, hypnotic, and antidepressive,” the statement notes. It achieves them via multiple pathways involving the heart, lungs, vasculature and, notably, the skeletal muscles.
“It’s been widely overlooked that at least 50% of low exercise capacity and symptoms in HFpEF are due to skeletal muscle dysfunction,” said Dr. Kitzman, an authority on exercise physiology in heart failure.
“But we’ve spent about 95% of our attention trying to modify and understand the cardiac component.” Skeletal muscles, he said, “are not an innocent bystander. They’re part of the problem. And that’s why we should really spend more time focusing on them.”
Dr. Kitzman disclosed receiving consulting fees from Bayer, Medtronic, Corvia Medical, Boehringer Ingelheim, Keyto, Rivus, NovoNordisk, AstraZeneca, and Pfizer; holding stock in Gilead; and receiving grants to his institution from Bayer, Novo Nordisk, AstraZeneca, Rivus, and Pfizer.
A version of this article first appeared on Medscape.com.
Cancer risk elevated after stroke in younger people
In young people, stroke might be the first manifestation of an underlying cancer, according to the investigators, led by Jamie Verhoeven, MD, PhD, with the department of neurology, Radboud University Medical Centre, Nijmegen, the Netherlands.
The new study can be viewed as a “stepping stone for future studies investigating the usefulness of screening for cancer after stroke,” the researchers say.
The study was published online in JAMA Network Open.
Currently, the diagnostic workup for young people with stroke includes searching for rare clotting disorders, although screening for cancer is not regularly performed.
Some research suggests that stroke and cancer are linked, but the literature is limited. In prior studies among people of all ages, cancer incidence after stroke has been variable – from 1% to 5% at 1 year and from 11% to 30% after 10 years.
To the team’s knowledge, only two studies have described the incidence of cancer after stroke among younger patients. One put the risk at 0.5% for people aged 18-50 years in the first year after stroke; the other described a cumulative risk of 17.3% in the 10 years after stroke for patients aged 18-55 years.
Using Dutch data, Dr. Verhoeven and colleagues identified 27,616 young stroke patients (age, 15-49 years; median age, 45 years) and 362,782 older stroke patients (median age, 76 years).
The cumulative incidence of any new cancer at 10 years was 3.7% among the younger stroke patients and 8.5% among the older stroke patients.
The incidence of a new cancer after stroke among younger patients was higher among women than men, while the opposite was true for older stroke patients.
Compared with the general population, younger stroke patients had a more than 2.5-fold greater likelihood of being diagnosed with a new cancer in the first year after ischemic stroke (standardized incidence ratio, 2.6). The risk was highest for lung cancer (SIR, 6.9), followed by hematologic cancers (SIR, 5.2).
Compared with the general population, younger stroke patients had nearly a 5.5-fold greater likelihood of being diagnosed with a new cancer in the first year after intracerebral hemorrhage (SIR, 5.4), and the risk was highest for hematologic cancers (SIR, 14.2).
In younger patients, the cumulative incidence of any cancer decreased over the years but remained significantly higher for 8 years following a stroke.
For patients aged 50 years or older, the 1-year risk for any new cancer after either ischemic stroke or intracerebral hemorrhage was 1.2 times higher, compared with the general population.
“We typically think of occult cancer as being a cause of stroke in an older population, given that the incidence of cancer increases over time [but] what this study shows is that we probably do need to consider occult cancer as an underlying cause of stroke even in a younger population,” said Laura Gioia, MD, stroke neurologist at the University of Montreal, who was not involved in the research.
Dr. Verhoeven and colleagues conclude that their finding supports the hypothesis of a causal link between cancer and stroke. Given the timing between stroke and cancer diagnosis, cancer may have been present when the stroke occurred and possibly played a role in causing it, the authors note. However, conclusions on causal mechanisms cannot be drawn from the current study.
The question of whether young stroke patients should be screened for cancer is a tough one, Dr. Gioia noted. “Cancer represents a small percentage of causes of stroke. That means you would have to screen a lot of people with a benefit that is still uncertain for the moment,” Dr. Gioia said in an interview.
“I think we need to keep cancer in mind as a cause of stroke in our young patients, and that should probably guide our history-taking with the patient and consider imaging when it’s appropriate and when we think that there could be an underlying occult cancer,” Dr. Gioia suggested.
The study was funded in part through unrestricted funding by Stryker, Medtronic, and Cerenovus. Dr. Verhoeven and Dr. Gioia have disclosed no relevant financial relationships.
A version of this article first appeared on Medscape.com.
FROM JAMA NETWORK OPEN
Heart rate, cardiac phase influence perception of time
People’s perception of time is subjective and based not only on their emotional state but also on heartbeat and heart rate (HR), two new studies suggest.
Researchers studied young adults with an electrocardiogram (ECG), measuring electrical activity at millisecond resolution while participants listened to tones that varied in duration. Participants were asked to report whether certain tones were longer or shorter, in relation to others.
The researchers found that the momentary perception of time was not continuous but rather expanded or contracted with each heartbeat. When the heartbeat preceding a tone was shorter, participants regarded the tone as longer in duration; but when the preceding heartbeat was longer, the participants experienced the tone as shorter.
“Our findings suggest that there is a unique role that cardiac dynamics play in the momentary experience of time,” lead author Saeedah Sadeghi, MSc, a doctoral candidate in the department of psychology at Cornell University, Ithaca, N.Y., said in an interview.
The study was published online in Psychophysiology.
In a second study, published in the journal Current Biology, a separate team of researchers asked participants to judge whether a brief event – the presentation of a tone or an image – was shorter or longer than a reference duration. ECG was used to track systole and diastole when participants were presented with these events.
The researchers found that the durations were underestimated during systole and overestimated during diastole, suggesting that time seemed to “speed up” or “slow down,” based on cardiac contraction and relaxation. When participants rated the events as more arousing, their perceived durations contracted, even during diastole.
“In our new paper, we show that our heart shapes the perceived duration of events, so time passes quicker when the heart contracts but slower when the heart relaxes,” lead author Irena Arslanova, PhD, postdoctoral researcher in cognitive neuroscience, Royal Holloway University of London, told this news organization.
Temporal ‘wrinkles’
“Subjective time is malleable,” observed Ms. Sadeghi and colleagues in their report. “Rather than being a uniform dimension, perceived duration has ‘wrinkles,’ with certain intervals appearing to dilate or contract relative to objective time” – a phenomenon sometimes referred to as “distortion.”
“We have known that people aren’t always consistent in how they perceive time, and objective duration doesn’t always explain subjective perception of time,” Ms. Sadeghi said.
Although the potential role of the heart in the experience of time has been hypothesized, research into the heart-time connection has been limited, with previous studies focusing primarily on estimating the average cardiac measures on longer time scales over seconds to minutes.
The current study sought to investigate “the beat-by-beat fluctuations of the heart period on the experience of brief moments in time” because, compared with longer time scales, subsecond temporal perception “has different underlying mechanisms” and a subsecond stimulus can be a “small fraction of a heartbeat.”
To home in on this small fraction, the researchers studied 45 participants (aged 18-21), who listened to 210 tones ranging in duration from 80 ms (short) to 188 ms (long). The tones were linearly spaced at 18-ms increments (80, 98, 116, 134, 152, 170, 188).
Participants were asked to categorize each tone as “short” or “long.” All tones were randomly assigned to be synchronized either with the systolic or diastolic phase of the cardiac cycle (50% each). The tones were triggered by participants’ heartbeats.
In addition, participants engaged in a heartbeat-counting activity, in which they were asked not to touch their pulse but to count their heartbeats by tuning in to their bodily sensations at intervals of 25, 35, and 45 seconds.
‘Classical’ response
“Participants exhibited an increased heart period after tone onset, which returned to baseline following an average canonical bell shape,” the authors reported.
The researchers performed regression analyses to determine how, on average, the heart rate before the tone was related to perceived duration or how the amount of change after the tone was related to perceived duration.
They found that when the heart rate was higher before the tone, participants tended to be more accurate in their time perception. When the heartbeat preceding a tone was shorter, participants experienced the tone as longer; conversely, when the heartbeat was longer, they experienced the duration of the identical sound as shorter.
When participants focused their attention on the sounds, their heart rate was affected such that their orienting responses actually changed their heart rate and, in turn, their temporal perception.
“The orienting response is classical,” Ms. Sadeghi said. “When you attend to something unpredictable or novel, the act of orienting attention decreases the HR.”
She explained that the heartbeats are “noise to the brain.” When people need to perceive external events, “a decrease in HR facilitates the intake of things from outside and facilitates sensory intake.”
A lower HR “makes it easier for the person to take in the tone and perceive it, so it feels as though they perceive more of the tone and the duration seems longer – similarly, when the HR decreases.”
It is unknown whether this is a causal relationship, she cautioned, “but it seems as though the decrease in HR somehow makes it easier to ‘get’ more of the tone, which then appears to have longer duration.”
Bidirectional relationship
“We know that experienced time can be distorted,” said Dr. Arslanova. “Time flies by when we’re busy or having fun but drags on when we’re bored or waiting for something, yet we still don’t know how the brain gives rise to such elastic experience of time.”
The brain controls the heart in response to the information the heart provides about the state of the body, she noted, “but we have begun to see more research showing that the heart–brain relationship is bidirectional.”
This means that the heart plays a role in shaping “how we process information and experience emotions.” In this analysis, Dr. Arslanova and colleagues “wanted to study whether the heart also shapes the experience of time.”
To do so, they conducted two experiments.
In the first, participants (n = 28) were presented with brief events during systole or during diastole. The events took the form of an emotionally neutral visual shape or auditory tone, shown for durations of 200 to 400 ms.
Participants were asked whether these events were of longer or shorter duration, compared with a reference duration.
The researchers found significant main effect of cardiac phase systole (F(1,27) = 8.1, P =.01), with stimuli presented at diastole regarded, on average, as 7 ms longer than those presented at systole.
They also found a significant main effect of modality (F(1,27) = 5.7, P = .02), with tones judged, on average, as 13 ms longer than visual stimuli.
“This means that time ‘sped up’ during the heart’s contraction and ‘slowed down’ during the heart’s relaxation,” Dr. Arslanova said.
The effect of cardiac phase on duration perception was independent of changes in HR, the authors noted.
In the second experiment, participants performed a similar task, but this time, it involved the images of faces containing emotional expressions. The researchers again observed a similar pattern of time appearing to speed up during systole and slow down during diastole, with stimuli present at diastole regarded as being an average 9 ms longer than those presented at systole.
These opposing effects of systole and diastole on time perception were present only for low and average arousal ratings (b = 14.4 [SE 3.2], P < .001 and b = 9.2 [2.3], P <.001, respectively). However, this effect disappeared when arousal ratings increased (b = 4.1 [3.2] P =.21).
“Interestingly, when participants rated the events as more arousing, their perceived durations contracted, even during the heart’s relaxation,” Dr. Arslanova observed. “This means that in a nonaroused state, the two cardiac phases pull the experienced duration in opposite directions – time contracts, then expands.”
The findings “also predict that increasing HR would speed up passing time, making events seem shorter, because there will be a stronger influence from the heart’s contractions,” she said.
She described the relationship between time perception and emotion as complex, noting that the findings are important because they show “that the way we experience time cannot be examined in isolation from our body,” she said.
Converging evidence
Martin Wiener, PhD, assistant professor, George Mason University, Fairfax, Va., said both papers “provide converging evidence on the role of the heart in our perception of time.”
Together, “the results share that our sense of time – that is, our incoming sensory perception of the present ‘moment’ – is adjusted or ‘gated’ by both our HR and cardiac phase,” said Dr. Wiener, executive director of the Timing Research Forum.
The studies “provide a link between the body and the brain, in terms of our perception, and that we cannot study one without the context of the other,” said Dr. Wiener, who was not involved with the current study.
“All of this opens up a new avenue of research, and so it is very exciting to see,” Dr. Wiener stated.
No source of funding was listed for the study by Ms. Sadeghi and coauthors. They declared no relevant financial relationships.
Dr. Arslanova and coauthors declared no competing interests. Senior author Manos Tsakiris, PhD, receives funding from the European Research Council Consolidator Grant. Dr. Wiener declared no relevant financial relationships.
A version of this article first appeared on Medscape.com.
FROM PSYCHOPHYSIOLOGY
Analysis identifies gaps in CV risk screening of patients with psoriasis
Just , according to an analysis of 10 years of national survey data.
From 2007 to 2016, national screening rates for four CV risk factors at 14.8 million psoriasis-related visits to dermatology providers were 11% (body-mass index), 7.4% (blood pressure), 2.9% (cholesterol), and 1.7% (glucose). Data from the National Ambulatory Medical Care Survey showed that at least one of the four factors was screened at 16% of dermatology visits, said William B. Song, BS, of the department of dermatology, University of Pennsylvania, Philadelphia, and associates.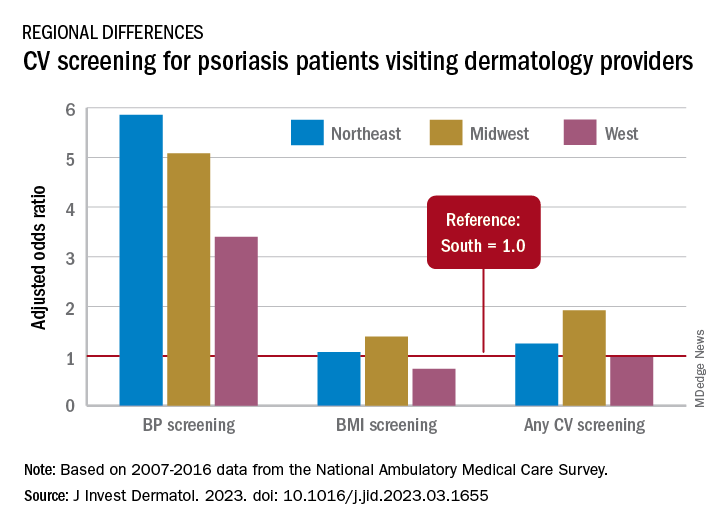
The main focus of their study, however, was regional differences. “CV risk factor screening by dermatology providers for patients with psoriasis is low across all regions of the United States and lowest in the South, the region that experiences the highest CVD burden in the United States,” they wrote in a letter to the editor.
Compared with the South, the adjusted odds of any CV screening were 0.98 in the West, 1.25 in the Northeast, and 1.92 in the Midwest. Blood pressure screening was significantly higher in all three regions, compared with the South, while BMI screening was actually lower in the West (0.74), the investigators reported. Odds ratios were not available for cholesterol and glucose screening because of sample size limitations.
The regional variation in screening rates “is not explained by patient demographics or disease severity,” they noted, adding that 2.8 million visits with BP screening would have been added over the 10-year study period “if providers in the South screened patients with psoriasis for high blood pressure at the same rate as providers in the Northeast.”
Guidelines published in 2019 by the American Academy of Dermatology and the National Psoriasis Foundation – which were cowritten by Joel M. Gelfand, MD, senior author of the current study – noted that dermatologists “play an important role in evidence-based screening of CV risk factors in patients with psoriasis,” the investigators wrote. But the regional variations suggest “that some regions experience barriers to appropriate screening or challenges in adhering to guidelines for managing psoriasis and CV risk.”
While the lack of data from after 2016 is one of the study limitations, they added, “continued efforts to develop effective interventions to improve CV screening and care for people with psoriasis in all regions of the U.S. are needed to more effectively address the burden of CV disease experienced by people with psoriasis.”
The study was partly funded by the National Psoriasis Foundation. Three of the seven investigators disclosed earnings from private companies in the form of consultant fees, research support, and honoraria. Dr. Gelfand is a deputy editor for the Journal of Investigative Dermatology.
FROM THE JOURNAL OF INVESTIGATIVE DERMATOLOGY
Some diets better than others for heart protection
In an analysis of randomized trials, the Mediterranean diet and low-fat diets were linked to reduced risks of all-cause mortality and nonfatal MI over 3 years in adults at increased risk for cardiovascular disease (CVD), while the Mediterranean diet also showed lower risk of stroke.
Five other popular diets appeared to have little or no benefit with regard to these outcomes.
“These findings with data presentations are extremely important for patients who are skeptical about the desirability of diet change,” wrote the authors, led by Giorgio Karam, a medical student at the University of Manitoba, Winnipeg.
The results were published online in The BMJ.
Dietary guidelines recommend various diets along with physical activity or other cointerventions for adults at increased CVD risk, but they are often based on low-certainty evidence from nonrandomized studies and on surrogate outcomes.
Several meta-analyses of randomized controlled trials with mortality and major CV outcomes have reported benefits of some dietary programs, but those studies did not use network meta-analysis to give absolute estimates and certainty of estimates for adults at intermediate and high risk, the authors noted.
For this study, Mr. Karam and colleagues conducted a comprehensive systematic review and network meta-analysis in which they compared the effects of seven popular structured diets on mortality and CVD events for adults with CVD or CVD risk factors.
The seven diet plans were the Mediterranean, low fat, very low fat, modified fat, combined low fat and low sodium, Ornish, and Pritikin diets. Data for the analysis came from 40 randomized controlled trials that involved 35,548 participants who were followed for an average of 3 years.
There was evidence of “moderate” certainty that the Mediterranean diet was superior to minimal intervention for all-cause mortality (odds ratio [OR], 0.72), CV mortality (OR, 0.55), stroke (OR, 0.65), and nonfatal MI (OR, 0.48).
On an absolute basis (per 1,000 over 5 years), the Mediterranean diet let to 17 fewer deaths from any cause, 13 fewer CV deaths, seven fewer strokes, and 17 fewer nonfatal MIs.
There was evidence of moderate certainty that a low-fat diet was superior to minimal intervention for prevention of all-cause mortality (OR, 0.84; nine fewer deaths per 1,000) and nonfatal MI (OR, 0.77; seven fewer deaths per 1,000). The low-fat diet had little to no benefit with regard to stroke reduction.
The Mediterranean diet was not “convincingly” superior to a low-fat diet for mortality or nonfatal MI, the authors noted.
The absolute effects for the Mediterranean and low-fat diets were more pronounced in adults at high CVD risk. With the Mediterranean diet, there were 36 fewer all-cause deaths and 39 fewer CV deaths per 1,000 over 5 years.
The five other dietary programs generally had “little or no benefit” compared with minimal intervention. The evidence was of low to moderate certainty.
The studies did not provide enough data to gauge the impact of the diets on angina, heart failure, peripheral vascular events, and atrial fibrillation.
The researchers say that strengths of their analysis include a comprehensive review and thorough literature search and a rigorous assessment of study bias. In addition, the researchers adhered to recognized GRADE methods for assessing the certainty of estimates.
Limitations of their work include not being able to measure adherence to dietary programs and the possibility that some of the benefits may have been due to other factors, such as drug treatment and support for quitting smoking.
The study had no specific funding. The authors have disclosed no relevant financial relationships.
A version of this article originally appeared on Medscape.com.
New antiobesity drugs will benefit many. Is that bad?
where some economists opined that their coverage would be disastrous for Medicare.
Among their concerns? The drugs need to be taken long term (just like drugs for any other chronic condition). The new drugs are more expensive than the old drugs (just like new drugs for any other chronic condition). Lots of people will want to take them (just like highly effective drugs for any other chronic condition that has a significant quality-of-life or clinical impact). The U.K. recommended that they be covered only for 2 years (unlike drugs for any other chronic condition). And the Institute for Clinical and Economic Review (ICER) on which they lean heavily decided that $13,618 annually was too expensive for a medication that leads to sustained 15%-20% weight losses and those losses’ consequential benefits.
As a clinician working with patients who sustain those levels of weight loss, I find that conclusion confusing. Whether by way of lifestyle alone, or more often by way of lifestyle efforts plus medication or lifestyle efforts plus surgery, the benefits reported and seen with 15%-20% weight losses are almost uniformly huge. Patients are regularly seen discontinuing or reducing the dosage of multiple medications as a result of improvements to multiple weight-responsive comorbidities, and they also report objective benefits to mood, sleep, mobility, pain, and energy. Losing that much weight changes lives. Not to mention the impact that that degree of loss has on the primary prevention of so many diseases, including plausible reductions in many common cancers – reductions that have been shown to occur after surgery-related weight losses and for which there’s no plausible reason to imagine that they wouldn’t occur with pharmaceutical-related losses.
Are those discussions found in the NEJM op-ed or in the ICER report? Well, yes, sort of. However, in the NEJM op-ed, the word “prevention” isn’t used once, and unlike with oral hypoglycemics or antihypertensives, the authors state that with antiobesity medications, additional research is needed to determine whether medication-induced changes to A1c, blood pressure, and waist circumference would have clinical benefits: “Antiobesity medications have been shown to improve the surrogate end points of weight, glycated hemoglobin levels, systolic blood pressure, and waist circumference. Long-term studies are needed, however, to clarify how medication-induced changes in these surrogate markers translate to health outcomes.”
Primary prevention is mentioned in the ICER review, but in the “limitations” section where the authors explain that they didn’t include it in their modeling: “The long-term benefits of preventing other comorbidities including cancer, chronic kidney disease, osteoarthritis, and sleep apnea were not explicitly modeled in the base case.”
And they pretended that the impact on existing weight-responsive comorbidities mostly didn’t exist, too: “To limit the complexity of the cost-effectiveness model and to prevent double-counting of treatment benefits, we limited the long-term effects of treatments for weight management to cardiovascular risk and delays in the onset and/or diagnosis of diabetes mellitus.”
As far as cardiovascular disease (CVD) benefits go, you might have thought that it would be a slam dunk on that basis alone, at least according to a recent simple back-of-the-envelope math exercise presented at a recent American College of Cardiology conference, which applied the semaglutide treatment group weight changes in the STEP 1 trial to estimate the population impact on weight and obesity in 30- to 74-year-olds without prior CVD, and estimated 10-year CVD risks utilizing the BMI-based Framingham CVD risk scores. By their accounting, semaglutide treatment in eligible American patients has the potential to prevent over 1.6 million CVD events over 10 years.
Finally, even putting aside ICER’s admittedly and exceedingly narrow base case, what lifestyle-alone studies could ICER possibly be comparing with drug efficacy? And what does “alone” mean? Does “alone” mean with a months- or years long interprofessional behavioral program? Does “alone” mean by way of diet books? Does “alone” mean by way of simply “moving more and eating less”? I’m not aware of robust studies demonstrating any long-term meaningful, predictable, reproducible, durable weight loss outcomes for any lifestyle-only approach, intensive or otherwise.
It’s difficult for me to imagine a situation in which a drug other than an antiobesity drug would be found to have too many benefits to include in your cost-effectiveness analysis but where you’d be comfortable to run that analysis anyhow, and then come out against the drug’s recommendation and fearmonger about its use.
But then again, systemic weight bias is a hell of a drug.
Dr. Freedhoff is associate professor, department of family medicine, University of Ottawa, and medical director, Bariatric Medical Institute, Ottawa. He disclosed ties with Constant Health and Novo Nordisk, and has shared opinions via Weighty Matters and social media.
A version of this article originally appeared on Medscape.com.
Subclinical CAD by CT predicts MI risk, with or without stenoses
About half of middle-aged adults in the community without cardiovascular (CV) symptoms have coronary atherosclerosis by CT angiography (CTA) that puts them at substantial risk for myocardial infarction (MI), suggests a prospective cohort study.
The 10% of participants who had subclinical disease considered obstructive at CTA showed a ninefold increased risk for MI over several years. Obstructive disease seemed to elevate risk more than subclinical disease that wasn’t obstructive but still considered extensive within the coronary arteries.
The findings, based on a Copenhagen General Population Study cohort, are new for CTA but consistent with research based on coronary artery calcium (CAC) scores and other ways to assess CV risk, say researchers.
Although all participants underwent CTA, such imaging isn’t used in the general population for atherosclerosis screening. But the findings may have implications for “opportunistic screening” for subclinical coronary disease at CTA conducted for other reasons, notes the study’s report, published online in the Annals of Internal Medicine.
“Identification of luminal obstructive or extensive subclinical coronary atherosclerosis” could potentially provide “clinically relevant, incremental risk assessment” in nonischemic patients who undergo cardiac CT or electrocardiogram-gated chest CT before procedures such as arrhythmia ablation or valve repair, it states.
Such patients found with subclinical coronary atherosclerosis might potentially “benefit from referral to intensified cardiovascular primary prevention therapy,” write the authors, led by Andreas Fuchs, MD, PhD, Copenhagen University Hospital-Rigshospitalet.
The group acknowledges the findings may not entirely apply to a non-Danish population.
A screening role for CTA?
Whether CTA has a role to play in adults without symptoms “is a big, open question in the field right now,” observed Ron Blankstein, MD, not associated with the current analysis, for this news organization.
Most population studies of CV risk prediction, such as MESA, have looked at CAC scores, not CTA, and have shown that “the more plaque individuals have, the higher the risk.” The current findings are similar but novel in coming from coronary CTA in a large asymptomatic community population, said Dr. Blankstein, who is director of cardiac CT at Brigham and Women’s Hospital, Boston.
“It’s possible that patients who have obstructive plaque in general tend to have a larger amount of plaque as well,” he said. So, while the study suggests that “the more plaque individuals have, the worse their overall risk,” it also shows that the risk “is enhanced even more if they have obstructive disease.”
The Danish cohort analysis “provides a unique opportunity to study the contemporary natural history of coronary artery disease in the absence of intervention,” notes an accompanying editorial.
For example, both patients and clinicians were blinded to CTA results, and CV preventive therapies weren’t common, observe Michael McDermott, MBChB, and David E. Newby, DM, PhD, of the BHF Centre for Cardiovascular Science, University of Edinburgh.
The analysis suggests that subclinical coronary disease that is obstructive predicts MI risk more strongly than extensive coronary disease, they note, and may be present in two-thirds of MI patients. “This contrasts with symptomatic populations, where nonobstructive disease accounts for most future myocardial infarctions, presumably from plaque rupture.”
It also points to “strong associations between nonobstructive extensive disease and adverse plaque characteristics,” write Dr. McDermott and Dr. Newby. “This underscores the major importance of plaque burden” for the prediction of coronary events.
Graded risk
The analysis included 9,533 persons aged 40 and older without known ischemic heart disease or symptoms with available CTA assessments.
Obstructive disease, defined as presence of a luminal stenosis of at least 50%, was seen in 10% and nonobstructive disease in 36% of the total cohort, the report states.
Disease occupying more than one-third of the coronary tree was considered extensive and less than one-third of the coronaries nonextensive, occurring in 10.5% and 35.8% of the cohort, respectively.
There were 71 MIs and 193 deaths over a median of 3.5 years. The adjusted relative risk for MI, compared with those without coronary atherosclerosis, was:
- 7.65 (95% confidence interval, 3.53-16.57) overall in patients with extensive disease.
- 8.28 (95% CI, 3.75-18.32) in those with obstructive but nonextensive disease.
- 9.19 (95% CI, 4.49-18.82) overall in those with obstructive disease.
- 12.48 (95% CI, 5.50-28.12) in those with or obstructive and extensive disease.
The adjusted RR for the composite of death or MI was also elevated in persons with extensive disease:
- 2.70 (95% CI, 1.72-4.25) in those with extensive but nonobstructive disease.
- 3.15 (95% CI, 2.05-4.83) in those with extensive and obstructive disease.
“It’s one thing to show that the more plaque, the higher the risk,” Dr. Blankstein said. But “does the information ultimately lead to better outcomes? Do patients have fewer MIs or fewer deaths?” Several ongoing randomized trials are exploring these questions.
They include DANE-HEART (Computed Tomography Coronary Angiography for Primary Prevention), projected to enroll about 6,000 participants from the Copenhagen General Population Study cohort who have at least one CV risk factor, and SCOT-HEART 2 (second Computed Tomography Coronary Angiography for the Prevention of Myocardial Infarction), enrolling a similar cohort in Scotland.
The study was supported by grants from AP Møller og Hustru Chastine Mc-Kinney Møllers Fond, the Research Council of Rigshospitalet, and Danish Heart Foundation. Dr. Fuchs reports no relevant financial relationships. Disclosures for the other authors can be found here. Dr. Blankstein recently disclosed serving as a consultant to Amgen, Caristo Diagnostics, Novartis, and Silence Therapeutics. Disclosures for Dr. McDermott and Dr. Newby, who are SCOT-HEART 2 investigators, can be found here.
A version of this article originally appeared on Medscape.com.
‘Excess’ deaths surging, but why?
This transcript has been edited for clarity.
“Excess deaths.” You’ve heard the phrase countless times by now. It is one of the myriad of previously esoteric epidemiology terms that the pandemic brought squarely into the zeitgeist.
As a sort of standard candle of the performance of a state or a region or a country in terms of health care, it has a lot of utility – if for nothing more than Monday-morning quarterbacking. But this week, I want to dig in on the concept a bit because, according to a new study, the excess death gap between the United States and Western Europe has never been higher.
You might imagine that the best way to figure this out is for some group of intelligent people to review each death and decide, somehow, whether it was expected or not. But aside from being impractical, this would end up being somewhat subjective. That older person who died from pneumonia – was that an expected death? Could it have been avoided?
Rather, the calculation of excess mortality relies on large numbers and statistical inference to compare an expected number of deaths with those that are observed.
The difference is excess mortality, even if you can never be sure whether any particular death was expected or not.
As always, however, the devil is in the details. What data do you use to define the expected number of deaths?
There are options here. Probably the most straightforward analysis uses past data from the country of interest. You look at annual deaths over some historical period of time and compare those numbers with the rates today. Two issues need to be accounted for here: population growth – a larger population will have more deaths, so you need to adjust the historical population with current levels, and demographic shifts – an older or more male population will have more deaths, so you need to adjust for that as well.
But provided you take care of those factors, you can estimate fairly well how many deaths you can expect to see in any given period of time.
Still, you should see right away that excess mortality is a relative concept. If you think that, just perhaps, the United States has some systematic failure to deliver care that has been stable and persistent over time, you wouldn’t capture that failing in an excess mortality calculation that uses U.S. historical data as the baseline.
The best way to get around that is to use data from other countries, and that’s just what this article – a rare single-author piece by Patrick Heuveline – does, calculating excess deaths in the United States by standardizing our mortality rates to the five largest Western European countries: the United Kingdom, France, Germany, Italy, and Spain.
Controlling for the differences in the demographics of that European population, here is the expected number of deaths in the United States over the past 5 years.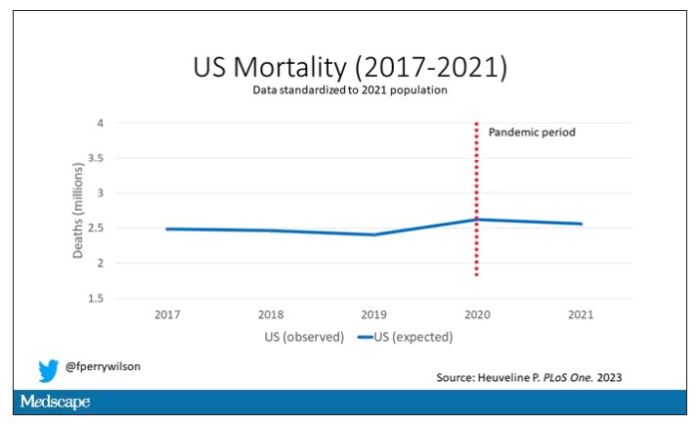
Note that there is a small uptick in expected deaths in 2020, reflecting the pandemic, which returns to baseline levels by 2021. This is because that’s what happened in Europe; by 2021, the excess mortality due to COVID-19 was quite low.
Here are the actual deaths in the US during that time.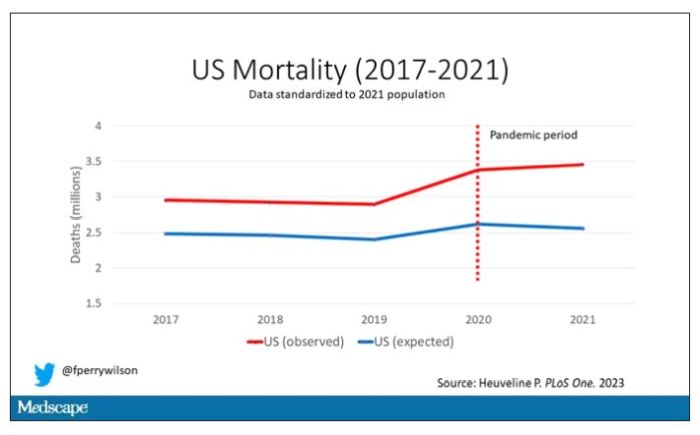
Highlighted here in green, then, is the excess mortality over time in the United States.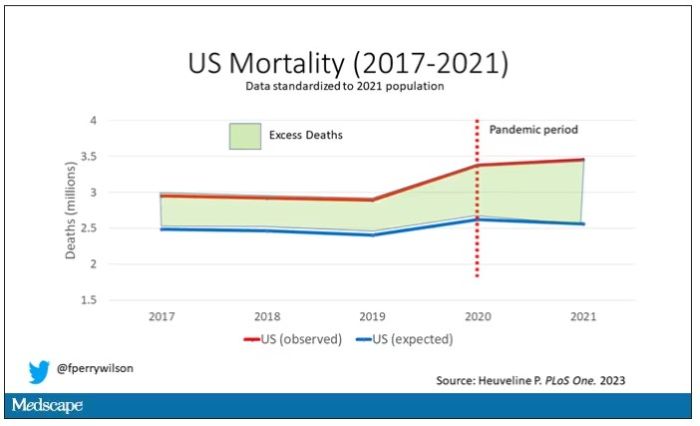
There are some fascinating and concerning findings here.
First of all, you can see that even before the pandemic, the United States has an excess mortality problem. This is not entirely a surprise; we’ve known that so-called “deaths of despair,” those due to alcohol abuse, drug overdoses, and suicide, are at an all-time high and tend to affect a “prime of life” population that would not otherwise be expected to die. In fact, fully 50% of the excess deaths in the United States occur in those between ages 15 and 64.
Excess deaths are also a concerning percentage of total deaths. In 2017, 17% of total deaths in the United States could be considered “excess.” In 2021, that number had doubled to 35%. Nearly 900,000 individuals in the United States died in 2021 who perhaps didn’t need to.
The obvious culprit to blame here is COVID, but COVID-associated excess deaths only explain about 50% of the excess we see in 2021. The rest reflect something even more concerning: a worsening of the failures of the past, perhaps exacerbated by the pandemic but not due to the virus itself.
Of course, we started this discussion acknowledging that the calculation of excess mortality is exquisitely dependent on how you model the expected number of deaths, and I’m sure some will take issue with the use of European numbers when applied to Americans. After all, Europe has, by and large, a robust public health service, socialized medicine, and healthcare that does not run the risk of bankrupting its citizens. How can we compare our outcomes to a place like that?
How indeed.
F. Perry Wilson, MD, MSCE, is an associate professor of medicine and director of Yale University’s Clinical and Translational Research Accelerator in New Haven,Conn. He reported no relevant conflicts of interest.
A version of this article originally appeared on Medscape.com.