User login
Bringing you the latest news, research and reviews, exclusive interviews, podcasts, quizzes, and more.
div[contains(@class, 'header__large-screen')]
div[contains(@class, 'read-next-article')]
div[contains(@class, 'main-prefix')]
div[contains(@class, 'nav-primary')]
nav[contains(@class, 'nav-primary')]
section[contains(@class, 'footer-nav-section-wrapper')]
footer[@id='footer']
section[contains(@class, 'nav-hidden')]
div[contains(@class, 'ce-card-content')]
nav[contains(@class, 'nav-ce-stack')]
div[contains(@class, 'view-medstat-quiz-listing-panes')]
div[contains(@class, 'pane-article-sidebar-latest-news')]
Cancer risk elevated after stroke in younger people
In young people, stroke might be the first manifestation of an underlying cancer, according to the investigators, led by Jamie Verhoeven, MD, PhD, with the department of neurology, Radboud University Medical Centre, Nijmegen, the Netherlands.
The new study can be viewed as a “stepping stone for future studies investigating the usefulness of screening for cancer after stroke,” the researchers say.
The study was published online in JAMA Network Open.
Currently, the diagnostic workup for young people with stroke includes searching for rare clotting disorders, although screening for cancer is not regularly performed.
Some research suggests that stroke and cancer are linked, but the literature is limited. In prior studies among people of all ages, cancer incidence after stroke has been variable – from 1% to 5% at 1 year and from 11% to 30% after 10 years.
To the team’s knowledge, only two studies have described the incidence of cancer after stroke among younger patients. One put the risk at 0.5% for people aged 18-50 years in the first year after stroke; the other described a cumulative risk of 17.3% in the 10 years after stroke for patients aged 18-55 years.
Using Dutch data, Dr. Verhoeven and colleagues identified 27,616 young stroke patients (age, 15-49 years; median age, 45 years) and 362,782 older stroke patients (median age, 76 years).
The cumulative incidence of any new cancer at 10 years was 3.7% among the younger stroke patients and 8.5% among the older stroke patients.
The incidence of a new cancer after stroke among younger patients was higher among women than men, while the opposite was true for older stroke patients.
Compared with the general population, younger stroke patients had a more than 2.5-fold greater likelihood of being diagnosed with a new cancer in the first year after ischemic stroke (standardized incidence ratio, 2.6). The risk was highest for lung cancer (SIR, 6.9), followed by hematologic cancers (SIR, 5.2).
Compared with the general population, younger stroke patients had nearly a 5.5-fold greater likelihood of being diagnosed with a new cancer in the first year after intracerebral hemorrhage (SIR, 5.4), and the risk was highest for hematologic cancers (SIR, 14.2).
In younger patients, the cumulative incidence of any cancer decreased over the years but remained significantly higher for 8 years following a stroke.
For patients aged 50 years or older, the 1-year risk for any new cancer after either ischemic stroke or intracerebral hemorrhage was 1.2 times higher, compared with the general population.
“We typically think of occult cancer as being a cause of stroke in an older population, given that the incidence of cancer increases over time [but] what this study shows is that we probably do need to consider occult cancer as an underlying cause of stroke even in a younger population,” said Laura Gioia, MD, stroke neurologist at the University of Montreal, who was not involved in the research.
Dr. Verhoeven and colleagues conclude that their finding supports the hypothesis of a causal link between cancer and stroke. Given the timing between stroke and cancer diagnosis, cancer may have been present when the stroke occurred and possibly played a role in causing it, the authors note. However, conclusions on causal mechanisms cannot be drawn from the current study.
The question of whether young stroke patients should be screened for cancer is a tough one, Dr. Gioia noted. “Cancer represents a small percentage of causes of stroke. That means you would have to screen a lot of people with a benefit that is still uncertain for the moment,” Dr. Gioia said in an interview.
“I think we need to keep cancer in mind as a cause of stroke in our young patients, and that should probably guide our history-taking with the patient and consider imaging when it’s appropriate and when we think that there could be an underlying occult cancer,” Dr. Gioia suggested.
The study was funded in part through unrestricted funding by Stryker, Medtronic, and Cerenovus. Dr. Verhoeven and Dr. Gioia have disclosed no relevant financial relationships.
A version of this article first appeared on Medscape.com.
FROM JAMA NETWORK OPEN
Heart rate, cardiac phase influence perception of time
People’s perception of time is subjective and based not only on their emotional state but also on heartbeat and heart rate (HR), two new studies suggest.
Researchers studied young adults with an electrocardiogram (ECG), measuring electrical activity at millisecond resolution while participants listened to tones that varied in duration. Participants were asked to report whether certain tones were longer or shorter, in relation to others.
The researchers found that the momentary perception of time was not continuous but rather expanded or contracted with each heartbeat. When the heartbeat preceding a tone was shorter, participants regarded the tone as longer in duration; but when the preceding heartbeat was longer, the participants experienced the tone as shorter.
“Our findings suggest that there is a unique role that cardiac dynamics play in the momentary experience of time,” lead author Saeedah Sadeghi, MSc, a doctoral candidate in the department of psychology at Cornell University, Ithaca, N.Y., said in an interview.
The study was published online in Psychophysiology.
In a second study, published in the journal Current Biology, a separate team of researchers asked participants to judge whether a brief event – the presentation of a tone or an image – was shorter or longer than a reference duration. ECG was used to track systole and diastole when participants were presented with these events.
The researchers found that the durations were underestimated during systole and overestimated during diastole, suggesting that time seemed to “speed up” or “slow down,” based on cardiac contraction and relaxation. When participants rated the events as more arousing, their perceived durations contracted, even during diastole.
“In our new paper, we show that our heart shapes the perceived duration of events, so time passes quicker when the heart contracts but slower when the heart relaxes,” lead author Irena Arslanova, PhD, postdoctoral researcher in cognitive neuroscience, Royal Holloway University of London, told this news organization.
Temporal ‘wrinkles’
“Subjective time is malleable,” observed Ms. Sadeghi and colleagues in their report. “Rather than being a uniform dimension, perceived duration has ‘wrinkles,’ with certain intervals appearing to dilate or contract relative to objective time” – a phenomenon sometimes referred to as “distortion.”
“We have known that people aren’t always consistent in how they perceive time, and objective duration doesn’t always explain subjective perception of time,” Ms. Sadeghi said.
Although the potential role of the heart in the experience of time has been hypothesized, research into the heart-time connection has been limited, with previous studies focusing primarily on estimating the average cardiac measures on longer time scales over seconds to minutes.
The current study sought to investigate “the beat-by-beat fluctuations of the heart period on the experience of brief moments in time” because, compared with longer time scales, subsecond temporal perception “has different underlying mechanisms” and a subsecond stimulus can be a “small fraction of a heartbeat.”
To home in on this small fraction, the researchers studied 45 participants (aged 18-21), who listened to 210 tones ranging in duration from 80 ms (short) to 188 ms (long). The tones were linearly spaced at 18-ms increments (80, 98, 116, 134, 152, 170, 188).
Participants were asked to categorize each tone as “short” or “long.” All tones were randomly assigned to be synchronized either with the systolic or diastolic phase of the cardiac cycle (50% each). The tones were triggered by participants’ heartbeats.
In addition, participants engaged in a heartbeat-counting activity, in which they were asked not to touch their pulse but to count their heartbeats by tuning in to their bodily sensations at intervals of 25, 35, and 45 seconds.
‘Classical’ response
“Participants exhibited an increased heart period after tone onset, which returned to baseline following an average canonical bell shape,” the authors reported.
The researchers performed regression analyses to determine how, on average, the heart rate before the tone was related to perceived duration or how the amount of change after the tone was related to perceived duration.
They found that when the heart rate was higher before the tone, participants tended to be more accurate in their time perception. When the heartbeat preceding a tone was shorter, participants experienced the tone as longer; conversely, when the heartbeat was longer, they experienced the duration of the identical sound as shorter.
When participants focused their attention on the sounds, their heart rate was affected such that their orienting responses actually changed their heart rate and, in turn, their temporal perception.
“The orienting response is classical,” Ms. Sadeghi said. “When you attend to something unpredictable or novel, the act of orienting attention decreases the HR.”
She explained that the heartbeats are “noise to the brain.” When people need to perceive external events, “a decrease in HR facilitates the intake of things from outside and facilitates sensory intake.”
A lower HR “makes it easier for the person to take in the tone and perceive it, so it feels as though they perceive more of the tone and the duration seems longer – similarly, when the HR decreases.”
It is unknown whether this is a causal relationship, she cautioned, “but it seems as though the decrease in HR somehow makes it easier to ‘get’ more of the tone, which then appears to have longer duration.”
Bidirectional relationship
“We know that experienced time can be distorted,” said Dr. Arslanova. “Time flies by when we’re busy or having fun but drags on when we’re bored or waiting for something, yet we still don’t know how the brain gives rise to such elastic experience of time.”
The brain controls the heart in response to the information the heart provides about the state of the body, she noted, “but we have begun to see more research showing that the heart–brain relationship is bidirectional.”
This means that the heart plays a role in shaping “how we process information and experience emotions.” In this analysis, Dr. Arslanova and colleagues “wanted to study whether the heart also shapes the experience of time.”
To do so, they conducted two experiments.
In the first, participants (n = 28) were presented with brief events during systole or during diastole. The events took the form of an emotionally neutral visual shape or auditory tone, shown for durations of 200 to 400 ms.
Participants were asked whether these events were of longer or shorter duration, compared with a reference duration.
The researchers found significant main effect of cardiac phase systole (F(1,27) = 8.1, P =.01), with stimuli presented at diastole regarded, on average, as 7 ms longer than those presented at systole.
They also found a significant main effect of modality (F(1,27) = 5.7, P = .02), with tones judged, on average, as 13 ms longer than visual stimuli.
“This means that time ‘sped up’ during the heart’s contraction and ‘slowed down’ during the heart’s relaxation,” Dr. Arslanova said.
The effect of cardiac phase on duration perception was independent of changes in HR, the authors noted.
In the second experiment, participants performed a similar task, but this time, it involved the images of faces containing emotional expressions. The researchers again observed a similar pattern of time appearing to speed up during systole and slow down during diastole, with stimuli present at diastole regarded as being an average 9 ms longer than those presented at systole.
These opposing effects of systole and diastole on time perception were present only for low and average arousal ratings (b = 14.4 [SE 3.2], P < .001 and b = 9.2 [2.3], P <.001, respectively). However, this effect disappeared when arousal ratings increased (b = 4.1 [3.2] P =.21).
“Interestingly, when participants rated the events as more arousing, their perceived durations contracted, even during the heart’s relaxation,” Dr. Arslanova observed. “This means that in a nonaroused state, the two cardiac phases pull the experienced duration in opposite directions – time contracts, then expands.”
The findings “also predict that increasing HR would speed up passing time, making events seem shorter, because there will be a stronger influence from the heart’s contractions,” she said.
She described the relationship between time perception and emotion as complex, noting that the findings are important because they show “that the way we experience time cannot be examined in isolation from our body,” she said.
Converging evidence
Martin Wiener, PhD, assistant professor, George Mason University, Fairfax, Va., said both papers “provide converging evidence on the role of the heart in our perception of time.”
Together, “the results share that our sense of time – that is, our incoming sensory perception of the present ‘moment’ – is adjusted or ‘gated’ by both our HR and cardiac phase,” said Dr. Wiener, executive director of the Timing Research Forum.
The studies “provide a link between the body and the brain, in terms of our perception, and that we cannot study one without the context of the other,” said Dr. Wiener, who was not involved with the current study.
“All of this opens up a new avenue of research, and so it is very exciting to see,” Dr. Wiener stated.
No source of funding was listed for the study by Ms. Sadeghi and coauthors. They declared no relevant financial relationships.
Dr. Arslanova and coauthors declared no competing interests. Senior author Manos Tsakiris, PhD, receives funding from the European Research Council Consolidator Grant. Dr. Wiener declared no relevant financial relationships.
A version of this article first appeared on Medscape.com.
FROM PSYCHOPHYSIOLOGY
Analysis identifies gaps in CV risk screening of patients with psoriasis
Just , according to an analysis of 10 years of national survey data.
From 2007 to 2016, national screening rates for four CV risk factors at 14.8 million psoriasis-related visits to dermatology providers were 11% (body-mass index), 7.4% (blood pressure), 2.9% (cholesterol), and 1.7% (glucose). Data from the National Ambulatory Medical Care Survey showed that at least one of the four factors was screened at 16% of dermatology visits, said William B. Song, BS, of the department of dermatology, University of Pennsylvania, Philadelphia, and associates.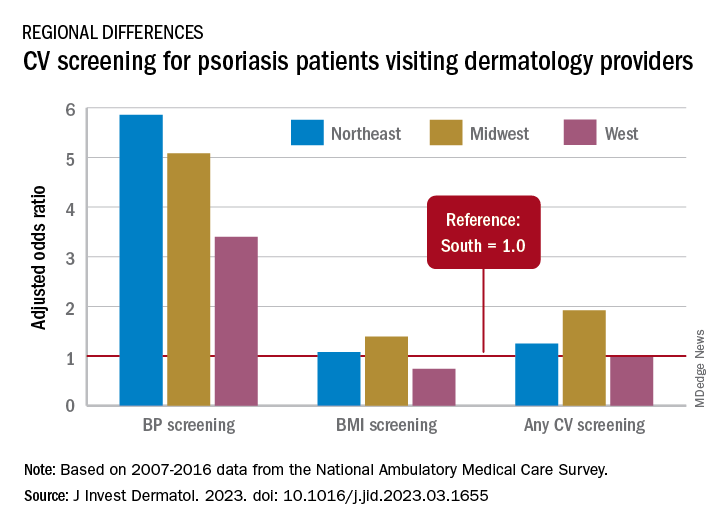
The main focus of their study, however, was regional differences. “CV risk factor screening by dermatology providers for patients with psoriasis is low across all regions of the United States and lowest in the South, the region that experiences the highest CVD burden in the United States,” they wrote in a letter to the editor.
Compared with the South, the adjusted odds of any CV screening were 0.98 in the West, 1.25 in the Northeast, and 1.92 in the Midwest. Blood pressure screening was significantly higher in all three regions, compared with the South, while BMI screening was actually lower in the West (0.74), the investigators reported. Odds ratios were not available for cholesterol and glucose screening because of sample size limitations.
The regional variation in screening rates “is not explained by patient demographics or disease severity,” they noted, adding that 2.8 million visits with BP screening would have been added over the 10-year study period “if providers in the South screened patients with psoriasis for high blood pressure at the same rate as providers in the Northeast.”
Guidelines published in 2019 by the American Academy of Dermatology and the National Psoriasis Foundation – which were cowritten by Joel M. Gelfand, MD, senior author of the current study – noted that dermatologists “play an important role in evidence-based screening of CV risk factors in patients with psoriasis,” the investigators wrote. But the regional variations suggest “that some regions experience barriers to appropriate screening or challenges in adhering to guidelines for managing psoriasis and CV risk.”
While the lack of data from after 2016 is one of the study limitations, they added, “continued efforts to develop effective interventions to improve CV screening and care for people with psoriasis in all regions of the U.S. are needed to more effectively address the burden of CV disease experienced by people with psoriasis.”
The study was partly funded by the National Psoriasis Foundation. Three of the seven investigators disclosed earnings from private companies in the form of consultant fees, research support, and honoraria. Dr. Gelfand is a deputy editor for the Journal of Investigative Dermatology.
FROM THE JOURNAL OF INVESTIGATIVE DERMATOLOGY
Some diets better than others for heart protection
In an analysis of randomized trials, the Mediterranean diet and low-fat diets were linked to reduced risks of all-cause mortality and nonfatal MI over 3 years in adults at increased risk for cardiovascular disease (CVD), while the Mediterranean diet also showed lower risk of stroke.
Five other popular diets appeared to have little or no benefit with regard to these outcomes.
“These findings with data presentations are extremely important for patients who are skeptical about the desirability of diet change,” wrote the authors, led by Giorgio Karam, a medical student at the University of Manitoba, Winnipeg.
The results were published online in The BMJ.
Dietary guidelines recommend various diets along with physical activity or other cointerventions for adults at increased CVD risk, but they are often based on low-certainty evidence from nonrandomized studies and on surrogate outcomes.
Several meta-analyses of randomized controlled trials with mortality and major CV outcomes have reported benefits of some dietary programs, but those studies did not use network meta-analysis to give absolute estimates and certainty of estimates for adults at intermediate and high risk, the authors noted.
For this study, Mr. Karam and colleagues conducted a comprehensive systematic review and network meta-analysis in which they compared the effects of seven popular structured diets on mortality and CVD events for adults with CVD or CVD risk factors.
The seven diet plans were the Mediterranean, low fat, very low fat, modified fat, combined low fat and low sodium, Ornish, and Pritikin diets. Data for the analysis came from 40 randomized controlled trials that involved 35,548 participants who were followed for an average of 3 years.
There was evidence of “moderate” certainty that the Mediterranean diet was superior to minimal intervention for all-cause mortality (odds ratio [OR], 0.72), CV mortality (OR, 0.55), stroke (OR, 0.65), and nonfatal MI (OR, 0.48).
On an absolute basis (per 1,000 over 5 years), the Mediterranean diet let to 17 fewer deaths from any cause, 13 fewer CV deaths, seven fewer strokes, and 17 fewer nonfatal MIs.
There was evidence of moderate certainty that a low-fat diet was superior to minimal intervention for prevention of all-cause mortality (OR, 0.84; nine fewer deaths per 1,000) and nonfatal MI (OR, 0.77; seven fewer deaths per 1,000). The low-fat diet had little to no benefit with regard to stroke reduction.
The Mediterranean diet was not “convincingly” superior to a low-fat diet for mortality or nonfatal MI, the authors noted.
The absolute effects for the Mediterranean and low-fat diets were more pronounced in adults at high CVD risk. With the Mediterranean diet, there were 36 fewer all-cause deaths and 39 fewer CV deaths per 1,000 over 5 years.
The five other dietary programs generally had “little or no benefit” compared with minimal intervention. The evidence was of low to moderate certainty.
The studies did not provide enough data to gauge the impact of the diets on angina, heart failure, peripheral vascular events, and atrial fibrillation.
The researchers say that strengths of their analysis include a comprehensive review and thorough literature search and a rigorous assessment of study bias. In addition, the researchers adhered to recognized GRADE methods for assessing the certainty of estimates.
Limitations of their work include not being able to measure adherence to dietary programs and the possibility that some of the benefits may have been due to other factors, such as drug treatment and support for quitting smoking.
The study had no specific funding. The authors have disclosed no relevant financial relationships.
A version of this article originally appeared on Medscape.com.
New antiobesity drugs will benefit many. Is that bad?
where some economists opined that their coverage would be disastrous for Medicare.
Among their concerns? The drugs need to be taken long term (just like drugs for any other chronic condition). The new drugs are more expensive than the old drugs (just like new drugs for any other chronic condition). Lots of people will want to take them (just like highly effective drugs for any other chronic condition that has a significant quality-of-life or clinical impact). The U.K. recommended that they be covered only for 2 years (unlike drugs for any other chronic condition). And the Institute for Clinical and Economic Review (ICER) on which they lean heavily decided that $13,618 annually was too expensive for a medication that leads to sustained 15%-20% weight losses and those losses’ consequential benefits.
As a clinician working with patients who sustain those levels of weight loss, I find that conclusion confusing. Whether by way of lifestyle alone, or more often by way of lifestyle efforts plus medication or lifestyle efforts plus surgery, the benefits reported and seen with 15%-20% weight losses are almost uniformly huge. Patients are regularly seen discontinuing or reducing the dosage of multiple medications as a result of improvements to multiple weight-responsive comorbidities, and they also report objective benefits to mood, sleep, mobility, pain, and energy. Losing that much weight changes lives. Not to mention the impact that that degree of loss has on the primary prevention of so many diseases, including plausible reductions in many common cancers – reductions that have been shown to occur after surgery-related weight losses and for which there’s no plausible reason to imagine that they wouldn’t occur with pharmaceutical-related losses.
Are those discussions found in the NEJM op-ed or in the ICER report? Well, yes, sort of. However, in the NEJM op-ed, the word “prevention” isn’t used once, and unlike with oral hypoglycemics or antihypertensives, the authors state that with antiobesity medications, additional research is needed to determine whether medication-induced changes to A1c, blood pressure, and waist circumference would have clinical benefits: “Antiobesity medications have been shown to improve the surrogate end points of weight, glycated hemoglobin levels, systolic blood pressure, and waist circumference. Long-term studies are needed, however, to clarify how medication-induced changes in these surrogate markers translate to health outcomes.”
Primary prevention is mentioned in the ICER review, but in the “limitations” section where the authors explain that they didn’t include it in their modeling: “The long-term benefits of preventing other comorbidities including cancer, chronic kidney disease, osteoarthritis, and sleep apnea were not explicitly modeled in the base case.”
And they pretended that the impact on existing weight-responsive comorbidities mostly didn’t exist, too: “To limit the complexity of the cost-effectiveness model and to prevent double-counting of treatment benefits, we limited the long-term effects of treatments for weight management to cardiovascular risk and delays in the onset and/or diagnosis of diabetes mellitus.”
As far as cardiovascular disease (CVD) benefits go, you might have thought that it would be a slam dunk on that basis alone, at least according to a recent simple back-of-the-envelope math exercise presented at a recent American College of Cardiology conference, which applied the semaglutide treatment group weight changes in the STEP 1 trial to estimate the population impact on weight and obesity in 30- to 74-year-olds without prior CVD, and estimated 10-year CVD risks utilizing the BMI-based Framingham CVD risk scores. By their accounting, semaglutide treatment in eligible American patients has the potential to prevent over 1.6 million CVD events over 10 years.
Finally, even putting aside ICER’s admittedly and exceedingly narrow base case, what lifestyle-alone studies could ICER possibly be comparing with drug efficacy? And what does “alone” mean? Does “alone” mean with a months- or years long interprofessional behavioral program? Does “alone” mean by way of diet books? Does “alone” mean by way of simply “moving more and eating less”? I’m not aware of robust studies demonstrating any long-term meaningful, predictable, reproducible, durable weight loss outcomes for any lifestyle-only approach, intensive or otherwise.
It’s difficult for me to imagine a situation in which a drug other than an antiobesity drug would be found to have too many benefits to include in your cost-effectiveness analysis but where you’d be comfortable to run that analysis anyhow, and then come out against the drug’s recommendation and fearmonger about its use.
But then again, systemic weight bias is a hell of a drug.
Dr. Freedhoff is associate professor, department of family medicine, University of Ottawa, and medical director, Bariatric Medical Institute, Ottawa. He disclosed ties with Constant Health and Novo Nordisk, and has shared opinions via Weighty Matters and social media.
A version of this article originally appeared on Medscape.com.
Subclinical CAD by CT predicts MI risk, with or without stenoses
About half of middle-aged adults in the community without cardiovascular (CV) symptoms have coronary atherosclerosis by CT angiography (CTA) that puts them at substantial risk for myocardial infarction (MI), suggests a prospective cohort study.
The 10% of participants who had subclinical disease considered obstructive at CTA showed a ninefold increased risk for MI over several years. Obstructive disease seemed to elevate risk more than subclinical disease that wasn’t obstructive but still considered extensive within the coronary arteries.
The findings, based on a Copenhagen General Population Study cohort, are new for CTA but consistent with research based on coronary artery calcium (CAC) scores and other ways to assess CV risk, say researchers.
Although all participants underwent CTA, such imaging isn’t used in the general population for atherosclerosis screening. But the findings may have implications for “opportunistic screening” for subclinical coronary disease at CTA conducted for other reasons, notes the study’s report, published online in the Annals of Internal Medicine.
“Identification of luminal obstructive or extensive subclinical coronary atherosclerosis” could potentially provide “clinically relevant, incremental risk assessment” in nonischemic patients who undergo cardiac CT or electrocardiogram-gated chest CT before procedures such as arrhythmia ablation or valve repair, it states.
Such patients found with subclinical coronary atherosclerosis might potentially “benefit from referral to intensified cardiovascular primary prevention therapy,” write the authors, led by Andreas Fuchs, MD, PhD, Copenhagen University Hospital-Rigshospitalet.
The group acknowledges the findings may not entirely apply to a non-Danish population.
A screening role for CTA?
Whether CTA has a role to play in adults without symptoms “is a big, open question in the field right now,” observed Ron Blankstein, MD, not associated with the current analysis, for this news organization.
Most population studies of CV risk prediction, such as MESA, have looked at CAC scores, not CTA, and have shown that “the more plaque individuals have, the higher the risk.” The current findings are similar but novel in coming from coronary CTA in a large asymptomatic community population, said Dr. Blankstein, who is director of cardiac CT at Brigham and Women’s Hospital, Boston.
“It’s possible that patients who have obstructive plaque in general tend to have a larger amount of plaque as well,” he said. So, while the study suggests that “the more plaque individuals have, the worse their overall risk,” it also shows that the risk “is enhanced even more if they have obstructive disease.”
The Danish cohort analysis “provides a unique opportunity to study the contemporary natural history of coronary artery disease in the absence of intervention,” notes an accompanying editorial.
For example, both patients and clinicians were blinded to CTA results, and CV preventive therapies weren’t common, observe Michael McDermott, MBChB, and David E. Newby, DM, PhD, of the BHF Centre for Cardiovascular Science, University of Edinburgh.
The analysis suggests that subclinical coronary disease that is obstructive predicts MI risk more strongly than extensive coronary disease, they note, and may be present in two-thirds of MI patients. “This contrasts with symptomatic populations, where nonobstructive disease accounts for most future myocardial infarctions, presumably from plaque rupture.”
It also points to “strong associations between nonobstructive extensive disease and adverse plaque characteristics,” write Dr. McDermott and Dr. Newby. “This underscores the major importance of plaque burden” for the prediction of coronary events.
Graded risk
The analysis included 9,533 persons aged 40 and older without known ischemic heart disease or symptoms with available CTA assessments.
Obstructive disease, defined as presence of a luminal stenosis of at least 50%, was seen in 10% and nonobstructive disease in 36% of the total cohort, the report states.
Disease occupying more than one-third of the coronary tree was considered extensive and less than one-third of the coronaries nonextensive, occurring in 10.5% and 35.8% of the cohort, respectively.
There were 71 MIs and 193 deaths over a median of 3.5 years. The adjusted relative risk for MI, compared with those without coronary atherosclerosis, was:
- 7.65 (95% confidence interval, 3.53-16.57) overall in patients with extensive disease.
- 8.28 (95% CI, 3.75-18.32) in those with obstructive but nonextensive disease.
- 9.19 (95% CI, 4.49-18.82) overall in those with obstructive disease.
- 12.48 (95% CI, 5.50-28.12) in those with or obstructive and extensive disease.
The adjusted RR for the composite of death or MI was also elevated in persons with extensive disease:
- 2.70 (95% CI, 1.72-4.25) in those with extensive but nonobstructive disease.
- 3.15 (95% CI, 2.05-4.83) in those with extensive and obstructive disease.
“It’s one thing to show that the more plaque, the higher the risk,” Dr. Blankstein said. But “does the information ultimately lead to better outcomes? Do patients have fewer MIs or fewer deaths?” Several ongoing randomized trials are exploring these questions.
They include DANE-HEART (Computed Tomography Coronary Angiography for Primary Prevention), projected to enroll about 6,000 participants from the Copenhagen General Population Study cohort who have at least one CV risk factor, and SCOT-HEART 2 (second Computed Tomography Coronary Angiography for the Prevention of Myocardial Infarction), enrolling a similar cohort in Scotland.
The study was supported by grants from AP Møller og Hustru Chastine Mc-Kinney Møllers Fond, the Research Council of Rigshospitalet, and Danish Heart Foundation. Dr. Fuchs reports no relevant financial relationships. Disclosures for the other authors can be found here. Dr. Blankstein recently disclosed serving as a consultant to Amgen, Caristo Diagnostics, Novartis, and Silence Therapeutics. Disclosures for Dr. McDermott and Dr. Newby, who are SCOT-HEART 2 investigators, can be found here.
A version of this article originally appeared on Medscape.com.
‘Excess’ deaths surging, but why?
This transcript has been edited for clarity.
“Excess deaths.” You’ve heard the phrase countless times by now. It is one of the myriad of previously esoteric epidemiology terms that the pandemic brought squarely into the zeitgeist.
As a sort of standard candle of the performance of a state or a region or a country in terms of health care, it has a lot of utility – if for nothing more than Monday-morning quarterbacking. But this week, I want to dig in on the concept a bit because, according to a new study, the excess death gap between the United States and Western Europe has never been higher.
You might imagine that the best way to figure this out is for some group of intelligent people to review each death and decide, somehow, whether it was expected or not. But aside from being impractical, this would end up being somewhat subjective. That older person who died from pneumonia – was that an expected death? Could it have been avoided?
Rather, the calculation of excess mortality relies on large numbers and statistical inference to compare an expected number of deaths with those that are observed.
The difference is excess mortality, even if you can never be sure whether any particular death was expected or not.
As always, however, the devil is in the details. What data do you use to define the expected number of deaths?
There are options here. Probably the most straightforward analysis uses past data from the country of interest. You look at annual deaths over some historical period of time and compare those numbers with the rates today. Two issues need to be accounted for here: population growth – a larger population will have more deaths, so you need to adjust the historical population with current levels, and demographic shifts – an older or more male population will have more deaths, so you need to adjust for that as well.
But provided you take care of those factors, you can estimate fairly well how many deaths you can expect to see in any given period of time.
Still, you should see right away that excess mortality is a relative concept. If you think that, just perhaps, the United States has some systematic failure to deliver care that has been stable and persistent over time, you wouldn’t capture that failing in an excess mortality calculation that uses U.S. historical data as the baseline.
The best way to get around that is to use data from other countries, and that’s just what this article – a rare single-author piece by Patrick Heuveline – does, calculating excess deaths in the United States by standardizing our mortality rates to the five largest Western European countries: the United Kingdom, France, Germany, Italy, and Spain.
Controlling for the differences in the demographics of that European population, here is the expected number of deaths in the United States over the past 5 years.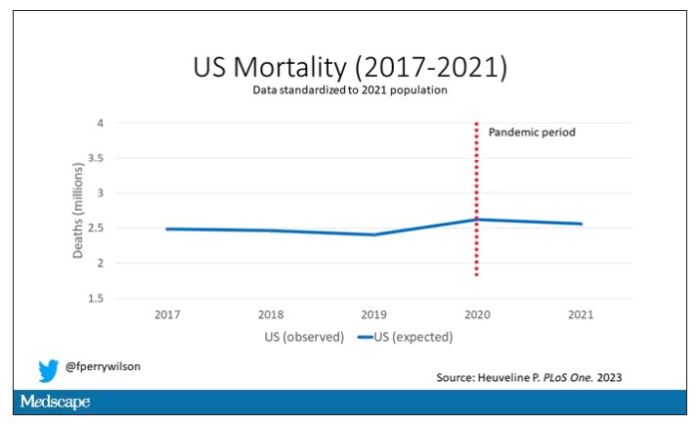
Note that there is a small uptick in expected deaths in 2020, reflecting the pandemic, which returns to baseline levels by 2021. This is because that’s what happened in Europe; by 2021, the excess mortality due to COVID-19 was quite low.
Here are the actual deaths in the US during that time.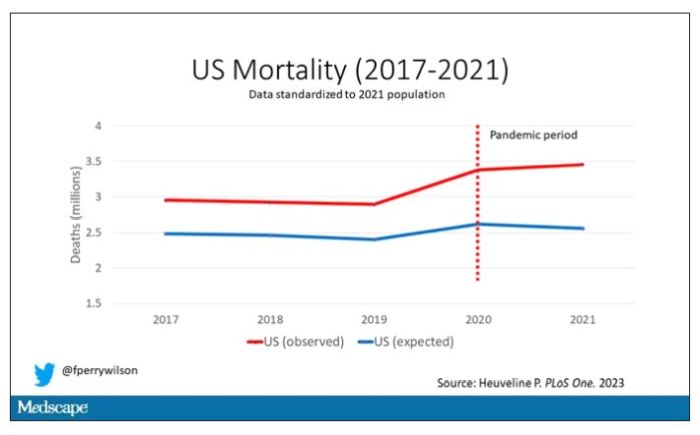
Highlighted here in green, then, is the excess mortality over time in the United States.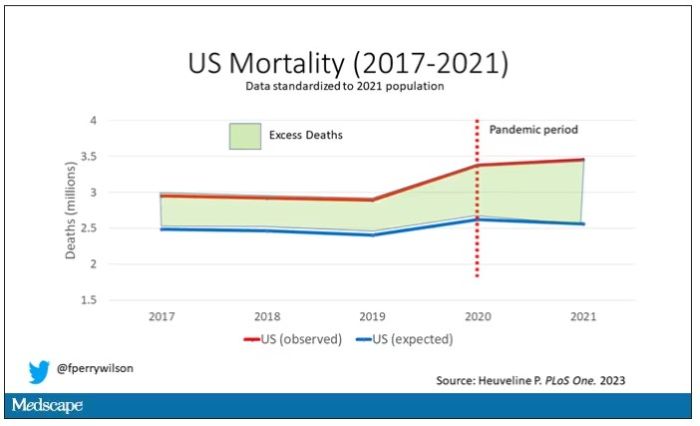
There are some fascinating and concerning findings here.
First of all, you can see that even before the pandemic, the United States has an excess mortality problem. This is not entirely a surprise; we’ve known that so-called “deaths of despair,” those due to alcohol abuse, drug overdoses, and suicide, are at an all-time high and tend to affect a “prime of life” population that would not otherwise be expected to die. In fact, fully 50% of the excess deaths in the United States occur in those between ages 15 and 64.
Excess deaths are also a concerning percentage of total deaths. In 2017, 17% of total deaths in the United States could be considered “excess.” In 2021, that number had doubled to 35%. Nearly 900,000 individuals in the United States died in 2021 who perhaps didn’t need to.
The obvious culprit to blame here is COVID, but COVID-associated excess deaths only explain about 50% of the excess we see in 2021. The rest reflect something even more concerning: a worsening of the failures of the past, perhaps exacerbated by the pandemic but not due to the virus itself.
Of course, we started this discussion acknowledging that the calculation of excess mortality is exquisitely dependent on how you model the expected number of deaths, and I’m sure some will take issue with the use of European numbers when applied to Americans. After all, Europe has, by and large, a robust public health service, socialized medicine, and healthcare that does not run the risk of bankrupting its citizens. How can we compare our outcomes to a place like that?
How indeed.
F. Perry Wilson, MD, MSCE, is an associate professor of medicine and director of Yale University’s Clinical and Translational Research Accelerator in New Haven,Conn. He reported no relevant conflicts of interest.
A version of this article originally appeared on Medscape.com.
Is it time to stop treating high triglycerides?
The publication of the PROMINENT trial, where pemafibrate successfully lowered high levels but was not associated with a lower risk for cardiovascular events, reinforced the point. Is it time to stop measuring and treating high triglycerides?
There may be noncardiovascular reasons to treat hypertriglyceridemia. Pancreatitis is the most cited one, given that the risk for pancreatitis increases with increasing triglyceride levels, especially in patients with a prior episode.
There may also be practical reasons to lower trigs. Because most cholesterol panels use the Friedewald equation to calculate low-density lipoprotein cholesterol (LDL-C) rather than measuring it directly, very high triglyceride levels can invalidate the calculation and return error messages on lab reports.
But we now have alternatives to measuring LDL-C, including non–high-density lipoprotein cholesterol (HDL-C) and apolipoprotein B (apoB), that better predict risk and are usable even in the setting of nonfasting samples when triglycerides are elevated.
Independent cardiovascular risk factor?
If we are going to measure and treat high triglycerides for cardiovascular reasons, the relevant question is, are high triglycerides an independent risk factor for cardiovascular disease?
Proponents have a broad swath of supportive literature to point at. Multiple studies have shown an association between triglyceride levels and cardiovascular risk. The evidence even extends beyond traditional epidemiologic analyses, to genetic studies that should be free from some of the problems seen in observational cohorts.
But it is difficult to be certain whether these associations are causal or merely confounding. An unhealthy diet will increase triglycerides, as will alcohol. Patients with diabetes or metabolic syndrome have high triglycerides. So do patients with nephrotic syndrome or hypothyroidism, or hypertensive patients taking thiazide diuretics. Adjusting for these baseline factors is possible but imperfect, and residual confounding is always an issue. An analysis of the Reykjavik and the EPIC-Norfolk studies found an association between triglyceride levels and cardiovascular risk. That risk was attenuated, but not eliminated, when adjusted for traditional risk factors such as age, smoking, blood pressure, diabetes, and cholesterol.
Randomized trials of triglyceride-lowering therapies would help resolve the question of whether hypertriglyceridemia contributes to coronary disease or simply identifies high-risk patients. Early trials seemed to support the idea of a causal link. The Helsinki Heart Study randomized patients to gemfibrozil or placebo and found a 34% relative risk reduction in coronary artery disease with the fibrate. But gemfibrozil didn’t only reduce triglycerides. It also increased HDL-C and lowered LDL-C relative to placebo, which may explain the observed benefit.
Gemfibrozil is rarely used today because we can achieve much greater LDL-C reductions with statins, as well as ezetimibe and PCSK9 inhibitors. The success of these drugs may not leave any room for triglyceride-lowering medications.
The pre- vs. post-statin era
In the 2005 FIELD study, participants were randomized to receive fenofibrate or placebo. Although patients weren’t taking statin at study entry, 17% of the placebo group started taking one during the trial. Fenofibrate wasn’t associated with a reduction in the primary endpoint, a combination of coronary heart disease death or nonfatal myocardial infarction (MI). Among the many secondary endpoints, nonfatal MI was lower but cardiovascular mortality was not in the fibrate-treated patients. In the same vein, the 2010 ACCORD study randomized patients to receive simvastatin plus fenofibrate or simvastatin alone. The composite primary outcome of MI, stroke, and cardiovascular mortality was not lowered nor were any secondary outcomes with the combination therapy. In the statin era, triglyceride-lowering therapies have not shown much benefit.
The final nail in the coffin may very well be the aforementioned PROMINENT trial. The new agent, pemafibrate, fared no better than its predecessor fenofibrate. Pemafibrate had no impact on the study’s primary composite outcome of nonfatal MI, stroke, coronary revascularization, or cardiovascular death despite being very effective at lowering triglycerides (by more than 25%). Patients treated with pemafibrate had increased LDL-C and apoB compared with the placebo group. When you realize that, the results of the study are not very surprising.
Some point to the results of REDUCE-IT as proof that triglycerides are still a valid target for pharmacotherapy. The debate on whether REDUCE-IT tested a good drug or a bad placebo is one for another day. The salient point for today is that the benefits of eicosapentaenoic acid (EPA) were seen regardless of either baseline or final triglyceride level. EPA may lower cardiac risk, but there is no widespread consensus that it does so by lowering triglycerides. There may be other mechanisms at work.
You could still argue that high triglycerides have value as a risk prediction tool even if their role as a target for drug therapy is questionable. There was a time when medications to lower triglycerides had a benefit. But this is the post-statin era, and that time has passed.
If you see patients with high triglycerides, treating them with triglyceride-lowering medication probably isn’t going to reduce their cardiovascular risk. Dietary interventions, encouraging exercise, and reducing alcohol consumption are better options. Not only will they lead to lower cholesterol levels, but they’ll lower cardiovascular risk, too.
Dr. Labos is a cardiologist at Hôpital Notre-Dame, Montreal, with a degree in epidemiology. He has disclosed no relevant financial relationships. He spends most of his time doing things that he doesn’t get paid for, like research, teaching, and podcasting. Occasionally he finds time to practice cardiology to pay the rent. He realizes that half of his research findings will be disproved in 5 years; he just doesn’t know which half. He is a regular contributor to the Montreal Gazette, CJAD radio, and CTV television in Montreal and is host of the award-winning podcast The Body of Evidence. The Body of Evidence.
A version of this article originally appeared on Medscape.com.
COAPT 5-year results ‘remarkable,’ but patient selection issues remain
It remained an open question in 2018, on the unveiling of the COAPT trial’s 2-year primary results, whether the striking reductions in mortality and heart-failure (HF) hospitalization observed for transcatheter edge-to-edge repair (TEER) with the MitraClip (Abbott) would be durable with longer follow-up.
The trial had enrolled an especially sick population of symptomatic patients with mitral regurgitation (MR) secondary to HF.
As it turns out, the therapy’s benefits at 2 years were indeed durable, at least out to 5 years, investigators reported March 5 at the joint scientific sessions of the American College of Cardiology and the World Heart Federation. The results were simultaneously published in the New England Journal of Medicine.
Patients who received the MitraClip on top of intensive medical therapy, compared with a group assigned to medical management alone, benefited significantly at 5 years with risk reductions of 51% for HF hospitalization, 28% for death from any cause, and 47% for the composite of the two events.
Still, mortality at 5 years among the 614 randomized patients was steep at 57.3% in the MitraClip group and 67.2% for those assigned to meds only, underscoring the need for early identification of patients appropriate for the device therapy, Gregg W. Stone, MD, said during his presentation.
Dr. Stone, of the Icahn School of Medicine at Mount Sinai, New York, is a COAPT co-principal investigator and lead author of the 5-year outcomes publication.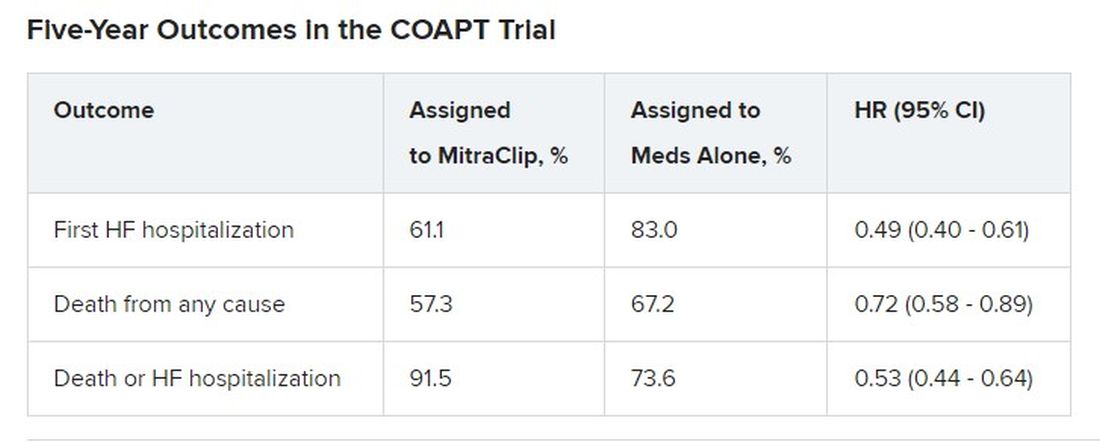
Outcomes were consistent across all prespecified patient subgroups, including by age, sex, MR, left ventricular (LV) function and volume, cardiomyopathy etiology, and degree of surgical risk, the researchers reported.
Symptom status, as measured by New York Heart Association (NYHA) functional class, improved throughout the 5-year follow-up for patients assigned to the MitraClip group, compared with the control group, and the intervention group was significantly more likely to be in NYHA class 1 or 2, the authors noted.
The relative benefits in terms of clinical outcomes of MitraClip therapy narrowed after 2-3 years, Dr. Stone said, primarily because at 2 years, patients who had been assigned to meds only were eligible to undergo TEER. Indeed, he noted, 45% of the 138 patients in the control group who were eligible for TEER at 2 years “crossed over” to receive a MitraClip. Those patients benefited despite their delay in undergoing the procedure, he observed.

However, nearly half of the control patients died before becoming eligible for crossover at 2 years. “We have to identify the appropriate patients for treatment and treat them early because the mortality is very high in this population,” Dr. Stone said.
“We need to do more because the MitraClip doesn’t do anything directly to the underlying left ventricular dysfunction, which is the cause of the patient’s disease,” he said. “We need advanced therapies to address the underlying left ventricular dysfunction” in this high-risk population.
Exclusions based on LV dimension
The COAPT trial included 614 patients with HF and symptomatic MR despite guideline-directed medical therapy. They were required to have moderate to severe (3+) or severe (4+) MR confirmed by an echocardiographic core laboratory and a left ventricular ejection fraction (LVEF) of 20%-50%.
Among the exclusion criteria were an LV end-systolic diameter greater than 70 mm, severe pulmonary hypertension, and moderate to severe symptomatic right ventricular failure.
The systolic LV dimension exclusion helped address the persistent question of whether “severe mitral regurgitation is a marker of a bad left ventricle or ... contributes to the pathophysiology” of MR and its poor outcomes, Dr. Stone said.
The 51% reduction in risk for time-to-first HF hospitalization among patients assigned to TEER “accrued very early,” Dr. Stone pointed out. “You can see the curves start to separate almost immediately after you reduce left atrial pressure and volume overload with the MitraClip.”
The curves stopped diverging after about 3 years because of crossover from the control group, he said. Still, “we had shown a substantial absolute 17% reduction in mortality at 2 years” with MitraClip. “That has continued out to 5 years, with a statistically significant 28% relative reduction,” he continued, and the absolute risk reduction reaching 10%.
Patients in the control group who crossed over “basically assumed the death and heart failure hospitalization rate of the MitraClip group,” Dr. Stone said. That wasn’t surprising “because most of the patients enrolled in the trial originally had chronic heart failure.” It’s “confirmation of the principal results of the trial.”
Comparison With MITRA-FR
“We know that MITRA-FR was a negative trial,” observed Wayne B. Batchelor, MD, an invited discussant following Dr. Stone’s presentation, referring to an earlier similar trial that showed no advantage for MitraClip. Compared with MITRA-FR, COAPT “has created an entirely different story.”
The marked reductions in mortality and risk for adverse events and low number-needed-to-treat with MitraClip are “really remarkable,” said Dr. Batchelor, who is with the Inova Heart and Vascular Institute, Falls Church, Va.
But the high absolute mortality for patients in the COAPT control group “speaks volumes to me and tells us that we’ve got to identify our patients well early,” he agreed, and to “implement transcatheter edge-to-edge therapy in properly selected patients on guideline-directed medical therapy in order to avoid that.”
The trial findings “suggest that we’re reducing HF hospitalization,” he said, “so this is an extremely potent therapy, potentially.
“The dramatic difference between the treated arm and the medical therapy arm in this trial makes me feel that this therapy is here to stay,” Dr. Batchelor concluded. “We just have to figure out how to deploy it properly in the right patients.”
The COAPT trial presents “a practice-changing paradigm,” said Suzanne J. Baron, MD, of Lahey Hospital & Medical Center, Burlington, Mass., another invited discussant.
The crossover data “really jumped out,” she added. “Waiting to treat patients with TEER may be harmful, so if we’re going to consider treating earlier, how do we identify the right patient?” Dr. Baron asked, especially given the negative MITRA-FR results.
MITRA-FR didn’t follow patients beyond 2 years, Dr. Stone noted. Still, “we do think that the main difference was that COAPT enrolled a patient population with more severe MR and slightly less LV dysfunction, at least in terms of the LV not being as dilated, so they didn’t have end-stage LV disease. Whereas in MITRA-FR, more of the patients had only moderate mitral regurgitation.” And big dilated left ventricles “are less likely to benefit.”
There were also differences between the studies in technique and background medical therapies, he added.
The Food and Drug Administration has approved – and payers are paying – for the treatment of patients who meet the COAPT criteria, “in whom we can be very confident they have a benefit,” Dr. Stone said.
“The real question is: Where are the edges where we should consider this? LVEF slightly less than 20% or slightly greater than 50%? Or primary atrial functional mitral regurgitation? There are registry data to suggest that they would benefit,” he said, but “we need more data.”
COAPT was supported by Abbott. Dr. Stone disclosed receiving speaker honoraria from Abbott and consulting fees or equity from Neovasc, Ancora, Valfix, and Cardiac Success; and that Mount Sinai receives research funding from Abbott. Disclosures for the other authors are available at nejm.org. Dr. Batchelor has disclosed receiving consultant fees or honoraria from Abbott, Boston Scientific, Idorsia, and V-Wave Medical, and having other ties with Medtronic. Dr. Baron has disclosed receiving consultant fees or honoraria from Abiomed, Biotronik, Boston Scientific, Edwards Lifesciences, Medtronic, Shockwave, and Zoll Medical, and conducting research or receiving research grants from Abiomed and Boston Scientific.
A version of this article originally appeared on Medscape.com.
It remained an open question in 2018, on the unveiling of the COAPT trial’s 2-year primary results, whether the striking reductions in mortality and heart-failure (HF) hospitalization observed for transcatheter edge-to-edge repair (TEER) with the MitraClip (Abbott) would be durable with longer follow-up.
The trial had enrolled an especially sick population of symptomatic patients with mitral regurgitation (MR) secondary to HF.
As it turns out, the therapy’s benefits at 2 years were indeed durable, at least out to 5 years, investigators reported March 5 at the joint scientific sessions of the American College of Cardiology and the World Heart Federation. The results were simultaneously published in the New England Journal of Medicine.
Patients who received the MitraClip on top of intensive medical therapy, compared with a group assigned to medical management alone, benefited significantly at 5 years with risk reductions of 51% for HF hospitalization, 28% for death from any cause, and 47% for the composite of the two events.
Still, mortality at 5 years among the 614 randomized patients was steep at 57.3% in the MitraClip group and 67.2% for those assigned to meds only, underscoring the need for early identification of patients appropriate for the device therapy, Gregg W. Stone, MD, said during his presentation.
Dr. Stone, of the Icahn School of Medicine at Mount Sinai, New York, is a COAPT co-principal investigator and lead author of the 5-year outcomes publication.
Outcomes were consistent across all prespecified patient subgroups, including by age, sex, MR, left ventricular (LV) function and volume, cardiomyopathy etiology, and degree of surgical risk, the researchers reported.
Symptom status, as measured by New York Heart Association (NYHA) functional class, improved throughout the 5-year follow-up for patients assigned to the MitraClip group, compared with the control group, and the intervention group was significantly more likely to be in NYHA class 1 or 2, the authors noted.
The relative benefits in terms of clinical outcomes of MitraClip therapy narrowed after 2-3 years, Dr. Stone said, primarily because at 2 years, patients who had been assigned to meds only were eligible to undergo TEER. Indeed, he noted, 45% of the 138 patients in the control group who were eligible for TEER at 2 years “crossed over” to receive a MitraClip. Those patients benefited despite their delay in undergoing the procedure, he observed.
However, nearly half of the control patients died before becoming eligible for crossover at 2 years. “We have to identify the appropriate patients for treatment and treat them early because the mortality is very high in this population,” Dr. Stone said.
“We need to do more because the MitraClip doesn’t do anything directly to the underlying left ventricular dysfunction, which is the cause of the patient’s disease,” he said. “We need advanced therapies to address the underlying left ventricular dysfunction” in this high-risk population.
Exclusions based on LV dimension
The COAPT trial included 614 patients with HF and symptomatic MR despite guideline-directed medical therapy. They were required to have moderate to severe (3+) or severe (4+) MR confirmed by an echocardiographic core laboratory and a left ventricular ejection fraction (LVEF) of 20%-50%.
Among the exclusion criteria were an LV end-systolic diameter greater than 70 mm, severe pulmonary hypertension, and moderate to severe symptomatic right ventricular failure.
The systolic LV dimension exclusion helped address the persistent question of whether “severe mitral regurgitation is a marker of a bad left ventricle or ... contributes to the pathophysiology” of MR and its poor outcomes, Dr. Stone said.
The 51% reduction in risk for time-to-first HF hospitalization among patients assigned to TEER “accrued very early,” Dr. Stone pointed out. “You can see the curves start to separate almost immediately after you reduce left atrial pressure and volume overload with the MitraClip.”
The curves stopped diverging after about 3 years because of crossover from the control group, he said. Still, “we had shown a substantial absolute 17% reduction in mortality at 2 years” with MitraClip. “That has continued out to 5 years, with a statistically significant 28% relative reduction,” he continued, and the absolute risk reduction reaching 10%.
Patients in the control group who crossed over “basically assumed the death and heart failure hospitalization rate of the MitraClip group,” Dr. Stone said. That wasn’t surprising “because most of the patients enrolled in the trial originally had chronic heart failure.” It’s “confirmation of the principal results of the trial.”
Comparison With MITRA-FR
“We know that MITRA-FR was a negative trial,” observed Wayne B. Batchelor, MD, an invited discussant following Dr. Stone’s presentation, referring to an earlier similar trial that showed no advantage for MitraClip. Compared with MITRA-FR, COAPT “has created an entirely different story.”
The marked reductions in mortality and risk for adverse events and low number-needed-to-treat with MitraClip are “really remarkable,” said Dr. Batchelor, who is with the Inova Heart and Vascular Institute, Falls Church, Va.
But the high absolute mortality for patients in the COAPT control group “speaks volumes to me and tells us that we’ve got to identify our patients well early,” he agreed, and to “implement transcatheter edge-to-edge therapy in properly selected patients on guideline-directed medical therapy in order to avoid that.”
The trial findings “suggest that we’re reducing HF hospitalization,” he said, “so this is an extremely potent therapy, potentially.
“The dramatic difference between the treated arm and the medical therapy arm in this trial makes me feel that this therapy is here to stay,” Dr. Batchelor concluded. “We just have to figure out how to deploy it properly in the right patients.”
The COAPT trial presents “a practice-changing paradigm,” said Suzanne J. Baron, MD, of Lahey Hospital & Medical Center, Burlington, Mass., another invited discussant.
The crossover data “really jumped out,” she added. “Waiting to treat patients with TEER may be harmful, so if we’re going to consider treating earlier, how do we identify the right patient?” Dr. Baron asked, especially given the negative MITRA-FR results.
MITRA-FR didn’t follow patients beyond 2 years, Dr. Stone noted. Still, “we do think that the main difference was that COAPT enrolled a patient population with more severe MR and slightly less LV dysfunction, at least in terms of the LV not being as dilated, so they didn’t have end-stage LV disease. Whereas in MITRA-FR, more of the patients had only moderate mitral regurgitation.” And big dilated left ventricles “are less likely to benefit.”
There were also differences between the studies in technique and background medical therapies, he added.
The Food and Drug Administration has approved – and payers are paying – for the treatment of patients who meet the COAPT criteria, “in whom we can be very confident they have a benefit,” Dr. Stone said.
“The real question is: Where are the edges where we should consider this? LVEF slightly less than 20% or slightly greater than 50%? Or primary atrial functional mitral regurgitation? There are registry data to suggest that they would benefit,” he said, but “we need more data.”
COAPT was supported by Abbott. Dr. Stone disclosed receiving speaker honoraria from Abbott and consulting fees or equity from Neovasc, Ancora, Valfix, and Cardiac Success; and that Mount Sinai receives research funding from Abbott. Disclosures for the other authors are available at nejm.org. Dr. Batchelor has disclosed receiving consultant fees or honoraria from Abbott, Boston Scientific, Idorsia, and V-Wave Medical, and having other ties with Medtronic. Dr. Baron has disclosed receiving consultant fees or honoraria from Abiomed, Biotronik, Boston Scientific, Edwards Lifesciences, Medtronic, Shockwave, and Zoll Medical, and conducting research or receiving research grants from Abiomed and Boston Scientific.
A version of this article originally appeared on Medscape.com.
FROM ACC 2023
Sweaty treatment for social anxiety could pass the sniff test
Getting sweet on sweat
Are you the sort of person who struggles in social situations? Have the past 3 years been a secret respite from the terror and exhaustion of meeting new people? We understand your plight. People kind of suck. And you don’t have to look far to be reminded of it.
Unfortunately, on occasion we all have to interact with other human beings. If you suffer from social anxiety, this is not a fun thing to do. But new research indicates that there may be a way to alleviate the stress for those with social anxiety: armpits.
Specifically, sweat from the armpits of other people. Yes, this means a group of scientists gathered up some volunteers and collected their armpit sweat while the volunteers watched a variety of movies (horror, comedy, romance, etc.). Our condolences to the poor unpaid interns tasked with gathering the sweat.
Once they had their precious new medicine, the researchers took a group of women and administered a round of mindfulness therapy. Some of the participants then received the various sweats, while the rest were forced to smell only clean air. (The horror!) Lo and behold, the sweat groups had their anxiety scores reduced by about 40% after their therapy, compared with just 17% in the control group.
The researchers also found that the source of the sweat didn’t matter. Their study subjects responded the same to sweat excreted during a scary movie as they did to sweat from a comedy, a result that surprised the researchers. They suggested chemosignals in the sweat may affect the treatment response and advised further research. Which means more sweat collection! They plan on testing emotionally neutral movies next time, and if we can make a humble suggestion, they also should try the sweatiest movies.
Before the Food and Drug Administration can approve armpit sweat as a treatment for social anxiety, we have some advice for those shut-in introverts out there. Next time you have to interact with rabid extroverts, instead of shaking their hands, walk up to them and take a deep whiff of their armpits. Establish dominance. Someone will feel awkward, and science has proved it won’t be you.
The puff that vaccinates
Ever been shot with a Nerf gun or hit with a foam pool tube? More annoying than painful, right? If we asked if you’d rather get pelted with one of those than receive a traditional vaccine injection, you would choose the former. Maybe someday you actually will.

During the boredom of the early pandemic lockdown, Jeremiah Gassensmith, PhD, of the department of chemistry and biochemistry at the University of Texas, Dallas, ordered a compressed gas–powered jet injection system to fool around with at home. Hey, who didn’t? Anyway, when it was time to go back to the lab he handed it over to one of his grad students, Yalini Wijesundara, and asked her to see what could be done with it.
In her tinkering she found that the jet injector could deliver metal-organic frameworks (MOFs) that can hold a bunch of different materials, like proteins and nucleic acids, through the skin.
Thus the “MOF-Jet” was born!
Jet injectors are nothing new, but they hurt. The MOF-Jet, however, is practically painless and cheaper than the gene guns that veterinarians use to inject biological cargo attached to the surface of a metal microparticle.
Changing the carrier gas also changes the time needed to break down the MOF and thus alters delivery of the drug inside. “If you shoot it with carbon dioxide, it will release its cargo faster within cells; if you use regular air, it will take 4 or 5 days,” Ms. Wijesundara explained in a written statement. That means the same drug could be released over different timescales without changing its formulation.
While testing on onion cells and mice, Ms. Wijesundara noted that it was as easy as “pointing and shooting” to distribute the puff of gas into the cells. A saving grace to those with needle anxiety. Not that we would know anything about needle anxiety.
More testing needs to be done before bringing this technology to human use, obviously, but we’re looking forward to saying goodbye to that dreaded prick and hello to a puff.
Your hippocampus is showing
Brain anatomy is one of the many, many things that’s not really our thing, but we do know a cool picture when we see one. Case in point: The image just below, which happens to be a full-scale, single-cell resolution model of the CA1 region of the hippocampus that “replicates the structure and architecture of the area, along with the position and relative connectivity of the neurons,” according to a statement from the Human Brain Project.

“We have performed a data mining operation on high resolution images of the human hippocampus, obtained from the BigBrain database. The position of individual neurons has been derived from a detailed analysis of these images,” said senior author Michele Migliore, PhD, of the Italian National Research Council’s Institute of Biophysics in Palermo.
Yes, he did say BigBrain database. BigBrain is – we checked and it’s definitely not this – a 3D model of a brain that was sectioned into 7,404 slices just 20 micrometers thick and then scanned by MRI. Digital reconstruction of those slices was done by supercomputer and the results are now available for analysis.
Dr. Migliore and his associates developed an image-processing algorithm to obtain neuronal positioning distribution and an algorithm to generate neuronal connectivity by approximating the shapes of dendrites and axons. (Our brains are starting to hurt just trying to write this.) “Some fit into narrow cones, others have a broad complex extension that can be approximated by dedicated geometrical volumes, and the connectivity to nearby neurons changes accordingly,” explained lead author Daniela Gandolfi of the University of Modena (Italy) and Reggio Emilia.
The investigators have made their dataset and the extraction methodology available on the EBRAINS platform and through the Human Brain Project and are moving on to other brain regions. And then, once everyone can find their way in and around the old gray matter, it should bring an end to conversations like this, which no doubt occur between male and female neuroscientists every day:
“Arnold, I think we’re lost.”
“Don’t worry, Bev, I know where I’m going.”
“Stop and ask this lady for directions.”
“I said I can find it.”
“Just ask her.”
“Fine. Excuse me, ma’am, can you tell us how to get to the corpora quadrigemina from here?
Getting sweet on sweat
Are you the sort of person who struggles in social situations? Have the past 3 years been a secret respite from the terror and exhaustion of meeting new people? We understand your plight. People kind of suck. And you don’t have to look far to be reminded of it.
Unfortunately, on occasion we all have to interact with other human beings. If you suffer from social anxiety, this is not a fun thing to do. But new research indicates that there may be a way to alleviate the stress for those with social anxiety: armpits.
Specifically, sweat from the armpits of other people. Yes, this means a group of scientists gathered up some volunteers and collected their armpit sweat while the volunteers watched a variety of movies (horror, comedy, romance, etc.). Our condolences to the poor unpaid interns tasked with gathering the sweat.
Once they had their precious new medicine, the researchers took a group of women and administered a round of mindfulness therapy. Some of the participants then received the various sweats, while the rest were forced to smell only clean air. (The horror!) Lo and behold, the sweat groups had their anxiety scores reduced by about 40% after their therapy, compared with just 17% in the control group.
The researchers also found that the source of the sweat didn’t matter. Their study subjects responded the same to sweat excreted during a scary movie as they did to sweat from a comedy, a result that surprised the researchers. They suggested chemosignals in the sweat may affect the treatment response and advised further research. Which means more sweat collection! They plan on testing emotionally neutral movies next time, and if we can make a humble suggestion, they also should try the sweatiest movies.
Before the Food and Drug Administration can approve armpit sweat as a treatment for social anxiety, we have some advice for those shut-in introverts out there. Next time you have to interact with rabid extroverts, instead of shaking their hands, walk up to them and take a deep whiff of their armpits. Establish dominance. Someone will feel awkward, and science has proved it won’t be you.
The puff that vaccinates
Ever been shot with a Nerf gun or hit with a foam pool tube? More annoying than painful, right? If we asked if you’d rather get pelted with one of those than receive a traditional vaccine injection, you would choose the former. Maybe someday you actually will.
During the boredom of the early pandemic lockdown, Jeremiah Gassensmith, PhD, of the department of chemistry and biochemistry at the University of Texas, Dallas, ordered a compressed gas–powered jet injection system to fool around with at home. Hey, who didn’t? Anyway, when it was time to go back to the lab he handed it over to one of his grad students, Yalini Wijesundara, and asked her to see what could be done with it.
In her tinkering she found that the jet injector could deliver metal-organic frameworks (MOFs) that can hold a bunch of different materials, like proteins and nucleic acids, through the skin.
Thus the “MOF-Jet” was born!
Jet injectors are nothing new, but they hurt. The MOF-Jet, however, is practically painless and cheaper than the gene guns that veterinarians use to inject biological cargo attached to the surface of a metal microparticle.
Changing the carrier gas also changes the time needed to break down the MOF and thus alters delivery of the drug inside. “If you shoot it with carbon dioxide, it will release its cargo faster within cells; if you use regular air, it will take 4 or 5 days,” Ms. Wijesundara explained in a written statement. That means the same drug could be released over different timescales without changing its formulation.
While testing on onion cells and mice, Ms. Wijesundara noted that it was as easy as “pointing and shooting” to distribute the puff of gas into the cells. A saving grace to those with needle anxiety. Not that we would know anything about needle anxiety.
More testing needs to be done before bringing this technology to human use, obviously, but we’re looking forward to saying goodbye to that dreaded prick and hello to a puff.
Your hippocampus is showing
Brain anatomy is one of the many, many things that’s not really our thing, but we do know a cool picture when we see one. Case in point: The image just below, which happens to be a full-scale, single-cell resolution model of the CA1 region of the hippocampus that “replicates the structure and architecture of the area, along with the position and relative connectivity of the neurons,” according to a statement from the Human Brain Project.
“We have performed a data mining operation on high resolution images of the human hippocampus, obtained from the BigBrain database. The position of individual neurons has been derived from a detailed analysis of these images,” said senior author Michele Migliore, PhD, of the Italian National Research Council’s Institute of Biophysics in Palermo.
Yes, he did say BigBrain database. BigBrain is – we checked and it’s definitely not this – a 3D model of a brain that was sectioned into 7,404 slices just 20 micrometers thick and then scanned by MRI. Digital reconstruction of those slices was done by supercomputer and the results are now available for analysis.
Dr. Migliore and his associates developed an image-processing algorithm to obtain neuronal positioning distribution and an algorithm to generate neuronal connectivity by approximating the shapes of dendrites and axons. (Our brains are starting to hurt just trying to write this.) “Some fit into narrow cones, others have a broad complex extension that can be approximated by dedicated geometrical volumes, and the connectivity to nearby neurons changes accordingly,” explained lead author Daniela Gandolfi of the University of Modena (Italy) and Reggio Emilia.
The investigators have made their dataset and the extraction methodology available on the EBRAINS platform and through the Human Brain Project and are moving on to other brain regions. And then, once everyone can find their way in and around the old gray matter, it should bring an end to conversations like this, which no doubt occur between male and female neuroscientists every day:
“Arnold, I think we’re lost.”
“Don’t worry, Bev, I know where I’m going.”
“Stop and ask this lady for directions.”
“I said I can find it.”
“Just ask her.”
“Fine. Excuse me, ma’am, can you tell us how to get to the corpora quadrigemina from here?