User login
Hospitalist Efficiency Impacted by Increased Workloads
Clinical question: Does an increased hospitalist workload lead to increased costs, longer lengths of stay, and worse medical outcomes?
Background: There is evidence that increased resident physician workloads contribute to adverse medical outcomes, but this has not been assessed in the hospital medicine setting. In a recent national survey of hospitalists, almost half reported that they had managed workloads that felt “unsafe.”
Study design: Retrospective cohort study.
Setting: Academic community health system in Delaware.
Synopsis: This study examined the effect of hospital occupancy and hospitalist workloads, using both daily relative value units (RVUs) and hospitalists’ daily patient census, on length of stay (LOS), hospital costs, inpatient mortality, activation of rapid response system (a proxy measure for decompensation), and 30-day readmission rates. Authors reviewed 20,241 hospitalizations and found that when hospitalist daily censuses exceeded 15 patients (or RVU of 25), length of stay increased “exponentially.” Increased workloads were not associated with worsening medical outcomes or diminished patient satisfaction scores.
The authors caution that the significantly increased costs and LOS at higher patient censuses raise concerns that hospital policies that incentivize productivity may “undermine larger system efforts targeting efficiency and costs of care.” They also suggest that hospitalist groups’ staffing approaches need to accommodate fluctuations in hospital occupancy.
Bottom line: When a hospitalist’s workload exceeds a census of 15 patients, the length of stay and cost may increase dramatically.
Article Reference: Elliott DJ, Young RS, Brice J, Aguiar R, Kolm P. Effect of hospitalist workload on the quality and efficiency of care. JAMA Intern Med. 2014;174(5):786-793.
Peri-Operative Clonidine Increases Hypotension, Bradycardia, Nonfatal Cardiac Arrest
Clinical question: In patients at risk for vascular complications undergoing noncardiac surgery, do the benefits of aspirin outweigh the risks?
Background: Aspirin has been shown to reduce the rate of myocardial infarction (MI) and major vascular events in patients not undergoing surgery. The benefits of initiating or continuing aspirin in patients undergoing surgery, balanced by the potential increase in bleeding risk, have not been widely studied.
Study design: International randomized placebo-controlled trial with a 2-by-2 factorial design.
Setting: One hundred thirty-five hospitals in 23 countries, from 2010-2013.
Synopsis: The study enrolled 10,010 patients, with a mean age of 68.6 years. Inclusion criteria were age >45 years old and risk for vascular complications, defined as a history of coronary artery disease, peripheral vascular disease, or cerebrovascular accident; major vascular surgery; or at least three of the following: age >70, congestive heart failure, transient ischemic attack, hypertension, diabetes mellitus type 2, creatinine >2 mg/dL, recent smoking, undergoing major surgery, or urgent/emergent surgery.
Groups were stratified by current use of aspirin and then assigned to aspirin or placebo; patients on aspirin held it a median of seven days before surgery. Those in the active group received 200 mg of aspirin pre-operatively. Patients not previously on aspirin then continued aspirin at 100 mg/day for 30 days; those on aspirin previously received 100 mg/day for seven days and then resumed their prior dose.
No difference was found in the primary outcome of death or non-fatal MI at 30 days, but aspirin was noted to increase the risk of major bleeding (4.6% vs. 3.8%, P=0.04), most commonly occurring at the surgical site (78.3%) and the GI tract (9.3%). Because major bleeding can be associated with peri-operative MI, this may have counteracted the cardiovascular benefits of aspirin.
Bottom line: Peri-operative administration of aspirin to patients at risk for vascular complications undergoing noncardiac surgery does not decrease the risk of peri-operative death or MI and may increase the risk of post-operative bleeding.
Citation: Devereaux PJ, Mrkobrada M, Sessler DI, et al. POISE-2 Investigators. Aspirin in patients undergoing noncardiac surgery. N Engl J Med. 2014;370(16):1494-1503.
Fibrinolytics Increase Stroke Risk, Hemorrhage in Intermediate-Risk Pulmonary Emboli
Clinical question: Do fibrinolytics decrease mortality rates in intermediate-risk pulmonary emboli?
Background: Over the past 40 years, fibrinolytics have been studied in fewer than 1,000 patients with pulmonary emboli. Previous studies have shown improvement in hemodynamic response, though the evidence for clinical outcomes such as death and hemodynamic collapse have not been studied adequately in intermediate-risk pulmonary emboli.
Study design: Randomized, double-blinded, placebo-controlled trial.
Setting: Seventy-six sites in 13 countries.
Synopsis: The PEITHO [Pulmonary EmbolIsm THrOmbolysis] trial randomized 1,006 patients in a double-blind fashion. All patients had acute pulmonary emboli with evidence of right ventricular dysfunction on computed tomography scan or echocardiogram, as well as an elevated troponin, in the absence of hemodynamic compromise. Patients received tenecteplase and heparin or placebo and heparin. The primary outcome was death and hemodynamic decompensation.
The primary outcome was found in 2.6% of the treatment group and 5.6% in the placebo group (P=0.02), favoring the treatment group; however, there was no difference in death at seven days (1.2% vs. 1.8%; P=0.42) and 30 days (2.4% vs. 3.2%; P=0.42). Additionally, there were higher rates of extracranial bleeding (6.3% vs. 1.2%; P=<0.001) and stroke (2.4% vs. 0.2%; P=0.003) in the tenecteplase group than in the placebo group. Of the 12 strokes in the treatment group, 11 were hemorrhagic.
Bottom line: Treatment of intermediate-risk pulmonary emboli with fibrinolytics may improve hemodynamics; however, there is no mortality benefit, and fibrinolytic therapy carries an increased risk of bleeding and stroke.
Citation: Meyer G, Vicaut E, Danays T, et al. Fibrinolysis for patients with intermediate-risk pulmonary embolism. N Engl J Med. 2014;370(15):1402-1411.
AHA/ACC Atrial Fibrillation Guidelines Updated
Clinical question: What new recommendations are made in the AHA/ACC/HRS atrial fibrillation guidelines?
Background: This is the AHA’s first comprehensive update on atrial fibrillation since 2006; there were two intervening focused updates in 2011.
Synopsis: The majority of the new recommendations center on patient selection for anticoagulation and the role of the new oral anticoagulants.
CHA2DS2-VASc is now recommended over CHADS2 for evaluation of stroke risk, with anticoagulation recommended for a score of two or greater, or for a patient with any prior history of stroke or transient ischemic attack.
Warfarin, direct thrombin inhibitors, or factor Xa inhibitors may be considered in patients with normal renal function. Reduced doses of these medications may be considered in patients with moderate to severe renal dysfunction but have not been studied in clinical trials.
Warfarin remains the drug of choice for patients on hemodialysis and those with hemodynamically significant mitral stenosis or aortic valve replacement.
The clinical utility of bleeding risk scores remains insufficient for formal recommendations. There is sparse evidence on which to base recommendations for bridging, but additional studies, such as the BRIDGE trial, are ongoing. A liberal rate control strategy targeting heart rates <110 in asymptomatic patients with preserved systolic function is reasonable; ideal rate control targets remain controversial.
Citation: January CT, Wann LS, Alpert JS, et al. 2014 AHA/ACC/HRS Guideline for the management of patients with atrial fibrillation: a report of the American College of Cardiology/American Heart Association Task Force on Practice Guidelines and the Heart Rhythm Society [published online ahead of print April 10, 2014]. Circulation.
Peri-Operative Aspirin Impact on Risk of Bleeding, Death, Myocardial Infarction Examined
Clinical question: Does peri-operative clonidine prevent myocardial infarction (MI)?
Background: A meta-analysis showed that peri-operative clonidine decreased death and MI compared to placebo in patients undergoing vascular surgery. It also showed that rates of death and MI were the same for patients taking clonidine vs. placebo undergoing nonvascular surgery without significant effects on hemodynamics.
Study design: Randomized controlled trial.
Setting: One hundred thirty-five centers across 23 countries.
Synopsis: The POISE-II [PeriOperative Ischemic Evaluation-II] study randomized 10,010 patients in a 1:1:1:1 fashion to analyze peri-operative clonidine and aspirin against placebo. This paper specifically examined the effects of peri-operative clonidine vs. placebo. The average age of the population was 69 years old. The most common comorbidities were diabetes (38%) and coronary artery disease (23%).
The outcomes showed that clonidine vs. placebo yielded insignificant results with respect to the primary endpoints (death, MI, or stroke: 7.6% vs. 7.0%; P=0.30); however, there were significantly higher rates of clinically significant hypotension (47.6% vs. 37.1%; P<0.001), bradycardia (12.0% vs. 8.1%; P<0.001), and nonfatal cardiac arrest (0.3% vs. 0.1%; P=0.02) in the clonidine group.
These results differ from previous, smaller studies, which suggested that there were no significant hemodynamic changes when patients received peri-operative clonidine.
Bottom line: Peri-operative clonidine does not affect the rate of MI but increases clinically significant hypotension, bradycardia, and nonfatal cardiac arrest.
Citation: Devereaux PJ, Sessler DI, Leslie K, et al. Clonidine in patients undergoing noncardiac surgery. N Engl J Med. 2014;370(16):1504-1513.
Confusion Assessment Method (CAM-S) Evaluates Delirium Severity, Gauges Clinical Outcome
Clinical question: Can a delirium severity score that coincides with clinical outcomes be developed?
Background: Quantification of the severity of delirium is important. Building on the Confusion Assessment Method (CAM) scoring system, the CAM-S was developed to help evaluate the severity of delirium.
Study design: Validation analysis in two independent cohorts.
Setting: Three academic medical centers.
Synopsis: Two cohorts of patients were included. The sample from the SAGES [Successful Aging after Elective Surgery] study included 300 patients aged 70 years or older undergoing major surgery. The sample from the Project Recovery study included 919 medical patients aged 70 years or older. There was a predominance of women in both studies. Patients were excluded if they had delirium or dementia present at baseline, recent hospitalization, a terminal diagnosis, vision and auditory impairment, or inability to speak English. A short, four-item form and 10-item longer form were developed, and scores on forms were correlated with outcomes both in the hospital and after discharge.
A higher severity score in both short and long forms was associated with a higher length of stay, as well as relative risk of death and nursing home residence at 90 days.
Limitations to the study were that all patients in the study were 70 years and older and that the Project Recovery sample used an older data set from 1995-1998.
Bottom line: The CAM-S represents a new delirium severity measurement system; it is associated with several clinical outcomes.
Citation: Inouye SK, Kosar CM, Tommet D, et al. The CAM-S: development and validation of a new scoring system for delirium severity in 2 cohorts. Ann Intern Med. 2014;160(8):526-533.
Risk-Prediction Model for Recurrent Clostridium difficile Infection
Clinical question: What are the risk factors identified at the onset of illness that are associated with recurrent C. diff infection?
Background: After initial infection, 10%-25% of patients experience recurrent C. diff infection (CDI). The identification of patients at high risk of recurrence would be beneficial for therapeutic decision making.
Study design: Retrospective cohort study.
Setting: Large, urban, academic medical center.
Synopsis: Authors included 4,196 patients with an initial infection, defined by a positive C. diff toxin assay and unformed stools. A repeat positive toxin within 42 days of completing treatment for the initial infection represented recurrent CDI. Multiple characteristics were examined to identify risks of recurrent infection, including demographics and those related to acute and chronic disease. A logistic regression model was used to identify risk factors for recurrence.
Four hundred twenty-five patients (10.1%) had recurrent infection. Age, fluoroquinolone and high-risk antibiotic use, community-acquired healthcare-associated infection, multiple hospitalizations, and gastric acid suppression were found to predict recurrent infection through multivariate analysis.
Limitations of the study included potential confounding, use of observational data, and generalizability, given the urban academic medical center setting. This prediction model differs from previously developed models in that it identifies factors present at the onset of infection.
Bottom line: Multiple factors identified at the onset of illness can predict CDI recurrence.
Citation: Zilberberg MD, Reske K, Olsen M, Yan Y, Dubberke ER. Development and validation of a recurrent Clostridium difficile risk-prediction model. J Hosp Med. 2014;9(7):418-423.
Overdiagnosis in Pediatric Hospital Medicine Is Harming Children

Summary
One of PHM2014’s first breakout sessions, coming on the heels of Dr. Meuthing’s opening talk on reducing serious safety events, focused on the topic of overdiagnosis in pediatric HM and its contribution to patient harm. The first key point was the distinction between overdiagnosis and misdiagnosis. Overdiagnosis is the identification of an abnormality where detection will not benefit the patient. This is different from misdiagnosis or incorrect diagnosis. Overdiagnosis has grown over the years due to several causes, including our fear of missing a diagnosis and the increasing use of screening tests.
The speakers outlined many, varied drivers of overdiagnosis, including physicians’ unawareness of overdiagnosis, physicians’ discomfort with uncertainty, physicians’ inherent belief in technology and its results, quality measures based on usage and testing, a perceived imperative to use testing and technology because it is available, and system incentives such as fee for service, which reimburses or rewards increased testing. The classic example of overdiagnosis in pediatrics is asymptomatic urinary screening for neuroblastomas, where studies showed an increase in testing and an increase in diagnosis but no change in mortality. A current example is children receiving head CT scans for minor head trauma, which can lead to a diagnosis of small asymptomatic head bleeds or nondisplaced skull fractures, which can in turn lead to PICU admissions, transfers to higher level centers, prophylactic administration of anti-seizure medications, and repeat CT scans.
From the patient perspective, overdiagnosis can lead to unnecessary hospitalizations, inappropriate medications and treatments, and increased patient or parental anxiety secondary to a diagnosis or disease label.
How Should Hyponatremia Be Evaluated and Managed?
Case
A 67-year-old male patient who has depression and is on sertraline presents with increasing confusion over the past week. Initial plasma sodium is 109 mEq/L. On exam, he weighs 70 kg and is euvolemic. His urine osmolarity (Uosm) is 800 mosm/L with a urine sodium (UNa) of 40 mEq/L. He is somnolent but awakens to sternal rub. How should this patient’s hyponatremia be evaluated and managed?
Overview
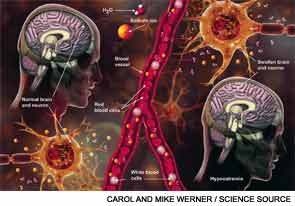
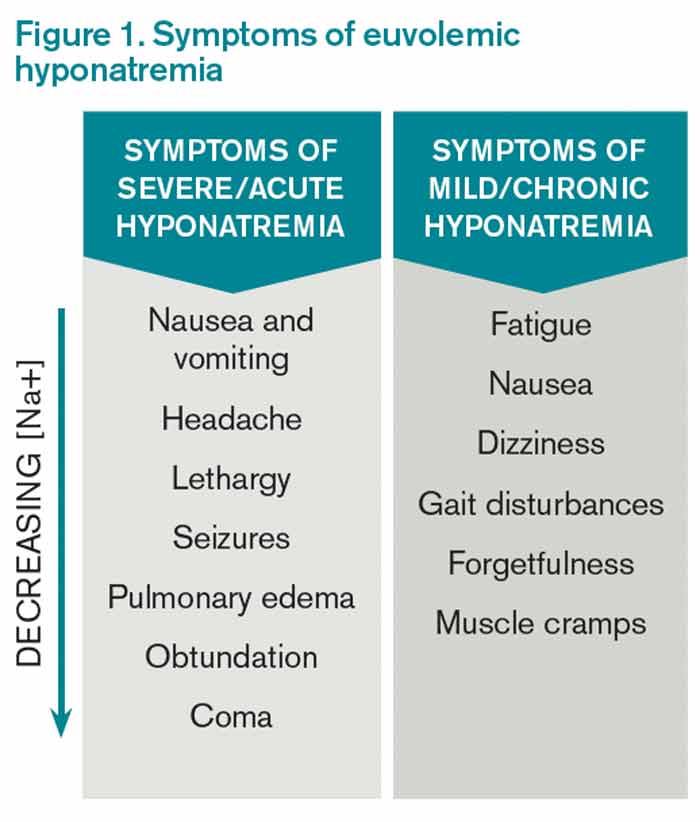
Hyponatremia, a disorder of excess total body water in relation to sodium, occurs in up to 42% of hospitalized patients.1,2 Regardless of the cause, hyponatremia is usually associated with the syndrome of inappropriate antidiuretic hormone secretion (SIADH) or with the appropriate elevation of antidiuretic hormone (ADH), known as hypovolemia. ADH is produced in the hypothalamus and released in the posterior pituitary in response to increasing plasma osmolarity (pOSM) or effective circulating volume depletion. ADH acts in the cortical collecting duct to increase the number of luminal aquaporin channels, increasing water reabsorption and decreasing plasma osmolarity. When hyponatremia is severe, the movement of water into cells causes cellular brain swelling, and clinical symptoms progress from malaise, headache, and nausea to obtundation, seizures, or respiratory arrest (see Figure 1). Even mild, chronic hyponatremia (120-131 mEq/L) is associated with an increased risk of falls due to mild gait and attention impairment.3
Evaluation
Step 1: Plasma osmolarity
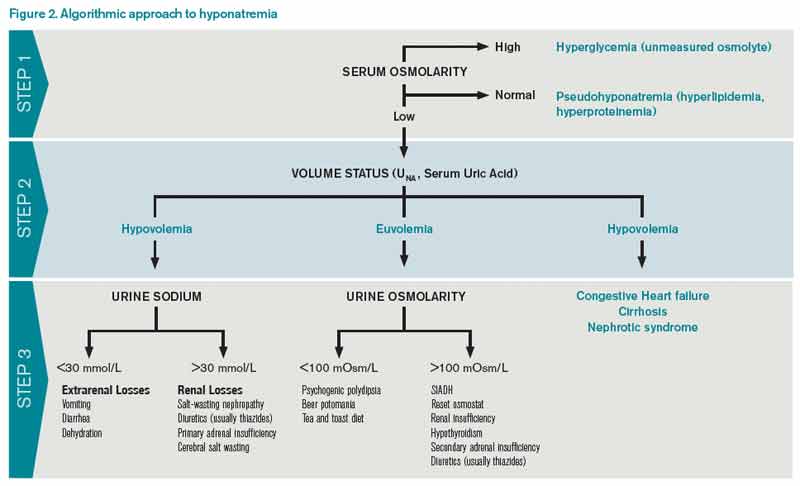
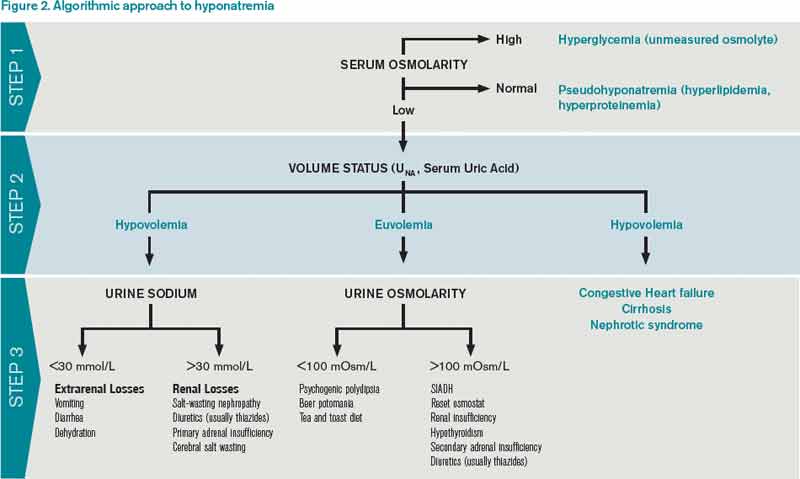
The first step in diagnosing the cause of hyponatremia and treating it is to measure pOSM. The majority of patients with hyponatremia have hypoosmolar hyponatremia and therefore have a low pOSM; however, patients may have normal or high osmolarity. Hyponatremia with normal osmolarity can be caused by pseudohyponatremia (i.e., hyperglycemia, paraproteinemia, hyperlipidemia), severe renal failure, ingestion of excess alcohol, or post-transurethral resection of prostate or bladder.
Hyponatremia with high pOSM occurs as a result of elevated levels of an extra solute in the plasma that does not readily enter cells. This draws water into the extracellular fluid and lowers the sodium concentration. This will most commonly result from hyperglycemia or infusion of mannitol.
Step 2: Assess volume status with physical exam, urine sodium (UNa)
The majority of patients with hyponatremia will have low pOSM. These patients should be categorized by volume status: hypovolemic, euvolemic, or hypervolemic (see Figure 2). On exam, hypervolemia is usually evident, and the cause of hypervolemic hyponatremia is usually elicited from a patient’s history; however, differentiating between hypovolemic and euvolemic hyponatremia by history and physical exam can be difficult, because examination findings are neither sensitive nor specific.4 UNa should always be evaluated, especially when differentiating between hypovolemic and euvolemic. This was illustrated in a study of 58 non-edematous patients with hyponatremia. Investigators determined which patients had hypovolemic hyponatremia based on their response to saline infusion. Of the patients identified as hypovolemic using physical exam, only 47% responded to saline. In contrast, a spot UNa of less than 30 mEq/L was 80% sensitive and 100% specific for saline responsiveness.5 Although the majority of hypovolemic hyponatremia patients will have a low UNa, the following causes of hypovolemic hyponatremia can result in high UNa: diuretics, adrenal insufficiency, salt-wasting nephropathy, and cerebral salt-wasting.
A low serum uric acid can also be useful in differentiating hypovolemic and euvolemic hyponatremia, which is most commonly caused by SIADH. In SIADH, there is urinary wasting of uric acid, which leads to low serum uric acid. In a study of 105 patients with lung cancer, a serum uric acid of less than 4 mg/dL was 75% sensitive and 89% specific for SIADH.6
Step 3: Urine osmolarity
After determining volume status, the physician should determine if there is excess ADH by measuring Uosm. Under normal conditions, hyponatremia should suppress ADH secretion and allow the kidney to excrete water by diluting the urine to less than 100 mosm/L. If Uosm is less than 100 mosm/L, then the kidneys are responding appropriately and can only persist in the following situations: The patient is drinking large volumes of water (e.g. primary polydipsia), there is insufficient solute to excrete free water (e.g. beer potomania, “tea and toast” diet), or the patient has a different set point for ADH suppression (i.e., reset osmostat). After determining volume status, UNa, and Uosm, the physician will have narrowed the cause of hyponatremia significantly (see Figure 2). Of note, when SIADH is diagnosed, it is important to look for and reverse causes (see Figure 3).
Treatment
Severe symptomatic hyponatremia
In patients with severe neurologic symptoms, physicians must balance the need to reduce symptoms quickly with the dangers of overly rapid correction. After its use in marathon runners, several experts have endorsed the following regimen to reduce symptoms rapidly: an intravenous bolus of 100 mL of 3% saline is given and repeated if symptoms persist after 10 minutes.7,8 Once symptoms improve, the basal rate can be calculated using the equation below, but the rate of sodium correction in 24 hours with this regimen should not exceed 6 to 8 mEq/L in 24 hours or 12 to 14 mEq/L in 48 hours.9,10 This is based on several case studies showing that there were no cases of central pontine myelinolysis (CPM) if correction rates were less than 10 mEq/L over 24 hours.11,12
It is important to remember that this is only a rough guide, because the equation assumes the entire infusate is retained and there is no sodium or water output. The best way to avoid overly rapid correction is to check serum sodium every two hours and monitor urine output closely. If the patient is making large volumes of urine, serum sodium may be rising too quickly. If the patient corrects too rapidly, it may be possible to avoid CPM by re-lowering the sodium.13 This can be accomplished by giving desmopressin to slow urinary free water loss while simultaneously giving hypotonic fluids.
Asymptomatic or mildly symptomatic hyponatremia
Hypovolemic hyponatremia: Treatment of hypovolemic hyponatremia is aimed at correcting volume status, the underlying problem that drives ADH secretion. The body will always choose to preserve volume over osmolarity. In most cases, normal saline (NS) should be used to restore intravascular volume, and the rate of infusion can be calculated using the same equation as above. Once volume is replete, ADH release will cease. Patients will be in danger of overly rapid correction of serum sodium, so fluids should be switched to hypotonic solutions, such as ½ NS.
Euvolemic Hyponatremia: Euvolemic hyponatremia, typically caused by SIADH, is characterized by a high Uosm (>100 mosm/L) and a high UNa (>30 mEq/L). All patients require free water restriction, and fluid intake should be at least 500 mL below a patient’s urine output, usually one liter or less. If this is ineffective, salt tabs can be given. Salt tabs will increase the solute load, necessitating an increase in urine output. Patients should be given approximately nine grams of salt tabs in three divided doses (equivalent to 1 L of NS). Patients with highly concentrated urine (Uosm >500 mosm/L) will not respond as well to the salt load, because the kidneys will continue to excrete much of the sodium in a concentrated urine. In such patients, a loop diuretic can be used to help excrete free water, because it decreases the Uosm to about ½ NS (154 mOsm/L). One possible regimen is 20-40 mg of oral furosemide two to three times daily.
Hypervolemic Hyponatremia: Hypervolemic hyponatremia is caused by congestive heart failure (CHF), cirrhosis, or nephrotic syndrome. In all cases, there is excess ADH as a result of the carotid baroreceptors sensing a decrease in effective circulation volume. In the case of CHF and cirrhosis, the degree of hyponatremia is a marker of disease severity, but there is no data to show that correction of hyponatremia improves outcomes. Fluid restriction is the cornerstone of therapy, but if the patient’s volume status is not optimized, then loop diuretics may improve hyponatremia through excretion of diluted urine. In addition, angiotensin-converting enzyme inhibitors can improve hyponatremia in CHF by reducing ADH levels and improving cardiac output via afterload reduction.
There has been recent interest in the use of vasopressin V2 receptor antagonists or “vaptans.” The SALT 1 and 2 trials, which included patients with CHF and cirrhosis, showed that they are effective in increasing serum sodium and improving mental function in the short term. But there are concerns about hepatotoxicity, overly rapid correction of serum sodium, lack of mortality benefit, and cost.14 The latest American Heart Association CHF guidelines recommend (class IIb) vaptans in patients with “hyponatremia that may be causing cognitive symptoms when standard measures have failed.”15 Tolvaptan, in particular, should not be used in cirrhotic patients due to concerns of hepatotoxicity.
Outcome of the Case
Because of the high UNa and Uosm and the use of a selective serotonin reuptake inhibitor (SSRI), the treating physician suspects the patient has SIADH. Given the severe symptoms, he is given 100 mL of 3% hypertonic saline and experiences improvement in his lethargy. Repeat sodium is 112 mEq/L. Using the equation above, a basal rate is calculated:
Change in serum sodium from 1 L of 3% saline= 514 mEq/L -112 mEq/L = 9.4 mEq 43 L
Because the goal correction rate is 6-8 mEq/L in 24 hours and the sodium has already increased by three, the physician elects to increase the sodium by 5 mEq/L for a total of 8 mEq/L for 24 hours:
5.0 mEq x 1000 ml = 532 ml of 3% saline ÷ 24 hours = 22 mL/hr. 9.4 mEq
Serum sodium is checked every two hours. The following day, the sodium is 115 mEq/L and the patient is fully alert. The hypertonic saline is stopped and the patient is maintained on free water restriction. Some 72 hours later, the sodium is 124 mEq/L.
Dr. Chang is co-director of the medicine-geriatrics clerkship, director of education in the division of hospital medicine, and assistant professor in the department of medicine at Mount Sinai Medical Center in New York City. Dr. Madeira is clinical instructor in the department of general internal medicine at the NYU School of Medicine and a hospitalist at the VA NY Harbor Healthcare System.
References
- Hoorn EJ, Lindemans J, Zietse R. Development of severe hyponatraemia in hospitalized patients: Treatment-related risk factors and inadequate management. Nephrol Dial Transplant. 2006;21(1):70-76.
- Hawkins RC. Age and gender as risk factors for hyponatremia and hypernatremia. Clin Chim Acta. 2003;337(1-2):169-172.
- Renneboog B, Musch W, Vandemergel X, Manto MU, Decaux G. Mild chronic hyponatremia is associated with falls, unsteadiness, and attention deficits. Am J Med. 2006;119(1):71.e1-8.
- McGee S, Abernethy WB 3rd, Simel DL. The rational clinical examination: Is this patient hypovolemic? JAMA. 1999;281(11):1022-1029.
- Chung HM, Kluge R, Schrier RW, Anderson RJ. Clinical assessment of extracellular fluid volume in hyponatremia. Am J Med. 1987;83(5):905-908.
- Passamonte PM. Hypouricemia, inappropriate secretion of antidiuretic hormone, and small cell carcinoma of the lung. Arch Intern Med. 1984;144(8):1569-1570.
- Verbalis JG, Goldsmith SR, Greenberg A, et al. Diagnosis, evaluation, and treatment of hyponatremia: expert panel recommendations. Am J Med. 2013;126(10 Suppl 1):S1-42.
- Rogers IR, Hook G, Stuempfle KJ, Hoffman MD, Hew-Butler, T. An intervention study of oral versus intravenous hypertonic saline administration in ultramarathon runners with exercise-associated hyponatremia: a preliminary randomized trial. Clin J Sport Med. 2011;21(3):200-203.
- Adrogué HJ, Madias NE. Hyponatremia. N Engl J Med. 2000;342(21):1581-1589.
- Tzamaloukas AH, Malhotra D, Rosen BH, Raj DS, Murata GH, Shapiro JI. Principles of management of severe hyponatremia. J Am Heart Assoc. 2013;2(1):e005199.
- Sterns RH. Severe symptomatic hyponatremia: Treatment and outcome. A study of 64 cases. Ann Intern Med. 1987;107(5):656-664.
- Karp BI, Laureno R. Pontine and extrapontine myelinolysis: a neurologic disorder following rapid correction of hyponatremia. Medicine (Baltimore). 1993;72(6):359-373.
- Soupart A, Penninckx R, Crenier L, Stenuit A, Perier O, Decaux G. Prevention of brain demyelination in rats after excessive correction of chronic hyponatremia by serum sodium lowering. Kidney Int. 1994;45(1):193-200.
- Schrier RW, Gross P, Gheorghiade M, et al. Tolvaptan, a selective oral vasopressin V2-receptor antagonist, for hyponatremia. N Engl J Med. 2006;355(20):2099-2112.
- Yancy CW, Jessup M, Bozkurt B, et al. 2013 ACCF/AHA guideline for the management of heart failure: A report of the American College of Cardiology Foundation/American Heart Association Task Force on Practice Guidelines. J Am Coll Cardiol. 2013;62(16):e147-239.
Case
A 67-year-old male patient who has depression and is on sertraline presents with increasing confusion over the past week. Initial plasma sodium is 109 mEq/L. On exam, he weighs 70 kg and is euvolemic. His urine osmolarity (Uosm) is 800 mosm/L with a urine sodium (UNa) of 40 mEq/L. He is somnolent but awakens to sternal rub. How should this patient’s hyponatremia be evaluated and managed?
Overview
Hyponatremia, a disorder of excess total body water in relation to sodium, occurs in up to 42% of hospitalized patients.1,2 Regardless of the cause, hyponatremia is usually associated with the syndrome of inappropriate antidiuretic hormone secretion (SIADH) or with the appropriate elevation of antidiuretic hormone (ADH), known as hypovolemia. ADH is produced in the hypothalamus and released in the posterior pituitary in response to increasing plasma osmolarity (pOSM) or effective circulating volume depletion. ADH acts in the cortical collecting duct to increase the number of luminal aquaporin channels, increasing water reabsorption and decreasing plasma osmolarity. When hyponatremia is severe, the movement of water into cells causes cellular brain swelling, and clinical symptoms progress from malaise, headache, and nausea to obtundation, seizures, or respiratory arrest (see Figure 1). Even mild, chronic hyponatremia (120-131 mEq/L) is associated with an increased risk of falls due to mild gait and attention impairment.3
Evaluation
Step 1: Plasma osmolarity
The first step in diagnosing the cause of hyponatremia and treating it is to measure pOSM. The majority of patients with hyponatremia have hypoosmolar hyponatremia and therefore have a low pOSM; however, patients may have normal or high osmolarity. Hyponatremia with normal osmolarity can be caused by pseudohyponatremia (i.e., hyperglycemia, paraproteinemia, hyperlipidemia), severe renal failure, ingestion of excess alcohol, or post-transurethral resection of prostate or bladder.
Hyponatremia with high pOSM occurs as a result of elevated levels of an extra solute in the plasma that does not readily enter cells. This draws water into the extracellular fluid and lowers the sodium concentration. This will most commonly result from hyperglycemia or infusion of mannitol.
Step 2: Assess volume status with physical exam, urine sodium (UNa)
The majority of patients with hyponatremia will have low pOSM. These patients should be categorized by volume status: hypovolemic, euvolemic, or hypervolemic (see Figure 2). On exam, hypervolemia is usually evident, and the cause of hypervolemic hyponatremia is usually elicited from a patient’s history; however, differentiating between hypovolemic and euvolemic hyponatremia by history and physical exam can be difficult, because examination findings are neither sensitive nor specific.4 UNa should always be evaluated, especially when differentiating between hypovolemic and euvolemic. This was illustrated in a study of 58 non-edematous patients with hyponatremia. Investigators determined which patients had hypovolemic hyponatremia based on their response to saline infusion. Of the patients identified as hypovolemic using physical exam, only 47% responded to saline. In contrast, a spot UNa of less than 30 mEq/L was 80% sensitive and 100% specific for saline responsiveness.5 Although the majority of hypovolemic hyponatremia patients will have a low UNa, the following causes of hypovolemic hyponatremia can result in high UNa: diuretics, adrenal insufficiency, salt-wasting nephropathy, and cerebral salt-wasting.
A low serum uric acid can also be useful in differentiating hypovolemic and euvolemic hyponatremia, which is most commonly caused by SIADH. In SIADH, there is urinary wasting of uric acid, which leads to low serum uric acid. In a study of 105 patients with lung cancer, a serum uric acid of less than 4 mg/dL was 75% sensitive and 89% specific for SIADH.6
Step 3: Urine osmolarity
After determining volume status, the physician should determine if there is excess ADH by measuring Uosm. Under normal conditions, hyponatremia should suppress ADH secretion and allow the kidney to excrete water by diluting the urine to less than 100 mosm/L. If Uosm is less than 100 mosm/L, then the kidneys are responding appropriately and can only persist in the following situations: The patient is drinking large volumes of water (e.g. primary polydipsia), there is insufficient solute to excrete free water (e.g. beer potomania, “tea and toast” diet), or the patient has a different set point for ADH suppression (i.e., reset osmostat). After determining volume status, UNa, and Uosm, the physician will have narrowed the cause of hyponatremia significantly (see Figure 2). Of note, when SIADH is diagnosed, it is important to look for and reverse causes (see Figure 3).
Treatment
Severe symptomatic hyponatremia
In patients with severe neurologic symptoms, physicians must balance the need to reduce symptoms quickly with the dangers of overly rapid correction. After its use in marathon runners, several experts have endorsed the following regimen to reduce symptoms rapidly: an intravenous bolus of 100 mL of 3% saline is given and repeated if symptoms persist after 10 minutes.7,8 Once symptoms improve, the basal rate can be calculated using the equation below, but the rate of sodium correction in 24 hours with this regimen should not exceed 6 to 8 mEq/L in 24 hours or 12 to 14 mEq/L in 48 hours.9,10 This is based on several case studies showing that there were no cases of central pontine myelinolysis (CPM) if correction rates were less than 10 mEq/L over 24 hours.11,12
It is important to remember that this is only a rough guide, because the equation assumes the entire infusate is retained and there is no sodium or water output. The best way to avoid overly rapid correction is to check serum sodium every two hours and monitor urine output closely. If the patient is making large volumes of urine, serum sodium may be rising too quickly. If the patient corrects too rapidly, it may be possible to avoid CPM by re-lowering the sodium.13 This can be accomplished by giving desmopressin to slow urinary free water loss while simultaneously giving hypotonic fluids.
Asymptomatic or mildly symptomatic hyponatremia
Hypovolemic hyponatremia: Treatment of hypovolemic hyponatremia is aimed at correcting volume status, the underlying problem that drives ADH secretion. The body will always choose to preserve volume over osmolarity. In most cases, normal saline (NS) should be used to restore intravascular volume, and the rate of infusion can be calculated using the same equation as above. Once volume is replete, ADH release will cease. Patients will be in danger of overly rapid correction of serum sodium, so fluids should be switched to hypotonic solutions, such as ½ NS.
Euvolemic Hyponatremia: Euvolemic hyponatremia, typically caused by SIADH, is characterized by a high Uosm (>100 mosm/L) and a high UNa (>30 mEq/L). All patients require free water restriction, and fluid intake should be at least 500 mL below a patient’s urine output, usually one liter or less. If this is ineffective, salt tabs can be given. Salt tabs will increase the solute load, necessitating an increase in urine output. Patients should be given approximately nine grams of salt tabs in three divided doses (equivalent to 1 L of NS). Patients with highly concentrated urine (Uosm >500 mosm/L) will not respond as well to the salt load, because the kidneys will continue to excrete much of the sodium in a concentrated urine. In such patients, a loop diuretic can be used to help excrete free water, because it decreases the Uosm to about ½ NS (154 mOsm/L). One possible regimen is 20-40 mg of oral furosemide two to three times daily.
Hypervolemic Hyponatremia: Hypervolemic hyponatremia is caused by congestive heart failure (CHF), cirrhosis, or nephrotic syndrome. In all cases, there is excess ADH as a result of the carotid baroreceptors sensing a decrease in effective circulation volume. In the case of CHF and cirrhosis, the degree of hyponatremia is a marker of disease severity, but there is no data to show that correction of hyponatremia improves outcomes. Fluid restriction is the cornerstone of therapy, but if the patient’s volume status is not optimized, then loop diuretics may improve hyponatremia through excretion of diluted urine. In addition, angiotensin-converting enzyme inhibitors can improve hyponatremia in CHF by reducing ADH levels and improving cardiac output via afterload reduction.
There has been recent interest in the use of vasopressin V2 receptor antagonists or “vaptans.” The SALT 1 and 2 trials, which included patients with CHF and cirrhosis, showed that they are effective in increasing serum sodium and improving mental function in the short term. But there are concerns about hepatotoxicity, overly rapid correction of serum sodium, lack of mortality benefit, and cost.14 The latest American Heart Association CHF guidelines recommend (class IIb) vaptans in patients with “hyponatremia that may be causing cognitive symptoms when standard measures have failed.”15 Tolvaptan, in particular, should not be used in cirrhotic patients due to concerns of hepatotoxicity.
Outcome of the Case
Because of the high UNa and Uosm and the use of a selective serotonin reuptake inhibitor (SSRI), the treating physician suspects the patient has SIADH. Given the severe symptoms, he is given 100 mL of 3% hypertonic saline and experiences improvement in his lethargy. Repeat sodium is 112 mEq/L. Using the equation above, a basal rate is calculated:
Change in serum sodium from 1 L of 3% saline= 514 mEq/L -112 mEq/L = 9.4 mEq 43 L
Because the goal correction rate is 6-8 mEq/L in 24 hours and the sodium has already increased by three, the physician elects to increase the sodium by 5 mEq/L for a total of 8 mEq/L for 24 hours:
5.0 mEq x 1000 ml = 532 ml of 3% saline ÷ 24 hours = 22 mL/hr. 9.4 mEq
Serum sodium is checked every two hours. The following day, the sodium is 115 mEq/L and the patient is fully alert. The hypertonic saline is stopped and the patient is maintained on free water restriction. Some 72 hours later, the sodium is 124 mEq/L.
Dr. Chang is co-director of the medicine-geriatrics clerkship, director of education in the division of hospital medicine, and assistant professor in the department of medicine at Mount Sinai Medical Center in New York City. Dr. Madeira is clinical instructor in the department of general internal medicine at the NYU School of Medicine and a hospitalist at the VA NY Harbor Healthcare System.
References
- Hoorn EJ, Lindemans J, Zietse R. Development of severe hyponatraemia in hospitalized patients: Treatment-related risk factors and inadequate management. Nephrol Dial Transplant. 2006;21(1):70-76.
- Hawkins RC. Age and gender as risk factors for hyponatremia and hypernatremia. Clin Chim Acta. 2003;337(1-2):169-172.
- Renneboog B, Musch W, Vandemergel X, Manto MU, Decaux G. Mild chronic hyponatremia is associated with falls, unsteadiness, and attention deficits. Am J Med. 2006;119(1):71.e1-8.
- McGee S, Abernethy WB 3rd, Simel DL. The rational clinical examination: Is this patient hypovolemic? JAMA. 1999;281(11):1022-1029.
- Chung HM, Kluge R, Schrier RW, Anderson RJ. Clinical assessment of extracellular fluid volume in hyponatremia. Am J Med. 1987;83(5):905-908.
- Passamonte PM. Hypouricemia, inappropriate secretion of antidiuretic hormone, and small cell carcinoma of the lung. Arch Intern Med. 1984;144(8):1569-1570.
- Verbalis JG, Goldsmith SR, Greenberg A, et al. Diagnosis, evaluation, and treatment of hyponatremia: expert panel recommendations. Am J Med. 2013;126(10 Suppl 1):S1-42.
- Rogers IR, Hook G, Stuempfle KJ, Hoffman MD, Hew-Butler, T. An intervention study of oral versus intravenous hypertonic saline administration in ultramarathon runners with exercise-associated hyponatremia: a preliminary randomized trial. Clin J Sport Med. 2011;21(3):200-203.
- Adrogué HJ, Madias NE. Hyponatremia. N Engl J Med. 2000;342(21):1581-1589.
- Tzamaloukas AH, Malhotra D, Rosen BH, Raj DS, Murata GH, Shapiro JI. Principles of management of severe hyponatremia. J Am Heart Assoc. 2013;2(1):e005199.
- Sterns RH. Severe symptomatic hyponatremia: Treatment and outcome. A study of 64 cases. Ann Intern Med. 1987;107(5):656-664.
- Karp BI, Laureno R. Pontine and extrapontine myelinolysis: a neurologic disorder following rapid correction of hyponatremia. Medicine (Baltimore). 1993;72(6):359-373.
- Soupart A, Penninckx R, Crenier L, Stenuit A, Perier O, Decaux G. Prevention of brain demyelination in rats after excessive correction of chronic hyponatremia by serum sodium lowering. Kidney Int. 1994;45(1):193-200.
- Schrier RW, Gross P, Gheorghiade M, et al. Tolvaptan, a selective oral vasopressin V2-receptor antagonist, for hyponatremia. N Engl J Med. 2006;355(20):2099-2112.
- Yancy CW, Jessup M, Bozkurt B, et al. 2013 ACCF/AHA guideline for the management of heart failure: A report of the American College of Cardiology Foundation/American Heart Association Task Force on Practice Guidelines. J Am Coll Cardiol. 2013;62(16):e147-239.
Epidemiology, Consequences of Non-Leg VTE
Clinical question: Which risk factors are key in the development of nonleg deep vein thromboses (NLDVTs) and what are the expected clinical sequelae from these events?
Background: Critically ill patients are at increased risk of venous thrombosis. Despite adherence to recommended daily thromboprophylaxis, many patients will develop a venous thrombosis in a vein other than the lower extremity. The association between NLDVT and pulmonary embolism (PE) or death is less clearly identified.
Study design: The PROphylaxis for ThromboEmbolism in Critical Care Trial (PROTECT), a multicenter, randomized, blinded, and concealed prospective cohort study occurring between May 2006 and June 2010.
Setting: Sixty-seven international secondary and tertiary care ICUs in both academic and community settings.
Synopsis: Researchers enrolled 3,746 ICU patients in a randomized controlled trial of dalteparin vs. standard heparin for thromboprophylaxis. Of these patients, 84 (2.2%) developed a NLDVT. These thromboses were more likely to be deep and located proximally.
Risk factors were assessed using five selected variables: APACHE [acute physiology and chronic health evaluation], BMI, malignancy, and treatment with vasopressors or statins. Outside of indwelling upper extremity central venous catheters, cancer was the only independent predictor of NLDVT.
Compared to patients without any VTE, those with NLDVT were more likely to develop PE (14.9% vs. 1.9%) and have longer ICU stays (19 vs. nine days). On average, one in seven patients with NLDVT developed PE during their hospital stay. Despite the association with PE, NLDVT was not associated with an increased ICU mortality in an adjusted model.
However, the PROTECT trial may have been underpowered to detect a difference. Additional limitations of the study included a relatively small total number of NLDVTs and a lack of standardized screening protocols for both NLDVT and PE.
Bottom line: Despite universal heparin thromboprophylaxis, many medical-surgical critically ill patients may develop NLDVT, placing them at higher risk for longer ICU stays and PE.
Citation: Lamontagne F, McIntyre L, Dodek P, et al. Nonleg venous thrombosis in critically ill adults: a nested prospective cohort study. JAMA Intern Med. 2014;174(5):689-696.