User login
For MD-IQ use only
Most U.S. adults age 50+ report good health: Survey
a nonprofit hospice/advanced illness care organization based in Virginia.
Among the respondents, 41% said their health was very good or excellent.
However, the ratings differed largely by race, employment status, and income.
Employment status was also associated with a significant difference in the way people viewed their health at the top tier and bottom tier.
The middle tier (“good” health) was reported similarly (from 33% to 37%) whether a person was employed, retired, or not employed. However, employed respondents were much more likely to report they had “excellent” or “very good” health (51% vs. 44% for retirees and 21% for the not employed).
Conversely, those who were not employed were far more likely to report “fair” or “poor” health (45%) than those who were employed (13%) or retired (20%).
Similarly, respondents with incomes of less than $50,000 were three times more likely to report their health as “fair” or “poor” than were those with incomes of more than $100,000 (36% vs. 12%).
WebMD/CCH surveyed 3,464 U.S. residents ages 50 and older between Aug. 13 and Nov. 9, 2020. WebMD.com readers were randomly invited to take a 10-minute online survey.
Aging at home a priority
The survey also highlighted a strong preference for aging in place, says Steve Cone, chief of communications and philanthropy at CCH.
“More now than ever before, thanks to the COVID experience, baby boomers and their children really believe that’s the holy grail,” he says.
Mr. Cone notes that the quick spread of COVID-19 through some nursing homes early in the pandemic likely has strengthened people’s resolve to live out their lives in their own homes.
The survey indicated that 85% of people aged 50+ who are living in their own home, a family member’s home, or a loved one’s home responded that it is “very important” or “important” to stay in their home as they age.
When asked what services they would need to continue their living situation, the most common responses were housekeeping, home repair services, and transportation (listed as needs by 35% to 45% of respondents). Regarding changes they would have to make to feel safe in their home as they age, installing grab bars and/or safety rails in the bath/shower was the most popular answer (50%).
Use of telemedicine
Respondents were also asked about their acceptance of telemedicine, and 62% said they would be likely or very likely to engage in virtual visits with a doctor it in the future.
However, the likelihood varied by income level. Specifically, respondents with incomes over $100,000 were significantly more likely to say they would use telemedicine in the future than were those with incomes below $50,000 (74% vs. 60%). They were also more likely to already have used telemedicine.
Although respondents generally embraced telemedicine, they are less confident about some types of monitoring, according to Mr. Cone.
Emergency response (64%) was the leading type of remote monitoring respondents ages 50 and older would allow. Only a minority of respondents would allow the other types of monitoring asked about in the survey.
Close to one-quarter of respondents would not allow any type of monitoring.
Fewer than one-third would allow tracking of medication compliance, refrigerator use, sleep habits, or bathroom use.
People see monitoring of some movements as “Orwellian,” Mr. Cone says.
Knowledge of hospice
The survey findings support the need for more widespread use of hospice so people can stay in their homes as they age, Mr. Cone says.
When illness gets severe, “There’s no reason you have to get rushed to the emergency room or wind up in a hospital,” Mr. Cone says.
He notes that hospice and palliative care can come to patients wherever they reside – in their home, an assisted living center, a nursing home, or even a hospital room.
“That doesn’t mean the physician isn’t involved,” he says. “But working as a team, we can keep them in their homes and their lifestyle intact.”
Patients whose doctors attest that they are likely to live a maximum 6 months are eligible for hospice. But most families wait too long to long to start hospice or palliative care for a patient, Mr. Cone says, and may not be aware of what these services typically cover, including meal preparation and pet care.
In the survey, nearly one-third of respondents said they did not know that palliative care is something that “can be given at any stage of a serious illness” or “provides non-medical services (e.g., patient/family communication, help with insurance issues, scheduling appointments, arranging transportation).”
He notes palliative care and hospice are covered by Medicare and Medicaid and also by most private insurance plans or by individual companies providing the service.
However, health care providers may have to overcome a general reluctance to discuss hospice when sharing options for those severely ill.
The survey showed that while 51% of those 50 and older are at least “slightly interested” in learning more about hospice, a nearly equal number say they are “not at all interested” (49%).
Most using hospice are White
More than 90% of those surveyed reported that aspects of hospice care, including “comfort and relief from pain at the end of patients’ lives,” providing a dedicated care team, and an alternative to other care settings, are “very important” or “important.”
However, national hospice use rates are extremely low for minorities and the LGBTQ community, according to Mr. Cone. Among Medicare hospice recipients, 82% were white, 8.2% Black, 6.7% Hispanic, and 1.8% Asian or Pacific Islander, according to the National Hospice and Palliative Care Organization.
Those numbers signal a need for outreach to those communities with information on what services are available and how to access them, he says.
Health costs top concern
The survey also asked about level of concern regarding matters including family, health, financials, and end-of-life directives and found adults aged 50 and older expressed the greatest amount of concern for health care costs that are not covered by insurance.
More than half (56%) said they were concerned or very concerned about those costs, which was higher than the percentage concerned about losing a spouse (49%).
Respondents were less concerned (“slightly concerned” or “not at all concerned”) about their children living far away, planning end-of life-directives, and falling or having reduced mobility.
A version of this article first appeared on WebMD.com.
a nonprofit hospice/advanced illness care organization based in Virginia.
Among the respondents, 41% said their health was very good or excellent.
However, the ratings differed largely by race, employment status, and income.
Employment status was also associated with a significant difference in the way people viewed their health at the top tier and bottom tier.
The middle tier (“good” health) was reported similarly (from 33% to 37%) whether a person was employed, retired, or not employed. However, employed respondents were much more likely to report they had “excellent” or “very good” health (51% vs. 44% for retirees and 21% for the not employed).
Conversely, those who were not employed were far more likely to report “fair” or “poor” health (45%) than those who were employed (13%) or retired (20%).
Similarly, respondents with incomes of less than $50,000 were three times more likely to report their health as “fair” or “poor” than were those with incomes of more than $100,000 (36% vs. 12%).
WebMD/CCH surveyed 3,464 U.S. residents ages 50 and older between Aug. 13 and Nov. 9, 2020. WebMD.com readers were randomly invited to take a 10-minute online survey.
Aging at home a priority
The survey also highlighted a strong preference for aging in place, says Steve Cone, chief of communications and philanthropy at CCH.
“More now than ever before, thanks to the COVID experience, baby boomers and their children really believe that’s the holy grail,” he says.
Mr. Cone notes that the quick spread of COVID-19 through some nursing homes early in the pandemic likely has strengthened people’s resolve to live out their lives in their own homes.
The survey indicated that 85% of people aged 50+ who are living in their own home, a family member’s home, or a loved one’s home responded that it is “very important” or “important” to stay in their home as they age.
When asked what services they would need to continue their living situation, the most common responses were housekeeping, home repair services, and transportation (listed as needs by 35% to 45% of respondents). Regarding changes they would have to make to feel safe in their home as they age, installing grab bars and/or safety rails in the bath/shower was the most popular answer (50%).
Use of telemedicine
Respondents were also asked about their acceptance of telemedicine, and 62% said they would be likely or very likely to engage in virtual visits with a doctor it in the future.
However, the likelihood varied by income level. Specifically, respondents with incomes over $100,000 were significantly more likely to say they would use telemedicine in the future than were those with incomes below $50,000 (74% vs. 60%). They were also more likely to already have used telemedicine.
Although respondents generally embraced telemedicine, they are less confident about some types of monitoring, according to Mr. Cone.
Emergency response (64%) was the leading type of remote monitoring respondents ages 50 and older would allow. Only a minority of respondents would allow the other types of monitoring asked about in the survey.
Close to one-quarter of respondents would not allow any type of monitoring.
Fewer than one-third would allow tracking of medication compliance, refrigerator use, sleep habits, or bathroom use.
People see monitoring of some movements as “Orwellian,” Mr. Cone says.
Knowledge of hospice
The survey findings support the need for more widespread use of hospice so people can stay in their homes as they age, Mr. Cone says.
When illness gets severe, “There’s no reason you have to get rushed to the emergency room or wind up in a hospital,” Mr. Cone says.
He notes that hospice and palliative care can come to patients wherever they reside – in their home, an assisted living center, a nursing home, or even a hospital room.
“That doesn’t mean the physician isn’t involved,” he says. “But working as a team, we can keep them in their homes and their lifestyle intact.”
Patients whose doctors attest that they are likely to live a maximum 6 months are eligible for hospice. But most families wait too long to long to start hospice or palliative care for a patient, Mr. Cone says, and may not be aware of what these services typically cover, including meal preparation and pet care.
In the survey, nearly one-third of respondents said they did not know that palliative care is something that “can be given at any stage of a serious illness” or “provides non-medical services (e.g., patient/family communication, help with insurance issues, scheduling appointments, arranging transportation).”
He notes palliative care and hospice are covered by Medicare and Medicaid and also by most private insurance plans or by individual companies providing the service.
However, health care providers may have to overcome a general reluctance to discuss hospice when sharing options for those severely ill.
The survey showed that while 51% of those 50 and older are at least “slightly interested” in learning more about hospice, a nearly equal number say they are “not at all interested” (49%).
Most using hospice are White
More than 90% of those surveyed reported that aspects of hospice care, including “comfort and relief from pain at the end of patients’ lives,” providing a dedicated care team, and an alternative to other care settings, are “very important” or “important.”
However, national hospice use rates are extremely low for minorities and the LGBTQ community, according to Mr. Cone. Among Medicare hospice recipients, 82% were white, 8.2% Black, 6.7% Hispanic, and 1.8% Asian or Pacific Islander, according to the National Hospice and Palliative Care Organization.
Those numbers signal a need for outreach to those communities with information on what services are available and how to access them, he says.
Health costs top concern
The survey also asked about level of concern regarding matters including family, health, financials, and end-of-life directives and found adults aged 50 and older expressed the greatest amount of concern for health care costs that are not covered by insurance.
More than half (56%) said they were concerned or very concerned about those costs, which was higher than the percentage concerned about losing a spouse (49%).
Respondents were less concerned (“slightly concerned” or “not at all concerned”) about their children living far away, planning end-of life-directives, and falling or having reduced mobility.
A version of this article first appeared on WebMD.com.
a nonprofit hospice/advanced illness care organization based in Virginia.
Among the respondents, 41% said their health was very good or excellent.
However, the ratings differed largely by race, employment status, and income.
Employment status was also associated with a significant difference in the way people viewed their health at the top tier and bottom tier.
The middle tier (“good” health) was reported similarly (from 33% to 37%) whether a person was employed, retired, or not employed. However, employed respondents were much more likely to report they had “excellent” or “very good” health (51% vs. 44% for retirees and 21% for the not employed).
Conversely, those who were not employed were far more likely to report “fair” or “poor” health (45%) than those who were employed (13%) or retired (20%).
Similarly, respondents with incomes of less than $50,000 were three times more likely to report their health as “fair” or “poor” than were those with incomes of more than $100,000 (36% vs. 12%).
WebMD/CCH surveyed 3,464 U.S. residents ages 50 and older between Aug. 13 and Nov. 9, 2020. WebMD.com readers were randomly invited to take a 10-minute online survey.
Aging at home a priority
The survey also highlighted a strong preference for aging in place, says Steve Cone, chief of communications and philanthropy at CCH.
“More now than ever before, thanks to the COVID experience, baby boomers and their children really believe that’s the holy grail,” he says.
Mr. Cone notes that the quick spread of COVID-19 through some nursing homes early in the pandemic likely has strengthened people’s resolve to live out their lives in their own homes.
The survey indicated that 85% of people aged 50+ who are living in their own home, a family member’s home, or a loved one’s home responded that it is “very important” or “important” to stay in their home as they age.
When asked what services they would need to continue their living situation, the most common responses were housekeeping, home repair services, and transportation (listed as needs by 35% to 45% of respondents). Regarding changes they would have to make to feel safe in their home as they age, installing grab bars and/or safety rails in the bath/shower was the most popular answer (50%).
Use of telemedicine
Respondents were also asked about their acceptance of telemedicine, and 62% said they would be likely or very likely to engage in virtual visits with a doctor it in the future.
However, the likelihood varied by income level. Specifically, respondents with incomes over $100,000 were significantly more likely to say they would use telemedicine in the future than were those with incomes below $50,000 (74% vs. 60%). They were also more likely to already have used telemedicine.
Although respondents generally embraced telemedicine, they are less confident about some types of monitoring, according to Mr. Cone.
Emergency response (64%) was the leading type of remote monitoring respondents ages 50 and older would allow. Only a minority of respondents would allow the other types of monitoring asked about in the survey.
Close to one-quarter of respondents would not allow any type of monitoring.
Fewer than one-third would allow tracking of medication compliance, refrigerator use, sleep habits, or bathroom use.
People see monitoring of some movements as “Orwellian,” Mr. Cone says.
Knowledge of hospice
The survey findings support the need for more widespread use of hospice so people can stay in their homes as they age, Mr. Cone says.
When illness gets severe, “There’s no reason you have to get rushed to the emergency room or wind up in a hospital,” Mr. Cone says.
He notes that hospice and palliative care can come to patients wherever they reside – in their home, an assisted living center, a nursing home, or even a hospital room.
“That doesn’t mean the physician isn’t involved,” he says. “But working as a team, we can keep them in their homes and their lifestyle intact.”
Patients whose doctors attest that they are likely to live a maximum 6 months are eligible for hospice. But most families wait too long to long to start hospice or palliative care for a patient, Mr. Cone says, and may not be aware of what these services typically cover, including meal preparation and pet care.
In the survey, nearly one-third of respondents said they did not know that palliative care is something that “can be given at any stage of a serious illness” or “provides non-medical services (e.g., patient/family communication, help with insurance issues, scheduling appointments, arranging transportation).”
He notes palliative care and hospice are covered by Medicare and Medicaid and also by most private insurance plans or by individual companies providing the service.
However, health care providers may have to overcome a general reluctance to discuss hospice when sharing options for those severely ill.
The survey showed that while 51% of those 50 and older are at least “slightly interested” in learning more about hospice, a nearly equal number say they are “not at all interested” (49%).
Most using hospice are White
More than 90% of those surveyed reported that aspects of hospice care, including “comfort and relief from pain at the end of patients’ lives,” providing a dedicated care team, and an alternative to other care settings, are “very important” or “important.”
However, national hospice use rates are extremely low for minorities and the LGBTQ community, according to Mr. Cone. Among Medicare hospice recipients, 82% were white, 8.2% Black, 6.7% Hispanic, and 1.8% Asian or Pacific Islander, according to the National Hospice and Palliative Care Organization.
Those numbers signal a need for outreach to those communities with information on what services are available and how to access them, he says.
Health costs top concern
The survey also asked about level of concern regarding matters including family, health, financials, and end-of-life directives and found adults aged 50 and older expressed the greatest amount of concern for health care costs that are not covered by insurance.
More than half (56%) said they were concerned or very concerned about those costs, which was higher than the percentage concerned about losing a spouse (49%).
Respondents were less concerned (“slightly concerned” or “not at all concerned”) about their children living far away, planning end-of life-directives, and falling or having reduced mobility.
A version of this article first appeared on WebMD.com.
The Peer Review Process During the COVID-19 Pandemic
The COVID-19 pandemic put unparalleled strain on US health care systems and individual health care providers (HCPs), which has been well documented. Like all other medical peer reviewed journals, Federal Practitioner relies heavily on the generosity and dedication of federal HCPs. As the pandemic unfolded, we questioned whether HCPs would have the time and energy to write new articles, complete research projects, and review the work of their peers. To assess the impact of COVID-19 on the journal, we compared data from a full year during the COVID-19 pandemic with that of the previous year to determine whether and how the pandemic reshaped the peer review and publication process.
For the purposes of this review, we will compare a full year of COVID-19 journal performance with the prior year. Since COVID-19 infections spiked at different times in different places, there is no clear starting point for the pandemic. Similarly, states varied widely in their vaccination rates and opening procedures. Nevertheless, the period from May 1, 2020 to April 30, 2021, most of the country experienced COVID-19 restrictions, and the number of cases rose dramatically.
From May 1, 2020 to April 30, 2021, Federal Practitioner received 208 submissions, 110% increase over the previous year (189 submissions from May 1, 2019 to April 30, 2020) and a 28% increase over a 2-year period. After submission, it took an average of 9.0 days to the first reviewer invitation compared with 10.3 days in the previous year and 4.7 days 2 years prior. Time from the initial submission to the first decision (ie, accept, reject, or revise) took 72.8 days in the COVID-19 year compared with 91.1 days in the previous year and 69.6 days 2 years prior. In both periods it took reviewers a mean 9.5 days to complete a review from the date invited, and the rate of late reviews was unchanged as well.
During the COVID-19 pandemic year, 1481 reviewer invitations were sent to potential reviewers and 498 reviews were completed (33.6%) by 195 individual reviewers: an average of 2.4 reviews per manuscript. Most reviewers recommended to accept the manuscript, and just 14.7% of reviewers recommended to reject the manuscript (Table). The previous year 1295 invitations were sent to potential reviewers and 460 reviews were completed (38.1%) by 181 individual reviewers for an average of 2.4 reviews per manuscript.
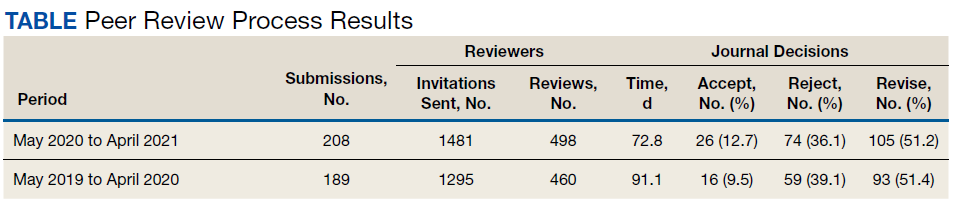
For the original submissions, the journal accepted just 26 (12.7%) articles, recommended revisions for 105 (51.2%) submissions, and rejected 74 (36.1%) submissions from May 1, 2020 to April 30, 3021. One hundred seven manuscripts were revised once, and 75.7% were accepted, and 2.8% were rejected. Twenty-two articles had a second revision and 1 had a third revision and all were published. In the year before the pandemic, just 16 (9.5%) manuscripts were accepted in their original form and 59 (39.1%) were rejected.
Federal Practitioner published 113 articles from May 2020 to April 2021. These articles included 44 (38.9%) original studies, 25 (22.1%) case studies, 20 (17.7%) program profiles, 16 (14.2%) commentaries/editorials, and 8 (7.1%) review articles; 19 (16.8%) articles were focused on COVID-19. The prior year saw Federal Practitioner publish 106 articles in 18 issues. Of these articles 36.8% were original studies, 22.6% were program profiles, 18.9% were case studies, 13.2% were commentaries/editorials, and 8.5% were review articles.
Despite the impact of COVID-19, federal HCPs continued to contribute to this journal without significant interruption. The journal saw a 10% increase in submissions during the pandemic year compared with the previous year but that was in keeping with prior increases in submissions. Similarly, the journal saw more individual reviewers submit more total reviews from May 2020 to April 2021 compared with the previous year. The broad spectrum of reviewers involved in the process and the growing volume of both reviews and submissions suggest that our reviewers remained available and committed to the peer review process despite the impact of a pandemic.
Reducing the time to first decision remains an important priority for the journal. Although the time was shortened during the pandemic, it still took longer to inform authors of the first decision compared with 2 years before. There is no indication that COVID-19 had an impact on the speed of decision making. Reviewers were as timely during the pandemic as they were the year before.
Similarly, there was little difference in the types of articles that were published, other than the obvious increase in COVID-19 submissions. Most of the articles on COVID-19 were editorials and columns, though the journal also published case studies, program profiles, and review articles on treatment. During the pandemic, a higher percentage of articles were original studies and case reports, and fewer were program profiles compared with the types the year before. It is unclear if these differences resulted from random fluctuations in unsolicited manuscripts or are part of a larger trend. The journal managed to publish slightly more articles from May 2020 to April 2021 compared with May 2019 to April 2020 despite fewer issues. This is likely due to increased submissions and articles published online.
For the original submissions, the journal accepted just 26 (12.7%) articles, recommended revisions for 105 (51.2%) submissions and rejected 74 (36.1%) submissions from May 2020 to April 3021. One hundred seven manuscripts were revised once and 75.7% were accepted and 2.8% were rejected. Twenty-two articles had a second revision and 1 had a third revision and all were published. In the year prior to the pandemic, just 16 (9.5%) manuscripts were accepted in their original form, and 59 (39.1%) were rejected.
Although Federal Practitioner improved the efficiency of its decision making, there is still significant room for improvement. We are committed to providing our authors with more rapid decisions and reducing the time to the first decision. Seventy-two days is still too long for authors to wait to hear about the initial decision on their article. Future reviews of the publication process should focus not only on the types of articles that are included, but their subjects as well. Given the great diversity of clinical care practiced across the US Department of Veterans Affairs, US Department of Defense, and the US Public Health Service, the journal must ensure that its articles reflect its diverse audience. We would like to see articles come from authors associated with all 3 major branches of our audience, as well as small portions of the readership (eg, Federal Bureau of Prisons, National Institutes of Health) and ask our readers to help us promote the journal to potential authors in all Federal Health Care organizations. We are especially interested in submissions on or from underserved populations.
Despite the significant burdens on HCPs and federal health care systems, Federal Practitioner managed to increase the speed of publication and the number of articles between May 2020 and April 2021 thanks to the work of all the authors and reviewers who contributed their time and energy to the publication during this challenging period. Their efforts are impressive and greatly appreciated. We pledge to continue to improve our process to reduce the time to publication and to continue to provide regular updates on our process and performance.
The COVID-19 pandemic put unparalleled strain on US health care systems and individual health care providers (HCPs), which has been well documented. Like all other medical peer reviewed journals, Federal Practitioner relies heavily on the generosity and dedication of federal HCPs. As the pandemic unfolded, we questioned whether HCPs would have the time and energy to write new articles, complete research projects, and review the work of their peers. To assess the impact of COVID-19 on the journal, we compared data from a full year during the COVID-19 pandemic with that of the previous year to determine whether and how the pandemic reshaped the peer review and publication process.
For the purposes of this review, we will compare a full year of COVID-19 journal performance with the prior year. Since COVID-19 infections spiked at different times in different places, there is no clear starting point for the pandemic. Similarly, states varied widely in their vaccination rates and opening procedures. Nevertheless, the period from May 1, 2020 to April 30, 2021, most of the country experienced COVID-19 restrictions, and the number of cases rose dramatically.
From May 1, 2020 to April 30, 2021, Federal Practitioner received 208 submissions, 110% increase over the previous year (189 submissions from May 1, 2019 to April 30, 2020) and a 28% increase over a 2-year period. After submission, it took an average of 9.0 days to the first reviewer invitation compared with 10.3 days in the previous year and 4.7 days 2 years prior. Time from the initial submission to the first decision (ie, accept, reject, or revise) took 72.8 days in the COVID-19 year compared with 91.1 days in the previous year and 69.6 days 2 years prior. In both periods it took reviewers a mean 9.5 days to complete a review from the date invited, and the rate of late reviews was unchanged as well.
During the COVID-19 pandemic year, 1481 reviewer invitations were sent to potential reviewers and 498 reviews were completed (33.6%) by 195 individual reviewers: an average of 2.4 reviews per manuscript. Most reviewers recommended to accept the manuscript, and just 14.7% of reviewers recommended to reject the manuscript (Table). The previous year 1295 invitations were sent to potential reviewers and 460 reviews were completed (38.1%) by 181 individual reviewers for an average of 2.4 reviews per manuscript.
For the original submissions, the journal accepted just 26 (12.7%) articles, recommended revisions for 105 (51.2%) submissions, and rejected 74 (36.1%) submissions from May 1, 2020 to April 30, 3021. One hundred seven manuscripts were revised once, and 75.7% were accepted, and 2.8% were rejected. Twenty-two articles had a second revision and 1 had a third revision and all were published. In the year before the pandemic, just 16 (9.5%) manuscripts were accepted in their original form and 59 (39.1%) were rejected.
Federal Practitioner published 113 articles from May 2020 to April 2021. These articles included 44 (38.9%) original studies, 25 (22.1%) case studies, 20 (17.7%) program profiles, 16 (14.2%) commentaries/editorials, and 8 (7.1%) review articles; 19 (16.8%) articles were focused on COVID-19. The prior year saw Federal Practitioner publish 106 articles in 18 issues. Of these articles 36.8% were original studies, 22.6% were program profiles, 18.9% were case studies, 13.2% were commentaries/editorials, and 8.5% were review articles.
Despite the impact of COVID-19, federal HCPs continued to contribute to this journal without significant interruption. The journal saw a 10% increase in submissions during the pandemic year compared with the previous year but that was in keeping with prior increases in submissions. Similarly, the journal saw more individual reviewers submit more total reviews from May 2020 to April 2021 compared with the previous year. The broad spectrum of reviewers involved in the process and the growing volume of both reviews and submissions suggest that our reviewers remained available and committed to the peer review process despite the impact of a pandemic.
Reducing the time to first decision remains an important priority for the journal. Although the time was shortened during the pandemic, it still took longer to inform authors of the first decision compared with 2 years before. There is no indication that COVID-19 had an impact on the speed of decision making. Reviewers were as timely during the pandemic as they were the year before.
Similarly, there was little difference in the types of articles that were published, other than the obvious increase in COVID-19 submissions. Most of the articles on COVID-19 were editorials and columns, though the journal also published case studies, program profiles, and review articles on treatment. During the pandemic, a higher percentage of articles were original studies and case reports, and fewer were program profiles compared with the types the year before. It is unclear if these differences resulted from random fluctuations in unsolicited manuscripts or are part of a larger trend. The journal managed to publish slightly more articles from May 2020 to April 2021 compared with May 2019 to April 2020 despite fewer issues. This is likely due to increased submissions and articles published online.
For the original submissions, the journal accepted just 26 (12.7%) articles, recommended revisions for 105 (51.2%) submissions and rejected 74 (36.1%) submissions from May 2020 to April 3021. One hundred seven manuscripts were revised once and 75.7% were accepted and 2.8% were rejected. Twenty-two articles had a second revision and 1 had a third revision and all were published. In the year prior to the pandemic, just 16 (9.5%) manuscripts were accepted in their original form, and 59 (39.1%) were rejected.
Although Federal Practitioner improved the efficiency of its decision making, there is still significant room for improvement. We are committed to providing our authors with more rapid decisions and reducing the time to the first decision. Seventy-two days is still too long for authors to wait to hear about the initial decision on their article. Future reviews of the publication process should focus not only on the types of articles that are included, but their subjects as well. Given the great diversity of clinical care practiced across the US Department of Veterans Affairs, US Department of Defense, and the US Public Health Service, the journal must ensure that its articles reflect its diverse audience. We would like to see articles come from authors associated with all 3 major branches of our audience, as well as small portions of the readership (eg, Federal Bureau of Prisons, National Institutes of Health) and ask our readers to help us promote the journal to potential authors in all Federal Health Care organizations. We are especially interested in submissions on or from underserved populations.
Despite the significant burdens on HCPs and federal health care systems, Federal Practitioner managed to increase the speed of publication and the number of articles between May 2020 and April 2021 thanks to the work of all the authors and reviewers who contributed their time and energy to the publication during this challenging period. Their efforts are impressive and greatly appreciated. We pledge to continue to improve our process to reduce the time to publication and to continue to provide regular updates on our process and performance.
The COVID-19 pandemic put unparalleled strain on US health care systems and individual health care providers (HCPs), which has been well documented. Like all other medical peer reviewed journals, Federal Practitioner relies heavily on the generosity and dedication of federal HCPs. As the pandemic unfolded, we questioned whether HCPs would have the time and energy to write new articles, complete research projects, and review the work of their peers. To assess the impact of COVID-19 on the journal, we compared data from a full year during the COVID-19 pandemic with that of the previous year to determine whether and how the pandemic reshaped the peer review and publication process.
For the purposes of this review, we will compare a full year of COVID-19 journal performance with the prior year. Since COVID-19 infections spiked at different times in different places, there is no clear starting point for the pandemic. Similarly, states varied widely in their vaccination rates and opening procedures. Nevertheless, the period from May 1, 2020 to April 30, 2021, most of the country experienced COVID-19 restrictions, and the number of cases rose dramatically.
From May 1, 2020 to April 30, 2021, Federal Practitioner received 208 submissions, 110% increase over the previous year (189 submissions from May 1, 2019 to April 30, 2020) and a 28% increase over a 2-year period. After submission, it took an average of 9.0 days to the first reviewer invitation compared with 10.3 days in the previous year and 4.7 days 2 years prior. Time from the initial submission to the first decision (ie, accept, reject, or revise) took 72.8 days in the COVID-19 year compared with 91.1 days in the previous year and 69.6 days 2 years prior. In both periods it took reviewers a mean 9.5 days to complete a review from the date invited, and the rate of late reviews was unchanged as well.
During the COVID-19 pandemic year, 1481 reviewer invitations were sent to potential reviewers and 498 reviews were completed (33.6%) by 195 individual reviewers: an average of 2.4 reviews per manuscript. Most reviewers recommended to accept the manuscript, and just 14.7% of reviewers recommended to reject the manuscript (Table). The previous year 1295 invitations were sent to potential reviewers and 460 reviews were completed (38.1%) by 181 individual reviewers for an average of 2.4 reviews per manuscript.
For the original submissions, the journal accepted just 26 (12.7%) articles, recommended revisions for 105 (51.2%) submissions, and rejected 74 (36.1%) submissions from May 1, 2020 to April 30, 3021. One hundred seven manuscripts were revised once, and 75.7% were accepted, and 2.8% were rejected. Twenty-two articles had a second revision and 1 had a third revision and all were published. In the year before the pandemic, just 16 (9.5%) manuscripts were accepted in their original form and 59 (39.1%) were rejected.
Federal Practitioner published 113 articles from May 2020 to April 2021. These articles included 44 (38.9%) original studies, 25 (22.1%) case studies, 20 (17.7%) program profiles, 16 (14.2%) commentaries/editorials, and 8 (7.1%) review articles; 19 (16.8%) articles were focused on COVID-19. The prior year saw Federal Practitioner publish 106 articles in 18 issues. Of these articles 36.8% were original studies, 22.6% were program profiles, 18.9% were case studies, 13.2% were commentaries/editorials, and 8.5% were review articles.
Despite the impact of COVID-19, federal HCPs continued to contribute to this journal without significant interruption. The journal saw a 10% increase in submissions during the pandemic year compared with the previous year but that was in keeping with prior increases in submissions. Similarly, the journal saw more individual reviewers submit more total reviews from May 2020 to April 2021 compared with the previous year. The broad spectrum of reviewers involved in the process and the growing volume of both reviews and submissions suggest that our reviewers remained available and committed to the peer review process despite the impact of a pandemic.
Reducing the time to first decision remains an important priority for the journal. Although the time was shortened during the pandemic, it still took longer to inform authors of the first decision compared with 2 years before. There is no indication that COVID-19 had an impact on the speed of decision making. Reviewers were as timely during the pandemic as they were the year before.
Similarly, there was little difference in the types of articles that were published, other than the obvious increase in COVID-19 submissions. Most of the articles on COVID-19 were editorials and columns, though the journal also published case studies, program profiles, and review articles on treatment. During the pandemic, a higher percentage of articles were original studies and case reports, and fewer were program profiles compared with the types the year before. It is unclear if these differences resulted from random fluctuations in unsolicited manuscripts or are part of a larger trend. The journal managed to publish slightly more articles from May 2020 to April 2021 compared with May 2019 to April 2020 despite fewer issues. This is likely due to increased submissions and articles published online.
For the original submissions, the journal accepted just 26 (12.7%) articles, recommended revisions for 105 (51.2%) submissions and rejected 74 (36.1%) submissions from May 2020 to April 3021. One hundred seven manuscripts were revised once and 75.7% were accepted and 2.8% were rejected. Twenty-two articles had a second revision and 1 had a third revision and all were published. In the year prior to the pandemic, just 16 (9.5%) manuscripts were accepted in their original form, and 59 (39.1%) were rejected.
Although Federal Practitioner improved the efficiency of its decision making, there is still significant room for improvement. We are committed to providing our authors with more rapid decisions and reducing the time to the first decision. Seventy-two days is still too long for authors to wait to hear about the initial decision on their article. Future reviews of the publication process should focus not only on the types of articles that are included, but their subjects as well. Given the great diversity of clinical care practiced across the US Department of Veterans Affairs, US Department of Defense, and the US Public Health Service, the journal must ensure that its articles reflect its diverse audience. We would like to see articles come from authors associated with all 3 major branches of our audience, as well as small portions of the readership (eg, Federal Bureau of Prisons, National Institutes of Health) and ask our readers to help us promote the journal to potential authors in all Federal Health Care organizations. We are especially interested in submissions on or from underserved populations.
Despite the significant burdens on HCPs and federal health care systems, Federal Practitioner managed to increase the speed of publication and the number of articles between May 2020 and April 2021 thanks to the work of all the authors and reviewers who contributed their time and energy to the publication during this challenging period. Their efforts are impressive and greatly appreciated. We pledge to continue to improve our process to reduce the time to publication and to continue to provide regular updates on our process and performance.
Home Modifications for Rural Veterans With Disabilities
The US Department of Veterans Affairs (VA) created the Home Improvements and Structural Alterations (HISA) program to help provide necessary home modifications (HMs) to veterans with disabilities (VWDs) that will facilitate the provision of medical services at home and improve home accessibility and functional independence. The Veterans Health Administration (VHA) has more than 9 million veteran enrollees; of those, 2.7 million are classified as rural or highly rural.1 Rural veterans (RVs) possess higher rate of disability compared with that of urban veterans.2-5 RVs have unequal access to screening of ambulatory care sensitive conditions (eg, hypertension, diabetes mellitus).6 Furthermore, RVs are at risk of poor medical outcomes due to distance from health care facilities and specialist care, which can be a barrier to emergency care when issues arise. These barriers, among others, are associated with compromised health quality of life and health outcomes for RVs.3,6 The HISA program may be key to decreasing falls and other serious mishaps in the home. Therefore, understanding use of the HISA program by RVs is important. However, to date little information has been available regarding use of HISA benefits by RVs or characteristics of RVs who receive HISA benefits.
HISA Alterations Program
HISA was initially developed by VA to improve veterans’ transition from acute medical care to home.7,8 However, to obtain HISA grants currently, there is an average 3 to 6 months application process.7 Through the HISA program, VWDs can be prescribed the following HMs, including (but not limited to): flooring replacement, permanent ramps, roll-in showers, installation of central air-conditioning systems, improved lighting, kitchen/bathroom modifications, and home inspections. The HMs prescribed depend on an assessment of medical need by health care providers (HCPs).8
As time passed and the veteran population aged, the program now primarily helps ensure the ability to enter into essential areas and safety in the home.5 The amount of a HISA payment is based on whether a veteran’s health condition is related to military service as defined by the VHA service connection medical evaluation process. Barriers to obtaining a HISA HM can include difficulty in navigating the evaluation process and difficulty in finding a qualified contractor or builder to do the HM.7
This article aims to: (1) Detail the sociodemographic and clinical characteristics of rural HISA users (RHUs); (2) report on HISA usage patterns in number, types, and cost of HMs; (3) compare use amid the diverse VA medical centers (VAMCs) and related complexity levels and Veterans Integrated Service Networks (VISNs); and (4) examine the relationship between travel time/distance and HISA utilization. The long-term goal is to provide accurate information to researchers, HM administrators, health care providers and policy makers on HISA program utilization by rural VWDs, which may help improve its use and bring awareness of its users. This study was approved by the affiliate University of Florida Institutional Review Board and VA research and development committee at the North Florida/South Georgia Veterans Health System.
Methods
Data were obtained from 3 VA sources: the National Prosthetics Patient Database (NPPD), the VHA Medical Inpatient Dataset, and the VHA Outpatient Dataset.7 The NPPD is a national administrative database that contains information on prosthetic-associated products ordered by HCPs for patients, such as portable ramps, handrails, home oxygen equipment, and orthotic and prosthetic apparatus. Data obtained from the NPPD included cost of HMs, clinical characteristics, VISN, and VAMC. VA facilities are categorized into complexity levels 1a, 1b, 1c, 2, and 3. Complexity level 1a to 1c VAMCs address medical cases that entail “heightening involvedness,” meaning a larger number of patients presented with medical concerns needing medical specialists. Complexity levels 2 and 3 have fewer resources, lower patient numbers, and less medically complex patients. Finally, the VHA Medical Inpatient and Outpatient Datasets administrated by VA Informatics and Computing Infrastructure, consist of in-depth health services national data on inpatient and outpatient encounters and procedures.
The study cohort was divided into those with service-connected conditions (Class 1) or those with conditions not related to military service (Class 2). If veterans were identified in both classes, they were assigned to Class 1. The cost variable is determined by using the veterans’ classification. Class 1 veterans receive a lifetime limit of $6800, and Class 2 veterans receive a lifetime limit of $2000. A Class 2 veteran with ≥ 50% disability rating is eligible for a HISA lifetime limit of $6800. Whenever a value exceeds allowed limit of $6800 or $2000, due to data entry error or other reasons, the study team reassigned the cost value to the maximum allowed value.
Travel distance and time were derived by loading patient zip codes and HISA facility locations into the geographical information system program and using the nearest facility and find-route tools. These tools used a road network that simulates real-world driving conditions to calculate distance.
Study Variables
VWDs of any age, gender, and race/ethnicity who qualified for HISA and received HMs from fiscal year ( FY) 2015 through FY 2018 were identified (N = 30,823). Most VWDs were nonrural subjects (n = 19,970), and 43 had no Federal Information Processing System data. The final study cohort consisted of 10,810 HISA recipients. The NPPD, inpatient and outpatient data were merged by scrambled social security numbers to retrieve the following data: age, gender, race, ethnicity, marital status, Class (1 or 2), mean and total number of inpatient days, and type of HMs prescribed.
We also recorded rurality using the VA Rural-Urban Commuting Areas (RUCA) system, but we combined the rural and highly rural designation.1 Census tracts with a RUCA score of 10.0 are deemed highly rural, the remainder are considered rural except those with a RUCA score of 1.0 or 1.1. Travel time and distance from a veteran’s home to the VA facility that provided the HISA prescription were determined from zip codes. The current study focuses on VAMCs prescribing stations (affiliated sites of administrative parent medical facilities) where the HISA users obtained the HM, not the parent station (administrative parent medical facilities).
HISA Utilization
To characterize HISA utilization geographically and over time, the number of users were mapped by county. Areas where users were increasing (hot spots) or decreasing (cold spots) also were mapped. The maps were created using Environmental Systems Research Institute ArcGIS Pro 2.2.1 software. We chose to use natural breaks (Jenks) data classification method in a choropleth to symbolize the change over time map. We then used the Getis Ord GI* optimized hot spot analysis tool in the ArcGIS Pro spatial statistics tool set to generate the hot/cold spot maps. This tool identifies clusters of high values (hot spots) and low values (cold spots) creating a new output layer, RHUs by county, with a Z score, P value, and CI for each county. The Gi Bin field classifies statistically significant hot and cold spots. Counties sorted into the ± 3 category (bin) have a clustering characteristic (eg, with neighboring counties) that is statistically significant with a 99% CI; the ± 2 bin indicates a 95% CI for those county clustering sorted therein; ± 1 reflects a 90% CI; and 0 bin contains county features that have no statistical significant clustering with neighboring counties.
Data Analysis
Data were cleaned and analyzed using SAS 9.4 and R 3.5.3. Descriptive statistics are provided for sociodemographic characteristics, clinical characteristics, and class. ANOVA and t tests were used to compare continuous variables between groups, while χ2 and Fisher exact tests were used for dichotomous and categorical outcome variables. The threshold for statistical significance for these tests was set at α = .001.
Results
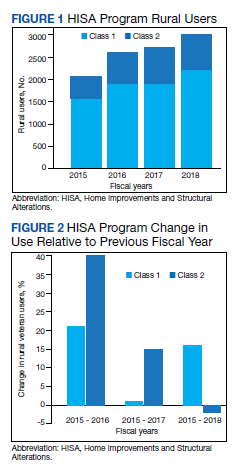
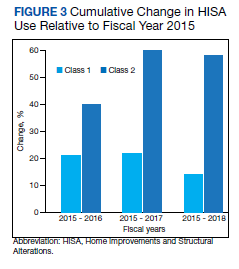
There were 10,810 RHUs from FY 2015 through FY 2018 and HISA utilization increased each year (Figure 1). Although some years may show usage decreases relative to previous fiscal years, the cumulative trends showed an increase relative to FY 2015 for both Classes of RVs (Figure 2). There was a 45.4% increase from FY 2015 to FY 2018 with a mean 13.6% yearly increase. Class 1 increased 21.0% and Class 2 increased 39.5% from FY 2015 to FY 2016 (Figure 3).
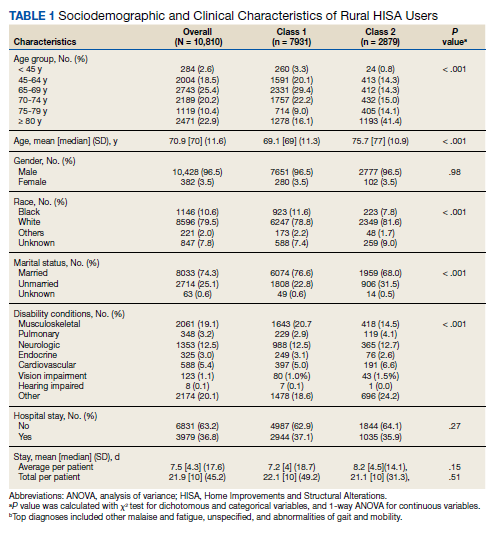
Most RHUs were male, White, and married. Class 1 and Class 2 RHUs differed significantly by age, race, marital status, and disability conditions: Class 1 RHUs were aged 6.6 years younger with a mean age of 69.1 years compared with 75.7 years for Class 2 users. For Class 1 RHUs, a plurality (29.4%) were aged 65 to 69 years; while a plurality (41.4%) of Class 2 users were aged ≥ 80 years. Musculoskeletal was the most common identified type of condition for all RHUs (Table 1).
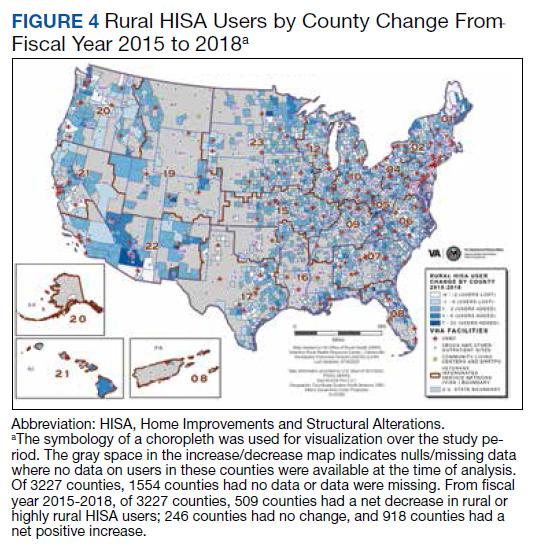
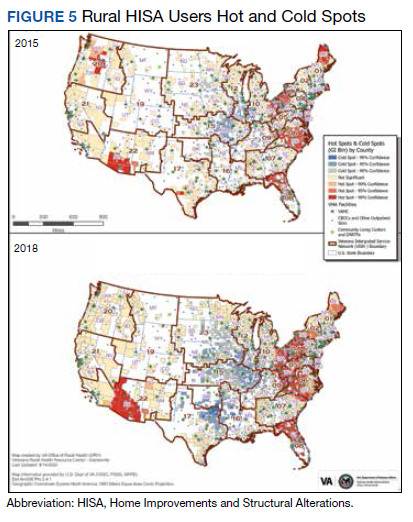
To better understand HISA utilization patterns and net RHUs per county, we used a map to detail RHUs by county and change over time (Figure 4). Additionally, we compared US counties by RHUs from FY 2015 to FY 2018 and determined how clusters of high numbers of RHUs (hot spots) and low numbers of RHUs (cold spots) shifted over this period (Figure 5). While HISA utilization grew over the study period, the net count of RHUs per county varied by 9 to 20 persons/county. The population of RHUs increased over time in the Southwest, Southeast, and over much of the East/Northeast, while in the Central and Midwest regions, number of RHUs seems to decrease in population and/or use of the system. The cold spots in the Midwest and South Central US seem to increase with a significant relationship to neighboring counties having a low number of RHUs.
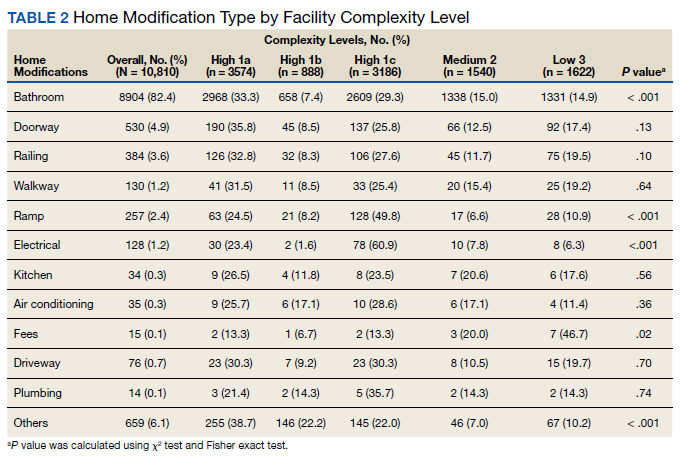
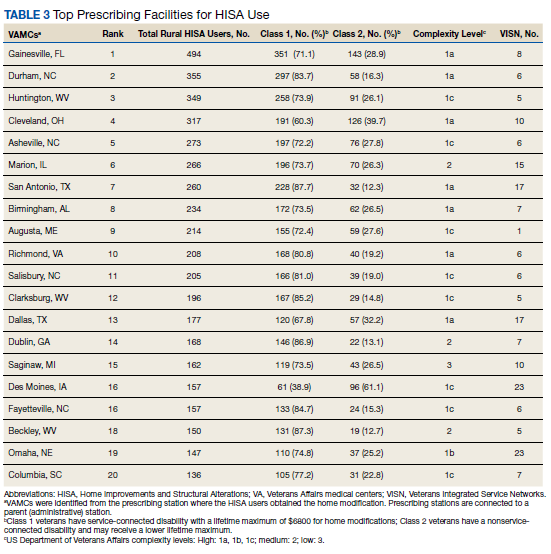
There were 11,166 HM prescribed to RHUs (Table 2). Bathroom HMs also were the dominant HM type for all facilities regardless of complexity levels (Table 3). The San Antonio, Texas, VAMC demonstrated the highest Class 1 vs Class 2 difference in HISA use (Class 1: 87.7% and Class 2: 12.3%). Except for the Des Moines VAMC, all other VAMCs showed HISA use > 60% by Class 1.
Cost Data
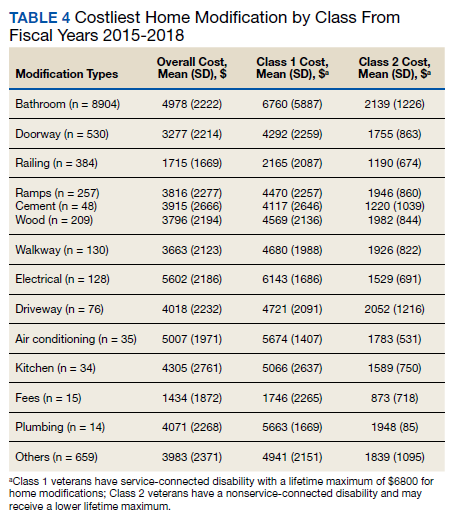
Air-conditioning installation ($5007) was the costliest HM overall (Table 4), closely followed by bathroom ($4978) and kitchen modifications ($4305). Bathroom renovations were the costliest HM type for both Class 1 and Class 2, closely followed by electrical repair and air-conditioning installation for Class 1 and driveway reconstruction and wooden ramp construction for Class 2.
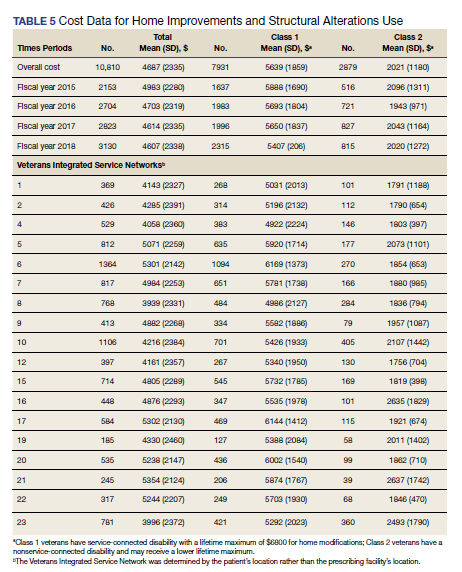
The mean award received for HM was $4687 (Table 5). While the number of RHUs increased from FY 2015 to FY 2016, the average cost decreased, both overall ($280) and for Class 1 ($195) and Class 2 ($153). Except for a small decline in the number of Class 2 HISA recipients from FY 2017 to FY 2018, overall, the number of RHUs continuously grew from FY 2015 to FY 2018: 977 for the overall cohort, 678 for Class 1 and 299 for Class 2. Despite the obvious gain in the number of RHUs, the average costs did not notably change over time. VISN 21 had the highest mean cost, followed by VISNs 17, 6, 22, and 20.
Travel
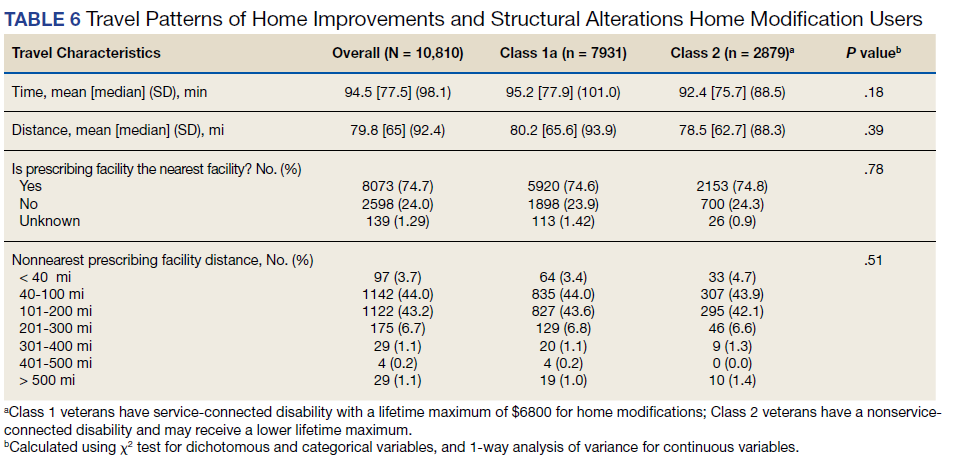
Travel time and distance to the HISA prescribing facility differed significantly between Class 1 and Class 2 HISA users. RHUs had to travel about 95 minutes from their place of residence to access the HISA benefits program. There were no statistically significant differences between Class 1 and 2 users with respect to travel time and distance traveled (Table 6).
The majority of Class 1 and Class 2 veterans accessed the HISA from their nearest facility. However, nearly one-quarter of both Class 1 and 2 RHUs (24% each) did not. Among the 2598 who accessed the nonnearest facility, 97 (3.7%) accessed a facility that is ≤ 40 miles. Many (44%) users traveled 40 to 100 miles, and another 43.2% traveled 100 to 200 miles from their residence to access a HM prescription. Some 2598 users (1.1%) traveled > 500 miles to access a facility.
Discussion
Although utilization of the HISA program has steadily increased, overall participation by subpopulations such as RHUs can still be improved significantly. Veterans aged ≤ 46 years who have a disability that is common to those receiving HISA benefits have low HISA utilization. Similarly, veterans with sensory disabilities also have low use. These subpopulations are among those in great need of attention and services.
A study by Lucas and Zelaya, using the 2016 National Health Interview Survey data with an aim to measure degree of vision problems, dual sensory impairment, and hearing trouble in male veterans aged ≥ 18 years, found that veterans were more likely to report dual sensory impairment and balance difficulties when compared with nonveterans.9 The number of female veterans is growing but had very low representation in this study.10 This emerging VHA population requires information and education on their HM benefits.
Home Modifications
The most common HM prescribed for RHUs was for the bathroom. Further investigation is warranted as to why, given the diversity of HM types that the grant covers, low prescription rates exist across most of the HM types. There may be a lack of knowledge by providers and VWD as to the range of HMs that can be awarded under the grant. It is important that HCPs and veterans receive education on HISA HM options.
Semeah and colleagues pointed out the need for an assessment of the HISA HM ordering system to ensure that multiple HMs items (eg, kitchen, air conditioning, fees, driveway, and plumbing) are listed among the forced choices shown to clinicians to select from.7 Poor housing in rural America is widespread: 63% of rural dwellings need renovations and/or repairs to be accessible to individuals with disabilities, with > 6.7 million rural homes having no or faulty plumbing or kitchens; yet in this study, prescriptions for these HMs accounted for < 1%.11,12
VISN 6 had the most HISA awards with 1364, while VISN 21 had the fewest (245). Across all VISNs, Class 1 RHUs received more prescriptions than did Class 2 RHUs. Future research may seek to examine whether prescribers are fully aware of the eligibility of HM prescription to Class 2 veterans. VISN 21 ($5354); VISN 17 ($5302); and VISN 6 ($5301) had the highest mean HM expenditures. The national mean cost for HISA HMs were $4978 for bathrooms and $4305 for kitchens; for non-HISA HMs in FY 2017, the mean costs were $6362 and $12,255, respectively. A noteworthy concern is whether the maximum grant limit awards are sufficient to perform more expensive and complex HMs, such as the kitchen or major bathroom alternations.13
Facilities categorized as 1a, 1b, or 1c provided
North Florida/Sough Georgia was the highest-prescribing VAMC with 39% more HM prescriptions than the second highest prescribing facility (Durham, NC). Unfortunately, the data presented here cannot establish causality for the large variance difference between the top facilities, and the skewed distribution of total RHUs across VAMCs.
Travel-Related Variables
HISA beneficiaries face significant travel-related challenges. Just 3.6% of RHUs could access a facility within 40 miles of their home and 43.2% traveled 100 to 200 miles from their home to access a HM prescription. Further exploration is warranted to understand how travel patterns impact access to or the uptake of HISA.
RVs already have problems with accessing care because of long travel time.14,15 The choice or necessity to travel to a farther facility for HISA prescription is problematic for RVs, especially when transportation is often reported in the literature as a barrier to resources for people living in rural communities.15-17 When patients have travel barriers, they wait longer to obtain medical services and often wait for their conditions to worsen before seeking services.15,18 Once HM is completed, telerehabilitation is an effective delivery method used for delivering health care services to people in remote places.18,19 Considering that HISA use has the potential to improve quality of life, afford comfort, facilitate the accomplishment of activities of daily living for RVs, it is important that future studies examine how existing telehealth technologies can be used to improve HISA access.
Future Directions
County-level analyses is warranted in future studies exploring potential variables associated with HISA use; for example, county-level rates of primary care physicians and other HCPs. Future research should explore how long distance travel impacts the HISA application process and HM implementation. Further research also should focus on the HISA application structure and process to identify causes of delays. The HISA application process takes a mean 6 months to complete, yet the duration of hospital stays is 1 to 3 weeks, thus it is impossible to connect HISA to hospital discharge, which was the original intent of the program. Future research can examine how telehealth services can expedite HISA obtainment and coordination of the application process. Future research also may study the possible causes of the wide variations in HM prescriptions per facility. It is also important that educational programs provide information on the array of HM items that veterans can obtain.
Conclusions
In our previous study of the HISA cohort (2011-2017), we documented that an increase in utilization of the HISA program was warranted based on the low national budgetary appropriation and identification of significant low participation by vulnerable subpopulations, including veterans residing in rural areas or having returned from recent conflicts.7 The present study documents national utilization patterns, demographic profiles, and clinical characteristics of RHUs from FY 2015 through FY 2018, data that may be useful to policy makers and HISA administrators in predicting future use and users. It is important to note that the data and information presented in this article identify trends. The work in no way establishes a gold standard or any targeted goal of utilization. Future research could focus on conceptualizing or theorizing what steps are necessary to set such a gold standard of utilization rate and steps toward achievement.
Acknowledgments
This research was supported by grant 15521 from the US Department of Veterans Affairs, Office of Rural Health . Furthermore, the research was supported in part by grant K12 HD055929 from the National Institutes of Health.
1. US Department of Veterans Affairs, Veteran Health Administration, Office of Rural Health. Rural veteran health care challenges. Updated February 9, 2021. Accessed June 11, 2021. https://www.ruralhealth.va.gov/aboutus/ruralvets.asp
2. Holder, K.A. Veterans in rural America, 2011–2015. Published January 2017. Accessed June 11, 2021. https://www.census.gov/content/dam/Census/library/publications/2017/acs/acs-36.pdf
3. Pezzin LE, Bogner HR, Kurichi JE, et al. Preventable hospitalizations, barriers to care, and disability. Medicine (Baltimore). 2018;97(19):e0691. doi:10.1097/MD.0000000000010691
4. Rosenbach ML. Access and satisfaction within the disabled Medicare population. Health Care Financ Rev. 1995;17(2):147-167.
5. Semeah LM, Ganesh SP, Wang X, et al. Home modification and health services utilization in rural and urban veterans with disabilities. Housing Policy Debate. 2021. Published online: March 4, 2021. doi:10.1080/10511482.2020.1858923
6. Spoont M, Greer N, Su J, Fitzgerald P, Rutks I, and Wilt TJ. Rural vs. urban ambulatory health care: A Systematic Review. Published May 2011. Accessed June 11, 2021. https://www.hsrd.research.va.gov/publications/esp/ambulatory.pdf
7. Semeah LM, Wang X, Cowper Ripley DC, et al. Improving health through a home modification service for veterans. In: Fiedler BA, ed. Three Facets of Public Health and Paths to Improvements. Academic Press; 2020:381-416.
8. Semeah LM, Ahrentzen S, Jia H, Cowper-Ripley DC, Levy CE, Mann WC. The home improvements and structural alterations benefits program: veterans with disabilities and home accessibility. J Disability Policy Studies. 2017;28(1):43-51. doi:10.1177/1044207317696275
9. Lucas, JW, Zelaya, CE. Hearing difficulty, vision trouble, and balance problems among male veterans and nonveterans. Published June 12, 2020. Accessed June 11, 2021. https://www.cdc.gov/nchs/data/nhsr/nhsr142-508.pdf
10. US Department of Veterans Affairs, National Center for Veterans Analysis and Statistics. Women veterans report: the past, present, and future of women veterans. Published February 2017. Accessed June 11, 2021. https://www.va.gov/vetdata/docs/SpecialReports/Women_Veterans_2015_Final.pdf
11. US Department of Housing and Urban Development, Office of Policy Development and Research. Housing challenges of rural seniors. Published 2017. Accessed June 11, 2021. https://www.huduser.gov/portal/periodicals/em/summer17/highlight1.html
12. Pendall R, Goodman L, Zhu J, Gold A. The future of rural housing. Published October 2016. Accessed June 11, 202.1 https://www.urban.org/sites/default/files/publication/85101/2000972-the-future-of-rural-housing_6.pdf
13. Joint Center for Housing Studies at Harvard University. Improving America’s housing 2019. Published 2019. Accessed June 11, 2021. https://www.jchs.harvard.edu/sites/default/files/reports/files/Harvard_JCHS_Improving_Americas_Housing_2019.pdf
14. Schooley BL, Horan TA, Lee PW, West PA. Rural veteran access to healthcare services: investigating the role of information and communication technologies in overcoming spatial barriers. Perspect Health Inf Manag. 2010;7(Spring):1f. Published 2010 Apr 1.
15. Ripley DC, Kwong PL, Vogel WB, Kurichi JE, Bates BE, Davenport C. How does geographic access affect in-hospital mortality for veterans with acute ischemic stroke?. Med Care. 2015;53(6):501-509. doi:10.1097/MLR.0000000000000366
16. Cowper-Ripley DC, Reker DM, Hayes J, et al. Geographic access to VHA rehabilitation services for traumatically injured veterans. Fed Pract. 2009;26(10):28-39.
17. Smith M, Towne S, Herrera-Venson A, Cameron K, Horel S, Ory M, et al. Delivery of fall prevention interventions for at-risk older adults in rural areas: Findings from a national dissemination. International journal of environmental research and public health. 2018;15:2798. doi: 10.3390/ijerph15122798
18. Hale-Gallardo JL, Kreider CM, Jia H, et al. Telerehabilitation for Rural Veterans: A Qualitative Assessment of Barriers and Facilitators to Implementation. J Multidiscip Healthc. 2020;13:559-570. doi:10.2147/JMDH.S247267
19. Sarfo FS, Akassi J, Kyem G, et al. Long-Term Outcomes of Stroke in a Ghanaian Outpatient Clinic. J Stroke Cerebrovasc Dis. 2018;27(4):1090-1099. doi:10.1016/j.jstrokecerebrovasdis.2017.11.017
The US Department of Veterans Affairs (VA) created the Home Improvements and Structural Alterations (HISA) program to help provide necessary home modifications (HMs) to veterans with disabilities (VWDs) that will facilitate the provision of medical services at home and improve home accessibility and functional independence. The Veterans Health Administration (VHA) has more than 9 million veteran enrollees; of those, 2.7 million are classified as rural or highly rural.1 Rural veterans (RVs) possess higher rate of disability compared with that of urban veterans.2-5 RVs have unequal access to screening of ambulatory care sensitive conditions (eg, hypertension, diabetes mellitus).6 Furthermore, RVs are at risk of poor medical outcomes due to distance from health care facilities and specialist care, which can be a barrier to emergency care when issues arise. These barriers, among others, are associated with compromised health quality of life and health outcomes for RVs.3,6 The HISA program may be key to decreasing falls and other serious mishaps in the home. Therefore, understanding use of the HISA program by RVs is important. However, to date little information has been available regarding use of HISA benefits by RVs or characteristics of RVs who receive HISA benefits.
HISA Alterations Program
HISA was initially developed by VA to improve veterans’ transition from acute medical care to home.7,8 However, to obtain HISA grants currently, there is an average 3 to 6 months application process.7 Through the HISA program, VWDs can be prescribed the following HMs, including (but not limited to): flooring replacement, permanent ramps, roll-in showers, installation of central air-conditioning systems, improved lighting, kitchen/bathroom modifications, and home inspections. The HMs prescribed depend on an assessment of medical need by health care providers (HCPs).8
As time passed and the veteran population aged, the program now primarily helps ensure the ability to enter into essential areas and safety in the home.5 The amount of a HISA payment is based on whether a veteran’s health condition is related to military service as defined by the VHA service connection medical evaluation process. Barriers to obtaining a HISA HM can include difficulty in navigating the evaluation process and difficulty in finding a qualified contractor or builder to do the HM.7
This article aims to: (1) Detail the sociodemographic and clinical characteristics of rural HISA users (RHUs); (2) report on HISA usage patterns in number, types, and cost of HMs; (3) compare use amid the diverse VA medical centers (VAMCs) and related complexity levels and Veterans Integrated Service Networks (VISNs); and (4) examine the relationship between travel time/distance and HISA utilization. The long-term goal is to provide accurate information to researchers, HM administrators, health care providers and policy makers on HISA program utilization by rural VWDs, which may help improve its use and bring awareness of its users. This study was approved by the affiliate University of Florida Institutional Review Board and VA research and development committee at the North Florida/South Georgia Veterans Health System.
Methods
Data were obtained from 3 VA sources: the National Prosthetics Patient Database (NPPD), the VHA Medical Inpatient Dataset, and the VHA Outpatient Dataset.7 The NPPD is a national administrative database that contains information on prosthetic-associated products ordered by HCPs for patients, such as portable ramps, handrails, home oxygen equipment, and orthotic and prosthetic apparatus. Data obtained from the NPPD included cost of HMs, clinical characteristics, VISN, and VAMC. VA facilities are categorized into complexity levels 1a, 1b, 1c, 2, and 3. Complexity level 1a to 1c VAMCs address medical cases that entail “heightening involvedness,” meaning a larger number of patients presented with medical concerns needing medical specialists. Complexity levels 2 and 3 have fewer resources, lower patient numbers, and less medically complex patients. Finally, the VHA Medical Inpatient and Outpatient Datasets administrated by VA Informatics and Computing Infrastructure, consist of in-depth health services national data on inpatient and outpatient encounters and procedures.
The study cohort was divided into those with service-connected conditions (Class 1) or those with conditions not related to military service (Class 2). If veterans were identified in both classes, they were assigned to Class 1. The cost variable is determined by using the veterans’ classification. Class 1 veterans receive a lifetime limit of $6800, and Class 2 veterans receive a lifetime limit of $2000. A Class 2 veteran with ≥ 50% disability rating is eligible for a HISA lifetime limit of $6800. Whenever a value exceeds allowed limit of $6800 or $2000, due to data entry error or other reasons, the study team reassigned the cost value to the maximum allowed value.
Travel distance and time were derived by loading patient zip codes and HISA facility locations into the geographical information system program and using the nearest facility and find-route tools. These tools used a road network that simulates real-world driving conditions to calculate distance.
Study Variables
VWDs of any age, gender, and race/ethnicity who qualified for HISA and received HMs from fiscal year ( FY) 2015 through FY 2018 were identified (N = 30,823). Most VWDs were nonrural subjects (n = 19,970), and 43 had no Federal Information Processing System data. The final study cohort consisted of 10,810 HISA recipients. The NPPD, inpatient and outpatient data were merged by scrambled social security numbers to retrieve the following data: age, gender, race, ethnicity, marital status, Class (1 or 2), mean and total number of inpatient days, and type of HMs prescribed.
We also recorded rurality using the VA Rural-Urban Commuting Areas (RUCA) system, but we combined the rural and highly rural designation.1 Census tracts with a RUCA score of 10.0 are deemed highly rural, the remainder are considered rural except those with a RUCA score of 1.0 or 1.1. Travel time and distance from a veteran’s home to the VA facility that provided the HISA prescription were determined from zip codes. The current study focuses on VAMCs prescribing stations (affiliated sites of administrative parent medical facilities) where the HISA users obtained the HM, not the parent station (administrative parent medical facilities).
HISA Utilization
To characterize HISA utilization geographically and over time, the number of users were mapped by county. Areas where users were increasing (hot spots) or decreasing (cold spots) also were mapped. The maps were created using Environmental Systems Research Institute ArcGIS Pro 2.2.1 software. We chose to use natural breaks (Jenks) data classification method in a choropleth to symbolize the change over time map. We then used the Getis Ord GI* optimized hot spot analysis tool in the ArcGIS Pro spatial statistics tool set to generate the hot/cold spot maps. This tool identifies clusters of high values (hot spots) and low values (cold spots) creating a new output layer, RHUs by county, with a Z score, P value, and CI for each county. The Gi Bin field classifies statistically significant hot and cold spots. Counties sorted into the ± 3 category (bin) have a clustering characteristic (eg, with neighboring counties) that is statistically significant with a 99% CI; the ± 2 bin indicates a 95% CI for those county clustering sorted therein; ± 1 reflects a 90% CI; and 0 bin contains county features that have no statistical significant clustering with neighboring counties.
Data Analysis
Data were cleaned and analyzed using SAS 9.4 and R 3.5.3. Descriptive statistics are provided for sociodemographic characteristics, clinical characteristics, and class. ANOVA and t tests were used to compare continuous variables between groups, while χ2 and Fisher exact tests were used for dichotomous and categorical outcome variables. The threshold for statistical significance for these tests was set at α = .001.
Results
There were 10,810 RHUs from FY 2015 through FY 2018 and HISA utilization increased each year (Figure 1). Although some years may show usage decreases relative to previous fiscal years, the cumulative trends showed an increase relative to FY 2015 for both Classes of RVs (Figure 2). There was a 45.4% increase from FY 2015 to FY 2018 with a mean 13.6% yearly increase. Class 1 increased 21.0% and Class 2 increased 39.5% from FY 2015 to FY 2016 (Figure 3).
Most RHUs were male, White, and married. Class 1 and Class 2 RHUs differed significantly by age, race, marital status, and disability conditions: Class 1 RHUs were aged 6.6 years younger with a mean age of 69.1 years compared with 75.7 years for Class 2 users. For Class 1 RHUs, a plurality (29.4%) were aged 65 to 69 years; while a plurality (41.4%) of Class 2 users were aged ≥ 80 years. Musculoskeletal was the most common identified type of condition for all RHUs (Table 1).
To better understand HISA utilization patterns and net RHUs per county, we used a map to detail RHUs by county and change over time (Figure 4). Additionally, we compared US counties by RHUs from FY 2015 to FY 2018 and determined how clusters of high numbers of RHUs (hot spots) and low numbers of RHUs (cold spots) shifted over this period (Figure 5). While HISA utilization grew over the study period, the net count of RHUs per county varied by 9 to 20 persons/county. The population of RHUs increased over time in the Southwest, Southeast, and over much of the East/Northeast, while in the Central and Midwest regions, number of RHUs seems to decrease in population and/or use of the system. The cold spots in the Midwest and South Central US seem to increase with a significant relationship to neighboring counties having a low number of RHUs.
There were 11,166 HM prescribed to RHUs (Table 2). Bathroom HMs also were the dominant HM type for all facilities regardless of complexity levels (Table 3). The San Antonio, Texas, VAMC demonstrated the highest Class 1 vs Class 2 difference in HISA use (Class 1: 87.7% and Class 2: 12.3%). Except for the Des Moines VAMC, all other VAMCs showed HISA use > 60% by Class 1.
Cost Data
Air-conditioning installation ($5007) was the costliest HM overall (Table 4), closely followed by bathroom ($4978) and kitchen modifications ($4305). Bathroom renovations were the costliest HM type for both Class 1 and Class 2, closely followed by electrical repair and air-conditioning installation for Class 1 and driveway reconstruction and wooden ramp construction for Class 2.
The mean award received for HM was $4687 (Table 5). While the number of RHUs increased from FY 2015 to FY 2016, the average cost decreased, both overall ($280) and for Class 1 ($195) and Class 2 ($153). Except for a small decline in the number of Class 2 HISA recipients from FY 2017 to FY 2018, overall, the number of RHUs continuously grew from FY 2015 to FY 2018: 977 for the overall cohort, 678 for Class 1 and 299 for Class 2. Despite the obvious gain in the number of RHUs, the average costs did not notably change over time. VISN 21 had the highest mean cost, followed by VISNs 17, 6, 22, and 20.
Travel
Travel time and distance to the HISA prescribing facility differed significantly between Class 1 and Class 2 HISA users. RHUs had to travel about 95 minutes from their place of residence to access the HISA benefits program. There were no statistically significant differences between Class 1 and 2 users with respect to travel time and distance traveled (Table 6).
The majority of Class 1 and Class 2 veterans accessed the HISA from their nearest facility. However, nearly one-quarter of both Class 1 and 2 RHUs (24% each) did not. Among the 2598 who accessed the nonnearest facility, 97 (3.7%) accessed a facility that is ≤ 40 miles. Many (44%) users traveled 40 to 100 miles, and another 43.2% traveled 100 to 200 miles from their residence to access a HM prescription. Some 2598 users (1.1%) traveled > 500 miles to access a facility.
Discussion
Although utilization of the HISA program has steadily increased, overall participation by subpopulations such as RHUs can still be improved significantly. Veterans aged ≤ 46 years who have a disability that is common to those receiving HISA benefits have low HISA utilization. Similarly, veterans with sensory disabilities also have low use. These subpopulations are among those in great need of attention and services.
A study by Lucas and Zelaya, using the 2016 National Health Interview Survey data with an aim to measure degree of vision problems, dual sensory impairment, and hearing trouble in male veterans aged ≥ 18 years, found that veterans were more likely to report dual sensory impairment and balance difficulties when compared with nonveterans.9 The number of female veterans is growing but had very low representation in this study.10 This emerging VHA population requires information and education on their HM benefits.
Home Modifications
The most common HM prescribed for RHUs was for the bathroom. Further investigation is warranted as to why, given the diversity of HM types that the grant covers, low prescription rates exist across most of the HM types. There may be a lack of knowledge by providers and VWD as to the range of HMs that can be awarded under the grant. It is important that HCPs and veterans receive education on HISA HM options.
Semeah and colleagues pointed out the need for an assessment of the HISA HM ordering system to ensure that multiple HMs items (eg, kitchen, air conditioning, fees, driveway, and plumbing) are listed among the forced choices shown to clinicians to select from.7 Poor housing in rural America is widespread: 63% of rural dwellings need renovations and/or repairs to be accessible to individuals with disabilities, with > 6.7 million rural homes having no or faulty plumbing or kitchens; yet in this study, prescriptions for these HMs accounted for < 1%.11,12
VISN 6 had the most HISA awards with 1364, while VISN 21 had the fewest (245). Across all VISNs, Class 1 RHUs received more prescriptions than did Class 2 RHUs. Future research may seek to examine whether prescribers are fully aware of the eligibility of HM prescription to Class 2 veterans. VISN 21 ($5354); VISN 17 ($5302); and VISN 6 ($5301) had the highest mean HM expenditures. The national mean cost for HISA HMs were $4978 for bathrooms and $4305 for kitchens; for non-HISA HMs in FY 2017, the mean costs were $6362 and $12,255, respectively. A noteworthy concern is whether the maximum grant limit awards are sufficient to perform more expensive and complex HMs, such as the kitchen or major bathroom alternations.13
Facilities categorized as 1a, 1b, or 1c provided
North Florida/Sough Georgia was the highest-prescribing VAMC with 39% more HM prescriptions than the second highest prescribing facility (Durham, NC). Unfortunately, the data presented here cannot establish causality for the large variance difference between the top facilities, and the skewed distribution of total RHUs across VAMCs.
Travel-Related Variables
HISA beneficiaries face significant travel-related challenges. Just 3.6% of RHUs could access a facility within 40 miles of their home and 43.2% traveled 100 to 200 miles from their home to access a HM prescription. Further exploration is warranted to understand how travel patterns impact access to or the uptake of HISA.
RVs already have problems with accessing care because of long travel time.14,15 The choice or necessity to travel to a farther facility for HISA prescription is problematic for RVs, especially when transportation is often reported in the literature as a barrier to resources for people living in rural communities.15-17 When patients have travel barriers, they wait longer to obtain medical services and often wait for their conditions to worsen before seeking services.15,18 Once HM is completed, telerehabilitation is an effective delivery method used for delivering health care services to people in remote places.18,19 Considering that HISA use has the potential to improve quality of life, afford comfort, facilitate the accomplishment of activities of daily living for RVs, it is important that future studies examine how existing telehealth technologies can be used to improve HISA access.
Future Directions
County-level analyses is warranted in future studies exploring potential variables associated with HISA use; for example, county-level rates of primary care physicians and other HCPs. Future research should explore how long distance travel impacts the HISA application process and HM implementation. Further research also should focus on the HISA application structure and process to identify causes of delays. The HISA application process takes a mean 6 months to complete, yet the duration of hospital stays is 1 to 3 weeks, thus it is impossible to connect HISA to hospital discharge, which was the original intent of the program. Future research can examine how telehealth services can expedite HISA obtainment and coordination of the application process. Future research also may study the possible causes of the wide variations in HM prescriptions per facility. It is also important that educational programs provide information on the array of HM items that veterans can obtain.
Conclusions
In our previous study of the HISA cohort (2011-2017), we documented that an increase in utilization of the HISA program was warranted based on the low national budgetary appropriation and identification of significant low participation by vulnerable subpopulations, including veterans residing in rural areas or having returned from recent conflicts.7 The present study documents national utilization patterns, demographic profiles, and clinical characteristics of RHUs from FY 2015 through FY 2018, data that may be useful to policy makers and HISA administrators in predicting future use and users. It is important to note that the data and information presented in this article identify trends. The work in no way establishes a gold standard or any targeted goal of utilization. Future research could focus on conceptualizing or theorizing what steps are necessary to set such a gold standard of utilization rate and steps toward achievement.
Acknowledgments
This research was supported by grant 15521 from the US Department of Veterans Affairs, Office of Rural Health . Furthermore, the research was supported in part by grant K12 HD055929 from the National Institutes of Health.
The US Department of Veterans Affairs (VA) created the Home Improvements and Structural Alterations (HISA) program to help provide necessary home modifications (HMs) to veterans with disabilities (VWDs) that will facilitate the provision of medical services at home and improve home accessibility and functional independence. The Veterans Health Administration (VHA) has more than 9 million veteran enrollees; of those, 2.7 million are classified as rural or highly rural.1 Rural veterans (RVs) possess higher rate of disability compared with that of urban veterans.2-5 RVs have unequal access to screening of ambulatory care sensitive conditions (eg, hypertension, diabetes mellitus).6 Furthermore, RVs are at risk of poor medical outcomes due to distance from health care facilities and specialist care, which can be a barrier to emergency care when issues arise. These barriers, among others, are associated with compromised health quality of life and health outcomes for RVs.3,6 The HISA program may be key to decreasing falls and other serious mishaps in the home. Therefore, understanding use of the HISA program by RVs is important. However, to date little information has been available regarding use of HISA benefits by RVs or characteristics of RVs who receive HISA benefits.
HISA Alterations Program
HISA was initially developed by VA to improve veterans’ transition from acute medical care to home.7,8 However, to obtain HISA grants currently, there is an average 3 to 6 months application process.7 Through the HISA program, VWDs can be prescribed the following HMs, including (but not limited to): flooring replacement, permanent ramps, roll-in showers, installation of central air-conditioning systems, improved lighting, kitchen/bathroom modifications, and home inspections. The HMs prescribed depend on an assessment of medical need by health care providers (HCPs).8
As time passed and the veteran population aged, the program now primarily helps ensure the ability to enter into essential areas and safety in the home.5 The amount of a HISA payment is based on whether a veteran’s health condition is related to military service as defined by the VHA service connection medical evaluation process. Barriers to obtaining a HISA HM can include difficulty in navigating the evaluation process and difficulty in finding a qualified contractor or builder to do the HM.7
This article aims to: (1) Detail the sociodemographic and clinical characteristics of rural HISA users (RHUs); (2) report on HISA usage patterns in number, types, and cost of HMs; (3) compare use amid the diverse VA medical centers (VAMCs) and related complexity levels and Veterans Integrated Service Networks (VISNs); and (4) examine the relationship between travel time/distance and HISA utilization. The long-term goal is to provide accurate information to researchers, HM administrators, health care providers and policy makers on HISA program utilization by rural VWDs, which may help improve its use and bring awareness of its users. This study was approved by the affiliate University of Florida Institutional Review Board and VA research and development committee at the North Florida/South Georgia Veterans Health System.
Methods
Data were obtained from 3 VA sources: the National Prosthetics Patient Database (NPPD), the VHA Medical Inpatient Dataset, and the VHA Outpatient Dataset.7 The NPPD is a national administrative database that contains information on prosthetic-associated products ordered by HCPs for patients, such as portable ramps, handrails, home oxygen equipment, and orthotic and prosthetic apparatus. Data obtained from the NPPD included cost of HMs, clinical characteristics, VISN, and VAMC. VA facilities are categorized into complexity levels 1a, 1b, 1c, 2, and 3. Complexity level 1a to 1c VAMCs address medical cases that entail “heightening involvedness,” meaning a larger number of patients presented with medical concerns needing medical specialists. Complexity levels 2 and 3 have fewer resources, lower patient numbers, and less medically complex patients. Finally, the VHA Medical Inpatient and Outpatient Datasets administrated by VA Informatics and Computing Infrastructure, consist of in-depth health services national data on inpatient and outpatient encounters and procedures.
The study cohort was divided into those with service-connected conditions (Class 1) or those with conditions not related to military service (Class 2). If veterans were identified in both classes, they were assigned to Class 1. The cost variable is determined by using the veterans’ classification. Class 1 veterans receive a lifetime limit of $6800, and Class 2 veterans receive a lifetime limit of $2000. A Class 2 veteran with ≥ 50% disability rating is eligible for a HISA lifetime limit of $6800. Whenever a value exceeds allowed limit of $6800 or $2000, due to data entry error or other reasons, the study team reassigned the cost value to the maximum allowed value.
Travel distance and time were derived by loading patient zip codes and HISA facility locations into the geographical information system program and using the nearest facility and find-route tools. These tools used a road network that simulates real-world driving conditions to calculate distance.
Study Variables
VWDs of any age, gender, and race/ethnicity who qualified for HISA and received HMs from fiscal year ( FY) 2015 through FY 2018 were identified (N = 30,823). Most VWDs were nonrural subjects (n = 19,970), and 43 had no Federal Information Processing System data. The final study cohort consisted of 10,810 HISA recipients. The NPPD, inpatient and outpatient data were merged by scrambled social security numbers to retrieve the following data: age, gender, race, ethnicity, marital status, Class (1 or 2), mean and total number of inpatient days, and type of HMs prescribed.
We also recorded rurality using the VA Rural-Urban Commuting Areas (RUCA) system, but we combined the rural and highly rural designation.1 Census tracts with a RUCA score of 10.0 are deemed highly rural, the remainder are considered rural except those with a RUCA score of 1.0 or 1.1. Travel time and distance from a veteran’s home to the VA facility that provided the HISA prescription were determined from zip codes. The current study focuses on VAMCs prescribing stations (affiliated sites of administrative parent medical facilities) where the HISA users obtained the HM, not the parent station (administrative parent medical facilities).
HISA Utilization
To characterize HISA utilization geographically and over time, the number of users were mapped by county. Areas where users were increasing (hot spots) or decreasing (cold spots) also were mapped. The maps were created using Environmental Systems Research Institute ArcGIS Pro 2.2.1 software. We chose to use natural breaks (Jenks) data classification method in a choropleth to symbolize the change over time map. We then used the Getis Ord GI* optimized hot spot analysis tool in the ArcGIS Pro spatial statistics tool set to generate the hot/cold spot maps. This tool identifies clusters of high values (hot spots) and low values (cold spots) creating a new output layer, RHUs by county, with a Z score, P value, and CI for each county. The Gi Bin field classifies statistically significant hot and cold spots. Counties sorted into the ± 3 category (bin) have a clustering characteristic (eg, with neighboring counties) that is statistically significant with a 99% CI; the ± 2 bin indicates a 95% CI for those county clustering sorted therein; ± 1 reflects a 90% CI; and 0 bin contains county features that have no statistical significant clustering with neighboring counties.
Data Analysis
Data were cleaned and analyzed using SAS 9.4 and R 3.5.3. Descriptive statistics are provided for sociodemographic characteristics, clinical characteristics, and class. ANOVA and t tests were used to compare continuous variables between groups, while χ2 and Fisher exact tests were used for dichotomous and categorical outcome variables. The threshold for statistical significance for these tests was set at α = .001.
Results
There were 10,810 RHUs from FY 2015 through FY 2018 and HISA utilization increased each year (Figure 1). Although some years may show usage decreases relative to previous fiscal years, the cumulative trends showed an increase relative to FY 2015 for both Classes of RVs (Figure 2). There was a 45.4% increase from FY 2015 to FY 2018 with a mean 13.6% yearly increase. Class 1 increased 21.0% and Class 2 increased 39.5% from FY 2015 to FY 2016 (Figure 3).
Most RHUs were male, White, and married. Class 1 and Class 2 RHUs differed significantly by age, race, marital status, and disability conditions: Class 1 RHUs were aged 6.6 years younger with a mean age of 69.1 years compared with 75.7 years for Class 2 users. For Class 1 RHUs, a plurality (29.4%) were aged 65 to 69 years; while a plurality (41.4%) of Class 2 users were aged ≥ 80 years. Musculoskeletal was the most common identified type of condition for all RHUs (Table 1).
To better understand HISA utilization patterns and net RHUs per county, we used a map to detail RHUs by county and change over time (Figure 4). Additionally, we compared US counties by RHUs from FY 2015 to FY 2018 and determined how clusters of high numbers of RHUs (hot spots) and low numbers of RHUs (cold spots) shifted over this period (Figure 5). While HISA utilization grew over the study period, the net count of RHUs per county varied by 9 to 20 persons/county. The population of RHUs increased over time in the Southwest, Southeast, and over much of the East/Northeast, while in the Central and Midwest regions, number of RHUs seems to decrease in population and/or use of the system. The cold spots in the Midwest and South Central US seem to increase with a significant relationship to neighboring counties having a low number of RHUs.
There were 11,166 HM prescribed to RHUs (Table 2). Bathroom HMs also were the dominant HM type for all facilities regardless of complexity levels (Table 3). The San Antonio, Texas, VAMC demonstrated the highest Class 1 vs Class 2 difference in HISA use (Class 1: 87.7% and Class 2: 12.3%). Except for the Des Moines VAMC, all other VAMCs showed HISA use > 60% by Class 1.
Cost Data
Air-conditioning installation ($5007) was the costliest HM overall (Table 4), closely followed by bathroom ($4978) and kitchen modifications ($4305). Bathroom renovations were the costliest HM type for both Class 1 and Class 2, closely followed by electrical repair and air-conditioning installation for Class 1 and driveway reconstruction and wooden ramp construction for Class 2.
The mean award received for HM was $4687 (Table 5). While the number of RHUs increased from FY 2015 to FY 2016, the average cost decreased, both overall ($280) and for Class 1 ($195) and Class 2 ($153). Except for a small decline in the number of Class 2 HISA recipients from FY 2017 to FY 2018, overall, the number of RHUs continuously grew from FY 2015 to FY 2018: 977 for the overall cohort, 678 for Class 1 and 299 for Class 2. Despite the obvious gain in the number of RHUs, the average costs did not notably change over time. VISN 21 had the highest mean cost, followed by VISNs 17, 6, 22, and 20.
Travel
Travel time and distance to the HISA prescribing facility differed significantly between Class 1 and Class 2 HISA users. RHUs had to travel about 95 minutes from their place of residence to access the HISA benefits program. There were no statistically significant differences between Class 1 and 2 users with respect to travel time and distance traveled (Table 6).
The majority of Class 1 and Class 2 veterans accessed the HISA from their nearest facility. However, nearly one-quarter of both Class 1 and 2 RHUs (24% each) did not. Among the 2598 who accessed the nonnearest facility, 97 (3.7%) accessed a facility that is ≤ 40 miles. Many (44%) users traveled 40 to 100 miles, and another 43.2% traveled 100 to 200 miles from their residence to access a HM prescription. Some 2598 users (1.1%) traveled > 500 miles to access a facility.
Discussion
Although utilization of the HISA program has steadily increased, overall participation by subpopulations such as RHUs can still be improved significantly. Veterans aged ≤ 46 years who have a disability that is common to those receiving HISA benefits have low HISA utilization. Similarly, veterans with sensory disabilities also have low use. These subpopulations are among those in great need of attention and services.
A study by Lucas and Zelaya, using the 2016 National Health Interview Survey data with an aim to measure degree of vision problems, dual sensory impairment, and hearing trouble in male veterans aged ≥ 18 years, found that veterans were more likely to report dual sensory impairment and balance difficulties when compared with nonveterans.9 The number of female veterans is growing but had very low representation in this study.10 This emerging VHA population requires information and education on their HM benefits.
Home Modifications
The most common HM prescribed for RHUs was for the bathroom. Further investigation is warranted as to why, given the diversity of HM types that the grant covers, low prescription rates exist across most of the HM types. There may be a lack of knowledge by providers and VWD as to the range of HMs that can be awarded under the grant. It is important that HCPs and veterans receive education on HISA HM options.
Semeah and colleagues pointed out the need for an assessment of the HISA HM ordering system to ensure that multiple HMs items (eg, kitchen, air conditioning, fees, driveway, and plumbing) are listed among the forced choices shown to clinicians to select from.7 Poor housing in rural America is widespread: 63% of rural dwellings need renovations and/or repairs to be accessible to individuals with disabilities, with > 6.7 million rural homes having no or faulty plumbing or kitchens; yet in this study, prescriptions for these HMs accounted for < 1%.11,12
VISN 6 had the most HISA awards with 1364, while VISN 21 had the fewest (245). Across all VISNs, Class 1 RHUs received more prescriptions than did Class 2 RHUs. Future research may seek to examine whether prescribers are fully aware of the eligibility of HM prescription to Class 2 veterans. VISN 21 ($5354); VISN 17 ($5302); and VISN 6 ($5301) had the highest mean HM expenditures. The national mean cost for HISA HMs were $4978 for bathrooms and $4305 for kitchens; for non-HISA HMs in FY 2017, the mean costs were $6362 and $12,255, respectively. A noteworthy concern is whether the maximum grant limit awards are sufficient to perform more expensive and complex HMs, such as the kitchen or major bathroom alternations.13
Facilities categorized as 1a, 1b, or 1c provided
North Florida/Sough Georgia was the highest-prescribing VAMC with 39% more HM prescriptions than the second highest prescribing facility (Durham, NC). Unfortunately, the data presented here cannot establish causality for the large variance difference between the top facilities, and the skewed distribution of total RHUs across VAMCs.
Travel-Related Variables
HISA beneficiaries face significant travel-related challenges. Just 3.6% of RHUs could access a facility within 40 miles of their home and 43.2% traveled 100 to 200 miles from their home to access a HM prescription. Further exploration is warranted to understand how travel patterns impact access to or the uptake of HISA.
RVs already have problems with accessing care because of long travel time.14,15 The choice or necessity to travel to a farther facility for HISA prescription is problematic for RVs, especially when transportation is often reported in the literature as a barrier to resources for people living in rural communities.15-17 When patients have travel barriers, they wait longer to obtain medical services and often wait for their conditions to worsen before seeking services.15,18 Once HM is completed, telerehabilitation is an effective delivery method used for delivering health care services to people in remote places.18,19 Considering that HISA use has the potential to improve quality of life, afford comfort, facilitate the accomplishment of activities of daily living for RVs, it is important that future studies examine how existing telehealth technologies can be used to improve HISA access.
Future Directions
County-level analyses is warranted in future studies exploring potential variables associated with HISA use; for example, county-level rates of primary care physicians and other HCPs. Future research should explore how long distance travel impacts the HISA application process and HM implementation. Further research also should focus on the HISA application structure and process to identify causes of delays. The HISA application process takes a mean 6 months to complete, yet the duration of hospital stays is 1 to 3 weeks, thus it is impossible to connect HISA to hospital discharge, which was the original intent of the program. Future research can examine how telehealth services can expedite HISA obtainment and coordination of the application process. Future research also may study the possible causes of the wide variations in HM prescriptions per facility. It is also important that educational programs provide information on the array of HM items that veterans can obtain.
Conclusions
In our previous study of the HISA cohort (2011-2017), we documented that an increase in utilization of the HISA program was warranted based on the low national budgetary appropriation and identification of significant low participation by vulnerable subpopulations, including veterans residing in rural areas or having returned from recent conflicts.7 The present study documents national utilization patterns, demographic profiles, and clinical characteristics of RHUs from FY 2015 through FY 2018, data that may be useful to policy makers and HISA administrators in predicting future use and users. It is important to note that the data and information presented in this article identify trends. The work in no way establishes a gold standard or any targeted goal of utilization. Future research could focus on conceptualizing or theorizing what steps are necessary to set such a gold standard of utilization rate and steps toward achievement.
Acknowledgments
This research was supported by grant 15521 from the US Department of Veterans Affairs, Office of Rural Health . Furthermore, the research was supported in part by grant K12 HD055929 from the National Institutes of Health.
1. US Department of Veterans Affairs, Veteran Health Administration, Office of Rural Health. Rural veteran health care challenges. Updated February 9, 2021. Accessed June 11, 2021. https://www.ruralhealth.va.gov/aboutus/ruralvets.asp
2. Holder, K.A. Veterans in rural America, 2011–2015. Published January 2017. Accessed June 11, 2021. https://www.census.gov/content/dam/Census/library/publications/2017/acs/acs-36.pdf
3. Pezzin LE, Bogner HR, Kurichi JE, et al. Preventable hospitalizations, barriers to care, and disability. Medicine (Baltimore). 2018;97(19):e0691. doi:10.1097/MD.0000000000010691
4. Rosenbach ML. Access and satisfaction within the disabled Medicare population. Health Care Financ Rev. 1995;17(2):147-167.
5. Semeah LM, Ganesh SP, Wang X, et al. Home modification and health services utilization in rural and urban veterans with disabilities. Housing Policy Debate. 2021. Published online: March 4, 2021. doi:10.1080/10511482.2020.1858923
6. Spoont M, Greer N, Su J, Fitzgerald P, Rutks I, and Wilt TJ. Rural vs. urban ambulatory health care: A Systematic Review. Published May 2011. Accessed June 11, 2021. https://www.hsrd.research.va.gov/publications/esp/ambulatory.pdf
7. Semeah LM, Wang X, Cowper Ripley DC, et al. Improving health through a home modification service for veterans. In: Fiedler BA, ed. Three Facets of Public Health and Paths to Improvements. Academic Press; 2020:381-416.
8. Semeah LM, Ahrentzen S, Jia H, Cowper-Ripley DC, Levy CE, Mann WC. The home improvements and structural alterations benefits program: veterans with disabilities and home accessibility. J Disability Policy Studies. 2017;28(1):43-51. doi:10.1177/1044207317696275
9. Lucas, JW, Zelaya, CE. Hearing difficulty, vision trouble, and balance problems among male veterans and nonveterans. Published June 12, 2020. Accessed June 11, 2021. https://www.cdc.gov/nchs/data/nhsr/nhsr142-508.pdf
10. US Department of Veterans Affairs, National Center for Veterans Analysis and Statistics. Women veterans report: the past, present, and future of women veterans. Published February 2017. Accessed June 11, 2021. https://www.va.gov/vetdata/docs/SpecialReports/Women_Veterans_2015_Final.pdf
11. US Department of Housing and Urban Development, Office of Policy Development and Research. Housing challenges of rural seniors. Published 2017. Accessed June 11, 2021. https://www.huduser.gov/portal/periodicals/em/summer17/highlight1.html
12. Pendall R, Goodman L, Zhu J, Gold A. The future of rural housing. Published October 2016. Accessed June 11, 202.1 https://www.urban.org/sites/default/files/publication/85101/2000972-the-future-of-rural-housing_6.pdf
13. Joint Center for Housing Studies at Harvard University. Improving America’s housing 2019. Published 2019. Accessed June 11, 2021. https://www.jchs.harvard.edu/sites/default/files/reports/files/Harvard_JCHS_Improving_Americas_Housing_2019.pdf
14. Schooley BL, Horan TA, Lee PW, West PA. Rural veteran access to healthcare services: investigating the role of information and communication technologies in overcoming spatial barriers. Perspect Health Inf Manag. 2010;7(Spring):1f. Published 2010 Apr 1.
15. Ripley DC, Kwong PL, Vogel WB, Kurichi JE, Bates BE, Davenport C. How does geographic access affect in-hospital mortality for veterans with acute ischemic stroke?. Med Care. 2015;53(6):501-509. doi:10.1097/MLR.0000000000000366
16. Cowper-Ripley DC, Reker DM, Hayes J, et al. Geographic access to VHA rehabilitation services for traumatically injured veterans. Fed Pract. 2009;26(10):28-39.
17. Smith M, Towne S, Herrera-Venson A, Cameron K, Horel S, Ory M, et al. Delivery of fall prevention interventions for at-risk older adults in rural areas: Findings from a national dissemination. International journal of environmental research and public health. 2018;15:2798. doi: 10.3390/ijerph15122798
18. Hale-Gallardo JL, Kreider CM, Jia H, et al. Telerehabilitation for Rural Veterans: A Qualitative Assessment of Barriers and Facilitators to Implementation. J Multidiscip Healthc. 2020;13:559-570. doi:10.2147/JMDH.S247267
19. Sarfo FS, Akassi J, Kyem G, et al. Long-Term Outcomes of Stroke in a Ghanaian Outpatient Clinic. J Stroke Cerebrovasc Dis. 2018;27(4):1090-1099. doi:10.1016/j.jstrokecerebrovasdis.2017.11.017
1. US Department of Veterans Affairs, Veteran Health Administration, Office of Rural Health. Rural veteran health care challenges. Updated February 9, 2021. Accessed June 11, 2021. https://www.ruralhealth.va.gov/aboutus/ruralvets.asp
2. Holder, K.A. Veterans in rural America, 2011–2015. Published January 2017. Accessed June 11, 2021. https://www.census.gov/content/dam/Census/library/publications/2017/acs/acs-36.pdf
3. Pezzin LE, Bogner HR, Kurichi JE, et al. Preventable hospitalizations, barriers to care, and disability. Medicine (Baltimore). 2018;97(19):e0691. doi:10.1097/MD.0000000000010691
4. Rosenbach ML. Access and satisfaction within the disabled Medicare population. Health Care Financ Rev. 1995;17(2):147-167.
5. Semeah LM, Ganesh SP, Wang X, et al. Home modification and health services utilization in rural and urban veterans with disabilities. Housing Policy Debate. 2021. Published online: March 4, 2021. doi:10.1080/10511482.2020.1858923
6. Spoont M, Greer N, Su J, Fitzgerald P, Rutks I, and Wilt TJ. Rural vs. urban ambulatory health care: A Systematic Review. Published May 2011. Accessed June 11, 2021. https://www.hsrd.research.va.gov/publications/esp/ambulatory.pdf
7. Semeah LM, Wang X, Cowper Ripley DC, et al. Improving health through a home modification service for veterans. In: Fiedler BA, ed. Three Facets of Public Health and Paths to Improvements. Academic Press; 2020:381-416.
8. Semeah LM, Ahrentzen S, Jia H, Cowper-Ripley DC, Levy CE, Mann WC. The home improvements and structural alterations benefits program: veterans with disabilities and home accessibility. J Disability Policy Studies. 2017;28(1):43-51. doi:10.1177/1044207317696275
9. Lucas, JW, Zelaya, CE. Hearing difficulty, vision trouble, and balance problems among male veterans and nonveterans. Published June 12, 2020. Accessed June 11, 2021. https://www.cdc.gov/nchs/data/nhsr/nhsr142-508.pdf
10. US Department of Veterans Affairs, National Center for Veterans Analysis and Statistics. Women veterans report: the past, present, and future of women veterans. Published February 2017. Accessed June 11, 2021. https://www.va.gov/vetdata/docs/SpecialReports/Women_Veterans_2015_Final.pdf
11. US Department of Housing and Urban Development, Office of Policy Development and Research. Housing challenges of rural seniors. Published 2017. Accessed June 11, 2021. https://www.huduser.gov/portal/periodicals/em/summer17/highlight1.html
12. Pendall R, Goodman L, Zhu J, Gold A. The future of rural housing. Published October 2016. Accessed June 11, 202.1 https://www.urban.org/sites/default/files/publication/85101/2000972-the-future-of-rural-housing_6.pdf
13. Joint Center for Housing Studies at Harvard University. Improving America’s housing 2019. Published 2019. Accessed June 11, 2021. https://www.jchs.harvard.edu/sites/default/files/reports/files/Harvard_JCHS_Improving_Americas_Housing_2019.pdf
14. Schooley BL, Horan TA, Lee PW, West PA. Rural veteran access to healthcare services: investigating the role of information and communication technologies in overcoming spatial barriers. Perspect Health Inf Manag. 2010;7(Spring):1f. Published 2010 Apr 1.
15. Ripley DC, Kwong PL, Vogel WB, Kurichi JE, Bates BE, Davenport C. How does geographic access affect in-hospital mortality for veterans with acute ischemic stroke?. Med Care. 2015;53(6):501-509. doi:10.1097/MLR.0000000000000366
16. Cowper-Ripley DC, Reker DM, Hayes J, et al. Geographic access to VHA rehabilitation services for traumatically injured veterans. Fed Pract. 2009;26(10):28-39.
17. Smith M, Towne S, Herrera-Venson A, Cameron K, Horel S, Ory M, et al. Delivery of fall prevention interventions for at-risk older adults in rural areas: Findings from a national dissemination. International journal of environmental research and public health. 2018;15:2798. doi: 10.3390/ijerph15122798
18. Hale-Gallardo JL, Kreider CM, Jia H, et al. Telerehabilitation for Rural Veterans: A Qualitative Assessment of Barriers and Facilitators to Implementation. J Multidiscip Healthc. 2020;13:559-570. doi:10.2147/JMDH.S247267
19. Sarfo FS, Akassi J, Kyem G, et al. Long-Term Outcomes of Stroke in a Ghanaian Outpatient Clinic. J Stroke Cerebrovasc Dis. 2018;27(4):1090-1099. doi:10.1016/j.jstrokecerebrovasdis.2017.11.017
Assessment of a Medication Deprescribing Tool on Polypharmacy and Cost Avoidance
According to the Centers for Disease Control and Prevention National Center for Health Statistics (NCHS), the use of prescription drugs has increased in the past half century. Although prescription drugs have played an important role in preventing, controlling, and delaying onset or progression of disease, their growth in use also has posed many risks.1 One ramification of this growth is the occurrence of polypharmacy, which does not have a universal, clear definition. In general, it can be described as the concurrent use of multiple medications by a single patient to treat one or more medical ailments. Five or more medications taken simultaneously is the most common definition to date, but this is just one of many acceptable definitions and that varies from one health care facility to another.1,2
Regardless of the cutoffs established to indicate polypharmacy, its incidence can result in poor and potentially harmful health outcomes. Polypharmacy increases the risk of experiencing adverse drug events (ADEs), drug-drug interactions (DDIs), geriatric-related syndromes, falls, hospitalization, and mortality. Issues with adherence may begin to unfold secondary to increased pill burden. Both the patient and the health care system may encounter financial strain, as polypharmacy can lead to unnecessary and essentially preventable costs of care. When evaluating the likelihood of polypharmacy based on age group, NCHS found that 47.5% of patients taking ≥ 5 medications were aged ≥ 65 years.1-5 This indicates that polypharmacy is of great concern in the geriatric population, which also represents a large proportion of individuals accessing Veterans Health Administration (VHA) care.
Deprescibing
Deprescribing is the act of withdrawing or discontinuing potentially inappropriate medications (PIM), or medications used by older patients harboring ADEs that generally outweigh the clinical benefits of the drug. Deprescribing is an effective tool for managing or reducing polypharmacy. A variety of tools have been created whose sole purpose is to simplify deprescribing. Some tools explicitly identify PIM and are widely familiar in medical practice. Examples are the Beers Criteria developed in 1991 or Screening Tool to Alert Right Treatment/Screening Tool of Older Persons Prescriptions (START/STOPP) criteria created in 2003. Other tools that are less commonplace but equally as resourceful are MedStopper and Deprescribing.org. The former was launched in 2015 and is a Canadian online system that provides risk assessments for medications with guidance for tapering or stopping medications if continuation of the drug presents higher risk than benefit.5-7 The latter is a full-fledged website developed by a physician, a pharmacist, and their research teams that serves as an exchange hub for deprescribing information.
In 2016, the VIONE (Vital, Important, Optional, Not indicated/treatment complete, and Every medication has an indication) deprescribing tool was developed by Saraswathy Battar, MD, at Central Arkansas Veterans Healthcare System (CAVHS) in Little Rock, as a system that could go beyond medication reconciliation (Table 1). Health care providers (HCPs) and pharmacists evaluate each medication that a patient has been prescribed and places each medication in a VIONE category. Prescribers may then take the opportunity to deprescribe or discontinue medications if deemed appropriate based on their clinical assessments and shared decision making.8 Traditionally, medication reconciliation involves the process of obtaining a complete and accurate list of medications as reported by a patient or caregiver to a HCP. VIONE encourages HCPs and pharmacists not only to ensure medication lists are accurate, but also that each medication reported is appropriate for continued use. In other words, VIONE is meant to help implement deprescribing at opportune times. More than 14,000 medications have been deprescribed using the VIONE method, resulting in more than $2,000,000 of annualized cost avoidance after just 1 year of implementation at CAVHS.9
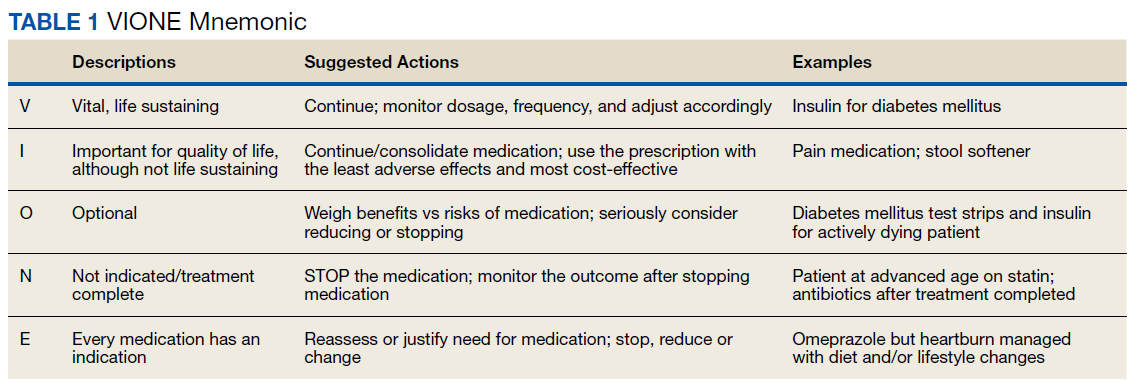
VIONE consists of 2 major components in the Computerized Patient Record System (CPRS): a template and a dropdown discontinuation menu. The template captured patient allergies, pertinent laboratory data, the patient’s active problem list and applicable diagnoses, and active medication list. Patient aligned care team (PACT) pharmacists used the information captured in the template to conduct medication reconciliations and polypharmacy reviews. Each medication is categorized in VIONE using data collected during reviews. A menu delineates reasons for discontinuation: optional, dose decrease, no diagnosis, not indicated/treatment complete, discontinue alternate medication prescribed, and patient reported no longer taking. The discontinuation menu allowed PACT pharmacists and physicians to choose 1 VIONE option per medication to clarify the reason for discontinuation. VIONE-based discontinuations are recorded in CPRS and identified as deprescribed.
At the time of this project, > 30 US Department of Veterans Affairs (VA) facilities had adopted VIONE. Use of VIONE at VA Southern Nevada Healthcare System (VASNHS) in North Las Vegas has been incorporated in the everyday practices of home-based primary care pharmacists and physicians but has yet to be implemented in other areas of the facility. The purpose of this project was to determine the impact of the VIONE tool on polypharmacy and cost avoidance at VASNHS when used by primary care physicians (PCPs) and PACT primary care clinics.
Methods
Veterans receiving care at VASNHS aged ≥ 65 years with ≥ 10 active medications noted in CPRS were included in this project. PACT pharmacists and physicians were educated on the proper use of the VIONE tool prior to its implementation. Education included a 15-minute slide presentation followed by dissemination of a 1-page VIONE tool handout during a PACT all-staff clinic meeting.
Data were collected for 3 months before and after the intervention. Data were made available for assessment by the Automated Data Processing Application Coordinator (ADPAC) at VASNHS. The ADPAC created and generated an Excel spreadsheet report, which listed all medications deprescribed using the VIONE method. The primary endpoint was the total number of medications discontinued using the VIONE template and/or discontinuation menu. For the purpose of this project, appropriate discontinuation was considered any prescription deprescribed, excluding medical supplies, by pharmacists and PCPs who received VIONE education.

The secondary endpoint was the estimated annualized cost avoidance for the facility (Figure). The calculation does not include medications discontinued due to the prescription of an alternative medication or dose decreases since these VIONE selections imply that a new prescription or order was placed and the original prescription was not deprescribed. Annualized cost avoidance was determined with use of the VIONE dashboard, a database that retrospectively gathers information regarding patients at risk of polypharmacy, polypharmacy-related ADEs, and cost. Manual adjustments were made to various parameters on the Veterans Integrated Service Network 15 VIONE dashboard by the author in order to obtain data specific to this project. These parameters allowed selection of service sections, specific staff members or the option to include or exclude chronic or nonchronic medications. The annualized cost avoidance figure was then compared to raw data pulled by a VIONE dashboard correspondent to ensure the manual calculation was accurate. Finally, the 5 most common classes of medications deprescribed were identified for information purposes and to provide a better postulation on the types of medications being discontinued using the VIONE method.
Results
A total of 2,442 veterans met inclusion criteria, and the VIONE method was applied to 598 between late October 2018 and January 2019. The 13 PACT pharmacists contacted at least 10 veterans each, thus at least 130 were randomly selected for telephone calls to perform polypharmacy reviews using the VIONE note template. The discontinuation menu was used if a medication qualified to be deprescribed. After 3 months, 1986 prescriptions were deprescribed using VIONE; however, 1060 prescriptions were considered appropriately deprescribed (Table 2). The 13 PACT pharmacists deprescribed 361 medications, and the 29 PACT physicians deprescribed 699 medications. These prescriptions were then separated into medication categories to determine the most common discontinued classes. Vitamins and supplements were the medication class most frequently deprescribed (19.4%), followed by pain medications (15.5%), antimicrobial agents (9.6%), antihypertensive medications (9.2%), and diabetes medications (6.4%) (Table 3). The top 5 medication categories accounted for 60% of all medications appropriately deprescribed.
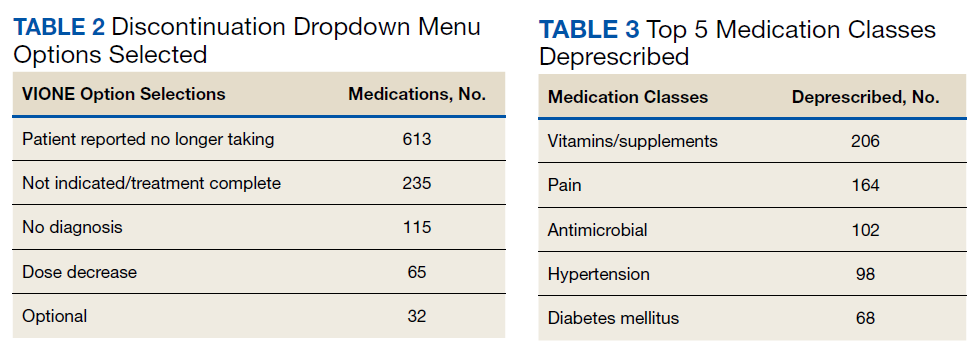
The estimated annualized cost avoidance for all medications deprescribed in the 3-month project period was $84,030.46. To provide the most appropriate and accurate calculation, medication classes excluded from this figure were acute or short-term prescriptions and antimicrobial agents. Medications prescribed short-term typically are not suitable to continue for an extended period, and antimicrobial agents were excluded since they are normally associated with higher costs, and may overestimate the cost avoidance calculation for the facility.
Discussion
The outcomes for the primary and secondary endpoints of this project illustrate that using VIONE in PACT primary care clinics had a notable impact on polypharmacy and cost avoidance over a short period. This outcome can be attributed to 2 significant effects of using the deprescribing tool. VIONE’s simplicity in application allowed clinicians to incorporate daily use of the tool with minimal effort. Education was all that was required to fully enable clinicians to work together successfully and exercise collaborative practice to promote deprescribing. VIONE also elicited a cascade of favorable effects that improve patient safety and health outcomes. The tool aided in identification of PIM, which helped reduce polypharmacy and medication burden. The risk for DDIs and ADEs may decrease; therefore, the incidence of falls, need for emergency department visits or inpatient care related to polypharmacy may decline. Less complex medication regimens may alleviate issues with adherence and avoid the various consequences of polypharmacy in theory. Simplified regimens can potentially improve disease management and quality of life for patients. Further studies are needed to substantiate deprescribing and its true effect on patient adherence and better health outcomes at this time.10
Reducing polypharmacy can lead to cost savings. Based on the results of this 3-month study, we expect that VASNHS would save more than $84,000 by reducing polypharmacy among its patients. Those savings can be funneled back into the health care system, and allotted to necessary patient care, prescriptions, and health care facility needs.
Limitations
There are some important limitations to this study. Definitions of polypharmacy may vary from one health care facility to another. The cutoffs for polypharmacy may differ, causing the prevalence of polypharmacy and potential costs savings to vary. Use of VIONE may be inconsistent among users if not previously educated or properly trained. For instance, VIONE selections are listed in the same menu as the standard CPRS discontinuation options, which may lead to discontinuation of medical supplies or laboratory orders instead of prescriptions.
The method of data analysis and project design used in this study may have been subject to error. For example, the list of PCPs may have been inaccurate or outdated, which would result in an over- or underrepresentation of those who contributed to data collection. Furthermore, there is some volatility in calculating the total cost avoidance. For example, medications for chronic conditions that were only taken on an as needed basis may have overestimated savings. Either under- or overestimations could occur when parameters are adjusted on the VIONE discontinuation dashboard without appropriate guidance. With the ability to manually adjust the dashboard parameters, dissimilarities in calculations may follow.
Conclusions
The VIONE tool may be useful in improving patient safety through deprescribing and discontinuing PIM. Decreasing the number of medications being taken concomitantly by a patient and continuing only those that are imperative in their medical treatment is the first step to reducing the incidence of polypharmacy. Consequently, chances of ADEs or DDIs are lessened, especially among older individuals who are considered high risk for experiencing the detrimental effects that may ensue. These effects include geriatric-related syndromes, increased risk of fall, hospital visits or admissions, or death. Use of VIONE easily promotes collaboration among clinicians to evaluate medications eligible for discontinuation more regularly. If this deprescribing tool is continuously used, costs avoided can likely be maximized within VA health care systems.
The results of this project should serve as an incentive to push for better prescribing practices and increase deprescribing efforts. It should provoke the need for change in regimens and the subsequent discontinuation of prescriptions that are not considered vital to continue. Finally, the result of this project should substantiate the positive impact a deprescribing tool can possess to avert the issues commonly associated with polypharmacy.
1. Centers for Disease Control and Prevention, National Center for Health Statistics. Health, United States, 2013: with special feature on prescription drugs. Published May 2014. Accessed May 13, 2021. https://www.cdc.gov/nchs/data/hus/hus13.pdf
2. Masnoon N, Shakib S, Kalisch-Ellett L, Caughey GE. What is polypharmacy? A systematic review of definitions. BMC Geriatr. 2017;17(1):230. Published 2017 Oct 10. doi:10.1186/s12877-017-0621-2
3. Parulekar MS, Rogers CK. Polypharmacy and mobility. In: Cifu DX, Lew HL, Oh-Park M., eds Geriatric Rehabilitation. Elsevier; 2018. doi:10.1016/B978-0-323-54454-2.12001-1
4. Rieckert A, Trampisch US, Klaaßen-Mielke R, et al. Polypharmacy in older patients with chronic diseases: a cross-sectional analysis of factors associated with excessive polypharmacy. BMC Fam Pract. 2018;19(1):113. Published 2018 Jul 18. doi:10.1186/s12875-018-0795-5
5. Thompson CA. New medication review method cuts veterans’ Rx load, saves millions. Am J Health Syst Pharm. 2018;75(8):502-503. doi:10.2146/news180023
6. Reeve E. Deprescribing tools: a review of the types of tools available to aid deprescribing in clinical practice. J Pharm Pract Res. 2020;50(1):98-107. doi:10.1002/jppr.1626
7. Fried TR, Niehoff KM, Street RL, et al. Effect of the Tool to Reduce Inappropriate Medications on Medication Communication and Deprescribing. J Am Geriatr Soc. 2017;65(10):2265-2271. doi:10.1111/jgs.15042
8. Battar S, Dickerson KR, Sedgwick C, et al. Understanding principles of high reliability organizations through the eyes of VIONE, a clinical program to improve patient safety by deprescribing potentially inappropriate medications and reducing polypharmacy. Fed Pract. 2019;36(12):564-568.
9. Battar S, Cmelik T, Dickerson K, Scott, M. Experience better health with VIONE a safe medication deprescribing tool [Nonpublic source, not verified]
10. Ulley J, Harrop D, Ali A, et al. Desprescribing interventions and their impact on medication adherence in community-dwelling older adults with polypharmacy: a systematic review. BMC Geriatr. 2019;19(15):1-13.
According to the Centers for Disease Control and Prevention National Center for Health Statistics (NCHS), the use of prescription drugs has increased in the past half century. Although prescription drugs have played an important role in preventing, controlling, and delaying onset or progression of disease, their growth in use also has posed many risks.1 One ramification of this growth is the occurrence of polypharmacy, which does not have a universal, clear definition. In general, it can be described as the concurrent use of multiple medications by a single patient to treat one or more medical ailments. Five or more medications taken simultaneously is the most common definition to date, but this is just one of many acceptable definitions and that varies from one health care facility to another.1,2
Regardless of the cutoffs established to indicate polypharmacy, its incidence can result in poor and potentially harmful health outcomes. Polypharmacy increases the risk of experiencing adverse drug events (ADEs), drug-drug interactions (DDIs), geriatric-related syndromes, falls, hospitalization, and mortality. Issues with adherence may begin to unfold secondary to increased pill burden. Both the patient and the health care system may encounter financial strain, as polypharmacy can lead to unnecessary and essentially preventable costs of care. When evaluating the likelihood of polypharmacy based on age group, NCHS found that 47.5% of patients taking ≥ 5 medications were aged ≥ 65 years.1-5 This indicates that polypharmacy is of great concern in the geriatric population, which also represents a large proportion of individuals accessing Veterans Health Administration (VHA) care.
Deprescibing
Deprescribing is the act of withdrawing or discontinuing potentially inappropriate medications (PIM), or medications used by older patients harboring ADEs that generally outweigh the clinical benefits of the drug. Deprescribing is an effective tool for managing or reducing polypharmacy. A variety of tools have been created whose sole purpose is to simplify deprescribing. Some tools explicitly identify PIM and are widely familiar in medical practice. Examples are the Beers Criteria developed in 1991 or Screening Tool to Alert Right Treatment/Screening Tool of Older Persons Prescriptions (START/STOPP) criteria created in 2003. Other tools that are less commonplace but equally as resourceful are MedStopper and Deprescribing.org. The former was launched in 2015 and is a Canadian online system that provides risk assessments for medications with guidance for tapering or stopping medications if continuation of the drug presents higher risk than benefit.5-7 The latter is a full-fledged website developed by a physician, a pharmacist, and their research teams that serves as an exchange hub for deprescribing information.
In 2016, the VIONE (Vital, Important, Optional, Not indicated/treatment complete, and Every medication has an indication) deprescribing tool was developed by Saraswathy Battar, MD, at Central Arkansas Veterans Healthcare System (CAVHS) in Little Rock, as a system that could go beyond medication reconciliation (Table 1). Health care providers (HCPs) and pharmacists evaluate each medication that a patient has been prescribed and places each medication in a VIONE category. Prescribers may then take the opportunity to deprescribe or discontinue medications if deemed appropriate based on their clinical assessments and shared decision making.8 Traditionally, medication reconciliation involves the process of obtaining a complete and accurate list of medications as reported by a patient or caregiver to a HCP. VIONE encourages HCPs and pharmacists not only to ensure medication lists are accurate, but also that each medication reported is appropriate for continued use. In other words, VIONE is meant to help implement deprescribing at opportune times. More than 14,000 medications have been deprescribed using the VIONE method, resulting in more than $2,000,000 of annualized cost avoidance after just 1 year of implementation at CAVHS.9
VIONE consists of 2 major components in the Computerized Patient Record System (CPRS): a template and a dropdown discontinuation menu. The template captured patient allergies, pertinent laboratory data, the patient’s active problem list and applicable diagnoses, and active medication list. Patient aligned care team (PACT) pharmacists used the information captured in the template to conduct medication reconciliations and polypharmacy reviews. Each medication is categorized in VIONE using data collected during reviews. A menu delineates reasons for discontinuation: optional, dose decrease, no diagnosis, not indicated/treatment complete, discontinue alternate medication prescribed, and patient reported no longer taking. The discontinuation menu allowed PACT pharmacists and physicians to choose 1 VIONE option per medication to clarify the reason for discontinuation. VIONE-based discontinuations are recorded in CPRS and identified as deprescribed.
At the time of this project, > 30 US Department of Veterans Affairs (VA) facilities had adopted VIONE. Use of VIONE at VA Southern Nevada Healthcare System (VASNHS) in North Las Vegas has been incorporated in the everyday practices of home-based primary care pharmacists and physicians but has yet to be implemented in other areas of the facility. The purpose of this project was to determine the impact of the VIONE tool on polypharmacy and cost avoidance at VASNHS when used by primary care physicians (PCPs) and PACT primary care clinics.
Methods
Veterans receiving care at VASNHS aged ≥ 65 years with ≥ 10 active medications noted in CPRS were included in this project. PACT pharmacists and physicians were educated on the proper use of the VIONE tool prior to its implementation. Education included a 15-minute slide presentation followed by dissemination of a 1-page VIONE tool handout during a PACT all-staff clinic meeting.
Data were collected for 3 months before and after the intervention. Data were made available for assessment by the Automated Data Processing Application Coordinator (ADPAC) at VASNHS. The ADPAC created and generated an Excel spreadsheet report, which listed all medications deprescribed using the VIONE method. The primary endpoint was the total number of medications discontinued using the VIONE template and/or discontinuation menu. For the purpose of this project, appropriate discontinuation was considered any prescription deprescribed, excluding medical supplies, by pharmacists and PCPs who received VIONE education.
The secondary endpoint was the estimated annualized cost avoidance for the facility (Figure). The calculation does not include medications discontinued due to the prescription of an alternative medication or dose decreases since these VIONE selections imply that a new prescription or order was placed and the original prescription was not deprescribed. Annualized cost avoidance was determined with use of the VIONE dashboard, a database that retrospectively gathers information regarding patients at risk of polypharmacy, polypharmacy-related ADEs, and cost. Manual adjustments were made to various parameters on the Veterans Integrated Service Network 15 VIONE dashboard by the author in order to obtain data specific to this project. These parameters allowed selection of service sections, specific staff members or the option to include or exclude chronic or nonchronic medications. The annualized cost avoidance figure was then compared to raw data pulled by a VIONE dashboard correspondent to ensure the manual calculation was accurate. Finally, the 5 most common classes of medications deprescribed were identified for information purposes and to provide a better postulation on the types of medications being discontinued using the VIONE method.
Results
A total of 2,442 veterans met inclusion criteria, and the VIONE method was applied to 598 between late October 2018 and January 2019. The 13 PACT pharmacists contacted at least 10 veterans each, thus at least 130 were randomly selected for telephone calls to perform polypharmacy reviews using the VIONE note template. The discontinuation menu was used if a medication qualified to be deprescribed. After 3 months, 1986 prescriptions were deprescribed using VIONE; however, 1060 prescriptions were considered appropriately deprescribed (Table 2). The 13 PACT pharmacists deprescribed 361 medications, and the 29 PACT physicians deprescribed 699 medications. These prescriptions were then separated into medication categories to determine the most common discontinued classes. Vitamins and supplements were the medication class most frequently deprescribed (19.4%), followed by pain medications (15.5%), antimicrobial agents (9.6%), antihypertensive medications (9.2%), and diabetes medications (6.4%) (Table 3). The top 5 medication categories accounted for 60% of all medications appropriately deprescribed.
The estimated annualized cost avoidance for all medications deprescribed in the 3-month project period was $84,030.46. To provide the most appropriate and accurate calculation, medication classes excluded from this figure were acute or short-term prescriptions and antimicrobial agents. Medications prescribed short-term typically are not suitable to continue for an extended period, and antimicrobial agents were excluded since they are normally associated with higher costs, and may overestimate the cost avoidance calculation for the facility.
Discussion
The outcomes for the primary and secondary endpoints of this project illustrate that using VIONE in PACT primary care clinics had a notable impact on polypharmacy and cost avoidance over a short period. This outcome can be attributed to 2 significant effects of using the deprescribing tool. VIONE’s simplicity in application allowed clinicians to incorporate daily use of the tool with minimal effort. Education was all that was required to fully enable clinicians to work together successfully and exercise collaborative practice to promote deprescribing. VIONE also elicited a cascade of favorable effects that improve patient safety and health outcomes. The tool aided in identification of PIM, which helped reduce polypharmacy and medication burden. The risk for DDIs and ADEs may decrease; therefore, the incidence of falls, need for emergency department visits or inpatient care related to polypharmacy may decline. Less complex medication regimens may alleviate issues with adherence and avoid the various consequences of polypharmacy in theory. Simplified regimens can potentially improve disease management and quality of life for patients. Further studies are needed to substantiate deprescribing and its true effect on patient adherence and better health outcomes at this time.10
Reducing polypharmacy can lead to cost savings. Based on the results of this 3-month study, we expect that VASNHS would save more than $84,000 by reducing polypharmacy among its patients. Those savings can be funneled back into the health care system, and allotted to necessary patient care, prescriptions, and health care facility needs.
Limitations
There are some important limitations to this study. Definitions of polypharmacy may vary from one health care facility to another. The cutoffs for polypharmacy may differ, causing the prevalence of polypharmacy and potential costs savings to vary. Use of VIONE may be inconsistent among users if not previously educated or properly trained. For instance, VIONE selections are listed in the same menu as the standard CPRS discontinuation options, which may lead to discontinuation of medical supplies or laboratory orders instead of prescriptions.
The method of data analysis and project design used in this study may have been subject to error. For example, the list of PCPs may have been inaccurate or outdated, which would result in an over- or underrepresentation of those who contributed to data collection. Furthermore, there is some volatility in calculating the total cost avoidance. For example, medications for chronic conditions that were only taken on an as needed basis may have overestimated savings. Either under- or overestimations could occur when parameters are adjusted on the VIONE discontinuation dashboard without appropriate guidance. With the ability to manually adjust the dashboard parameters, dissimilarities in calculations may follow.
Conclusions
The VIONE tool may be useful in improving patient safety through deprescribing and discontinuing PIM. Decreasing the number of medications being taken concomitantly by a patient and continuing only those that are imperative in their medical treatment is the first step to reducing the incidence of polypharmacy. Consequently, chances of ADEs or DDIs are lessened, especially among older individuals who are considered high risk for experiencing the detrimental effects that may ensue. These effects include geriatric-related syndromes, increased risk of fall, hospital visits or admissions, or death. Use of VIONE easily promotes collaboration among clinicians to evaluate medications eligible for discontinuation more regularly. If this deprescribing tool is continuously used, costs avoided can likely be maximized within VA health care systems.
The results of this project should serve as an incentive to push for better prescribing practices and increase deprescribing efforts. It should provoke the need for change in regimens and the subsequent discontinuation of prescriptions that are not considered vital to continue. Finally, the result of this project should substantiate the positive impact a deprescribing tool can possess to avert the issues commonly associated with polypharmacy.
According to the Centers for Disease Control and Prevention National Center for Health Statistics (NCHS), the use of prescription drugs has increased in the past half century. Although prescription drugs have played an important role in preventing, controlling, and delaying onset or progression of disease, their growth in use also has posed many risks.1 One ramification of this growth is the occurrence of polypharmacy, which does not have a universal, clear definition. In general, it can be described as the concurrent use of multiple medications by a single patient to treat one or more medical ailments. Five or more medications taken simultaneously is the most common definition to date, but this is just one of many acceptable definitions and that varies from one health care facility to another.1,2
Regardless of the cutoffs established to indicate polypharmacy, its incidence can result in poor and potentially harmful health outcomes. Polypharmacy increases the risk of experiencing adverse drug events (ADEs), drug-drug interactions (DDIs), geriatric-related syndromes, falls, hospitalization, and mortality. Issues with adherence may begin to unfold secondary to increased pill burden. Both the patient and the health care system may encounter financial strain, as polypharmacy can lead to unnecessary and essentially preventable costs of care. When evaluating the likelihood of polypharmacy based on age group, NCHS found that 47.5% of patients taking ≥ 5 medications were aged ≥ 65 years.1-5 This indicates that polypharmacy is of great concern in the geriatric population, which also represents a large proportion of individuals accessing Veterans Health Administration (VHA) care.
Deprescibing
Deprescribing is the act of withdrawing or discontinuing potentially inappropriate medications (PIM), or medications used by older patients harboring ADEs that generally outweigh the clinical benefits of the drug. Deprescribing is an effective tool for managing or reducing polypharmacy. A variety of tools have been created whose sole purpose is to simplify deprescribing. Some tools explicitly identify PIM and are widely familiar in medical practice. Examples are the Beers Criteria developed in 1991 or Screening Tool to Alert Right Treatment/Screening Tool of Older Persons Prescriptions (START/STOPP) criteria created in 2003. Other tools that are less commonplace but equally as resourceful are MedStopper and Deprescribing.org. The former was launched in 2015 and is a Canadian online system that provides risk assessments for medications with guidance for tapering or stopping medications if continuation of the drug presents higher risk than benefit.5-7 The latter is a full-fledged website developed by a physician, a pharmacist, and their research teams that serves as an exchange hub for deprescribing information.
In 2016, the VIONE (Vital, Important, Optional, Not indicated/treatment complete, and Every medication has an indication) deprescribing tool was developed by Saraswathy Battar, MD, at Central Arkansas Veterans Healthcare System (CAVHS) in Little Rock, as a system that could go beyond medication reconciliation (Table 1). Health care providers (HCPs) and pharmacists evaluate each medication that a patient has been prescribed and places each medication in a VIONE category. Prescribers may then take the opportunity to deprescribe or discontinue medications if deemed appropriate based on their clinical assessments and shared decision making.8 Traditionally, medication reconciliation involves the process of obtaining a complete and accurate list of medications as reported by a patient or caregiver to a HCP. VIONE encourages HCPs and pharmacists not only to ensure medication lists are accurate, but also that each medication reported is appropriate for continued use. In other words, VIONE is meant to help implement deprescribing at opportune times. More than 14,000 medications have been deprescribed using the VIONE method, resulting in more than $2,000,000 of annualized cost avoidance after just 1 year of implementation at CAVHS.9
VIONE consists of 2 major components in the Computerized Patient Record System (CPRS): a template and a dropdown discontinuation menu. The template captured patient allergies, pertinent laboratory data, the patient’s active problem list and applicable diagnoses, and active medication list. Patient aligned care team (PACT) pharmacists used the information captured in the template to conduct medication reconciliations and polypharmacy reviews. Each medication is categorized in VIONE using data collected during reviews. A menu delineates reasons for discontinuation: optional, dose decrease, no diagnosis, not indicated/treatment complete, discontinue alternate medication prescribed, and patient reported no longer taking. The discontinuation menu allowed PACT pharmacists and physicians to choose 1 VIONE option per medication to clarify the reason for discontinuation. VIONE-based discontinuations are recorded in CPRS and identified as deprescribed.
At the time of this project, > 30 US Department of Veterans Affairs (VA) facilities had adopted VIONE. Use of VIONE at VA Southern Nevada Healthcare System (VASNHS) in North Las Vegas has been incorporated in the everyday practices of home-based primary care pharmacists and physicians but has yet to be implemented in other areas of the facility. The purpose of this project was to determine the impact of the VIONE tool on polypharmacy and cost avoidance at VASNHS when used by primary care physicians (PCPs) and PACT primary care clinics.
Methods
Veterans receiving care at VASNHS aged ≥ 65 years with ≥ 10 active medications noted in CPRS were included in this project. PACT pharmacists and physicians were educated on the proper use of the VIONE tool prior to its implementation. Education included a 15-minute slide presentation followed by dissemination of a 1-page VIONE tool handout during a PACT all-staff clinic meeting.
Data were collected for 3 months before and after the intervention. Data were made available for assessment by the Automated Data Processing Application Coordinator (ADPAC) at VASNHS. The ADPAC created and generated an Excel spreadsheet report, which listed all medications deprescribed using the VIONE method. The primary endpoint was the total number of medications discontinued using the VIONE template and/or discontinuation menu. For the purpose of this project, appropriate discontinuation was considered any prescription deprescribed, excluding medical supplies, by pharmacists and PCPs who received VIONE education.
The secondary endpoint was the estimated annualized cost avoidance for the facility (Figure). The calculation does not include medications discontinued due to the prescription of an alternative medication or dose decreases since these VIONE selections imply that a new prescription or order was placed and the original prescription was not deprescribed. Annualized cost avoidance was determined with use of the VIONE dashboard, a database that retrospectively gathers information regarding patients at risk of polypharmacy, polypharmacy-related ADEs, and cost. Manual adjustments were made to various parameters on the Veterans Integrated Service Network 15 VIONE dashboard by the author in order to obtain data specific to this project. These parameters allowed selection of service sections, specific staff members or the option to include or exclude chronic or nonchronic medications. The annualized cost avoidance figure was then compared to raw data pulled by a VIONE dashboard correspondent to ensure the manual calculation was accurate. Finally, the 5 most common classes of medications deprescribed were identified for information purposes and to provide a better postulation on the types of medications being discontinued using the VIONE method.
Results
A total of 2,442 veterans met inclusion criteria, and the VIONE method was applied to 598 between late October 2018 and January 2019. The 13 PACT pharmacists contacted at least 10 veterans each, thus at least 130 were randomly selected for telephone calls to perform polypharmacy reviews using the VIONE note template. The discontinuation menu was used if a medication qualified to be deprescribed. After 3 months, 1986 prescriptions were deprescribed using VIONE; however, 1060 prescriptions were considered appropriately deprescribed (Table 2). The 13 PACT pharmacists deprescribed 361 medications, and the 29 PACT physicians deprescribed 699 medications. These prescriptions were then separated into medication categories to determine the most common discontinued classes. Vitamins and supplements were the medication class most frequently deprescribed (19.4%), followed by pain medications (15.5%), antimicrobial agents (9.6%), antihypertensive medications (9.2%), and diabetes medications (6.4%) (Table 3). The top 5 medication categories accounted for 60% of all medications appropriately deprescribed.
The estimated annualized cost avoidance for all medications deprescribed in the 3-month project period was $84,030.46. To provide the most appropriate and accurate calculation, medication classes excluded from this figure were acute or short-term prescriptions and antimicrobial agents. Medications prescribed short-term typically are not suitable to continue for an extended period, and antimicrobial agents were excluded since they are normally associated with higher costs, and may overestimate the cost avoidance calculation for the facility.
Discussion
The outcomes for the primary and secondary endpoints of this project illustrate that using VIONE in PACT primary care clinics had a notable impact on polypharmacy and cost avoidance over a short period. This outcome can be attributed to 2 significant effects of using the deprescribing tool. VIONE’s simplicity in application allowed clinicians to incorporate daily use of the tool with minimal effort. Education was all that was required to fully enable clinicians to work together successfully and exercise collaborative practice to promote deprescribing. VIONE also elicited a cascade of favorable effects that improve patient safety and health outcomes. The tool aided in identification of PIM, which helped reduce polypharmacy and medication burden. The risk for DDIs and ADEs may decrease; therefore, the incidence of falls, need for emergency department visits or inpatient care related to polypharmacy may decline. Less complex medication regimens may alleviate issues with adherence and avoid the various consequences of polypharmacy in theory. Simplified regimens can potentially improve disease management and quality of life for patients. Further studies are needed to substantiate deprescribing and its true effect on patient adherence and better health outcomes at this time.10
Reducing polypharmacy can lead to cost savings. Based on the results of this 3-month study, we expect that VASNHS would save more than $84,000 by reducing polypharmacy among its patients. Those savings can be funneled back into the health care system, and allotted to necessary patient care, prescriptions, and health care facility needs.
Limitations
There are some important limitations to this study. Definitions of polypharmacy may vary from one health care facility to another. The cutoffs for polypharmacy may differ, causing the prevalence of polypharmacy and potential costs savings to vary. Use of VIONE may be inconsistent among users if not previously educated or properly trained. For instance, VIONE selections are listed in the same menu as the standard CPRS discontinuation options, which may lead to discontinuation of medical supplies or laboratory orders instead of prescriptions.
The method of data analysis and project design used in this study may have been subject to error. For example, the list of PCPs may have been inaccurate or outdated, which would result in an over- or underrepresentation of those who contributed to data collection. Furthermore, there is some volatility in calculating the total cost avoidance. For example, medications for chronic conditions that were only taken on an as needed basis may have overestimated savings. Either under- or overestimations could occur when parameters are adjusted on the VIONE discontinuation dashboard without appropriate guidance. With the ability to manually adjust the dashboard parameters, dissimilarities in calculations may follow.
Conclusions
The VIONE tool may be useful in improving patient safety through deprescribing and discontinuing PIM. Decreasing the number of medications being taken concomitantly by a patient and continuing only those that are imperative in their medical treatment is the first step to reducing the incidence of polypharmacy. Consequently, chances of ADEs or DDIs are lessened, especially among older individuals who are considered high risk for experiencing the detrimental effects that may ensue. These effects include geriatric-related syndromes, increased risk of fall, hospital visits or admissions, or death. Use of VIONE easily promotes collaboration among clinicians to evaluate medications eligible for discontinuation more regularly. If this deprescribing tool is continuously used, costs avoided can likely be maximized within VA health care systems.
The results of this project should serve as an incentive to push for better prescribing practices and increase deprescribing efforts. It should provoke the need for change in regimens and the subsequent discontinuation of prescriptions that are not considered vital to continue. Finally, the result of this project should substantiate the positive impact a deprescribing tool can possess to avert the issues commonly associated with polypharmacy.
1. Centers for Disease Control and Prevention, National Center for Health Statistics. Health, United States, 2013: with special feature on prescription drugs. Published May 2014. Accessed May 13, 2021. https://www.cdc.gov/nchs/data/hus/hus13.pdf
2. Masnoon N, Shakib S, Kalisch-Ellett L, Caughey GE. What is polypharmacy? A systematic review of definitions. BMC Geriatr. 2017;17(1):230. Published 2017 Oct 10. doi:10.1186/s12877-017-0621-2
3. Parulekar MS, Rogers CK. Polypharmacy and mobility. In: Cifu DX, Lew HL, Oh-Park M., eds Geriatric Rehabilitation. Elsevier; 2018. doi:10.1016/B978-0-323-54454-2.12001-1
4. Rieckert A, Trampisch US, Klaaßen-Mielke R, et al. Polypharmacy in older patients with chronic diseases: a cross-sectional analysis of factors associated with excessive polypharmacy. BMC Fam Pract. 2018;19(1):113. Published 2018 Jul 18. doi:10.1186/s12875-018-0795-5
5. Thompson CA. New medication review method cuts veterans’ Rx load, saves millions. Am J Health Syst Pharm. 2018;75(8):502-503. doi:10.2146/news180023
6. Reeve E. Deprescribing tools: a review of the types of tools available to aid deprescribing in clinical practice. J Pharm Pract Res. 2020;50(1):98-107. doi:10.1002/jppr.1626
7. Fried TR, Niehoff KM, Street RL, et al. Effect of the Tool to Reduce Inappropriate Medications on Medication Communication and Deprescribing. J Am Geriatr Soc. 2017;65(10):2265-2271. doi:10.1111/jgs.15042
8. Battar S, Dickerson KR, Sedgwick C, et al. Understanding principles of high reliability organizations through the eyes of VIONE, a clinical program to improve patient safety by deprescribing potentially inappropriate medications and reducing polypharmacy. Fed Pract. 2019;36(12):564-568.
9. Battar S, Cmelik T, Dickerson K, Scott, M. Experience better health with VIONE a safe medication deprescribing tool [Nonpublic source, not verified]
10. Ulley J, Harrop D, Ali A, et al. Desprescribing interventions and their impact on medication adherence in community-dwelling older adults with polypharmacy: a systematic review. BMC Geriatr. 2019;19(15):1-13.
1. Centers for Disease Control and Prevention, National Center for Health Statistics. Health, United States, 2013: with special feature on prescription drugs. Published May 2014. Accessed May 13, 2021. https://www.cdc.gov/nchs/data/hus/hus13.pdf
2. Masnoon N, Shakib S, Kalisch-Ellett L, Caughey GE. What is polypharmacy? A systematic review of definitions. BMC Geriatr. 2017;17(1):230. Published 2017 Oct 10. doi:10.1186/s12877-017-0621-2
3. Parulekar MS, Rogers CK. Polypharmacy and mobility. In: Cifu DX, Lew HL, Oh-Park M., eds Geriatric Rehabilitation. Elsevier; 2018. doi:10.1016/B978-0-323-54454-2.12001-1
4. Rieckert A, Trampisch US, Klaaßen-Mielke R, et al. Polypharmacy in older patients with chronic diseases: a cross-sectional analysis of factors associated with excessive polypharmacy. BMC Fam Pract. 2018;19(1):113. Published 2018 Jul 18. doi:10.1186/s12875-018-0795-5
5. Thompson CA. New medication review method cuts veterans’ Rx load, saves millions. Am J Health Syst Pharm. 2018;75(8):502-503. doi:10.2146/news180023
6. Reeve E. Deprescribing tools: a review of the types of tools available to aid deprescribing in clinical practice. J Pharm Pract Res. 2020;50(1):98-107. doi:10.1002/jppr.1626
7. Fried TR, Niehoff KM, Street RL, et al. Effect of the Tool to Reduce Inappropriate Medications on Medication Communication and Deprescribing. J Am Geriatr Soc. 2017;65(10):2265-2271. doi:10.1111/jgs.15042
8. Battar S, Dickerson KR, Sedgwick C, et al. Understanding principles of high reliability organizations through the eyes of VIONE, a clinical program to improve patient safety by deprescribing potentially inappropriate medications and reducing polypharmacy. Fed Pract. 2019;36(12):564-568.
9. Battar S, Cmelik T, Dickerson K, Scott, M. Experience better health with VIONE a safe medication deprescribing tool [Nonpublic source, not verified]
10. Ulley J, Harrop D, Ali A, et al. Desprescribing interventions and their impact on medication adherence in community-dwelling older adults with polypharmacy: a systematic review. BMC Geriatr. 2019;19(15):1-13.
Can overweight docs really give credible weight loss advice?
Kevin Gendreau, MD, a weight loss doctor at Southcoast Health in Fall River, Maine, lets patients know that he was once obese. He says this knowledge inspires and motivates them to lose weight.
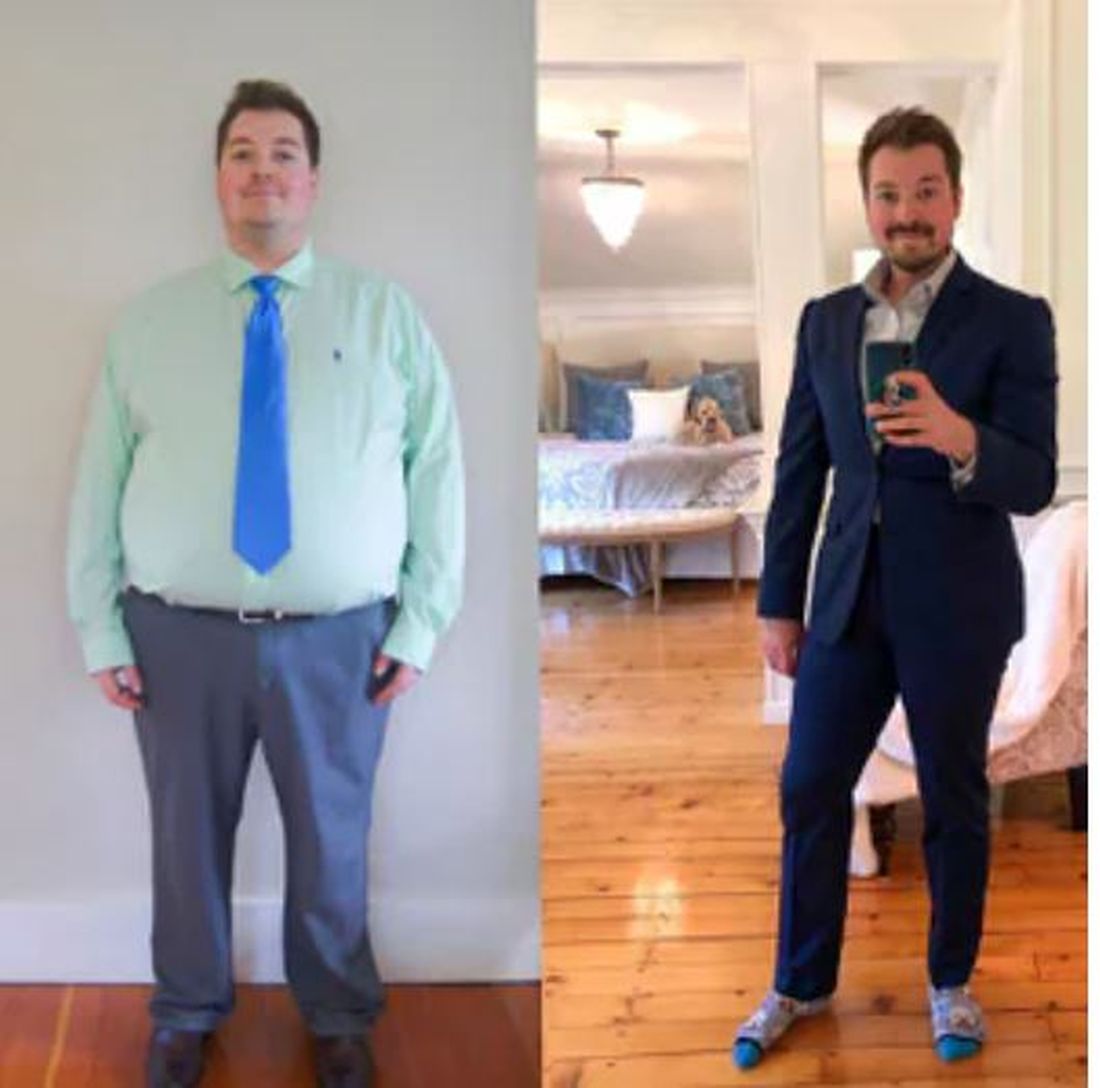
After dropping 125 pounds over 18 months, “I can relate to their binges, hardships, and plateaus on a very personal level,” he says.
Peminda Cabandugama, MD, an endocrinologist and obesity medicine specialist at Truman Medical Center at the University of Missouri-Kansas City, has weighed between 180 and 240 pounds in the past decade. He now weighs 225 pounds and has a healthy lifestyle.
“I have had patients come to me saying, ‘I used to see a different weight loss doctor who was not heavy. But how can he understand what I’m going through?’” he says.
Dr. Cabandugama shares his weight loss struggles with patients “to dispel this myth that weight management is as simple as just eating too much and not exercising. It involves a smorgasbord of emotions and hormones, some within and outside of our control. I hope that sharing this allows me to connect more with my patients so that they know that even their health care professional goes through the same challenges that they do.”
“Patients are more likely to make behavior changes when doctors are supportive and have had similar experiences and talk about their stories,” says Wendy Bennett, MD, an obesity researcher and associate professor of medicine at Johns Hopkins University in Baltimore.
Do patients respect overweight doctors?
While Dr. Gendreau and Dr. Cabandugama have lost weight,
Doctors sometimes have biased attitudes toward overweight patients, but few studies have looked at whether patients have biases towards overweight doctors. The results vary and may depend on whether or not the patients are overweight.
A random online survey of 358 participants suggested that regardless of their own weight, people had biases about doctor weight gain. They viewed the overweight or obese doctors as less trustworthy and credible, which could lead the participants to reject their medical advice and change doctors.
“Patients expect doctors who are providing health care to be doing everything they can to take care of their own health and well-being,” says Pamela Peeke, MD, an assistant clinical professor of medicine at the University of Maryland in Baltimore.
“I am a physician who believes you have to walk the talk — that the best teachers are those who live it,” she says.
Still, “I don’t think based on this one experimental study that we can conclude that overweight physicians are harming patients’ efforts to change their behavior,” notes Dr. Bennett, who was not involved in the study.
“I think that patients do often want to connect with their physicians on more personal levels, but without the story behind where the advice is coming from, patients may struggle to trust a provider who seems to be contradicting the messages,” she says.
A study that Dr. Bennett helped lead suggests that patients are not biased against overweight doctors if they themselves need to lose weight. A national survey of 600 overweight patients showed that 87% trusted diet advice from overweight primary care doctors, compared to 77% who trusted diet advice from doctors who had a healthy weight.
“This shows that patients were more trusting of physicians who are more like them, which can lead to better relationships. We know from the studies on race that patients are often more trusting of physicians from the same race as them,” says Dr. Bennett.
Dr. Gendreau says that when he was severely obese, some patients questioned whether to trust his weight loss advice.
“It was very awkward when they turned to me and said, ‘What about you?’ I would respond that it’s my job to inform them about the risks to their health,” he says.
Nearly half (48%) of doctors said they are trying to lose weight, according to the 2021 Medscape Physician Lifestyle and Happiness Report. As a result, many doctors may end up in the position of seemingly advising to “do what I say, not what I do.”
Nearly three in five Americans are trying to lose weight, according to Gelesis poll results released in December 2020.
Should doctors pay more attention to wellness?
Doctors have an ethical duty to maintain their own health and wellness so they can provide safe and effective medical care. If they don’t have a healthy lifestyle, they need to make adjustments, the American Medical Association Code of Ethics advises.
Dr. Peeke agrees with the AMA. “We signed on to do this — we have to go out of our way to carve out time, even if it’s just 15 minutes where we hide away and eat that healthy lunch that we brought with us,” she says.
Dr. Gendreau suggests busy doctors do what he did.
“I started by bringing healthy snacks — small Ziploc bags filled with mixed nuts and berries — and expanded from there. This way, if I got hungry or stressed between patients, I would have easy access to something nutritious,” he says.
He and Dr. Peeke also suggest making protein shakes or berry smoothies that are low in sugar.
“These can keep you full for hours as you sip them between patients,” says Dr. Gendreau.
Convincing busy doctors to make lifestyle changes may be challenging. Sixty-five percent of those who responded to the Physician Lifestyle and Happiness Report say that they sometimes, rarely, or never focus on their health and wellness. Only 45% said they are eating healthy, and 65% said they exercise.
“Self-care isn’t a priority for most physicians because we are taught to take care of others and to put them first,” says Dr. Gendreau. “Like many doctors, I had so many other priorities — family, friends, career. Also, my last year of medical school was so difficult that my priority was finishing. I pushed my health to the side and told myself that I could fix this later.”
Only about one in five medical schools require students to take a nutrition course, according to David Eisenberg, MD, an adjunct associate professor of nutrition at the Harvard T.H. Chan School of Public Health, Boston.
“I didn’t get one ounce of nutrition training, which is the reason I became a Pew Foundation scholar in nutrition and metabolism. I had to go outside of my traditional training,” says Dr. Peeke.
“Physicians are not adequately trained to do the behavioral counseling and motivational interviewing that is needed,” says Dr. Bennett. “We do a good job of diagnosing obesity based on body mass index and understanding the relationship with future health conditions. But most doctors struggle with both a lack of time and the skill set to make significant behavior changes.”
“Medical school curriculum is focused so heavily on the pathology and pathophysiology of obesity, rather than how to prevent it with the appropriate diet and exercise regimen,” Dr. Gendreau says. “My physician patients often tell me that their own education in the field of nutrition is lacking, which can affect their weight loss journey and what they teach their patients.”
Dr. Gendreau, crediting his own weight loss journey as well as his obesity medicine fellowship, says his confidence in discussing weight loss with patients has soared.
Reframing obesity as a chronic disease
Rather than criticizing overweight people, including doctors, for their personal health choices, a better approach is to think of weight or obesity as a chronic illness, says Dr. Bennett.
“If we understand that obesity is a chronic health condition that people are struggling with, we can empathize with them,” she says, recommending that more providers share their weight loss journeys with patients they give lifestyle advice to, which may help address and repair potential biases.
A version of this article first appeared on WebMD.com.
Kevin Gendreau, MD, a weight loss doctor at Southcoast Health in Fall River, Maine, lets patients know that he was once obese. He says this knowledge inspires and motivates them to lose weight.
After dropping 125 pounds over 18 months, “I can relate to their binges, hardships, and plateaus on a very personal level,” he says.
Peminda Cabandugama, MD, an endocrinologist and obesity medicine specialist at Truman Medical Center at the University of Missouri-Kansas City, has weighed between 180 and 240 pounds in the past decade. He now weighs 225 pounds and has a healthy lifestyle.
“I have had patients come to me saying, ‘I used to see a different weight loss doctor who was not heavy. But how can he understand what I’m going through?’” he says.
Dr. Cabandugama shares his weight loss struggles with patients “to dispel this myth that weight management is as simple as just eating too much and not exercising. It involves a smorgasbord of emotions and hormones, some within and outside of our control. I hope that sharing this allows me to connect more with my patients so that they know that even their health care professional goes through the same challenges that they do.”
“Patients are more likely to make behavior changes when doctors are supportive and have had similar experiences and talk about their stories,” says Wendy Bennett, MD, an obesity researcher and associate professor of medicine at Johns Hopkins University in Baltimore.
Do patients respect overweight doctors?
While Dr. Gendreau and Dr. Cabandugama have lost weight,
Doctors sometimes have biased attitudes toward overweight patients, but few studies have looked at whether patients have biases towards overweight doctors. The results vary and may depend on whether or not the patients are overweight.
A random online survey of 358 participants suggested that regardless of their own weight, people had biases about doctor weight gain. They viewed the overweight or obese doctors as less trustworthy and credible, which could lead the participants to reject their medical advice and change doctors.
“Patients expect doctors who are providing health care to be doing everything they can to take care of their own health and well-being,” says Pamela Peeke, MD, an assistant clinical professor of medicine at the University of Maryland in Baltimore.
“I am a physician who believes you have to walk the talk — that the best teachers are those who live it,” she says.
Still, “I don’t think based on this one experimental study that we can conclude that overweight physicians are harming patients’ efforts to change their behavior,” notes Dr. Bennett, who was not involved in the study.
“I think that patients do often want to connect with their physicians on more personal levels, but without the story behind where the advice is coming from, patients may struggle to trust a provider who seems to be contradicting the messages,” she says.
A study that Dr. Bennett helped lead suggests that patients are not biased against overweight doctors if they themselves need to lose weight. A national survey of 600 overweight patients showed that 87% trusted diet advice from overweight primary care doctors, compared to 77% who trusted diet advice from doctors who had a healthy weight.
“This shows that patients were more trusting of physicians who are more like them, which can lead to better relationships. We know from the studies on race that patients are often more trusting of physicians from the same race as them,” says Dr. Bennett.
Dr. Gendreau says that when he was severely obese, some patients questioned whether to trust his weight loss advice.
“It was very awkward when they turned to me and said, ‘What about you?’ I would respond that it’s my job to inform them about the risks to their health,” he says.
Nearly half (48%) of doctors said they are trying to lose weight, according to the 2021 Medscape Physician Lifestyle and Happiness Report. As a result, many doctors may end up in the position of seemingly advising to “do what I say, not what I do.”
Nearly three in five Americans are trying to lose weight, according to Gelesis poll results released in December 2020.
Should doctors pay more attention to wellness?
Doctors have an ethical duty to maintain their own health and wellness so they can provide safe and effective medical care. If they don’t have a healthy lifestyle, they need to make adjustments, the American Medical Association Code of Ethics advises.
Dr. Peeke agrees with the AMA. “We signed on to do this — we have to go out of our way to carve out time, even if it’s just 15 minutes where we hide away and eat that healthy lunch that we brought with us,” she says.
Dr. Gendreau suggests busy doctors do what he did.
“I started by bringing healthy snacks — small Ziploc bags filled with mixed nuts and berries — and expanded from there. This way, if I got hungry or stressed between patients, I would have easy access to something nutritious,” he says.
He and Dr. Peeke also suggest making protein shakes or berry smoothies that are low in sugar.
“These can keep you full for hours as you sip them between patients,” says Dr. Gendreau.
Convincing busy doctors to make lifestyle changes may be challenging. Sixty-five percent of those who responded to the Physician Lifestyle and Happiness Report say that they sometimes, rarely, or never focus on their health and wellness. Only 45% said they are eating healthy, and 65% said they exercise.
“Self-care isn’t a priority for most physicians because we are taught to take care of others and to put them first,” says Dr. Gendreau. “Like many doctors, I had so many other priorities — family, friends, career. Also, my last year of medical school was so difficult that my priority was finishing. I pushed my health to the side and told myself that I could fix this later.”
Only about one in five medical schools require students to take a nutrition course, according to David Eisenberg, MD, an adjunct associate professor of nutrition at the Harvard T.H. Chan School of Public Health, Boston.
“I didn’t get one ounce of nutrition training, which is the reason I became a Pew Foundation scholar in nutrition and metabolism. I had to go outside of my traditional training,” says Dr. Peeke.
“Physicians are not adequately trained to do the behavioral counseling and motivational interviewing that is needed,” says Dr. Bennett. “We do a good job of diagnosing obesity based on body mass index and understanding the relationship with future health conditions. But most doctors struggle with both a lack of time and the skill set to make significant behavior changes.”
“Medical school curriculum is focused so heavily on the pathology and pathophysiology of obesity, rather than how to prevent it with the appropriate diet and exercise regimen,” Dr. Gendreau says. “My physician patients often tell me that their own education in the field of nutrition is lacking, which can affect their weight loss journey and what they teach their patients.”
Dr. Gendreau, crediting his own weight loss journey as well as his obesity medicine fellowship, says his confidence in discussing weight loss with patients has soared.
Reframing obesity as a chronic disease
Rather than criticizing overweight people, including doctors, for their personal health choices, a better approach is to think of weight or obesity as a chronic illness, says Dr. Bennett.
“If we understand that obesity is a chronic health condition that people are struggling with, we can empathize with them,” she says, recommending that more providers share their weight loss journeys with patients they give lifestyle advice to, which may help address and repair potential biases.
A version of this article first appeared on WebMD.com.
Kevin Gendreau, MD, a weight loss doctor at Southcoast Health in Fall River, Maine, lets patients know that he was once obese. He says this knowledge inspires and motivates them to lose weight.
After dropping 125 pounds over 18 months, “I can relate to their binges, hardships, and plateaus on a very personal level,” he says.
Peminda Cabandugama, MD, an endocrinologist and obesity medicine specialist at Truman Medical Center at the University of Missouri-Kansas City, has weighed between 180 and 240 pounds in the past decade. He now weighs 225 pounds and has a healthy lifestyle.
“I have had patients come to me saying, ‘I used to see a different weight loss doctor who was not heavy. But how can he understand what I’m going through?’” he says.
Dr. Cabandugama shares his weight loss struggles with patients “to dispel this myth that weight management is as simple as just eating too much and not exercising. It involves a smorgasbord of emotions and hormones, some within and outside of our control. I hope that sharing this allows me to connect more with my patients so that they know that even their health care professional goes through the same challenges that they do.”
“Patients are more likely to make behavior changes when doctors are supportive and have had similar experiences and talk about their stories,” says Wendy Bennett, MD, an obesity researcher and associate professor of medicine at Johns Hopkins University in Baltimore.
Do patients respect overweight doctors?
While Dr. Gendreau and Dr. Cabandugama have lost weight,
Doctors sometimes have biased attitudes toward overweight patients, but few studies have looked at whether patients have biases towards overweight doctors. The results vary and may depend on whether or not the patients are overweight.
A random online survey of 358 participants suggested that regardless of their own weight, people had biases about doctor weight gain. They viewed the overweight or obese doctors as less trustworthy and credible, which could lead the participants to reject their medical advice and change doctors.
“Patients expect doctors who are providing health care to be doing everything they can to take care of their own health and well-being,” says Pamela Peeke, MD, an assistant clinical professor of medicine at the University of Maryland in Baltimore.
“I am a physician who believes you have to walk the talk — that the best teachers are those who live it,” she says.
Still, “I don’t think based on this one experimental study that we can conclude that overweight physicians are harming patients’ efforts to change their behavior,” notes Dr. Bennett, who was not involved in the study.
“I think that patients do often want to connect with their physicians on more personal levels, but without the story behind where the advice is coming from, patients may struggle to trust a provider who seems to be contradicting the messages,” she says.
A study that Dr. Bennett helped lead suggests that patients are not biased against overweight doctors if they themselves need to lose weight. A national survey of 600 overweight patients showed that 87% trusted diet advice from overweight primary care doctors, compared to 77% who trusted diet advice from doctors who had a healthy weight.
“This shows that patients were more trusting of physicians who are more like them, which can lead to better relationships. We know from the studies on race that patients are often more trusting of physicians from the same race as them,” says Dr. Bennett.
Dr. Gendreau says that when he was severely obese, some patients questioned whether to trust his weight loss advice.
“It was very awkward when they turned to me and said, ‘What about you?’ I would respond that it’s my job to inform them about the risks to their health,” he says.
Nearly half (48%) of doctors said they are trying to lose weight, according to the 2021 Medscape Physician Lifestyle and Happiness Report. As a result, many doctors may end up in the position of seemingly advising to “do what I say, not what I do.”
Nearly three in five Americans are trying to lose weight, according to Gelesis poll results released in December 2020.
Should doctors pay more attention to wellness?
Doctors have an ethical duty to maintain their own health and wellness so they can provide safe and effective medical care. If they don’t have a healthy lifestyle, they need to make adjustments, the American Medical Association Code of Ethics advises.
Dr. Peeke agrees with the AMA. “We signed on to do this — we have to go out of our way to carve out time, even if it’s just 15 minutes where we hide away and eat that healthy lunch that we brought with us,” she says.
Dr. Gendreau suggests busy doctors do what he did.
“I started by bringing healthy snacks — small Ziploc bags filled with mixed nuts and berries — and expanded from there. This way, if I got hungry or stressed between patients, I would have easy access to something nutritious,” he says.
He and Dr. Peeke also suggest making protein shakes or berry smoothies that are low in sugar.
“These can keep you full for hours as you sip them between patients,” says Dr. Gendreau.
Convincing busy doctors to make lifestyle changes may be challenging. Sixty-five percent of those who responded to the Physician Lifestyle and Happiness Report say that they sometimes, rarely, or never focus on their health and wellness. Only 45% said they are eating healthy, and 65% said they exercise.
“Self-care isn’t a priority for most physicians because we are taught to take care of others and to put them first,” says Dr. Gendreau. “Like many doctors, I had so many other priorities — family, friends, career. Also, my last year of medical school was so difficult that my priority was finishing. I pushed my health to the side and told myself that I could fix this later.”
Only about one in five medical schools require students to take a nutrition course, according to David Eisenberg, MD, an adjunct associate professor of nutrition at the Harvard T.H. Chan School of Public Health, Boston.
“I didn’t get one ounce of nutrition training, which is the reason I became a Pew Foundation scholar in nutrition and metabolism. I had to go outside of my traditional training,” says Dr. Peeke.
“Physicians are not adequately trained to do the behavioral counseling and motivational interviewing that is needed,” says Dr. Bennett. “We do a good job of diagnosing obesity based on body mass index and understanding the relationship with future health conditions. But most doctors struggle with both a lack of time and the skill set to make significant behavior changes.”
“Medical school curriculum is focused so heavily on the pathology and pathophysiology of obesity, rather than how to prevent it with the appropriate diet and exercise regimen,” Dr. Gendreau says. “My physician patients often tell me that their own education in the field of nutrition is lacking, which can affect their weight loss journey and what they teach their patients.”
Dr. Gendreau, crediting his own weight loss journey as well as his obesity medicine fellowship, says his confidence in discussing weight loss with patients has soared.
Reframing obesity as a chronic disease
Rather than criticizing overweight people, including doctors, for their personal health choices, a better approach is to think of weight or obesity as a chronic illness, says Dr. Bennett.
“If we understand that obesity is a chronic health condition that people are struggling with, we can empathize with them,” she says, recommending that more providers share their weight loss journeys with patients they give lifestyle advice to, which may help address and repair potential biases.
A version of this article first appeared on WebMD.com.
OSA in women: Different symptoms, risks and consequences
The reported prevalence and severity of obstructive sleep apnea in women is lower, compared with men, but the consequences of the disease are “at least the same, if not worse,” with women appearing to have greater susceptibility to adverse OSA-related cardiovascular consequences – particularly as it pertains to endothelial dysfunction, Reena Mehra, MD, MS, said at the virtual annual meeting of the Associated Professional Sleep Societies.
Women more so than men have endothelial dysfunction associated with OSA, “suggesting there is an enhanced sensitivity of the female vascular endothelium to intermittent hypoxia,” said Dr. Mehra, director of sleep disorders research at the Cleveland Clinic and professor of medicine at Case Western Reserve University, also in Cleveland.
Sex-specific differences in the anatomic and physiological characteristics of the upper airway, in fat distribution and in respiratory stability as they relate to OSA have been documented for some time – and today, these and other differences relating to the diagnosis, treatment, and consequences of sleep apnea continue to be studied and elucidated, said Dr. Mehra, Anita Rajagopal, MD, and Chitra Lal, MD, in a session on OSA in women. Each spoke about the breath and implications of these differences, and of increasing recognition of the significance of OSA in women.
Likely underdiagnosis
Epidemiologic studies have suggested a three- to fivefold higher prevalence of OSA in men than in women in the general population. But it has also been estimated that 17%-25% of women have sleep apnea, and the prevalence reported in various studies has generally increased with time, said Dr. Rajagopal, department medical director for sleep medicine at Community Physician Network in Indianapolis, and medical director of the Community Health Network Sleep/Wake Disorders Center, also in Indianapolis.
One population-based study in Sweden, reported in 2013, found OSA (defined as an apnea-hypopnea index [AHI] ≥5) in 50% of women aged 20-70, she noted.
It’s quite possible women are being misdiagnosed or underdiagnosed because of their reporting of different symptoms, Dr. Rajagopal said. The Epworth Sleepiness Scale, commonly used to screen for OSA, has not been validated for use in women and has not been strongly associated with daytime sleepiness in women in population-based studies, she said, noting that women who report similar levels of daytime sleepiness to men are less likely to have an ESS score greater than 10.
“We shouldn’t rule out obstructive sleep apnea in women with a low ESS,” Dr. Rajagopal said in an interview after the meeting. Attentiveness to the symptoms more often reported by women – generalized daytime fatigue/lack of energy, insomnia, morning headaches, mood disturbances, and nightmares – is important, as is performance of overnight polysomnography when a home sleep study is negative and there is clinical suspicion of OSA.Respiratory disturbances in women are frequently associated with arousals – which induce less ventilatory instability in women than in men – rather than oxygen desaturations, leading to underestimation of OSA on home sleep testing. Insomnia associated with OSA in women may also increase the likelihood of a false negative result, Dr. Rajagopal said at the meeting.
“It’s really important [in sleep testing] to consider your AHI values in women,” she said. “The AHI value may not provide a true indication of the degree of sleep fragmentation being experienced by patients.” That OSA symptoms manifest in women with lower AHIs has been elucidated in research showing, for instance, that those with an AHI of 2-5 per hour have a similar level of symptoms to men with an AHI of at least 15 per hour, she said.
Women tend to have a clustering of apnea during REM sleep, and it’s possible that “the long-term effects of REM disruption contribute to greater symptomatology at lower AHI values in women compared to men,” Dr. Rajagopal said.
Also at play are when it comes to testing and diagnosis are several other key sex differences, she said. For one, the upper airways in women are less collapsible and more stable during sleep (most evident during non-REM sleep), and respiratory events during sleep are less frequently associated with complete upper airway collapse.
Women also have shorter apneic episodes, but “the longest apneas are associated with a more severe oxygen desaturation,” she said. Moreover, they have more episodes of upper airway resistance during sleep, which in and of itself “has been shown to produce clinical symptoms such as daytime fatigue and clinical depression.”
In her presentation, Dr. Mehra similarly commented on a likely underdiagnosis of OSA in women. In addition to differing symptoms, including palpitations, “women are less likely to have arousals, and have a lesser degree of nocturnal hypoxia compared to men ... perhaps leading to even more of an underdiagnosis.”
Unique consequences
Differences in upper airway physiology and other sex-specific differences impacting OSA susceptibility are at least partly attributable to sex hormones, said Dr. Mehra and Dr. Lal, associate professor of medicine at the Medical University of South Carolina, Charleston.
A significant increase in prevalence is seen after menopause, and research has shown that each additional year in menopause is associated with a greater AHI – a “dose-response effect,” Dr. Lal said. An inverse association between hormone replacement therapy and OSA severity has been seen in epidemiological studies including the Sleep Heart Health Study, Dr. Mehra said. But in prospective studies, Dr. Lal noted, hormone replacement therapy has not been shown to decrease AHI.
Experimental and clinical studies suggest that the vascular endothelium is influenced by sex hormones, Dr. Mehra said. Estrogen is known to improve endothelial function by inducing increased nitric oxide bioavailability – important in the setting of hypoxemia, which leads to reduced bioavailability of nitric oxide. “Alterations of sex-specific hormones in OSA may represent a key factor in increasing vulnerability to vascular dysfunction,” Dr. Mehra added.
The Sleep Heart Health Study also documented sex-specific differences, showing a graded increase of troponin with increasing OSA severity category as well as an increase in left ventricular mass thickness, and a 30% increased risk of heart failure or death in women with moderate/severe OSA, compared with women without OSA or with mild OSA, Dr. Mehra said. These findings were not observed in men.
The dominance of REM-related OSA in women raises risk because sleep disturbances during REM sleep are associated with adverse cardiometabolic outcomes including prevalent and incident hypertension, Dr. Mehra noted. “REM-related OSA may also adversely impact glucose metabolism,” she said, “even in the absence of non-REM obstructive sleep apnea.”
Regarding OSA treatment and responsivity, Dr. Mehra said that preliminary, post hoc data from a randomized, controlled trial of the impact of continuous positive airway pressure (CPAP) therapy on cardiovascular biomarkers showed a sex-specific effect. “There were differences in men versus women in terms of responsiveness with regards to biomarkers of inflammation and oxidative stress ... with reductions from CPAP observed in women but not in men,” said Dr. Mehra, a co-investigator of the study.
The data suggests, she said that “these biomarkers may be more responsive to treatment and a reversal of sleep apnea pathophysiology in women.”
Women also appear to respond better than men to upper airway nerve stimulation (UAS), she said, referring to an international registry study showing a 3.6-fold higher odds of responsiveness to the therapy relative to men. Women in the study were 60% less likely to be approved by insurance for UAS, however, making it “a public policy issue, said Dr. Mehra, a coinvestigator.
Dr. Rajagopal, Dr. Mehra, and Dr. Lal all reported that they had no potential conflicts of interest.
The reported prevalence and severity of obstructive sleep apnea in women is lower, compared with men, but the consequences of the disease are “at least the same, if not worse,” with women appearing to have greater susceptibility to adverse OSA-related cardiovascular consequences – particularly as it pertains to endothelial dysfunction, Reena Mehra, MD, MS, said at the virtual annual meeting of the Associated Professional Sleep Societies.
Women more so than men have endothelial dysfunction associated with OSA, “suggesting there is an enhanced sensitivity of the female vascular endothelium to intermittent hypoxia,” said Dr. Mehra, director of sleep disorders research at the Cleveland Clinic and professor of medicine at Case Western Reserve University, also in Cleveland.
Sex-specific differences in the anatomic and physiological characteristics of the upper airway, in fat distribution and in respiratory stability as they relate to OSA have been documented for some time – and today, these and other differences relating to the diagnosis, treatment, and consequences of sleep apnea continue to be studied and elucidated, said Dr. Mehra, Anita Rajagopal, MD, and Chitra Lal, MD, in a session on OSA in women. Each spoke about the breath and implications of these differences, and of increasing recognition of the significance of OSA in women.
Likely underdiagnosis
Epidemiologic studies have suggested a three- to fivefold higher prevalence of OSA in men than in women in the general population. But it has also been estimated that 17%-25% of women have sleep apnea, and the prevalence reported in various studies has generally increased with time, said Dr. Rajagopal, department medical director for sleep medicine at Community Physician Network in Indianapolis, and medical director of the Community Health Network Sleep/Wake Disorders Center, also in Indianapolis.
One population-based study in Sweden, reported in 2013, found OSA (defined as an apnea-hypopnea index [AHI] ≥5) in 50% of women aged 20-70, she noted.
It’s quite possible women are being misdiagnosed or underdiagnosed because of their reporting of different symptoms, Dr. Rajagopal said. The Epworth Sleepiness Scale, commonly used to screen for OSA, has not been validated for use in women and has not been strongly associated with daytime sleepiness in women in population-based studies, she said, noting that women who report similar levels of daytime sleepiness to men are less likely to have an ESS score greater than 10.
“We shouldn’t rule out obstructive sleep apnea in women with a low ESS,” Dr. Rajagopal said in an interview after the meeting. Attentiveness to the symptoms more often reported by women – generalized daytime fatigue/lack of energy, insomnia, morning headaches, mood disturbances, and nightmares – is important, as is performance of overnight polysomnography when a home sleep study is negative and there is clinical suspicion of OSA.Respiratory disturbances in women are frequently associated with arousals – which induce less ventilatory instability in women than in men – rather than oxygen desaturations, leading to underestimation of OSA on home sleep testing. Insomnia associated with OSA in women may also increase the likelihood of a false negative result, Dr. Rajagopal said at the meeting.
“It’s really important [in sleep testing] to consider your AHI values in women,” she said. “The AHI value may not provide a true indication of the degree of sleep fragmentation being experienced by patients.” That OSA symptoms manifest in women with lower AHIs has been elucidated in research showing, for instance, that those with an AHI of 2-5 per hour have a similar level of symptoms to men with an AHI of at least 15 per hour, she said.
Women tend to have a clustering of apnea during REM sleep, and it’s possible that “the long-term effects of REM disruption contribute to greater symptomatology at lower AHI values in women compared to men,” Dr. Rajagopal said.
Also at play are when it comes to testing and diagnosis are several other key sex differences, she said. For one, the upper airways in women are less collapsible and more stable during sleep (most evident during non-REM sleep), and respiratory events during sleep are less frequently associated with complete upper airway collapse.
Women also have shorter apneic episodes, but “the longest apneas are associated with a more severe oxygen desaturation,” she said. Moreover, they have more episodes of upper airway resistance during sleep, which in and of itself “has been shown to produce clinical symptoms such as daytime fatigue and clinical depression.”
In her presentation, Dr. Mehra similarly commented on a likely underdiagnosis of OSA in women. In addition to differing symptoms, including palpitations, “women are less likely to have arousals, and have a lesser degree of nocturnal hypoxia compared to men ... perhaps leading to even more of an underdiagnosis.”
Unique consequences
Differences in upper airway physiology and other sex-specific differences impacting OSA susceptibility are at least partly attributable to sex hormones, said Dr. Mehra and Dr. Lal, associate professor of medicine at the Medical University of South Carolina, Charleston.
A significant increase in prevalence is seen after menopause, and research has shown that each additional year in menopause is associated with a greater AHI – a “dose-response effect,” Dr. Lal said. An inverse association between hormone replacement therapy and OSA severity has been seen in epidemiological studies including the Sleep Heart Health Study, Dr. Mehra said. But in prospective studies, Dr. Lal noted, hormone replacement therapy has not been shown to decrease AHI.
Experimental and clinical studies suggest that the vascular endothelium is influenced by sex hormones, Dr. Mehra said. Estrogen is known to improve endothelial function by inducing increased nitric oxide bioavailability – important in the setting of hypoxemia, which leads to reduced bioavailability of nitric oxide. “Alterations of sex-specific hormones in OSA may represent a key factor in increasing vulnerability to vascular dysfunction,” Dr. Mehra added.
The Sleep Heart Health Study also documented sex-specific differences, showing a graded increase of troponin with increasing OSA severity category as well as an increase in left ventricular mass thickness, and a 30% increased risk of heart failure or death in women with moderate/severe OSA, compared with women without OSA or with mild OSA, Dr. Mehra said. These findings were not observed in men.
The dominance of REM-related OSA in women raises risk because sleep disturbances during REM sleep are associated with adverse cardiometabolic outcomes including prevalent and incident hypertension, Dr. Mehra noted. “REM-related OSA may also adversely impact glucose metabolism,” she said, “even in the absence of non-REM obstructive sleep apnea.”
Regarding OSA treatment and responsivity, Dr. Mehra said that preliminary, post hoc data from a randomized, controlled trial of the impact of continuous positive airway pressure (CPAP) therapy on cardiovascular biomarkers showed a sex-specific effect. “There were differences in men versus women in terms of responsiveness with regards to biomarkers of inflammation and oxidative stress ... with reductions from CPAP observed in women but not in men,” said Dr. Mehra, a co-investigator of the study.
The data suggests, she said that “these biomarkers may be more responsive to treatment and a reversal of sleep apnea pathophysiology in women.”
Women also appear to respond better than men to upper airway nerve stimulation (UAS), she said, referring to an international registry study showing a 3.6-fold higher odds of responsiveness to the therapy relative to men. Women in the study were 60% less likely to be approved by insurance for UAS, however, making it “a public policy issue, said Dr. Mehra, a coinvestigator.
Dr. Rajagopal, Dr. Mehra, and Dr. Lal all reported that they had no potential conflicts of interest.
The reported prevalence and severity of obstructive sleep apnea in women is lower, compared with men, but the consequences of the disease are “at least the same, if not worse,” with women appearing to have greater susceptibility to adverse OSA-related cardiovascular consequences – particularly as it pertains to endothelial dysfunction, Reena Mehra, MD, MS, said at the virtual annual meeting of the Associated Professional Sleep Societies.
Women more so than men have endothelial dysfunction associated with OSA, “suggesting there is an enhanced sensitivity of the female vascular endothelium to intermittent hypoxia,” said Dr. Mehra, director of sleep disorders research at the Cleveland Clinic and professor of medicine at Case Western Reserve University, also in Cleveland.
Sex-specific differences in the anatomic and physiological characteristics of the upper airway, in fat distribution and in respiratory stability as they relate to OSA have been documented for some time – and today, these and other differences relating to the diagnosis, treatment, and consequences of sleep apnea continue to be studied and elucidated, said Dr. Mehra, Anita Rajagopal, MD, and Chitra Lal, MD, in a session on OSA in women. Each spoke about the breath and implications of these differences, and of increasing recognition of the significance of OSA in women.
Likely underdiagnosis
Epidemiologic studies have suggested a three- to fivefold higher prevalence of OSA in men than in women in the general population. But it has also been estimated that 17%-25% of women have sleep apnea, and the prevalence reported in various studies has generally increased with time, said Dr. Rajagopal, department medical director for sleep medicine at Community Physician Network in Indianapolis, and medical director of the Community Health Network Sleep/Wake Disorders Center, also in Indianapolis.
One population-based study in Sweden, reported in 2013, found OSA (defined as an apnea-hypopnea index [AHI] ≥5) in 50% of women aged 20-70, she noted.
It’s quite possible women are being misdiagnosed or underdiagnosed because of their reporting of different symptoms, Dr. Rajagopal said. The Epworth Sleepiness Scale, commonly used to screen for OSA, has not been validated for use in women and has not been strongly associated with daytime sleepiness in women in population-based studies, she said, noting that women who report similar levels of daytime sleepiness to men are less likely to have an ESS score greater than 10.
“We shouldn’t rule out obstructive sleep apnea in women with a low ESS,” Dr. Rajagopal said in an interview after the meeting. Attentiveness to the symptoms more often reported by women – generalized daytime fatigue/lack of energy, insomnia, morning headaches, mood disturbances, and nightmares – is important, as is performance of overnight polysomnography when a home sleep study is negative and there is clinical suspicion of OSA.Respiratory disturbances in women are frequently associated with arousals – which induce less ventilatory instability in women than in men – rather than oxygen desaturations, leading to underestimation of OSA on home sleep testing. Insomnia associated with OSA in women may also increase the likelihood of a false negative result, Dr. Rajagopal said at the meeting.
“It’s really important [in sleep testing] to consider your AHI values in women,” she said. “The AHI value may not provide a true indication of the degree of sleep fragmentation being experienced by patients.” That OSA symptoms manifest in women with lower AHIs has been elucidated in research showing, for instance, that those with an AHI of 2-5 per hour have a similar level of symptoms to men with an AHI of at least 15 per hour, she said.
Women tend to have a clustering of apnea during REM sleep, and it’s possible that “the long-term effects of REM disruption contribute to greater symptomatology at lower AHI values in women compared to men,” Dr. Rajagopal said.
Also at play are when it comes to testing and diagnosis are several other key sex differences, she said. For one, the upper airways in women are less collapsible and more stable during sleep (most evident during non-REM sleep), and respiratory events during sleep are less frequently associated with complete upper airway collapse.
Women also have shorter apneic episodes, but “the longest apneas are associated with a more severe oxygen desaturation,” she said. Moreover, they have more episodes of upper airway resistance during sleep, which in and of itself “has been shown to produce clinical symptoms such as daytime fatigue and clinical depression.”
In her presentation, Dr. Mehra similarly commented on a likely underdiagnosis of OSA in women. In addition to differing symptoms, including palpitations, “women are less likely to have arousals, and have a lesser degree of nocturnal hypoxia compared to men ... perhaps leading to even more of an underdiagnosis.”
Unique consequences
Differences in upper airway physiology and other sex-specific differences impacting OSA susceptibility are at least partly attributable to sex hormones, said Dr. Mehra and Dr. Lal, associate professor of medicine at the Medical University of South Carolina, Charleston.
A significant increase in prevalence is seen after menopause, and research has shown that each additional year in menopause is associated with a greater AHI – a “dose-response effect,” Dr. Lal said. An inverse association between hormone replacement therapy and OSA severity has been seen in epidemiological studies including the Sleep Heart Health Study, Dr. Mehra said. But in prospective studies, Dr. Lal noted, hormone replacement therapy has not been shown to decrease AHI.
Experimental and clinical studies suggest that the vascular endothelium is influenced by sex hormones, Dr. Mehra said. Estrogen is known to improve endothelial function by inducing increased nitric oxide bioavailability – important in the setting of hypoxemia, which leads to reduced bioavailability of nitric oxide. “Alterations of sex-specific hormones in OSA may represent a key factor in increasing vulnerability to vascular dysfunction,” Dr. Mehra added.
The Sleep Heart Health Study also documented sex-specific differences, showing a graded increase of troponin with increasing OSA severity category as well as an increase in left ventricular mass thickness, and a 30% increased risk of heart failure or death in women with moderate/severe OSA, compared with women without OSA or with mild OSA, Dr. Mehra said. These findings were not observed in men.
The dominance of REM-related OSA in women raises risk because sleep disturbances during REM sleep are associated with adverse cardiometabolic outcomes including prevalent and incident hypertension, Dr. Mehra noted. “REM-related OSA may also adversely impact glucose metabolism,” she said, “even in the absence of non-REM obstructive sleep apnea.”
Regarding OSA treatment and responsivity, Dr. Mehra said that preliminary, post hoc data from a randomized, controlled trial of the impact of continuous positive airway pressure (CPAP) therapy on cardiovascular biomarkers showed a sex-specific effect. “There were differences in men versus women in terms of responsiveness with regards to biomarkers of inflammation and oxidative stress ... with reductions from CPAP observed in women but not in men,” said Dr. Mehra, a co-investigator of the study.
The data suggests, she said that “these biomarkers may be more responsive to treatment and a reversal of sleep apnea pathophysiology in women.”
Women also appear to respond better than men to upper airway nerve stimulation (UAS), she said, referring to an international registry study showing a 3.6-fold higher odds of responsiveness to the therapy relative to men. Women in the study were 60% less likely to be approved by insurance for UAS, however, making it “a public policy issue, said Dr. Mehra, a coinvestigator.
Dr. Rajagopal, Dr. Mehra, and Dr. Lal all reported that they had no potential conflicts of interest.
FROM SLEEP 2021
Malpractice claims from the COVID-19 pandemic: More questions than answers
Editor’s note: This article has been provided by The Doctors Company, the exclusively endorsed medical malpractice carrier for the Society of Hospital Medicine.
The pandemic has raised pressing questions around preventive measures, vaccines, and safe treatment, but it has also obscured one key lingering uncertainty for medical professionals: Where are all the medical malpractice claims?
A variety of factors create a cloud of uncertainty around when, if ever, we will see the claims we expected from care provided just before the pandemic, much less claims deriving from care during the pandemic of both COVID-19 and non–COVID-19 patients.
Malpractice claims take time to surface
We won’t know until 2022 or later whether there will be an increase in claims related to the pandemic. When a medical error occurs, it’s not like an automobile accident. Everybody nearby knows when there’s been an automobile accident because they hear screeching tires, a loud crash, and then sirens. But when a medical error occurs, generally speaking, neither the doctor nor the patient immediately knows that something is amiss. It can take months or years for people to realize that something untoward has occurred.
Claims from medical errors that occurred before the pandemic bring additional uncertainties. In 2020, we saw fewer than expected overall claims filed from events occurring 18-24 months before the pandemic. In total, 20% fewer claims were filed than in 2019. This may have had to do with courts shutting down, people being reluctant to meet with attorneys to discuss a claim, and/or lawyers working from home. We may see these claims filed later than expected, or maybe we won’t see them at all.
But without a doubt, pandemic-related claims will be filed. The pandemic’s impact on physicians increases the risk of claims. Burnout is a major cause of medical errors, and a recent study found that out of 60 countries, U.S. health care providers showed the highest rates of burnout. We’re concerned about the stress affecting physicians’ performance – not just the physical stress of the demands put on them while treating COVID-19 patients, but all of the worry. For instance, a lot of doctors at the start of this pandemic stayed at hotels because they didn’t want to bring the virus home to their families – if they got exposed. Those sorts of stressors from life disruptions, on top of the stress of treating COVID-19 patients and the stress of treating non–COVID-19 patients within overtaxed health care systems, contribute to the possibilities for error.
Immunity protections are not fail-safe
And while health care providers have medical liability protections during the pandemic, these protections may not prevent claims. Health care provider pandemic-related liability laws vary from state to state, and they will be tested in the courts as to whether they’re constitutional. For example, there is pending legislation in New York state that would repeal the provider protections created there at the start of the pandemic. Further, some expert witnesses will couch their statements in terms of what it takes to get around one of these statutes. Therefore, physicians do have reason for concern, even in states with strong liability protections.
The following case example, which is one of about 40 COVID-19–related claims made against our members so far, is a poster child for why these protections are necessary: A quadriplegic patient with COVID-19 had reached the point of organ failure before he reached the ED. There was really nothing medical science could do for him at that point, in terms of a chance at recovery. Therefore, the patient’s physician and conservator placed him in assisted living for palliative care. This was a sad but reasonable decision during a pandemic, with hospital beds needed for patients with a shot at surviving. Following that patient’s death, the physician is being sued.
Defending claims regarding treatment vs. regarding infection control
We are very confident in our ability to protect our members against claims where they are being sued over the treatment of the disease. Claims arising out of treatment are not concerning to us because there is no cure for COVID-19 – one can only treat the symptoms as the virus runs its course.
On the other hand, suits harder to defend would be those that revolve around transmitting the disease because providers didn’t follow guidelines from the Centers for Disease Control and Prevention or there wasn’t enough personal protective equipment. That’s why we stress the importance of following CDC guidelines, and why we’ve taken proactive steps to communicate with the entire medical community throughout the pandemic as part of our commitment to serve those who provide care.
Mr. White is chief operating officer at The Doctors Company. The guidelines suggested here are not rules, do not constitute legal advice, and do not ensure a successful outcome. The ultimate decision regarding the appropriateness of any treatment must be made by each health care provider considering the circumstances of the individual situation and in accordance with the laws of the jurisdiction in which the care is rendered.
Editor’s note: This article has been provided by The Doctors Company, the exclusively endorsed medical malpractice carrier for the Society of Hospital Medicine.
The pandemic has raised pressing questions around preventive measures, vaccines, and safe treatment, but it has also obscured one key lingering uncertainty for medical professionals: Where are all the medical malpractice claims?
A variety of factors create a cloud of uncertainty around when, if ever, we will see the claims we expected from care provided just before the pandemic, much less claims deriving from care during the pandemic of both COVID-19 and non–COVID-19 patients.
Malpractice claims take time to surface
We won’t know until 2022 or later whether there will be an increase in claims related to the pandemic. When a medical error occurs, it’s not like an automobile accident. Everybody nearby knows when there’s been an automobile accident because they hear screeching tires, a loud crash, and then sirens. But when a medical error occurs, generally speaking, neither the doctor nor the patient immediately knows that something is amiss. It can take months or years for people to realize that something untoward has occurred.
Claims from medical errors that occurred before the pandemic bring additional uncertainties. In 2020, we saw fewer than expected overall claims filed from events occurring 18-24 months before the pandemic. In total, 20% fewer claims were filed than in 2019. This may have had to do with courts shutting down, people being reluctant to meet with attorneys to discuss a claim, and/or lawyers working from home. We may see these claims filed later than expected, or maybe we won’t see them at all.
But without a doubt, pandemic-related claims will be filed. The pandemic’s impact on physicians increases the risk of claims. Burnout is a major cause of medical errors, and a recent study found that out of 60 countries, U.S. health care providers showed the highest rates of burnout. We’re concerned about the stress affecting physicians’ performance – not just the physical stress of the demands put on them while treating COVID-19 patients, but all of the worry. For instance, a lot of doctors at the start of this pandemic stayed at hotels because they didn’t want to bring the virus home to their families – if they got exposed. Those sorts of stressors from life disruptions, on top of the stress of treating COVID-19 patients and the stress of treating non–COVID-19 patients within overtaxed health care systems, contribute to the possibilities for error.
Immunity protections are not fail-safe
And while health care providers have medical liability protections during the pandemic, these protections may not prevent claims. Health care provider pandemic-related liability laws vary from state to state, and they will be tested in the courts as to whether they’re constitutional. For example, there is pending legislation in New York state that would repeal the provider protections created there at the start of the pandemic. Further, some expert witnesses will couch their statements in terms of what it takes to get around one of these statutes. Therefore, physicians do have reason for concern, even in states with strong liability protections.
The following case example, which is one of about 40 COVID-19–related claims made against our members so far, is a poster child for why these protections are necessary: A quadriplegic patient with COVID-19 had reached the point of organ failure before he reached the ED. There was really nothing medical science could do for him at that point, in terms of a chance at recovery. Therefore, the patient’s physician and conservator placed him in assisted living for palliative care. This was a sad but reasonable decision during a pandemic, with hospital beds needed for patients with a shot at surviving. Following that patient’s death, the physician is being sued.
Defending claims regarding treatment vs. regarding infection control
We are very confident in our ability to protect our members against claims where they are being sued over the treatment of the disease. Claims arising out of treatment are not concerning to us because there is no cure for COVID-19 – one can only treat the symptoms as the virus runs its course.
On the other hand, suits harder to defend would be those that revolve around transmitting the disease because providers didn’t follow guidelines from the Centers for Disease Control and Prevention or there wasn’t enough personal protective equipment. That’s why we stress the importance of following CDC guidelines, and why we’ve taken proactive steps to communicate with the entire medical community throughout the pandemic as part of our commitment to serve those who provide care.
Mr. White is chief operating officer at The Doctors Company. The guidelines suggested here are not rules, do not constitute legal advice, and do not ensure a successful outcome. The ultimate decision regarding the appropriateness of any treatment must be made by each health care provider considering the circumstances of the individual situation and in accordance with the laws of the jurisdiction in which the care is rendered.
Editor’s note: This article has been provided by The Doctors Company, the exclusively endorsed medical malpractice carrier for the Society of Hospital Medicine.
The pandemic has raised pressing questions around preventive measures, vaccines, and safe treatment, but it has also obscured one key lingering uncertainty for medical professionals: Where are all the medical malpractice claims?
A variety of factors create a cloud of uncertainty around when, if ever, we will see the claims we expected from care provided just before the pandemic, much less claims deriving from care during the pandemic of both COVID-19 and non–COVID-19 patients.
Malpractice claims take time to surface
We won’t know until 2022 or later whether there will be an increase in claims related to the pandemic. When a medical error occurs, it’s not like an automobile accident. Everybody nearby knows when there’s been an automobile accident because they hear screeching tires, a loud crash, and then sirens. But when a medical error occurs, generally speaking, neither the doctor nor the patient immediately knows that something is amiss. It can take months or years for people to realize that something untoward has occurred.
Claims from medical errors that occurred before the pandemic bring additional uncertainties. In 2020, we saw fewer than expected overall claims filed from events occurring 18-24 months before the pandemic. In total, 20% fewer claims were filed than in 2019. This may have had to do with courts shutting down, people being reluctant to meet with attorneys to discuss a claim, and/or lawyers working from home. We may see these claims filed later than expected, or maybe we won’t see them at all.
But without a doubt, pandemic-related claims will be filed. The pandemic’s impact on physicians increases the risk of claims. Burnout is a major cause of medical errors, and a recent study found that out of 60 countries, U.S. health care providers showed the highest rates of burnout. We’re concerned about the stress affecting physicians’ performance – not just the physical stress of the demands put on them while treating COVID-19 patients, but all of the worry. For instance, a lot of doctors at the start of this pandemic stayed at hotels because they didn’t want to bring the virus home to their families – if they got exposed. Those sorts of stressors from life disruptions, on top of the stress of treating COVID-19 patients and the stress of treating non–COVID-19 patients within overtaxed health care systems, contribute to the possibilities for error.
Immunity protections are not fail-safe
And while health care providers have medical liability protections during the pandemic, these protections may not prevent claims. Health care provider pandemic-related liability laws vary from state to state, and they will be tested in the courts as to whether they’re constitutional. For example, there is pending legislation in New York state that would repeal the provider protections created there at the start of the pandemic. Further, some expert witnesses will couch their statements in terms of what it takes to get around one of these statutes. Therefore, physicians do have reason for concern, even in states with strong liability protections.
The following case example, which is one of about 40 COVID-19–related claims made against our members so far, is a poster child for why these protections are necessary: A quadriplegic patient with COVID-19 had reached the point of organ failure before he reached the ED. There was really nothing medical science could do for him at that point, in terms of a chance at recovery. Therefore, the patient’s physician and conservator placed him in assisted living for palliative care. This was a sad but reasonable decision during a pandemic, with hospital beds needed for patients with a shot at surviving. Following that patient’s death, the physician is being sued.
Defending claims regarding treatment vs. regarding infection control
We are very confident in our ability to protect our members against claims where they are being sued over the treatment of the disease. Claims arising out of treatment are not concerning to us because there is no cure for COVID-19 – one can only treat the symptoms as the virus runs its course.
On the other hand, suits harder to defend would be those that revolve around transmitting the disease because providers didn’t follow guidelines from the Centers for Disease Control and Prevention or there wasn’t enough personal protective equipment. That’s why we stress the importance of following CDC guidelines, and why we’ve taken proactive steps to communicate with the entire medical community throughout the pandemic as part of our commitment to serve those who provide care.
Mr. White is chief operating officer at The Doctors Company. The guidelines suggested here are not rules, do not constitute legal advice, and do not ensure a successful outcome. The ultimate decision regarding the appropriateness of any treatment must be made by each health care provider considering the circumstances of the individual situation and in accordance with the laws of the jurisdiction in which the care is rendered.
Network meta-analysis ranks first-line H. pylori regimens
A network meta-analysis of current first-line dual, triple, and quadruple therapies for Helicobacter pylori infection found that vonoprazan triple therapy was most effective, while standard triple therapy of a proton pump inhibitor (PPI), amoxicillin, and clarithromycin was least effective. Levofloxacin-containing triple therapy performed best in Western countries and West Asia, while reverse hybrid therapy was most effective in East Asia.

The results “[suggest that] a new approach concerning H. pylori treatment is now needed and that the time for transitioning from trial and error to antimicrobial stewardship [of H. pylori infection] has arrived,” wrote Theodore Rokkas, PhD, MD, of the European University of Cyprus in Engomi, and colleagues. Their study was published in Gastroenterology.
H. pylori infection is the primary cause of gastritis, peptic ulcer disease, gastric mucosa–associated lymphoid tissue lymphoma, and gastric cancer.
Since H. pylori infection was first recognized, physicians have employed a range of drugs in double, triple, and quadruple combinations to combat it.
Despite those efforts, treatment success is lower than with many other infectious diseases. A newcomer is the potassium-competing acid blocker vonoprazan, which increases efficacy of amoxicillin combination therapies and has, thereby, generated renewed interest in all combination therapies, according to the study authors. Vonoprazan is currently available in some Asian countries, but not the United States or Europe.
Current guidelines for H. pylori treatment relied on randomized controlled trials and relevant pair-wise meta-analyses, but no previous pairwise analysis has included all currently available medications, the authors noted. Network meta-analyses can help fill this evidence gap: They incorporate both direct and indirect evidence from a collection of randomized controlled trials to estimate the comparative effectiveness of three or more regimens.
The researchers conducted a network meta-analysis that included 68 randomized, controlled trials totaling 22,975 patients. The following regimens were included in the analysis: Concomitant quadruple bismuth treatment (bismuth quadruple therapy), concomitant quadruple nonbismuth treatment (nonbismuth quadruple therapy), high-dose amoxicillin double treatment (Amox-dual therapy), levofloxacin-containing treatment (Levo-therapy), reverse hybrid therapy (R-hybrid therapy), sequential quadruple treatment (sequential therapy), standard triple treatment (triple therapy), and vonoprazan-containing therapy (Vono-triple therapy).
Statistically significant results were found with Vono-triple therapy versus triple therapy (odds ratio, 3.80; 95% confidence interval, 1.62-8.94), sequential therapy versus triple therapy (OR, 1.79; 95% CI, 1.26-2.53), nonbismuth quadruple therapy versus triple therapy (OR, 2.08; 95% CI, 1.45-2.98), bismuth quadruple therapy versus triple therapy (OR, 1.47; 95% CI, 1.02-2.11), and Levo-therapy versus triple therapy (OR, 1.79; 95% CI, 1.26-2.53).
In the overall data, mean cure rates greater than 90% were seen only in Vono-triple therapy (91.4%; 95% CI, 88.5-93.5%) and R-hybrid therapy (93.6%; 95% CI, 90.4-96.8%). Cure rates were lower for Nonbismuth quadruple therapy (84.3%; 95% CI, 82.7-85.8%), Levo-therapy (83.8%; 95% CI, 82.1-85.4%), Sequential therapy (83.7%; 95% CI, 82.7-84.7%), bismuth quadruple therapy (81.3%; 95% CI, 79.5-83.1%), Amox-dual therapy (80.2%; 75.3%-84.4%), and triple therapy (75.7%; 95% CI, 74.9-76.4%). Levo-therapy performed best in Western countries (88.5%; 95% CI, 86.5-90.5%) and West Asia (88.4%; 95% CI, 84.6-91.1%). R-hybrid therapy performed best in East Asia (93.6%; 95% CI, 90.4-96.8%).
A surface under the cumulative ranking (SUCRA) value, which represents the efficacy of the intervention compared to an ideal intervention, was 92.4% for Vono-triple therapy. The second highest SUCRA value was for 68.8% for nonbismuth quadruple therapy. The SUCRA value of standard triple therapy was 4.7%.
A key limitation to the study is that Vono-triple therapy was tested only in Japan, and requires additional study in other geographic regions.
The study received support from the Department of Veteran Affairs. The authors have consulted for and received research funding from various pharmaceutical companies.
A network meta-analysis of current first-line dual, triple, and quadruple therapies for Helicobacter pylori infection found that vonoprazan triple therapy was most effective, while standard triple therapy of a proton pump inhibitor (PPI), amoxicillin, and clarithromycin was least effective. Levofloxacin-containing triple therapy performed best in Western countries and West Asia, while reverse hybrid therapy was most effective in East Asia.
The results “[suggest that] a new approach concerning H. pylori treatment is now needed and that the time for transitioning from trial and error to antimicrobial stewardship [of H. pylori infection] has arrived,” wrote Theodore Rokkas, PhD, MD, of the European University of Cyprus in Engomi, and colleagues. Their study was published in Gastroenterology.
H. pylori infection is the primary cause of gastritis, peptic ulcer disease, gastric mucosa–associated lymphoid tissue lymphoma, and gastric cancer.
Since H. pylori infection was first recognized, physicians have employed a range of drugs in double, triple, and quadruple combinations to combat it.
Despite those efforts, treatment success is lower than with many other infectious diseases. A newcomer is the potassium-competing acid blocker vonoprazan, which increases efficacy of amoxicillin combination therapies and has, thereby, generated renewed interest in all combination therapies, according to the study authors. Vonoprazan is currently available in some Asian countries, but not the United States or Europe.
Current guidelines for H. pylori treatment relied on randomized controlled trials and relevant pair-wise meta-analyses, but no previous pairwise analysis has included all currently available medications, the authors noted. Network meta-analyses can help fill this evidence gap: They incorporate both direct and indirect evidence from a collection of randomized controlled trials to estimate the comparative effectiveness of three or more regimens.
The researchers conducted a network meta-analysis that included 68 randomized, controlled trials totaling 22,975 patients. The following regimens were included in the analysis: Concomitant quadruple bismuth treatment (bismuth quadruple therapy), concomitant quadruple nonbismuth treatment (nonbismuth quadruple therapy), high-dose amoxicillin double treatment (Amox-dual therapy), levofloxacin-containing treatment (Levo-therapy), reverse hybrid therapy (R-hybrid therapy), sequential quadruple treatment (sequential therapy), standard triple treatment (triple therapy), and vonoprazan-containing therapy (Vono-triple therapy).
Statistically significant results were found with Vono-triple therapy versus triple therapy (odds ratio, 3.80; 95% confidence interval, 1.62-8.94), sequential therapy versus triple therapy (OR, 1.79; 95% CI, 1.26-2.53), nonbismuth quadruple therapy versus triple therapy (OR, 2.08; 95% CI, 1.45-2.98), bismuth quadruple therapy versus triple therapy (OR, 1.47; 95% CI, 1.02-2.11), and Levo-therapy versus triple therapy (OR, 1.79; 95% CI, 1.26-2.53).
In the overall data, mean cure rates greater than 90% were seen only in Vono-triple therapy (91.4%; 95% CI, 88.5-93.5%) and R-hybrid therapy (93.6%; 95% CI, 90.4-96.8%). Cure rates were lower for Nonbismuth quadruple therapy (84.3%; 95% CI, 82.7-85.8%), Levo-therapy (83.8%; 95% CI, 82.1-85.4%), Sequential therapy (83.7%; 95% CI, 82.7-84.7%), bismuth quadruple therapy (81.3%; 95% CI, 79.5-83.1%), Amox-dual therapy (80.2%; 75.3%-84.4%), and triple therapy (75.7%; 95% CI, 74.9-76.4%). Levo-therapy performed best in Western countries (88.5%; 95% CI, 86.5-90.5%) and West Asia (88.4%; 95% CI, 84.6-91.1%). R-hybrid therapy performed best in East Asia (93.6%; 95% CI, 90.4-96.8%).
A surface under the cumulative ranking (SUCRA) value, which represents the efficacy of the intervention compared to an ideal intervention, was 92.4% for Vono-triple therapy. The second highest SUCRA value was for 68.8% for nonbismuth quadruple therapy. The SUCRA value of standard triple therapy was 4.7%.
A key limitation to the study is that Vono-triple therapy was tested only in Japan, and requires additional study in other geographic regions.
The study received support from the Department of Veteran Affairs. The authors have consulted for and received research funding from various pharmaceutical companies.
A network meta-analysis of current first-line dual, triple, and quadruple therapies for Helicobacter pylori infection found that vonoprazan triple therapy was most effective, while standard triple therapy of a proton pump inhibitor (PPI), amoxicillin, and clarithromycin was least effective. Levofloxacin-containing triple therapy performed best in Western countries and West Asia, while reverse hybrid therapy was most effective in East Asia.
The results “[suggest that] a new approach concerning H. pylori treatment is now needed and that the time for transitioning from trial and error to antimicrobial stewardship [of H. pylori infection] has arrived,” wrote Theodore Rokkas, PhD, MD, of the European University of Cyprus in Engomi, and colleagues. Their study was published in Gastroenterology.
H. pylori infection is the primary cause of gastritis, peptic ulcer disease, gastric mucosa–associated lymphoid tissue lymphoma, and gastric cancer.
Since H. pylori infection was first recognized, physicians have employed a range of drugs in double, triple, and quadruple combinations to combat it.
Despite those efforts, treatment success is lower than with many other infectious diseases. A newcomer is the potassium-competing acid blocker vonoprazan, which increases efficacy of amoxicillin combination therapies and has, thereby, generated renewed interest in all combination therapies, according to the study authors. Vonoprazan is currently available in some Asian countries, but not the United States or Europe.
Current guidelines for H. pylori treatment relied on randomized controlled trials and relevant pair-wise meta-analyses, but no previous pairwise analysis has included all currently available medications, the authors noted. Network meta-analyses can help fill this evidence gap: They incorporate both direct and indirect evidence from a collection of randomized controlled trials to estimate the comparative effectiveness of three or more regimens.
The researchers conducted a network meta-analysis that included 68 randomized, controlled trials totaling 22,975 patients. The following regimens were included in the analysis: Concomitant quadruple bismuth treatment (bismuth quadruple therapy), concomitant quadruple nonbismuth treatment (nonbismuth quadruple therapy), high-dose amoxicillin double treatment (Amox-dual therapy), levofloxacin-containing treatment (Levo-therapy), reverse hybrid therapy (R-hybrid therapy), sequential quadruple treatment (sequential therapy), standard triple treatment (triple therapy), and vonoprazan-containing therapy (Vono-triple therapy).
Statistically significant results were found with Vono-triple therapy versus triple therapy (odds ratio, 3.80; 95% confidence interval, 1.62-8.94), sequential therapy versus triple therapy (OR, 1.79; 95% CI, 1.26-2.53), nonbismuth quadruple therapy versus triple therapy (OR, 2.08; 95% CI, 1.45-2.98), bismuth quadruple therapy versus triple therapy (OR, 1.47; 95% CI, 1.02-2.11), and Levo-therapy versus triple therapy (OR, 1.79; 95% CI, 1.26-2.53).
In the overall data, mean cure rates greater than 90% were seen only in Vono-triple therapy (91.4%; 95% CI, 88.5-93.5%) and R-hybrid therapy (93.6%; 95% CI, 90.4-96.8%). Cure rates were lower for Nonbismuth quadruple therapy (84.3%; 95% CI, 82.7-85.8%), Levo-therapy (83.8%; 95% CI, 82.1-85.4%), Sequential therapy (83.7%; 95% CI, 82.7-84.7%), bismuth quadruple therapy (81.3%; 95% CI, 79.5-83.1%), Amox-dual therapy (80.2%; 75.3%-84.4%), and triple therapy (75.7%; 95% CI, 74.9-76.4%). Levo-therapy performed best in Western countries (88.5%; 95% CI, 86.5-90.5%) and West Asia (88.4%; 95% CI, 84.6-91.1%). R-hybrid therapy performed best in East Asia (93.6%; 95% CI, 90.4-96.8%).
A surface under the cumulative ranking (SUCRA) value, which represents the efficacy of the intervention compared to an ideal intervention, was 92.4% for Vono-triple therapy. The second highest SUCRA value was for 68.8% for nonbismuth quadruple therapy. The SUCRA value of standard triple therapy was 4.7%.
A key limitation to the study is that Vono-triple therapy was tested only in Japan, and requires additional study in other geographic regions.
The study received support from the Department of Veteran Affairs. The authors have consulted for and received research funding from various pharmaceutical companies.
FROM GASTROENTEROLOGY
Limited English proficiency linked with less health care in U.S.
Jessica Himmelstein, MD, a Harvard research fellow and primary care physician at Cambridge Health Alliance in Cambridge, Mass., led a study of more than 120,000 adults published July 6, 2021. The study population included 17,776 Hispanic adults with limited English proficiency, 14,936 Hispanic adults proficient in English and 87,834 non-Hispanic, English-proficient adults.
Researchers compared several measures of care usage from information in the Agency for Healthcare Research and Quality’s Medical Expenditure Panel Survey from 1998 to 2018.
They found that, in adjusted analyses, total use of care per capita from 2014-2018, measured by health care expenditures, was $1,463 lower (98% confidence interval, $1,030-$1,897), or 35% lower for primary-Spanish speakers than for Hispanic adults who were English proficient and $2,802 lower (98% CI, $2,356-$3,247), or 42% lower versus non-Hispanic adults who were English proficient.
Spanish speakers also had 36% fewer outpatient visits and 48% fewer prescription medications than non-Hispanic adults, and 35% fewer outpatient visits and 37% fewer prescription medications than English-proficient Hispanic adults.
Even when accounting for differences in health, age, sex, income and insurance, adults with language barriers fared worse.
Gaps span all types of care
The services that those with limited English skills are missing are “the types of care people need to lead a healthy life,” from routine visits and medications to urgent or emergency care, Dr. Himmelstein said in an interview.
She said the gaps were greater in outpatient care and in medication use, compared with emergency department visits and inpatient care, but the inequities were present in all the categories she and her coinvestigators studied.
Underlying causes for having less care may include that people who struggle with English may not feel comfortable accessing the health system or may feel unwelcome or discriminated against.
“An undercurrent of biases, including racism, could also be contributing,” she said.
The data show that, despite several federal policy changes aimed at promoting language services in hospitals and clinics, several language-based disparities have not improved over 2 decades.
Some of the changes have included an executive order in 2000 requiring interpreters to be available in federally funded health facilities. In 2010, the Affordable Care Act enhanced the definition of meaningful access to language services and setting standards for qualified interpreters.
Gap widened over 2 decades
The adjusted gap in annual health care expenditures per capita between adults with limited English skills and non-Hispanic, English-proficient adults widened by $1,596 (98% CI, $837-$2,356) between 1999-2000 and 2017-2018, after accounting for inflation.
Dr. Himmelstein said that though this study period predated COVID-19, its findings may help explain the disproportionate burden the pandemic placed on the Hispanic population.
“This is a community that traditionally wasn’t getting access to care and then suddenly something like COVID-19 comes and they were even more devastated,” she noted.
Telehealth, which proved an important way to access care during the pandemic, also added a degree of communication difficulty for those with fewer English skills, she said.
Many of the telehealth changes are here to stay, and it will be important to ask: “Are we ensuring equity in telehealth use for individuals who face language barriers?” Dr. Himmelstein said.

Olga Garcia-Bedoya, MD, an associate professor at University of Illinois at Chicago’s department of medicine and medical director of UIC’s Institute for Minority Health Research, said having access to interpreters with high accuracy is key to narrowing the gaps.
“The literature is very clear that access to professional medical interpreters is associated with decreased health disparities for patients with limited English proficiency,” she said.
More cultural training for clinicians is needed surrounding beliefs about illness and that some care may be declined not because of a person’s limited English proficiency, but because their beliefs may keep them from getting care, Dr. Garcia-Bedoya added. When it comes to getting a flu shot, for example, sometimes belief systems, rather than English proficiency, keep people from accessing care.
What can be done?
Addressing barriers caused by lack of English proficiency will likely take change in policies, including one related reimbursement for medical interpreters, Dr. Himmelstein said.
Currently, only 15 states’ Medicaid programs or Children’s Health Insurance Programs reimburse providers for language services, the paper notes, and neither Medicare nor private insurers routinely pay for those services.
Recruiting bilingual providers and staff at health care facilities and in medical and nursing schools will also be important to narrow the gaps, Dr. Himmelstein said.
Strengthening standards for interpreters also will help. “Currently such standards vary by state or by institution and are not necessarily enforced,” she explained.
It will also be important to make sure patients know that they are entitled by law to care, free of discriminatory practices and to have certain language services including qualified interpreters, Dr. Himmelstein said.
Dr. Garcia-Bedoya said changes need to come from health systems working in combination with clinicians, providing resources so that quality interpreters can be accessed and making sure that equipment supports clear communication in telehealth. Patients’ language preferences should also be noted as soon as they make the appointment.
The findings of the study may have large significance as one in seven people in the United States speak Spanish at home, and 25 million people in the United States have limited English proficiency, the authors noted.
Dr. Himmelstein receives funding support from an Institutional National Research Service Award. Dr. Garcia-Bedoya reports no relevant financial relationships.
Jessica Himmelstein, MD, a Harvard research fellow and primary care physician at Cambridge Health Alliance in Cambridge, Mass., led a study of more than 120,000 adults published July 6, 2021. The study population included 17,776 Hispanic adults with limited English proficiency, 14,936 Hispanic adults proficient in English and 87,834 non-Hispanic, English-proficient adults.
Researchers compared several measures of care usage from information in the Agency for Healthcare Research and Quality’s Medical Expenditure Panel Survey from 1998 to 2018.
They found that, in adjusted analyses, total use of care per capita from 2014-2018, measured by health care expenditures, was $1,463 lower (98% confidence interval, $1,030-$1,897), or 35% lower for primary-Spanish speakers than for Hispanic adults who were English proficient and $2,802 lower (98% CI, $2,356-$3,247), or 42% lower versus non-Hispanic adults who were English proficient.
Spanish speakers also had 36% fewer outpatient visits and 48% fewer prescription medications than non-Hispanic adults, and 35% fewer outpatient visits and 37% fewer prescription medications than English-proficient Hispanic adults.
Even when accounting for differences in health, age, sex, income and insurance, adults with language barriers fared worse.
Gaps span all types of care
The services that those with limited English skills are missing are “the types of care people need to lead a healthy life,” from routine visits and medications to urgent or emergency care, Dr. Himmelstein said in an interview.
She said the gaps were greater in outpatient care and in medication use, compared with emergency department visits and inpatient care, but the inequities were present in all the categories she and her coinvestigators studied.
Underlying causes for having less care may include that people who struggle with English may not feel comfortable accessing the health system or may feel unwelcome or discriminated against.
“An undercurrent of biases, including racism, could also be contributing,” she said.
The data show that, despite several federal policy changes aimed at promoting language services in hospitals and clinics, several language-based disparities have not improved over 2 decades.
Some of the changes have included an executive order in 2000 requiring interpreters to be available in federally funded health facilities. In 2010, the Affordable Care Act enhanced the definition of meaningful access to language services and setting standards for qualified interpreters.
Gap widened over 2 decades
The adjusted gap in annual health care expenditures per capita between adults with limited English skills and non-Hispanic, English-proficient adults widened by $1,596 (98% CI, $837-$2,356) between 1999-2000 and 2017-2018, after accounting for inflation.
Dr. Himmelstein said that though this study period predated COVID-19, its findings may help explain the disproportionate burden the pandemic placed on the Hispanic population.
“This is a community that traditionally wasn’t getting access to care and then suddenly something like COVID-19 comes and they were even more devastated,” she noted.
Telehealth, which proved an important way to access care during the pandemic, also added a degree of communication difficulty for those with fewer English skills, she said.
Many of the telehealth changes are here to stay, and it will be important to ask: “Are we ensuring equity in telehealth use for individuals who face language barriers?” Dr. Himmelstein said.
Olga Garcia-Bedoya, MD, an associate professor at University of Illinois at Chicago’s department of medicine and medical director of UIC’s Institute for Minority Health Research, said having access to interpreters with high accuracy is key to narrowing the gaps.
“The literature is very clear that access to professional medical interpreters is associated with decreased health disparities for patients with limited English proficiency,” she said.
More cultural training for clinicians is needed surrounding beliefs about illness and that some care may be declined not because of a person’s limited English proficiency, but because their beliefs may keep them from getting care, Dr. Garcia-Bedoya added. When it comes to getting a flu shot, for example, sometimes belief systems, rather than English proficiency, keep people from accessing care.
What can be done?
Addressing barriers caused by lack of English proficiency will likely take change in policies, including one related reimbursement for medical interpreters, Dr. Himmelstein said.
Currently, only 15 states’ Medicaid programs or Children’s Health Insurance Programs reimburse providers for language services, the paper notes, and neither Medicare nor private insurers routinely pay for those services.
Recruiting bilingual providers and staff at health care facilities and in medical and nursing schools will also be important to narrow the gaps, Dr. Himmelstein said.
Strengthening standards for interpreters also will help. “Currently such standards vary by state or by institution and are not necessarily enforced,” she explained.
It will also be important to make sure patients know that they are entitled by law to care, free of discriminatory practices and to have certain language services including qualified interpreters, Dr. Himmelstein said.
Dr. Garcia-Bedoya said changes need to come from health systems working in combination with clinicians, providing resources so that quality interpreters can be accessed and making sure that equipment supports clear communication in telehealth. Patients’ language preferences should also be noted as soon as they make the appointment.
The findings of the study may have large significance as one in seven people in the United States speak Spanish at home, and 25 million people in the United States have limited English proficiency, the authors noted.
Dr. Himmelstein receives funding support from an Institutional National Research Service Award. Dr. Garcia-Bedoya reports no relevant financial relationships.
Jessica Himmelstein, MD, a Harvard research fellow and primary care physician at Cambridge Health Alliance in Cambridge, Mass., led a study of more than 120,000 adults published July 6, 2021. The study population included 17,776 Hispanic adults with limited English proficiency, 14,936 Hispanic adults proficient in English and 87,834 non-Hispanic, English-proficient adults.
Researchers compared several measures of care usage from information in the Agency for Healthcare Research and Quality’s Medical Expenditure Panel Survey from 1998 to 2018.
They found that, in adjusted analyses, total use of care per capita from 2014-2018, measured by health care expenditures, was $1,463 lower (98% confidence interval, $1,030-$1,897), or 35% lower for primary-Spanish speakers than for Hispanic adults who were English proficient and $2,802 lower (98% CI, $2,356-$3,247), or 42% lower versus non-Hispanic adults who were English proficient.
Spanish speakers also had 36% fewer outpatient visits and 48% fewer prescription medications than non-Hispanic adults, and 35% fewer outpatient visits and 37% fewer prescription medications than English-proficient Hispanic adults.
Even when accounting for differences in health, age, sex, income and insurance, adults with language barriers fared worse.
Gaps span all types of care
The services that those with limited English skills are missing are “the types of care people need to lead a healthy life,” from routine visits and medications to urgent or emergency care, Dr. Himmelstein said in an interview.
She said the gaps were greater in outpatient care and in medication use, compared with emergency department visits and inpatient care, but the inequities were present in all the categories she and her coinvestigators studied.
Underlying causes for having less care may include that people who struggle with English may not feel comfortable accessing the health system or may feel unwelcome or discriminated against.
“An undercurrent of biases, including racism, could also be contributing,” she said.
The data show that, despite several federal policy changes aimed at promoting language services in hospitals and clinics, several language-based disparities have not improved over 2 decades.
Some of the changes have included an executive order in 2000 requiring interpreters to be available in federally funded health facilities. In 2010, the Affordable Care Act enhanced the definition of meaningful access to language services and setting standards for qualified interpreters.
Gap widened over 2 decades
The adjusted gap in annual health care expenditures per capita between adults with limited English skills and non-Hispanic, English-proficient adults widened by $1,596 (98% CI, $837-$2,356) between 1999-2000 and 2017-2018, after accounting for inflation.
Dr. Himmelstein said that though this study period predated COVID-19, its findings may help explain the disproportionate burden the pandemic placed on the Hispanic population.
“This is a community that traditionally wasn’t getting access to care and then suddenly something like COVID-19 comes and they were even more devastated,” she noted.
Telehealth, which proved an important way to access care during the pandemic, also added a degree of communication difficulty for those with fewer English skills, she said.
Many of the telehealth changes are here to stay, and it will be important to ask: “Are we ensuring equity in telehealth use for individuals who face language barriers?” Dr. Himmelstein said.
Olga Garcia-Bedoya, MD, an associate professor at University of Illinois at Chicago’s department of medicine and medical director of UIC’s Institute for Minority Health Research, said having access to interpreters with high accuracy is key to narrowing the gaps.
“The literature is very clear that access to professional medical interpreters is associated with decreased health disparities for patients with limited English proficiency,” she said.
More cultural training for clinicians is needed surrounding beliefs about illness and that some care may be declined not because of a person’s limited English proficiency, but because their beliefs may keep them from getting care, Dr. Garcia-Bedoya added. When it comes to getting a flu shot, for example, sometimes belief systems, rather than English proficiency, keep people from accessing care.
What can be done?
Addressing barriers caused by lack of English proficiency will likely take change in policies, including one related reimbursement for medical interpreters, Dr. Himmelstein said.
Currently, only 15 states’ Medicaid programs or Children’s Health Insurance Programs reimburse providers for language services, the paper notes, and neither Medicare nor private insurers routinely pay for those services.
Recruiting bilingual providers and staff at health care facilities and in medical and nursing schools will also be important to narrow the gaps, Dr. Himmelstein said.
Strengthening standards for interpreters also will help. “Currently such standards vary by state or by institution and are not necessarily enforced,” she explained.
It will also be important to make sure patients know that they are entitled by law to care, free of discriminatory practices and to have certain language services including qualified interpreters, Dr. Himmelstein said.
Dr. Garcia-Bedoya said changes need to come from health systems working in combination with clinicians, providing resources so that quality interpreters can be accessed and making sure that equipment supports clear communication in telehealth. Patients’ language preferences should also be noted as soon as they make the appointment.
The findings of the study may have large significance as one in seven people in the United States speak Spanish at home, and 25 million people in the United States have limited English proficiency, the authors noted.
Dr. Himmelstein receives funding support from an Institutional National Research Service Award. Dr. Garcia-Bedoya reports no relevant financial relationships.
FROM HEALTH AFFAIRS
Married docs remove girl’s lethal facial tumor in ‘excruciatingly difficult’ procedure
In 2019, doctors in London saw a 5-year old girl from rural Ethiopia with an enormous tumor extending from her cheek to her lower jaw. Her name was Negalem and the tumor was a vascular malformation, a life-threatening web of tangled blood vessels.
Surgery to remove it was impossible, the doctors told the foundation advocating for the girl. The child would never make it off the operating table. After a closer examination, the London group still declined to do the procedure, but told the child’s parents and advocates that if anyone was going to attempt this, they’d need to get the little girl to New York.
In New York City, on 64th St. in Manhattan, is the Vascular Birthmark Institute, founded by Milton Waner, MD, who has exclusively treated hemangiomas and vascular malformations for the last 30 years. “I’m the only person in the [United] States whose practice is exclusively [treating] vascular anomalies,” Dr. Waner said in an interview.
Dr. Waner has assembled a multidisciplinary team of experts at the institute’s offices in Lenox Hill – including his wife Teresa O, MD, a facial plastic and reconstructive surgeon and neurospecialist. “People often ask how the hell do you spend so much time with your spouse?” Dr. Waner says. “We work extremely well together. We complement each other.”
Dr. O and Dr. Waner each manage half of the cases at VBI. And in January they received an email about Negalem. After corresponding with the child’s advocate and reviewing images,
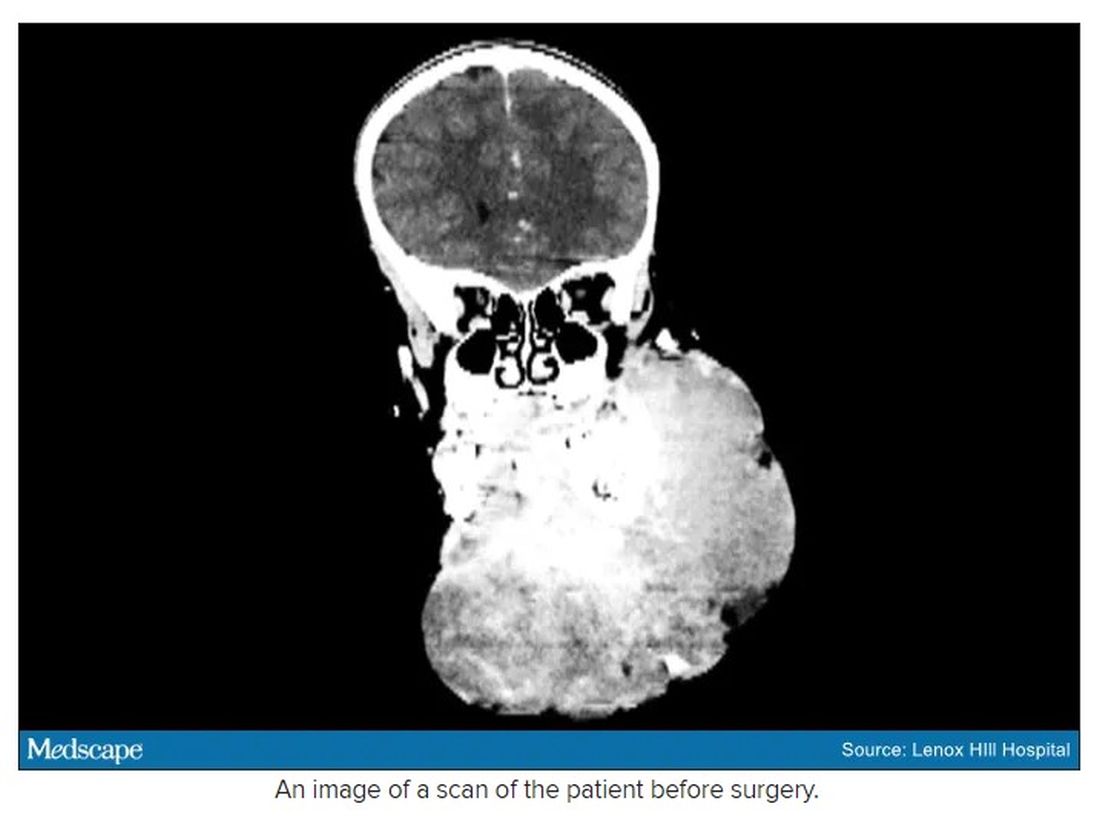
The challenge with vascular malformations in children, Dr. Waner said, is that they have a fraction of the blood an adult has. Where adults have an average of 5 L of blood, a child this age has only 1 L. To lose 200 or 300 mL of blood, “that’s 20% or 30% of their blood volume,” Dr. Waner said. So the removal of such a mass, which requires a meticulous dissection around many blood vessels, carries a high risk of the child bleeding out.
There were some logistical hurdles, but the patient arrived in Manhattan in mid-June, at no cost to her family. The medical visa was organized by a volunteer who also work for USAID. Healing the Children Northeast paid for her travel and the Waner Kids Foundation paid for her hotel stay. Lenox Hill Hospital and Northwell Health covered all hospital costs and postsurgery care. And Dr. O and Dr. Waner did the planning, consult visits, and procedure pro bono.
The surgery was possible because of the generosity of several organizations, but the two surgeons still had a limited time to remove the mass. Under different circumstances, and with the luxury of more time, the patient would have undergone several rounds of sclerotherapy. This procedure, done by interventional radiologists, involves injecting a toxin into the blood vessels, which causes them to clot. Done prior to surgery it can help limit bleeding risk.
On June 23, the morning of the surgery, the patient underwent one round of sclerotherapy. However, it didn’t have the intended effect, Dr. Waner said, “because the lesion was just so massive.”
The team had planned several of their moves ahead of time. But this isn’t the sort of surgery you’d find in a textbook. Because it’s such a unique field, Dr. Waner and Dr. O have developed many of their own techniques along the way. This patient was much like the cases they treat every day, only “several orders of magnitudes greater,” Dr. Waner said. “On a scale of 1 to 10 she was a 12.”
The morning of the surgery, “I was very apprehensive,” Dr. Waner recalled. He vividly remembers the girl’s father repeatedly kissing her to say goodbye as she lay on the operating table, fully aware that this procedure was a life-threatening one. And from the beginning there were challenges, like getting her under anesthesia when the anatomy of her mouth, deformed by the tumor, didn’t allow the anesthesiologists to use their typical tubing. Then, once the skin was removed, it became clear how dilated and tangled the involved blood vessels were. There were many vital structures tangled in the anomaly. “The jugular vein was right there. The carotid artery was right there,” Dr. Waner said. It was extremely difficult to delineate and preserve them, he said.
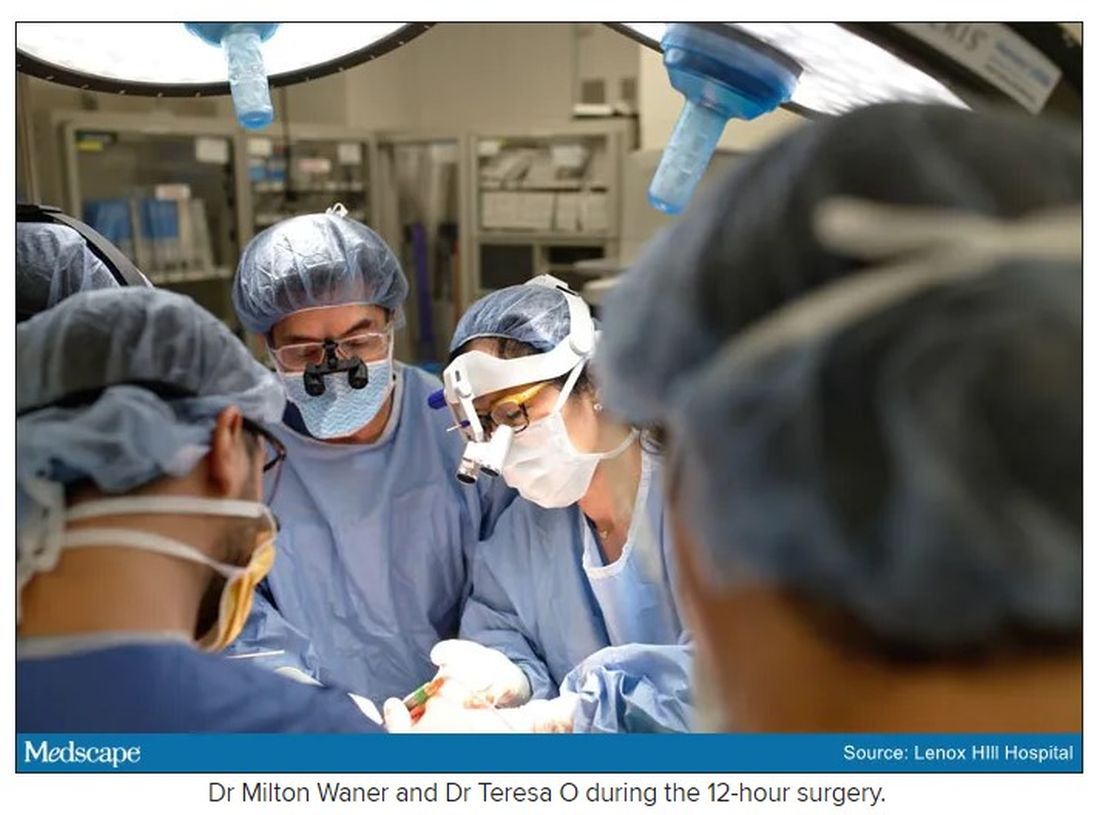
“That’s why we really took our time. We just went very slowly and deliberately,” Dr. O said. The blood vessels were so dilated that their only option was to move painstakingly slow – otherwise a small nick could be devastating.
But even with the slow pace the surgery was “excruciatingly difficult,” Dr. Waner said. And early on in the dissection he wasn’t quite sure they’d make it out. The sclerotherapy hadn’t done much to prevent bleeding. “At one point every millimeter or 2 that we advanced we got into some bleeding,” Dr. Waner said. “Brisk bleeding.”
Once they got into the surgery they also realized that the growth had adhered to the jaw bone. “There were vessels traversing into the bone, which were hard to control,” Dr. O said.
But finally, both doctors realized they’d be able to remove it. With the lesion removed they began the work of reconstruction and reanimation.
The child’s jaw and cheek bone had grown beyond their normal size to support the growth. They had to shave them down to achieve facial symmetry. The tumor had also inhibited much of the child’s facial nerve control. With it gone, Dr. O began the work of finding all the facial nerve branches and assembling them to reanimate the child’s face.
Before medicine, Dr. O trained as an architect, which, according to Dr. Waner, has equipped her with very good spatial awareness – a valuable skill in the surgical reconstruction phase. After seeing a lecture by Dr. Waner, she immediately saw a fit for her unique interest and skill set. She did fellowship training with Dr. Waner in vascular anomalies, and then went on to specialize in facial nerve reanimation. The proof of Dr. O’s expertise is Negalem’s new, beautiful smile, Dr. Waner said.
The surgery drew out over 8 hours, as long as a day of surgeries for the two doctors. When Dr. O finally walked into the waiting room to inform the family of the success, the first words out of the father’s mouth were: “Is my daughter alive?”
A growth like Negalem had is not compatible with a normal life. Dr. Waner’s mantra is that every child has the right to look normal. But this case went beyond aesthetics. If the growth hadn’t been removed, the child was expected to live only 4-6 more years, Dr. Waner said. Without the surgery, she could have suffocated, starved without the ability to swallow, or suffered a fatal bleed.
Dr. O and Dr. Waner are uniquely equipped to do this kind of work, but both are adamant that treating vascular anomalies is a multidisciplinary, multimodal approach. Specialties in anesthesiology, radiology, lasers, facial nerves – they are all critical to these procedures. And often patients with these kinds of lesions require medical and radiologic interventions in addition to surgery. In this particular case, from logistics to post op, “it was a lot of teamwork,” Dr. O said, “a lot of international teams coming together.”
Though extremely difficult, “in the end the result was exactly what we wanted,” Dr. Waner said. Negalem can live a normal life. And as for the surgical duo, both feel very fortunate to do this work. Dr. O said, “I’m honored to have found this specialty and to be able to train with and work with Milton. I’m so happy to do what I do every day.”
A version of this article first appeared on Medscape.com.
In 2019, doctors in London saw a 5-year old girl from rural Ethiopia with an enormous tumor extending from her cheek to her lower jaw. Her name was Negalem and the tumor was a vascular malformation, a life-threatening web of tangled blood vessels.
Surgery to remove it was impossible, the doctors told the foundation advocating for the girl. The child would never make it off the operating table. After a closer examination, the London group still declined to do the procedure, but told the child’s parents and advocates that if anyone was going to attempt this, they’d need to get the little girl to New York.
In New York City, on 64th St. in Manhattan, is the Vascular Birthmark Institute, founded by Milton Waner, MD, who has exclusively treated hemangiomas and vascular malformations for the last 30 years. “I’m the only person in the [United] States whose practice is exclusively [treating] vascular anomalies,” Dr. Waner said in an interview.
Dr. Waner has assembled a multidisciplinary team of experts at the institute’s offices in Lenox Hill – including his wife Teresa O, MD, a facial plastic and reconstructive surgeon and neurospecialist. “People often ask how the hell do you spend so much time with your spouse?” Dr. Waner says. “We work extremely well together. We complement each other.”
Dr. O and Dr. Waner each manage half of the cases at VBI. And in January they received an email about Negalem. After corresponding with the child’s advocate and reviewing images,
The challenge with vascular malformations in children, Dr. Waner said, is that they have a fraction of the blood an adult has. Where adults have an average of 5 L of blood, a child this age has only 1 L. To lose 200 or 300 mL of blood, “that’s 20% or 30% of their blood volume,” Dr. Waner said. So the removal of such a mass, which requires a meticulous dissection around many blood vessels, carries a high risk of the child bleeding out.
There were some logistical hurdles, but the patient arrived in Manhattan in mid-June, at no cost to her family. The medical visa was organized by a volunteer who also work for USAID. Healing the Children Northeast paid for her travel and the Waner Kids Foundation paid for her hotel stay. Lenox Hill Hospital and Northwell Health covered all hospital costs and postsurgery care. And Dr. O and Dr. Waner did the planning, consult visits, and procedure pro bono.
The surgery was possible because of the generosity of several organizations, but the two surgeons still had a limited time to remove the mass. Under different circumstances, and with the luxury of more time, the patient would have undergone several rounds of sclerotherapy. This procedure, done by interventional radiologists, involves injecting a toxin into the blood vessels, which causes them to clot. Done prior to surgery it can help limit bleeding risk.
On June 23, the morning of the surgery, the patient underwent one round of sclerotherapy. However, it didn’t have the intended effect, Dr. Waner said, “because the lesion was just so massive.”
The team had planned several of their moves ahead of time. But this isn’t the sort of surgery you’d find in a textbook. Because it’s such a unique field, Dr. Waner and Dr. O have developed many of their own techniques along the way. This patient was much like the cases they treat every day, only “several orders of magnitudes greater,” Dr. Waner said. “On a scale of 1 to 10 she was a 12.”
The morning of the surgery, “I was very apprehensive,” Dr. Waner recalled. He vividly remembers the girl’s father repeatedly kissing her to say goodbye as she lay on the operating table, fully aware that this procedure was a life-threatening one. And from the beginning there were challenges, like getting her under anesthesia when the anatomy of her mouth, deformed by the tumor, didn’t allow the anesthesiologists to use their typical tubing. Then, once the skin was removed, it became clear how dilated and tangled the involved blood vessels were. There were many vital structures tangled in the anomaly. “The jugular vein was right there. The carotid artery was right there,” Dr. Waner said. It was extremely difficult to delineate and preserve them, he said.
“That’s why we really took our time. We just went very slowly and deliberately,” Dr. O said. The blood vessels were so dilated that their only option was to move painstakingly slow – otherwise a small nick could be devastating.
But even with the slow pace the surgery was “excruciatingly difficult,” Dr. Waner said. And early on in the dissection he wasn’t quite sure they’d make it out. The sclerotherapy hadn’t done much to prevent bleeding. “At one point every millimeter or 2 that we advanced we got into some bleeding,” Dr. Waner said. “Brisk bleeding.”
Once they got into the surgery they also realized that the growth had adhered to the jaw bone. “There were vessels traversing into the bone, which were hard to control,” Dr. O said.
But finally, both doctors realized they’d be able to remove it. With the lesion removed they began the work of reconstruction and reanimation.
The child’s jaw and cheek bone had grown beyond their normal size to support the growth. They had to shave them down to achieve facial symmetry. The tumor had also inhibited much of the child’s facial nerve control. With it gone, Dr. O began the work of finding all the facial nerve branches and assembling them to reanimate the child’s face.
Before medicine, Dr. O trained as an architect, which, according to Dr. Waner, has equipped her with very good spatial awareness – a valuable skill in the surgical reconstruction phase. After seeing a lecture by Dr. Waner, she immediately saw a fit for her unique interest and skill set. She did fellowship training with Dr. Waner in vascular anomalies, and then went on to specialize in facial nerve reanimation. The proof of Dr. O’s expertise is Negalem’s new, beautiful smile, Dr. Waner said.
The surgery drew out over 8 hours, as long as a day of surgeries for the two doctors. When Dr. O finally walked into the waiting room to inform the family of the success, the first words out of the father’s mouth were: “Is my daughter alive?”
A growth like Negalem had is not compatible with a normal life. Dr. Waner’s mantra is that every child has the right to look normal. But this case went beyond aesthetics. If the growth hadn’t been removed, the child was expected to live only 4-6 more years, Dr. Waner said. Without the surgery, she could have suffocated, starved without the ability to swallow, or suffered a fatal bleed.
Dr. O and Dr. Waner are uniquely equipped to do this kind of work, but both are adamant that treating vascular anomalies is a multidisciplinary, multimodal approach. Specialties in anesthesiology, radiology, lasers, facial nerves – they are all critical to these procedures. And often patients with these kinds of lesions require medical and radiologic interventions in addition to surgery. In this particular case, from logistics to post op, “it was a lot of teamwork,” Dr. O said, “a lot of international teams coming together.”
Though extremely difficult, “in the end the result was exactly what we wanted,” Dr. Waner said. Negalem can live a normal life. And as for the surgical duo, both feel very fortunate to do this work. Dr. O said, “I’m honored to have found this specialty and to be able to train with and work with Milton. I’m so happy to do what I do every day.”
A version of this article first appeared on Medscape.com.
In 2019, doctors in London saw a 5-year old girl from rural Ethiopia with an enormous tumor extending from her cheek to her lower jaw. Her name was Negalem and the tumor was a vascular malformation, a life-threatening web of tangled blood vessels.
Surgery to remove it was impossible, the doctors told the foundation advocating for the girl. The child would never make it off the operating table. After a closer examination, the London group still declined to do the procedure, but told the child’s parents and advocates that if anyone was going to attempt this, they’d need to get the little girl to New York.
In New York City, on 64th St. in Manhattan, is the Vascular Birthmark Institute, founded by Milton Waner, MD, who has exclusively treated hemangiomas and vascular malformations for the last 30 years. “I’m the only person in the [United] States whose practice is exclusively [treating] vascular anomalies,” Dr. Waner said in an interview.
Dr. Waner has assembled a multidisciplinary team of experts at the institute’s offices in Lenox Hill – including his wife Teresa O, MD, a facial plastic and reconstructive surgeon and neurospecialist. “People often ask how the hell do you spend so much time with your spouse?” Dr. Waner says. “We work extremely well together. We complement each other.”
Dr. O and Dr. Waner each manage half of the cases at VBI. And in January they received an email about Negalem. After corresponding with the child’s advocate and reviewing images,
The challenge with vascular malformations in children, Dr. Waner said, is that they have a fraction of the blood an adult has. Where adults have an average of 5 L of blood, a child this age has only 1 L. To lose 200 or 300 mL of blood, “that’s 20% or 30% of their blood volume,” Dr. Waner said. So the removal of such a mass, which requires a meticulous dissection around many blood vessels, carries a high risk of the child bleeding out.
There were some logistical hurdles, but the patient arrived in Manhattan in mid-June, at no cost to her family. The medical visa was organized by a volunteer who also work for USAID. Healing the Children Northeast paid for her travel and the Waner Kids Foundation paid for her hotel stay. Lenox Hill Hospital and Northwell Health covered all hospital costs and postsurgery care. And Dr. O and Dr. Waner did the planning, consult visits, and procedure pro bono.
The surgery was possible because of the generosity of several organizations, but the two surgeons still had a limited time to remove the mass. Under different circumstances, and with the luxury of more time, the patient would have undergone several rounds of sclerotherapy. This procedure, done by interventional radiologists, involves injecting a toxin into the blood vessels, which causes them to clot. Done prior to surgery it can help limit bleeding risk.
On June 23, the morning of the surgery, the patient underwent one round of sclerotherapy. However, it didn’t have the intended effect, Dr. Waner said, “because the lesion was just so massive.”
The team had planned several of their moves ahead of time. But this isn’t the sort of surgery you’d find in a textbook. Because it’s such a unique field, Dr. Waner and Dr. O have developed many of their own techniques along the way. This patient was much like the cases they treat every day, only “several orders of magnitudes greater,” Dr. Waner said. “On a scale of 1 to 10 she was a 12.”
The morning of the surgery, “I was very apprehensive,” Dr. Waner recalled. He vividly remembers the girl’s father repeatedly kissing her to say goodbye as she lay on the operating table, fully aware that this procedure was a life-threatening one. And from the beginning there were challenges, like getting her under anesthesia when the anatomy of her mouth, deformed by the tumor, didn’t allow the anesthesiologists to use their typical tubing. Then, once the skin was removed, it became clear how dilated and tangled the involved blood vessels were. There were many vital structures tangled in the anomaly. “The jugular vein was right there. The carotid artery was right there,” Dr. Waner said. It was extremely difficult to delineate and preserve them, he said.
“That’s why we really took our time. We just went very slowly and deliberately,” Dr. O said. The blood vessels were so dilated that their only option was to move painstakingly slow – otherwise a small nick could be devastating.
But even with the slow pace the surgery was “excruciatingly difficult,” Dr. Waner said. And early on in the dissection he wasn’t quite sure they’d make it out. The sclerotherapy hadn’t done much to prevent bleeding. “At one point every millimeter or 2 that we advanced we got into some bleeding,” Dr. Waner said. “Brisk bleeding.”
Once they got into the surgery they also realized that the growth had adhered to the jaw bone. “There were vessels traversing into the bone, which were hard to control,” Dr. O said.
But finally, both doctors realized they’d be able to remove it. With the lesion removed they began the work of reconstruction and reanimation.
The child’s jaw and cheek bone had grown beyond their normal size to support the growth. They had to shave them down to achieve facial symmetry. The tumor had also inhibited much of the child’s facial nerve control. With it gone, Dr. O began the work of finding all the facial nerve branches and assembling them to reanimate the child’s face.
Before medicine, Dr. O trained as an architect, which, according to Dr. Waner, has equipped her with very good spatial awareness – a valuable skill in the surgical reconstruction phase. After seeing a lecture by Dr. Waner, she immediately saw a fit for her unique interest and skill set. She did fellowship training with Dr. Waner in vascular anomalies, and then went on to specialize in facial nerve reanimation. The proof of Dr. O’s expertise is Negalem’s new, beautiful smile, Dr. Waner said.
The surgery drew out over 8 hours, as long as a day of surgeries for the two doctors. When Dr. O finally walked into the waiting room to inform the family of the success, the first words out of the father’s mouth were: “Is my daughter alive?”
A growth like Negalem had is not compatible with a normal life. Dr. Waner’s mantra is that every child has the right to look normal. But this case went beyond aesthetics. If the growth hadn’t been removed, the child was expected to live only 4-6 more years, Dr. Waner said. Without the surgery, she could have suffocated, starved without the ability to swallow, or suffered a fatal bleed.
Dr. O and Dr. Waner are uniquely equipped to do this kind of work, but both are adamant that treating vascular anomalies is a multidisciplinary, multimodal approach. Specialties in anesthesiology, radiology, lasers, facial nerves – they are all critical to these procedures. And often patients with these kinds of lesions require medical and radiologic interventions in addition to surgery. In this particular case, from logistics to post op, “it was a lot of teamwork,” Dr. O said, “a lot of international teams coming together.”
Though extremely difficult, “in the end the result was exactly what we wanted,” Dr. Waner said. Negalem can live a normal life. And as for the surgical duo, both feel very fortunate to do this work. Dr. O said, “I’m honored to have found this specialty and to be able to train with and work with Milton. I’m so happy to do what I do every day.”
A version of this article first appeared on Medscape.com.