User login
Costs and Reimbursements for Mental Health Hospitalizations at Children’s Hospitals
Increasing numbers of children and adolescents are presenting to children’s hospitals with acute mental health crises requiring emergent or inpatient treatment.1-5 As a result, children’s hospitals are experiencing additional financial challenges because specialty mental health services are often reimbursed at lower rates than other medical services.6-9 Poor reimbursement has also been cited as a deterrent to the provision of mental health specialty care, including emergency mental health crisis services.10 The cumulative financial impact of recent trends in the provision of mental health crisis services at children’s hospitals, however, is unknown. We conducted this study to assess children’s hospitals’ costs, reimbursement, and net profits or losses when delivering inpatient mental health care.
METHODS
We conducted a retrospective cohort study of the Children’s Hospital Association’s Pediatric Health Information System (PHIS) and Revenue Management Program (RMP) databases. PHIS is an administrative and billing database that collects International Classification of Disease, 10th Revision (ICD-10) diagnoses, procedure codes, and hospital charges from encounters at 52 US children’s hospitals. Costs are estimated from charges using hospital-, year-, and department-specific cost-to-charge ratios. The RMP database is an add-on module to the PHIS database that captures reimbursement data submitted quarterly from 17 participating hospitals based on actual reimbursement amounts collected for each encounter.
Among the 17 participating hospitals, we included all medical (ie, not surgical or intensive care) encounters during calendar year 2017 for children older than 6 years. We stratified encounters into three diagnosis types: primary mental health diagnosis,5 suicide attempt,11 or other medical hospitalizations. We separated suicide attempts since these encounters often require care for both mental health concerns and medical complications. Eating disorders were excluded because these programs at children’s hospitals primarily focus on medical complications, require complex multispecialty support, have significantly longer hospitalizations and made up a small volume of overall mental health hospitalizations.
We stratified all analyses by inpatient or observation encounter and determined the proportion of encounters and hospital days attributed to primary mental health, suicide attempt, and other medical conditions at each hospital. One of the 17 children’s hospitals does not use observation status billing, so the observation encounters dataset includes 16 hospitals.
We summarized patients’ demographic and clinical characteristics using frequencies and percentages, comparing across diagnosis groups using chi-square tests. We calculated mean cost per day as (total cost) ÷ (total length of stay [LOS]), reimbursement per day as (total reimbursement) ÷ (total LOS) for each hospital and patient group, and margin per day as (reimbursement per day) – (cost per day). We then determined the total margin difference of caring for mental health vs caring for other medical encounters as ([margin per day for mental health] – [margin per day other medical]) × (number of mental health days). Similarly, we calculated the total margin loss for suicide attempts vs other medical encounters. After calculating profits and losses at individual hospitals, we summed total annual profits and losses to calculate cumulative annual differences. We summarized these profits and losses across all hospitals with medians and interquartile ranges (IQR).
This study of deidentified administrative data was approved by the Internal Review Board at Vanderbilt University as non-human subjects research. All statistical analyses were performed using SAS v.9.4 (SAS Institute, Cary, North Carolina), and P values < .05 were considered statistically significant.
RESULTS
Study Population
Across the 17 included children’s hospitals, there were 8,521 (7.6%) mental health encounters, 3,247 (2.9%) suicide attempt encounters, and 99,937 (89.5%) other medical encounters. LOS was significantly longer for mental health hospitalizations than for suicide attempts and for other medical hospitalizations.
Hospital Characteristics
All 17 free-standing children’s hospitals in the study had an inpatient behavioral health/psychiatric consultation service, and 7 of the 17 had an inpatient behavioral health/psychiatric unit. The total number of discharges for mental health, suicide attempt, and other medical conditions per year varied (range, 2,868-13,214) across the hospitals.
Hospital Daily Profits and Losses for Mental Health, Suicide Attempt, and Other Medical Admissions
For inpatient status mental health hospitalizations, the median margin was $376/day (IQR, $23-$618). For inpatient status suicide attempt hospitalizations, the median margin was $685/day (IQR, $3-$1,117), and for other medical hospitalizations the median margin was $603/day (IQR, $240-$991). With regard to observation status admissions, mental health hospitalizations had a median margin of –$453/day (IQR, –$806 to $362), suicide attempts of –$103/day (IQR, –$639 to $264), and other medical conditions of $353/day (IQR, –$616 to $658; Figure).
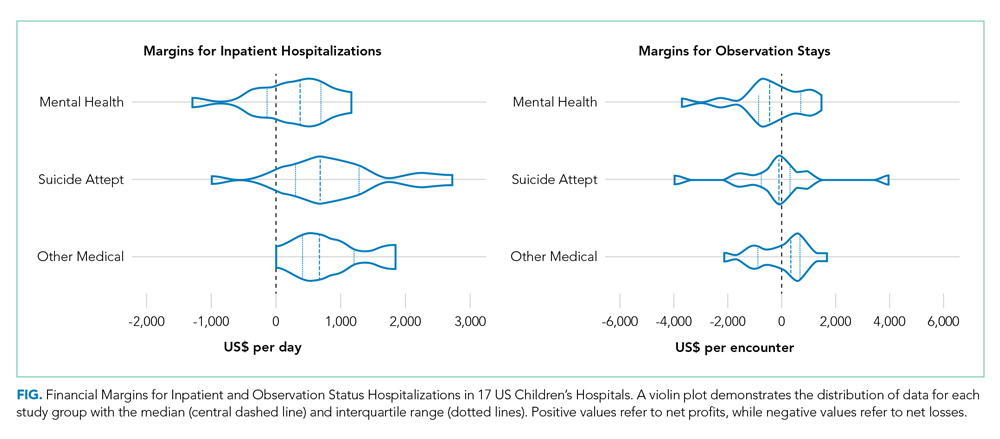
Hospital Annual Profits and Losses for Mental Health and Suicide Attempt Admissions, Compared With Other Medical Admissions
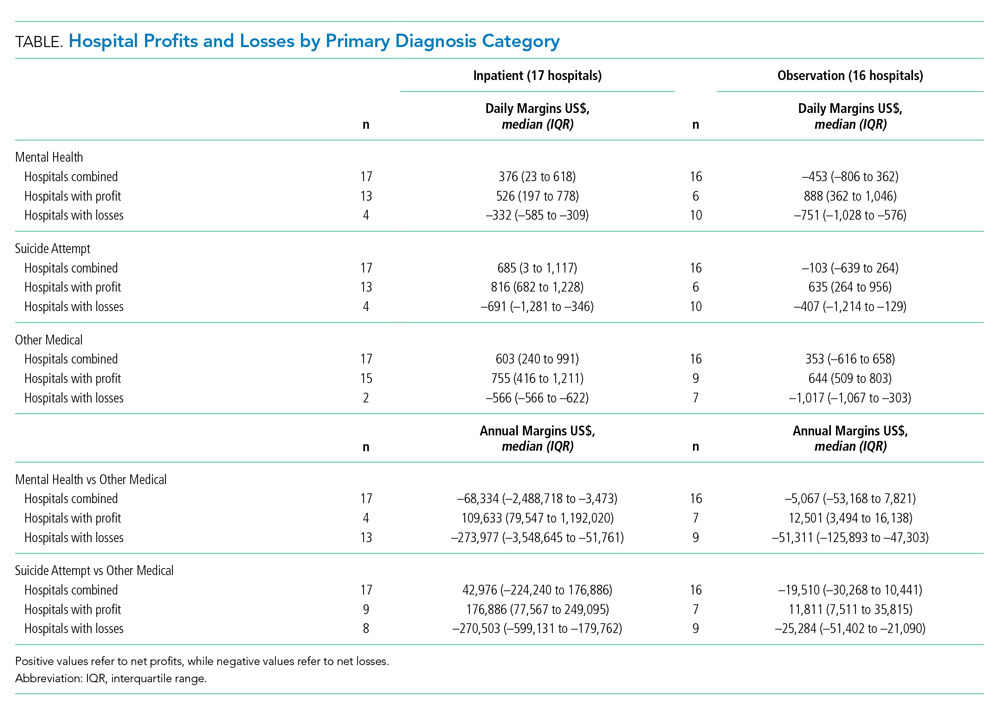
The Table shows daily and annual profits and losses for inpatient and observation status. The total annual loss across all hospitals for mental health and suicide attempt hospitalizations, compared with other medical hospitalizations, including both inpatient and observation status, was –$26,658,255 when taking both profits and losses into account. For the seven hospitals with net profits for mental health and suicide attempt hospitalizations, compared with other medical hospitalizations, the median net profit for combined inpatient and observation status encounters was $119,361 (IQR, $82,818-$195,543), and the total net profit was $5,872,665. For the 10 hospitals with net losses for mental health and suicide attempt hospitalizations, compared with other medical hospitalizations, the median net loss for combined inpatient and observation status was –$2,169,357 (IQR, –$4,034,085 to –$511,755), and the total net loss was –$27,419,379.
DISCUSSION
Hospitalizations for mental health disorders and suicide attempts accounted for 10.5% of hospitalizations at 17 US children’s hospitals in 2017. Overall, mental health and suicide attempt hospitalizations had lower financial margins than did other medical hospitalizations, and they accounted for a total margin loss of more than $26 million across 17 hospitals. Seven hospitals generated a profit for mental health and suicide attempt admissions; 10 hospitals reported losses. Only three hospitals generated a higher net profit for mental health admissions than for other medical admissions. More hospitals had net profits for inpatient status mental health and suicide attempt admissions than for observation status mental health and suicide attempt admissions.
For a minority of children’s hospitals, mental health hospitalizations had higher profit margins than for other medical hospitalizations. This raises questions about patient outcomes and the type of care models employed. One potential explanation is that these hospitals have negotiated favorable agreements with payers. Another possibility could be variations in case-mix and payer mix. Certain mental health services, such as crisis response teams, social workers, and child life specialists, may also be funded from nonpayer sources, so estimates may not fully reflect the cost of providing mental health services. A worst-case view is that hospitals with higher profit margins are providing less or poorer care because of lower reimbursement.
Mental health and suicide attempt hospitalizations were associated with smaller margins but counterintuitively generally wider IQRs for cost. This might be related to variation in care models, but our study was not positioned to examine reasons for this variation. The relationship between reimbursement or margins and patient outcomes, as well as specific mechanisms which may drive costs and outcomes, are areas for future research.
Health insurance plays a crucial role in mental health care. In our study, hospitals were more likely to report positive margins from inpatient status mental health hospitalizations rather than from observation status ones. This is unsurprising because payments for observation status are generally lower than for inpatient status.12 Less is known about what influences billing and payment for inpatient versus observation at individual hospitals, particularly for mental health hospitalizations. In many cases, billing status is not strictly under the hospital’s control and may be determined by payers during or after the hospitalization. Significant variability in the percentage of patients billed as observation status and the impact of lower, often negative, margins for observation mental health encounters, will have a disproportionate effect on some hospitals. Future work could investigate how these differences may influence overall costs and delivery of care.
This study has several limitations that deserve attention. Costs reported are based on cost to charge ratios, which may generate imperfect estimates. Data was limited to 17 freestanding children’s hospitals, and our findings may not generalize to other hospitals. We also compared mental health and suicide attempt hospitalizations with “other medical” hospitalizations. This broad group contains certain medical conditions that may have higher or lower profit margins than average, and estimates of the margins could be over- or underestimated. We assumed that mental health and suicide attempt admissions were displacing admissions with non–mental health medical conditions (ie, not an empty bed). If those beds would otherwise be unoccupied, raw margins are better estimates of the financial impact than margin differences between mental health/suicide attempt and other medical hospitalizations.
CONCLUSION
Children’s hospitals are more likely to have significantly lower financial margins for mental health and suicide attempt hospitalizations than for other medical hospitalizations. Future work to investigate how quality of care is associated with reimbursement can help ensure that funding for children’s acute mental health care services is commensurate with resources required to provide high quality services.
Disclosures
The authors had no financial relationships relevant to this article to disclose.
Funding Source
Research reported in this publication was supported by the National Institute of Mental Health of the National Institutes of Health under Award Number K23MH115162 (Doupnik).
Disclaimer
The content is solely the responsibility of the authors and does not necessarily represent the official views of the National Institutes of Health.
1. Plemmons G, Hall M, Doupnik S, et al. Hospitalization for suicide ideation or attempt: 2008-2015. Pediatrics. 2018;141(6):e20172426. https://doi.org/10.1542/peds.2017-2426.
2. Perou R, Bitsko RH, Blumberg SJ, et al. Mental health surveillance among children--United States, 2005-2011. MMWR Suppl. 2013;62:1-35.
3. Mojtabai R, Olfson M, Han B. National trends in the prevalence and treatment of depression in adolescents and young adults. Pediatrics 2016;138(6):e20161878. https://doi.org/10.1542/peds.2016-1878.
4. Curtin SC, Warner M, Hedegaard H. Increase in suicide in the United States, 1999-2014. NCHS Data Brief. 2016;(241):1–8.
5. Zima BT, Rodean J, Hall M, Bardach NS, Coker TR, Berry JG. Psychiatric disorders and trends in resource use in pediatric hospitals. Pediatrics. 2016;138(5):e20160909. https://doi.org/10.1542/peds.2016-0909.
6. Bierenbaum ML, Katsikas S, Furr A, Carter BD. Factors associated with non-reimbursable activity on an inpatient pediatric consultation-liaison service. J Clin Psychol Med Settings. 2013;20:464-72. https://doi.org/10.1007/s10880-013-9371-2.
7. Bishop TF, Press MJ, Keyhani S, Pincus HA. Acceptance of insurance by psychiatrists and the implications for access to mental health care. JAMA Psychiatry. 2014;71:176-81. https://doi.org/10.1001/jamapsychiatry.2013.2862.
8. McAuliffe Lines M, Tynan WD, Angalet GB, Shroff Pendley J. Commentary: the use of health and behavior codes in pediatric psychology: where are we now? J Pediatr Psychol. 2012;37:486-90. https://doi.org/10.1093/jpepsy/jss045.
9. Drotar D. Introduction to the special section: pediatric psychologists’ experiences in obtaining reimbursement for the use of health and behavior codes. J Pediatr Psychol. 2012;37:479-85. https://doi.org/10.1093/jpepsy/jss065.
10. Komers AM. “Indiana children’s hospital shutters psychiatric unit.” Becker’s Hospital Review. 2019. https://www.beckershospitalreview.com/patient-flow/indiana-children-s-hospital-shutters-psychiatric-unit.html. Accessed August 28, 2019.
11. Hedegaard H, Schoenbaum M, Claassen C, Crosby A, Holland K, Proescholdbell S. Issues in developing a surveillance case definition for nonfatal suicide attempt and intentional self-harm using International Classification of Diseases, Tenth Revision, Clinical Modification (ICD-10-CM) coded data. Natl Health Stat Report. 2018;(108):1-19.
12. Fieldston ES, Shah SS, Hall M, et al. Resource utilization for observation-status stays at children’s hospitals. Pediatrics. 2013;131(6):1050-8. https://doi.org/10.1542/peds.2012-2494.
Increasing numbers of children and adolescents are presenting to children’s hospitals with acute mental health crises requiring emergent or inpatient treatment.1-5 As a result, children’s hospitals are experiencing additional financial challenges because specialty mental health services are often reimbursed at lower rates than other medical services.6-9 Poor reimbursement has also been cited as a deterrent to the provision of mental health specialty care, including emergency mental health crisis services.10 The cumulative financial impact of recent trends in the provision of mental health crisis services at children’s hospitals, however, is unknown. We conducted this study to assess children’s hospitals’ costs, reimbursement, and net profits or losses when delivering inpatient mental health care.
METHODS
We conducted a retrospective cohort study of the Children’s Hospital Association’s Pediatric Health Information System (PHIS) and Revenue Management Program (RMP) databases. PHIS is an administrative and billing database that collects International Classification of Disease, 10th Revision (ICD-10) diagnoses, procedure codes, and hospital charges from encounters at 52 US children’s hospitals. Costs are estimated from charges using hospital-, year-, and department-specific cost-to-charge ratios. The RMP database is an add-on module to the PHIS database that captures reimbursement data submitted quarterly from 17 participating hospitals based on actual reimbursement amounts collected for each encounter.
Among the 17 participating hospitals, we included all medical (ie, not surgical or intensive care) encounters during calendar year 2017 for children older than 6 years. We stratified encounters into three diagnosis types: primary mental health diagnosis,5 suicide attempt,11 or other medical hospitalizations. We separated suicide attempts since these encounters often require care for both mental health concerns and medical complications. Eating disorders were excluded because these programs at children’s hospitals primarily focus on medical complications, require complex multispecialty support, have significantly longer hospitalizations and made up a small volume of overall mental health hospitalizations.
We stratified all analyses by inpatient or observation encounter and determined the proportion of encounters and hospital days attributed to primary mental health, suicide attempt, and other medical conditions at each hospital. One of the 17 children’s hospitals does not use observation status billing, so the observation encounters dataset includes 16 hospitals.
We summarized patients’ demographic and clinical characteristics using frequencies and percentages, comparing across diagnosis groups using chi-square tests. We calculated mean cost per day as (total cost) ÷ (total length of stay [LOS]), reimbursement per day as (total reimbursement) ÷ (total LOS) for each hospital and patient group, and margin per day as (reimbursement per day) – (cost per day). We then determined the total margin difference of caring for mental health vs caring for other medical encounters as ([margin per day for mental health] – [margin per day other medical]) × (number of mental health days). Similarly, we calculated the total margin loss for suicide attempts vs other medical encounters. After calculating profits and losses at individual hospitals, we summed total annual profits and losses to calculate cumulative annual differences. We summarized these profits and losses across all hospitals with medians and interquartile ranges (IQR).
This study of deidentified administrative data was approved by the Internal Review Board at Vanderbilt University as non-human subjects research. All statistical analyses were performed using SAS v.9.4 (SAS Institute, Cary, North Carolina), and P values < .05 were considered statistically significant.
RESULTS
Study Population
Across the 17 included children’s hospitals, there were 8,521 (7.6%) mental health encounters, 3,247 (2.9%) suicide attempt encounters, and 99,937 (89.5%) other medical encounters. LOS was significantly longer for mental health hospitalizations than for suicide attempts and for other medical hospitalizations.
Hospital Characteristics
All 17 free-standing children’s hospitals in the study had an inpatient behavioral health/psychiatric consultation service, and 7 of the 17 had an inpatient behavioral health/psychiatric unit. The total number of discharges for mental health, suicide attempt, and other medical conditions per year varied (range, 2,868-13,214) across the hospitals.
Hospital Daily Profits and Losses for Mental Health, Suicide Attempt, and Other Medical Admissions
For inpatient status mental health hospitalizations, the median margin was $376/day (IQR, $23-$618). For inpatient status suicide attempt hospitalizations, the median margin was $685/day (IQR, $3-$1,117), and for other medical hospitalizations the median margin was $603/day (IQR, $240-$991). With regard to observation status admissions, mental health hospitalizations had a median margin of –$453/day (IQR, –$806 to $362), suicide attempts of –$103/day (IQR, –$639 to $264), and other medical conditions of $353/day (IQR, –$616 to $658; Figure).
Hospital Annual Profits and Losses for Mental Health and Suicide Attempt Admissions, Compared With Other Medical Admissions
The Table shows daily and annual profits and losses for inpatient and observation status. The total annual loss across all hospitals for mental health and suicide attempt hospitalizations, compared with other medical hospitalizations, including both inpatient and observation status, was –$26,658,255 when taking both profits and losses into account. For the seven hospitals with net profits for mental health and suicide attempt hospitalizations, compared with other medical hospitalizations, the median net profit for combined inpatient and observation status encounters was $119,361 (IQR, $82,818-$195,543), and the total net profit was $5,872,665. For the 10 hospitals with net losses for mental health and suicide attempt hospitalizations, compared with other medical hospitalizations, the median net loss for combined inpatient and observation status was –$2,169,357 (IQR, –$4,034,085 to –$511,755), and the total net loss was –$27,419,379.
DISCUSSION
Hospitalizations for mental health disorders and suicide attempts accounted for 10.5% of hospitalizations at 17 US children’s hospitals in 2017. Overall, mental health and suicide attempt hospitalizations had lower financial margins than did other medical hospitalizations, and they accounted for a total margin loss of more than $26 million across 17 hospitals. Seven hospitals generated a profit for mental health and suicide attempt admissions; 10 hospitals reported losses. Only three hospitals generated a higher net profit for mental health admissions than for other medical admissions. More hospitals had net profits for inpatient status mental health and suicide attempt admissions than for observation status mental health and suicide attempt admissions.
For a minority of children’s hospitals, mental health hospitalizations had higher profit margins than for other medical hospitalizations. This raises questions about patient outcomes and the type of care models employed. One potential explanation is that these hospitals have negotiated favorable agreements with payers. Another possibility could be variations in case-mix and payer mix. Certain mental health services, such as crisis response teams, social workers, and child life specialists, may also be funded from nonpayer sources, so estimates may not fully reflect the cost of providing mental health services. A worst-case view is that hospitals with higher profit margins are providing less or poorer care because of lower reimbursement.
Mental health and suicide attempt hospitalizations were associated with smaller margins but counterintuitively generally wider IQRs for cost. This might be related to variation in care models, but our study was not positioned to examine reasons for this variation. The relationship between reimbursement or margins and patient outcomes, as well as specific mechanisms which may drive costs and outcomes, are areas for future research.
Health insurance plays a crucial role in mental health care. In our study, hospitals were more likely to report positive margins from inpatient status mental health hospitalizations rather than from observation status ones. This is unsurprising because payments for observation status are generally lower than for inpatient status.12 Less is known about what influences billing and payment for inpatient versus observation at individual hospitals, particularly for mental health hospitalizations. In many cases, billing status is not strictly under the hospital’s control and may be determined by payers during or after the hospitalization. Significant variability in the percentage of patients billed as observation status and the impact of lower, often negative, margins for observation mental health encounters, will have a disproportionate effect on some hospitals. Future work could investigate how these differences may influence overall costs and delivery of care.
This study has several limitations that deserve attention. Costs reported are based on cost to charge ratios, which may generate imperfect estimates. Data was limited to 17 freestanding children’s hospitals, and our findings may not generalize to other hospitals. We also compared mental health and suicide attempt hospitalizations with “other medical” hospitalizations. This broad group contains certain medical conditions that may have higher or lower profit margins than average, and estimates of the margins could be over- or underestimated. We assumed that mental health and suicide attempt admissions were displacing admissions with non–mental health medical conditions (ie, not an empty bed). If those beds would otherwise be unoccupied, raw margins are better estimates of the financial impact than margin differences between mental health/suicide attempt and other medical hospitalizations.
CONCLUSION
Children’s hospitals are more likely to have significantly lower financial margins for mental health and suicide attempt hospitalizations than for other medical hospitalizations. Future work to investigate how quality of care is associated with reimbursement can help ensure that funding for children’s acute mental health care services is commensurate with resources required to provide high quality services.
Disclosures
The authors had no financial relationships relevant to this article to disclose.
Funding Source
Research reported in this publication was supported by the National Institute of Mental Health of the National Institutes of Health under Award Number K23MH115162 (Doupnik).
Disclaimer
The content is solely the responsibility of the authors and does not necessarily represent the official views of the National Institutes of Health.
Increasing numbers of children and adolescents are presenting to children’s hospitals with acute mental health crises requiring emergent or inpatient treatment.1-5 As a result, children’s hospitals are experiencing additional financial challenges because specialty mental health services are often reimbursed at lower rates than other medical services.6-9 Poor reimbursement has also been cited as a deterrent to the provision of mental health specialty care, including emergency mental health crisis services.10 The cumulative financial impact of recent trends in the provision of mental health crisis services at children’s hospitals, however, is unknown. We conducted this study to assess children’s hospitals’ costs, reimbursement, and net profits or losses when delivering inpatient mental health care.
METHODS
We conducted a retrospective cohort study of the Children’s Hospital Association’s Pediatric Health Information System (PHIS) and Revenue Management Program (RMP) databases. PHIS is an administrative and billing database that collects International Classification of Disease, 10th Revision (ICD-10) diagnoses, procedure codes, and hospital charges from encounters at 52 US children’s hospitals. Costs are estimated from charges using hospital-, year-, and department-specific cost-to-charge ratios. The RMP database is an add-on module to the PHIS database that captures reimbursement data submitted quarterly from 17 participating hospitals based on actual reimbursement amounts collected for each encounter.
Among the 17 participating hospitals, we included all medical (ie, not surgical or intensive care) encounters during calendar year 2017 for children older than 6 years. We stratified encounters into three diagnosis types: primary mental health diagnosis,5 suicide attempt,11 or other medical hospitalizations. We separated suicide attempts since these encounters often require care for both mental health concerns and medical complications. Eating disorders were excluded because these programs at children’s hospitals primarily focus on medical complications, require complex multispecialty support, have significantly longer hospitalizations and made up a small volume of overall mental health hospitalizations.
We stratified all analyses by inpatient or observation encounter and determined the proportion of encounters and hospital days attributed to primary mental health, suicide attempt, and other medical conditions at each hospital. One of the 17 children’s hospitals does not use observation status billing, so the observation encounters dataset includes 16 hospitals.
We summarized patients’ demographic and clinical characteristics using frequencies and percentages, comparing across diagnosis groups using chi-square tests. We calculated mean cost per day as (total cost) ÷ (total length of stay [LOS]), reimbursement per day as (total reimbursement) ÷ (total LOS) for each hospital and patient group, and margin per day as (reimbursement per day) – (cost per day). We then determined the total margin difference of caring for mental health vs caring for other medical encounters as ([margin per day for mental health] – [margin per day other medical]) × (number of mental health days). Similarly, we calculated the total margin loss for suicide attempts vs other medical encounters. After calculating profits and losses at individual hospitals, we summed total annual profits and losses to calculate cumulative annual differences. We summarized these profits and losses across all hospitals with medians and interquartile ranges (IQR).
This study of deidentified administrative data was approved by the Internal Review Board at Vanderbilt University as non-human subjects research. All statistical analyses were performed using SAS v.9.4 (SAS Institute, Cary, North Carolina), and P values < .05 were considered statistically significant.
RESULTS
Study Population
Across the 17 included children’s hospitals, there were 8,521 (7.6%) mental health encounters, 3,247 (2.9%) suicide attempt encounters, and 99,937 (89.5%) other medical encounters. LOS was significantly longer for mental health hospitalizations than for suicide attempts and for other medical hospitalizations.
Hospital Characteristics
All 17 free-standing children’s hospitals in the study had an inpatient behavioral health/psychiatric consultation service, and 7 of the 17 had an inpatient behavioral health/psychiatric unit. The total number of discharges for mental health, suicide attempt, and other medical conditions per year varied (range, 2,868-13,214) across the hospitals.
Hospital Daily Profits and Losses for Mental Health, Suicide Attempt, and Other Medical Admissions
For inpatient status mental health hospitalizations, the median margin was $376/day (IQR, $23-$618). For inpatient status suicide attempt hospitalizations, the median margin was $685/day (IQR, $3-$1,117), and for other medical hospitalizations the median margin was $603/day (IQR, $240-$991). With regard to observation status admissions, mental health hospitalizations had a median margin of –$453/day (IQR, –$806 to $362), suicide attempts of –$103/day (IQR, –$639 to $264), and other medical conditions of $353/day (IQR, –$616 to $658; Figure).
Hospital Annual Profits and Losses for Mental Health and Suicide Attempt Admissions, Compared With Other Medical Admissions
The Table shows daily and annual profits and losses for inpatient and observation status. The total annual loss across all hospitals for mental health and suicide attempt hospitalizations, compared with other medical hospitalizations, including both inpatient and observation status, was –$26,658,255 when taking both profits and losses into account. For the seven hospitals with net profits for mental health and suicide attempt hospitalizations, compared with other medical hospitalizations, the median net profit for combined inpatient and observation status encounters was $119,361 (IQR, $82,818-$195,543), and the total net profit was $5,872,665. For the 10 hospitals with net losses for mental health and suicide attempt hospitalizations, compared with other medical hospitalizations, the median net loss for combined inpatient and observation status was –$2,169,357 (IQR, –$4,034,085 to –$511,755), and the total net loss was –$27,419,379.
DISCUSSION
Hospitalizations for mental health disorders and suicide attempts accounted for 10.5% of hospitalizations at 17 US children’s hospitals in 2017. Overall, mental health and suicide attempt hospitalizations had lower financial margins than did other medical hospitalizations, and they accounted for a total margin loss of more than $26 million across 17 hospitals. Seven hospitals generated a profit for mental health and suicide attempt admissions; 10 hospitals reported losses. Only three hospitals generated a higher net profit for mental health admissions than for other medical admissions. More hospitals had net profits for inpatient status mental health and suicide attempt admissions than for observation status mental health and suicide attempt admissions.
For a minority of children’s hospitals, mental health hospitalizations had higher profit margins than for other medical hospitalizations. This raises questions about patient outcomes and the type of care models employed. One potential explanation is that these hospitals have negotiated favorable agreements with payers. Another possibility could be variations in case-mix and payer mix. Certain mental health services, such as crisis response teams, social workers, and child life specialists, may also be funded from nonpayer sources, so estimates may not fully reflect the cost of providing mental health services. A worst-case view is that hospitals with higher profit margins are providing less or poorer care because of lower reimbursement.
Mental health and suicide attempt hospitalizations were associated with smaller margins but counterintuitively generally wider IQRs for cost. This might be related to variation in care models, but our study was not positioned to examine reasons for this variation. The relationship between reimbursement or margins and patient outcomes, as well as specific mechanisms which may drive costs and outcomes, are areas for future research.
Health insurance plays a crucial role in mental health care. In our study, hospitals were more likely to report positive margins from inpatient status mental health hospitalizations rather than from observation status ones. This is unsurprising because payments for observation status are generally lower than for inpatient status.12 Less is known about what influences billing and payment for inpatient versus observation at individual hospitals, particularly for mental health hospitalizations. In many cases, billing status is not strictly under the hospital’s control and may be determined by payers during or after the hospitalization. Significant variability in the percentage of patients billed as observation status and the impact of lower, often negative, margins for observation mental health encounters, will have a disproportionate effect on some hospitals. Future work could investigate how these differences may influence overall costs and delivery of care.
This study has several limitations that deserve attention. Costs reported are based on cost to charge ratios, which may generate imperfect estimates. Data was limited to 17 freestanding children’s hospitals, and our findings may not generalize to other hospitals. We also compared mental health and suicide attempt hospitalizations with “other medical” hospitalizations. This broad group contains certain medical conditions that may have higher or lower profit margins than average, and estimates of the margins could be over- or underestimated. We assumed that mental health and suicide attempt admissions were displacing admissions with non–mental health medical conditions (ie, not an empty bed). If those beds would otherwise be unoccupied, raw margins are better estimates of the financial impact than margin differences between mental health/suicide attempt and other medical hospitalizations.
CONCLUSION
Children’s hospitals are more likely to have significantly lower financial margins for mental health and suicide attempt hospitalizations than for other medical hospitalizations. Future work to investigate how quality of care is associated with reimbursement can help ensure that funding for children’s acute mental health care services is commensurate with resources required to provide high quality services.
Disclosures
The authors had no financial relationships relevant to this article to disclose.
Funding Source
Research reported in this publication was supported by the National Institute of Mental Health of the National Institutes of Health under Award Number K23MH115162 (Doupnik).
Disclaimer
The content is solely the responsibility of the authors and does not necessarily represent the official views of the National Institutes of Health.
1. Plemmons G, Hall M, Doupnik S, et al. Hospitalization for suicide ideation or attempt: 2008-2015. Pediatrics. 2018;141(6):e20172426. https://doi.org/10.1542/peds.2017-2426.
2. Perou R, Bitsko RH, Blumberg SJ, et al. Mental health surveillance among children--United States, 2005-2011. MMWR Suppl. 2013;62:1-35.
3. Mojtabai R, Olfson M, Han B. National trends in the prevalence and treatment of depression in adolescents and young adults. Pediatrics 2016;138(6):e20161878. https://doi.org/10.1542/peds.2016-1878.
4. Curtin SC, Warner M, Hedegaard H. Increase in suicide in the United States, 1999-2014. NCHS Data Brief. 2016;(241):1–8.
5. Zima BT, Rodean J, Hall M, Bardach NS, Coker TR, Berry JG. Psychiatric disorders and trends in resource use in pediatric hospitals. Pediatrics. 2016;138(5):e20160909. https://doi.org/10.1542/peds.2016-0909.
6. Bierenbaum ML, Katsikas S, Furr A, Carter BD. Factors associated with non-reimbursable activity on an inpatient pediatric consultation-liaison service. J Clin Psychol Med Settings. 2013;20:464-72. https://doi.org/10.1007/s10880-013-9371-2.
7. Bishop TF, Press MJ, Keyhani S, Pincus HA. Acceptance of insurance by psychiatrists and the implications for access to mental health care. JAMA Psychiatry. 2014;71:176-81. https://doi.org/10.1001/jamapsychiatry.2013.2862.
8. McAuliffe Lines M, Tynan WD, Angalet GB, Shroff Pendley J. Commentary: the use of health and behavior codes in pediatric psychology: where are we now? J Pediatr Psychol. 2012;37:486-90. https://doi.org/10.1093/jpepsy/jss045.
9. Drotar D. Introduction to the special section: pediatric psychologists’ experiences in obtaining reimbursement for the use of health and behavior codes. J Pediatr Psychol. 2012;37:479-85. https://doi.org/10.1093/jpepsy/jss065.
10. Komers AM. “Indiana children’s hospital shutters psychiatric unit.” Becker’s Hospital Review. 2019. https://www.beckershospitalreview.com/patient-flow/indiana-children-s-hospital-shutters-psychiatric-unit.html. Accessed August 28, 2019.
11. Hedegaard H, Schoenbaum M, Claassen C, Crosby A, Holland K, Proescholdbell S. Issues in developing a surveillance case definition for nonfatal suicide attempt and intentional self-harm using International Classification of Diseases, Tenth Revision, Clinical Modification (ICD-10-CM) coded data. Natl Health Stat Report. 2018;(108):1-19.
12. Fieldston ES, Shah SS, Hall M, et al. Resource utilization for observation-status stays at children’s hospitals. Pediatrics. 2013;131(6):1050-8. https://doi.org/10.1542/peds.2012-2494.
1. Plemmons G, Hall M, Doupnik S, et al. Hospitalization for suicide ideation or attempt: 2008-2015. Pediatrics. 2018;141(6):e20172426. https://doi.org/10.1542/peds.2017-2426.
2. Perou R, Bitsko RH, Blumberg SJ, et al. Mental health surveillance among children--United States, 2005-2011. MMWR Suppl. 2013;62:1-35.
3. Mojtabai R, Olfson M, Han B. National trends in the prevalence and treatment of depression in adolescents and young adults. Pediatrics 2016;138(6):e20161878. https://doi.org/10.1542/peds.2016-1878.
4. Curtin SC, Warner M, Hedegaard H. Increase in suicide in the United States, 1999-2014. NCHS Data Brief. 2016;(241):1–8.
5. Zima BT, Rodean J, Hall M, Bardach NS, Coker TR, Berry JG. Psychiatric disorders and trends in resource use in pediatric hospitals. Pediatrics. 2016;138(5):e20160909. https://doi.org/10.1542/peds.2016-0909.
6. Bierenbaum ML, Katsikas S, Furr A, Carter BD. Factors associated with non-reimbursable activity on an inpatient pediatric consultation-liaison service. J Clin Psychol Med Settings. 2013;20:464-72. https://doi.org/10.1007/s10880-013-9371-2.
7. Bishop TF, Press MJ, Keyhani S, Pincus HA. Acceptance of insurance by psychiatrists and the implications for access to mental health care. JAMA Psychiatry. 2014;71:176-81. https://doi.org/10.1001/jamapsychiatry.2013.2862.
8. McAuliffe Lines M, Tynan WD, Angalet GB, Shroff Pendley J. Commentary: the use of health and behavior codes in pediatric psychology: where are we now? J Pediatr Psychol. 2012;37:486-90. https://doi.org/10.1093/jpepsy/jss045.
9. Drotar D. Introduction to the special section: pediatric psychologists’ experiences in obtaining reimbursement for the use of health and behavior codes. J Pediatr Psychol. 2012;37:479-85. https://doi.org/10.1093/jpepsy/jss065.
10. Komers AM. “Indiana children’s hospital shutters psychiatric unit.” Becker’s Hospital Review. 2019. https://www.beckershospitalreview.com/patient-flow/indiana-children-s-hospital-shutters-psychiatric-unit.html. Accessed August 28, 2019.
11. Hedegaard H, Schoenbaum M, Claassen C, Crosby A, Holland K, Proescholdbell S. Issues in developing a surveillance case definition for nonfatal suicide attempt and intentional self-harm using International Classification of Diseases, Tenth Revision, Clinical Modification (ICD-10-CM) coded data. Natl Health Stat Report. 2018;(108):1-19.
12. Fieldston ES, Shah SS, Hall M, et al. Resource utilization for observation-status stays at children’s hospitals. Pediatrics. 2013;131(6):1050-8. https://doi.org/10.1542/peds.2012-2494.
© 2020 Society of Hospital Medicine
Effect of Parental Adverse Childhood Experiences and Resilience on a Child’s Healthcare Reutilization
Adverse Childhood Experiences, or ACEs, include exposure to abuse, neglect, or household dysfunction (eg, having a parent who is mentally ill) as a child.1 Exposure to ACEs affects health into adulthood, with a dose-response relationship between ACEs and a range of comorbidities.1 Adults with 6 or more ACEs have a 20-year shorter life expectancy than do those with no ACEs.1 Still, ACEs are static; once experienced, that experience cannot be undone. However, resilience, or positive adaptation in the context of adversity, can be protective, buffering the negative effects of ACEs.2,3 Protective factors that promote resilience include social capital, such as positive relationships with caregivers and peers.3
With their clear link to health outcomes across the life-course, there is a movement for pediatricians to screen children for ACEs4 and to develop strategies that promote resilience in children, parents, and families. However, screening a child for adversity has challenges because younger children may not have experienced an adverse exposure, or they may be unable to voice their experiences. Studies have demonstrated that parental adversity, or ACEs, may be a marker for childhood adversity.5,6 Biological models also support this potential intergenerational effect of ACEs. Chronic exposure to stress, including ACEs, results in elevated cortisol via a dysregulated hypothalamic-pituitary-adrenal axis, which results in chronic inflammation.7 This “toxic stress” is prolonged, severe in intensity, and can lead to epigenetic changes that may be passed on to the next generation.8,9
Hospitalization of an ill child, and the transition to home after that hospitalization, is a stressful event for children and families.10 This stress may be relevant to parents that have a history of a high rate of ACEs or a current low degree of resilience. Our previous work demonstrated that, in the inpatient setting, parents with high ACEs (≥4) or low resilience have increased coping difficulty 14 days after their child’s hospital discharge.11 Our objective here was to evaluate whether a parent’s ACEs and/or resilience would also be associated with that child’s likelihood of reutilization. We hypothesized that more parental ACEs and/or lower parental resilience would be associated with revisits the emergency room, urgent care, or hospital readmissions.
METHODS
Participants and Study Design
We conducted a prospective cohort study of parents of hospitalized children recruited from the “Hospital-to-Home Outcomes” Studies (H2O I and H2O II).12,13 H2O I and II were prospective, single-center, randomized controlled trials designed to determine the effectiveness of either a nurse-led transitional home visit (H2O I) or telephone call (H2O II) on 30-day unplanned healthcare reutilization. The trials and this study were approved by the Cincinnati Children’s Institutional Review Board. All parents provided written informed consent.
Details of H2O I and II recruitment and design have been described previously.12,13 Briefly, children were eligible for inclusion in either study if they were admitted to our institution’s general Hospital Medicine or the Hospital Medicine Complex Care Services; for H2O I, children hospitalized on the Neurology and Neurosurgery services were also eligible.12,13 Patients were excluded if they were discharged to a residential facility, if they lived outside the home healthcare nurse service area, if they were eligible for skilled home healthcare services (eg, intravenous antibiotics), or if the participating caregiver was non-English speaking.12,13 In H2O I, families were randomized either to receive a single nurse home visit within 96 hours of discharge or standard of care. In H2O II, families enrolled were randomized to receive a telephone call by a nurse within 96 hours of discharge or standard of care. As we have previously published, randomization in both trials successfully balanced the intervention and control arms with respect to key demographic characteristics.12,13 For the analyses presented here, we focused on a subset of caregivers 18 years and older whose children were enrolled in either H2O I or II between August 2015 and October 2016. In both H2O trials, face-to-face and paper-based questionnaires were completed by parents during the index hospitalization.
Outcome and Predictors
Our primary outcome was unanticipated healthcare reutilization defined as return to the emergency room, urgent care, or unplanned readmission within 30 days of hospital discharge, consistent with the H2O trials. This was measured using the primary institution’s administrative data supplemented by a utilization database shared across regional hospitals.14 Readmissions were identified as “unplanned” using a previously validated algorithm,15 and treated as a dichotomous yes/no variable.
Our primary predictors were parental ACEs and resilience (see Appendix Tables). The ACE questionnaire addresses abuse, neglect, and household dysfunction in the first 18 years of life.1 It is composed of 10 questions, each with a yes/no response.1 We defined parents as low (ACE 0), moderate (ACE 1-3), or high (ACE ≥4) risk a priori because previous literature has described poor outcomes in adults with 4 or more ACEs.16
Given the sensitive nature of the questions, respondents independently completed the ACE questionnaire on paper instead of via the face-to-face survey. Respondents returned the completed questionnaire to the research assistant in a sealed envelope. All families received educational information on relevant hospital and community-based resources (eg, social work).
Parental resilience was measured using the Brief Resilience Scale (BRS). The BRS is 6 items, each on a 5-point Likert scale. Responses were averaged, providing a total score of 1-5; higher scores are representative of higher resilience.17 We treated the BRS score as a continuous variable. BRS has been used in clinical settings; it has demonstrated positive correlation with social support and negative correlation with fatigue.17 Parents answered BRS questions during the index pediatric hospitalization in a face-to-face interview.
Parent and Child Characteristics
Parent and child sociodemographic variables were also obtained during the face-to-face interview. Parental variables included age, gender, educational attainment, household income, employment status, and financial and social strain.11 Educational attainment was analyzed in 2 categories—high school or less vs more than high school—because most discharge instructions are written at a high school reading level.18 Parents reported their annual household income in the following categories: <$15,000; $15,000-$29,999; $30,000-$44,999; $45,000-$59,999; $60,000-$89,999; $90,000-$119,999; ≥$120,000. Employment was dichotomized as not employed/student vs any employment. Financial and social strain were assessed using a series of 9 previously described questions.19 These questions assessed, via self-report, a family’s ability to make ends meet, ability to pay rent/mortgage or utilities, need to move in with others because of financial reasons, and ability to borrow money if needed, as well as home ownership and parental marital status.15,19 Strain questions were all dichotomous (yes/no, single/not single). A composite variable was then constructed that categorized those reporting no strain items, 1 to 2 items, 3 to 4 items, and 5 or more items.20
Child variables included race, ethnicity, age, primary care access,21 payer, and H2O treatment arm. Race categories were white/Caucasian, black/African American, American Indian or Alaskan Native, Asian or Pacific Islander, and other; ethnicity categories were Hispanic/Latino, non-Hispanic/Latino, and unknown. Given relatively low numbers of children reported to be Hispanic/Latino, we combined race and ethnicity into a single variable, categorized as non-Hispanic/white, non-Hispanic/black, and multiracial/Hispanic/other. Primary care access was assessed using the access subscale to the Parent’s Perception of Primary Care questionnaire. This includes assessment of a family’s ability to travel to their doctor, to see their doctor for routine or sick care, and to get help or advice on evenings or weekends. Scores were categorized as always adequate, almost always adequate, or sometimes/never adequate.21 Payer was dichotomized to private or public/self-pay.
Statistical Analyses
We examined the distribution of outcomes, predictors, and covariates. We compared sociodemographic characteristics of those respondents and nonrespondents to the ACE screen using the chi-square test for categorical variables or the t test for continuous variables. We used logistic regression to assess for associations between the independent variables of interest and reutilization, adjusting for potential confounders. To build our adjusted, multivariable model, we decided a priori to include child race/ethnicity, primary care access, financial and social strain, and trial treatment arm. We treated the H2O I control group as the referent group. Other covariates considered for inclusion were caregiver education, household income, employment, and payer. These were included in multivariable models if bivariate associations were significant at the P < .1 level. We assessed an ACE-by-resilience interaction term because we hypothesized that those with more ACEs and lower resilience may have more reutilization outcomes than parents with fewer ACEs and higher resilience. We also evaluated interaction terms between trial arm assignment and predictors to assess effects that may be introduced by the randomization. Predictors in the final logistic regression model were significant at the P < .05 level. Logistic regression assumption of little or no multicollinearity among the independent variables was verified in the final models. All analyses were performed with Stata v16 (Stata Corp, College Station, Texas).
RESULTS
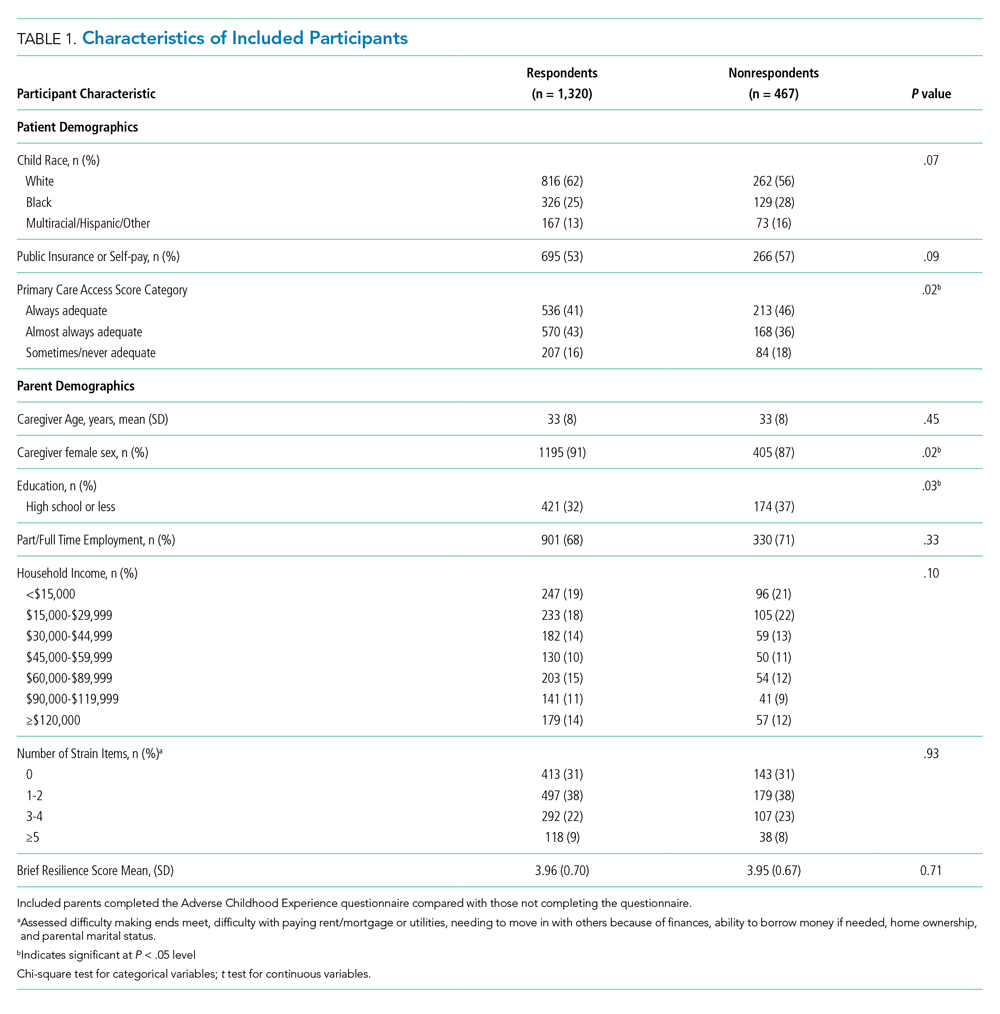
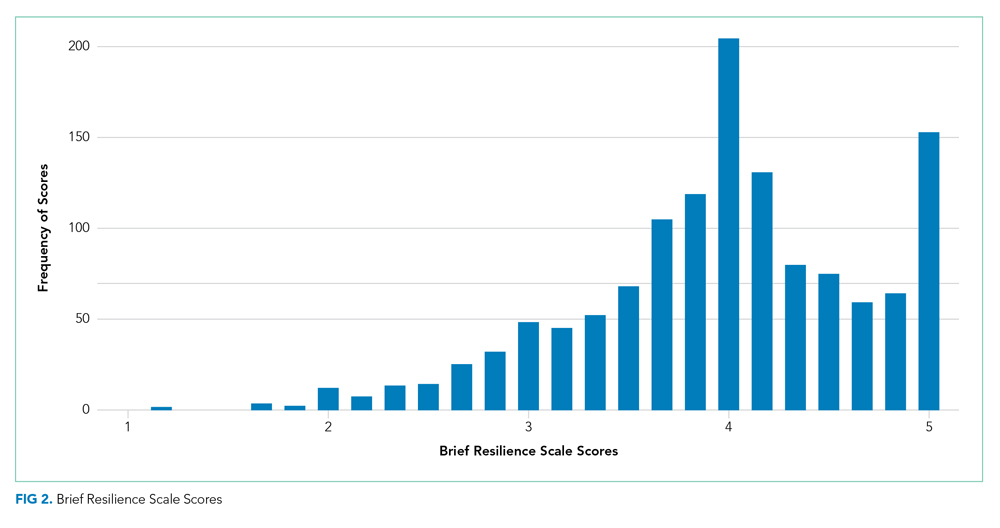
There were a total of 1,787 parent-child dyads enrolled in the H2O I and II during the study period; 1,320 parents (74%) completed the ACE questionnaire and were included the analysis. Included parents were primarily female and employed, as well as educated beyond high school (Table 1). Overall, 64% reported one or more ACEs (range 0 to 9); 45% reported 1to 3, and 19% reported 4 or more ACEs. The most commonly reported ACEs were divorce (n = 573, 43%), exposure to alcoholism (n = 306, 23%), and exposure to mental illness (n = 281, 21%; Figure 1). Parents had a mean BRS score of 3.97 (range 1.17-5.00), with the distribution shown in Figure 2.
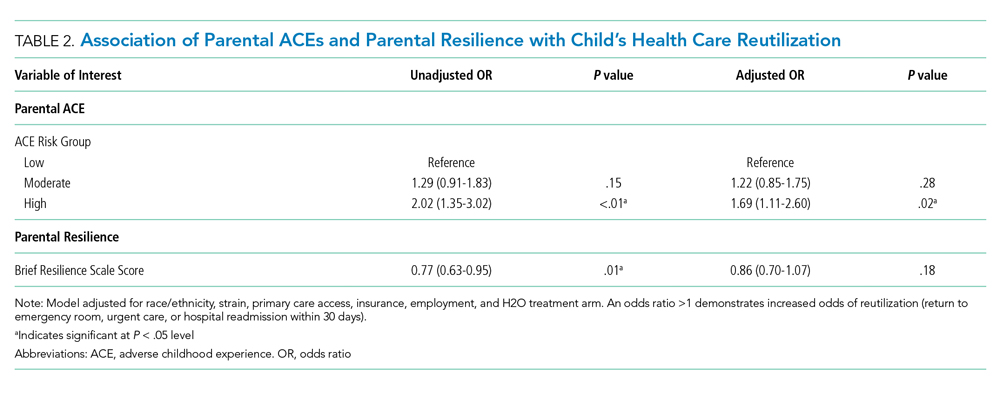
Of the 1,320 included patients, the average length of stay was 2.5 days, and 82% of hospitalizations were caused by acute medical issues (eg, bronchiolitis). A total of 211 children experienced a reutilization event within 30 days of discharge. In bivariate analysis, children with parents with 4 or more ACEs had a 2.02-times (95% CI 1.35-3.02) higher odds of experiencing a reutilization event than did those with parents reporting no ACEs. Parents with higher resilience scores had children with a lower odds of reutilization (odds ratio [OR] 0.77 95% CI 0.63-0.95).

In addition to our a priori variables, parental education, employment, and insurance met our significance threshold for inclusion in the multivariable model. The ACE-by-resilience interaction term was not significant and not included in the model. Similarly, there was no significant interaction between ACE and resilience and H2O treatment arm; the interaction terms were not included in the final adjusted model, but treatment arm assignment was kept as a covariate. A total of 1,292 children, out of the 1,320 respondents, remained in the final multivariable model; the excluded 28 had incomplete covariate data but were not otherwise different. In this final adjusted model, children with parents reporting 4 or more ACEs had a 1.69-times (95% CI 1.11-2.60) greater odds of reutilization than did those with parents reporting no ACEs (Table 2). Resilience failed to reach statistical significance in the adjusted model (OR 0.86, 95% CI 0.70-1.07).
DISCUSSION
We found that high-risk parents (4 or more ACEs) had children with an increased odds of healthcare reutilization, suggesting intergenerational effects of ACEs. We did not find a similar effect relating to parental resilience. We also did not find an interaction between parental ACEs and resilience, suggesting that a parent’s reported degree of resilience does not modify the effect of ACEs on reutilization risk.
Parental adversity may be a risk factor for a child’s unanticipated reutilization. We previously demonstrated that parents with 4 or more ACEs have more coping difficulty than a parent with no ACEs after a child’s hospitalization.11 It is possible that parents with high adversity may have poorer coping mechanisms when dealing with a stressful situation, such as a child’s hospitalization. This may have resulted in inequitable outcomes (eg, increased reutilization) for their children. Other studies have confirmed such an intergenerational effect of adversity, linking a parent’s ACEs with poor developmental, behavioral, and health outcomes in their children.6,22,23 O’Malley et al showed an association of parental ACEs to current adversities,24 such as insurance or housing concerns, that affect the entirety of the household, including children. In short, it appears that parental ACEs may be a compelling predictor of current childhood adversity.
Resilience buffers the negative effects of ACEs; however, we did not find significant associations between resilience and reutilization or an interaction between ACEs and resilience. The factors that may contribute to reutilization are complex. In our previous work, parental resilience was associated with coping difficulty after discharge; but again, did not interact with parental ACEs.11 Here, we suggest that while resilience may buffer the negative effects of ACEs, that buffering may not affect the likelihood of reutilization. It is also possible that the BRS tool is of less relevance on how one handles the stress of a child’s hospitalization. While the BRS is one measure of resilience, there are many other relevant constructs to resilience, such as connection to social supports, that also may also contribute to risk of reutilization.25
Reducing the stress of a hospitalization itself and promoting a safe transition from hospital to home is critical to improving child health outcomes. Our data here, and in our previous work, demonstrate that a history of adversity and one’s current coping ability may drive a parent’s response to a child’s hospitalization and affect their capacity to care for that child after hospital discharge.11 Additional in-hospital supports like child life, behavioral health, or pastoral care could reduce the stress of the hospitalization while also building positive coping mechanisms.26-29 A meta-analysis demonstrated that such coping interventions can help alleviate the stress of a hospitalization.30 Hill et al demonstrated successful stress reduction in parents of hospitalized children using a “Coping Kit for Parents.”31 Further studies are warranted to understand which interventions are most effective for children and families and whether they could be more effectively deployed if the inpatient team knew more about parental ACEs.
Screening for parental ACEs could help to identify patients at highest risk for a poor transition to home. Therefore, screening for parental adversity in clinical settings, including inpatient settings, may be relevant and valuable.32 Additionally, by recognizing the high prevalence of ACEs in an inpatient setting, hospitals and healthcare organizations could be motivated to develop and enact trauma-informed approaches. A trauma-informed care approach recognizes the intersection of trauma with health and social problems. With this recognition, care teams can more sensitively address the trauma as they provide relevant services.33 Trauma-informed care is a secondary public health prevention approach that would help team members identify the prevalence and effects of trauma via screening, recognize the signs of a maladaptive response to stress, and respond by integrating awareness of trauma into practice management.28,34 Both the National Academy of Medicine and the Agency for Healthcare Research and Quality have called for such a trauma-informed approach in primary care.35 In response, many healthcare organizations have developed trauma-informed practices to better address the needs of the populations they serve. For example, provider training on this approach has led to improved rapport in patient-provider relationships.36
Although ACE awareness is a component of trauma-informed care, there are still limitations of the original ACE questionnaire developed by Felitti et al. The existing tool is not inclusive of all adversities a parent or child may face. Moreover, its focus is on past exposures and experiences and not current health-related social needs (eg, food insecurity) which have known linkages with a range of health outcomes and health disparities.37 Additionally, the original ACE questionnaire was created as a population level tool and not as a screening tool. If used as a screening tool, providers may view the questions as too sensitive to ask, and parents may have difficulty responding to and understanding the relevance to their child’s care. Therefore, we suggest that more evidence is required to understand how to best adapt ACE questions into a screening processes that may be implemented in a medical setting.
More evidence is also needed to determine when and where such screening may be most useful. A primary care provider would be best equipped to screen caregivers for ACEs given their established relationship with parents and patients. Given the potential relevance of such information for inpatient care provision, information could then flow from primary care to the inpatient team. However, because not all patients have established primary care providers and only 4% of pediatricians screen for ACEs,38 it is important for inpatient medical teams to understand their role in identifying and addressing ACEs during hospital stays. Development of a screening tool, with input from all stakeholders—including parents—that is valid and feasible for use in a pediatric inpatient setting would be an important step forward. This tool should be paired with training in how to discuss these topics in a trauma-informed, nonjudgmental, empathic manner. We see this as a way in which providers can more effectively elicit an accurate response while simultaneously educating parents on the relevance of such sensitive topics during an acute hospital stay. We also recommend that screening should always be paired with response capabilities that connect those who screen positive with resources that could help them to navigate the stress experienced during and after a child’s hospitalization. Furthermore, communication with primary care providers about parents that screen positive should be integrated into the transition process.
This work has several limitations. First, our study was a part of randomized controlled trials conducted in one academic setting, which thereby limits generalizability. For example, we limited our cohort to those who were English-speaking patients only. This may bias our results because respondents with limited English proficiency may have different risk profiles than their English-speaking peers. In addition, the administration of the both the ACE and resilience questionnaires occurred during an acutely stressful period, which may influence how a parent responds to these questions. Also, both of the surveys are self-reported by parents, which may be susceptible to memory and response biases. Relatedly, we had a high number of nonrespondents, particularly to the ACE questionnaire. Our results are therefore only relevant to those who chose to respond and cannot be applied to nonrespondents. Further work assessing why one does or does not respond to such sensitive questions is an important area for future inquiry. Lastly, our cohort had limited medical complexity; future studies may consider links between parental ACEs (and resilience) and morbidity experienced by children with medical complexity.
CONCLUSION
Parents history of adversity is linked to their children’s unanticipated healthcare reutilization after a hospital discharge. Screening for parental stressors during a hospitalization may be an important first step to connecting parents and children to evidence-based interventions capable of mitigating the stress of hospitalization and promoting better, more seamless transitions from hospital to home.
Acknowledgments
Group Members: The following H2O members are nonauthor contributors: JoAnne Bachus, BSN, RN; Monica Borell, BSN, RN; Lenisa V Chang, MA, PhD; Patricia Crawford, RN; Sarah Ferris, BA; Jennifer Gold, BSN, RN; Judy A Heilman, BSN, RN; Jane C Khoury, PhD; Pierce Kuhnell, MS; Karen Lawley, BSN, RN; Margo Moore, MS, BSN, RN; Lynne O’Donnell, BSN, RN; Sarah Riddle, MD; Susan N Sherman, DPA; Angela M Statile, MD, MEd; Karen P Sullivan, BSN, RN; Heather Tubbs-Cooley, PhD, RN; Susan Wade-Murphy, MSN, RN; and Christine M White, MD, MAT.
The authors also thank David Keller, MD, for his guidance on the study.
Disclosures
The authors have no financial relationships or conflicts of interest relevant to this article to disclose.
Funding Source
Supported by funds from the Academic Pediatric Young Investigator Award (Dr A Shah) and the Patient-Centered Outcomes Research Institute Award (IHS-1306-0081, to Dr K Auger, Dr S Shah, Dr H Sucharew, Dr J Simmons), the National Institutes of Health (1K23AI112916, to Dr AF Beck), and the Agency for Healthcare Research and Quality (1K12HS026393-01, to Dr A Shah, K08-HS024735- 01A1, to Dr K Auger). Dr J Haney received Summer Undergraduate Research Fellowship funding through the Summer Undergraduate Research Fellowship at Cincinnati Children’s Hospital Medical Center.
Disclaimer
All statements in this report, including findings and conclusions, are solely those of the authors and do not necessarily represent the views of the Patient-Centered Outcomes Research Institute, its Board of Governors, or the Methodology Committee.
1. Felitti VJ, Anda RF, Nordenberg D, et al. Relationship of childhood abuse and household dysfunction to many of the leading causes of death in adults. The Adverse Childhood Experiences (ACE) Study. Am J Prev Med. 1998;14(4):245-258. https://doi.org/10.1016/s0749-3797(98)00017-8.
2. Bethell CD, Newacheck P, Hawes E, Halfon N. Adverse childhood experiences: assessing the impact on health and school engagement and the mitigating role of resilience. Health Aff. 2014;33(12):2106-2115. https://doi.org/10.1377/hlthaff.2014.0914.
3. Masten AS. Ordinary Magic. Resilience processes in development. Am Psychol. 2001;56(3):227-238. https://doi.org/10.1037//0003-066x.56.3.227.
4. Garner AS, Shonkoff JP, Committee on Psychosocial Aspects of C, et al. Early childhood adversity, toxic stress, and the role of the pediatrician: translating developmental science into lifelong health. Pediatrics. 2012;129(1):e224-231. https://doi.org/10.1542/peds.2011-2662.
5. Randell KA, O’Malley D, Dowd MD. Association of parental adverse childhood experiences and current child adversity. JAMA Pediatrics. 2015;169(8):786-787. https://doi.org/10.1001/jamapediatrics.2015.0269.
6. Le-Scherban F, Wang X, Boyle-Steed KH, Pachter LM. Intergenerational associations of parent adverse childhood experiences and child health outcomes. Pediatrics. 2018;141(6):e20174274. https://doi.org/10.1542/peds.2017-4274.
7. Johnson SB, Riley AW, Granger DA, Riis J. The science of early life toxic stress for pediatric practice and advocacy. Pediatrics. 2013;131(2):319-327. https://doi.org/10.1542/peds.2012-0469.
8. Roth TL, Lubin FD, Funk AJ, Sweatt JD. Lasting epigenetic influence of early-life adversity on the BDNF gene. Biol Psychiatry. 2009;65(9):760-769. https://doi.org/10.1016/j.biopsych.2008.11.028.
9. Garner AS, Forkey H, Szilagyi M. Translating developmental science to address childhood adversity. Acad Pediatr. 2015;15(5):493-502. https://doi.org/10.1016/j.acap.2015.05.010.
10. Weiss M, Johnson NL, Malin S, Jerofke T, Lang C, Sherburne E. Readiness for discharge in parents of hospitalized children. J Pediatr Nurs. 2008;23(4):282-295. https://doi.org/10.1016/j.pedn.2007.10.005.
11. Shah AN, Beck AF, Sucharew HJ, et al. Parental adverse childhood experiences and resilience on coping after discharge. Pediatrics. 2018;141(4):e20172127. https://doi.org/10.1542/peds.2017-2127.
12. Auger KA, Simmons JM, Tubbs-Cooley HL, et al. Postdischarge nurse home visits and reuse: The Hospital to Home Outcomes (H2O) Trial. Pediatrics. 2018;142(1):e20173919. https://doi.org/10.1542/peds.2017-3919.
13. Auger KA, Shah SS, Tubbs-Cooley HL, et al. Effects of a 1-time nurse-led telephone call after pediatric discharge: the H2O II randomized clinical trial. JAMA Pediatr. 2018;172(9):e181482. https://doi.org/10.1001/jamapediatrics.2018.1482.
14. TheHealthCollaborative. Healthbridge analytics. http://healthcollab.org/hbanalytics/. Accessed August 11, 2017.
15. Auger K, Mueller E, Weinberg S, et al. A validated method for identifying unplanned pediatric readmission. J Pediatr. 2016;170:105-12.e122. https://doi.org10.1016/j.jpeds.2015.11.051.
16. Felitti VJ. Belastungen in der Kindheit und Gesundheit im Erwachsenenalter: die Verwandlung von Gold in Blei [The relationship of adverse childhood experiences to adult health: turning gold into lead]. Z Psychosom Med Psychother. 2002;48(4):359-369. https://doi.org/10.13109/zptm.2002.48.4.359.
17. Smith BW, Dalen J, Wiggins K, Tooley E, Christopher P, Bernard J. The brief resilience scale: assessing the ability to bounce back. Int J Behav Med. 2008;15(3):194-200. https://doi.org/10.1080/10705500802222972.
18. Baker DW, Parker RM, Williams MV, Clark WS. Health literacy and the risk of hospital admission. J Gen Intern Med. 1998;13(12):791-798. https://doi.org/10.1046/j.1525-1497.1998.00242.x.
19. Auger KA, Kahn RS, Simmons JM, et al. Using address information to identify hardships reported by families of children hospitalized with asthma. Acad Pediatr. 2017;17(1):79-87. https://doi.org/10.1016/j.acap.2016.07.003.
20. Auger KA, Kahn RS, Davis MM, Simmons JM. Pediatric asthma readmission: asthma knowledge is not enough? J Pediatr. 2015;166(1):101-108. https://doi.org/10.1016/j.jpeds.2014.07.046.
21. Seid M, Varni JW, Bermudez LO, et al. Parents’ perceptions of primary care: measuring parents’ experiences of pediatric primary care quality. Pediatrics. 2001;108(2):264-270. https://doi:10.1542/peds.108.2.264.
22. Schickedanz A, Halfon N, Sastry N, Chung PJ. Parents’ adverse childhood experiences and their children’s behavioral health problems. Pediatrics. 2018;142(2). https://doi.org/10.1542/peds.2018-0023.
23. Folger AT, Eismann EA, Stephenson NB, et al. Parental adverse childhood experiences and offspring development at 2 years of age. Pediatrics. 2018;141(4):e20172826. https://doi.org/10.1542/peds.2017-2826.
24. O’Malley DM, Randell KA, Dowd MD. Family adversity and resilience measures in pediatric acute care settings. Public Health Nurs. 2016;33(1):3-10. https://doi.org/10.1111/phn.12246.
25. Masten AS. Resilience in developing systems: the promise of integrated approaches. Eur J Dev Psychol. 2016;13(3):297-312. https://doi.org/10.1080/17405629.2016.1147344.
26. Burns-Nader S, Hernandez-Reif M. Facilitating play for hospitalized children through child life services. Child Health Care. 2016;45(1):1-21. https://doi.org/10.1080/02739615.2014.948161.
27. Feudtner C, Haney J, Dimmers MA. Spiritual care needs of hospitalized children and their families: a national survey of pastoral care providers’ perceptions. Pediatrics. 2003;111(1):e67-e72. https://doi.org/10.1542/peds.111.1.e67.
28. Kazak AE, Schneider S, Didonato S, Pai AL. Family psychosocial risk screening guided by the Pediatric Psychosocial Preventative Health Model (PPPHM) using the Psychosocial Assessment Tool (PAT). Acta Oncol. 2015;54(5):574-580. https://doi.org/10.3109/0284186X.2014.995774.
29. Kodish I. Behavioral health care for children who are medically hospitalized. Pediatr Ann. 2018;47(8):e323-e327. https://doi.org/10.3928/19382359-20180705-01.
30. Doupnik SK, Hill D, Palakshappa D, et al. Parent coping support interventions during acute pediatric hospitalizations: a meta-analysis. Pediatrics. 2017;140(3). https://doi.org/10.1542/peds.2016-4171.
31. Hill DL, Carroll KW, Snyder KJG, et al. Development and pilot testing of a coping kit for parents of hospitalized children. Acad Pediatr. 2019;19(4):454-463. https://doi.org/10.1016/j.acap.2018.11.001.
32. Bronner MB, Peek N, Knoester H, Bos AP, Last BF, Grootenhuis MA. Course and predictors of posttraumatic stress disorder in parents after pediatric intensive care treatment of their child. J Pediatr Psychol. 2010;35(9):966-974. https://doi.org/10.1093/jpepsy/jsq004.
33. Bowen EA, Murshid NS. Trauma-informed social policy: a conceptual framework for policy analysis and advocacy. Am J Public Health. 2016;106(2):223-229. https://doi.org/10.2105/AJPH.2015.302970.
34. Substance Abuse and Mental Health Services Administration. SAMHSA’s Concept of Trauma and Guidance for a Trauma-Informed Approach. Rockville, MD: SAMHSA; 2014.
35. Machtinger EL, Cuca YP, Khanna N, Rose CD, Kimberg LS. From treatment to healing: the promise of trauma-informed primary care. Womens Health Issues. 2015;25(3):193-197. https://doi.org/10.1016/j.whi.2015.03.008.
36. Green BL, Saunders PA, Power E, et al. Trauma-informed medical care: patient response to a primary care provider communication training. J Loss Trauma . 2016;21(2):147-159. https://doi.org/10.1080/15325024.2015.1084854.
37. McKay S, Parente V. Health Disparities in the Hospitalized Child. Hosp Pediatr. 2019;9(5):317-325. https://doi.org/10.1542/hpeds.2018-0223.
38. Kerker BD, Storfer-Isser A, Szilagyi M, et al. Do pediatricians ask about adverse childhood experiences in pediatric primary care? Acad Pediatr. 2016;16(2):154-160. https://doi.org/10.1
Adverse Childhood Experiences, or ACEs, include exposure to abuse, neglect, or household dysfunction (eg, having a parent who is mentally ill) as a child.1 Exposure to ACEs affects health into adulthood, with a dose-response relationship between ACEs and a range of comorbidities.1 Adults with 6 or more ACEs have a 20-year shorter life expectancy than do those with no ACEs.1 Still, ACEs are static; once experienced, that experience cannot be undone. However, resilience, or positive adaptation in the context of adversity, can be protective, buffering the negative effects of ACEs.2,3 Protective factors that promote resilience include social capital, such as positive relationships with caregivers and peers.3
With their clear link to health outcomes across the life-course, there is a movement for pediatricians to screen children for ACEs4 and to develop strategies that promote resilience in children, parents, and families. However, screening a child for adversity has challenges because younger children may not have experienced an adverse exposure, or they may be unable to voice their experiences. Studies have demonstrated that parental adversity, or ACEs, may be a marker for childhood adversity.5,6 Biological models also support this potential intergenerational effect of ACEs. Chronic exposure to stress, including ACEs, results in elevated cortisol via a dysregulated hypothalamic-pituitary-adrenal axis, which results in chronic inflammation.7 This “toxic stress” is prolonged, severe in intensity, and can lead to epigenetic changes that may be passed on to the next generation.8,9
Hospitalization of an ill child, and the transition to home after that hospitalization, is a stressful event for children and families.10 This stress may be relevant to parents that have a history of a high rate of ACEs or a current low degree of resilience. Our previous work demonstrated that, in the inpatient setting, parents with high ACEs (≥4) or low resilience have increased coping difficulty 14 days after their child’s hospital discharge.11 Our objective here was to evaluate whether a parent’s ACEs and/or resilience would also be associated with that child’s likelihood of reutilization. We hypothesized that more parental ACEs and/or lower parental resilience would be associated with revisits the emergency room, urgent care, or hospital readmissions.
METHODS
Participants and Study Design
We conducted a prospective cohort study of parents of hospitalized children recruited from the “Hospital-to-Home Outcomes” Studies (H2O I and H2O II).12,13 H2O I and II were prospective, single-center, randomized controlled trials designed to determine the effectiveness of either a nurse-led transitional home visit (H2O I) or telephone call (H2O II) on 30-day unplanned healthcare reutilization. The trials and this study were approved by the Cincinnati Children’s Institutional Review Board. All parents provided written informed consent.
Details of H2O I and II recruitment and design have been described previously.12,13 Briefly, children were eligible for inclusion in either study if they were admitted to our institution’s general Hospital Medicine or the Hospital Medicine Complex Care Services; for H2O I, children hospitalized on the Neurology and Neurosurgery services were also eligible.12,13 Patients were excluded if they were discharged to a residential facility, if they lived outside the home healthcare nurse service area, if they were eligible for skilled home healthcare services (eg, intravenous antibiotics), or if the participating caregiver was non-English speaking.12,13 In H2O I, families were randomized either to receive a single nurse home visit within 96 hours of discharge or standard of care. In H2O II, families enrolled were randomized to receive a telephone call by a nurse within 96 hours of discharge or standard of care. As we have previously published, randomization in both trials successfully balanced the intervention and control arms with respect to key demographic characteristics.12,13 For the analyses presented here, we focused on a subset of caregivers 18 years and older whose children were enrolled in either H2O I or II between August 2015 and October 2016. In both H2O trials, face-to-face and paper-based questionnaires were completed by parents during the index hospitalization.
Outcome and Predictors
Our primary outcome was unanticipated healthcare reutilization defined as return to the emergency room, urgent care, or unplanned readmission within 30 days of hospital discharge, consistent with the H2O trials. This was measured using the primary institution’s administrative data supplemented by a utilization database shared across regional hospitals.14 Readmissions were identified as “unplanned” using a previously validated algorithm,15 and treated as a dichotomous yes/no variable.
Our primary predictors were parental ACEs and resilience (see Appendix Tables). The ACE questionnaire addresses abuse, neglect, and household dysfunction in the first 18 years of life.1 It is composed of 10 questions, each with a yes/no response.1 We defined parents as low (ACE 0), moderate (ACE 1-3), or high (ACE ≥4) risk a priori because previous literature has described poor outcomes in adults with 4 or more ACEs.16
Given the sensitive nature of the questions, respondents independently completed the ACE questionnaire on paper instead of via the face-to-face survey. Respondents returned the completed questionnaire to the research assistant in a sealed envelope. All families received educational information on relevant hospital and community-based resources (eg, social work).
Parental resilience was measured using the Brief Resilience Scale (BRS). The BRS is 6 items, each on a 5-point Likert scale. Responses were averaged, providing a total score of 1-5; higher scores are representative of higher resilience.17 We treated the BRS score as a continuous variable. BRS has been used in clinical settings; it has demonstrated positive correlation with social support and negative correlation with fatigue.17 Parents answered BRS questions during the index pediatric hospitalization in a face-to-face interview.
Parent and Child Characteristics
Parent and child sociodemographic variables were also obtained during the face-to-face interview. Parental variables included age, gender, educational attainment, household income, employment status, and financial and social strain.11 Educational attainment was analyzed in 2 categories—high school or less vs more than high school—because most discharge instructions are written at a high school reading level.18 Parents reported their annual household income in the following categories: <$15,000; $15,000-$29,999; $30,000-$44,999; $45,000-$59,999; $60,000-$89,999; $90,000-$119,999; ≥$120,000. Employment was dichotomized as not employed/student vs any employment. Financial and social strain were assessed using a series of 9 previously described questions.19 These questions assessed, via self-report, a family’s ability to make ends meet, ability to pay rent/mortgage or utilities, need to move in with others because of financial reasons, and ability to borrow money if needed, as well as home ownership and parental marital status.15,19 Strain questions were all dichotomous (yes/no, single/not single). A composite variable was then constructed that categorized those reporting no strain items, 1 to 2 items, 3 to 4 items, and 5 or more items.20
Child variables included race, ethnicity, age, primary care access,21 payer, and H2O treatment arm. Race categories were white/Caucasian, black/African American, American Indian or Alaskan Native, Asian or Pacific Islander, and other; ethnicity categories were Hispanic/Latino, non-Hispanic/Latino, and unknown. Given relatively low numbers of children reported to be Hispanic/Latino, we combined race and ethnicity into a single variable, categorized as non-Hispanic/white, non-Hispanic/black, and multiracial/Hispanic/other. Primary care access was assessed using the access subscale to the Parent’s Perception of Primary Care questionnaire. This includes assessment of a family’s ability to travel to their doctor, to see their doctor for routine or sick care, and to get help or advice on evenings or weekends. Scores were categorized as always adequate, almost always adequate, or sometimes/never adequate.21 Payer was dichotomized to private or public/self-pay.
Statistical Analyses
We examined the distribution of outcomes, predictors, and covariates. We compared sociodemographic characteristics of those respondents and nonrespondents to the ACE screen using the chi-square test for categorical variables or the t test for continuous variables. We used logistic regression to assess for associations between the independent variables of interest and reutilization, adjusting for potential confounders. To build our adjusted, multivariable model, we decided a priori to include child race/ethnicity, primary care access, financial and social strain, and trial treatment arm. We treated the H2O I control group as the referent group. Other covariates considered for inclusion were caregiver education, household income, employment, and payer. These were included in multivariable models if bivariate associations were significant at the P < .1 level. We assessed an ACE-by-resilience interaction term because we hypothesized that those with more ACEs and lower resilience may have more reutilization outcomes than parents with fewer ACEs and higher resilience. We also evaluated interaction terms between trial arm assignment and predictors to assess effects that may be introduced by the randomization. Predictors in the final logistic regression model were significant at the P < .05 level. Logistic regression assumption of little or no multicollinearity among the independent variables was verified in the final models. All analyses were performed with Stata v16 (Stata Corp, College Station, Texas).
RESULTS
There were a total of 1,787 parent-child dyads enrolled in the H2O I and II during the study period; 1,320 parents (74%) completed the ACE questionnaire and were included the analysis. Included parents were primarily female and employed, as well as educated beyond high school (Table 1). Overall, 64% reported one or more ACEs (range 0 to 9); 45% reported 1to 3, and 19% reported 4 or more ACEs. The most commonly reported ACEs were divorce (n = 573, 43%), exposure to alcoholism (n = 306, 23%), and exposure to mental illness (n = 281, 21%; Figure 1). Parents had a mean BRS score of 3.97 (range 1.17-5.00), with the distribution shown in Figure 2.
Of the 1,320 included patients, the average length of stay was 2.5 days, and 82% of hospitalizations were caused by acute medical issues (eg, bronchiolitis). A total of 211 children experienced a reutilization event within 30 days of discharge. In bivariate analysis, children with parents with 4 or more ACEs had a 2.02-times (95% CI 1.35-3.02) higher odds of experiencing a reutilization event than did those with parents reporting no ACEs. Parents with higher resilience scores had children with a lower odds of reutilization (odds ratio [OR] 0.77 95% CI 0.63-0.95).
In addition to our a priori variables, parental education, employment, and insurance met our significance threshold for inclusion in the multivariable model. The ACE-by-resilience interaction term was not significant and not included in the model. Similarly, there was no significant interaction between ACE and resilience and H2O treatment arm; the interaction terms were not included in the final adjusted model, but treatment arm assignment was kept as a covariate. A total of 1,292 children, out of the 1,320 respondents, remained in the final multivariable model; the excluded 28 had incomplete covariate data but were not otherwise different. In this final adjusted model, children with parents reporting 4 or more ACEs had a 1.69-times (95% CI 1.11-2.60) greater odds of reutilization than did those with parents reporting no ACEs (Table 2). Resilience failed to reach statistical significance in the adjusted model (OR 0.86, 95% CI 0.70-1.07).
DISCUSSION
We found that high-risk parents (4 or more ACEs) had children with an increased odds of healthcare reutilization, suggesting intergenerational effects of ACEs. We did not find a similar effect relating to parental resilience. We also did not find an interaction between parental ACEs and resilience, suggesting that a parent’s reported degree of resilience does not modify the effect of ACEs on reutilization risk.
Parental adversity may be a risk factor for a child’s unanticipated reutilization. We previously demonstrated that parents with 4 or more ACEs have more coping difficulty than a parent with no ACEs after a child’s hospitalization.11 It is possible that parents with high adversity may have poorer coping mechanisms when dealing with a stressful situation, such as a child’s hospitalization. This may have resulted in inequitable outcomes (eg, increased reutilization) for their children. Other studies have confirmed such an intergenerational effect of adversity, linking a parent’s ACEs with poor developmental, behavioral, and health outcomes in their children.6,22,23 O’Malley et al showed an association of parental ACEs to current adversities,24 such as insurance or housing concerns, that affect the entirety of the household, including children. In short, it appears that parental ACEs may be a compelling predictor of current childhood adversity.
Resilience buffers the negative effects of ACEs; however, we did not find significant associations between resilience and reutilization or an interaction between ACEs and resilience. The factors that may contribute to reutilization are complex. In our previous work, parental resilience was associated with coping difficulty after discharge; but again, did not interact with parental ACEs.11 Here, we suggest that while resilience may buffer the negative effects of ACEs, that buffering may not affect the likelihood of reutilization. It is also possible that the BRS tool is of less relevance on how one handles the stress of a child’s hospitalization. While the BRS is one measure of resilience, there are many other relevant constructs to resilience, such as connection to social supports, that also may also contribute to risk of reutilization.25
Reducing the stress of a hospitalization itself and promoting a safe transition from hospital to home is critical to improving child health outcomes. Our data here, and in our previous work, demonstrate that a history of adversity and one’s current coping ability may drive a parent’s response to a child’s hospitalization and affect their capacity to care for that child after hospital discharge.11 Additional in-hospital supports like child life, behavioral health, or pastoral care could reduce the stress of the hospitalization while also building positive coping mechanisms.26-29 A meta-analysis demonstrated that such coping interventions can help alleviate the stress of a hospitalization.30 Hill et al demonstrated successful stress reduction in parents of hospitalized children using a “Coping Kit for Parents.”31 Further studies are warranted to understand which interventions are most effective for children and families and whether they could be more effectively deployed if the inpatient team knew more about parental ACEs.
Screening for parental ACEs could help to identify patients at highest risk for a poor transition to home. Therefore, screening for parental adversity in clinical settings, including inpatient settings, may be relevant and valuable.32 Additionally, by recognizing the high prevalence of ACEs in an inpatient setting, hospitals and healthcare organizations could be motivated to develop and enact trauma-informed approaches. A trauma-informed care approach recognizes the intersection of trauma with health and social problems. With this recognition, care teams can more sensitively address the trauma as they provide relevant services.33 Trauma-informed care is a secondary public health prevention approach that would help team members identify the prevalence and effects of trauma via screening, recognize the signs of a maladaptive response to stress, and respond by integrating awareness of trauma into practice management.28,34 Both the National Academy of Medicine and the Agency for Healthcare Research and Quality have called for such a trauma-informed approach in primary care.35 In response, many healthcare organizations have developed trauma-informed practices to better address the needs of the populations they serve. For example, provider training on this approach has led to improved rapport in patient-provider relationships.36
Although ACE awareness is a component of trauma-informed care, there are still limitations of the original ACE questionnaire developed by Felitti et al. The existing tool is not inclusive of all adversities a parent or child may face. Moreover, its focus is on past exposures and experiences and not current health-related social needs (eg, food insecurity) which have known linkages with a range of health outcomes and health disparities.37 Additionally, the original ACE questionnaire was created as a population level tool and not as a screening tool. If used as a screening tool, providers may view the questions as too sensitive to ask, and parents may have difficulty responding to and understanding the relevance to their child’s care. Therefore, we suggest that more evidence is required to understand how to best adapt ACE questions into a screening processes that may be implemented in a medical setting.
More evidence is also needed to determine when and where such screening may be most useful. A primary care provider would be best equipped to screen caregivers for ACEs given their established relationship with parents and patients. Given the potential relevance of such information for inpatient care provision, information could then flow from primary care to the inpatient team. However, because not all patients have established primary care providers and only 4% of pediatricians screen for ACEs,38 it is important for inpatient medical teams to understand their role in identifying and addressing ACEs during hospital stays. Development of a screening tool, with input from all stakeholders—including parents—that is valid and feasible for use in a pediatric inpatient setting would be an important step forward. This tool should be paired with training in how to discuss these topics in a trauma-informed, nonjudgmental, empathic manner. We see this as a way in which providers can more effectively elicit an accurate response while simultaneously educating parents on the relevance of such sensitive topics during an acute hospital stay. We also recommend that screening should always be paired with response capabilities that connect those who screen positive with resources that could help them to navigate the stress experienced during and after a child’s hospitalization. Furthermore, communication with primary care providers about parents that screen positive should be integrated into the transition process.
This work has several limitations. First, our study was a part of randomized controlled trials conducted in one academic setting, which thereby limits generalizability. For example, we limited our cohort to those who were English-speaking patients only. This may bias our results because respondents with limited English proficiency may have different risk profiles than their English-speaking peers. In addition, the administration of the both the ACE and resilience questionnaires occurred during an acutely stressful period, which may influence how a parent responds to these questions. Also, both of the surveys are self-reported by parents, which may be susceptible to memory and response biases. Relatedly, we had a high number of nonrespondents, particularly to the ACE questionnaire. Our results are therefore only relevant to those who chose to respond and cannot be applied to nonrespondents. Further work assessing why one does or does not respond to such sensitive questions is an important area for future inquiry. Lastly, our cohort had limited medical complexity; future studies may consider links between parental ACEs (and resilience) and morbidity experienced by children with medical complexity.
CONCLUSION
Parents history of adversity is linked to their children’s unanticipated healthcare reutilization after a hospital discharge. Screening for parental stressors during a hospitalization may be an important first step to connecting parents and children to evidence-based interventions capable of mitigating the stress of hospitalization and promoting better, more seamless transitions from hospital to home.
Acknowledgments
Group Members: The following H2O members are nonauthor contributors: JoAnne Bachus, BSN, RN; Monica Borell, BSN, RN; Lenisa V Chang, MA, PhD; Patricia Crawford, RN; Sarah Ferris, BA; Jennifer Gold, BSN, RN; Judy A Heilman, BSN, RN; Jane C Khoury, PhD; Pierce Kuhnell, MS; Karen Lawley, BSN, RN; Margo Moore, MS, BSN, RN; Lynne O’Donnell, BSN, RN; Sarah Riddle, MD; Susan N Sherman, DPA; Angela M Statile, MD, MEd; Karen P Sullivan, BSN, RN; Heather Tubbs-Cooley, PhD, RN; Susan Wade-Murphy, MSN, RN; and Christine M White, MD, MAT.
The authors also thank David Keller, MD, for his guidance on the study.
Disclosures
The authors have no financial relationships or conflicts of interest relevant to this article to disclose.
Funding Source
Supported by funds from the Academic Pediatric Young Investigator Award (Dr A Shah) and the Patient-Centered Outcomes Research Institute Award (IHS-1306-0081, to Dr K Auger, Dr S Shah, Dr H Sucharew, Dr J Simmons), the National Institutes of Health (1K23AI112916, to Dr AF Beck), and the Agency for Healthcare Research and Quality (1K12HS026393-01, to Dr A Shah, K08-HS024735- 01A1, to Dr K Auger). Dr J Haney received Summer Undergraduate Research Fellowship funding through the Summer Undergraduate Research Fellowship at Cincinnati Children’s Hospital Medical Center.
Disclaimer
All statements in this report, including findings and conclusions, are solely those of the authors and do not necessarily represent the views of the Patient-Centered Outcomes Research Institute, its Board of Governors, or the Methodology Committee.
Adverse Childhood Experiences, or ACEs, include exposure to abuse, neglect, or household dysfunction (eg, having a parent who is mentally ill) as a child.1 Exposure to ACEs affects health into adulthood, with a dose-response relationship between ACEs and a range of comorbidities.1 Adults with 6 or more ACEs have a 20-year shorter life expectancy than do those with no ACEs.1 Still, ACEs are static; once experienced, that experience cannot be undone. However, resilience, or positive adaptation in the context of adversity, can be protective, buffering the negative effects of ACEs.2,3 Protective factors that promote resilience include social capital, such as positive relationships with caregivers and peers.3
With their clear link to health outcomes across the life-course, there is a movement for pediatricians to screen children for ACEs4 and to develop strategies that promote resilience in children, parents, and families. However, screening a child for adversity has challenges because younger children may not have experienced an adverse exposure, or they may be unable to voice their experiences. Studies have demonstrated that parental adversity, or ACEs, may be a marker for childhood adversity.5,6 Biological models also support this potential intergenerational effect of ACEs. Chronic exposure to stress, including ACEs, results in elevated cortisol via a dysregulated hypothalamic-pituitary-adrenal axis, which results in chronic inflammation.7 This “toxic stress” is prolonged, severe in intensity, and can lead to epigenetic changes that may be passed on to the next generation.8,9
Hospitalization of an ill child, and the transition to home after that hospitalization, is a stressful event for children and families.10 This stress may be relevant to parents that have a history of a high rate of ACEs or a current low degree of resilience. Our previous work demonstrated that, in the inpatient setting, parents with high ACEs (≥4) or low resilience have increased coping difficulty 14 days after their child’s hospital discharge.11 Our objective here was to evaluate whether a parent’s ACEs and/or resilience would also be associated with that child’s likelihood of reutilization. We hypothesized that more parental ACEs and/or lower parental resilience would be associated with revisits the emergency room, urgent care, or hospital readmissions.
METHODS
Participants and Study Design
We conducted a prospective cohort study of parents of hospitalized children recruited from the “Hospital-to-Home Outcomes” Studies (H2O I and H2O II).12,13 H2O I and II were prospective, single-center, randomized controlled trials designed to determine the effectiveness of either a nurse-led transitional home visit (H2O I) or telephone call (H2O II) on 30-day unplanned healthcare reutilization. The trials and this study were approved by the Cincinnati Children’s Institutional Review Board. All parents provided written informed consent.
Details of H2O I and II recruitment and design have been described previously.12,13 Briefly, children were eligible for inclusion in either study if they were admitted to our institution’s general Hospital Medicine or the Hospital Medicine Complex Care Services; for H2O I, children hospitalized on the Neurology and Neurosurgery services were also eligible.12,13 Patients were excluded if they were discharged to a residential facility, if they lived outside the home healthcare nurse service area, if they were eligible for skilled home healthcare services (eg, intravenous antibiotics), or if the participating caregiver was non-English speaking.12,13 In H2O I, families were randomized either to receive a single nurse home visit within 96 hours of discharge or standard of care. In H2O II, families enrolled were randomized to receive a telephone call by a nurse within 96 hours of discharge or standard of care. As we have previously published, randomization in both trials successfully balanced the intervention and control arms with respect to key demographic characteristics.12,13 For the analyses presented here, we focused on a subset of caregivers 18 years and older whose children were enrolled in either H2O I or II between August 2015 and October 2016. In both H2O trials, face-to-face and paper-based questionnaires were completed by parents during the index hospitalization.
Outcome and Predictors
Our primary outcome was unanticipated healthcare reutilization defined as return to the emergency room, urgent care, or unplanned readmission within 30 days of hospital discharge, consistent with the H2O trials. This was measured using the primary institution’s administrative data supplemented by a utilization database shared across regional hospitals.14 Readmissions were identified as “unplanned” using a previously validated algorithm,15 and treated as a dichotomous yes/no variable.
Our primary predictors were parental ACEs and resilience (see Appendix Tables). The ACE questionnaire addresses abuse, neglect, and household dysfunction in the first 18 years of life.1 It is composed of 10 questions, each with a yes/no response.1 We defined parents as low (ACE 0), moderate (ACE 1-3), or high (ACE ≥4) risk a priori because previous literature has described poor outcomes in adults with 4 or more ACEs.16
Given the sensitive nature of the questions, respondents independently completed the ACE questionnaire on paper instead of via the face-to-face survey. Respondents returned the completed questionnaire to the research assistant in a sealed envelope. All families received educational information on relevant hospital and community-based resources (eg, social work).
Parental resilience was measured using the Brief Resilience Scale (BRS). The BRS is 6 items, each on a 5-point Likert scale. Responses were averaged, providing a total score of 1-5; higher scores are representative of higher resilience.17 We treated the BRS score as a continuous variable. BRS has been used in clinical settings; it has demonstrated positive correlation with social support and negative correlation with fatigue.17 Parents answered BRS questions during the index pediatric hospitalization in a face-to-face interview.
Parent and Child Characteristics
Parent and child sociodemographic variables were also obtained during the face-to-face interview. Parental variables included age, gender, educational attainment, household income, employment status, and financial and social strain.11 Educational attainment was analyzed in 2 categories—high school or less vs more than high school—because most discharge instructions are written at a high school reading level.18 Parents reported their annual household income in the following categories: <$15,000; $15,000-$29,999; $30,000-$44,999; $45,000-$59,999; $60,000-$89,999; $90,000-$119,999; ≥$120,000. Employment was dichotomized as not employed/student vs any employment. Financial and social strain were assessed using a series of 9 previously described questions.19 These questions assessed, via self-report, a family’s ability to make ends meet, ability to pay rent/mortgage or utilities, need to move in with others because of financial reasons, and ability to borrow money if needed, as well as home ownership and parental marital status.15,19 Strain questions were all dichotomous (yes/no, single/not single). A composite variable was then constructed that categorized those reporting no strain items, 1 to 2 items, 3 to 4 items, and 5 or more items.20
Child variables included race, ethnicity, age, primary care access,21 payer, and H2O treatment arm. Race categories were white/Caucasian, black/African American, American Indian or Alaskan Native, Asian or Pacific Islander, and other; ethnicity categories were Hispanic/Latino, non-Hispanic/Latino, and unknown. Given relatively low numbers of children reported to be Hispanic/Latino, we combined race and ethnicity into a single variable, categorized as non-Hispanic/white, non-Hispanic/black, and multiracial/Hispanic/other. Primary care access was assessed using the access subscale to the Parent’s Perception of Primary Care questionnaire. This includes assessment of a family’s ability to travel to their doctor, to see their doctor for routine or sick care, and to get help or advice on evenings or weekends. Scores were categorized as always adequate, almost always adequate, or sometimes/never adequate.21 Payer was dichotomized to private or public/self-pay.
Statistical Analyses
We examined the distribution of outcomes, predictors, and covariates. We compared sociodemographic characteristics of those respondents and nonrespondents to the ACE screen using the chi-square test for categorical variables or the t test for continuous variables. We used logistic regression to assess for associations between the independent variables of interest and reutilization, adjusting for potential confounders. To build our adjusted, multivariable model, we decided a priori to include child race/ethnicity, primary care access, financial and social strain, and trial treatment arm. We treated the H2O I control group as the referent group. Other covariates considered for inclusion were caregiver education, household income, employment, and payer. These were included in multivariable models if bivariate associations were significant at the P < .1 level. We assessed an ACE-by-resilience interaction term because we hypothesized that those with more ACEs and lower resilience may have more reutilization outcomes than parents with fewer ACEs and higher resilience. We also evaluated interaction terms between trial arm assignment and predictors to assess effects that may be introduced by the randomization. Predictors in the final logistic regression model were significant at the P < .05 level. Logistic regression assumption of little or no multicollinearity among the independent variables was verified in the final models. All analyses were performed with Stata v16 (Stata Corp, College Station, Texas).
RESULTS
There were a total of 1,787 parent-child dyads enrolled in the H2O I and II during the study period; 1,320 parents (74%) completed the ACE questionnaire and were included the analysis. Included parents were primarily female and employed, as well as educated beyond high school (Table 1). Overall, 64% reported one or more ACEs (range 0 to 9); 45% reported 1to 3, and 19% reported 4 or more ACEs. The most commonly reported ACEs were divorce (n = 573, 43%), exposure to alcoholism (n = 306, 23%), and exposure to mental illness (n = 281, 21%; Figure 1). Parents had a mean BRS score of 3.97 (range 1.17-5.00), with the distribution shown in Figure 2.
Of the 1,320 included patients, the average length of stay was 2.5 days, and 82% of hospitalizations were caused by acute medical issues (eg, bronchiolitis). A total of 211 children experienced a reutilization event within 30 days of discharge. In bivariate analysis, children with parents with 4 or more ACEs had a 2.02-times (95% CI 1.35-3.02) higher odds of experiencing a reutilization event than did those with parents reporting no ACEs. Parents with higher resilience scores had children with a lower odds of reutilization (odds ratio [OR] 0.77 95% CI 0.63-0.95).
In addition to our a priori variables, parental education, employment, and insurance met our significance threshold for inclusion in the multivariable model. The ACE-by-resilience interaction term was not significant and not included in the model. Similarly, there was no significant interaction between ACE and resilience and H2O treatment arm; the interaction terms were not included in the final adjusted model, but treatment arm assignment was kept as a covariate. A total of 1,292 children, out of the 1,320 respondents, remained in the final multivariable model; the excluded 28 had incomplete covariate data but were not otherwise different. In this final adjusted model, children with parents reporting 4 or more ACEs had a 1.69-times (95% CI 1.11-2.60) greater odds of reutilization than did those with parents reporting no ACEs (Table 2). Resilience failed to reach statistical significance in the adjusted model (OR 0.86, 95% CI 0.70-1.07).
DISCUSSION
We found that high-risk parents (4 or more ACEs) had children with an increased odds of healthcare reutilization, suggesting intergenerational effects of ACEs. We did not find a similar effect relating to parental resilience. We also did not find an interaction between parental ACEs and resilience, suggesting that a parent’s reported degree of resilience does not modify the effect of ACEs on reutilization risk.
Parental adversity may be a risk factor for a child’s unanticipated reutilization. We previously demonstrated that parents with 4 or more ACEs have more coping difficulty than a parent with no ACEs after a child’s hospitalization.11 It is possible that parents with high adversity may have poorer coping mechanisms when dealing with a stressful situation, such as a child’s hospitalization. This may have resulted in inequitable outcomes (eg, increased reutilization) for their children. Other studies have confirmed such an intergenerational effect of adversity, linking a parent’s ACEs with poor developmental, behavioral, and health outcomes in their children.6,22,23 O’Malley et al showed an association of parental ACEs to current adversities,24 such as insurance or housing concerns, that affect the entirety of the household, including children. In short, it appears that parental ACEs may be a compelling predictor of current childhood adversity.
Resilience buffers the negative effects of ACEs; however, we did not find significant associations between resilience and reutilization or an interaction between ACEs and resilience. The factors that may contribute to reutilization are complex. In our previous work, parental resilience was associated with coping difficulty after discharge; but again, did not interact with parental ACEs.11 Here, we suggest that while resilience may buffer the negative effects of ACEs, that buffering may not affect the likelihood of reutilization. It is also possible that the BRS tool is of less relevance on how one handles the stress of a child’s hospitalization. While the BRS is one measure of resilience, there are many other relevant constructs to resilience, such as connection to social supports, that also may also contribute to risk of reutilization.25
Reducing the stress of a hospitalization itself and promoting a safe transition from hospital to home is critical to improving child health outcomes. Our data here, and in our previous work, demonstrate that a history of adversity and one’s current coping ability may drive a parent’s response to a child’s hospitalization and affect their capacity to care for that child after hospital discharge.11 Additional in-hospital supports like child life, behavioral health, or pastoral care could reduce the stress of the hospitalization while also building positive coping mechanisms.26-29 A meta-analysis demonstrated that such coping interventions can help alleviate the stress of a hospitalization.30 Hill et al demonstrated successful stress reduction in parents of hospitalized children using a “Coping Kit for Parents.”31 Further studies are warranted to understand which interventions are most effective for children and families and whether they could be more effectively deployed if the inpatient team knew more about parental ACEs.
Screening for parental ACEs could help to identify patients at highest risk for a poor transition to home. Therefore, screening for parental adversity in clinical settings, including inpatient settings, may be relevant and valuable.32 Additionally, by recognizing the high prevalence of ACEs in an inpatient setting, hospitals and healthcare organizations could be motivated to develop and enact trauma-informed approaches. A trauma-informed care approach recognizes the intersection of trauma with health and social problems. With this recognition, care teams can more sensitively address the trauma as they provide relevant services.33 Trauma-informed care is a secondary public health prevention approach that would help team members identify the prevalence and effects of trauma via screening, recognize the signs of a maladaptive response to stress, and respond by integrating awareness of trauma into practice management.28,34 Both the National Academy of Medicine and the Agency for Healthcare Research and Quality have called for such a trauma-informed approach in primary care.35 In response, many healthcare organizations have developed trauma-informed practices to better address the needs of the populations they serve. For example, provider training on this approach has led to improved rapport in patient-provider relationships.36
Although ACE awareness is a component of trauma-informed care, there are still limitations of the original ACE questionnaire developed by Felitti et al. The existing tool is not inclusive of all adversities a parent or child may face. Moreover, its focus is on past exposures and experiences and not current health-related social needs (eg, food insecurity) which have known linkages with a range of health outcomes and health disparities.37 Additionally, the original ACE questionnaire was created as a population level tool and not as a screening tool. If used as a screening tool, providers may view the questions as too sensitive to ask, and parents may have difficulty responding to and understanding the relevance to their child’s care. Therefore, we suggest that more evidence is required to understand how to best adapt ACE questions into a screening processes that may be implemented in a medical setting.
More evidence is also needed to determine when and where such screening may be most useful. A primary care provider would be best equipped to screen caregivers for ACEs given their established relationship with parents and patients. Given the potential relevance of such information for inpatient care provision, information could then flow from primary care to the inpatient team. However, because not all patients have established primary care providers and only 4% of pediatricians screen for ACEs,38 it is important for inpatient medical teams to understand their role in identifying and addressing ACEs during hospital stays. Development of a screening tool, with input from all stakeholders—including parents—that is valid and feasible for use in a pediatric inpatient setting would be an important step forward. This tool should be paired with training in how to discuss these topics in a trauma-informed, nonjudgmental, empathic manner. We see this as a way in which providers can more effectively elicit an accurate response while simultaneously educating parents on the relevance of such sensitive topics during an acute hospital stay. We also recommend that screening should always be paired with response capabilities that connect those who screen positive with resources that could help them to navigate the stress experienced during and after a child’s hospitalization. Furthermore, communication with primary care providers about parents that screen positive should be integrated into the transition process.
This work has several limitations. First, our study was a part of randomized controlled trials conducted in one academic setting, which thereby limits generalizability. For example, we limited our cohort to those who were English-speaking patients only. This may bias our results because respondents with limited English proficiency may have different risk profiles than their English-speaking peers. In addition, the administration of the both the ACE and resilience questionnaires occurred during an acutely stressful period, which may influence how a parent responds to these questions. Also, both of the surveys are self-reported by parents, which may be susceptible to memory and response biases. Relatedly, we had a high number of nonrespondents, particularly to the ACE questionnaire. Our results are therefore only relevant to those who chose to respond and cannot be applied to nonrespondents. Further work assessing why one does or does not respond to such sensitive questions is an important area for future inquiry. Lastly, our cohort had limited medical complexity; future studies may consider links between parental ACEs (and resilience) and morbidity experienced by children with medical complexity.
CONCLUSION
Parents history of adversity is linked to their children’s unanticipated healthcare reutilization after a hospital discharge. Screening for parental stressors during a hospitalization may be an important first step to connecting parents and children to evidence-based interventions capable of mitigating the stress of hospitalization and promoting better, more seamless transitions from hospital to home.
Acknowledgments
Group Members: The following H2O members are nonauthor contributors: JoAnne Bachus, BSN, RN; Monica Borell, BSN, RN; Lenisa V Chang, MA, PhD; Patricia Crawford, RN; Sarah Ferris, BA; Jennifer Gold, BSN, RN; Judy A Heilman, BSN, RN; Jane C Khoury, PhD; Pierce Kuhnell, MS; Karen Lawley, BSN, RN; Margo Moore, MS, BSN, RN; Lynne O’Donnell, BSN, RN; Sarah Riddle, MD; Susan N Sherman, DPA; Angela M Statile, MD, MEd; Karen P Sullivan, BSN, RN; Heather Tubbs-Cooley, PhD, RN; Susan Wade-Murphy, MSN, RN; and Christine M White, MD, MAT.
The authors also thank David Keller, MD, for his guidance on the study.
Disclosures
The authors have no financial relationships or conflicts of interest relevant to this article to disclose.
Funding Source
Supported by funds from the Academic Pediatric Young Investigator Award (Dr A Shah) and the Patient-Centered Outcomes Research Institute Award (IHS-1306-0081, to Dr K Auger, Dr S Shah, Dr H Sucharew, Dr J Simmons), the National Institutes of Health (1K23AI112916, to Dr AF Beck), and the Agency for Healthcare Research and Quality (1K12HS026393-01, to Dr A Shah, K08-HS024735- 01A1, to Dr K Auger). Dr J Haney received Summer Undergraduate Research Fellowship funding through the Summer Undergraduate Research Fellowship at Cincinnati Children’s Hospital Medical Center.
Disclaimer
All statements in this report, including findings and conclusions, are solely those of the authors and do not necessarily represent the views of the Patient-Centered Outcomes Research Institute, its Board of Governors, or the Methodology Committee.
1. Felitti VJ, Anda RF, Nordenberg D, et al. Relationship of childhood abuse and household dysfunction to many of the leading causes of death in adults. The Adverse Childhood Experiences (ACE) Study. Am J Prev Med. 1998;14(4):245-258. https://doi.org/10.1016/s0749-3797(98)00017-8.
2. Bethell CD, Newacheck P, Hawes E, Halfon N. Adverse childhood experiences: assessing the impact on health and school engagement and the mitigating role of resilience. Health Aff. 2014;33(12):2106-2115. https://doi.org/10.1377/hlthaff.2014.0914.
3. Masten AS. Ordinary Magic. Resilience processes in development. Am Psychol. 2001;56(3):227-238. https://doi.org/10.1037//0003-066x.56.3.227.
4. Garner AS, Shonkoff JP, Committee on Psychosocial Aspects of C, et al. Early childhood adversity, toxic stress, and the role of the pediatrician: translating developmental science into lifelong health. Pediatrics. 2012;129(1):e224-231. https://doi.org/10.1542/peds.2011-2662.
5. Randell KA, O’Malley D, Dowd MD. Association of parental adverse childhood experiences and current child adversity. JAMA Pediatrics. 2015;169(8):786-787. https://doi.org/10.1001/jamapediatrics.2015.0269.
6. Le-Scherban F, Wang X, Boyle-Steed KH, Pachter LM. Intergenerational associations of parent adverse childhood experiences and child health outcomes. Pediatrics. 2018;141(6):e20174274. https://doi.org/10.1542/peds.2017-4274.
7. Johnson SB, Riley AW, Granger DA, Riis J. The science of early life toxic stress for pediatric practice and advocacy. Pediatrics. 2013;131(2):319-327. https://doi.org/10.1542/peds.2012-0469.
8. Roth TL, Lubin FD, Funk AJ, Sweatt JD. Lasting epigenetic influence of early-life adversity on the BDNF gene. Biol Psychiatry. 2009;65(9):760-769. https://doi.org/10.1016/j.biopsych.2008.11.028.
9. Garner AS, Forkey H, Szilagyi M. Translating developmental science to address childhood adversity. Acad Pediatr. 2015;15(5):493-502. https://doi.org/10.1016/j.acap.2015.05.010.
10. Weiss M, Johnson NL, Malin S, Jerofke T, Lang C, Sherburne E. Readiness for discharge in parents of hospitalized children. J Pediatr Nurs. 2008;23(4):282-295. https://doi.org/10.1016/j.pedn.2007.10.005.
11. Shah AN, Beck AF, Sucharew HJ, et al. Parental adverse childhood experiences and resilience on coping after discharge. Pediatrics. 2018;141(4):e20172127. https://doi.org/10.1542/peds.2017-2127.
12. Auger KA, Simmons JM, Tubbs-Cooley HL, et al. Postdischarge nurse home visits and reuse: The Hospital to Home Outcomes (H2O) Trial. Pediatrics. 2018;142(1):e20173919. https://doi.org/10.1542/peds.2017-3919.
13. Auger KA, Shah SS, Tubbs-Cooley HL, et al. Effects of a 1-time nurse-led telephone call after pediatric discharge: the H2O II randomized clinical trial. JAMA Pediatr. 2018;172(9):e181482. https://doi.org/10.1001/jamapediatrics.2018.1482.
14. TheHealthCollaborative. Healthbridge analytics. http://healthcollab.org/hbanalytics/. Accessed August 11, 2017.
15. Auger K, Mueller E, Weinberg S, et al. A validated method for identifying unplanned pediatric readmission. J Pediatr. 2016;170:105-12.e122. https://doi.org10.1016/j.jpeds.2015.11.051.
16. Felitti VJ. Belastungen in der Kindheit und Gesundheit im Erwachsenenalter: die Verwandlung von Gold in Blei [The relationship of adverse childhood experiences to adult health: turning gold into lead]. Z Psychosom Med Psychother. 2002;48(4):359-369. https://doi.org/10.13109/zptm.2002.48.4.359.
17. Smith BW, Dalen J, Wiggins K, Tooley E, Christopher P, Bernard J. The brief resilience scale: assessing the ability to bounce back. Int J Behav Med. 2008;15(3):194-200. https://doi.org/10.1080/10705500802222972.
18. Baker DW, Parker RM, Williams MV, Clark WS. Health literacy and the risk of hospital admission. J Gen Intern Med. 1998;13(12):791-798. https://doi.org/10.1046/j.1525-1497.1998.00242.x.
19. Auger KA, Kahn RS, Simmons JM, et al. Using address information to identify hardships reported by families of children hospitalized with asthma. Acad Pediatr. 2017;17(1):79-87. https://doi.org/10.1016/j.acap.2016.07.003.
20. Auger KA, Kahn RS, Davis MM, Simmons JM. Pediatric asthma readmission: asthma knowledge is not enough? J Pediatr. 2015;166(1):101-108. https://doi.org/10.1016/j.jpeds.2014.07.046.
21. Seid M, Varni JW, Bermudez LO, et al. Parents’ perceptions of primary care: measuring parents’ experiences of pediatric primary care quality. Pediatrics. 2001;108(2):264-270. https://doi:10.1542/peds.108.2.264.
22. Schickedanz A, Halfon N, Sastry N, Chung PJ. Parents’ adverse childhood experiences and their children’s behavioral health problems. Pediatrics. 2018;142(2). https://doi.org/10.1542/peds.2018-0023.
23. Folger AT, Eismann EA, Stephenson NB, et al. Parental adverse childhood experiences and offspring development at 2 years of age. Pediatrics. 2018;141(4):e20172826. https://doi.org/10.1542/peds.2017-2826.
24. O’Malley DM, Randell KA, Dowd MD. Family adversity and resilience measures in pediatric acute care settings. Public Health Nurs. 2016;33(1):3-10. https://doi.org/10.1111/phn.12246.
25. Masten AS. Resilience in developing systems: the promise of integrated approaches. Eur J Dev Psychol. 2016;13(3):297-312. https://doi.org/10.1080/17405629.2016.1147344.
26. Burns-Nader S, Hernandez-Reif M. Facilitating play for hospitalized children through child life services. Child Health Care. 2016;45(1):1-21. https://doi.org/10.1080/02739615.2014.948161.
27. Feudtner C, Haney J, Dimmers MA. Spiritual care needs of hospitalized children and their families: a national survey of pastoral care providers’ perceptions. Pediatrics. 2003;111(1):e67-e72. https://doi.org/10.1542/peds.111.1.e67.
28. Kazak AE, Schneider S, Didonato S, Pai AL. Family psychosocial risk screening guided by the Pediatric Psychosocial Preventative Health Model (PPPHM) using the Psychosocial Assessment Tool (PAT). Acta Oncol. 2015;54(5):574-580. https://doi.org/10.3109/0284186X.2014.995774.
29. Kodish I. Behavioral health care for children who are medically hospitalized. Pediatr Ann. 2018;47(8):e323-e327. https://doi.org/10.3928/19382359-20180705-01.
30. Doupnik SK, Hill D, Palakshappa D, et al. Parent coping support interventions during acute pediatric hospitalizations: a meta-analysis. Pediatrics. 2017;140(3). https://doi.org/10.1542/peds.2016-4171.
31. Hill DL, Carroll KW, Snyder KJG, et al. Development and pilot testing of a coping kit for parents of hospitalized children. Acad Pediatr. 2019;19(4):454-463. https://doi.org/10.1016/j.acap.2018.11.001.
32. Bronner MB, Peek N, Knoester H, Bos AP, Last BF, Grootenhuis MA. Course and predictors of posttraumatic stress disorder in parents after pediatric intensive care treatment of their child. J Pediatr Psychol. 2010;35(9):966-974. https://doi.org/10.1093/jpepsy/jsq004.
33. Bowen EA, Murshid NS. Trauma-informed social policy: a conceptual framework for policy analysis and advocacy. Am J Public Health. 2016;106(2):223-229. https://doi.org/10.2105/AJPH.2015.302970.
34. Substance Abuse and Mental Health Services Administration. SAMHSA’s Concept of Trauma and Guidance for a Trauma-Informed Approach. Rockville, MD: SAMHSA; 2014.
35. Machtinger EL, Cuca YP, Khanna N, Rose CD, Kimberg LS. From treatment to healing: the promise of trauma-informed primary care. Womens Health Issues. 2015;25(3):193-197. https://doi.org/10.1016/j.whi.2015.03.008.
36. Green BL, Saunders PA, Power E, et al. Trauma-informed medical care: patient response to a primary care provider communication training. J Loss Trauma . 2016;21(2):147-159. https://doi.org/10.1080/15325024.2015.1084854.
37. McKay S, Parente V. Health Disparities in the Hospitalized Child. Hosp Pediatr. 2019;9(5):317-325. https://doi.org/10.1542/hpeds.2018-0223.
38. Kerker BD, Storfer-Isser A, Szilagyi M, et al. Do pediatricians ask about adverse childhood experiences in pediatric primary care? Acad Pediatr. 2016;16(2):154-160. https://doi.org/10.1
1. Felitti VJ, Anda RF, Nordenberg D, et al. Relationship of childhood abuse and household dysfunction to many of the leading causes of death in adults. The Adverse Childhood Experiences (ACE) Study. Am J Prev Med. 1998;14(4):245-258. https://doi.org/10.1016/s0749-3797(98)00017-8.
2. Bethell CD, Newacheck P, Hawes E, Halfon N. Adverse childhood experiences: assessing the impact on health and school engagement and the mitigating role of resilience. Health Aff. 2014;33(12):2106-2115. https://doi.org/10.1377/hlthaff.2014.0914.
3. Masten AS. Ordinary Magic. Resilience processes in development. Am Psychol. 2001;56(3):227-238. https://doi.org/10.1037//0003-066x.56.3.227.
4. Garner AS, Shonkoff JP, Committee on Psychosocial Aspects of C, et al. Early childhood adversity, toxic stress, and the role of the pediatrician: translating developmental science into lifelong health. Pediatrics. 2012;129(1):e224-231. https://doi.org/10.1542/peds.2011-2662.
5. Randell KA, O’Malley D, Dowd MD. Association of parental adverse childhood experiences and current child adversity. JAMA Pediatrics. 2015;169(8):786-787. https://doi.org/10.1001/jamapediatrics.2015.0269.
6. Le-Scherban F, Wang X, Boyle-Steed KH, Pachter LM. Intergenerational associations of parent adverse childhood experiences and child health outcomes. Pediatrics. 2018;141(6):e20174274. https://doi.org/10.1542/peds.2017-4274.
7. Johnson SB, Riley AW, Granger DA, Riis J. The science of early life toxic stress for pediatric practice and advocacy. Pediatrics. 2013;131(2):319-327. https://doi.org/10.1542/peds.2012-0469.
8. Roth TL, Lubin FD, Funk AJ, Sweatt JD. Lasting epigenetic influence of early-life adversity on the BDNF gene. Biol Psychiatry. 2009;65(9):760-769. https://doi.org/10.1016/j.biopsych.2008.11.028.
9. Garner AS, Forkey H, Szilagyi M. Translating developmental science to address childhood adversity. Acad Pediatr. 2015;15(5):493-502. https://doi.org/10.1016/j.acap.2015.05.010.
10. Weiss M, Johnson NL, Malin S, Jerofke T, Lang C, Sherburne E. Readiness for discharge in parents of hospitalized children. J Pediatr Nurs. 2008;23(4):282-295. https://doi.org/10.1016/j.pedn.2007.10.005.
11. Shah AN, Beck AF, Sucharew HJ, et al. Parental adverse childhood experiences and resilience on coping after discharge. Pediatrics. 2018;141(4):e20172127. https://doi.org/10.1542/peds.2017-2127.
12. Auger KA, Simmons JM, Tubbs-Cooley HL, et al. Postdischarge nurse home visits and reuse: The Hospital to Home Outcomes (H2O) Trial. Pediatrics. 2018;142(1):e20173919. https://doi.org/10.1542/peds.2017-3919.
13. Auger KA, Shah SS, Tubbs-Cooley HL, et al. Effects of a 1-time nurse-led telephone call after pediatric discharge: the H2O II randomized clinical trial. JAMA Pediatr. 2018;172(9):e181482. https://doi.org/10.1001/jamapediatrics.2018.1482.
14. TheHealthCollaborative. Healthbridge analytics. http://healthcollab.org/hbanalytics/. Accessed August 11, 2017.
15. Auger K, Mueller E, Weinberg S, et al. A validated method for identifying unplanned pediatric readmission. J Pediatr. 2016;170:105-12.e122. https://doi.org10.1016/j.jpeds.2015.11.051.
16. Felitti VJ. Belastungen in der Kindheit und Gesundheit im Erwachsenenalter: die Verwandlung von Gold in Blei [The relationship of adverse childhood experiences to adult health: turning gold into lead]. Z Psychosom Med Psychother. 2002;48(4):359-369. https://doi.org/10.13109/zptm.2002.48.4.359.
17. Smith BW, Dalen J, Wiggins K, Tooley E, Christopher P, Bernard J. The brief resilience scale: assessing the ability to bounce back. Int J Behav Med. 2008;15(3):194-200. https://doi.org/10.1080/10705500802222972.
18. Baker DW, Parker RM, Williams MV, Clark WS. Health literacy and the risk of hospital admission. J Gen Intern Med. 1998;13(12):791-798. https://doi.org/10.1046/j.1525-1497.1998.00242.x.
19. Auger KA, Kahn RS, Simmons JM, et al. Using address information to identify hardships reported by families of children hospitalized with asthma. Acad Pediatr. 2017;17(1):79-87. https://doi.org/10.1016/j.acap.2016.07.003.
20. Auger KA, Kahn RS, Davis MM, Simmons JM. Pediatric asthma readmission: asthma knowledge is not enough? J Pediatr. 2015;166(1):101-108. https://doi.org/10.1016/j.jpeds.2014.07.046.
21. Seid M, Varni JW, Bermudez LO, et al. Parents’ perceptions of primary care: measuring parents’ experiences of pediatric primary care quality. Pediatrics. 2001;108(2):264-270. https://doi:10.1542/peds.108.2.264.
22. Schickedanz A, Halfon N, Sastry N, Chung PJ. Parents’ adverse childhood experiences and their children’s behavioral health problems. Pediatrics. 2018;142(2). https://doi.org/10.1542/peds.2018-0023.
23. Folger AT, Eismann EA, Stephenson NB, et al. Parental adverse childhood experiences and offspring development at 2 years of age. Pediatrics. 2018;141(4):e20172826. https://doi.org/10.1542/peds.2017-2826.
24. O’Malley DM, Randell KA, Dowd MD. Family adversity and resilience measures in pediatric acute care settings. Public Health Nurs. 2016;33(1):3-10. https://doi.org/10.1111/phn.12246.
25. Masten AS. Resilience in developing systems: the promise of integrated approaches. Eur J Dev Psychol. 2016;13(3):297-312. https://doi.org/10.1080/17405629.2016.1147344.
26. Burns-Nader S, Hernandez-Reif M. Facilitating play for hospitalized children through child life services. Child Health Care. 2016;45(1):1-21. https://doi.org/10.1080/02739615.2014.948161.
27. Feudtner C, Haney J, Dimmers MA. Spiritual care needs of hospitalized children and their families: a national survey of pastoral care providers’ perceptions. Pediatrics. 2003;111(1):e67-e72. https://doi.org/10.1542/peds.111.1.e67.
28. Kazak AE, Schneider S, Didonato S, Pai AL. Family psychosocial risk screening guided by the Pediatric Psychosocial Preventative Health Model (PPPHM) using the Psychosocial Assessment Tool (PAT). Acta Oncol. 2015;54(5):574-580. https://doi.org/10.3109/0284186X.2014.995774.
29. Kodish I. Behavioral health care for children who are medically hospitalized. Pediatr Ann. 2018;47(8):e323-e327. https://doi.org/10.3928/19382359-20180705-01.
30. Doupnik SK, Hill D, Palakshappa D, et al. Parent coping support interventions during acute pediatric hospitalizations: a meta-analysis. Pediatrics. 2017;140(3). https://doi.org/10.1542/peds.2016-4171.
31. Hill DL, Carroll KW, Snyder KJG, et al. Development and pilot testing of a coping kit for parents of hospitalized children. Acad Pediatr. 2019;19(4):454-463. https://doi.org/10.1016/j.acap.2018.11.001.
32. Bronner MB, Peek N, Knoester H, Bos AP, Last BF, Grootenhuis MA. Course and predictors of posttraumatic stress disorder in parents after pediatric intensive care treatment of their child. J Pediatr Psychol. 2010;35(9):966-974. https://doi.org/10.1093/jpepsy/jsq004.
33. Bowen EA, Murshid NS. Trauma-informed social policy: a conceptual framework for policy analysis and advocacy. Am J Public Health. 2016;106(2):223-229. https://doi.org/10.2105/AJPH.2015.302970.
34. Substance Abuse and Mental Health Services Administration. SAMHSA’s Concept of Trauma and Guidance for a Trauma-Informed Approach. Rockville, MD: SAMHSA; 2014.
35. Machtinger EL, Cuca YP, Khanna N, Rose CD, Kimberg LS. From treatment to healing: the promise of trauma-informed primary care. Womens Health Issues. 2015;25(3):193-197. https://doi.org/10.1016/j.whi.2015.03.008.
36. Green BL, Saunders PA, Power E, et al. Trauma-informed medical care: patient response to a primary care provider communication training. J Loss Trauma . 2016;21(2):147-159. https://doi.org/10.1080/15325024.2015.1084854.
37. McKay S, Parente V. Health Disparities in the Hospitalized Child. Hosp Pediatr. 2019;9(5):317-325. https://doi.org/10.1542/hpeds.2018-0223.
38. Kerker BD, Storfer-Isser A, Szilagyi M, et al. Do pediatricians ask about adverse childhood experiences in pediatric primary care? Acad Pediatr. 2016;16(2):154-160. https://doi.org/10.1
© 2020 Society of Hospital Medicine
A Jaw-Dropping Diagnosis
A 73-year-old man presented to primary care for an annual examination. Four days prior, he noted right-sided sharp jaw pain such that he could not open his mouth nor chew solid food; it radiated from the right mandible to the ipsilateral temple. He also noted bilateral aching hip pain for several years that increased in severity in the prior 2 months. He reported an intentional weight loss of 9 kg over the past year, achieved through dietary modification. He denied fever, chills, and visual disturbance.
Acute onset of unilateral jaw pain that is worsened by chewing is a feature consistent with a temporomandibular disorder (TMD). TMD consists of musculoskeletal and neuromuscular conditions that affect the temporomandibular joints (TMJs), masticatory muscles, and associated tissues. Common symptoms of TMD include facial or ear pain, temporal headache, and TMJ dysfunction or discomfort. In addition to TMD, craniofacial pain has many possible etiologies such as dental pathology, neuralgias, sinus and otologic disorders, headache and migraine disorders, infections, rheumatologic conditions, and neoplasms.
Systemic etiologies for this patient’s symptoms are a consideration given his age and concomitant worsening of chronic hip pain. Rheumatologic conditions such as giant cell arteritis (GCA) and polymyalgia rheumatica (PMR) are more common in adults older than 50 years of age and cause headache, jaw claudication, and pelvic girdle pain. Rarely, hematologic malignancies (eg, lymphoma), solid tumor metastases (eg, breast cancer, melanoma), and primary tumors of the head and neck (eg, nasopharyngeal carcinoma) can involve the mandible, TMJ, or parotid gland and result in symptoms of TMD.
Medical history was notable for hypertension and type 2 diabetes mellitus complicated by peripheral neuropathy. He smoked one pack of cigarettes daily for 40 years but quit 15 years prior. He drank 4 ounces of vodka each night.
On examination, temperature was 36.5°C, heart rate 92 beats per minute, blood pressure 127/60 mmHg, respiratory rate 12 breaths per minute, oxygen saturation 98% on ambient air, and weight 118 kg. Extraocular movements were intact, pupils were equal and reactive to light and accommodation, and there were no visual field deficits. Nondilated funduscopic examination revealed normal blood vessels, optic disc, and optic cup-to-disc ratio. Dentition was good with pink gingiva. Bilateral temples were nontender. There was normal range of motion and strength in the shoulders, hips, and lower extremities with no tenderness over the trochanters. Patellar and ankle reflexes were present and symmetric bilaterally. He had no rashes or ecchymoses.
The history of smoking, especially with concomitant alcohol intake, is a risk factor for head and neck cancer, and these malignancies can lead to facial pain. While the normal oral cavity exam argues against localized oral and dental causes of the patient’s symptoms, direct fiberoptic endoscopy should be considered. The neck should be examined for lymphadenopathy. Normal vital signs point away from severe infection. The lack of findings in the head and musculoskeletal regions does not exclude systemic etiologies such as rheumatologic conditions or neoplasm. Complete blood cell count and markers of inflammation including erythrocyte sedimentation rate (ESR) and C-reactive protein (CRP) levels should be obtained. Hip and pelvic radiographs should be obtained to evaluate for hip osteoarthritis, fractures, or osseous lesions.
The appointment occurred during evening hours and the patient declined further evaluation until the following morning, at which time laboratory studies revealed normal serum levels of electrolytes, blood urea nitrogen, and creatinine. White blood cell (WBC) count was 6,800/mm3 with an immature granulocyte ratio of 1.8% (normal, 0.0-0.5%), hemoglobin 13.2 g/dL, and platelet count 163,000/mm3. ESR was 118 mm/hr (normal, 0-15 mm/hr) and CRP was 1.5 mg/dL (normal, 0-0.75 mg/dL). Radiographs of the hips and pelvis showed osteoarthritis of the bilateral hip joints and degenerative disc disease of the lower lumbar spine.
Granulocytosis may occur in response to infection, rheumatologic conditions, and hematologic malignancies such as chronic myelogenous leukemia. While infectious etiologies (eg, abscess, osteomyelitis) are the most common cause of an extremely elevated ESR level, this patient does not have other signs or symptoms of infection such as fever or leukocytosis. Therefore, other common causes for an extremely elevated ESR level should be considered, including malignancy (eg, multiple myeloma, lymphoma, metastatic solid tumor) and autoimmune conditions (eg, rheumatoid arthritis, vasculitis). While multiple myeloma is the most common malignant etiology for extremely elevated ESR, the patient lacks signs of this condition such as anemia, elevated creatinine, or osteolytic lesions on radiographic imaging. Osteoarthritis identified on the radiographs may contribute to the patient’s hip pain but would not explain the patient’s jaw pain, weight loss, granulocytosis, and elevated ESR. These findings, taken together with the patient’s age, are most suggestive of GCA with possible coexisting PMR. Temporal artery biopsy should be obtained as it is the gold standard test for diagnosing GCA.
The patient was contacted by telephone that same day with laboratory test results. During the call, he endorsed increased jaw and temple pain. He was advised to proceed to the emergency department (ED) for timely evaluation and treatment.
Because GCA was being considered, ophthalmology performed an ocular examination in the ED, which demonstrated no signs of optic nerve or retinal ischemia. Computed tomography (CT) scan of the head and neck with intravenous contrast revealed no abscess or soft tissue abnormalities. Right temporal artery biopsy was performed.
The normal ocular examination does not exclude GCA, and temporal artery biopsy is appropriate. The mainstay of treatment for GCA is high-dose systemic glucocorticoids, which should not be withheld while awaiting biopsy results since ophthalmic artery inflammation may occur and threaten vision.
While GCA remains the leading diagnosis, malignant etiologies warrant further consideration because they are a common cause of extreme ESR elevation, particularly among older patients. The patient’s cancer screening history should be reviewed. The normal CT scan of the head and neck reduces the likelihood of localized solid tumor etiologies; however, additional CT imaging of the chest, abdomen, and pelvis is warranted to evaluate for metastatic solid tumors or lymphoma.
A 10-day course of prednisone 60 mg daily was prescribed for empiric treatment of GCA. The patient was discharged home with follow-up scheduled in rheumatology and primary care clinics. Pain in the jaw and temple resolved within several days.
Two weeks later, he presented to the rheumatology clinic. He noted 1 week of lower right back pain described as dull, aching, radiating to the lateral right hip, and occurring when transitioning from sitting to standing. He had no leg numbness, weakness, or change in bowel habits. Bladder habits were also unchanged, although he reported chronic urinary frequency and occasional incontinence. He reported further weight loss, this time an unintentional loss of 9 kg. He noted frequent sweating but no fever.
He reported a normal colonoscopy within the prior 5 years. Because these records were not available for review, a fecal immunochemical test was obtained and negative for hemoglobin. He had previously declined prostate cancer screening.
The resolution of jaw and temple pain with prednisone supports the presumed diagnosis of GCA. Up to half of patients with GCA may also have PMR, which can cause aching and stiffness in the arms, hips, and lumbar region, and pain may be abrupt in onset. However, PMR-related pain would be expected to improve rather than develop or worsen in the setting of high-dose glucocorticoid use. Therefore, other causes of acute-onset back pain must be considered.
While localized musculoskeletal etiologies such as lumbar muscle strain, radiculopathy, and vertebral compression fracture are possible, co-occurrence of unintentional weight loss and diaphoresis with elevated inflammatory markers suggests a systemic etiology. A neoplastic process with bony metastasis is possible. The reportedly normal colonoscopy and the negative fecal immunochemical test make colorectal cancer less likely. Inflammatory conditions such as ankylosing spondylitis and rheumatoid arthritis are also possible. Ankylosing spondylitis usually presents at a much younger age, however, and axial skeletal involvement in rheumatoid arthritis often involves the cervical spine and is usually seen after longstanding disease. Additionally, the hallmark of inflammatory back pain is morning stiffness which the patient does not endorse. Nonetheless, additional laboratory testing should include antinuclear antibody, rheumatoid factor, and anti-cyclic citrullinated peptide (anti-CCP) antibody. Vertebral osteomyelitis remains on the differential diagnosis, and repeat WBC count and inflammatory markers should be assessed. Lumbosacral radiographs should be obtained to rule out fracture.
Physical examination in the rheumatology clinic revealed a temperature of 37.0°C, heart rate 100 beats per minute, blood pressure 146/72 mmHg, respiratory rate 12 breaths per minute, and oxygen saturation 98% on ambient air. Weight was 109 kg. He was pale and diaphoretic. There was diffuse tenderness to palpation of the right-sided lumbar paraspinal muscles. Straight leg raise was negative bilaterally. Patellar reflexes and gait were normal.
Blood chemistries, renal function, and aminotransferase levels were normal. WBC count was 7,100/mm3, hemoglobin 8.0 g/dL, mean corpuscular volume 88.9 fL, platelet count 128,000/mm3, ESR 66 mm/hr, CRP 0.57 mg/dL, alkaline phosphatase 438 IU/L (normal, 30-130 IU/L), and thyroid-stimulating hormone 0.925 mU/L (normal, 0.34-5.60 mU/L). Testing for antinuclear antibodies, rheumatoid factor, and anti-CCP antibody was unremarkable. Prostate-specific antigen (PSA) level was 2.2 ng/mL (normal, 0-4 ng/mL). Urinalysis was unremarkable. Antibodies to hepatitis C and Treponema pallidum were negative. Interferon gamma release assay was negative.
Findings of new onset anemia and thrombocytopenia, in combination with elevated ESR and alkaline phosphatase level, are concerning for disseminated intravascular coagulation (DIC) and microangiopathic hemolytic anemia (MAHA), bone marrow infiltration of a metastatic neoplasm, or ineffective hematopoiesis caused by myelodysplastic syndromes or myelofibrosis.
Laboratory evaluation should include iron studies, lactate dehydrogenase (LDH), haptoglobin, fibrinogen, D-dimer, reticulocyte count, and peripheral blood smear to assess for hemolysis and erythrocyte morphology. Advanced imaging with lumbosacral magnetic resonance imaging (MRI) should be obtained to evaluate for focal etiologies of back pain such as disc herniation, abscess, marrow infiltration, and infarction.
Additional laboratory studies revealed a gamma-glutamyl transferase level of 49 IU/L (normal, 8-56 IU/L), LDH 288 IU/L (normal, 98-192 IU/L), haptoglobin 495 mg/dL (normal, 32-240 mg/dL), fibrinogen >700 mg/dL (normal, 225-550 mg/dL), D-dimer 693 ng/mL (normal, 200-250 ng/mL), serum iron 57 mcg/dL (normal, 33-150 mcg/dL), total iron binding capacity 286 mcg/dL (normal, 250-450 mcg/dL), ferritin 1,012 ng/mL (normal, 17.9-464 ng/mL), and reticulocyte count 2.9% (normal, 0.5-2.5%). Coagulation studies and serum protein electrophoresis were normal. Erythropoietin level was 109 mIU/mL (normal, 4.0-20.0 mIU/mL). Peripheral blood smear demonstrated moderate anemia with 8% nucleated erythrocytes per white blood cell (normal, 0%) and no circulating blasts.
MRI of the thoracolumbar spine and pelvis revealed diffusely abnormal bone marrow signal with multiple superimposed focal and poorly defined enhancing lesions along the lumbar spine marrow, sacrum, and bilateral iliac bones (Figure 1). Positron emission tomography/computed tomography (PET/CT) scan showed no scintigraphic evidence of metabolically active neoplastic, paraneoplastic, or inflammatory disorder.
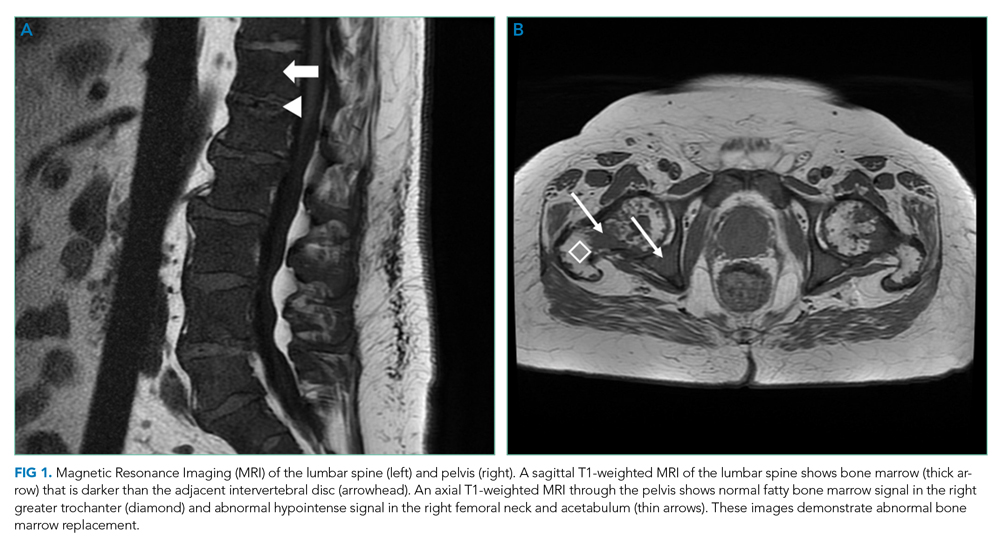
The elevated haptoglobin, normal coagulation studies, and absence of fragmented erythrocytes on peripheral smear exclude an intravascular hemolytic process. The patient’s lower than expected reticulocyte count for the degree of anemia, elevated erythropoietin, and nucleated erythrocytes constitute a pattern that can be seen with bone marrow infiltration. There are no circulating blasts, making leukemia less likely. A solid organ tumor with bone metastases may cause enhancing lesions on MRI since this form of imaging is more sensitive than radiography for detecting skeletal malignancies. The negative PET/CT, however, does not reveal a primary tumor. Myelofibrosis is an infiltrative myeloproliferative disorder associated with nonspecific laboratory abnormalities, bone pain, weight loss, and night sweats that could cause diffuse MRI bone marrow signal alterations with normal PET/CT findings. However, myelofibrosis would not typically cause a significantly elevated ESR, and thus would be an unlikely cause for this patient’s presentation.
Given the constellation of symptoms, hematologic abnormalities, and bone marrow infiltration on imaging, hematology should be consulted to perform a bone marrow biopsy to assist with definitive diagnosis.
Bone marrow biopsy demonstrated metastatic adenocarcinoma consistent with prostatic origin (Figure 2). Bone scan demonstrated widespread osteoblastic metastases, which included the skull and temporal regions. These lesions were thought to be the cause of the patient’s original presenting symptom of jaw pain.
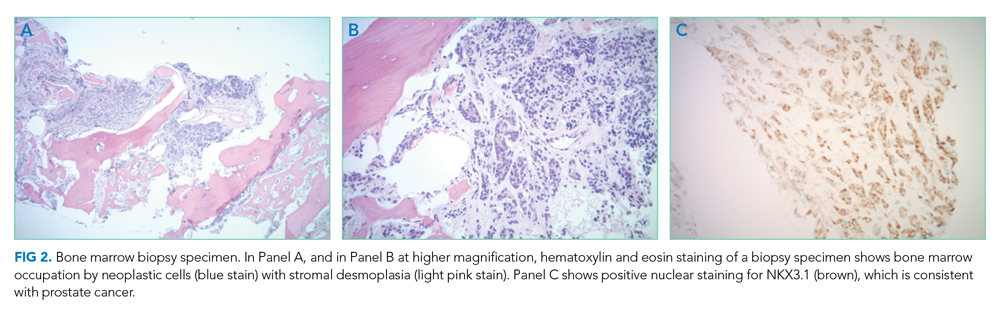
The patient was started on androgen deprivation therapy, initially with degarelix and subsequently leuprolide shots and abiraterone with prednisone. PSA was 0.08 ng/mL after 3 months of androgen deprivation therapy. His back and hip pain slowly improved.
DISCUSSION
Prostate cancer is the most common cancer in men with one out of every nine men diagnosed in his lifetime.1 While most men initially present with localized, curable disease,1 4% present with metastatic disease, an incidence that has been increasing since 2004.2 Despite available treatments, metastatic prostate cancer has a poor prognosis, with an average overall survival of approximately 5 years.3
Prostate cancer can be challenging to diagnose. Men with prostate cancer are commonly asymptomatic. Rarely, patients may present with hematuria, bony pain caused by metastasis, or obstructive urinary symptoms like hesitancy or incomplete bladder emptying. Our patient presented with jaw pain, which was ultimately attributed to osteoblastic lesions of the skull. Additionally, his history of urinary frequency and incontinence may have been clues to his underlying diagnosis of prostate cancer.
Prostate cancer screening remains highly nuanced and relies on shared decision-making between patients and healthcare providers. Clinical practice guidelines for early detection of prostate cancer recommend individualized PSA-based serologic screening.4,5 Specifically, the United States Preventive Services Task Force recommends screening men aged 55 to 69 years who desire screening and understand the potential harms associated with a positive test result. These harms may include psychological distress and complications from prostate biopsy (eg, pain or infection) or prostate cancer treatment (eg, erectile, urinary, and/or bowel dysfunction).4-6 The decision to screen can be guided by individuals’ risk factors including African American race, family history, and older age.
While our patient elected not to undergo routine prostate cancer screening, a PSA level was obtained during his diagnostic evaluation and highlights the limitations of PSA-based screening. A PSA level ≤4.0 ng/mL has 21% sensitivity and 91% specificity for detecting prostate cancer.7 PSA levels above 4.0 ng/mL warrant repeat testing and, if persistently elevated, referral to urology for possible prostate biopsy. PSA levels often correlate with burden of disease, and patients with PSA levels >20 ng/mL are referred for CT imaging to evaluate for metastatic disease.8 PSA’s poor sensitivity was underscored in a study by Thompson et al who evaluated the incidence of prostate cancer in men participating in the Prostate Cancer Prevention Trial with PSA levels of <4 ng/mL.9 In this study, 15% of men diagnosed with prostate cancer never had a PSA level >4 ng/mL.9 While most of the cancers in this study were low grade and may have been clinically insignificant, 15% demonstrated histologic signs of at least intermediate-risk disease. Our patient’s PSA level of 2.2 ng/mL was below the threshold that triggers additional evaluation even though he had widely metastatic prostate cancer.
Our patient’s severe jaw and temple pain, weight loss, and progressive hip pain were concerning for GCA. This vasculitis of large- and medium-sized arteries predominantly affects older adults with greatest incidence among those 70 years of age and older.10 Symptoms occur because of cranial artery inflammation and may include headache, visual disturbance, erythema or tenderness of the temporal artery, and jaw claudication. Extracranial inflammation may affect the thoracic aorta and its branches and rarely the abdominal aorta and lower limb arteries. Pelvic girdle pain more typically results from associated PMR. Patients may also note systemic symptoms such as fever, weight loss, and fatigue.
Prompt diagnostic testing is important when considering GCA. Most patients with GCA have ESR levels greater than 40 mm/hr.11 ESR is a laboratory test that measures the vertical distance erythrocytes travel in a column of blood over 1 hour; in the setting of inflammation, cells form clumps and travel more quickly than individual cells, resulting in a higher value. While moderate elevations in ESR may occur without an identifiable cause, extreme ESR levels—those above 100 mm/hr, as observed in our patient—are highly suggestive of certain serious conditions, including infection, malignancy, and autoimmune disease such as GCA.12,13 Temporal artery biopsy is the gold standard test to diagnose GCA. However, because of noncontiguous inflammation of the temporal artery, biopsies may be falsely negative. Thus, sampling of the contralateral temporal artery may be warranted if suspicion remains high.
As was the case for our patient, PET/CT is not reliable for diagnosing prostate cancer. In contrast to other malignancies (eg, lymphoma, lung cancer), prostate cancer typically does not display increased glucose metabolism. Moreover, the close proximity of the bladder and prostate can interfere with imaging interpretation because the fluorodeoxyglucose (FDG) tracer is excreted in the urine.14 The reported sensitivity of PET/CT for the diagnosis of prostate cancer ranges from 17%-65%.15,16 In a small study of men with metastatic prostate cancer, only 18% of bony metastases were FDG avid, and there was no correlation between FDG avidity and PSA level.15 Notably, although PET/CT includes CT imaging, this CT is used to map anatomic landmarks and is not separately interpreted by the radiologist. Thus, even if evidence of prostate cancer was apparent on traditional CT, it may be overlooked on PET/CT.
Several important points regarding diagnostic testing are raised by this case. First, PSA-based screening for prostate cancer may be falsely negative, even in the setting of widely metastatic disease. Second, extreme ESR elevation is a marker for serious underlying disease and warrants a thorough diagnostic evaluation. Finally, PET/CT has limited diagnostic utility in evaluating metastatic prostate cancer because of the normal rates of glucose metabolism. Our patient initially presented with jaw pain, yet his progressive physical symptoms and laboratory abnormalities prompted an evaluation which ultimately revealed the jaw-dropping diagnosis of PSA-negative, metastatic prostate cancer.
KEY TEACHING POINTS
- ESR levels greater than 100 mm/hr are highly suggestive of certain serious conditions including infection, autoimmune disease, and malignancy.
- PSA-based screening for prostate cancer can result in false negative test results. In one study, 15% of men diagnosed with prostate cancer never had a PSA level greater than 4 ng/mL (ie, the level at which repeat laboratory testing and/or referral to urology for possible prostate biopsy is advisable).
- PET/CT has limited diagnostic utility in evaluating metastatic prostate cancer, because prostate cancer cells typically demonstrate normal glucose metabolism.
Disclosures
Drs Griauzde, Northway, Yentz, and Houchens have nothing to disclose. Dr Saint reports personal fees from ISMIE Mutual Insurance Company during the conduct of the study, as well as personal fees from Jvion and Doximity outside the submitted work.
1. Prostate Cancer - Cancer Stat Facts. SEER. https://seer.cancer.gov/statfacts/html/prost.html. Accessed October 23, 2018.
2. Li J, Siegel DA, King JB. Stage-specific incidence rates and trends of prostate cancer by age, race, and ethnicity, United States, 2004-2014. Ann Epidemiol. 2018;28(5):328-330. https://doi.org/10.1016/j.annepidem.2018.03.001.
3. Sweeney CJ, Chen YH, Carducci M, et al. Chemohormonal therapy in metastatic hormone-sensitive prostate cancer. N Engl J Med. 2015;373(8):737-746. https://doi.org/10.1056/NEJMoa1503747.
4. US Preventive Services Task Force. Final Recommendation Statement: Prostate Cancer: Screening. https://www.uspreventiveservicestaskforce.org/Page/Document/RecommendationStatementFinal/prostate-cancer-screening1. Accessed August 8, 2018.
5. American Urological Association. http://www.auanet.org/guidelines/prostate-cancer-early-detection. Accessed August 8, 2018.
6. American Cancer Society. American Cancer Society Recommendations for Prostate Cancer Early Detection. https://www.cancer.org/cancer/prostate-cancer/early-detection/acs-recommendations.html. Accessed August 8, 2018.
7. Wolf AM, Wender RC, Etzioni RB, et al. American Cancer Society guideline for the early detection of prostate cancer: update 2010. CA Cancer J Clin. 2010;60(2):70-98. https://doi.org/10.3322/caac.20066.
8. Mohler JL, Lee RJ, Antonarakis ES, Higano CS, Richey S. NCCN Guidelines Index Table of Contents. Prostate Cancer. 2018:151.
9. Thompson IM, Pauler DK, Goodman PJ, et al. Prevalence of prostate cancer among men with a prostate-specific antigen level ≤4.0 ng per milliliter. N Engl J Med. 2004;350(22):2239-2246. https://doi.org/10.1056/NEJMoa031918.
10. Pioro MH. Primary care vasculitis: Polymyalgia rheumatica and giant cell arteritis. Prim Care. 2018;45(2):305-323. https://doi.org/10.1016/j.pop.2018.02.007.
11. Salvarani C, Hunder GG. Giant cell arteritis with low erythrocyte sedimentation rate: frequency of occurrence in a population-based study. Arthritis Rheum. 2001;45(2):140-145. https://doi.org/10.1002/1529-0131(200104)45:2<140::AID-ANR166>3.0.CO;2-2
12. Brigden ML. Clinical utility of the erythrocyte sedimentation rate. Am Fam Physician. 1999;60(5):1443-1450.
13. Daniels LM, Tosh PK, Fiala JA, Schleck CD, Mandrekar JN, Beckman TJ. Extremely elevated erythrocyte sedimentation rates: Associations with patients’ diagnoses, demographic dharacteristics, and comorbidities. Mayo Clin Proc. 2017;92(11):1636-1643. https://doi.org/10.1016/j.mayocp.2017.07.018.
14. Powles T, Murray I, Brock C, Oliver T, Avril N. Molecular positron emission tomography and PET/CT imaging in urological malignancies. Eur Urol. 2007;51(6):1511-1521. http://doi.org/10.1016/j.eururo.2007.01.061.
15. Yeh SDJ, Imbriaco M, Larson SM, et al. Detection of bony metastases of androgen-independent prostate cancer by PET-FDG. Nucl Med Biol. 1996;23(6):693-697. https://doi.org/10.1016/0969-8051(96)00044-3.
16. Perera M, Papa N, Christidis D, et al. Sensitivity, specificity, and predictors of positive 68ga-prostate-specific membrane antigen positron emission tomography in advanced prostate cancer: a systematic review and meta-analysis. Eur Urol. 2016;70(6):926-937. https://doi.org/10.1016/j.eururo.2016.06.021.
A 73-year-old man presented to primary care for an annual examination. Four days prior, he noted right-sided sharp jaw pain such that he could not open his mouth nor chew solid food; it radiated from the right mandible to the ipsilateral temple. He also noted bilateral aching hip pain for several years that increased in severity in the prior 2 months. He reported an intentional weight loss of 9 kg over the past year, achieved through dietary modification. He denied fever, chills, and visual disturbance.
Acute onset of unilateral jaw pain that is worsened by chewing is a feature consistent with a temporomandibular disorder (TMD). TMD consists of musculoskeletal and neuromuscular conditions that affect the temporomandibular joints (TMJs), masticatory muscles, and associated tissues. Common symptoms of TMD include facial or ear pain, temporal headache, and TMJ dysfunction or discomfort. In addition to TMD, craniofacial pain has many possible etiologies such as dental pathology, neuralgias, sinus and otologic disorders, headache and migraine disorders, infections, rheumatologic conditions, and neoplasms.
Systemic etiologies for this patient’s symptoms are a consideration given his age and concomitant worsening of chronic hip pain. Rheumatologic conditions such as giant cell arteritis (GCA) and polymyalgia rheumatica (PMR) are more common in adults older than 50 years of age and cause headache, jaw claudication, and pelvic girdle pain. Rarely, hematologic malignancies (eg, lymphoma), solid tumor metastases (eg, breast cancer, melanoma), and primary tumors of the head and neck (eg, nasopharyngeal carcinoma) can involve the mandible, TMJ, or parotid gland and result in symptoms of TMD.
Medical history was notable for hypertension and type 2 diabetes mellitus complicated by peripheral neuropathy. He smoked one pack of cigarettes daily for 40 years but quit 15 years prior. He drank 4 ounces of vodka each night.
On examination, temperature was 36.5°C, heart rate 92 beats per minute, blood pressure 127/60 mmHg, respiratory rate 12 breaths per minute, oxygen saturation 98% on ambient air, and weight 118 kg. Extraocular movements were intact, pupils were equal and reactive to light and accommodation, and there were no visual field deficits. Nondilated funduscopic examination revealed normal blood vessels, optic disc, and optic cup-to-disc ratio. Dentition was good with pink gingiva. Bilateral temples were nontender. There was normal range of motion and strength in the shoulders, hips, and lower extremities with no tenderness over the trochanters. Patellar and ankle reflexes were present and symmetric bilaterally. He had no rashes or ecchymoses.
The history of smoking, especially with concomitant alcohol intake, is a risk factor for head and neck cancer, and these malignancies can lead to facial pain. While the normal oral cavity exam argues against localized oral and dental causes of the patient’s symptoms, direct fiberoptic endoscopy should be considered. The neck should be examined for lymphadenopathy. Normal vital signs point away from severe infection. The lack of findings in the head and musculoskeletal regions does not exclude systemic etiologies such as rheumatologic conditions or neoplasm. Complete blood cell count and markers of inflammation including erythrocyte sedimentation rate (ESR) and C-reactive protein (CRP) levels should be obtained. Hip and pelvic radiographs should be obtained to evaluate for hip osteoarthritis, fractures, or osseous lesions.
The appointment occurred during evening hours and the patient declined further evaluation until the following morning, at which time laboratory studies revealed normal serum levels of electrolytes, blood urea nitrogen, and creatinine. White blood cell (WBC) count was 6,800/mm3 with an immature granulocyte ratio of 1.8% (normal, 0.0-0.5%), hemoglobin 13.2 g/dL, and platelet count 163,000/mm3. ESR was 118 mm/hr (normal, 0-15 mm/hr) and CRP was 1.5 mg/dL (normal, 0-0.75 mg/dL). Radiographs of the hips and pelvis showed osteoarthritis of the bilateral hip joints and degenerative disc disease of the lower lumbar spine.
Granulocytosis may occur in response to infection, rheumatologic conditions, and hematologic malignancies such as chronic myelogenous leukemia. While infectious etiologies (eg, abscess, osteomyelitis) are the most common cause of an extremely elevated ESR level, this patient does not have other signs or symptoms of infection such as fever or leukocytosis. Therefore, other common causes for an extremely elevated ESR level should be considered, including malignancy (eg, multiple myeloma, lymphoma, metastatic solid tumor) and autoimmune conditions (eg, rheumatoid arthritis, vasculitis). While multiple myeloma is the most common malignant etiology for extremely elevated ESR, the patient lacks signs of this condition such as anemia, elevated creatinine, or osteolytic lesions on radiographic imaging. Osteoarthritis identified on the radiographs may contribute to the patient’s hip pain but would not explain the patient’s jaw pain, weight loss, granulocytosis, and elevated ESR. These findings, taken together with the patient’s age, are most suggestive of GCA with possible coexisting PMR. Temporal artery biopsy should be obtained as it is the gold standard test for diagnosing GCA.
The patient was contacted by telephone that same day with laboratory test results. During the call, he endorsed increased jaw and temple pain. He was advised to proceed to the emergency department (ED) for timely evaluation and treatment.
Because GCA was being considered, ophthalmology performed an ocular examination in the ED, which demonstrated no signs of optic nerve or retinal ischemia. Computed tomography (CT) scan of the head and neck with intravenous contrast revealed no abscess or soft tissue abnormalities. Right temporal artery biopsy was performed.
The normal ocular examination does not exclude GCA, and temporal artery biopsy is appropriate. The mainstay of treatment for GCA is high-dose systemic glucocorticoids, which should not be withheld while awaiting biopsy results since ophthalmic artery inflammation may occur and threaten vision.
While GCA remains the leading diagnosis, malignant etiologies warrant further consideration because they are a common cause of extreme ESR elevation, particularly among older patients. The patient’s cancer screening history should be reviewed. The normal CT scan of the head and neck reduces the likelihood of localized solid tumor etiologies; however, additional CT imaging of the chest, abdomen, and pelvis is warranted to evaluate for metastatic solid tumors or lymphoma.
A 10-day course of prednisone 60 mg daily was prescribed for empiric treatment of GCA. The patient was discharged home with follow-up scheduled in rheumatology and primary care clinics. Pain in the jaw and temple resolved within several days.
Two weeks later, he presented to the rheumatology clinic. He noted 1 week of lower right back pain described as dull, aching, radiating to the lateral right hip, and occurring when transitioning from sitting to standing. He had no leg numbness, weakness, or change in bowel habits. Bladder habits were also unchanged, although he reported chronic urinary frequency and occasional incontinence. He reported further weight loss, this time an unintentional loss of 9 kg. He noted frequent sweating but no fever.
He reported a normal colonoscopy within the prior 5 years. Because these records were not available for review, a fecal immunochemical test was obtained and negative for hemoglobin. He had previously declined prostate cancer screening.
The resolution of jaw and temple pain with prednisone supports the presumed diagnosis of GCA. Up to half of patients with GCA may also have PMR, which can cause aching and stiffness in the arms, hips, and lumbar region, and pain may be abrupt in onset. However, PMR-related pain would be expected to improve rather than develop or worsen in the setting of high-dose glucocorticoid use. Therefore, other causes of acute-onset back pain must be considered.
While localized musculoskeletal etiologies such as lumbar muscle strain, radiculopathy, and vertebral compression fracture are possible, co-occurrence of unintentional weight loss and diaphoresis with elevated inflammatory markers suggests a systemic etiology. A neoplastic process with bony metastasis is possible. The reportedly normal colonoscopy and the negative fecal immunochemical test make colorectal cancer less likely. Inflammatory conditions such as ankylosing spondylitis and rheumatoid arthritis are also possible. Ankylosing spondylitis usually presents at a much younger age, however, and axial skeletal involvement in rheumatoid arthritis often involves the cervical spine and is usually seen after longstanding disease. Additionally, the hallmark of inflammatory back pain is morning stiffness which the patient does not endorse. Nonetheless, additional laboratory testing should include antinuclear antibody, rheumatoid factor, and anti-cyclic citrullinated peptide (anti-CCP) antibody. Vertebral osteomyelitis remains on the differential diagnosis, and repeat WBC count and inflammatory markers should be assessed. Lumbosacral radiographs should be obtained to rule out fracture.
Physical examination in the rheumatology clinic revealed a temperature of 37.0°C, heart rate 100 beats per minute, blood pressure 146/72 mmHg, respiratory rate 12 breaths per minute, and oxygen saturation 98% on ambient air. Weight was 109 kg. He was pale and diaphoretic. There was diffuse tenderness to palpation of the right-sided lumbar paraspinal muscles. Straight leg raise was negative bilaterally. Patellar reflexes and gait were normal.
Blood chemistries, renal function, and aminotransferase levels were normal. WBC count was 7,100/mm3, hemoglobin 8.0 g/dL, mean corpuscular volume 88.9 fL, platelet count 128,000/mm3, ESR 66 mm/hr, CRP 0.57 mg/dL, alkaline phosphatase 438 IU/L (normal, 30-130 IU/L), and thyroid-stimulating hormone 0.925 mU/L (normal, 0.34-5.60 mU/L). Testing for antinuclear antibodies, rheumatoid factor, and anti-CCP antibody was unremarkable. Prostate-specific antigen (PSA) level was 2.2 ng/mL (normal, 0-4 ng/mL). Urinalysis was unremarkable. Antibodies to hepatitis C and Treponema pallidum were negative. Interferon gamma release assay was negative.
Findings of new onset anemia and thrombocytopenia, in combination with elevated ESR and alkaline phosphatase level, are concerning for disseminated intravascular coagulation (DIC) and microangiopathic hemolytic anemia (MAHA), bone marrow infiltration of a metastatic neoplasm, or ineffective hematopoiesis caused by myelodysplastic syndromes or myelofibrosis.
Laboratory evaluation should include iron studies, lactate dehydrogenase (LDH), haptoglobin, fibrinogen, D-dimer, reticulocyte count, and peripheral blood smear to assess for hemolysis and erythrocyte morphology. Advanced imaging with lumbosacral magnetic resonance imaging (MRI) should be obtained to evaluate for focal etiologies of back pain such as disc herniation, abscess, marrow infiltration, and infarction.
Additional laboratory studies revealed a gamma-glutamyl transferase level of 49 IU/L (normal, 8-56 IU/L), LDH 288 IU/L (normal, 98-192 IU/L), haptoglobin 495 mg/dL (normal, 32-240 mg/dL), fibrinogen >700 mg/dL (normal, 225-550 mg/dL), D-dimer 693 ng/mL (normal, 200-250 ng/mL), serum iron 57 mcg/dL (normal, 33-150 mcg/dL), total iron binding capacity 286 mcg/dL (normal, 250-450 mcg/dL), ferritin 1,012 ng/mL (normal, 17.9-464 ng/mL), and reticulocyte count 2.9% (normal, 0.5-2.5%). Coagulation studies and serum protein electrophoresis were normal. Erythropoietin level was 109 mIU/mL (normal, 4.0-20.0 mIU/mL). Peripheral blood smear demonstrated moderate anemia with 8% nucleated erythrocytes per white blood cell (normal, 0%) and no circulating blasts.
MRI of the thoracolumbar spine and pelvis revealed diffusely abnormal bone marrow signal with multiple superimposed focal and poorly defined enhancing lesions along the lumbar spine marrow, sacrum, and bilateral iliac bones (Figure 1). Positron emission tomography/computed tomography (PET/CT) scan showed no scintigraphic evidence of metabolically active neoplastic, paraneoplastic, or inflammatory disorder.
The elevated haptoglobin, normal coagulation studies, and absence of fragmented erythrocytes on peripheral smear exclude an intravascular hemolytic process. The patient’s lower than expected reticulocyte count for the degree of anemia, elevated erythropoietin, and nucleated erythrocytes constitute a pattern that can be seen with bone marrow infiltration. There are no circulating blasts, making leukemia less likely. A solid organ tumor with bone metastases may cause enhancing lesions on MRI since this form of imaging is more sensitive than radiography for detecting skeletal malignancies. The negative PET/CT, however, does not reveal a primary tumor. Myelofibrosis is an infiltrative myeloproliferative disorder associated with nonspecific laboratory abnormalities, bone pain, weight loss, and night sweats that could cause diffuse MRI bone marrow signal alterations with normal PET/CT findings. However, myelofibrosis would not typically cause a significantly elevated ESR, and thus would be an unlikely cause for this patient’s presentation.
Given the constellation of symptoms, hematologic abnormalities, and bone marrow infiltration on imaging, hematology should be consulted to perform a bone marrow biopsy to assist with definitive diagnosis.
Bone marrow biopsy demonstrated metastatic adenocarcinoma consistent with prostatic origin (Figure 2). Bone scan demonstrated widespread osteoblastic metastases, which included the skull and temporal regions. These lesions were thought to be the cause of the patient’s original presenting symptom of jaw pain.
The patient was started on androgen deprivation therapy, initially with degarelix and subsequently leuprolide shots and abiraterone with prednisone. PSA was 0.08 ng/mL after 3 months of androgen deprivation therapy. His back and hip pain slowly improved.
DISCUSSION
Prostate cancer is the most common cancer in men with one out of every nine men diagnosed in his lifetime.1 While most men initially present with localized, curable disease,1 4% present with metastatic disease, an incidence that has been increasing since 2004.2 Despite available treatments, metastatic prostate cancer has a poor prognosis, with an average overall survival of approximately 5 years.3
Prostate cancer can be challenging to diagnose. Men with prostate cancer are commonly asymptomatic. Rarely, patients may present with hematuria, bony pain caused by metastasis, or obstructive urinary symptoms like hesitancy or incomplete bladder emptying. Our patient presented with jaw pain, which was ultimately attributed to osteoblastic lesions of the skull. Additionally, his history of urinary frequency and incontinence may have been clues to his underlying diagnosis of prostate cancer.
Prostate cancer screening remains highly nuanced and relies on shared decision-making between patients and healthcare providers. Clinical practice guidelines for early detection of prostate cancer recommend individualized PSA-based serologic screening.4,5 Specifically, the United States Preventive Services Task Force recommends screening men aged 55 to 69 years who desire screening and understand the potential harms associated with a positive test result. These harms may include psychological distress and complications from prostate biopsy (eg, pain or infection) or prostate cancer treatment (eg, erectile, urinary, and/or bowel dysfunction).4-6 The decision to screen can be guided by individuals’ risk factors including African American race, family history, and older age.
While our patient elected not to undergo routine prostate cancer screening, a PSA level was obtained during his diagnostic evaluation and highlights the limitations of PSA-based screening. A PSA level ≤4.0 ng/mL has 21% sensitivity and 91% specificity for detecting prostate cancer.7 PSA levels above 4.0 ng/mL warrant repeat testing and, if persistently elevated, referral to urology for possible prostate biopsy. PSA levels often correlate with burden of disease, and patients with PSA levels >20 ng/mL are referred for CT imaging to evaluate for metastatic disease.8 PSA’s poor sensitivity was underscored in a study by Thompson et al who evaluated the incidence of prostate cancer in men participating in the Prostate Cancer Prevention Trial with PSA levels of <4 ng/mL.9 In this study, 15% of men diagnosed with prostate cancer never had a PSA level >4 ng/mL.9 While most of the cancers in this study were low grade and may have been clinically insignificant, 15% demonstrated histologic signs of at least intermediate-risk disease. Our patient’s PSA level of 2.2 ng/mL was below the threshold that triggers additional evaluation even though he had widely metastatic prostate cancer.
Our patient’s severe jaw and temple pain, weight loss, and progressive hip pain were concerning for GCA. This vasculitis of large- and medium-sized arteries predominantly affects older adults with greatest incidence among those 70 years of age and older.10 Symptoms occur because of cranial artery inflammation and may include headache, visual disturbance, erythema or tenderness of the temporal artery, and jaw claudication. Extracranial inflammation may affect the thoracic aorta and its branches and rarely the abdominal aorta and lower limb arteries. Pelvic girdle pain more typically results from associated PMR. Patients may also note systemic symptoms such as fever, weight loss, and fatigue.
Prompt diagnostic testing is important when considering GCA. Most patients with GCA have ESR levels greater than 40 mm/hr.11 ESR is a laboratory test that measures the vertical distance erythrocytes travel in a column of blood over 1 hour; in the setting of inflammation, cells form clumps and travel more quickly than individual cells, resulting in a higher value. While moderate elevations in ESR may occur without an identifiable cause, extreme ESR levels—those above 100 mm/hr, as observed in our patient—are highly suggestive of certain serious conditions, including infection, malignancy, and autoimmune disease such as GCA.12,13 Temporal artery biopsy is the gold standard test to diagnose GCA. However, because of noncontiguous inflammation of the temporal artery, biopsies may be falsely negative. Thus, sampling of the contralateral temporal artery may be warranted if suspicion remains high.
As was the case for our patient, PET/CT is not reliable for diagnosing prostate cancer. In contrast to other malignancies (eg, lymphoma, lung cancer), prostate cancer typically does not display increased glucose metabolism. Moreover, the close proximity of the bladder and prostate can interfere with imaging interpretation because the fluorodeoxyglucose (FDG) tracer is excreted in the urine.14 The reported sensitivity of PET/CT for the diagnosis of prostate cancer ranges from 17%-65%.15,16 In a small study of men with metastatic prostate cancer, only 18% of bony metastases were FDG avid, and there was no correlation between FDG avidity and PSA level.15 Notably, although PET/CT includes CT imaging, this CT is used to map anatomic landmarks and is not separately interpreted by the radiologist. Thus, even if evidence of prostate cancer was apparent on traditional CT, it may be overlooked on PET/CT.
Several important points regarding diagnostic testing are raised by this case. First, PSA-based screening for prostate cancer may be falsely negative, even in the setting of widely metastatic disease. Second, extreme ESR elevation is a marker for serious underlying disease and warrants a thorough diagnostic evaluation. Finally, PET/CT has limited diagnostic utility in evaluating metastatic prostate cancer because of the normal rates of glucose metabolism. Our patient initially presented with jaw pain, yet his progressive physical symptoms and laboratory abnormalities prompted an evaluation which ultimately revealed the jaw-dropping diagnosis of PSA-negative, metastatic prostate cancer.
KEY TEACHING POINTS
- ESR levels greater than 100 mm/hr are highly suggestive of certain serious conditions including infection, autoimmune disease, and malignancy.
- PSA-based screening for prostate cancer can result in false negative test results. In one study, 15% of men diagnosed with prostate cancer never had a PSA level greater than 4 ng/mL (ie, the level at which repeat laboratory testing and/or referral to urology for possible prostate biopsy is advisable).
- PET/CT has limited diagnostic utility in evaluating metastatic prostate cancer, because prostate cancer cells typically demonstrate normal glucose metabolism.
Disclosures
Drs Griauzde, Northway, Yentz, and Houchens have nothing to disclose. Dr Saint reports personal fees from ISMIE Mutual Insurance Company during the conduct of the study, as well as personal fees from Jvion and Doximity outside the submitted work.
A 73-year-old man presented to primary care for an annual examination. Four days prior, he noted right-sided sharp jaw pain such that he could not open his mouth nor chew solid food; it radiated from the right mandible to the ipsilateral temple. He also noted bilateral aching hip pain for several years that increased in severity in the prior 2 months. He reported an intentional weight loss of 9 kg over the past year, achieved through dietary modification. He denied fever, chills, and visual disturbance.
Acute onset of unilateral jaw pain that is worsened by chewing is a feature consistent with a temporomandibular disorder (TMD). TMD consists of musculoskeletal and neuromuscular conditions that affect the temporomandibular joints (TMJs), masticatory muscles, and associated tissues. Common symptoms of TMD include facial or ear pain, temporal headache, and TMJ dysfunction or discomfort. In addition to TMD, craniofacial pain has many possible etiologies such as dental pathology, neuralgias, sinus and otologic disorders, headache and migraine disorders, infections, rheumatologic conditions, and neoplasms.
Systemic etiologies for this patient’s symptoms are a consideration given his age and concomitant worsening of chronic hip pain. Rheumatologic conditions such as giant cell arteritis (GCA) and polymyalgia rheumatica (PMR) are more common in adults older than 50 years of age and cause headache, jaw claudication, and pelvic girdle pain. Rarely, hematologic malignancies (eg, lymphoma), solid tumor metastases (eg, breast cancer, melanoma), and primary tumors of the head and neck (eg, nasopharyngeal carcinoma) can involve the mandible, TMJ, or parotid gland and result in symptoms of TMD.
Medical history was notable for hypertension and type 2 diabetes mellitus complicated by peripheral neuropathy. He smoked one pack of cigarettes daily for 40 years but quit 15 years prior. He drank 4 ounces of vodka each night.
On examination, temperature was 36.5°C, heart rate 92 beats per minute, blood pressure 127/60 mmHg, respiratory rate 12 breaths per minute, oxygen saturation 98% on ambient air, and weight 118 kg. Extraocular movements were intact, pupils were equal and reactive to light and accommodation, and there were no visual field deficits. Nondilated funduscopic examination revealed normal blood vessels, optic disc, and optic cup-to-disc ratio. Dentition was good with pink gingiva. Bilateral temples were nontender. There was normal range of motion and strength in the shoulders, hips, and lower extremities with no tenderness over the trochanters. Patellar and ankle reflexes were present and symmetric bilaterally. He had no rashes or ecchymoses.
The history of smoking, especially with concomitant alcohol intake, is a risk factor for head and neck cancer, and these malignancies can lead to facial pain. While the normal oral cavity exam argues against localized oral and dental causes of the patient’s symptoms, direct fiberoptic endoscopy should be considered. The neck should be examined for lymphadenopathy. Normal vital signs point away from severe infection. The lack of findings in the head and musculoskeletal regions does not exclude systemic etiologies such as rheumatologic conditions or neoplasm. Complete blood cell count and markers of inflammation including erythrocyte sedimentation rate (ESR) and C-reactive protein (CRP) levels should be obtained. Hip and pelvic radiographs should be obtained to evaluate for hip osteoarthritis, fractures, or osseous lesions.
The appointment occurred during evening hours and the patient declined further evaluation until the following morning, at which time laboratory studies revealed normal serum levels of electrolytes, blood urea nitrogen, and creatinine. White blood cell (WBC) count was 6,800/mm3 with an immature granulocyte ratio of 1.8% (normal, 0.0-0.5%), hemoglobin 13.2 g/dL, and platelet count 163,000/mm3. ESR was 118 mm/hr (normal, 0-15 mm/hr) and CRP was 1.5 mg/dL (normal, 0-0.75 mg/dL). Radiographs of the hips and pelvis showed osteoarthritis of the bilateral hip joints and degenerative disc disease of the lower lumbar spine.
Granulocytosis may occur in response to infection, rheumatologic conditions, and hematologic malignancies such as chronic myelogenous leukemia. While infectious etiologies (eg, abscess, osteomyelitis) are the most common cause of an extremely elevated ESR level, this patient does not have other signs or symptoms of infection such as fever or leukocytosis. Therefore, other common causes for an extremely elevated ESR level should be considered, including malignancy (eg, multiple myeloma, lymphoma, metastatic solid tumor) and autoimmune conditions (eg, rheumatoid arthritis, vasculitis). While multiple myeloma is the most common malignant etiology for extremely elevated ESR, the patient lacks signs of this condition such as anemia, elevated creatinine, or osteolytic lesions on radiographic imaging. Osteoarthritis identified on the radiographs may contribute to the patient’s hip pain but would not explain the patient’s jaw pain, weight loss, granulocytosis, and elevated ESR. These findings, taken together with the patient’s age, are most suggestive of GCA with possible coexisting PMR. Temporal artery biopsy should be obtained as it is the gold standard test for diagnosing GCA.
The patient was contacted by telephone that same day with laboratory test results. During the call, he endorsed increased jaw and temple pain. He was advised to proceed to the emergency department (ED) for timely evaluation and treatment.
Because GCA was being considered, ophthalmology performed an ocular examination in the ED, which demonstrated no signs of optic nerve or retinal ischemia. Computed tomography (CT) scan of the head and neck with intravenous contrast revealed no abscess or soft tissue abnormalities. Right temporal artery biopsy was performed.
The normal ocular examination does not exclude GCA, and temporal artery biopsy is appropriate. The mainstay of treatment for GCA is high-dose systemic glucocorticoids, which should not be withheld while awaiting biopsy results since ophthalmic artery inflammation may occur and threaten vision.
While GCA remains the leading diagnosis, malignant etiologies warrant further consideration because they are a common cause of extreme ESR elevation, particularly among older patients. The patient’s cancer screening history should be reviewed. The normal CT scan of the head and neck reduces the likelihood of localized solid tumor etiologies; however, additional CT imaging of the chest, abdomen, and pelvis is warranted to evaluate for metastatic solid tumors or lymphoma.
A 10-day course of prednisone 60 mg daily was prescribed for empiric treatment of GCA. The patient was discharged home with follow-up scheduled in rheumatology and primary care clinics. Pain in the jaw and temple resolved within several days.
Two weeks later, he presented to the rheumatology clinic. He noted 1 week of lower right back pain described as dull, aching, radiating to the lateral right hip, and occurring when transitioning from sitting to standing. He had no leg numbness, weakness, or change in bowel habits. Bladder habits were also unchanged, although he reported chronic urinary frequency and occasional incontinence. He reported further weight loss, this time an unintentional loss of 9 kg. He noted frequent sweating but no fever.
He reported a normal colonoscopy within the prior 5 years. Because these records were not available for review, a fecal immunochemical test was obtained and negative for hemoglobin. He had previously declined prostate cancer screening.
The resolution of jaw and temple pain with prednisone supports the presumed diagnosis of GCA. Up to half of patients with GCA may also have PMR, which can cause aching and stiffness in the arms, hips, and lumbar region, and pain may be abrupt in onset. However, PMR-related pain would be expected to improve rather than develop or worsen in the setting of high-dose glucocorticoid use. Therefore, other causes of acute-onset back pain must be considered.
While localized musculoskeletal etiologies such as lumbar muscle strain, radiculopathy, and vertebral compression fracture are possible, co-occurrence of unintentional weight loss and diaphoresis with elevated inflammatory markers suggests a systemic etiology. A neoplastic process with bony metastasis is possible. The reportedly normal colonoscopy and the negative fecal immunochemical test make colorectal cancer less likely. Inflammatory conditions such as ankylosing spondylitis and rheumatoid arthritis are also possible. Ankylosing spondylitis usually presents at a much younger age, however, and axial skeletal involvement in rheumatoid arthritis often involves the cervical spine and is usually seen after longstanding disease. Additionally, the hallmark of inflammatory back pain is morning stiffness which the patient does not endorse. Nonetheless, additional laboratory testing should include antinuclear antibody, rheumatoid factor, and anti-cyclic citrullinated peptide (anti-CCP) antibody. Vertebral osteomyelitis remains on the differential diagnosis, and repeat WBC count and inflammatory markers should be assessed. Lumbosacral radiographs should be obtained to rule out fracture.
Physical examination in the rheumatology clinic revealed a temperature of 37.0°C, heart rate 100 beats per minute, blood pressure 146/72 mmHg, respiratory rate 12 breaths per minute, and oxygen saturation 98% on ambient air. Weight was 109 kg. He was pale and diaphoretic. There was diffuse tenderness to palpation of the right-sided lumbar paraspinal muscles. Straight leg raise was negative bilaterally. Patellar reflexes and gait were normal.
Blood chemistries, renal function, and aminotransferase levels were normal. WBC count was 7,100/mm3, hemoglobin 8.0 g/dL, mean corpuscular volume 88.9 fL, platelet count 128,000/mm3, ESR 66 mm/hr, CRP 0.57 mg/dL, alkaline phosphatase 438 IU/L (normal, 30-130 IU/L), and thyroid-stimulating hormone 0.925 mU/L (normal, 0.34-5.60 mU/L). Testing for antinuclear antibodies, rheumatoid factor, and anti-CCP antibody was unremarkable. Prostate-specific antigen (PSA) level was 2.2 ng/mL (normal, 0-4 ng/mL). Urinalysis was unremarkable. Antibodies to hepatitis C and Treponema pallidum were negative. Interferon gamma release assay was negative.
Findings of new onset anemia and thrombocytopenia, in combination with elevated ESR and alkaline phosphatase level, are concerning for disseminated intravascular coagulation (DIC) and microangiopathic hemolytic anemia (MAHA), bone marrow infiltration of a metastatic neoplasm, or ineffective hematopoiesis caused by myelodysplastic syndromes or myelofibrosis.
Laboratory evaluation should include iron studies, lactate dehydrogenase (LDH), haptoglobin, fibrinogen, D-dimer, reticulocyte count, and peripheral blood smear to assess for hemolysis and erythrocyte morphology. Advanced imaging with lumbosacral magnetic resonance imaging (MRI) should be obtained to evaluate for focal etiologies of back pain such as disc herniation, abscess, marrow infiltration, and infarction.
Additional laboratory studies revealed a gamma-glutamyl transferase level of 49 IU/L (normal, 8-56 IU/L), LDH 288 IU/L (normal, 98-192 IU/L), haptoglobin 495 mg/dL (normal, 32-240 mg/dL), fibrinogen >700 mg/dL (normal, 225-550 mg/dL), D-dimer 693 ng/mL (normal, 200-250 ng/mL), serum iron 57 mcg/dL (normal, 33-150 mcg/dL), total iron binding capacity 286 mcg/dL (normal, 250-450 mcg/dL), ferritin 1,012 ng/mL (normal, 17.9-464 ng/mL), and reticulocyte count 2.9% (normal, 0.5-2.5%). Coagulation studies and serum protein electrophoresis were normal. Erythropoietin level was 109 mIU/mL (normal, 4.0-20.0 mIU/mL). Peripheral blood smear demonstrated moderate anemia with 8% nucleated erythrocytes per white blood cell (normal, 0%) and no circulating blasts.
MRI of the thoracolumbar spine and pelvis revealed diffusely abnormal bone marrow signal with multiple superimposed focal and poorly defined enhancing lesions along the lumbar spine marrow, sacrum, and bilateral iliac bones (Figure 1). Positron emission tomography/computed tomography (PET/CT) scan showed no scintigraphic evidence of metabolically active neoplastic, paraneoplastic, or inflammatory disorder.
The elevated haptoglobin, normal coagulation studies, and absence of fragmented erythrocytes on peripheral smear exclude an intravascular hemolytic process. The patient’s lower than expected reticulocyte count for the degree of anemia, elevated erythropoietin, and nucleated erythrocytes constitute a pattern that can be seen with bone marrow infiltration. There are no circulating blasts, making leukemia less likely. A solid organ tumor with bone metastases may cause enhancing lesions on MRI since this form of imaging is more sensitive than radiography for detecting skeletal malignancies. The negative PET/CT, however, does not reveal a primary tumor. Myelofibrosis is an infiltrative myeloproliferative disorder associated with nonspecific laboratory abnormalities, bone pain, weight loss, and night sweats that could cause diffuse MRI bone marrow signal alterations with normal PET/CT findings. However, myelofibrosis would not typically cause a significantly elevated ESR, and thus would be an unlikely cause for this patient’s presentation.
Given the constellation of symptoms, hematologic abnormalities, and bone marrow infiltration on imaging, hematology should be consulted to perform a bone marrow biopsy to assist with definitive diagnosis.
Bone marrow biopsy demonstrated metastatic adenocarcinoma consistent with prostatic origin (Figure 2). Bone scan demonstrated widespread osteoblastic metastases, which included the skull and temporal regions. These lesions were thought to be the cause of the patient’s original presenting symptom of jaw pain.
The patient was started on androgen deprivation therapy, initially with degarelix and subsequently leuprolide shots and abiraterone with prednisone. PSA was 0.08 ng/mL after 3 months of androgen deprivation therapy. His back and hip pain slowly improved.
DISCUSSION
Prostate cancer is the most common cancer in men with one out of every nine men diagnosed in his lifetime.1 While most men initially present with localized, curable disease,1 4% present with metastatic disease, an incidence that has been increasing since 2004.2 Despite available treatments, metastatic prostate cancer has a poor prognosis, with an average overall survival of approximately 5 years.3
Prostate cancer can be challenging to diagnose. Men with prostate cancer are commonly asymptomatic. Rarely, patients may present with hematuria, bony pain caused by metastasis, or obstructive urinary symptoms like hesitancy or incomplete bladder emptying. Our patient presented with jaw pain, which was ultimately attributed to osteoblastic lesions of the skull. Additionally, his history of urinary frequency and incontinence may have been clues to his underlying diagnosis of prostate cancer.
Prostate cancer screening remains highly nuanced and relies on shared decision-making between patients and healthcare providers. Clinical practice guidelines for early detection of prostate cancer recommend individualized PSA-based serologic screening.4,5 Specifically, the United States Preventive Services Task Force recommends screening men aged 55 to 69 years who desire screening and understand the potential harms associated with a positive test result. These harms may include psychological distress and complications from prostate biopsy (eg, pain or infection) or prostate cancer treatment (eg, erectile, urinary, and/or bowel dysfunction).4-6 The decision to screen can be guided by individuals’ risk factors including African American race, family history, and older age.
While our patient elected not to undergo routine prostate cancer screening, a PSA level was obtained during his diagnostic evaluation and highlights the limitations of PSA-based screening. A PSA level ≤4.0 ng/mL has 21% sensitivity and 91% specificity for detecting prostate cancer.7 PSA levels above 4.0 ng/mL warrant repeat testing and, if persistently elevated, referral to urology for possible prostate biopsy. PSA levels often correlate with burden of disease, and patients with PSA levels >20 ng/mL are referred for CT imaging to evaluate for metastatic disease.8 PSA’s poor sensitivity was underscored in a study by Thompson et al who evaluated the incidence of prostate cancer in men participating in the Prostate Cancer Prevention Trial with PSA levels of <4 ng/mL.9 In this study, 15% of men diagnosed with prostate cancer never had a PSA level >4 ng/mL.9 While most of the cancers in this study were low grade and may have been clinically insignificant, 15% demonstrated histologic signs of at least intermediate-risk disease. Our patient’s PSA level of 2.2 ng/mL was below the threshold that triggers additional evaluation even though he had widely metastatic prostate cancer.
Our patient’s severe jaw and temple pain, weight loss, and progressive hip pain were concerning for GCA. This vasculitis of large- and medium-sized arteries predominantly affects older adults with greatest incidence among those 70 years of age and older.10 Symptoms occur because of cranial artery inflammation and may include headache, visual disturbance, erythema or tenderness of the temporal artery, and jaw claudication. Extracranial inflammation may affect the thoracic aorta and its branches and rarely the abdominal aorta and lower limb arteries. Pelvic girdle pain more typically results from associated PMR. Patients may also note systemic symptoms such as fever, weight loss, and fatigue.
Prompt diagnostic testing is important when considering GCA. Most patients with GCA have ESR levels greater than 40 mm/hr.11 ESR is a laboratory test that measures the vertical distance erythrocytes travel in a column of blood over 1 hour; in the setting of inflammation, cells form clumps and travel more quickly than individual cells, resulting in a higher value. While moderate elevations in ESR may occur without an identifiable cause, extreme ESR levels—those above 100 mm/hr, as observed in our patient—are highly suggestive of certain serious conditions, including infection, malignancy, and autoimmune disease such as GCA.12,13 Temporal artery biopsy is the gold standard test to diagnose GCA. However, because of noncontiguous inflammation of the temporal artery, biopsies may be falsely negative. Thus, sampling of the contralateral temporal artery may be warranted if suspicion remains high.
As was the case for our patient, PET/CT is not reliable for diagnosing prostate cancer. In contrast to other malignancies (eg, lymphoma, lung cancer), prostate cancer typically does not display increased glucose metabolism. Moreover, the close proximity of the bladder and prostate can interfere with imaging interpretation because the fluorodeoxyglucose (FDG) tracer is excreted in the urine.14 The reported sensitivity of PET/CT for the diagnosis of prostate cancer ranges from 17%-65%.15,16 In a small study of men with metastatic prostate cancer, only 18% of bony metastases were FDG avid, and there was no correlation between FDG avidity and PSA level.15 Notably, although PET/CT includes CT imaging, this CT is used to map anatomic landmarks and is not separately interpreted by the radiologist. Thus, even if evidence of prostate cancer was apparent on traditional CT, it may be overlooked on PET/CT.
Several important points regarding diagnostic testing are raised by this case. First, PSA-based screening for prostate cancer may be falsely negative, even in the setting of widely metastatic disease. Second, extreme ESR elevation is a marker for serious underlying disease and warrants a thorough diagnostic evaluation. Finally, PET/CT has limited diagnostic utility in evaluating metastatic prostate cancer because of the normal rates of glucose metabolism. Our patient initially presented with jaw pain, yet his progressive physical symptoms and laboratory abnormalities prompted an evaluation which ultimately revealed the jaw-dropping diagnosis of PSA-negative, metastatic prostate cancer.
KEY TEACHING POINTS
- ESR levels greater than 100 mm/hr are highly suggestive of certain serious conditions including infection, autoimmune disease, and malignancy.
- PSA-based screening for prostate cancer can result in false negative test results. In one study, 15% of men diagnosed with prostate cancer never had a PSA level greater than 4 ng/mL (ie, the level at which repeat laboratory testing and/or referral to urology for possible prostate biopsy is advisable).
- PET/CT has limited diagnostic utility in evaluating metastatic prostate cancer, because prostate cancer cells typically demonstrate normal glucose metabolism.
Disclosures
Drs Griauzde, Northway, Yentz, and Houchens have nothing to disclose. Dr Saint reports personal fees from ISMIE Mutual Insurance Company during the conduct of the study, as well as personal fees from Jvion and Doximity outside the submitted work.
1. Prostate Cancer - Cancer Stat Facts. SEER. https://seer.cancer.gov/statfacts/html/prost.html. Accessed October 23, 2018.
2. Li J, Siegel DA, King JB. Stage-specific incidence rates and trends of prostate cancer by age, race, and ethnicity, United States, 2004-2014. Ann Epidemiol. 2018;28(5):328-330. https://doi.org/10.1016/j.annepidem.2018.03.001.
3. Sweeney CJ, Chen YH, Carducci M, et al. Chemohormonal therapy in metastatic hormone-sensitive prostate cancer. N Engl J Med. 2015;373(8):737-746. https://doi.org/10.1056/NEJMoa1503747.
4. US Preventive Services Task Force. Final Recommendation Statement: Prostate Cancer: Screening. https://www.uspreventiveservicestaskforce.org/Page/Document/RecommendationStatementFinal/prostate-cancer-screening1. Accessed August 8, 2018.
5. American Urological Association. http://www.auanet.org/guidelines/prostate-cancer-early-detection. Accessed August 8, 2018.
6. American Cancer Society. American Cancer Society Recommendations for Prostate Cancer Early Detection. https://www.cancer.org/cancer/prostate-cancer/early-detection/acs-recommendations.html. Accessed August 8, 2018.
7. Wolf AM, Wender RC, Etzioni RB, et al. American Cancer Society guideline for the early detection of prostate cancer: update 2010. CA Cancer J Clin. 2010;60(2):70-98. https://doi.org/10.3322/caac.20066.
8. Mohler JL, Lee RJ, Antonarakis ES, Higano CS, Richey S. NCCN Guidelines Index Table of Contents. Prostate Cancer. 2018:151.
9. Thompson IM, Pauler DK, Goodman PJ, et al. Prevalence of prostate cancer among men with a prostate-specific antigen level ≤4.0 ng per milliliter. N Engl J Med. 2004;350(22):2239-2246. https://doi.org/10.1056/NEJMoa031918.
10. Pioro MH. Primary care vasculitis: Polymyalgia rheumatica and giant cell arteritis. Prim Care. 2018;45(2):305-323. https://doi.org/10.1016/j.pop.2018.02.007.
11. Salvarani C, Hunder GG. Giant cell arteritis with low erythrocyte sedimentation rate: frequency of occurrence in a population-based study. Arthritis Rheum. 2001;45(2):140-145. https://doi.org/10.1002/1529-0131(200104)45:2<140::AID-ANR166>3.0.CO;2-2
12. Brigden ML. Clinical utility of the erythrocyte sedimentation rate. Am Fam Physician. 1999;60(5):1443-1450.
13. Daniels LM, Tosh PK, Fiala JA, Schleck CD, Mandrekar JN, Beckman TJ. Extremely elevated erythrocyte sedimentation rates: Associations with patients’ diagnoses, demographic dharacteristics, and comorbidities. Mayo Clin Proc. 2017;92(11):1636-1643. https://doi.org/10.1016/j.mayocp.2017.07.018.
14. Powles T, Murray I, Brock C, Oliver T, Avril N. Molecular positron emission tomography and PET/CT imaging in urological malignancies. Eur Urol. 2007;51(6):1511-1521. http://doi.org/10.1016/j.eururo.2007.01.061.
15. Yeh SDJ, Imbriaco M, Larson SM, et al. Detection of bony metastases of androgen-independent prostate cancer by PET-FDG. Nucl Med Biol. 1996;23(6):693-697. https://doi.org/10.1016/0969-8051(96)00044-3.
16. Perera M, Papa N, Christidis D, et al. Sensitivity, specificity, and predictors of positive 68ga-prostate-specific membrane antigen positron emission tomography in advanced prostate cancer: a systematic review and meta-analysis. Eur Urol. 2016;70(6):926-937. https://doi.org/10.1016/j.eururo.2016.06.021.
1. Prostate Cancer - Cancer Stat Facts. SEER. https://seer.cancer.gov/statfacts/html/prost.html. Accessed October 23, 2018.
2. Li J, Siegel DA, King JB. Stage-specific incidence rates and trends of prostate cancer by age, race, and ethnicity, United States, 2004-2014. Ann Epidemiol. 2018;28(5):328-330. https://doi.org/10.1016/j.annepidem.2018.03.001.
3. Sweeney CJ, Chen YH, Carducci M, et al. Chemohormonal therapy in metastatic hormone-sensitive prostate cancer. N Engl J Med. 2015;373(8):737-746. https://doi.org/10.1056/NEJMoa1503747.
4. US Preventive Services Task Force. Final Recommendation Statement: Prostate Cancer: Screening. https://www.uspreventiveservicestaskforce.org/Page/Document/RecommendationStatementFinal/prostate-cancer-screening1. Accessed August 8, 2018.
5. American Urological Association. http://www.auanet.org/guidelines/prostate-cancer-early-detection. Accessed August 8, 2018.
6. American Cancer Society. American Cancer Society Recommendations for Prostate Cancer Early Detection. https://www.cancer.org/cancer/prostate-cancer/early-detection/acs-recommendations.html. Accessed August 8, 2018.
7. Wolf AM, Wender RC, Etzioni RB, et al. American Cancer Society guideline for the early detection of prostate cancer: update 2010. CA Cancer J Clin. 2010;60(2):70-98. https://doi.org/10.3322/caac.20066.
8. Mohler JL, Lee RJ, Antonarakis ES, Higano CS, Richey S. NCCN Guidelines Index Table of Contents. Prostate Cancer. 2018:151.
9. Thompson IM, Pauler DK, Goodman PJ, et al. Prevalence of prostate cancer among men with a prostate-specific antigen level ≤4.0 ng per milliliter. N Engl J Med. 2004;350(22):2239-2246. https://doi.org/10.1056/NEJMoa031918.
10. Pioro MH. Primary care vasculitis: Polymyalgia rheumatica and giant cell arteritis. Prim Care. 2018;45(2):305-323. https://doi.org/10.1016/j.pop.2018.02.007.
11. Salvarani C, Hunder GG. Giant cell arteritis with low erythrocyte sedimentation rate: frequency of occurrence in a population-based study. Arthritis Rheum. 2001;45(2):140-145. https://doi.org/10.1002/1529-0131(200104)45:2<140::AID-ANR166>3.0.CO;2-2
12. Brigden ML. Clinical utility of the erythrocyte sedimentation rate. Am Fam Physician. 1999;60(5):1443-1450.
13. Daniels LM, Tosh PK, Fiala JA, Schleck CD, Mandrekar JN, Beckman TJ. Extremely elevated erythrocyte sedimentation rates: Associations with patients’ diagnoses, demographic dharacteristics, and comorbidities. Mayo Clin Proc. 2017;92(11):1636-1643. https://doi.org/10.1016/j.mayocp.2017.07.018.
14. Powles T, Murray I, Brock C, Oliver T, Avril N. Molecular positron emission tomography and PET/CT imaging in urological malignancies. Eur Urol. 2007;51(6):1511-1521. http://doi.org/10.1016/j.eururo.2007.01.061.
15. Yeh SDJ, Imbriaco M, Larson SM, et al. Detection of bony metastases of androgen-independent prostate cancer by PET-FDG. Nucl Med Biol. 1996;23(6):693-697. https://doi.org/10.1016/0969-8051(96)00044-3.
16. Perera M, Papa N, Christidis D, et al. Sensitivity, specificity, and predictors of positive 68ga-prostate-specific membrane antigen positron emission tomography in advanced prostate cancer: a systematic review and meta-analysis. Eur Urol. 2016;70(6):926-937. https://doi.org/10.1016/j.eururo.2016.06.021.
© 2020 Society of Hospital Medicine
Where Dysphagia Begins: Polypharmacy and Xerostomia
Xerostomia, the subjective sensation of dry mouth, is a common problem developed by geriatric patients. In practice, xerostomia can impair swallowing, speech, and oral hygiene, and if left unchecked, symptoms such as dysphagia and dysarthria can diminish patients’ quality of life (QOL). Salivary gland hypofunction (SGH) is the objective measure of decreased saliva production, determined by sialometry. Although xerostomia and SGH can coexist, the 2 conditions are not necessarily related.1-4 For this discussion, the term xerostomia will denote dry mouth with or without a concomitant diagnosis of SGH.
Xerostomia is seen in a wide variety of patients with varied comorbidities. It is commonly associated with Sjögren syndrome and head and neck irradiation. The diagnosis and treatment of xerostomia often involves rheumatologists, dentists, otolaryngologists, and oncologists. Additionally, most of the scientific literature about this topic exists in dental journals, such as the Journal of the American Dental Association and the British Dental Journal. Rarer still are studies in the veteran population.5
Faced with increasing time pressure to treat the many chronic diseases affecting aging veterans, health care providers (HCPs) tend to deprioritize diagnosing dry mouth. To that point, saliva is often not considered in the same category as other bodily fluids. According to Mandel, “It lacks the drama of blood, the sincerity of sweat…[and] the emotional appeal of tears.”6 In reality, saliva plays a critical role in the oral-digestive tract and in swallowing. It contains the first digestive enzymes in the gastrointestinal tract and is key for maintaining homeostasis in the oral cavity.7 Decreased saliva production results in difficulties with speech and mastication as well as problems of dysphagia, esophageal dysfunction, dysgeusia, nutritional compromises, new and recurrent dental caries, candidiasis, glossitis, impaired use of dentures, halitosis, and susceptibility to mucosal injury.7,8 Problems with the production of saliva may lead to loss of QOL, such as enjoying a meal or conversing with others.4
Although xerostomia is often associated with advanced age, it is more often explained by the diseases that afflict geriatric patients and the arsenal of medications used to treat them.2,9-16 Polypharmacy, the simultaneous use of multiple drugs by a single patient for ≥ 1 conditions, is an independent risk factor for xerostomia regardless of the types of medication taken.16 From 2005 to 2011, older adults in the US significantly increased their prescription medication use and dietary supplements. More than one-third of older adults used ≥ 5 prescription medications concurrently, and two-thirds of older adults used combinations of prescribed medications, over-the-counter medications, and dietary supplements.17 Several drug classes have the capacity to induce xerostomia, such as antihypertensives, antiulcer agents, anticholinergics, and antidepressants.2,5,12 Prevalence of dry mouth also can range from 10% to 46%, and women typically are more medicated and symptomatic.2,3,9,13,14,16 Xerostomia can also lead to depression and even reduce patients’ will to live.18 Despite xerostomia’s prevalence and impact on QOL, few patients report it as their chief symptom, and few physicians attempt to treat it.19
In order to target polypharmacy as a cause of dry mouth, the objectives for this study were to evaluate (1) the prevalence of xerostomia; (2) the relationship between xerostomia and other oral conditions; and (3) the impact of polypharmacy on dry mouth in a veteran population.
Methods
This is a retrospective cross-sectional study of all outpatient visits in fiscal year (FY) 2015 (October 1, 2014 to September 30, 2015) at the VA Palo Alto Health Care System (VAPAHCS), a tertiary care US Department of Veterans Affairs (VA) hospital. This study was approved by the Stanford University Institutional Review Board. All patients diagnosed with xerostomia in the 1-year study period were identified using ICD-9 diagnosis codes for dry mouth or disturbance of salivary gland secretion (527.7, 527.8, R68.2) and Systemized Nomenclature of Medicine Clinical Terms (SNOMED CT) codes covering dry mouth, xerostomia, aptyalism, absent salivary secretion, and disturbance of salivary secretion (87715008, 78948009). Data analysts in the VA Office of Business Analytics assisted in gathering data from the Veterans Information Systems and Technology Architecture (VistA) electronic health record.
The statistical analysis of that data was performed using Microsoft Excel. Age and gender distributions were determined for the patients. The relationship between xerostomia and the number and types of medications taken by patients also was examined. A previous Swedish study examining the link between dry mouth and quantities of medications used a scale ranging from 0 to ≥ 7 medications.16 The scale for this study was made wider to include the following groups: 0-2, 3-5, 6-8, 9-11, and ≥ 12 medications. Items that do not have xerogenic risks, such as medical supplies (eg, gloves, syringes, etc) and topical medications, were excluded from the analysis. Finally, the number of subjects with comorbid problems with speech, dentition, or swallowing (SDS) was recorded. Non-VA medications were included to capture any self- or externally prescribed xerogenic medications.
Results
Of the patients seen at VAPAHCS during FY 2015, 138 had a diagnostic code for xerostomia, including 129 men (93.5%) and 9 women (6.5%). The average (SD) age of this xerostomia cohort was 69.3 (12.6) years, and the 3 most common age groups were 60 to 69 years (37.7%), 70 to 79 years (28.3%), and 80 to 89 years (13.0%) (Table 1). Of those 138 patients with a xerostomia diagnosis, a majority (84; 60.9%) had at least 1 documented SDS problem (Table 2). Conversely, during FY 2015, although 4,971 patients seen at VAPAHCS had documented SDS problems, only 77 (1.5%) had a recorded diagnosis of xerostomia
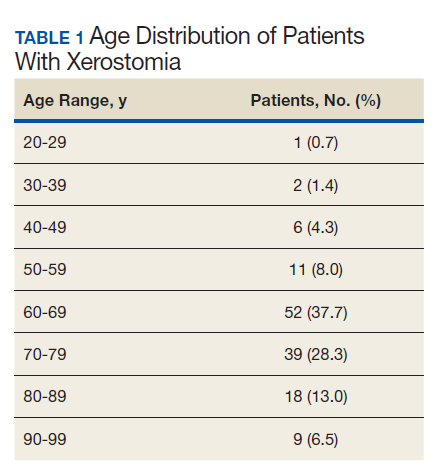
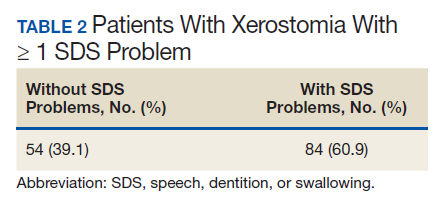
Of the 138 patients with xerostomia, 55 (39.9%) were taking ≥ 12 medications, more than twice as many patients as in any of the other groups studied (0-2, 3-5, 6-8, and 9-11 medications taken) (Table 3). On average, each patient with xerostomia filled prescriptions for 10.4 (SD, 7.2) different drugs. In this cohort of 138 patients diagnosed with xerostomia, antihypertensive medications or analgesics were taken by > 50% of patients, while statins, psychiatric medications, antibiotics, proton pump inhibitors, or drugs known to have anticholinergic activity were taken by > 40%. Antihistamines, anticonvulsants, diuretics, or inhaled respiratory agents were used by > 20% of the patients in this cohort (Table 4).
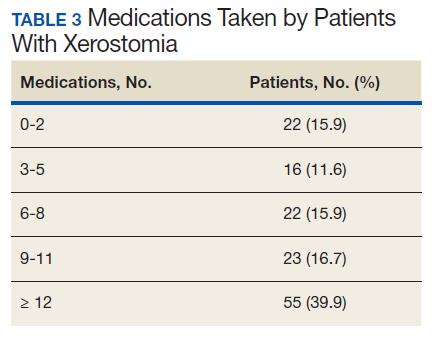
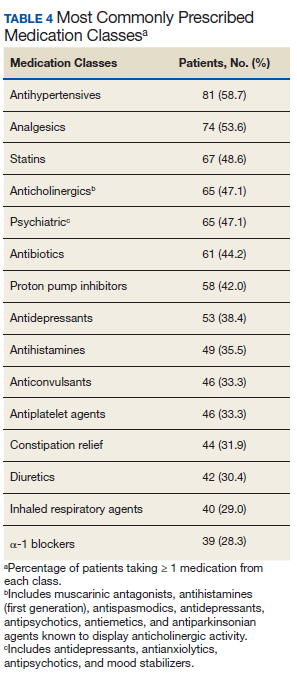
Data on each individual medication were split into 2 categories: the percentage of patients that filled ≥ 1 prescription for that drug, and the total number of prescriptions filled and/or refilled for that drug (ie, including all fills and refills made by individual patients). The 5 most widely used medications in this cohort were omeprazole (39.1%), docusate sodium (29.7%), gabapentin (29.7%), aspirin (27.5%), and hydrocodone/acetaminophen (26.1%) (Table 5). The 5 prescriptions that were cumulatively most filled and/or refilled were omeprazole (128), sildenafil citrate (108), gabapentin (101), hydrocodone/acetaminophen (100), and oxycodone (92) (Table 6). Though sildenafil citrate and oxycodone were among the most-filled prescriptions, these were not included in Table 5 as neither was taken by > 15% of the patients studied. These prescriptions were filled multiple times by a small subset of patients.
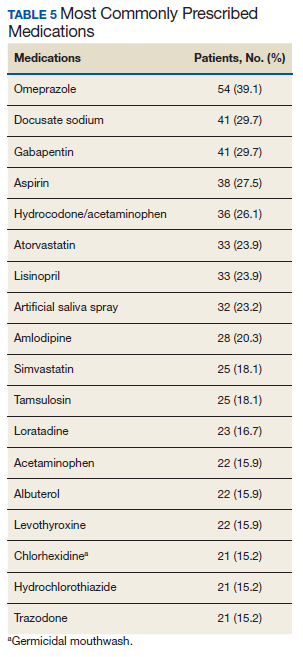
Regarding treatment for dry mouth, artificial saliva spray was one of the most widely used (23.2%) and the seventh most-filled prescription within this cohort (86). The only other medication taken by > 15% of patients in a formulation other than a tablet or capsule was chlorhexidine, a germicidal mouthwash used to improve oral care.
Also, 30 (21.7%) patients with a documented xerostomia diagnosis had a history of substance misuse involving use of ≥ 1 of tobacco, alcohol, marijuana, or other illicit drugs.
Discussion
Saliva is an essential component for the maintenance of normal oral health.20,21 Decreased saliva production causes problems, including difficulties with speech, mastication, dysphagia, changes in taste, dental caries, impaired use of prostheses, recurrent infections, halitosis, deterioration of soft tissues, and compromised QOL.22,23 Among patients with a diagnosed SDS abnormality who were seen at this facility during FY 2015, the prevalence of xerostomia was only 1.5%. However, the true prevalence and incidence of xerostomia among veterans is not known. Given the role of xerostomia as a common risk factor for SDS problems and the polypharmacy exhibited by those presented here with SDS problems, it is probable that xerostomia was underreported in this veteran cohort.
Additionally, although salivary acinar cells are known to atrophy with age, as is consistent with this xerostomia cohort’s average age (SD) of 69.3 (12.6) years, the development of dry mouth is a multifactorial process. The current scientific literature asserts that most salivary loss is due to local and systemic diseases, immunologic disorders, external radiation, and as was highlighted by this study, multiple prescription and nonprescription medications.24-26
It has also been demonstrated previously that dry mouth complaints and low salivary flow rates are directly proportional to the number of medications taken by patients.2,27-30 Polypharmacy is therefore an area of great interest, and ≥ 40 categories of xerogenic medications have been identified by investigators such as Sreebny and Schwartz.31 Among those, some of the most xerogenic medication classes include antihypertensives, antiulcer agents, anticholinergics, and antidepressants, are all very commonly consumed in this cohort of patients with dry mouth (58.7%, 42.0%, 47.1%, and 38.4%, respectively). The medication regimens within this cohort of veterans with xerostomia were prime examples of polypharmacy as each patient took an average (SD) of 10.4 (7.2) medications, 39.9% took ≥ 12, and 72.5% of patients with xerostomia were taking ≥ 6 prescription drugs during a 1-year period.
Given the dangers of polypharmacy, a more conservative approach to prescribing medications could feasibly help with preventing xerostomia and SGH. In practice, while clinicians try to avoid prescribing anticholinergics, antimuscarinics, and antihistaminergic drugs for geriatric patients, they are tasked with the complex management of medication adverse effects (AEs) when dealing with multiple health conditions. The clinicians’ primary responsibilities are to follow the standard of care and not to introduce unnecessary harm when managing patients, but they also must push for, stay abreast of, and conduct more basic research and clinical trials to inform, adjust, and improve our current standard.
Research into polypharmacy and its role in inducing dry mouth is ongoing. Twenty years ago, Thomson and colleagues identified reduced salivary flow in patients who used antianginals, thyroxine, diuretics, antidepressants, and medications for asthma, while only 5 years earlier Loesche and colleagues reported the role of antiulcer medications, such as proton pump inhibitors, in the development of xerostomia.2,32 Within the past 5 years, Viljakainen and colleagues and Ohara and colleagues have echoed some of those findings by identifying associations between xerostomia and agents that impact digestive organs.33,34 A strong association recently was identified between the use of antipsychotic drugs and xerostomia.35 Additionally, when attributing xerostomia to polypharmacy, the interaction between medications is often overlooked in favor of considering the raw number of prescriptions taken. Whereas 1 medication alone may not have drying properties, combinations of medications might be more likely to induce xerostomia. Thomson and colleagues suggested such a situation regarding the interaction between thyroxine and diuretics.36 Future studies should focus on identifying viable substitutes for existing medications that reduce risk for xerostomia without compromising the management of other serious conditions.
Treatment
Another pressing question for clinicians concerns artificial saliva. Although 23.2% of patients with dry mouth in this xerostomia cohort used artificial saliva, the efficacy of this treatment is still unproven. Saliva substitutes are often used by patients who cannot produce sufficient amounts of natural saliva. In practice, artificial saliva produces, at best, modest temporary improvement in dry mouth symptoms in up to 40% of patients. At worst, as put forth by the Cochrane Review, artificial saliva may be no better than placebo in treating dry mouth.37,38 The volumes needed for symptom relief are large, ranging between 40 mL and 150 mL per day depending on the substitute’s composition. Saliva substitutes also must be reapplied throughout each day. This is particularly bothersome when patients must wake up repeatedly to reapply the treatment at night.37 In short, these substances do not seem wholly effective in managing dry mouth, and other options must be made available to patients with refractory xerostomia when artificial saliva and lifestyle modifications fail.
For now, few alternatives exist. Chewing gums and lozenges help to stimulate salivary flow, as do muscarinic agonists like pilocarpine. Unfortunately, muscarinic agonists are seldom used due to cholinergic AEs. Humidifiers are effective in increasing nighttime moisture but are contraindicated in patients with dust mite allergies.39 Reservoir-based devices with automated pumps funnel water and/or salivary substitutes from a fanny pack into patients’ mouths for lubrication.37 Other more esoteric pharmacologic treatments include D-limonene, yohimbine, and amifostine, which purportedly protect salivary progenitor cells, increase peripheral cholinergic activity, and protect salivary glands from free-radical damage during radiation treatment, respectively. Although these agents have shown some promise, D-limonene is difficult to administer given the high dosage required for treatment, yohimbine hasn’t been seriously investigated for improving salivary secretion since 1997, and amifostine isn’t used widely due to its AE profile despite its US Food and Drug Administration approval for prevention of xerostomia.39
Substance Abuse
The impact of smoking on xerostomia remains controversial. Some studies report an association between active smoking and xerostomia; others suggest that the local irritant effect of tobacco smoke may increase salivary gland output.40,41 The same may be true for chronic alcohol use as there are no epidemiologic studies showing a causal relationship between alcohol use and xerostomia. Studies with rats that are chronically exposed to ethanol have found increased salivary flow rates.42 In the xerostomia cohort presented here, 30 patients (21.7%) had a documented history of substance misuse. That percentage is likely underestimated, as substance misuse is often underreported, and frequent use may not always constitute misuse. Therefore, nicotine exposure, alcohol exposure, illicit drug use, and vaping all should be considered during the workup of a patient with xerostomia.
Limitations
It is common for medications to remain in a patient’s health record long after that patient stops taking them. Developing methods to track when patients discontinue their prescriptions will be essential for clearing up uncertainty in our data and in other similar studies. This study also did not account for patients’ medication adherence and the duration of exposure to medications and illicit substances. Furthermore, the results of this veteran study are not easily generalizable as this cohort is disproportionately male, of advanced age, and especially prone to exhibiting both substance use and psychiatric diagnoses relative to the general population. As described by Viljakainen and colleagues, risk factors for xerostomia include advanced age, female gender, low body mass index (BMI), malnutrition, and depressive symptoms, but because the demographic scope of this veteran population was narrow, it was not possible to discern the impact of, for example, gender.33 Data on variables like BMI, malnutrition, and depressive symptoms were not available. For this study, xerostomia could only be considered as an all-or-nothing phenomenon because the dataset did not describe different levels of dry mouth severity (eg, mild, moderate, severe).
Additionally, past polypharmacy studies have acknowledged an inability to tell whether xerostomia is mainly due to medications or to underlying medical conditions. For example, for emphysema, ß-adrenergic stimulation from bronchodilators could cause dry mouth by thickening saliva and decreasing salivary volume, but the pathophysiology and/or cardinal symptoms of emphysema, including chronic obstructive pulmonary disease-associated tachypnea, might contribute independently to dryness.
Though we can make inferences based on the medications taken by this cohort (eg, those taking antihypertensives have high blood pressure), this dataset did not explicitly detail comorbid conditions and ICD codes for chronic diseases that commonly arise with xerostomia. Those conditions, however, are of great clinical importance. Diabetes mellitus, HIV/AIDS, and, classically, Sjögren syndrome, all are known to cause dry mouth.43 Identifying new conditions that co-occur with xerostomia would allow clinicians to describe the root causes of and risk factors for dry mouth and SDS conditions in greater detail. Patients with dry mouth without SDS problems in this dataset are of particular interest as closer examination of their medications and comorbid conditions could help us understand why some individuals and not others develop SDS problems. The subjects of how comorbidities contribute to dry mouth and how their influences can be judged independently from the effects of medications are of great interest to us and will be investigated rigorously in our future studies.
Conclusions
In this cohort, few patients with SDS problems had documentation of a concomitant xerostomia diagnosis. This could represent a true infrequency of dry mouth or more likely, an underrecognition by clinicians. Heightened physician awareness regarding the signs and symptoms of and risk factors for xerostomia is needed to improve providers’ ability to diagnose this condition.
In particular, polypharmacy should be a major consideration when evaluating patients for xerostomia. This continues to be an important area of research, and some of the latest data on polypharmacy among older patients were compiled in a recent meta-analysis by Tan and colleagues. The authors of that systematic review reiterated the significant association between salivary gland hypofunction and the number of medications taken by patients. They also advocated for the creation of a risk score for medication-induced dry mouth to aid in medication management.44 Per their recommendations, it is now as crucial as ever to consider the numbers and types of medications taken by patients, to discontinue unnecessary prescriptions when possible, and to continue developing new strategies for preventing and treating xerostomia.
1. Thomson WM, Chalmers JM, Spencer AJ, Ketabi M. The occurrence of xerostomia and salivary gland hypofunction in a population-based sample of older South Australians. Spec Care Dentist. 1999;19(1):20-23.
2. Thomson WM, Chalmers JM, Spencer AJ, Slade GD. Medication and dry mouth: findings from a cohort study of older people. J Public Health Dent. 2000;60(1):12-20.
3. Sasportas LS, Hosford DN, Sodini MA, et al. Cost-effectiveness landscape analysis of treatments addressing xerostomia in patients receiving head and neck radiation therapy. Oral Surg Oral Med Oral Pathol Oral Radiol. 2013;116(1):e37-e51.
4. Bivona PL. Xerostomia. A common problem among the elderly. N Y State Dent J. 1998;64(6):46-52.
5. Ness J, Hoth A, Barnett MJ, Shorr RI, Kaboli PJ. Anticholinergic medications in community-dwelling older veterans: prevalence of anticholinergic symptoms, symptom burden, and adverse drug events. Am J Geriatr Pharmacother. 2006;4(1):42-51.
6. Mandel ID. The diagnostic uses of saliva. J Oral Pathol Med. 1990;19(3):119-125.
7. Friedman PK, Isfeld D. Xerostomia: the “invisible” oral health condition. J Mass Dent Soc. 2008;57(3):42-44.
8. Ship JA, McCutcheon JA, Spivakovsky S, Kerr AR. Safety and effectiveness of topical dry mouth products containing olive oil, betaine, and xylitol in reducing xerostomia for polypharmacy-induced dry mouth. J Oral Rehabil. 2007;34(10):724-732.
9. Field EA, Fear S, Higham SM, et al. Age and medication are significant risk factors for xerostomia in an English population, attending general dental practice. Gerodontology. 2001;18(1):21-24.
10. Villa A, Connell CL, Abati S. Diagnosis and management of xerostomia and hyposalivation. Ther Clin Risk Manag. 2015;11:45-51.
11. Geuiros LA, Soares MS, Leao JC. Impact of ageing and drug consumption on oral health. Gerodontology. 2009;26(4):297-301.
12. Singh ML, Papas A. Oral implications of polypharmacy in the elderly. Dent Clin North Am. 2014;58(4):783-796.
13. Shinkai RS, Hatch JP, Schmidt CB, Sartori EA. Exposure to the oral side effects of medication in a community-based sample. Spec Care Dentist. 2006;26(3):116-120.
14. Hopcraft MS, Tan C. Xerostomia: an update for clinicians. Aust Dent J. 2010;55(3):238-244; quiz 353.
15. Ettinger RL. Review: xerostomia: a symptom which acts like a disease. Age Ageing. 1996;25(5):409-412.
16. Nederfors T, Isaksson R, Mornstad H, Dahlof C. Prevalence of perceived symptoms of dry mouth in an adult Swedish population—relation to age, sex and pharmacotherapy. Community Dent Oral Epidemiol. 1997;25(3):211-216.
17. Qato DM, Wilder J, Schumm LP, Gillet V, Alexander GC. Changes in prescription and over-the-counter medication and dietary supplement use among older adults in the United States, 2005 vs 2011. JAMA Intern Med. 2016;176(4):473-482.
18. Dirix P, Nuyts S, Vander Poorten V, Delaere P, Van den Boaert W. The influence of xerostomia after radiotherapy on quality of life: results of a questionnaire in head and neck cancer. Support Care Cancer. 2008;16(2):171-179.
19. Sreebny LM, Valdini A. Xerostomia. A neglected symptom. Arch Intern Med. 1987;147(7):1333-1337.
20. Sreebny LM. Saliva in health and disease: an appraisal and update. Int Dent J. 2000;50(3):140-161.
21. Amerongen AV, Veeran EC. Saliva—the defender of the oral cavity. Oral Dis. 2002;8(1):12-22.
22. Guggenheimer J, Moore PA. Xerostomia: etiology, recognition and treatment. J Am Dent Assoc. 2003;134(1):61-69; quiz 118-119.
23. Atkinson JC, Baum BJ. Salivary enhancement: current status and future therapies. J Dent Educ. 2001;65(10):1096-1101.
24. Narhi TO, Meurman JH, Ainamo A. Xerostomia and hyposalivation: causes, consequences and treatment in the elderly. Drugs Aging. 1999;15(2):103-116.
25. Ship JA, Baum BJ. Is reduced salivary flow normal in old people? Lancet. 1990;336(8729):1507.
26. Ghezzi EM, Wagner-Lange LA, Schork MA, et al. Longitudinal influence of age, menopause, hormone replacement therapy, and other medications on parotid flow rates in healthy women. J Gerontol A Biol Sci Med Sci. 2000;55(1):M34-M42.
27. Fox PC. Acquired salivary dysfunction. Drugs and radiation. Ann N Y Acad Sci. 1998;842:132-137.
28. Bergdahl M, Bergdahl J. Low unstimulated salivary flow and subjective oral dryness: association with medication, anxiety, depression, and stress. J Dent Res. 2000;79(9):1652-1658.
29. Ship JA, Pillemer SR, Baum BJ. Xerostomia and the geriatric patient. J Am Geriatr Soc. 2002;50(3):535-543.
30. Sreebny LM, Valdini A, Yu A. Xerostomia. Part II: Relationship to nonoral symptoms, drugs, and diseases. Oral Surg Oral Med Oral Pathol. 1989;68(4):419-427.
31. Sreebny LM, Schwartz SS. A reference guide to drugs and dry mouth—2nd edition. Gerodontology. 1997;14(1):33-47.
32. Loesche WJ, Bromberg J, Terpenning MS, et al. Xerostomia, xerogenic medications and food avoidances in selected geriatric groups. J Am Geriatr Soc. 1995;43(4):401-407.

33. Viljakainen S, Nykanen I, Ahonen R, et al. Xerostomia among older home care clients. Community Dent Oral Epidemiol. 2016;44(3):232-238.
34. Ohara Y, Hirano H, Yoshida H, et al. Prevalence and factors associated with xerostomia and hyposalivation among community-dwelling older people in Japan. Gerodontology. 2016;33(1):20-27.
35. Okamoto A, Miyachi H, Tanaka K, Chikazu D, Miyaoka H. Relationship between xerostomia and psychotropic drugs in patients with schizophrenia: evaluation using an oral moisture meter. J Clin Pharm Ther. 2016;41(6):684-688.
36. Thomson WM. Dry mouth and older people. Aust Dent J. 2015;60(suppl 1):54-63.
37. Sasportas LS, Hosford AT, Sodini MA, et al. Cost-effectiveness landscape analysis of treatments addressing xerostomia in patients receiving head and neck radiation therapy. Oral Surg Oral Med Oral Pathol Oral Radiol. 2013;116(1):e37-e51.
38. Furness S, Worthington HV, Bryan G, Birchenough S, McMillan R. Interventions for the management of dry mouth: topical therapies. Cochrane Database Syst Rev. 2011;(12):CD008924.
39. Roblegg E, Coughran A, Sirjani D. Saliva: an all-rounder of our body. Eur J Pharm Biopharm. 2019;142:133-141.
40. Billings RJ, Proskin HM, Moss ME. Xerostomia and associated factors in a community-dwelling adult population. Community Dent Oral Epidemiol. 1996;24(5):312-316.
41. Norlen P, Ostberg H, Bjorn AL. Relationship between general health, social factors and oral health in women at the age of retirement. Community Dent Oral Epidemiol. 1991;19(5):296-301.
42. Berry MR, Scott J. Functional and structural adaptation of the parotid gland to medium-term chronic ethanol exposure in the rat. Alcohol Alcoholism. 1990;25(5):523-531.
43. von Bultzingslowen I, Sollecito TP, Fox PC, et al. Salivary dysfunction associated with systemic diseases: systematic review and clinical management recommendations. Oral Surg Oral Med Oral Pathol Oral Radiol. 2007;103:S57.e1-e15.
44. Tan ECK, Lexomboon D, Sandborgh-Englund G, et al. Medications that cause dry mouth as an adverse effect in older people: a systematic review and metaanalysis. J Am Geriatr Soc. 2018;66(1):76-84.
Xerostomia, the subjective sensation of dry mouth, is a common problem developed by geriatric patients. In practice, xerostomia can impair swallowing, speech, and oral hygiene, and if left unchecked, symptoms such as dysphagia and dysarthria can diminish patients’ quality of life (QOL). Salivary gland hypofunction (SGH) is the objective measure of decreased saliva production, determined by sialometry. Although xerostomia and SGH can coexist, the 2 conditions are not necessarily related.1-4 For this discussion, the term xerostomia will denote dry mouth with or without a concomitant diagnosis of SGH.
Xerostomia is seen in a wide variety of patients with varied comorbidities. It is commonly associated with Sjögren syndrome and head and neck irradiation. The diagnosis and treatment of xerostomia often involves rheumatologists, dentists, otolaryngologists, and oncologists. Additionally, most of the scientific literature about this topic exists in dental journals, such as the Journal of the American Dental Association and the British Dental Journal. Rarer still are studies in the veteran population.5
Faced with increasing time pressure to treat the many chronic diseases affecting aging veterans, health care providers (HCPs) tend to deprioritize diagnosing dry mouth. To that point, saliva is often not considered in the same category as other bodily fluids. According to Mandel, “It lacks the drama of blood, the sincerity of sweat…[and] the emotional appeal of tears.”6 In reality, saliva plays a critical role in the oral-digestive tract and in swallowing. It contains the first digestive enzymes in the gastrointestinal tract and is key for maintaining homeostasis in the oral cavity.7 Decreased saliva production results in difficulties with speech and mastication as well as problems of dysphagia, esophageal dysfunction, dysgeusia, nutritional compromises, new and recurrent dental caries, candidiasis, glossitis, impaired use of dentures, halitosis, and susceptibility to mucosal injury.7,8 Problems with the production of saliva may lead to loss of QOL, such as enjoying a meal or conversing with others.4
Although xerostomia is often associated with advanced age, it is more often explained by the diseases that afflict geriatric patients and the arsenal of medications used to treat them.2,9-16 Polypharmacy, the simultaneous use of multiple drugs by a single patient for ≥ 1 conditions, is an independent risk factor for xerostomia regardless of the types of medication taken.16 From 2005 to 2011, older adults in the US significantly increased their prescription medication use and dietary supplements. More than one-third of older adults used ≥ 5 prescription medications concurrently, and two-thirds of older adults used combinations of prescribed medications, over-the-counter medications, and dietary supplements.17 Several drug classes have the capacity to induce xerostomia, such as antihypertensives, antiulcer agents, anticholinergics, and antidepressants.2,5,12 Prevalence of dry mouth also can range from 10% to 46%, and women typically are more medicated and symptomatic.2,3,9,13,14,16 Xerostomia can also lead to depression and even reduce patients’ will to live.18 Despite xerostomia’s prevalence and impact on QOL, few patients report it as their chief symptom, and few physicians attempt to treat it.19
In order to target polypharmacy as a cause of dry mouth, the objectives for this study were to evaluate (1) the prevalence of xerostomia; (2) the relationship between xerostomia and other oral conditions; and (3) the impact of polypharmacy on dry mouth in a veteran population.
Methods
This is a retrospective cross-sectional study of all outpatient visits in fiscal year (FY) 2015 (October 1, 2014 to September 30, 2015) at the VA Palo Alto Health Care System (VAPAHCS), a tertiary care US Department of Veterans Affairs (VA) hospital. This study was approved by the Stanford University Institutional Review Board. All patients diagnosed with xerostomia in the 1-year study period were identified using ICD-9 diagnosis codes for dry mouth or disturbance of salivary gland secretion (527.7, 527.8, R68.2) and Systemized Nomenclature of Medicine Clinical Terms (SNOMED CT) codes covering dry mouth, xerostomia, aptyalism, absent salivary secretion, and disturbance of salivary secretion (87715008, 78948009). Data analysts in the VA Office of Business Analytics assisted in gathering data from the Veterans Information Systems and Technology Architecture (VistA) electronic health record.
The statistical analysis of that data was performed using Microsoft Excel. Age and gender distributions were determined for the patients. The relationship between xerostomia and the number and types of medications taken by patients also was examined. A previous Swedish study examining the link between dry mouth and quantities of medications used a scale ranging from 0 to ≥ 7 medications.16 The scale for this study was made wider to include the following groups: 0-2, 3-5, 6-8, 9-11, and ≥ 12 medications. Items that do not have xerogenic risks, such as medical supplies (eg, gloves, syringes, etc) and topical medications, were excluded from the analysis. Finally, the number of subjects with comorbid problems with speech, dentition, or swallowing (SDS) was recorded. Non-VA medications were included to capture any self- or externally prescribed xerogenic medications.
Results
Of the patients seen at VAPAHCS during FY 2015, 138 had a diagnostic code for xerostomia, including 129 men (93.5%) and 9 women (6.5%). The average (SD) age of this xerostomia cohort was 69.3 (12.6) years, and the 3 most common age groups were 60 to 69 years (37.7%), 70 to 79 years (28.3%), and 80 to 89 years (13.0%) (Table 1). Of those 138 patients with a xerostomia diagnosis, a majority (84; 60.9%) had at least 1 documented SDS problem (Table 2). Conversely, during FY 2015, although 4,971 patients seen at VAPAHCS had documented SDS problems, only 77 (1.5%) had a recorded diagnosis of xerostomia
Of the 138 patients with xerostomia, 55 (39.9%) were taking ≥ 12 medications, more than twice as many patients as in any of the other groups studied (0-2, 3-5, 6-8, and 9-11 medications taken) (Table 3). On average, each patient with xerostomia filled prescriptions for 10.4 (SD, 7.2) different drugs. In this cohort of 138 patients diagnosed with xerostomia, antihypertensive medications or analgesics were taken by > 50% of patients, while statins, psychiatric medications, antibiotics, proton pump inhibitors, or drugs known to have anticholinergic activity were taken by > 40%. Antihistamines, anticonvulsants, diuretics, or inhaled respiratory agents were used by > 20% of the patients in this cohort (Table 4).
Data on each individual medication were split into 2 categories: the percentage of patients that filled ≥ 1 prescription for that drug, and the total number of prescriptions filled and/or refilled for that drug (ie, including all fills and refills made by individual patients). The 5 most widely used medications in this cohort were omeprazole (39.1%), docusate sodium (29.7%), gabapentin (29.7%), aspirin (27.5%), and hydrocodone/acetaminophen (26.1%) (Table 5). The 5 prescriptions that were cumulatively most filled and/or refilled were omeprazole (128), sildenafil citrate (108), gabapentin (101), hydrocodone/acetaminophen (100), and oxycodone (92) (Table 6). Though sildenafil citrate and oxycodone were among the most-filled prescriptions, these were not included in Table 5 as neither was taken by > 15% of the patients studied. These prescriptions were filled multiple times by a small subset of patients.
Regarding treatment for dry mouth, artificial saliva spray was one of the most widely used (23.2%) and the seventh most-filled prescription within this cohort (86). The only other medication taken by > 15% of patients in a formulation other than a tablet or capsule was chlorhexidine, a germicidal mouthwash used to improve oral care.
Also, 30 (21.7%) patients with a documented xerostomia diagnosis had a history of substance misuse involving use of ≥ 1 of tobacco, alcohol, marijuana, or other illicit drugs.
Discussion
Saliva is an essential component for the maintenance of normal oral health.20,21 Decreased saliva production causes problems, including difficulties with speech, mastication, dysphagia, changes in taste, dental caries, impaired use of prostheses, recurrent infections, halitosis, deterioration of soft tissues, and compromised QOL.22,23 Among patients with a diagnosed SDS abnormality who were seen at this facility during FY 2015, the prevalence of xerostomia was only 1.5%. However, the true prevalence and incidence of xerostomia among veterans is not known. Given the role of xerostomia as a common risk factor for SDS problems and the polypharmacy exhibited by those presented here with SDS problems, it is probable that xerostomia was underreported in this veteran cohort.
Additionally, although salivary acinar cells are known to atrophy with age, as is consistent with this xerostomia cohort’s average age (SD) of 69.3 (12.6) years, the development of dry mouth is a multifactorial process. The current scientific literature asserts that most salivary loss is due to local and systemic diseases, immunologic disorders, external radiation, and as was highlighted by this study, multiple prescription and nonprescription medications.24-26
It has also been demonstrated previously that dry mouth complaints and low salivary flow rates are directly proportional to the number of medications taken by patients.2,27-30 Polypharmacy is therefore an area of great interest, and ≥ 40 categories of xerogenic medications have been identified by investigators such as Sreebny and Schwartz.31 Among those, some of the most xerogenic medication classes include antihypertensives, antiulcer agents, anticholinergics, and antidepressants, are all very commonly consumed in this cohort of patients with dry mouth (58.7%, 42.0%, 47.1%, and 38.4%, respectively). The medication regimens within this cohort of veterans with xerostomia were prime examples of polypharmacy as each patient took an average (SD) of 10.4 (7.2) medications, 39.9% took ≥ 12, and 72.5% of patients with xerostomia were taking ≥ 6 prescription drugs during a 1-year period.
Given the dangers of polypharmacy, a more conservative approach to prescribing medications could feasibly help with preventing xerostomia and SGH. In practice, while clinicians try to avoid prescribing anticholinergics, antimuscarinics, and antihistaminergic drugs for geriatric patients, they are tasked with the complex management of medication adverse effects (AEs) when dealing with multiple health conditions. The clinicians’ primary responsibilities are to follow the standard of care and not to introduce unnecessary harm when managing patients, but they also must push for, stay abreast of, and conduct more basic research and clinical trials to inform, adjust, and improve our current standard.
Research into polypharmacy and its role in inducing dry mouth is ongoing. Twenty years ago, Thomson and colleagues identified reduced salivary flow in patients who used antianginals, thyroxine, diuretics, antidepressants, and medications for asthma, while only 5 years earlier Loesche and colleagues reported the role of antiulcer medications, such as proton pump inhibitors, in the development of xerostomia.2,32 Within the past 5 years, Viljakainen and colleagues and Ohara and colleagues have echoed some of those findings by identifying associations between xerostomia and agents that impact digestive organs.33,34 A strong association recently was identified between the use of antipsychotic drugs and xerostomia.35 Additionally, when attributing xerostomia to polypharmacy, the interaction between medications is often overlooked in favor of considering the raw number of prescriptions taken. Whereas 1 medication alone may not have drying properties, combinations of medications might be more likely to induce xerostomia. Thomson and colleagues suggested such a situation regarding the interaction between thyroxine and diuretics.36 Future studies should focus on identifying viable substitutes for existing medications that reduce risk for xerostomia without compromising the management of other serious conditions.
Treatment
Another pressing question for clinicians concerns artificial saliva. Although 23.2% of patients with dry mouth in this xerostomia cohort used artificial saliva, the efficacy of this treatment is still unproven. Saliva substitutes are often used by patients who cannot produce sufficient amounts of natural saliva. In practice, artificial saliva produces, at best, modest temporary improvement in dry mouth symptoms in up to 40% of patients. At worst, as put forth by the Cochrane Review, artificial saliva may be no better than placebo in treating dry mouth.37,38 The volumes needed for symptom relief are large, ranging between 40 mL and 150 mL per day depending on the substitute’s composition. Saliva substitutes also must be reapplied throughout each day. This is particularly bothersome when patients must wake up repeatedly to reapply the treatment at night.37 In short, these substances do not seem wholly effective in managing dry mouth, and other options must be made available to patients with refractory xerostomia when artificial saliva and lifestyle modifications fail.
For now, few alternatives exist. Chewing gums and lozenges help to stimulate salivary flow, as do muscarinic agonists like pilocarpine. Unfortunately, muscarinic agonists are seldom used due to cholinergic AEs. Humidifiers are effective in increasing nighttime moisture but are contraindicated in patients with dust mite allergies.39 Reservoir-based devices with automated pumps funnel water and/or salivary substitutes from a fanny pack into patients’ mouths for lubrication.37 Other more esoteric pharmacologic treatments include D-limonene, yohimbine, and amifostine, which purportedly protect salivary progenitor cells, increase peripheral cholinergic activity, and protect salivary glands from free-radical damage during radiation treatment, respectively. Although these agents have shown some promise, D-limonene is difficult to administer given the high dosage required for treatment, yohimbine hasn’t been seriously investigated for improving salivary secretion since 1997, and amifostine isn’t used widely due to its AE profile despite its US Food and Drug Administration approval for prevention of xerostomia.39
Substance Abuse
The impact of smoking on xerostomia remains controversial. Some studies report an association between active smoking and xerostomia; others suggest that the local irritant effect of tobacco smoke may increase salivary gland output.40,41 The same may be true for chronic alcohol use as there are no epidemiologic studies showing a causal relationship between alcohol use and xerostomia. Studies with rats that are chronically exposed to ethanol have found increased salivary flow rates.42 In the xerostomia cohort presented here, 30 patients (21.7%) had a documented history of substance misuse. That percentage is likely underestimated, as substance misuse is often underreported, and frequent use may not always constitute misuse. Therefore, nicotine exposure, alcohol exposure, illicit drug use, and vaping all should be considered during the workup of a patient with xerostomia.
Limitations
It is common for medications to remain in a patient’s health record long after that patient stops taking them. Developing methods to track when patients discontinue their prescriptions will be essential for clearing up uncertainty in our data and in other similar studies. This study also did not account for patients’ medication adherence and the duration of exposure to medications and illicit substances. Furthermore, the results of this veteran study are not easily generalizable as this cohort is disproportionately male, of advanced age, and especially prone to exhibiting both substance use and psychiatric diagnoses relative to the general population. As described by Viljakainen and colleagues, risk factors for xerostomia include advanced age, female gender, low body mass index (BMI), malnutrition, and depressive symptoms, but because the demographic scope of this veteran population was narrow, it was not possible to discern the impact of, for example, gender.33 Data on variables like BMI, malnutrition, and depressive symptoms were not available. For this study, xerostomia could only be considered as an all-or-nothing phenomenon because the dataset did not describe different levels of dry mouth severity (eg, mild, moderate, severe).
Additionally, past polypharmacy studies have acknowledged an inability to tell whether xerostomia is mainly due to medications or to underlying medical conditions. For example, for emphysema, ß-adrenergic stimulation from bronchodilators could cause dry mouth by thickening saliva and decreasing salivary volume, but the pathophysiology and/or cardinal symptoms of emphysema, including chronic obstructive pulmonary disease-associated tachypnea, might contribute independently to dryness.
Though we can make inferences based on the medications taken by this cohort (eg, those taking antihypertensives have high blood pressure), this dataset did not explicitly detail comorbid conditions and ICD codes for chronic diseases that commonly arise with xerostomia. Those conditions, however, are of great clinical importance. Diabetes mellitus, HIV/AIDS, and, classically, Sjögren syndrome, all are known to cause dry mouth.43 Identifying new conditions that co-occur with xerostomia would allow clinicians to describe the root causes of and risk factors for dry mouth and SDS conditions in greater detail. Patients with dry mouth without SDS problems in this dataset are of particular interest as closer examination of their medications and comorbid conditions could help us understand why some individuals and not others develop SDS problems. The subjects of how comorbidities contribute to dry mouth and how their influences can be judged independently from the effects of medications are of great interest to us and will be investigated rigorously in our future studies.
Conclusions
In this cohort, few patients with SDS problems had documentation of a concomitant xerostomia diagnosis. This could represent a true infrequency of dry mouth or more likely, an underrecognition by clinicians. Heightened physician awareness regarding the signs and symptoms of and risk factors for xerostomia is needed to improve providers’ ability to diagnose this condition.
In particular, polypharmacy should be a major consideration when evaluating patients for xerostomia. This continues to be an important area of research, and some of the latest data on polypharmacy among older patients were compiled in a recent meta-analysis by Tan and colleagues. The authors of that systematic review reiterated the significant association between salivary gland hypofunction and the number of medications taken by patients. They also advocated for the creation of a risk score for medication-induced dry mouth to aid in medication management.44 Per their recommendations, it is now as crucial as ever to consider the numbers and types of medications taken by patients, to discontinue unnecessary prescriptions when possible, and to continue developing new strategies for preventing and treating xerostomia.
Xerostomia, the subjective sensation of dry mouth, is a common problem developed by geriatric patients. In practice, xerostomia can impair swallowing, speech, and oral hygiene, and if left unchecked, symptoms such as dysphagia and dysarthria can diminish patients’ quality of life (QOL). Salivary gland hypofunction (SGH) is the objective measure of decreased saliva production, determined by sialometry. Although xerostomia and SGH can coexist, the 2 conditions are not necessarily related.1-4 For this discussion, the term xerostomia will denote dry mouth with or without a concomitant diagnosis of SGH.
Xerostomia is seen in a wide variety of patients with varied comorbidities. It is commonly associated with Sjögren syndrome and head and neck irradiation. The diagnosis and treatment of xerostomia often involves rheumatologists, dentists, otolaryngologists, and oncologists. Additionally, most of the scientific literature about this topic exists in dental journals, such as the Journal of the American Dental Association and the British Dental Journal. Rarer still are studies in the veteran population.5
Faced with increasing time pressure to treat the many chronic diseases affecting aging veterans, health care providers (HCPs) tend to deprioritize diagnosing dry mouth. To that point, saliva is often not considered in the same category as other bodily fluids. According to Mandel, “It lacks the drama of blood, the sincerity of sweat…[and] the emotional appeal of tears.”6 In reality, saliva plays a critical role in the oral-digestive tract and in swallowing. It contains the first digestive enzymes in the gastrointestinal tract and is key for maintaining homeostasis in the oral cavity.7 Decreased saliva production results in difficulties with speech and mastication as well as problems of dysphagia, esophageal dysfunction, dysgeusia, nutritional compromises, new and recurrent dental caries, candidiasis, glossitis, impaired use of dentures, halitosis, and susceptibility to mucosal injury.7,8 Problems with the production of saliva may lead to loss of QOL, such as enjoying a meal or conversing with others.4
Although xerostomia is often associated with advanced age, it is more often explained by the diseases that afflict geriatric patients and the arsenal of medications used to treat them.2,9-16 Polypharmacy, the simultaneous use of multiple drugs by a single patient for ≥ 1 conditions, is an independent risk factor for xerostomia regardless of the types of medication taken.16 From 2005 to 2011, older adults in the US significantly increased their prescription medication use and dietary supplements. More than one-third of older adults used ≥ 5 prescription medications concurrently, and two-thirds of older adults used combinations of prescribed medications, over-the-counter medications, and dietary supplements.17 Several drug classes have the capacity to induce xerostomia, such as antihypertensives, antiulcer agents, anticholinergics, and antidepressants.2,5,12 Prevalence of dry mouth also can range from 10% to 46%, and women typically are more medicated and symptomatic.2,3,9,13,14,16 Xerostomia can also lead to depression and even reduce patients’ will to live.18 Despite xerostomia’s prevalence and impact on QOL, few patients report it as their chief symptom, and few physicians attempt to treat it.19
In order to target polypharmacy as a cause of dry mouth, the objectives for this study were to evaluate (1) the prevalence of xerostomia; (2) the relationship between xerostomia and other oral conditions; and (3) the impact of polypharmacy on dry mouth in a veteran population.
Methods
This is a retrospective cross-sectional study of all outpatient visits in fiscal year (FY) 2015 (October 1, 2014 to September 30, 2015) at the VA Palo Alto Health Care System (VAPAHCS), a tertiary care US Department of Veterans Affairs (VA) hospital. This study was approved by the Stanford University Institutional Review Board. All patients diagnosed with xerostomia in the 1-year study period were identified using ICD-9 diagnosis codes for dry mouth or disturbance of salivary gland secretion (527.7, 527.8, R68.2) and Systemized Nomenclature of Medicine Clinical Terms (SNOMED CT) codes covering dry mouth, xerostomia, aptyalism, absent salivary secretion, and disturbance of salivary secretion (87715008, 78948009). Data analysts in the VA Office of Business Analytics assisted in gathering data from the Veterans Information Systems and Technology Architecture (VistA) electronic health record.
The statistical analysis of that data was performed using Microsoft Excel. Age and gender distributions were determined for the patients. The relationship between xerostomia and the number and types of medications taken by patients also was examined. A previous Swedish study examining the link between dry mouth and quantities of medications used a scale ranging from 0 to ≥ 7 medications.16 The scale for this study was made wider to include the following groups: 0-2, 3-5, 6-8, 9-11, and ≥ 12 medications. Items that do not have xerogenic risks, such as medical supplies (eg, gloves, syringes, etc) and topical medications, were excluded from the analysis. Finally, the number of subjects with comorbid problems with speech, dentition, or swallowing (SDS) was recorded. Non-VA medications were included to capture any self- or externally prescribed xerogenic medications.
Results
Of the patients seen at VAPAHCS during FY 2015, 138 had a diagnostic code for xerostomia, including 129 men (93.5%) and 9 women (6.5%). The average (SD) age of this xerostomia cohort was 69.3 (12.6) years, and the 3 most common age groups were 60 to 69 years (37.7%), 70 to 79 years (28.3%), and 80 to 89 years (13.0%) (Table 1). Of those 138 patients with a xerostomia diagnosis, a majority (84; 60.9%) had at least 1 documented SDS problem (Table 2). Conversely, during FY 2015, although 4,971 patients seen at VAPAHCS had documented SDS problems, only 77 (1.5%) had a recorded diagnosis of xerostomia
Of the 138 patients with xerostomia, 55 (39.9%) were taking ≥ 12 medications, more than twice as many patients as in any of the other groups studied (0-2, 3-5, 6-8, and 9-11 medications taken) (Table 3). On average, each patient with xerostomia filled prescriptions for 10.4 (SD, 7.2) different drugs. In this cohort of 138 patients diagnosed with xerostomia, antihypertensive medications or analgesics were taken by > 50% of patients, while statins, psychiatric medications, antibiotics, proton pump inhibitors, or drugs known to have anticholinergic activity were taken by > 40%. Antihistamines, anticonvulsants, diuretics, or inhaled respiratory agents were used by > 20% of the patients in this cohort (Table 4).
Data on each individual medication were split into 2 categories: the percentage of patients that filled ≥ 1 prescription for that drug, and the total number of prescriptions filled and/or refilled for that drug (ie, including all fills and refills made by individual patients). The 5 most widely used medications in this cohort were omeprazole (39.1%), docusate sodium (29.7%), gabapentin (29.7%), aspirin (27.5%), and hydrocodone/acetaminophen (26.1%) (Table 5). The 5 prescriptions that were cumulatively most filled and/or refilled were omeprazole (128), sildenafil citrate (108), gabapentin (101), hydrocodone/acetaminophen (100), and oxycodone (92) (Table 6). Though sildenafil citrate and oxycodone were among the most-filled prescriptions, these were not included in Table 5 as neither was taken by > 15% of the patients studied. These prescriptions were filled multiple times by a small subset of patients.
Regarding treatment for dry mouth, artificial saliva spray was one of the most widely used (23.2%) and the seventh most-filled prescription within this cohort (86). The only other medication taken by > 15% of patients in a formulation other than a tablet or capsule was chlorhexidine, a germicidal mouthwash used to improve oral care.
Also, 30 (21.7%) patients with a documented xerostomia diagnosis had a history of substance misuse involving use of ≥ 1 of tobacco, alcohol, marijuana, or other illicit drugs.
Discussion
Saliva is an essential component for the maintenance of normal oral health.20,21 Decreased saliva production causes problems, including difficulties with speech, mastication, dysphagia, changes in taste, dental caries, impaired use of prostheses, recurrent infections, halitosis, deterioration of soft tissues, and compromised QOL.22,23 Among patients with a diagnosed SDS abnormality who were seen at this facility during FY 2015, the prevalence of xerostomia was only 1.5%. However, the true prevalence and incidence of xerostomia among veterans is not known. Given the role of xerostomia as a common risk factor for SDS problems and the polypharmacy exhibited by those presented here with SDS problems, it is probable that xerostomia was underreported in this veteran cohort.
Additionally, although salivary acinar cells are known to atrophy with age, as is consistent with this xerostomia cohort’s average age (SD) of 69.3 (12.6) years, the development of dry mouth is a multifactorial process. The current scientific literature asserts that most salivary loss is due to local and systemic diseases, immunologic disorders, external radiation, and as was highlighted by this study, multiple prescription and nonprescription medications.24-26
It has also been demonstrated previously that dry mouth complaints and low salivary flow rates are directly proportional to the number of medications taken by patients.2,27-30 Polypharmacy is therefore an area of great interest, and ≥ 40 categories of xerogenic medications have been identified by investigators such as Sreebny and Schwartz.31 Among those, some of the most xerogenic medication classes include antihypertensives, antiulcer agents, anticholinergics, and antidepressants, are all very commonly consumed in this cohort of patients with dry mouth (58.7%, 42.0%, 47.1%, and 38.4%, respectively). The medication regimens within this cohort of veterans with xerostomia were prime examples of polypharmacy as each patient took an average (SD) of 10.4 (7.2) medications, 39.9% took ≥ 12, and 72.5% of patients with xerostomia were taking ≥ 6 prescription drugs during a 1-year period.
Given the dangers of polypharmacy, a more conservative approach to prescribing medications could feasibly help with preventing xerostomia and SGH. In practice, while clinicians try to avoid prescribing anticholinergics, antimuscarinics, and antihistaminergic drugs for geriatric patients, they are tasked with the complex management of medication adverse effects (AEs) when dealing with multiple health conditions. The clinicians’ primary responsibilities are to follow the standard of care and not to introduce unnecessary harm when managing patients, but they also must push for, stay abreast of, and conduct more basic research and clinical trials to inform, adjust, and improve our current standard.
Research into polypharmacy and its role in inducing dry mouth is ongoing. Twenty years ago, Thomson and colleagues identified reduced salivary flow in patients who used antianginals, thyroxine, diuretics, antidepressants, and medications for asthma, while only 5 years earlier Loesche and colleagues reported the role of antiulcer medications, such as proton pump inhibitors, in the development of xerostomia.2,32 Within the past 5 years, Viljakainen and colleagues and Ohara and colleagues have echoed some of those findings by identifying associations between xerostomia and agents that impact digestive organs.33,34 A strong association recently was identified between the use of antipsychotic drugs and xerostomia.35 Additionally, when attributing xerostomia to polypharmacy, the interaction between medications is often overlooked in favor of considering the raw number of prescriptions taken. Whereas 1 medication alone may not have drying properties, combinations of medications might be more likely to induce xerostomia. Thomson and colleagues suggested such a situation regarding the interaction between thyroxine and diuretics.36 Future studies should focus on identifying viable substitutes for existing medications that reduce risk for xerostomia without compromising the management of other serious conditions.
Treatment
Another pressing question for clinicians concerns artificial saliva. Although 23.2% of patients with dry mouth in this xerostomia cohort used artificial saliva, the efficacy of this treatment is still unproven. Saliva substitutes are often used by patients who cannot produce sufficient amounts of natural saliva. In practice, artificial saliva produces, at best, modest temporary improvement in dry mouth symptoms in up to 40% of patients. At worst, as put forth by the Cochrane Review, artificial saliva may be no better than placebo in treating dry mouth.37,38 The volumes needed for symptom relief are large, ranging between 40 mL and 150 mL per day depending on the substitute’s composition. Saliva substitutes also must be reapplied throughout each day. This is particularly bothersome when patients must wake up repeatedly to reapply the treatment at night.37 In short, these substances do not seem wholly effective in managing dry mouth, and other options must be made available to patients with refractory xerostomia when artificial saliva and lifestyle modifications fail.
For now, few alternatives exist. Chewing gums and lozenges help to stimulate salivary flow, as do muscarinic agonists like pilocarpine. Unfortunately, muscarinic agonists are seldom used due to cholinergic AEs. Humidifiers are effective in increasing nighttime moisture but are contraindicated in patients with dust mite allergies.39 Reservoir-based devices with automated pumps funnel water and/or salivary substitutes from a fanny pack into patients’ mouths for lubrication.37 Other more esoteric pharmacologic treatments include D-limonene, yohimbine, and amifostine, which purportedly protect salivary progenitor cells, increase peripheral cholinergic activity, and protect salivary glands from free-radical damage during radiation treatment, respectively. Although these agents have shown some promise, D-limonene is difficult to administer given the high dosage required for treatment, yohimbine hasn’t been seriously investigated for improving salivary secretion since 1997, and amifostine isn’t used widely due to its AE profile despite its US Food and Drug Administration approval for prevention of xerostomia.39
Substance Abuse
The impact of smoking on xerostomia remains controversial. Some studies report an association between active smoking and xerostomia; others suggest that the local irritant effect of tobacco smoke may increase salivary gland output.40,41 The same may be true for chronic alcohol use as there are no epidemiologic studies showing a causal relationship between alcohol use and xerostomia. Studies with rats that are chronically exposed to ethanol have found increased salivary flow rates.42 In the xerostomia cohort presented here, 30 patients (21.7%) had a documented history of substance misuse. That percentage is likely underestimated, as substance misuse is often underreported, and frequent use may not always constitute misuse. Therefore, nicotine exposure, alcohol exposure, illicit drug use, and vaping all should be considered during the workup of a patient with xerostomia.
Limitations
It is common for medications to remain in a patient’s health record long after that patient stops taking them. Developing methods to track when patients discontinue their prescriptions will be essential for clearing up uncertainty in our data and in other similar studies. This study also did not account for patients’ medication adherence and the duration of exposure to medications and illicit substances. Furthermore, the results of this veteran study are not easily generalizable as this cohort is disproportionately male, of advanced age, and especially prone to exhibiting both substance use and psychiatric diagnoses relative to the general population. As described by Viljakainen and colleagues, risk factors for xerostomia include advanced age, female gender, low body mass index (BMI), malnutrition, and depressive symptoms, but because the demographic scope of this veteran population was narrow, it was not possible to discern the impact of, for example, gender.33 Data on variables like BMI, malnutrition, and depressive symptoms were not available. For this study, xerostomia could only be considered as an all-or-nothing phenomenon because the dataset did not describe different levels of dry mouth severity (eg, mild, moderate, severe).
Additionally, past polypharmacy studies have acknowledged an inability to tell whether xerostomia is mainly due to medications or to underlying medical conditions. For example, for emphysema, ß-adrenergic stimulation from bronchodilators could cause dry mouth by thickening saliva and decreasing salivary volume, but the pathophysiology and/or cardinal symptoms of emphysema, including chronic obstructive pulmonary disease-associated tachypnea, might contribute independently to dryness.
Though we can make inferences based on the medications taken by this cohort (eg, those taking antihypertensives have high blood pressure), this dataset did not explicitly detail comorbid conditions and ICD codes for chronic diseases that commonly arise with xerostomia. Those conditions, however, are of great clinical importance. Diabetes mellitus, HIV/AIDS, and, classically, Sjögren syndrome, all are known to cause dry mouth.43 Identifying new conditions that co-occur with xerostomia would allow clinicians to describe the root causes of and risk factors for dry mouth and SDS conditions in greater detail. Patients with dry mouth without SDS problems in this dataset are of particular interest as closer examination of their medications and comorbid conditions could help us understand why some individuals and not others develop SDS problems. The subjects of how comorbidities contribute to dry mouth and how their influences can be judged independently from the effects of medications are of great interest to us and will be investigated rigorously in our future studies.
Conclusions
In this cohort, few patients with SDS problems had documentation of a concomitant xerostomia diagnosis. This could represent a true infrequency of dry mouth or more likely, an underrecognition by clinicians. Heightened physician awareness regarding the signs and symptoms of and risk factors for xerostomia is needed to improve providers’ ability to diagnose this condition.
In particular, polypharmacy should be a major consideration when evaluating patients for xerostomia. This continues to be an important area of research, and some of the latest data on polypharmacy among older patients were compiled in a recent meta-analysis by Tan and colleagues. The authors of that systematic review reiterated the significant association between salivary gland hypofunction and the number of medications taken by patients. They also advocated for the creation of a risk score for medication-induced dry mouth to aid in medication management.44 Per their recommendations, it is now as crucial as ever to consider the numbers and types of medications taken by patients, to discontinue unnecessary prescriptions when possible, and to continue developing new strategies for preventing and treating xerostomia.
1. Thomson WM, Chalmers JM, Spencer AJ, Ketabi M. The occurrence of xerostomia and salivary gland hypofunction in a population-based sample of older South Australians. Spec Care Dentist. 1999;19(1):20-23.
2. Thomson WM, Chalmers JM, Spencer AJ, Slade GD. Medication and dry mouth: findings from a cohort study of older people. J Public Health Dent. 2000;60(1):12-20.
3. Sasportas LS, Hosford DN, Sodini MA, et al. Cost-effectiveness landscape analysis of treatments addressing xerostomia in patients receiving head and neck radiation therapy. Oral Surg Oral Med Oral Pathol Oral Radiol. 2013;116(1):e37-e51.
4. Bivona PL. Xerostomia. A common problem among the elderly. N Y State Dent J. 1998;64(6):46-52.
5. Ness J, Hoth A, Barnett MJ, Shorr RI, Kaboli PJ. Anticholinergic medications in community-dwelling older veterans: prevalence of anticholinergic symptoms, symptom burden, and adverse drug events. Am J Geriatr Pharmacother. 2006;4(1):42-51.
6. Mandel ID. The diagnostic uses of saliva. J Oral Pathol Med. 1990;19(3):119-125.
7. Friedman PK, Isfeld D. Xerostomia: the “invisible” oral health condition. J Mass Dent Soc. 2008;57(3):42-44.
8. Ship JA, McCutcheon JA, Spivakovsky S, Kerr AR. Safety and effectiveness of topical dry mouth products containing olive oil, betaine, and xylitol in reducing xerostomia for polypharmacy-induced dry mouth. J Oral Rehabil. 2007;34(10):724-732.
9. Field EA, Fear S, Higham SM, et al. Age and medication are significant risk factors for xerostomia in an English population, attending general dental practice. Gerodontology. 2001;18(1):21-24.
10. Villa A, Connell CL, Abati S. Diagnosis and management of xerostomia and hyposalivation. Ther Clin Risk Manag. 2015;11:45-51.
11. Geuiros LA, Soares MS, Leao JC. Impact of ageing and drug consumption on oral health. Gerodontology. 2009;26(4):297-301.
12. Singh ML, Papas A. Oral implications of polypharmacy in the elderly. Dent Clin North Am. 2014;58(4):783-796.
13. Shinkai RS, Hatch JP, Schmidt CB, Sartori EA. Exposure to the oral side effects of medication in a community-based sample. Spec Care Dentist. 2006;26(3):116-120.
14. Hopcraft MS, Tan C. Xerostomia: an update for clinicians. Aust Dent J. 2010;55(3):238-244; quiz 353.
15. Ettinger RL. Review: xerostomia: a symptom which acts like a disease. Age Ageing. 1996;25(5):409-412.
16. Nederfors T, Isaksson R, Mornstad H, Dahlof C. Prevalence of perceived symptoms of dry mouth in an adult Swedish population—relation to age, sex and pharmacotherapy. Community Dent Oral Epidemiol. 1997;25(3):211-216.
17. Qato DM, Wilder J, Schumm LP, Gillet V, Alexander GC. Changes in prescription and over-the-counter medication and dietary supplement use among older adults in the United States, 2005 vs 2011. JAMA Intern Med. 2016;176(4):473-482.
18. Dirix P, Nuyts S, Vander Poorten V, Delaere P, Van den Boaert W. The influence of xerostomia after radiotherapy on quality of life: results of a questionnaire in head and neck cancer. Support Care Cancer. 2008;16(2):171-179.
19. Sreebny LM, Valdini A. Xerostomia. A neglected symptom. Arch Intern Med. 1987;147(7):1333-1337.
20. Sreebny LM. Saliva in health and disease: an appraisal and update. Int Dent J. 2000;50(3):140-161.
21. Amerongen AV, Veeran EC. Saliva—the defender of the oral cavity. Oral Dis. 2002;8(1):12-22.
22. Guggenheimer J, Moore PA. Xerostomia: etiology, recognition and treatment. J Am Dent Assoc. 2003;134(1):61-69; quiz 118-119.
23. Atkinson JC, Baum BJ. Salivary enhancement: current status and future therapies. J Dent Educ. 2001;65(10):1096-1101.
24. Narhi TO, Meurman JH, Ainamo A. Xerostomia and hyposalivation: causes, consequences and treatment in the elderly. Drugs Aging. 1999;15(2):103-116.
25. Ship JA, Baum BJ. Is reduced salivary flow normal in old people? Lancet. 1990;336(8729):1507.
26. Ghezzi EM, Wagner-Lange LA, Schork MA, et al. Longitudinal influence of age, menopause, hormone replacement therapy, and other medications on parotid flow rates in healthy women. J Gerontol A Biol Sci Med Sci. 2000;55(1):M34-M42.
27. Fox PC. Acquired salivary dysfunction. Drugs and radiation. Ann N Y Acad Sci. 1998;842:132-137.
28. Bergdahl M, Bergdahl J. Low unstimulated salivary flow and subjective oral dryness: association with medication, anxiety, depression, and stress. J Dent Res. 2000;79(9):1652-1658.
29. Ship JA, Pillemer SR, Baum BJ. Xerostomia and the geriatric patient. J Am Geriatr Soc. 2002;50(3):535-543.
30. Sreebny LM, Valdini A, Yu A. Xerostomia. Part II: Relationship to nonoral symptoms, drugs, and diseases. Oral Surg Oral Med Oral Pathol. 1989;68(4):419-427.
31. Sreebny LM, Schwartz SS. A reference guide to drugs and dry mouth—2nd edition. Gerodontology. 1997;14(1):33-47.
32. Loesche WJ, Bromberg J, Terpenning MS, et al. Xerostomia, xerogenic medications and food avoidances in selected geriatric groups. J Am Geriatr Soc. 1995;43(4):401-407.
33. Viljakainen S, Nykanen I, Ahonen R, et al. Xerostomia among older home care clients. Community Dent Oral Epidemiol. 2016;44(3):232-238.
34. Ohara Y, Hirano H, Yoshida H, et al. Prevalence and factors associated with xerostomia and hyposalivation among community-dwelling older people in Japan. Gerodontology. 2016;33(1):20-27.
35. Okamoto A, Miyachi H, Tanaka K, Chikazu D, Miyaoka H. Relationship between xerostomia and psychotropic drugs in patients with schizophrenia: evaluation using an oral moisture meter. J Clin Pharm Ther. 2016;41(6):684-688.
36. Thomson WM. Dry mouth and older people. Aust Dent J. 2015;60(suppl 1):54-63.
37. Sasportas LS, Hosford AT, Sodini MA, et al. Cost-effectiveness landscape analysis of treatments addressing xerostomia in patients receiving head and neck radiation therapy. Oral Surg Oral Med Oral Pathol Oral Radiol. 2013;116(1):e37-e51.
38. Furness S, Worthington HV, Bryan G, Birchenough S, McMillan R. Interventions for the management of dry mouth: topical therapies. Cochrane Database Syst Rev. 2011;(12):CD008924.
39. Roblegg E, Coughran A, Sirjani D. Saliva: an all-rounder of our body. Eur J Pharm Biopharm. 2019;142:133-141.
40. Billings RJ, Proskin HM, Moss ME. Xerostomia and associated factors in a community-dwelling adult population. Community Dent Oral Epidemiol. 1996;24(5):312-316.
41. Norlen P, Ostberg H, Bjorn AL. Relationship between general health, social factors and oral health in women at the age of retirement. Community Dent Oral Epidemiol. 1991;19(5):296-301.
42. Berry MR, Scott J. Functional and structural adaptation of the parotid gland to medium-term chronic ethanol exposure in the rat. Alcohol Alcoholism. 1990;25(5):523-531.
43. von Bultzingslowen I, Sollecito TP, Fox PC, et al. Salivary dysfunction associated with systemic diseases: systematic review and clinical management recommendations. Oral Surg Oral Med Oral Pathol Oral Radiol. 2007;103:S57.e1-e15.
44. Tan ECK, Lexomboon D, Sandborgh-Englund G, et al. Medications that cause dry mouth as an adverse effect in older people: a systematic review and metaanalysis. J Am Geriatr Soc. 2018;66(1):76-84.
1. Thomson WM, Chalmers JM, Spencer AJ, Ketabi M. The occurrence of xerostomia and salivary gland hypofunction in a population-based sample of older South Australians. Spec Care Dentist. 1999;19(1):20-23.
2. Thomson WM, Chalmers JM, Spencer AJ, Slade GD. Medication and dry mouth: findings from a cohort study of older people. J Public Health Dent. 2000;60(1):12-20.
3. Sasportas LS, Hosford DN, Sodini MA, et al. Cost-effectiveness landscape analysis of treatments addressing xerostomia in patients receiving head and neck radiation therapy. Oral Surg Oral Med Oral Pathol Oral Radiol. 2013;116(1):e37-e51.
4. Bivona PL. Xerostomia. A common problem among the elderly. N Y State Dent J. 1998;64(6):46-52.
5. Ness J, Hoth A, Barnett MJ, Shorr RI, Kaboli PJ. Anticholinergic medications in community-dwelling older veterans: prevalence of anticholinergic symptoms, symptom burden, and adverse drug events. Am J Geriatr Pharmacother. 2006;4(1):42-51.
6. Mandel ID. The diagnostic uses of saliva. J Oral Pathol Med. 1990;19(3):119-125.
7. Friedman PK, Isfeld D. Xerostomia: the “invisible” oral health condition. J Mass Dent Soc. 2008;57(3):42-44.
8. Ship JA, McCutcheon JA, Spivakovsky S, Kerr AR. Safety and effectiveness of topical dry mouth products containing olive oil, betaine, and xylitol in reducing xerostomia for polypharmacy-induced dry mouth. J Oral Rehabil. 2007;34(10):724-732.
9. Field EA, Fear S, Higham SM, et al. Age and medication are significant risk factors for xerostomia in an English population, attending general dental practice. Gerodontology. 2001;18(1):21-24.
10. Villa A, Connell CL, Abati S. Diagnosis and management of xerostomia and hyposalivation. Ther Clin Risk Manag. 2015;11:45-51.
11. Geuiros LA, Soares MS, Leao JC. Impact of ageing and drug consumption on oral health. Gerodontology. 2009;26(4):297-301.
12. Singh ML, Papas A. Oral implications of polypharmacy in the elderly. Dent Clin North Am. 2014;58(4):783-796.
13. Shinkai RS, Hatch JP, Schmidt CB, Sartori EA. Exposure to the oral side effects of medication in a community-based sample. Spec Care Dentist. 2006;26(3):116-120.
14. Hopcraft MS, Tan C. Xerostomia: an update for clinicians. Aust Dent J. 2010;55(3):238-244; quiz 353.
15. Ettinger RL. Review: xerostomia: a symptom which acts like a disease. Age Ageing. 1996;25(5):409-412.
16. Nederfors T, Isaksson R, Mornstad H, Dahlof C. Prevalence of perceived symptoms of dry mouth in an adult Swedish population—relation to age, sex and pharmacotherapy. Community Dent Oral Epidemiol. 1997;25(3):211-216.
17. Qato DM, Wilder J, Schumm LP, Gillet V, Alexander GC. Changes in prescription and over-the-counter medication and dietary supplement use among older adults in the United States, 2005 vs 2011. JAMA Intern Med. 2016;176(4):473-482.
18. Dirix P, Nuyts S, Vander Poorten V, Delaere P, Van den Boaert W. The influence of xerostomia after radiotherapy on quality of life: results of a questionnaire in head and neck cancer. Support Care Cancer. 2008;16(2):171-179.
19. Sreebny LM, Valdini A. Xerostomia. A neglected symptom. Arch Intern Med. 1987;147(7):1333-1337.
20. Sreebny LM. Saliva in health and disease: an appraisal and update. Int Dent J. 2000;50(3):140-161.
21. Amerongen AV, Veeran EC. Saliva—the defender of the oral cavity. Oral Dis. 2002;8(1):12-22.
22. Guggenheimer J, Moore PA. Xerostomia: etiology, recognition and treatment. J Am Dent Assoc. 2003;134(1):61-69; quiz 118-119.
23. Atkinson JC, Baum BJ. Salivary enhancement: current status and future therapies. J Dent Educ. 2001;65(10):1096-1101.
24. Narhi TO, Meurman JH, Ainamo A. Xerostomia and hyposalivation: causes, consequences and treatment in the elderly. Drugs Aging. 1999;15(2):103-116.
25. Ship JA, Baum BJ. Is reduced salivary flow normal in old people? Lancet. 1990;336(8729):1507.
26. Ghezzi EM, Wagner-Lange LA, Schork MA, et al. Longitudinal influence of age, menopause, hormone replacement therapy, and other medications on parotid flow rates in healthy women. J Gerontol A Biol Sci Med Sci. 2000;55(1):M34-M42.
27. Fox PC. Acquired salivary dysfunction. Drugs and radiation. Ann N Y Acad Sci. 1998;842:132-137.
28. Bergdahl M, Bergdahl J. Low unstimulated salivary flow and subjective oral dryness: association with medication, anxiety, depression, and stress. J Dent Res. 2000;79(9):1652-1658.
29. Ship JA, Pillemer SR, Baum BJ. Xerostomia and the geriatric patient. J Am Geriatr Soc. 2002;50(3):535-543.
30. Sreebny LM, Valdini A, Yu A. Xerostomia. Part II: Relationship to nonoral symptoms, drugs, and diseases. Oral Surg Oral Med Oral Pathol. 1989;68(4):419-427.
31. Sreebny LM, Schwartz SS. A reference guide to drugs and dry mouth—2nd edition. Gerodontology. 1997;14(1):33-47.
32. Loesche WJ, Bromberg J, Terpenning MS, et al. Xerostomia, xerogenic medications and food avoidances in selected geriatric groups. J Am Geriatr Soc. 1995;43(4):401-407.
33. Viljakainen S, Nykanen I, Ahonen R, et al. Xerostomia among older home care clients. Community Dent Oral Epidemiol. 2016;44(3):232-238.
34. Ohara Y, Hirano H, Yoshida H, et al. Prevalence and factors associated with xerostomia and hyposalivation among community-dwelling older people in Japan. Gerodontology. 2016;33(1):20-27.
35. Okamoto A, Miyachi H, Tanaka K, Chikazu D, Miyaoka H. Relationship between xerostomia and psychotropic drugs in patients with schizophrenia: evaluation using an oral moisture meter. J Clin Pharm Ther. 2016;41(6):684-688.
36. Thomson WM. Dry mouth and older people. Aust Dent J. 2015;60(suppl 1):54-63.
37. Sasportas LS, Hosford AT, Sodini MA, et al. Cost-effectiveness landscape analysis of treatments addressing xerostomia in patients receiving head and neck radiation therapy. Oral Surg Oral Med Oral Pathol Oral Radiol. 2013;116(1):e37-e51.
38. Furness S, Worthington HV, Bryan G, Birchenough S, McMillan R. Interventions for the management of dry mouth: topical therapies. Cochrane Database Syst Rev. 2011;(12):CD008924.
39. Roblegg E, Coughran A, Sirjani D. Saliva: an all-rounder of our body. Eur J Pharm Biopharm. 2019;142:133-141.
40. Billings RJ, Proskin HM, Moss ME. Xerostomia and associated factors in a community-dwelling adult population. Community Dent Oral Epidemiol. 1996;24(5):312-316.
41. Norlen P, Ostberg H, Bjorn AL. Relationship between general health, social factors and oral health in women at the age of retirement. Community Dent Oral Epidemiol. 1991;19(5):296-301.
42. Berry MR, Scott J. Functional and structural adaptation of the parotid gland to medium-term chronic ethanol exposure in the rat. Alcohol Alcoholism. 1990;25(5):523-531.
43. von Bultzingslowen I, Sollecito TP, Fox PC, et al. Salivary dysfunction associated with systemic diseases: systematic review and clinical management recommendations. Oral Surg Oral Med Oral Pathol Oral Radiol. 2007;103:S57.e1-e15.
44. Tan ECK, Lexomboon D, Sandborgh-Englund G, et al. Medications that cause dry mouth as an adverse effect in older people: a systematic review and metaanalysis. J Am Geriatr Soc. 2018;66(1):76-84.
Urgent and Emergent Eye Care Strategies to Protect Against COVID-19


COVID-19 is caused by the severe acute respiratory syndrome coronavirus 2 (SARS-CoV-2), and its symptoms range from mild to severe respiratory illness, fever, cough, fatigue, and shortness of breath.1 Diarrhea is common early on with infection and loss of taste and smell have also been reported.1 Follicular conjunctivitis has also been reported, either as an early sign of infection or during hospitalization for severe COVID-19 disease.2-4 The incubation period of COVID-19 falls within 2 to 14 days according to the CDC.5
It has been confirmed that COVID-19 is transmitted through both respiratory droplets and direct contact. Another possible route of viral transmission is entry through aerosolized droplets into the tears, which then pass through the nasolacrimal ducts and into the respiratory tract.6
Preparations Prior to Office Visit
It is essential for the eye care provider to prioritize patient care in order of absolute necessity, such as sudden vision loss, sudden onset flashes and floaters, and eye trauma. In cases of potentially sight threatening pathology, it is in the best interest of the patient to conduct a face-to-face appointment. Therefore, it is important to implement new guidelines and protocols as we continue to see these patients (Figure 1).

Prior to the patient entering the medical facility, measures should be implemented to minimize exposure risk. This can be done over the telephone or at vehicle entrance screening stations. The triage technician answering the telephone should have a script of questions to ask. The patient should be instructed to come into the office alone unless, for physical or mental reasons, a caregiver is required.
SARS-CoV-2 Screening Questions
Preparedness through risk mitigation strategies are recommended with a targeted questionnaire and noncontact temperature check at the clinic or hospital entrance. Below are some general questions to further triage patients exposed to SARS-CoV-2.
- Do you have fever or any respiratory symptoms?
- Do you have new or worsening cough or shortness of breath?
- Do you have flulike symptoms?
- Have you been in close contact with someone, including health care workers, confirmed to have the COVID-19?
If the patient answers yes to any of the above questions, the CDC urges health care providers to immediately notify both infection control personnel at your health care facility and your local or state health department.1,2 In regions currently managing significant outbreaks of COVID-19, the AAO recommends that eye care providers assume that any patient could be infected with SARS-CoV-2 and to proceed accordingly.2 If urgent eye care is needed, a referral call should be made to a hospital or center equipped to deal with COVID-19 and urgent eye conditions. When calling the referral center, ensure adequate staffing and space and relay all pertinent information along with receiving approval from the treating physician.
Face-to-Face Office Visits
Once it has been determined that it is in the best interest of the patient to be seen in a face-to-face visit, the patient should be instructed to call the office when they arrive in the parking lot. The CDC recommends limiting points of entry upon arrival and during the visit.1 As soon as an examination lane is ready, the patient can then be messaged to come into the office and escorted into the examination room.

An urgent or emergent ophthalmic examination for a patient with no respiratory symptoms, no fever, and no COVID-19 risk factors should include proper hand hygiene, use of personal protective equipment (PPE), and proper disinfection. Several studies have documented SARS-CoV-2 infection in asymptomatic and presymptomatic patients, making PPE of the up most importance.2,7,8 PPE should include mask, face shield, and gloves. Currently, there are national and international shortages on PPE and a heightened topic of discussion concerning mask use, effectiveness with extended wear, and reuse. Please refer to the CDC and AAO websites for up-to-date guidelines (Table).1,2 According to the CDC, N95 respirators are restricted to those performing or present for an aerosol-generating procedure.9

It is recommended that the eye care provider should only perform necessary tests and procedures. Noncontact tonometry should be avoided, as this might cause aerosolization of virus particles. The close proximity between eye care providers and their patients during slit-lamp examination may require further precautions to lower the risk of transmission via droplets or through hand to eye contact. The patient should be advised not to speak during the examination portion and the AAO also recommends a surgical mask or cloth face covering for the patient.2 An additional protective device that may be used during the slit-lamp exam is a breath shield or a barrier shield (Figures 2 and 3).2 Some manufacturers are offering clinicians free slit-lamp breath shields online.
Infection Prevention and Control Measures
Last, once the patient leaves the examination room, it should be properly disinfected. A disinfection checklist may be made to ensure uniform systematic cleaning. Alcohol and bleach-based disinfectants commonly used in health care settings are likely very effective against virus particles that cause COVID-19.10 During the disinfection process, gloves should be worn and careful attention paid to the contact time. Contact time is the amount of time the surface should appear visibly wet for proper disinfection. For example, Metrex CaviWipes have a recommended contact time of 3 minutes; however, this varies depending on type of virus and formulation, check labels or manufacturers’ websites for further directions.10 Also, the US Environmental Protection Agency has a database search available for disinfectants that meet their criteria for use against SARS-CoV-2.11
In an ever-changing environment, we offer this article to help equip providers to deliver the best possible patient care when face-to-face encounters are necessary. Currently nonurgent eye care follow-up visits are being conducted by telephone or video clinics. It is our goal to inform fellow practitioners on options and strategies to elevate the safety of staff and patients while minimizing the risk of exposure.
1. Centers for Disease Control and Prevention. Coronavirus disease 2019 (COVID-19): for healthcare professionals. https://www.cdc.gov/coronavirus/2019-nCoV/hcp/index.html. Updated April 7, 2020. Accessed April 13, 2020.
2. American Academy of Ophthalmology. Important coronavirus context for ophthalmologists. https://www.aao.org/headline/alert-important-coronavirus-context. Updated April 12, 2020. Accessed April 13, 2020.
3. Zhou Y, Zeng Y, Tong Y, Chen CZ. Ophthalmologic evidence against the interpersonal transmission of 2019 novel coronavirus through conjunctiva [preprint]. https://doi.org/10.1101/2020.02.11.20021956. Published February 12, 2020. Accessed April 13, 2020.
4. Lu CW, Liu XF, Jia ZF. 2019-nCoV transmission through the ocular surface must not be ignored. Lancet. 2020; 395(10224):e39.
5. Centers for Disease Control and Prevention. Symptoms of coronavirus. https://www.cdc.gov/coronavirus/2019-ncov/symptoms-testing/symptoms.html. Updated March 20, 2020. Accessed April 13, 2020.
6. van Doremalen N, Bushmaker T, Morris DH, et al. Aerosol and Surface Stability of SARS-CoV-2 as Compared with SARS-CoV-1. N Engl J Med. 2020;NEJMc2004973. [Published online ahead of print, March 17, 2020].
7. Kimball A, Hatfield KM, Arons M, et al. Asymptomatic and Presymptomatic SARS-CoV-Infections in Residents of a Long-Term Care Skilled Nursing Facility - King County, Washington, March 2020. MMWR Morb Mortal Wkly Rep. 2020;69(13):377-381.
8. Li R, Pei S, Chen B, et al. Substantial undocumented infection facilitates the rapid dissemination of novel coronavirus (SARS-CoV2) [published online ahead of print, 2020 Mar 16]. Science. 2020; eabb3221.
9. Centers for Disease Control and Prevention. Interim infection prevention and control recommendations for patients with suspected or confirmed coronavirus disease 2019 (COVID-19) in healthcare settings. https://www.cdc.gov/coronavirus/2019-ncov/hcp/infection-control-recommendations.html. Updated April 9, 2020. Accessed April 13, 2020.
10. Centers for Disease Control and Prevention. Cleaning and disinfection for households interim recommendations for U.S. households with suspected or confirmed coronavirus disease 2019 (COVID-19). https://www.cdc.gov/coronavirus/2019-ncov/prevent-getting-sick/cleaning-disinfection.html. Updated March 28, 2020. Accessed April 13, 2020.
11. US Environmental Protection Agency. Pesticide registration: List N: disinfectants for use against SARS-CoV-2. https://www.epa.gov/pesticide-registration/list-n-disinfectants-use-against-sars-cov-2. Updated April 10, 2020. Accessed April 13, 2020.
COVID-19 is caused by the severe acute respiratory syndrome coronavirus 2 (SARS-CoV-2), and its symptoms range from mild to severe respiratory illness, fever, cough, fatigue, and shortness of breath.1 Diarrhea is common early on with infection and loss of taste and smell have also been reported.1 Follicular conjunctivitis has also been reported, either as an early sign of infection or during hospitalization for severe COVID-19 disease.2-4 The incubation period of COVID-19 falls within 2 to 14 days according to the CDC.5
It has been confirmed that COVID-19 is transmitted through both respiratory droplets and direct contact. Another possible route of viral transmission is entry through aerosolized droplets into the tears, which then pass through the nasolacrimal ducts and into the respiratory tract.6
Preparations Prior to Office Visit
It is essential for the eye care provider to prioritize patient care in order of absolute necessity, such as sudden vision loss, sudden onset flashes and floaters, and eye trauma. In cases of potentially sight threatening pathology, it is in the best interest of the patient to conduct a face-to-face appointment. Therefore, it is important to implement new guidelines and protocols as we continue to see these patients (Figure 1).
Prior to the patient entering the medical facility, measures should be implemented to minimize exposure risk. This can be done over the telephone or at vehicle entrance screening stations. The triage technician answering the telephone should have a script of questions to ask. The patient should be instructed to come into the office alone unless, for physical or mental reasons, a caregiver is required.
SARS-CoV-2 Screening Questions
Preparedness through risk mitigation strategies are recommended with a targeted questionnaire and noncontact temperature check at the clinic or hospital entrance. Below are some general questions to further triage patients exposed to SARS-CoV-2.
- Do you have fever or any respiratory symptoms?
- Do you have new or worsening cough or shortness of breath?
- Do you have flulike symptoms?
- Have you been in close contact with someone, including health care workers, confirmed to have the COVID-19?
If the patient answers yes to any of the above questions, the CDC urges health care providers to immediately notify both infection control personnel at your health care facility and your local or state health department.1,2 In regions currently managing significant outbreaks of COVID-19, the AAO recommends that eye care providers assume that any patient could be infected with SARS-CoV-2 and to proceed accordingly.2 If urgent eye care is needed, a referral call should be made to a hospital or center equipped to deal with COVID-19 and urgent eye conditions. When calling the referral center, ensure adequate staffing and space and relay all pertinent information along with receiving approval from the treating physician.
Face-to-Face Office Visits
Once it has been determined that it is in the best interest of the patient to be seen in a face-to-face visit, the patient should be instructed to call the office when they arrive in the parking lot. The CDC recommends limiting points of entry upon arrival and during the visit.1 As soon as an examination lane is ready, the patient can then be messaged to come into the office and escorted into the examination room.
An urgent or emergent ophthalmic examination for a patient with no respiratory symptoms, no fever, and no COVID-19 risk factors should include proper hand hygiene, use of personal protective equipment (PPE), and proper disinfection. Several studies have documented SARS-CoV-2 infection in asymptomatic and presymptomatic patients, making PPE of the up most importance.2,7,8 PPE should include mask, face shield, and gloves. Currently, there are national and international shortages on PPE and a heightened topic of discussion concerning mask use, effectiveness with extended wear, and reuse. Please refer to the CDC and AAO websites for up-to-date guidelines (Table).1,2 According to the CDC, N95 respirators are restricted to those performing or present for an aerosol-generating procedure.9
It is recommended that the eye care provider should only perform necessary tests and procedures. Noncontact tonometry should be avoided, as this might cause aerosolization of virus particles. The close proximity between eye care providers and their patients during slit-lamp examination may require further precautions to lower the risk of transmission via droplets or through hand to eye contact. The patient should be advised not to speak during the examination portion and the AAO also recommends a surgical mask or cloth face covering for the patient.2 An additional protective device that may be used during the slit-lamp exam is a breath shield or a barrier shield (Figures 2 and 3).2 Some manufacturers are offering clinicians free slit-lamp breath shields online.
Infection Prevention and Control Measures
Last, once the patient leaves the examination room, it should be properly disinfected. A disinfection checklist may be made to ensure uniform systematic cleaning. Alcohol and bleach-based disinfectants commonly used in health care settings are likely very effective against virus particles that cause COVID-19.10 During the disinfection process, gloves should be worn and careful attention paid to the contact time. Contact time is the amount of time the surface should appear visibly wet for proper disinfection. For example, Metrex CaviWipes have a recommended contact time of 3 minutes; however, this varies depending on type of virus and formulation, check labels or manufacturers’ websites for further directions.10 Also, the US Environmental Protection Agency has a database search available for disinfectants that meet their criteria for use against SARS-CoV-2.11
In an ever-changing environment, we offer this article to help equip providers to deliver the best possible patient care when face-to-face encounters are necessary. Currently nonurgent eye care follow-up visits are being conducted by telephone or video clinics. It is our goal to inform fellow practitioners on options and strategies to elevate the safety of staff and patients while minimizing the risk of exposure.
COVID-19 is caused by the severe acute respiratory syndrome coronavirus 2 (SARS-CoV-2), and its symptoms range from mild to severe respiratory illness, fever, cough, fatigue, and shortness of breath.1 Diarrhea is common early on with infection and loss of taste and smell have also been reported.1 Follicular conjunctivitis has also been reported, either as an early sign of infection or during hospitalization for severe COVID-19 disease.2-4 The incubation period of COVID-19 falls within 2 to 14 days according to the CDC.5
It has been confirmed that COVID-19 is transmitted through both respiratory droplets and direct contact. Another possible route of viral transmission is entry through aerosolized droplets into the tears, which then pass through the nasolacrimal ducts and into the respiratory tract.6
Preparations Prior to Office Visit
It is essential for the eye care provider to prioritize patient care in order of absolute necessity, such as sudden vision loss, sudden onset flashes and floaters, and eye trauma. In cases of potentially sight threatening pathology, it is in the best interest of the patient to conduct a face-to-face appointment. Therefore, it is important to implement new guidelines and protocols as we continue to see these patients (Figure 1).
Prior to the patient entering the medical facility, measures should be implemented to minimize exposure risk. This can be done over the telephone or at vehicle entrance screening stations. The triage technician answering the telephone should have a script of questions to ask. The patient should be instructed to come into the office alone unless, for physical or mental reasons, a caregiver is required.
SARS-CoV-2 Screening Questions
Preparedness through risk mitigation strategies are recommended with a targeted questionnaire and noncontact temperature check at the clinic or hospital entrance. Below are some general questions to further triage patients exposed to SARS-CoV-2.
- Do you have fever or any respiratory symptoms?
- Do you have new or worsening cough or shortness of breath?
- Do you have flulike symptoms?
- Have you been in close contact with someone, including health care workers, confirmed to have the COVID-19?
If the patient answers yes to any of the above questions, the CDC urges health care providers to immediately notify both infection control personnel at your health care facility and your local or state health department.1,2 In regions currently managing significant outbreaks of COVID-19, the AAO recommends that eye care providers assume that any patient could be infected with SARS-CoV-2 and to proceed accordingly.2 If urgent eye care is needed, a referral call should be made to a hospital or center equipped to deal with COVID-19 and urgent eye conditions. When calling the referral center, ensure adequate staffing and space and relay all pertinent information along with receiving approval from the treating physician.
Face-to-Face Office Visits
Once it has been determined that it is in the best interest of the patient to be seen in a face-to-face visit, the patient should be instructed to call the office when they arrive in the parking lot. The CDC recommends limiting points of entry upon arrival and during the visit.1 As soon as an examination lane is ready, the patient can then be messaged to come into the office and escorted into the examination room.
An urgent or emergent ophthalmic examination for a patient with no respiratory symptoms, no fever, and no COVID-19 risk factors should include proper hand hygiene, use of personal protective equipment (PPE), and proper disinfection. Several studies have documented SARS-CoV-2 infection in asymptomatic and presymptomatic patients, making PPE of the up most importance.2,7,8 PPE should include mask, face shield, and gloves. Currently, there are national and international shortages on PPE and a heightened topic of discussion concerning mask use, effectiveness with extended wear, and reuse. Please refer to the CDC and AAO websites for up-to-date guidelines (Table).1,2 According to the CDC, N95 respirators are restricted to those performing or present for an aerosol-generating procedure.9
It is recommended that the eye care provider should only perform necessary tests and procedures. Noncontact tonometry should be avoided, as this might cause aerosolization of virus particles. The close proximity between eye care providers and their patients during slit-lamp examination may require further precautions to lower the risk of transmission via droplets or through hand to eye contact. The patient should be advised not to speak during the examination portion and the AAO also recommends a surgical mask or cloth face covering for the patient.2 An additional protective device that may be used during the slit-lamp exam is a breath shield or a barrier shield (Figures 2 and 3).2 Some manufacturers are offering clinicians free slit-lamp breath shields online.
Infection Prevention and Control Measures
Last, once the patient leaves the examination room, it should be properly disinfected. A disinfection checklist may be made to ensure uniform systematic cleaning. Alcohol and bleach-based disinfectants commonly used in health care settings are likely very effective against virus particles that cause COVID-19.10 During the disinfection process, gloves should be worn and careful attention paid to the contact time. Contact time is the amount of time the surface should appear visibly wet for proper disinfection. For example, Metrex CaviWipes have a recommended contact time of 3 minutes; however, this varies depending on type of virus and formulation, check labels or manufacturers’ websites for further directions.10 Also, the US Environmental Protection Agency has a database search available for disinfectants that meet their criteria for use against SARS-CoV-2.11
In an ever-changing environment, we offer this article to help equip providers to deliver the best possible patient care when face-to-face encounters are necessary. Currently nonurgent eye care follow-up visits are being conducted by telephone or video clinics. It is our goal to inform fellow practitioners on options and strategies to elevate the safety of staff and patients while minimizing the risk of exposure.
1. Centers for Disease Control and Prevention. Coronavirus disease 2019 (COVID-19): for healthcare professionals. https://www.cdc.gov/coronavirus/2019-nCoV/hcp/index.html. Updated April 7, 2020. Accessed April 13, 2020.
2. American Academy of Ophthalmology. Important coronavirus context for ophthalmologists. https://www.aao.org/headline/alert-important-coronavirus-context. Updated April 12, 2020. Accessed April 13, 2020.
3. Zhou Y, Zeng Y, Tong Y, Chen CZ. Ophthalmologic evidence against the interpersonal transmission of 2019 novel coronavirus through conjunctiva [preprint]. https://doi.org/10.1101/2020.02.11.20021956. Published February 12, 2020. Accessed April 13, 2020.
4. Lu CW, Liu XF, Jia ZF. 2019-nCoV transmission through the ocular surface must not be ignored. Lancet. 2020; 395(10224):e39.
5. Centers for Disease Control and Prevention. Symptoms of coronavirus. https://www.cdc.gov/coronavirus/2019-ncov/symptoms-testing/symptoms.html. Updated March 20, 2020. Accessed April 13, 2020.
6. van Doremalen N, Bushmaker T, Morris DH, et al. Aerosol and Surface Stability of SARS-CoV-2 as Compared with SARS-CoV-1. N Engl J Med. 2020;NEJMc2004973. [Published online ahead of print, March 17, 2020].
7. Kimball A, Hatfield KM, Arons M, et al. Asymptomatic and Presymptomatic SARS-CoV-Infections in Residents of a Long-Term Care Skilled Nursing Facility - King County, Washington, March 2020. MMWR Morb Mortal Wkly Rep. 2020;69(13):377-381.
8. Li R, Pei S, Chen B, et al. Substantial undocumented infection facilitates the rapid dissemination of novel coronavirus (SARS-CoV2) [published online ahead of print, 2020 Mar 16]. Science. 2020; eabb3221.
9. Centers for Disease Control and Prevention. Interim infection prevention and control recommendations for patients with suspected or confirmed coronavirus disease 2019 (COVID-19) in healthcare settings. https://www.cdc.gov/coronavirus/2019-ncov/hcp/infection-control-recommendations.html. Updated April 9, 2020. Accessed April 13, 2020.
10. Centers for Disease Control and Prevention. Cleaning and disinfection for households interim recommendations for U.S. households with suspected or confirmed coronavirus disease 2019 (COVID-19). https://www.cdc.gov/coronavirus/2019-ncov/prevent-getting-sick/cleaning-disinfection.html. Updated March 28, 2020. Accessed April 13, 2020.
11. US Environmental Protection Agency. Pesticide registration: List N: disinfectants for use against SARS-CoV-2. https://www.epa.gov/pesticide-registration/list-n-disinfectants-use-against-sars-cov-2. Updated April 10, 2020. Accessed April 13, 2020.
1. Centers for Disease Control and Prevention. Coronavirus disease 2019 (COVID-19): for healthcare professionals. https://www.cdc.gov/coronavirus/2019-nCoV/hcp/index.html. Updated April 7, 2020. Accessed April 13, 2020.
2. American Academy of Ophthalmology. Important coronavirus context for ophthalmologists. https://www.aao.org/headline/alert-important-coronavirus-context. Updated April 12, 2020. Accessed April 13, 2020.
3. Zhou Y, Zeng Y, Tong Y, Chen CZ. Ophthalmologic evidence against the interpersonal transmission of 2019 novel coronavirus through conjunctiva [preprint]. https://doi.org/10.1101/2020.02.11.20021956. Published February 12, 2020. Accessed April 13, 2020.
4. Lu CW, Liu XF, Jia ZF. 2019-nCoV transmission through the ocular surface must not be ignored. Lancet. 2020; 395(10224):e39.
5. Centers for Disease Control and Prevention. Symptoms of coronavirus. https://www.cdc.gov/coronavirus/2019-ncov/symptoms-testing/symptoms.html. Updated March 20, 2020. Accessed April 13, 2020.
6. van Doremalen N, Bushmaker T, Morris DH, et al. Aerosol and Surface Stability of SARS-CoV-2 as Compared with SARS-CoV-1. N Engl J Med. 2020;NEJMc2004973. [Published online ahead of print, March 17, 2020].
7. Kimball A, Hatfield KM, Arons M, et al. Asymptomatic and Presymptomatic SARS-CoV-Infections in Residents of a Long-Term Care Skilled Nursing Facility - King County, Washington, March 2020. MMWR Morb Mortal Wkly Rep. 2020;69(13):377-381.
8. Li R, Pei S, Chen B, et al. Substantial undocumented infection facilitates the rapid dissemination of novel coronavirus (SARS-CoV2) [published online ahead of print, 2020 Mar 16]. Science. 2020; eabb3221.
9. Centers for Disease Control and Prevention. Interim infection prevention and control recommendations for patients with suspected or confirmed coronavirus disease 2019 (COVID-19) in healthcare settings. https://www.cdc.gov/coronavirus/2019-ncov/hcp/infection-control-recommendations.html. Updated April 9, 2020. Accessed April 13, 2020.
10. Centers for Disease Control and Prevention. Cleaning and disinfection for households interim recommendations for U.S. households with suspected or confirmed coronavirus disease 2019 (COVID-19). https://www.cdc.gov/coronavirus/2019-ncov/prevent-getting-sick/cleaning-disinfection.html. Updated March 28, 2020. Accessed April 13, 2020.
11. US Environmental Protection Agency. Pesticide registration: List N: disinfectants for use against SARS-CoV-2. https://www.epa.gov/pesticide-registration/list-n-disinfectants-use-against-sars-cov-2. Updated April 10, 2020. Accessed April 13, 2020.
The Duty to Care and Its Exceptions in a Pandemic
As of April 9, 2020, the Centers for Disease Control and Prevention (CDC) reported that 9,282 health care providers in the US had contracted COVID-19, and 27 had died of the virus.2 Medscape reports the toll as much higher. Thousands more nurses, doctors, epidemiologists, social workers, physician assistants, dentists, pharmacists, and other health care workers from Italy, China, and dozens of other countries have died fighting this plague.3
The truth is no one knows how many health care workers are actually sick or even have died. State and federal governments have not been routinely and specifically tracking that data, making these already grim statistics likely a gross underestimation.4 While not all of these health care providers were exposed to COVID-19 in the line of duty, many were, and many more will be as the pandemic subsides in one epicenter only to erupt in another, and smolders for months until a vaccine quenches it.
Each of those lost lives of promise had a story of hard work and sacrifice to become a health care professional, of friends and family who loved and cared for them when ill, who need and grieve for them, now gone far too soon. Nor should we forget to mourn all of the administrative professionals, the line and support staff of health care facilities, who also perished fighting the pestilence. It is fitting then, that this second editorial in my pledge to write each month about COVID-19 until the pandemic ends, be about the duty to care and its limits.
The duty to care is among the most fundamental and ancient ethical obligations of health care providers. It is included even in modern codes of ethics like that of the American Medical Association and American Nurses Association. The obligation to not abandon patients is even more compelling for the Military Health System, Veterans Health Administration (VHA), and the US Public Health Service whose health care mission also is a public trust. The duty is rooted in the fiduciary nature of the health professions in which the interests of the patient should take priority over other considerations, including a risk to their own health and life. Prioritization though has exceptions. Physician and attorney David Orentlicher points out the unconditional obligation that bound physicians in the 14th century Black Death, or the 1918 Spanish influenza, now admits exceptions and qualifications.5
The exception that has become the object of greatest concern to health care workers is personal protective equipment (PPE). In modern public health ethics, health care systems and state and federal governments have a corresponding ethical obligation of reciprocity toward their employees whose work places them at elevated risk of harm—in this case, COVID-19 exposure. The principle of reciprocity encompasses the measures and materials that health care institutions need to provide to health care workers to reasonably minimize the risk of viral transmission. The reasonableness standard does not demand that there be zero risk. It does require that health care workers have adequate and appropriate PPE so that in fulfilling their duty to care they are not exposed to a disproportionate risk.
This last assertion has been the subject of controversy in the media and consternation on the part of health care professionals for several disconcerting reasons. First and foremost, a cascade failure on the part of government and industry has resulted in PPE being the scarcest health care resource in this pandemic.6 The shortage is as serious as that of the life-saving ventilators that are rightly at the center of most crisis standards resource allocation plans.7 Second, the guidance from the CDC and other authoritative sources continues to change. This is, in part, to adjust to the even more rapid pace of knowledge about the virus and its behavior and to adapt to the reality of insufficient PPE.8
Understandably, health care providers, especially those on the frontlines, may lose trust in the scientific experts and the leadership of their institutions, compounding the climate of moral distress in a public health crisis. Health care workers in the community, and even in federal service, have launched socially distanced protests and taken to social media to voice their concern and rally assistance.9,10 In response, VHA Executive-in-Charge Richard Stone, MD, admitted that VHA does have a shortage of PPE in a Washington Post interview.11 He outlined how the organization plans to address staff concerns. The article also reported only a 4% absentee rate of VHA staff as opposed to the 40% that plans predicted was possible. This demonstrates once more the dedication of VHA health care professionals and workers to fulfill their duty to care for veterans even amid fears about inadequate PPE.
In the epigraph, Albert Camus captures the uncertainty and fear that as humans all health care providers experience as they face the unpredictable but very real threat of COVID-19.1 Camus expresses even more strongly the devotion to duty of health care providers to care for vulnerable ill patients in need despite the inherent threat in a highly transmissible and potentially deadly infection that is inextricably linked to that caring. Orentlicher wisely opines that the integrity of the health professions and their respected role in society benefit from a strong duty to care.5 The best way to promote that duty is to do all in our power to protect those who willingly brave the pestilence to treat, and hope and pray someday to cure COVID-19.
1. Camus A. The Plague. Vintage Books: New York; 1948:120.
2. CDC COVID-19 Response Team. Characteristics of Health Care Personnel with COVID-19— United States, February 12-April 9, 2020. MMWR Morb Mortal Wkly Rep. 2020;69(15):477-481.
3. In memoriam: healthcare workers who have died of COVID-19. https://www.medscape.com/viewarticle/927976. Updated April 21, 2020. Accessed April 22, 2020.
4. Galvin G. The great unknown: how many health care workers have coronavirus? https://www.usnews.com/news/national-news/articles/2020-04-03/how-many-health-care-workers-have-coronavirus. Published April 3, 2020. Accessed April 22, 2020.
5. Orentlicher D. The physician’s duty to treat during pandemics. Am J Public Health. 2018;108(11):1459-1461.
6. Ranney ML, Griffeth V, Jha AK. Critical supply shortages—the need for ventilators and personal protective equipment during the Covid-19 pandemic. [Published online ahead of print, 2020 Mar 25.] N Engl J Med. 2020;10.1056/NEJMp2006141.
7. New York State Task Force on Life and the Law, New York State Department of Health. Ventilator allocation guidelines. https://www.health.ny.gov/regulations/task_force/reports_publications/docs/ventilator_guidelines.pdf. Published November 2015. Accessed April 22, 2020.
8. Centers for Disease Control and Prevention. Coronavirus Disease 2019 (COVID-2019): Strategies to optimize PPE and equipment. https://www.cdc.gov/coronavirus/2019-ncov/hcp/ppe-strategy/index.html. Updated April 3, 2020. Accessed April 22, 2020.
9. Wentling N. ‘It’s out of control’: VA nurses demand more protection against coronavirus. https://www.stripes.com/news/veterans/va-nurses-demand-more-protection-against-coronavirus-1.626910. Updated April 21, 2020. Accessed April 22, 2020.
10. Padilla M. ‘It feels like a war zone’: doctors and nurses plead for masks on social media. https://www.nytimes.com/2020/03/19/us/hospitals-coronavirus-ppe-shortage.html. Updated March 22, 2020. Accessed April 22, 2020.
11. Rein L. VA health chief acknowledges a shortage of protective gear for its hospital workers. https://www.washingtonpost.com/politics/va-health-chief-acknowledges-a-shortage-of-protective-gear-for-its-hospital-workers/2020/04/24/4c1bcd5e-84bf-11ea-ae26-989cfce1c7c7_story.html. Published April 25, 2020. Accessed April 27, 2020.
As of April 9, 2020, the Centers for Disease Control and Prevention (CDC) reported that 9,282 health care providers in the US had contracted COVID-19, and 27 had died of the virus.2 Medscape reports the toll as much higher. Thousands more nurses, doctors, epidemiologists, social workers, physician assistants, dentists, pharmacists, and other health care workers from Italy, China, and dozens of other countries have died fighting this plague.3
The truth is no one knows how many health care workers are actually sick or even have died. State and federal governments have not been routinely and specifically tracking that data, making these already grim statistics likely a gross underestimation.4 While not all of these health care providers were exposed to COVID-19 in the line of duty, many were, and many more will be as the pandemic subsides in one epicenter only to erupt in another, and smolders for months until a vaccine quenches it.
Each of those lost lives of promise had a story of hard work and sacrifice to become a health care professional, of friends and family who loved and cared for them when ill, who need and grieve for them, now gone far too soon. Nor should we forget to mourn all of the administrative professionals, the line and support staff of health care facilities, who also perished fighting the pestilence. It is fitting then, that this second editorial in my pledge to write each month about COVID-19 until the pandemic ends, be about the duty to care and its limits.
The duty to care is among the most fundamental and ancient ethical obligations of health care providers. It is included even in modern codes of ethics like that of the American Medical Association and American Nurses Association. The obligation to not abandon patients is even more compelling for the Military Health System, Veterans Health Administration (VHA), and the US Public Health Service whose health care mission also is a public trust. The duty is rooted in the fiduciary nature of the health professions in which the interests of the patient should take priority over other considerations, including a risk to their own health and life. Prioritization though has exceptions. Physician and attorney David Orentlicher points out the unconditional obligation that bound physicians in the 14th century Black Death, or the 1918 Spanish influenza, now admits exceptions and qualifications.5
The exception that has become the object of greatest concern to health care workers is personal protective equipment (PPE). In modern public health ethics, health care systems and state and federal governments have a corresponding ethical obligation of reciprocity toward their employees whose work places them at elevated risk of harm—in this case, COVID-19 exposure. The principle of reciprocity encompasses the measures and materials that health care institutions need to provide to health care workers to reasonably minimize the risk of viral transmission. The reasonableness standard does not demand that there be zero risk. It does require that health care workers have adequate and appropriate PPE so that in fulfilling their duty to care they are not exposed to a disproportionate risk.
This last assertion has been the subject of controversy in the media and consternation on the part of health care professionals for several disconcerting reasons. First and foremost, a cascade failure on the part of government and industry has resulted in PPE being the scarcest health care resource in this pandemic.6 The shortage is as serious as that of the life-saving ventilators that are rightly at the center of most crisis standards resource allocation plans.7 Second, the guidance from the CDC and other authoritative sources continues to change. This is, in part, to adjust to the even more rapid pace of knowledge about the virus and its behavior and to adapt to the reality of insufficient PPE.8
Understandably, health care providers, especially those on the frontlines, may lose trust in the scientific experts and the leadership of their institutions, compounding the climate of moral distress in a public health crisis. Health care workers in the community, and even in federal service, have launched socially distanced protests and taken to social media to voice their concern and rally assistance.9,10 In response, VHA Executive-in-Charge Richard Stone, MD, admitted that VHA does have a shortage of PPE in a Washington Post interview.11 He outlined how the organization plans to address staff concerns. The article also reported only a 4% absentee rate of VHA staff as opposed to the 40% that plans predicted was possible. This demonstrates once more the dedication of VHA health care professionals and workers to fulfill their duty to care for veterans even amid fears about inadequate PPE.
In the epigraph, Albert Camus captures the uncertainty and fear that as humans all health care providers experience as they face the unpredictable but very real threat of COVID-19.1 Camus expresses even more strongly the devotion to duty of health care providers to care for vulnerable ill patients in need despite the inherent threat in a highly transmissible and potentially deadly infection that is inextricably linked to that caring. Orentlicher wisely opines that the integrity of the health professions and their respected role in society benefit from a strong duty to care.5 The best way to promote that duty is to do all in our power to protect those who willingly brave the pestilence to treat, and hope and pray someday to cure COVID-19.
As of April 9, 2020, the Centers for Disease Control and Prevention (CDC) reported that 9,282 health care providers in the US had contracted COVID-19, and 27 had died of the virus.2 Medscape reports the toll as much higher. Thousands more nurses, doctors, epidemiologists, social workers, physician assistants, dentists, pharmacists, and other health care workers from Italy, China, and dozens of other countries have died fighting this plague.3
The truth is no one knows how many health care workers are actually sick or even have died. State and federal governments have not been routinely and specifically tracking that data, making these already grim statistics likely a gross underestimation.4 While not all of these health care providers were exposed to COVID-19 in the line of duty, many were, and many more will be as the pandemic subsides in one epicenter only to erupt in another, and smolders for months until a vaccine quenches it.
Each of those lost lives of promise had a story of hard work and sacrifice to become a health care professional, of friends and family who loved and cared for them when ill, who need and grieve for them, now gone far too soon. Nor should we forget to mourn all of the administrative professionals, the line and support staff of health care facilities, who also perished fighting the pestilence. It is fitting then, that this second editorial in my pledge to write each month about COVID-19 until the pandemic ends, be about the duty to care and its limits.
The duty to care is among the most fundamental and ancient ethical obligations of health care providers. It is included even in modern codes of ethics like that of the American Medical Association and American Nurses Association. The obligation to not abandon patients is even more compelling for the Military Health System, Veterans Health Administration (VHA), and the US Public Health Service whose health care mission also is a public trust. The duty is rooted in the fiduciary nature of the health professions in which the interests of the patient should take priority over other considerations, including a risk to their own health and life. Prioritization though has exceptions. Physician and attorney David Orentlicher points out the unconditional obligation that bound physicians in the 14th century Black Death, or the 1918 Spanish influenza, now admits exceptions and qualifications.5
The exception that has become the object of greatest concern to health care workers is personal protective equipment (PPE). In modern public health ethics, health care systems and state and federal governments have a corresponding ethical obligation of reciprocity toward their employees whose work places them at elevated risk of harm—in this case, COVID-19 exposure. The principle of reciprocity encompasses the measures and materials that health care institutions need to provide to health care workers to reasonably minimize the risk of viral transmission. The reasonableness standard does not demand that there be zero risk. It does require that health care workers have adequate and appropriate PPE so that in fulfilling their duty to care they are not exposed to a disproportionate risk.
This last assertion has been the subject of controversy in the media and consternation on the part of health care professionals for several disconcerting reasons. First and foremost, a cascade failure on the part of government and industry has resulted in PPE being the scarcest health care resource in this pandemic.6 The shortage is as serious as that of the life-saving ventilators that are rightly at the center of most crisis standards resource allocation plans.7 Second, the guidance from the CDC and other authoritative sources continues to change. This is, in part, to adjust to the even more rapid pace of knowledge about the virus and its behavior and to adapt to the reality of insufficient PPE.8
Understandably, health care providers, especially those on the frontlines, may lose trust in the scientific experts and the leadership of their institutions, compounding the climate of moral distress in a public health crisis. Health care workers in the community, and even in federal service, have launched socially distanced protests and taken to social media to voice their concern and rally assistance.9,10 In response, VHA Executive-in-Charge Richard Stone, MD, admitted that VHA does have a shortage of PPE in a Washington Post interview.11 He outlined how the organization plans to address staff concerns. The article also reported only a 4% absentee rate of VHA staff as opposed to the 40% that plans predicted was possible. This demonstrates once more the dedication of VHA health care professionals and workers to fulfill their duty to care for veterans even amid fears about inadequate PPE.
In the epigraph, Albert Camus captures the uncertainty and fear that as humans all health care providers experience as they face the unpredictable but very real threat of COVID-19.1 Camus expresses even more strongly the devotion to duty of health care providers to care for vulnerable ill patients in need despite the inherent threat in a highly transmissible and potentially deadly infection that is inextricably linked to that caring. Orentlicher wisely opines that the integrity of the health professions and their respected role in society benefit from a strong duty to care.5 The best way to promote that duty is to do all in our power to protect those who willingly brave the pestilence to treat, and hope and pray someday to cure COVID-19.
1. Camus A. The Plague. Vintage Books: New York; 1948:120.
2. CDC COVID-19 Response Team. Characteristics of Health Care Personnel with COVID-19— United States, February 12-April 9, 2020. MMWR Morb Mortal Wkly Rep. 2020;69(15):477-481.
3. In memoriam: healthcare workers who have died of COVID-19. https://www.medscape.com/viewarticle/927976. Updated April 21, 2020. Accessed April 22, 2020.
4. Galvin G. The great unknown: how many health care workers have coronavirus? https://www.usnews.com/news/national-news/articles/2020-04-03/how-many-health-care-workers-have-coronavirus. Published April 3, 2020. Accessed April 22, 2020.
5. Orentlicher D. The physician’s duty to treat during pandemics. Am J Public Health. 2018;108(11):1459-1461.
6. Ranney ML, Griffeth V, Jha AK. Critical supply shortages—the need for ventilators and personal protective equipment during the Covid-19 pandemic. [Published online ahead of print, 2020 Mar 25.] N Engl J Med. 2020;10.1056/NEJMp2006141.
7. New York State Task Force on Life and the Law, New York State Department of Health. Ventilator allocation guidelines. https://www.health.ny.gov/regulations/task_force/reports_publications/docs/ventilator_guidelines.pdf. Published November 2015. Accessed April 22, 2020.
8. Centers for Disease Control and Prevention. Coronavirus Disease 2019 (COVID-2019): Strategies to optimize PPE and equipment. https://www.cdc.gov/coronavirus/2019-ncov/hcp/ppe-strategy/index.html. Updated April 3, 2020. Accessed April 22, 2020.
9. Wentling N. ‘It’s out of control’: VA nurses demand more protection against coronavirus. https://www.stripes.com/news/veterans/va-nurses-demand-more-protection-against-coronavirus-1.626910. Updated April 21, 2020. Accessed April 22, 2020.
10. Padilla M. ‘It feels like a war zone’: doctors and nurses plead for masks on social media. https://www.nytimes.com/2020/03/19/us/hospitals-coronavirus-ppe-shortage.html. Updated March 22, 2020. Accessed April 22, 2020.
11. Rein L. VA health chief acknowledges a shortage of protective gear for its hospital workers. https://www.washingtonpost.com/politics/va-health-chief-acknowledges-a-shortage-of-protective-gear-for-its-hospital-workers/2020/04/24/4c1bcd5e-84bf-11ea-ae26-989cfce1c7c7_story.html. Published April 25, 2020. Accessed April 27, 2020.
1. Camus A. The Plague. Vintage Books: New York; 1948:120.
2. CDC COVID-19 Response Team. Characteristics of Health Care Personnel with COVID-19— United States, February 12-April 9, 2020. MMWR Morb Mortal Wkly Rep. 2020;69(15):477-481.
3. In memoriam: healthcare workers who have died of COVID-19. https://www.medscape.com/viewarticle/927976. Updated April 21, 2020. Accessed April 22, 2020.
4. Galvin G. The great unknown: how many health care workers have coronavirus? https://www.usnews.com/news/national-news/articles/2020-04-03/how-many-health-care-workers-have-coronavirus. Published April 3, 2020. Accessed April 22, 2020.
5. Orentlicher D. The physician’s duty to treat during pandemics. Am J Public Health. 2018;108(11):1459-1461.
6. Ranney ML, Griffeth V, Jha AK. Critical supply shortages—the need for ventilators and personal protective equipment during the Covid-19 pandemic. [Published online ahead of print, 2020 Mar 25.] N Engl J Med. 2020;10.1056/NEJMp2006141.
7. New York State Task Force on Life and the Law, New York State Department of Health. Ventilator allocation guidelines. https://www.health.ny.gov/regulations/task_force/reports_publications/docs/ventilator_guidelines.pdf. Published November 2015. Accessed April 22, 2020.
8. Centers for Disease Control and Prevention. Coronavirus Disease 2019 (COVID-2019): Strategies to optimize PPE and equipment. https://www.cdc.gov/coronavirus/2019-ncov/hcp/ppe-strategy/index.html. Updated April 3, 2020. Accessed April 22, 2020.
9. Wentling N. ‘It’s out of control’: VA nurses demand more protection against coronavirus. https://www.stripes.com/news/veterans/va-nurses-demand-more-protection-against-coronavirus-1.626910. Updated April 21, 2020. Accessed April 22, 2020.
10. Padilla M. ‘It feels like a war zone’: doctors and nurses plead for masks on social media. https://www.nytimes.com/2020/03/19/us/hospitals-coronavirus-ppe-shortage.html. Updated March 22, 2020. Accessed April 22, 2020.
11. Rein L. VA health chief acknowledges a shortage of protective gear for its hospital workers. https://www.washingtonpost.com/politics/va-health-chief-acknowledges-a-shortage-of-protective-gear-for-its-hospital-workers/2020/04/24/4c1bcd5e-84bf-11ea-ae26-989cfce1c7c7_story.html. Published April 25, 2020. Accessed April 27, 2020.
Leadership & Professional Development: Make a Friend Before You Need One
“Takers believe in a zero-sum world, and they end up creating one where bosses, colleagues and clients don’t trust them. Givers build deeper and broader relationships—people are rooting for them instead of gunning for them.”
—Adam Grant
To succeed in a hospital, leaders need a generous supply of social and political capital. House officers learn this very quickly, especially when they are relying on other members of the healthcare team to obtain tests and studies for their patients and calling for specialty consultations. To be successful and efficient, building relationships and trust is key. Such capital, unfortunately, takes time to develop. Therefore, healthcare leaders and clinicians at all levels of training need to make an everyday investment of goodwill and friendliness with those they encounter. The dividends may be slow in coming, but they are substantial and sustained. Friends give you the benefit of the doubt—and help you when you are most in need.
Having friends (or friendly colleagues) at work is beneficial both professionally and personally. The benefits of social interactions have been studied for years and even more so in recent times with the dramatic increase in the use of handheld devices. Eye contact between casual acquaintances passing each other in the hallway is replaced with eyes focused downward on smartphones. The result? We are becoming more socially isolated. Our personal solution? When we see professional colleagues (or patients and families in the hallways of our hospital), we nod in acknowledgement with appropriate eye contact and say “Good morning” or “Hello” even if we don’t know them—even if their eyes are focused on their devices as they walk past you in the hallway. You get a gold star if you remember the names of the professional colleagues you see frequently in the hallways or around the hospital.
This isn’t soft science; it’s backed by hard data. When we conduct site visits of different hospitals around the country to help them improve their care quality and performance, we informally divide hospitals into two groups: The “How ya doin’?” hospitals vs the “Rec-Ignore” hospitals (in which employees recognize a colleague in the hallway but choose to not acknowledge them). Most prefer to work at a “How ya doin’?” hospital. Being friendly has been linked to increased team spirit and morale, knowledge sharing, trust, prevention of burnout, and sense of a positive working environment. It also makes you feel better about yourself—and makes other people feel similarly as well.
We’ll share an example from a search for a new department chair. The dean went on reverse site visits to meet the two finalists in their home institutions and asked them for tours of their hospitals. Candidate A walked around and it seemed like everyone knew her. She smiled and said hello to the people she came in contact with during the tour. Not so for candidate B—just the opposite. Guess which candidate the dean hired?
Put away your phone, interact with your colleagues, and learn to make small talk, and not just with your supervisors or peers. Chitchat is an important “social lubricant,” fostering a sense of community and teamwork. It helps bring down the divides that come from organizational hierarchies. It helps endear you to your staff.
Developing a reputation as a nice person who is quick with a smile and even quicker with a “How ya doin’?” pays off in the end. This reputation also makes it easier to give bad news, something that all leaders must do at some point. So make a friend before you need one—it usually will pay dividends.
“Takers believe in a zero-sum world, and they end up creating one where bosses, colleagues and clients don’t trust them. Givers build deeper and broader relationships—people are rooting for them instead of gunning for them.”
—Adam Grant
To succeed in a hospital, leaders need a generous supply of social and political capital. House officers learn this very quickly, especially when they are relying on other members of the healthcare team to obtain tests and studies for their patients and calling for specialty consultations. To be successful and efficient, building relationships and trust is key. Such capital, unfortunately, takes time to develop. Therefore, healthcare leaders and clinicians at all levels of training need to make an everyday investment of goodwill and friendliness with those they encounter. The dividends may be slow in coming, but they are substantial and sustained. Friends give you the benefit of the doubt—and help you when you are most in need.
Having friends (or friendly colleagues) at work is beneficial both professionally and personally. The benefits of social interactions have been studied for years and even more so in recent times with the dramatic increase in the use of handheld devices. Eye contact between casual acquaintances passing each other in the hallway is replaced with eyes focused downward on smartphones. The result? We are becoming more socially isolated. Our personal solution? When we see professional colleagues (or patients and families in the hallways of our hospital), we nod in acknowledgement with appropriate eye contact and say “Good morning” or “Hello” even if we don’t know them—even if their eyes are focused on their devices as they walk past you in the hallway. You get a gold star if you remember the names of the professional colleagues you see frequently in the hallways or around the hospital.
This isn’t soft science; it’s backed by hard data. When we conduct site visits of different hospitals around the country to help them improve their care quality and performance, we informally divide hospitals into two groups: The “How ya doin’?” hospitals vs the “Rec-Ignore” hospitals (in which employees recognize a colleague in the hallway but choose to not acknowledge them). Most prefer to work at a “How ya doin’?” hospital. Being friendly has been linked to increased team spirit and morale, knowledge sharing, trust, prevention of burnout, and sense of a positive working environment. It also makes you feel better about yourself—and makes other people feel similarly as well.
We’ll share an example from a search for a new department chair. The dean went on reverse site visits to meet the two finalists in their home institutions and asked them for tours of their hospitals. Candidate A walked around and it seemed like everyone knew her. She smiled and said hello to the people she came in contact with during the tour. Not so for candidate B—just the opposite. Guess which candidate the dean hired?
Put away your phone, interact with your colleagues, and learn to make small talk, and not just with your supervisors or peers. Chitchat is an important “social lubricant,” fostering a sense of community and teamwork. It helps bring down the divides that come from organizational hierarchies. It helps endear you to your staff.
Developing a reputation as a nice person who is quick with a smile and even quicker with a “How ya doin’?” pays off in the end. This reputation also makes it easier to give bad news, something that all leaders must do at some point. So make a friend before you need one—it usually will pay dividends.
“Takers believe in a zero-sum world, and they end up creating one where bosses, colleagues and clients don’t trust them. Givers build deeper and broader relationships—people are rooting for them instead of gunning for them.”
—Adam Grant
To succeed in a hospital, leaders need a generous supply of social and political capital. House officers learn this very quickly, especially when they are relying on other members of the healthcare team to obtain tests and studies for their patients and calling for specialty consultations. To be successful and efficient, building relationships and trust is key. Such capital, unfortunately, takes time to develop. Therefore, healthcare leaders and clinicians at all levels of training need to make an everyday investment of goodwill and friendliness with those they encounter. The dividends may be slow in coming, but they are substantial and sustained. Friends give you the benefit of the doubt—and help you when you are most in need.
Having friends (or friendly colleagues) at work is beneficial both professionally and personally. The benefits of social interactions have been studied for years and even more so in recent times with the dramatic increase in the use of handheld devices. Eye contact between casual acquaintances passing each other in the hallway is replaced with eyes focused downward on smartphones. The result? We are becoming more socially isolated. Our personal solution? When we see professional colleagues (or patients and families in the hallways of our hospital), we nod in acknowledgement with appropriate eye contact and say “Good morning” or “Hello” even if we don’t know them—even if their eyes are focused on their devices as they walk past you in the hallway. You get a gold star if you remember the names of the professional colleagues you see frequently in the hallways or around the hospital.
This isn’t soft science; it’s backed by hard data. When we conduct site visits of different hospitals around the country to help them improve their care quality and performance, we informally divide hospitals into two groups: The “How ya doin’?” hospitals vs the “Rec-Ignore” hospitals (in which employees recognize a colleague in the hallway but choose to not acknowledge them). Most prefer to work at a “How ya doin’?” hospital. Being friendly has been linked to increased team spirit and morale, knowledge sharing, trust, prevention of burnout, and sense of a positive working environment. It also makes you feel better about yourself—and makes other people feel similarly as well.
We’ll share an example from a search for a new department chair. The dean went on reverse site visits to meet the two finalists in their home institutions and asked them for tours of their hospitals. Candidate A walked around and it seemed like everyone knew her. She smiled and said hello to the people she came in contact with during the tour. Not so for candidate B—just the opposite. Guess which candidate the dean hired?
Put away your phone, interact with your colleagues, and learn to make small talk, and not just with your supervisors or peers. Chitchat is an important “social lubricant,” fostering a sense of community and teamwork. It helps bring down the divides that come from organizational hierarchies. It helps endear you to your staff.
Developing a reputation as a nice person who is quick with a smile and even quicker with a “How ya doin’?” pays off in the end. This reputation also makes it easier to give bad news, something that all leaders must do at some point. So make a friend before you need one—it usually will pay dividends.
Rapid Publication, Knowledge Sharing, and Our Responsibility During the COVID-19 Pandemic
The first case of coronavirus disease 2019 (COVID-19) in the United States was identified in Washington state in late January 2020. As of mid-April 2020, the number of US cases has increased to more than 800,000 with over 40,000 deaths. The limited available knowledge to guide medical decision-making combined with rapid progression of the pandemic has resulted in an urgent need to better define clinical, radiologic, and laboratory features of the disease, predictors of disease progression, predominant modes of transmission, and effective treatments. This urgency has led to a flood of manuscript submissions, which strains the scientific vetting process and leads to the spread of medical misinformation and potential for serious harm. As an example, a small observational (noncontrolled) study that used an antimalarial drug to treat COVID-19 patients was touted by several national leaders as proof of its effectiveness, despite substantial methodologic limitations.1,2 While the article has not yet been retracted, the International Society of Antimicrobial Chemotherapy, the publishing journal’s society sponsor, subsequently issued a statement that “the article does not meet the Society’s expected standard.”3
With these concerns in mind, we recognize the importance of addressing the current pandemic and identifying areas where we can advance the field responsibly in the face of limited evidence in a rapidly evolving situation. Hospitalists throughout the world are facing unprecedented leadership challenges, navigating ethical stressors, and redesigning their care systems while learning rapidly and adapting nimbly. In this issue, we share leadership strategies, explore ethical challenges and controversies, describe successful practices, and provide personal reflections from a diverse group of hospitalists and leaders. As a journal, we have intentionally avoided rapid publication of articles with substantial methodologic limitations that are unlikely to advance our knowledge of COVID-19 even though such articles may generate substantial media coverage. Different regions of the country are at different stages of the pandemic; some hospitals are experiencing high patient volumes and struggling with shortages of equipment and supplies, while others are weeks away from peak disease activity or have avoided periods of high prevalence altogether. These varied experiences offer an opportunity to share our learnings and perspectives as we wait for more definitive evidence on best management practices. As part of our commitment to our colleagues in healthcare and to the broader scientific community, all Journal of Hospital Medicine articles related to COVID-19 and published during the pandemic will be open access (ie, freely accessible).
1. Gautret P, Lagier JC, Parola P, et al. Hydroxychloroquine and azithromycin as a treatment of COVID-19: results of an open-label non-randomized clinical trial. Int J Antimicrob Agents. 2020. https://doi.org/10.1016/j.ijantimicag.2020.105949.
2. Baker P, Rogers K, Enrich D, Haberman M. Trump’s aggressive advocacy of malaria drug for treating coronavirus divides medical community. New York Times. April 6, 2020. https://www.nytimes.com/2020/04/06/us/politics/coronavirus-trump-malaria-drug.html. Accessed April 13, 2020.
3. International Society of Antimicrobial Chemotherapy. Statement on International Journal of Antimicrobial Agents paper. https://www.isac.world/news-and-publications/official-isac-statement. Accessed April 13, 2020.
The first case of coronavirus disease 2019 (COVID-19) in the United States was identified in Washington state in late January 2020. As of mid-April 2020, the number of US cases has increased to more than 800,000 with over 40,000 deaths. The limited available knowledge to guide medical decision-making combined with rapid progression of the pandemic has resulted in an urgent need to better define clinical, radiologic, and laboratory features of the disease, predictors of disease progression, predominant modes of transmission, and effective treatments. This urgency has led to a flood of manuscript submissions, which strains the scientific vetting process and leads to the spread of medical misinformation and potential for serious harm. As an example, a small observational (noncontrolled) study that used an antimalarial drug to treat COVID-19 patients was touted by several national leaders as proof of its effectiveness, despite substantial methodologic limitations.1,2 While the article has not yet been retracted, the International Society of Antimicrobial Chemotherapy, the publishing journal’s society sponsor, subsequently issued a statement that “the article does not meet the Society’s expected standard.”3
With these concerns in mind, we recognize the importance of addressing the current pandemic and identifying areas where we can advance the field responsibly in the face of limited evidence in a rapidly evolving situation. Hospitalists throughout the world are facing unprecedented leadership challenges, navigating ethical stressors, and redesigning their care systems while learning rapidly and adapting nimbly. In this issue, we share leadership strategies, explore ethical challenges and controversies, describe successful practices, and provide personal reflections from a diverse group of hospitalists and leaders. As a journal, we have intentionally avoided rapid publication of articles with substantial methodologic limitations that are unlikely to advance our knowledge of COVID-19 even though such articles may generate substantial media coverage. Different regions of the country are at different stages of the pandemic; some hospitals are experiencing high patient volumes and struggling with shortages of equipment and supplies, while others are weeks away from peak disease activity or have avoided periods of high prevalence altogether. These varied experiences offer an opportunity to share our learnings and perspectives as we wait for more definitive evidence on best management practices. As part of our commitment to our colleagues in healthcare and to the broader scientific community, all Journal of Hospital Medicine articles related to COVID-19 and published during the pandemic will be open access (ie, freely accessible).
The first case of coronavirus disease 2019 (COVID-19) in the United States was identified in Washington state in late January 2020. As of mid-April 2020, the number of US cases has increased to more than 800,000 with over 40,000 deaths. The limited available knowledge to guide medical decision-making combined with rapid progression of the pandemic has resulted in an urgent need to better define clinical, radiologic, and laboratory features of the disease, predictors of disease progression, predominant modes of transmission, and effective treatments. This urgency has led to a flood of manuscript submissions, which strains the scientific vetting process and leads to the spread of medical misinformation and potential for serious harm. As an example, a small observational (noncontrolled) study that used an antimalarial drug to treat COVID-19 patients was touted by several national leaders as proof of its effectiveness, despite substantial methodologic limitations.1,2 While the article has not yet been retracted, the International Society of Antimicrobial Chemotherapy, the publishing journal’s society sponsor, subsequently issued a statement that “the article does not meet the Society’s expected standard.”3
With these concerns in mind, we recognize the importance of addressing the current pandemic and identifying areas where we can advance the field responsibly in the face of limited evidence in a rapidly evolving situation. Hospitalists throughout the world are facing unprecedented leadership challenges, navigating ethical stressors, and redesigning their care systems while learning rapidly and adapting nimbly. In this issue, we share leadership strategies, explore ethical challenges and controversies, describe successful practices, and provide personal reflections from a diverse group of hospitalists and leaders. As a journal, we have intentionally avoided rapid publication of articles with substantial methodologic limitations that are unlikely to advance our knowledge of COVID-19 even though such articles may generate substantial media coverage. Different regions of the country are at different stages of the pandemic; some hospitals are experiencing high patient volumes and struggling with shortages of equipment and supplies, while others are weeks away from peak disease activity or have avoided periods of high prevalence altogether. These varied experiences offer an opportunity to share our learnings and perspectives as we wait for more definitive evidence on best management practices. As part of our commitment to our colleagues in healthcare and to the broader scientific community, all Journal of Hospital Medicine articles related to COVID-19 and published during the pandemic will be open access (ie, freely accessible).
1. Gautret P, Lagier JC, Parola P, et al. Hydroxychloroquine and azithromycin as a treatment of COVID-19: results of an open-label non-randomized clinical trial. Int J Antimicrob Agents. 2020. https://doi.org/10.1016/j.ijantimicag.2020.105949.
2. Baker P, Rogers K, Enrich D, Haberman M. Trump’s aggressive advocacy of malaria drug for treating coronavirus divides medical community. New York Times. April 6, 2020. https://www.nytimes.com/2020/04/06/us/politics/coronavirus-trump-malaria-drug.html. Accessed April 13, 2020.
3. International Society of Antimicrobial Chemotherapy. Statement on International Journal of Antimicrobial Agents paper. https://www.isac.world/news-and-publications/official-isac-statement. Accessed April 13, 2020.
1. Gautret P, Lagier JC, Parola P, et al. Hydroxychloroquine and azithromycin as a treatment of COVID-19: results of an open-label non-randomized clinical trial. Int J Antimicrob Agents. 2020. https://doi.org/10.1016/j.ijantimicag.2020.105949.
2. Baker P, Rogers K, Enrich D, Haberman M. Trump’s aggressive advocacy of malaria drug for treating coronavirus divides medical community. New York Times. April 6, 2020. https://www.nytimes.com/2020/04/06/us/politics/coronavirus-trump-malaria-drug.html. Accessed April 13, 2020.
3. International Society of Antimicrobial Chemotherapy. Statement on International Journal of Antimicrobial Agents paper. https://www.isac.world/news-and-publications/official-isac-statement. Accessed April 13, 2020.
© 2020 Society of Hospital Medicine
Things We Do For No Reason™: Treatment of Infection-Related Fever in Hospitalized Patients
CLINICAL SCENARIO
The hospitalist admitted a 56-year-old man with hypertension and hyperlipidemia to the general medical unit for community-acquired pneumonia and started him on appropriate antimicrobial therapy. On the evening of admission, the nurse woke the patient to take his vital signs and noted a fever of 39.1°C (102.4°F). The patient had a pulse of 90 beats per minute, normal blood pressure, and a stable supplemental oxygen requirement via nasal cannula. The nurse noted an oral acetaminophen “as needed” order for fever. She woke the patient again to administer acetaminophen and notified the hospitalist.
BACKGROUND
Hospitalists frequently encounter febrile patients. According to one large hospital survey, fever occurs in 25% of pediatric and 31% of adult medical patients.1 Fever in hospitalized patients most commonly results from infection, but autoimmune disease, malignancy, and an array of other inflammatory conditions cause fevers as well.1
Defined as an elevated body temperature resulting from a raised hypothalamic set point2, hospitalists often treat fever with acetaminophen or nonsteroidal anti-inflammatory drugs (NSAIDs). These routinely administered medications act centrally to temporarily lower the hypothalamic set point and relieve fever.2,3 Standard hospital admission order sets commonly include an as-needed antipyretic every 4 to 6 hours for treatment of fever, regardless of the presence of fever-related symptoms.
Fever is differentiated from hyperthermia, where temperature increases because of dysregulated peripheral processes despite a normal hypothalamic set point.2 Examples of hyperthermia include heat stroke, malignant hyperthermia, and neuroleptic malignant syndrome. Notably, antipyretic medications have no effect on hyperthermia, but physical means, such as cooling blankets, can lead to temperature reduction.2
WHY YOU MIGHT THINK TREATMENT OF INFECTION-RELATED FEVER IS HELPFUL IN HOSPITALIZED PATIENTS
Hospitalists prescribe antipyretic medication to alleviate fever-related symptoms, including headache, chills and sweats, and joint and muscle aches.3 While researchers have sparingly studied this practice, available evidence and experience suggest that fever-related symptoms decline in parallel with defervescence after administration of acetaminophen or NSAIDs in both adult and pediatric populations.4,5 One randomized, controlled, double-blind study of nearly 400 adult outpatients in Germany with febrile upper respiratory tract infections showed that both aspirin and acetaminophen bested the placebo in reducing fever and associated headache, achiness, and discomfort over a span of 6 hours.4 In another study, this time with pediatric patients hospitalized with fever and uncomplicated respiratory tract infections, patients who received acetaminophen had statistically significant improvements in activity, alertness, mood, comfort, appetite, and fluid intake 6 hours after receiving that therapy.5
Physicians, nurses, and caregivers also commonly believe that fever is inherently noxious and that treatment of infection-related fever contributes to fighting the infection itself.2,3,6 The pediatric literature describes parents, caretakers, and clinicians who suffer from “fever phobia,” the worry that fevers contribute to long-term neurologic complications, recurrent febrile seizures, and death.6,7
Finally, healthcare providers administer antipyretic medication to mitigate the demand fever places on the cardiovascular and pulmonary systems.3 An elevated temperature increases the body’s metabolic rate, oxygen consumption, and cardiac output that critically ill patients who have acute and/or chronic compromise to those systems may not tolerate. For example, patients requiring pressor support for hemodynamic shock or mechanical ventilation for respiratory failure may not tolerate an elevated temperature.8
WHY THERE IS NO REASON TO TREAT INFECTION-RELATED FEVER IN ASYMPTOMATIC HOSPITALIZED PATIENTS
Fever serves as an adaptive host response to infection, boosting innate and adaptive immunity in a multitude of ways.8 In animal models, fever slows the replication of pathogenic bacteria and enhances the activity of antibiotic agents.8 In vitro studies demonstrate that fever increases mobility of leukocytes, phagocytic activity, and proliferation of T cells.8 Retrospective case-control studies of patients hospitalized with severe bacterial illnesses, including gram-negative bacteremia, spontaneous bacterial peritonitis, and community-acquired pneumonia, found that patients with a documented febrile response had increased survival compared with those who remained afebrile during the infection.9 In addition, a large retrospective cohort study of septic ICU patients found a progressive decline in mortality in association with increasing peak temperature on the day of ICU admission.10
In addition to the above studies supporting the important role of fever in fighting infection, recent evidence definitively demonstrates no mortality or morbidity benefit of using antipyretic medications in infected patients. A 2017 meta-analysis that included eight observational and eight randomized studies, totaling 18,939 adult septic ICU patients, demonstrated no difference in hospital and 28-day mortality in patients treated with antipyretics vs those who were not.11 The authors again found no mortality benefit with antipyretic use when separately analyzing data from only the randomized controlled trials (1,507 patients) or when stratifying patients based on the type of antipyretic received (acetaminophen, NSAIDs, or physical cooling).11 They reported no differences in predefined secondary outcomes of shock reversal or nosocomial infections. The authors commented that these robust results likely would not change even with more data from additional trials. In children, a recent meta-analysis of three randomized controlled trials (540 patients) did not find the use of acetaminophen, ibuprofen, or diclofenac effective in preventing febrile seizures.12Pediatric practice guidelines consistently recommend using antipyretic medication to alleviate discomfort caused by fever and not solely to reduce temperature.13,14
Antipyretic agents interfere with the effectiveness of the body’s immune response, as demonstrated in a number of infectious diseases.2,15-18 Two randomized controlled studies conducted in healthy adult volunteers challenged with rhinovirus reported increased viral shedding and decreased antibody response in those subjects who received aspirin or acetaminophen, compared with those given placebo.15,16 In another randomized controlled trial conducted in African children with malaria, paracetamol use delayed parasite clearance by 16 hours.17 A large case-control study correlated the use of NSAIDs with an increased risk of severe skin and soft-tissue complications in children with varicella and in adults with varicella zoster. 18 The international scientific community has raised concerns about worse outcomes with NSAID use in patients with COVID-19, the disease caused by severe acute respiratory syndrome coronavirus 2 (SARS-CoV-2); NSAIDs should be avoided in stable patients with COVID-19 until more data are available. 19
Additional risks and potential harms accompany antipyretic fever therapy. First, NSAIDs or acetaminophen may adversely affect patients with renal or hepatic insufficiency.2,3 Second, masking fevers may impair the clinician’s ability to diagnose or evaluate response to treatment. Third, unnecessarily waking a sleeping patient to check temperature or administer unneeded antipyretics can contribute to hospital-associated problems, including delirium, insomnia, and falls. Treating these iatrogenic problems in turn may require additional medications or interventions. These unintended consequences may potentially prolong hospital stays, increase medication errors and polypharmacy, and detract from a patient’s overall healing and recovery.
While the use of antipyretic medications improves fever-related symptoms, it comes at the cost of blunting a protective host response and exposes patients to medication risks without providing a clinical benefit. In sleeping, asymptomatic, or minimally symptomatic hospitalized patients, the risks of administering antipyretic medications clearly outweigh the benefits.
WHEN TREATING FEVER IS INDICATED
Treatment with antipyretic medication can alleviate fever-related symptoms in those patients who have significant headache, body aches, chills, or sweats and in pediatric patients with notable malaise, irritability, or poor oral intake. Debate continues on the use of antipyretics in the ICU setting when managing critically ill patients with severe cardiopulmonary compromise who may not tolerate the additional hemodynamic strain a fever produces (eg, patients with shock requiring vasopressor support or respiratory failure requiring mechanical ventilation). Remember, decrease body temperature in hyperthermia syndromes by physical means.
WHAT WE SHOULD DO INSTEAD
Withhold antipyretic medication (ie, allow permissive fever) in well-appearing general medical patients with asymptomatic infection-related fevers. In patients who tolerate fever with minimal or no symptoms, potential benefits of permissive fever include decreased time to infection resolution and/or decreased risk of hospital-acquired infections. This may result in shorter hospital stays and significant cost savings. If we do not treat patients with asymptomatic fevers, then it follows that we should not check overnight temperatures in hospitalized patients sleeping comfortably.
RECOMMENDATIONS
- Do not order as-needed antipyretic medication for stable patients on general medical units with infection solely to reduce temperature or achieve normothermia.
- Only treat infected febrile patients with antipyretic medications for fever-related symptoms (headache, chills, or body aches or, in pediatric patients, irritability, malaise, or poor oral intake).
- Treat pathologically elevated temperatures (ie, hyperthermia syndromes) with physical measures because antipyretic medications will be ineffective.
CONCLUSIONS
In the clinical scenario, the hospitalist admitted the patient in stable condition for treatment of a community-acquired pneumonia. He mounted a febrile response to infection, which suggests that his active immune system may aid in recovery. The nurse noted the fever while the patient slept comfortably without fever-related symptoms.
After discussing these facts with the patient’s concerned nurse, the clinician should discontinue the order for as-needed acetaminophen for fever and instead recommend permissive fever without administration of antipyretic medication. This may facilitate recovery, avoid unnecessary polypharmacy, and allow the medical care team to follow his fever curve to ensure that the infection is adequately treated. If the patient develops bothersome fever-related symptoms, the hospitalist can reasonably treat with a single-dose of acetaminophen or NSAID.
Do you think this is a low-value practice? Is this truly a “Thing We Do for No Reason™”? Share what you do in your practice and join in the conversation online by retweeting it on Twitter (#TWDFNR) and liking it on Facebook. We invite you to propose ideas for other “Things We Do for No Reason” topics by emailing [email protected].
1. McGowan JE Jr, Rose RC, Jacobs NF, Schaberg DR, Haley RW. Fever in hospitalized patients, with special reference to the medical service. Am J Med. 1987;82(3):580-586. https://doi.org/10.1016/0002-9343(87)90103-3.
2. Plaisance K, Mackowiak P. Antipyretic therapy. Arch Intern Med. 2000;160:449-456. https://doi.org/10.1001/archinte.160.4.449.
3. Greisman LA, Mackowiak PA. Fever: beneficial and detrimental effects of antipyretics. Curr Opin Infect Dis. 2002;15:241-245. https://doi.org/10.1097/00001432-200206000-00005.
4. Bachert C, Chuchalin AG, Eisebitt R, Netayzhenko VZ, Voelker M. Aspirin compared with acetaminophen in the treatment of fever and other symptoms of upper respiratory tract infection in adults: a multicenter, randomized, double-blind, double-dummy, placebo-controlled, parallel-group, single-dose, 6-hour dose-ranging study. Clin Ther. 2005;27(7):993-1003. https://doi.org/10.1016/j.clinthera.2005.06.002.
5. Gupta H, Shah D, Gupta P, Sharma KK. Role of paracetamol in treatment of childhood fever: a double-blind randomized placebo controlled trial. Indian Pediatr. 2007;44:903-911.
6. Schmitt BD. Fever phobia: misconceptions of parents about fevers. Am J Dis Child. 1980;134(2):176-181.
7. Karwowska A, Nijssen-Jordan C, Johnson D, Davies HD. Parental and health care provider understanding of childhood fever: a Canadian perspective. CJEM. 2002;4(6):394-400. https://doi.org/10.1017/s1481803500007892.
8. Kiekkas P, Aretha D, Bakalis N, Karpouhtsi I, Marneras C, Baltopoulos GI. Fever effects and treatment in critical care: literature review. Aust Crit Care. 2013;26:130-135. https://doi.org/10.1016/j.aucc.2012.10.004.
9. Hasday JD, Fairchild KD, Shanholtz C. The role of fever in the infected host. Microbes Infect. 2000;2(15):1891-1894. https://doi.org/10.1016/s1286-4579(00)01337-x.
10. Young PJ, Saxena M, Beasley R, et al. Early peak temperature and mortality in critically ill patients with or without infection. Intensive Care Med. 2012;38:437-444. https://doi.org/10.1007/s00134-012-2478-3.
11. Drewry A, Ablordeppey E, Murray E, et al. Antipyretic therapy in critically ill septic patients: a systematic review and meta-analysis. Crit Care Med. 2017;45(5):806-813. https://doi.org/10.1097/CCM.0000000000002285.
12. Rosenbloom E, Finkelstein Y, Adams-Webber T, Kozer E. Do antipyretics prevent the recurrence of febrile seizures in children? a systematic review of randomized controlled trials and meta-analysis. Eur J Paediatr Neuro. 2013;17:585-588. https://doi.org/10.1016/j.ejpn.2013.04.008.
13. Chiappini J, Venturini E, Remaschi G. 2016 Update of the Italian Pediatric Society Guidelines for management of fever in children. J Pediatr. 2017;180:177-183. https://doi.org/10.1016/j.jpeds.2016.09.043.
14. Fields E, Chard J, Murphy MS, Richardson M, Guideline Development Group and Technical Team. Assessment and initial management of feverish illness in children younger than five years: summary of updated NICE guidance. BMJ. 2013;346:f2866. https://doi.org/10.1136/bmj.f2866.
15. Stanley ED, Jackson GG, Panusarn C, Rubenis M, Dirda V. Increased viral shedding with aspirin treatment of rhinovirus infection. JAMA. 1975;231:1248-1251. https://doi.org/10.1001/jama.1975.03240240018017.
16. Graham NM, Burrell CJ, Douglas RM, Debelle P, Davies L. Adverse effects of aspirin, acetaminophen, and ibuprofen on immune function, viral shedding, and clinical status in rhinovirus-infected volunteers. J Infect Dis. 1990;162:1277-1282. https://doi.org/10.1093/infdis/162.6.1277.
17. Brandts CH, Ndjave M, Graninger W, Kremsner PG. Effect of paracetamol on parasite clearance time in Plasmodium falciparum malaria. Lancet. 1997;350:704-709. https://doi.org/10.1016/S0140-6736(97)02255-1.
18. Mikaeloff Y, Kezouh A, Suissa S. Nonsteroidal anti-inflammatory drug use and the risk of severe skin and soft tissue complications in patients with varicella or zoster disease. Br J Clin Pharmacol. 2007;65:2:203-209. https://doi.org/10.1016/S0140-6736(97)02255-1.
19. Day M. COVID-19: ibuprofen should not be used for managing symptoms, say doctors and scientists. BMJ. 2020;368:m1086. https://doi.org/10.1136/bmj.m1086.
CLINICAL SCENARIO
The hospitalist admitted a 56-year-old man with hypertension and hyperlipidemia to the general medical unit for community-acquired pneumonia and started him on appropriate antimicrobial therapy. On the evening of admission, the nurse woke the patient to take his vital signs and noted a fever of 39.1°C (102.4°F). The patient had a pulse of 90 beats per minute, normal blood pressure, and a stable supplemental oxygen requirement via nasal cannula. The nurse noted an oral acetaminophen “as needed” order for fever. She woke the patient again to administer acetaminophen and notified the hospitalist.
BACKGROUND
Hospitalists frequently encounter febrile patients. According to one large hospital survey, fever occurs in 25% of pediatric and 31% of adult medical patients.1 Fever in hospitalized patients most commonly results from infection, but autoimmune disease, malignancy, and an array of other inflammatory conditions cause fevers as well.1
Defined as an elevated body temperature resulting from a raised hypothalamic set point2, hospitalists often treat fever with acetaminophen or nonsteroidal anti-inflammatory drugs (NSAIDs). These routinely administered medications act centrally to temporarily lower the hypothalamic set point and relieve fever.2,3 Standard hospital admission order sets commonly include an as-needed antipyretic every 4 to 6 hours for treatment of fever, regardless of the presence of fever-related symptoms.
Fever is differentiated from hyperthermia, where temperature increases because of dysregulated peripheral processes despite a normal hypothalamic set point.2 Examples of hyperthermia include heat stroke, malignant hyperthermia, and neuroleptic malignant syndrome. Notably, antipyretic medications have no effect on hyperthermia, but physical means, such as cooling blankets, can lead to temperature reduction.2
WHY YOU MIGHT THINK TREATMENT OF INFECTION-RELATED FEVER IS HELPFUL IN HOSPITALIZED PATIENTS
Hospitalists prescribe antipyretic medication to alleviate fever-related symptoms, including headache, chills and sweats, and joint and muscle aches.3 While researchers have sparingly studied this practice, available evidence and experience suggest that fever-related symptoms decline in parallel with defervescence after administration of acetaminophen or NSAIDs in both adult and pediatric populations.4,5 One randomized, controlled, double-blind study of nearly 400 adult outpatients in Germany with febrile upper respiratory tract infections showed that both aspirin and acetaminophen bested the placebo in reducing fever and associated headache, achiness, and discomfort over a span of 6 hours.4 In another study, this time with pediatric patients hospitalized with fever and uncomplicated respiratory tract infections, patients who received acetaminophen had statistically significant improvements in activity, alertness, mood, comfort, appetite, and fluid intake 6 hours after receiving that therapy.5
Physicians, nurses, and caregivers also commonly believe that fever is inherently noxious and that treatment of infection-related fever contributes to fighting the infection itself.2,3,6 The pediatric literature describes parents, caretakers, and clinicians who suffer from “fever phobia,” the worry that fevers contribute to long-term neurologic complications, recurrent febrile seizures, and death.6,7
Finally, healthcare providers administer antipyretic medication to mitigate the demand fever places on the cardiovascular and pulmonary systems.3 An elevated temperature increases the body’s metabolic rate, oxygen consumption, and cardiac output that critically ill patients who have acute and/or chronic compromise to those systems may not tolerate. For example, patients requiring pressor support for hemodynamic shock or mechanical ventilation for respiratory failure may not tolerate an elevated temperature.8
WHY THERE IS NO REASON TO TREAT INFECTION-RELATED FEVER IN ASYMPTOMATIC HOSPITALIZED PATIENTS
Fever serves as an adaptive host response to infection, boosting innate and adaptive immunity in a multitude of ways.8 In animal models, fever slows the replication of pathogenic bacteria and enhances the activity of antibiotic agents.8 In vitro studies demonstrate that fever increases mobility of leukocytes, phagocytic activity, and proliferation of T cells.8 Retrospective case-control studies of patients hospitalized with severe bacterial illnesses, including gram-negative bacteremia, spontaneous bacterial peritonitis, and community-acquired pneumonia, found that patients with a documented febrile response had increased survival compared with those who remained afebrile during the infection.9 In addition, a large retrospective cohort study of septic ICU patients found a progressive decline in mortality in association with increasing peak temperature on the day of ICU admission.10
In addition to the above studies supporting the important role of fever in fighting infection, recent evidence definitively demonstrates no mortality or morbidity benefit of using antipyretic medications in infected patients. A 2017 meta-analysis that included eight observational and eight randomized studies, totaling 18,939 adult septic ICU patients, demonstrated no difference in hospital and 28-day mortality in patients treated with antipyretics vs those who were not.11 The authors again found no mortality benefit with antipyretic use when separately analyzing data from only the randomized controlled trials (1,507 patients) or when stratifying patients based on the type of antipyretic received (acetaminophen, NSAIDs, or physical cooling).11 They reported no differences in predefined secondary outcomes of shock reversal or nosocomial infections. The authors commented that these robust results likely would not change even with more data from additional trials. In children, a recent meta-analysis of three randomized controlled trials (540 patients) did not find the use of acetaminophen, ibuprofen, or diclofenac effective in preventing febrile seizures.12Pediatric practice guidelines consistently recommend using antipyretic medication to alleviate discomfort caused by fever and not solely to reduce temperature.13,14
Antipyretic agents interfere with the effectiveness of the body’s immune response, as demonstrated in a number of infectious diseases.2,15-18 Two randomized controlled studies conducted in healthy adult volunteers challenged with rhinovirus reported increased viral shedding and decreased antibody response in those subjects who received aspirin or acetaminophen, compared with those given placebo.15,16 In another randomized controlled trial conducted in African children with malaria, paracetamol use delayed parasite clearance by 16 hours.17 A large case-control study correlated the use of NSAIDs with an increased risk of severe skin and soft-tissue complications in children with varicella and in adults with varicella zoster. 18 The international scientific community has raised concerns about worse outcomes with NSAID use in patients with COVID-19, the disease caused by severe acute respiratory syndrome coronavirus 2 (SARS-CoV-2); NSAIDs should be avoided in stable patients with COVID-19 until more data are available. 19
Additional risks and potential harms accompany antipyretic fever therapy. First, NSAIDs or acetaminophen may adversely affect patients with renal or hepatic insufficiency.2,3 Second, masking fevers may impair the clinician’s ability to diagnose or evaluate response to treatment. Third, unnecessarily waking a sleeping patient to check temperature or administer unneeded antipyretics can contribute to hospital-associated problems, including delirium, insomnia, and falls. Treating these iatrogenic problems in turn may require additional medications or interventions. These unintended consequences may potentially prolong hospital stays, increase medication errors and polypharmacy, and detract from a patient’s overall healing and recovery.
While the use of antipyretic medications improves fever-related symptoms, it comes at the cost of blunting a protective host response and exposes patients to medication risks without providing a clinical benefit. In sleeping, asymptomatic, or minimally symptomatic hospitalized patients, the risks of administering antipyretic medications clearly outweigh the benefits.
WHEN TREATING FEVER IS INDICATED
Treatment with antipyretic medication can alleviate fever-related symptoms in those patients who have significant headache, body aches, chills, or sweats and in pediatric patients with notable malaise, irritability, or poor oral intake. Debate continues on the use of antipyretics in the ICU setting when managing critically ill patients with severe cardiopulmonary compromise who may not tolerate the additional hemodynamic strain a fever produces (eg, patients with shock requiring vasopressor support or respiratory failure requiring mechanical ventilation). Remember, decrease body temperature in hyperthermia syndromes by physical means.
WHAT WE SHOULD DO INSTEAD
Withhold antipyretic medication (ie, allow permissive fever) in well-appearing general medical patients with asymptomatic infection-related fevers. In patients who tolerate fever with minimal or no symptoms, potential benefits of permissive fever include decreased time to infection resolution and/or decreased risk of hospital-acquired infections. This may result in shorter hospital stays and significant cost savings. If we do not treat patients with asymptomatic fevers, then it follows that we should not check overnight temperatures in hospitalized patients sleeping comfortably.
RECOMMENDATIONS
- Do not order as-needed antipyretic medication for stable patients on general medical units with infection solely to reduce temperature or achieve normothermia.
- Only treat infected febrile patients with antipyretic medications for fever-related symptoms (headache, chills, or body aches or, in pediatric patients, irritability, malaise, or poor oral intake).
- Treat pathologically elevated temperatures (ie, hyperthermia syndromes) with physical measures because antipyretic medications will be ineffective.
CONCLUSIONS
In the clinical scenario, the hospitalist admitted the patient in stable condition for treatment of a community-acquired pneumonia. He mounted a febrile response to infection, which suggests that his active immune system may aid in recovery. The nurse noted the fever while the patient slept comfortably without fever-related symptoms.
After discussing these facts with the patient’s concerned nurse, the clinician should discontinue the order for as-needed acetaminophen for fever and instead recommend permissive fever without administration of antipyretic medication. This may facilitate recovery, avoid unnecessary polypharmacy, and allow the medical care team to follow his fever curve to ensure that the infection is adequately treated. If the patient develops bothersome fever-related symptoms, the hospitalist can reasonably treat with a single-dose of acetaminophen or NSAID.
Do you think this is a low-value practice? Is this truly a “Thing We Do for No Reason™”? Share what you do in your practice and join in the conversation online by retweeting it on Twitter (#TWDFNR) and liking it on Facebook. We invite you to propose ideas for other “Things We Do for No Reason” topics by emailing [email protected].
CLINICAL SCENARIO
The hospitalist admitted a 56-year-old man with hypertension and hyperlipidemia to the general medical unit for community-acquired pneumonia and started him on appropriate antimicrobial therapy. On the evening of admission, the nurse woke the patient to take his vital signs and noted a fever of 39.1°C (102.4°F). The patient had a pulse of 90 beats per minute, normal blood pressure, and a stable supplemental oxygen requirement via nasal cannula. The nurse noted an oral acetaminophen “as needed” order for fever. She woke the patient again to administer acetaminophen and notified the hospitalist.
BACKGROUND
Hospitalists frequently encounter febrile patients. According to one large hospital survey, fever occurs in 25% of pediatric and 31% of adult medical patients.1 Fever in hospitalized patients most commonly results from infection, but autoimmune disease, malignancy, and an array of other inflammatory conditions cause fevers as well.1
Defined as an elevated body temperature resulting from a raised hypothalamic set point2, hospitalists often treat fever with acetaminophen or nonsteroidal anti-inflammatory drugs (NSAIDs). These routinely administered medications act centrally to temporarily lower the hypothalamic set point and relieve fever.2,3 Standard hospital admission order sets commonly include an as-needed antipyretic every 4 to 6 hours for treatment of fever, regardless of the presence of fever-related symptoms.
Fever is differentiated from hyperthermia, where temperature increases because of dysregulated peripheral processes despite a normal hypothalamic set point.2 Examples of hyperthermia include heat stroke, malignant hyperthermia, and neuroleptic malignant syndrome. Notably, antipyretic medications have no effect on hyperthermia, but physical means, such as cooling blankets, can lead to temperature reduction.2
WHY YOU MIGHT THINK TREATMENT OF INFECTION-RELATED FEVER IS HELPFUL IN HOSPITALIZED PATIENTS
Hospitalists prescribe antipyretic medication to alleviate fever-related symptoms, including headache, chills and sweats, and joint and muscle aches.3 While researchers have sparingly studied this practice, available evidence and experience suggest that fever-related symptoms decline in parallel with defervescence after administration of acetaminophen or NSAIDs in both adult and pediatric populations.4,5 One randomized, controlled, double-blind study of nearly 400 adult outpatients in Germany with febrile upper respiratory tract infections showed that both aspirin and acetaminophen bested the placebo in reducing fever and associated headache, achiness, and discomfort over a span of 6 hours.4 In another study, this time with pediatric patients hospitalized with fever and uncomplicated respiratory tract infections, patients who received acetaminophen had statistically significant improvements in activity, alertness, mood, comfort, appetite, and fluid intake 6 hours after receiving that therapy.5
Physicians, nurses, and caregivers also commonly believe that fever is inherently noxious and that treatment of infection-related fever contributes to fighting the infection itself.2,3,6 The pediatric literature describes parents, caretakers, and clinicians who suffer from “fever phobia,” the worry that fevers contribute to long-term neurologic complications, recurrent febrile seizures, and death.6,7
Finally, healthcare providers administer antipyretic medication to mitigate the demand fever places on the cardiovascular and pulmonary systems.3 An elevated temperature increases the body’s metabolic rate, oxygen consumption, and cardiac output that critically ill patients who have acute and/or chronic compromise to those systems may not tolerate. For example, patients requiring pressor support for hemodynamic shock or mechanical ventilation for respiratory failure may not tolerate an elevated temperature.8
WHY THERE IS NO REASON TO TREAT INFECTION-RELATED FEVER IN ASYMPTOMATIC HOSPITALIZED PATIENTS
Fever serves as an adaptive host response to infection, boosting innate and adaptive immunity in a multitude of ways.8 In animal models, fever slows the replication of pathogenic bacteria and enhances the activity of antibiotic agents.8 In vitro studies demonstrate that fever increases mobility of leukocytes, phagocytic activity, and proliferation of T cells.8 Retrospective case-control studies of patients hospitalized with severe bacterial illnesses, including gram-negative bacteremia, spontaneous bacterial peritonitis, and community-acquired pneumonia, found that patients with a documented febrile response had increased survival compared with those who remained afebrile during the infection.9 In addition, a large retrospective cohort study of septic ICU patients found a progressive decline in mortality in association with increasing peak temperature on the day of ICU admission.10
In addition to the above studies supporting the important role of fever in fighting infection, recent evidence definitively demonstrates no mortality or morbidity benefit of using antipyretic medications in infected patients. A 2017 meta-analysis that included eight observational and eight randomized studies, totaling 18,939 adult septic ICU patients, demonstrated no difference in hospital and 28-day mortality in patients treated with antipyretics vs those who were not.11 The authors again found no mortality benefit with antipyretic use when separately analyzing data from only the randomized controlled trials (1,507 patients) or when stratifying patients based on the type of antipyretic received (acetaminophen, NSAIDs, or physical cooling).11 They reported no differences in predefined secondary outcomes of shock reversal or nosocomial infections. The authors commented that these robust results likely would not change even with more data from additional trials. In children, a recent meta-analysis of three randomized controlled trials (540 patients) did not find the use of acetaminophen, ibuprofen, or diclofenac effective in preventing febrile seizures.12Pediatric practice guidelines consistently recommend using antipyretic medication to alleviate discomfort caused by fever and not solely to reduce temperature.13,14
Antipyretic agents interfere with the effectiveness of the body’s immune response, as demonstrated in a number of infectious diseases.2,15-18 Two randomized controlled studies conducted in healthy adult volunteers challenged with rhinovirus reported increased viral shedding and decreased antibody response in those subjects who received aspirin or acetaminophen, compared with those given placebo.15,16 In another randomized controlled trial conducted in African children with malaria, paracetamol use delayed parasite clearance by 16 hours.17 A large case-control study correlated the use of NSAIDs with an increased risk of severe skin and soft-tissue complications in children with varicella and in adults with varicella zoster. 18 The international scientific community has raised concerns about worse outcomes with NSAID use in patients with COVID-19, the disease caused by severe acute respiratory syndrome coronavirus 2 (SARS-CoV-2); NSAIDs should be avoided in stable patients with COVID-19 until more data are available. 19
Additional risks and potential harms accompany antipyretic fever therapy. First, NSAIDs or acetaminophen may adversely affect patients with renal or hepatic insufficiency.2,3 Second, masking fevers may impair the clinician’s ability to diagnose or evaluate response to treatment. Third, unnecessarily waking a sleeping patient to check temperature or administer unneeded antipyretics can contribute to hospital-associated problems, including delirium, insomnia, and falls. Treating these iatrogenic problems in turn may require additional medications or interventions. These unintended consequences may potentially prolong hospital stays, increase medication errors and polypharmacy, and detract from a patient’s overall healing and recovery.
While the use of antipyretic medications improves fever-related symptoms, it comes at the cost of blunting a protective host response and exposes patients to medication risks without providing a clinical benefit. In sleeping, asymptomatic, or minimally symptomatic hospitalized patients, the risks of administering antipyretic medications clearly outweigh the benefits.
WHEN TREATING FEVER IS INDICATED
Treatment with antipyretic medication can alleviate fever-related symptoms in those patients who have significant headache, body aches, chills, or sweats and in pediatric patients with notable malaise, irritability, or poor oral intake. Debate continues on the use of antipyretics in the ICU setting when managing critically ill patients with severe cardiopulmonary compromise who may not tolerate the additional hemodynamic strain a fever produces (eg, patients with shock requiring vasopressor support or respiratory failure requiring mechanical ventilation). Remember, decrease body temperature in hyperthermia syndromes by physical means.
WHAT WE SHOULD DO INSTEAD
Withhold antipyretic medication (ie, allow permissive fever) in well-appearing general medical patients with asymptomatic infection-related fevers. In patients who tolerate fever with minimal or no symptoms, potential benefits of permissive fever include decreased time to infection resolution and/or decreased risk of hospital-acquired infections. This may result in shorter hospital stays and significant cost savings. If we do not treat patients with asymptomatic fevers, then it follows that we should not check overnight temperatures in hospitalized patients sleeping comfortably.
RECOMMENDATIONS
- Do not order as-needed antipyretic medication for stable patients on general medical units with infection solely to reduce temperature or achieve normothermia.
- Only treat infected febrile patients with antipyretic medications for fever-related symptoms (headache, chills, or body aches or, in pediatric patients, irritability, malaise, or poor oral intake).
- Treat pathologically elevated temperatures (ie, hyperthermia syndromes) with physical measures because antipyretic medications will be ineffective.
CONCLUSIONS
In the clinical scenario, the hospitalist admitted the patient in stable condition for treatment of a community-acquired pneumonia. He mounted a febrile response to infection, which suggests that his active immune system may aid in recovery. The nurse noted the fever while the patient slept comfortably without fever-related symptoms.
After discussing these facts with the patient’s concerned nurse, the clinician should discontinue the order for as-needed acetaminophen for fever and instead recommend permissive fever without administration of antipyretic medication. This may facilitate recovery, avoid unnecessary polypharmacy, and allow the medical care team to follow his fever curve to ensure that the infection is adequately treated. If the patient develops bothersome fever-related symptoms, the hospitalist can reasonably treat with a single-dose of acetaminophen or NSAID.
Do you think this is a low-value practice? Is this truly a “Thing We Do for No Reason™”? Share what you do in your practice and join in the conversation online by retweeting it on Twitter (#TWDFNR) and liking it on Facebook. We invite you to propose ideas for other “Things We Do for No Reason” topics by emailing [email protected].
1. McGowan JE Jr, Rose RC, Jacobs NF, Schaberg DR, Haley RW. Fever in hospitalized patients, with special reference to the medical service. Am J Med. 1987;82(3):580-586. https://doi.org/10.1016/0002-9343(87)90103-3.
2. Plaisance K, Mackowiak P. Antipyretic therapy. Arch Intern Med. 2000;160:449-456. https://doi.org/10.1001/archinte.160.4.449.
3. Greisman LA, Mackowiak PA. Fever: beneficial and detrimental effects of antipyretics. Curr Opin Infect Dis. 2002;15:241-245. https://doi.org/10.1097/00001432-200206000-00005.
4. Bachert C, Chuchalin AG, Eisebitt R, Netayzhenko VZ, Voelker M. Aspirin compared with acetaminophen in the treatment of fever and other symptoms of upper respiratory tract infection in adults: a multicenter, randomized, double-blind, double-dummy, placebo-controlled, parallel-group, single-dose, 6-hour dose-ranging study. Clin Ther. 2005;27(7):993-1003. https://doi.org/10.1016/j.clinthera.2005.06.002.
5. Gupta H, Shah D, Gupta P, Sharma KK. Role of paracetamol in treatment of childhood fever: a double-blind randomized placebo controlled trial. Indian Pediatr. 2007;44:903-911.
6. Schmitt BD. Fever phobia: misconceptions of parents about fevers. Am J Dis Child. 1980;134(2):176-181.
7. Karwowska A, Nijssen-Jordan C, Johnson D, Davies HD. Parental and health care provider understanding of childhood fever: a Canadian perspective. CJEM. 2002;4(6):394-400. https://doi.org/10.1017/s1481803500007892.
8. Kiekkas P, Aretha D, Bakalis N, Karpouhtsi I, Marneras C, Baltopoulos GI. Fever effects and treatment in critical care: literature review. Aust Crit Care. 2013;26:130-135. https://doi.org/10.1016/j.aucc.2012.10.004.
9. Hasday JD, Fairchild KD, Shanholtz C. The role of fever in the infected host. Microbes Infect. 2000;2(15):1891-1894. https://doi.org/10.1016/s1286-4579(00)01337-x.
10. Young PJ, Saxena M, Beasley R, et al. Early peak temperature and mortality in critically ill patients with or without infection. Intensive Care Med. 2012;38:437-444. https://doi.org/10.1007/s00134-012-2478-3.
11. Drewry A, Ablordeppey E, Murray E, et al. Antipyretic therapy in critically ill septic patients: a systematic review and meta-analysis. Crit Care Med. 2017;45(5):806-813. https://doi.org/10.1097/CCM.0000000000002285.
12. Rosenbloom E, Finkelstein Y, Adams-Webber T, Kozer E. Do antipyretics prevent the recurrence of febrile seizures in children? a systematic review of randomized controlled trials and meta-analysis. Eur J Paediatr Neuro. 2013;17:585-588. https://doi.org/10.1016/j.ejpn.2013.04.008.
13. Chiappini J, Venturini E, Remaschi G. 2016 Update of the Italian Pediatric Society Guidelines for management of fever in children. J Pediatr. 2017;180:177-183. https://doi.org/10.1016/j.jpeds.2016.09.043.
14. Fields E, Chard J, Murphy MS, Richardson M, Guideline Development Group and Technical Team. Assessment and initial management of feverish illness in children younger than five years: summary of updated NICE guidance. BMJ. 2013;346:f2866. https://doi.org/10.1136/bmj.f2866.
15. Stanley ED, Jackson GG, Panusarn C, Rubenis M, Dirda V. Increased viral shedding with aspirin treatment of rhinovirus infection. JAMA. 1975;231:1248-1251. https://doi.org/10.1001/jama.1975.03240240018017.
16. Graham NM, Burrell CJ, Douglas RM, Debelle P, Davies L. Adverse effects of aspirin, acetaminophen, and ibuprofen on immune function, viral shedding, and clinical status in rhinovirus-infected volunteers. J Infect Dis. 1990;162:1277-1282. https://doi.org/10.1093/infdis/162.6.1277.
17. Brandts CH, Ndjave M, Graninger W, Kremsner PG. Effect of paracetamol on parasite clearance time in Plasmodium falciparum malaria. Lancet. 1997;350:704-709. https://doi.org/10.1016/S0140-6736(97)02255-1.
18. Mikaeloff Y, Kezouh A, Suissa S. Nonsteroidal anti-inflammatory drug use and the risk of severe skin and soft tissue complications in patients with varicella or zoster disease. Br J Clin Pharmacol. 2007;65:2:203-209. https://doi.org/10.1016/S0140-6736(97)02255-1.
19. Day M. COVID-19: ibuprofen should not be used for managing symptoms, say doctors and scientists. BMJ. 2020;368:m1086. https://doi.org/10.1136/bmj.m1086.
1. McGowan JE Jr, Rose RC, Jacobs NF, Schaberg DR, Haley RW. Fever in hospitalized patients, with special reference to the medical service. Am J Med. 1987;82(3):580-586. https://doi.org/10.1016/0002-9343(87)90103-3.
2. Plaisance K, Mackowiak P. Antipyretic therapy. Arch Intern Med. 2000;160:449-456. https://doi.org/10.1001/archinte.160.4.449.
3. Greisman LA, Mackowiak PA. Fever: beneficial and detrimental effects of antipyretics. Curr Opin Infect Dis. 2002;15:241-245. https://doi.org/10.1097/00001432-200206000-00005.
4. Bachert C, Chuchalin AG, Eisebitt R, Netayzhenko VZ, Voelker M. Aspirin compared with acetaminophen in the treatment of fever and other symptoms of upper respiratory tract infection in adults: a multicenter, randomized, double-blind, double-dummy, placebo-controlled, parallel-group, single-dose, 6-hour dose-ranging study. Clin Ther. 2005;27(7):993-1003. https://doi.org/10.1016/j.clinthera.2005.06.002.
5. Gupta H, Shah D, Gupta P, Sharma KK. Role of paracetamol in treatment of childhood fever: a double-blind randomized placebo controlled trial. Indian Pediatr. 2007;44:903-911.
6. Schmitt BD. Fever phobia: misconceptions of parents about fevers. Am J Dis Child. 1980;134(2):176-181.
7. Karwowska A, Nijssen-Jordan C, Johnson D, Davies HD. Parental and health care provider understanding of childhood fever: a Canadian perspective. CJEM. 2002;4(6):394-400. https://doi.org/10.1017/s1481803500007892.
8. Kiekkas P, Aretha D, Bakalis N, Karpouhtsi I, Marneras C, Baltopoulos GI. Fever effects and treatment in critical care: literature review. Aust Crit Care. 2013;26:130-135. https://doi.org/10.1016/j.aucc.2012.10.004.
9. Hasday JD, Fairchild KD, Shanholtz C. The role of fever in the infected host. Microbes Infect. 2000;2(15):1891-1894. https://doi.org/10.1016/s1286-4579(00)01337-x.
10. Young PJ, Saxena M, Beasley R, et al. Early peak temperature and mortality in critically ill patients with or without infection. Intensive Care Med. 2012;38:437-444. https://doi.org/10.1007/s00134-012-2478-3.
11. Drewry A, Ablordeppey E, Murray E, et al. Antipyretic therapy in critically ill septic patients: a systematic review and meta-analysis. Crit Care Med. 2017;45(5):806-813. https://doi.org/10.1097/CCM.0000000000002285.
12. Rosenbloom E, Finkelstein Y, Adams-Webber T, Kozer E. Do antipyretics prevent the recurrence of febrile seizures in children? a systematic review of randomized controlled trials and meta-analysis. Eur J Paediatr Neuro. 2013;17:585-588. https://doi.org/10.1016/j.ejpn.2013.04.008.
13. Chiappini J, Venturini E, Remaschi G. 2016 Update of the Italian Pediatric Society Guidelines for management of fever in children. J Pediatr. 2017;180:177-183. https://doi.org/10.1016/j.jpeds.2016.09.043.
14. Fields E, Chard J, Murphy MS, Richardson M, Guideline Development Group and Technical Team. Assessment and initial management of feverish illness in children younger than five years: summary of updated NICE guidance. BMJ. 2013;346:f2866. https://doi.org/10.1136/bmj.f2866.
15. Stanley ED, Jackson GG, Panusarn C, Rubenis M, Dirda V. Increased viral shedding with aspirin treatment of rhinovirus infection. JAMA. 1975;231:1248-1251. https://doi.org/10.1001/jama.1975.03240240018017.
16. Graham NM, Burrell CJ, Douglas RM, Debelle P, Davies L. Adverse effects of aspirin, acetaminophen, and ibuprofen on immune function, viral shedding, and clinical status in rhinovirus-infected volunteers. J Infect Dis. 1990;162:1277-1282. https://doi.org/10.1093/infdis/162.6.1277.
17. Brandts CH, Ndjave M, Graninger W, Kremsner PG. Effect of paracetamol on parasite clearance time in Plasmodium falciparum malaria. Lancet. 1997;350:704-709. https://doi.org/10.1016/S0140-6736(97)02255-1.
18. Mikaeloff Y, Kezouh A, Suissa S. Nonsteroidal anti-inflammatory drug use and the risk of severe skin and soft tissue complications in patients with varicella or zoster disease. Br J Clin Pharmacol. 2007;65:2:203-209. https://doi.org/10.1016/S0140-6736(97)02255-1.
19. Day M. COVID-19: ibuprofen should not be used for managing symptoms, say doctors and scientists. BMJ. 2020;368:m1086. https://doi.org/10.1136/bmj.m1086.
© 2020 Society of Hospital Medicine
Improving Hand Hygiene Adherence in Healthcare Workers Before Patient Contact: A Multimodal Intervention in Four Tertiary Care Hospitals in Japan
In the era of multidrug resistant organisms spreading to healthcare facilities, as well as in the community, prevention of healthcare-associated infections (HAIs) has become one of the most important issues in the world. HAIs impact morbidity and mortality of patients, increase healthcare costs,1,2 and are associated with a longer length of stay in the hospital.3,4 In Japan, HAIs are a salient problem; more than 9% of patients admitted to the intensive care unit (ICU) developed an infection during their ICU stay,5 and the numbers of multidrug resistant organism isolates causing HAIs have been increasing annually.6
Hand hygiene is the most important strategy for preventing the spread of MDROs and reducing HAIs.7 Heightened attention to hand hygiene has occurred because of the recent global outbreak of coronavirus disease 2019 (COVID-19), which first appeared in Wuhan, China.8 Because no proven antiviral or vaccine is currently available for the disease, hand hygiene, appropriate cough etiquette, and physical distancing, including school closures, are the only way to prevent spread of the illness.9,10 The virus appears to be highly contagious and spread by droplet or contact routes. The spread of COVID-19 in healthcare facilities has been significant,11 and it could be a source of further spread of the disease in the community.
Unfortunately, hand hygiene adherence remains low in most settings.12 The World Health Organization (WHO) created a strategy to improve hand hygiene adherence,13 which has been implemented in many countries.14 This strategy consists of five key components: (1) system change, (2) training/education, (3) evaluation and feedback, (4) reminders in the workplace, and (5) institutional safety climate.13 Implementing a multimodal intervention including these five elements has increased hand hygiene adherence among healthcare workers (HCWs) and appears to reduce HAIs in different locations.15-17 Improving hand hygiene practice among HCWs is considered one of the most important ways to decrease the incidence of HAIs.15,18,19
There are two types of practice for hand hygiene: either hand washing with soap and water or using alcohol-based hand rub (AHR). The former requires water, soap, a sink, and paper towels, whereas the latter requires only hand rub, which is easy to use and requires one-third the length of time as the former.20 Therefore, AHR is strongly recommended, especially in acute and intensive care settings in hospitals, which require urgent care of patients. Importantly, previous studies demonstrated that greater use of AHR resulted in significant reductions in HAIs.7,14
In Japan, the data related to hand hygiene adherence is limited. Previous studies at four hospitals in different regions of Japan demonstrated that hand hygiene rates were suboptimal21 and lower than reported adherence rates from other international studies.14 One study at three hospitals showed rates could be improved by a multimodal intervention tailored by each institution.22 A 5-year follow-up study demonstrated the sustainability of the multimodal intervention23; however, hand hygiene adherence rates remained low at approximately 32%.
We hypothesized that perhaps focusing attention on just one single region (or prefecture) could boost hand hygiene rates. Niigata prefecture is located 200 miles north of Tokyo and is the largest prefecture facing the Japan Sea. There are five major tertiary hospitals in Niigata, and they communicate frequently and discuss infection control issues as a group. To investigate hand hygiene adherence before touching patients, and to evaluate the improvement of hand hygiene adherence induced by a multimodal intervention, we performed a pre- and postintervention study among HCWs at four of these tertiary care hospitals in Niigata.
METHODS
Participating hospitals
Four tertiary care hospitals in Niigata, Japan, volunteered to participate in the study. The characteristics of the four participating hospitals are summarized in Table 1. All hospitals are public or community based. Hospital A included two units, consisting of a cardiovascular-cerebral ICU and an emergency department (ED), and Hospitals B, C, and D included various units containing surgical or medical wards, an ICU, or an ED. All four hospitals have at least one designated infection-prevention nurse and an infection-prevention department. In addition, there is an infection control network system among the hospitals, and they communicate well to update the information related to local, domestic, or global infectious diseases through regular seminars and by distributing and exchanging electronic communication.
Preintervention
The preintervention infrastructure and existing activities to improve HCW hand hygiene in each hospital are summarized in Table 1. These activities were developed by each individual hospital and had been in place for at least 6 months before the study intervention. All hospitals used AHR and did direct observation for hand washing in designated wards or units and monitoring of AHR consumption; however, Hospital B did not have a wash basin in each room and no use of portable AHR. Preintervention hand hygiene data were collected from June to August 2018.
Intervention
To improve hand hygiene adherence, we initiated a multimodal intervention from September 2018 to February 2019 based on WHO recommendations13 and the findings from prior hand hygiene studies.22 Each facility was provided the same guidance on how to improve hand hygiene adherence and was asked to tailor their intervention to their settings (Table 2 and Appendix Figure). Suggested interventions included feedback regarding hand hygiene adherence observed during the preintervention period, interventions related to AHR, direct observation of and feedback regarding hand hygiene, new posters promoting hand hygiene in the workplace, a 1-month campaign for hand hygiene, seminars for HCWs related to hand hygiene, creation of a handbook for education/training, feedback regarding hand hygiene adherence during the intervention period, and others. The infection control team at each hospital designed the plans and strategies to improve hand hygiene adherence. Postintervention data were collected from February 2019 to March 2019.
Observation of Hand Hygiene Adherence
Hand hygiene adherence before patient contact was evaluated by board-certified infection control nurses. To reduce observation bias, external nurses from other participating hospitals conducted the observations. To minimize intraobserver variation, the same training as the previous study in Japan21 was provided. Hand hygiene observations were usually performed during the day Monday to Friday from 8
Use of either AHR or soap and water before patient contact was defined as appropriate hand hygiene.24,25 Hand hygiene adherence before patient contact for each provider-patient encounter was observed and recorded using a data collection form used in the previous studies.19,26 The following information was obtained: unit name, time of initiation and completion of observations, HCW type (physician or nurse), and the type of hand hygiene (ie, AHR, hand washing with soap and water, or none). The observers kept an appropriate distance from the observed HCWs to avoid interfering with their regular clinical practice. In addition, we informed HCWs in the hospital that their clinical practices were going to be observed; however, they were not informed their hand hygiene adherence was going to be monitored.
Statistical Analysis
Overall hand hygiene adherence rates from the pre- and postintervention periods were compared based on hospitals and HCW subgroups. The Pearson’s chi-square test was used for the comparison of hand hygiene adherence rates between pre- and postintervention periods, and 95% CIs were estimated using binomial distribution. Poisson regression was used to look at changes in hand hygiene adherence with adjustment for HCW type. A two-tailed P value of <.05 was considered statistically significant. The study protocol was reviewed and approved by the ethics committees at all participating hospitals.
RESULTS
Overall Changes
In total, there were 2,018 and 1,630 observations of hand hygiene during the preintervention and postintervention periods, respectively. Most observations were of nurses: 1,643 of the 2,018 preintervention observations (81.4%) and 1,245 of the 1,630 postintervention observations (76.4%).
Findings from the HCW observations are summarized in Figure A. The overall postintervention hand hygiene adherence rate (548 of 1,630 observations; 33.6%; 95% CI, 31.3%-35.9%) was significantly higher than the preintervention rate (453 of 2,018 observations; 22.4%; 95% CI, 20.6%-24.3%; P < .001). This finding persisted after adjustment for the type of HCW (nurse vs physician), with proper hand hygiene adherence occurring 1.55 times more often after the intervention than before (95% CI, 1.37-1.76; P < .001). The overall improvement in hand hygiene adherence rates in the postintervention period was seen in all four hospitals (Figure B). However, the hand hygiene adherence rates of nurses in Hospitals C and D were lower than those in Hospitals A and B both before and after the intervention.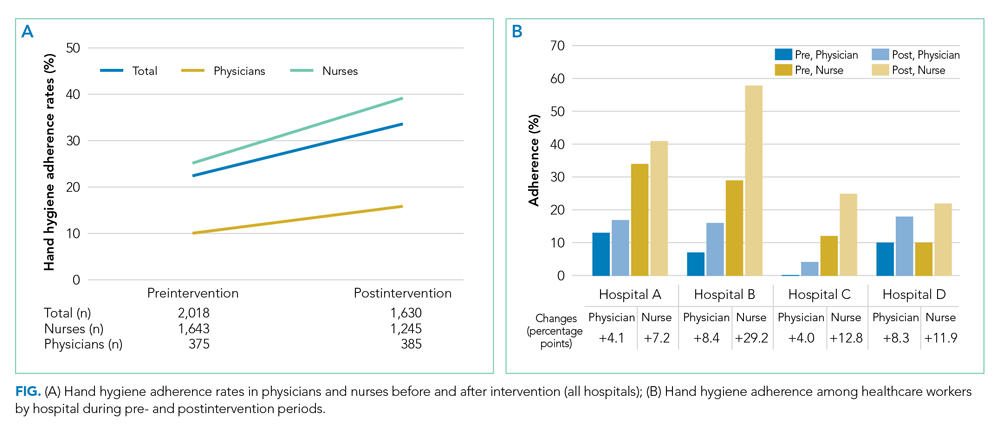
Use of AHR was the dominant appropriate hand hygiene practice vs hand washing with soap and water. Of those that practiced appropriate hand hygiene, the rate of AHR use was high and unchanged between preintervention (424 of 453; 93.6%) and postintervention periods (513 of 548; 93.6%; P = .99).
Changes by HCW Type
The rates of hand hygiene adherence in both physicians and nurses were higher in the postintervention period than in the preintervention period. However, the improvement of hand hygiene adherence among nurses—from 415 of 1,643 (25.2%) to 487 of 1,245 (39.1%) for an increase of 13.9 percentage points (95% CI,10.4-17.3)—was greater than that in physicians—from 38 of 375 (10.1%) to 61 of 385 (15.8%) for an increase of 5.7 percentage points (95% CI, 1.0-8.1; P < .001; Figure B). In general, nurse hand hygiene adherence was higher than that in physicians both in the preintervention period, with nurses at 25.2% (95% CI, 23.2%-27.4%) vs physicians at 10.1% (95% CI, 7.1%-13.2%; P < .001), and in the postintervention period, with nurses at 39.1% (95% CI, 36.4%-41.8%) vs physicians at 15.8% (95% CI, 12.2%-19.5%; P < .001).
Changes by Hospital
Overall, improvement of hand hygiene adherence was observed in all hospitals. However, the improvement rates differed in each hospital: They were 6.5 percentage points in Hospital A, 11.3 percentage points in Hospital C, 11.4 percentage points in Hospital D, and 18.4 percentage points in Hospital B. Hospital B achieved the highest postintervention adherence rates (42.6%), along with the highest improvement. The improvements of hand hygiene adherence in physicians were higher in Hospitals B (8.4 percentage points) and D (8.3 percentage points) than they were in Hospitals A (4.1 percentage points) and C (4.0 percentage points).
Interventions performed at each hospital to improve hand hygiene adherence are summarized in Table 2 and the Appendix Figure. All hospitals performed feedback of hand hygiene adherence after the preintervention period. Interventions related to AHR were frequently initiated; self-carry AHR was provided in two hospitals (Hospitals C and D), and location of AHR was moved (Hospitals B and D). In addition, new AHR products that caused less skin irritation were introduced in Hospital B. Direct observation by hospital staff (separate from our study observers) was also done as part of Hospital A and D’s improvement efforts. Other interventions included a 1-month campaign for hand hygiene including a contest for senryu (humorous 17-syllable poems; Table 2; Appendix Table), posters, seminars, and creation of a handbook related to hand hygiene. Posters emphasizing the importance of hand hygiene created by the local hospital infection control teams were put on the wall in several locations near wash basins. Seminars (1-hour lectures to emphasize the importance of hand hygiene) were provided to nurses. A 10-page hand hygiene handbook was created by one local infection control team and provided to nurses.
DISCUSSION
Our study demonstrated that the overall rate of hand hygiene adherence improved from 22.4% to 33.6% after multimodal intervention; however, the adherence rates even after intervention were suboptimal. The results were comparable with those of a previous study in Japan,22 which underscores how suboptimal HCW hand hygiene in Japan threatens patient safety. Hand hygiene among HCWs is one of the most important methods to prevent HAIs and to reduce spread of multidrug resistant organisms. High adherence has proven challenging because it requires behavior modification. We implemented WHO hand hygiene adherence strategies27 and evaluated the efficacy of a multimodal intervention in hopes of finding the specific factors that could be related to behavior modification for HCWs.
We observed several important relationships between the intervention components and their improvement in hand hygiene adherence. Among the four participating hospitals, Hospital B was the most successful with improvement of hand hygiene adherence from 24.2% to 42.6%. One unique intervention for Hospital B was the introduction of new AHR products for the people who had felt uncomfortable with current products. Frequent hand washing or the use of certain AHR products could irritate skin causing dry or rough hands, which could reduce hand hygiene practices. In Japan, there are several AHR products available. Among them, a few products contain skin moisturizing elements; these products are 10%-20% higher in cost than nonmoisturizing products. The HCWs in our study stated that the new products were more comfortable to use, and they requested to introduce them as daily use products. Thus, use of a product containing a hand moisturizer may reduce some factors negatively affecting hand hygiene practice and improve adherence rates.
Although this study was unable to determine which components are definitively associated with improving hand hygiene adherence, the findings suggest initiation of multiple intervention components simultaneously may provide more motivation for change than initiating only one or two components at a time. It is also possible that certain intervention components were more beneficial than others. Consistent with a previous study, improving hand hygiene adherence cannot be simply achieved by improving infrastructure (eg, introducing portable AHR) alone, but rather depends on altering the behavior of physicians and nurses.
This study was performed at four tertiary care hospitals in Niigata that are affiliated with Niigata University. They are located closely in the region, within 100 km, have quarterly conferences, and use a mutual monitoring system related to infection prevention. The members of infection control communicate regularly, which we thought would optimize improvements in hand hygiene adherence, compared with the circumstances of previous studies. In this setting, HCWs have similar education and share knowledge related to infection control, and the effects of interventions in each hospital were equally evaluated if similar interventions were implemented. In the current study, the interventions at each hospital were similar, and there was limited variety; therefore, specific, novel interventions that could affect hand hygiene adherence significantly were difficult to find.
There are a few possible reasons why hand hygiene adherence rates were low in the current study. First, part of this study was conducted during the summer so that the consciousness and caution for hand hygiene might be lower, compared with that in winter. In general, HCWs become more cautious for hand hygiene practice when they take care of patients diagnosed with influenza or respiratory syncytial virus infection. Second, the infrastructure for hand hygiene practice in the hospitals in Japan is inadequate and not well designed. Because of safety reasons, a single dispenser of AHR is placed at the entrance of each room in general and not at each bedside. The number of private rooms is limited, and most of the rooms in wards have multiple beds per room, with no access to AHR within the room. In fact, the interventions at all four hospitals included a change in the location and/or access of AHR. Easier access to AHR is likely a key step to improving hand hygiene adherence rates. Finally, there was not an active intervention to include hospital or unit leaders. This is important given the involvement of leaders in hand hygiene practice significantly changed the hand adherence rates in a previous study.19
Given the suboptimal hand hygiene adherence rates in Japan noted in this and previous Japanese studies,21,22 the spread of COVID-19 within the hospital setting is a concern. Transmission of COVID-19 by asymptomatic carriers has been suggested,11 which emphasizes the importance of regular standard precautions with good hand hygiene practice to prevent further transmission.
Although the hand hygiene rate was suboptimal, we were able to achieve a few sustainable, structural modifications in the clinical environment after the intervention. These include adding AHR in new locations, changing the location of existing AHR to more appropriate locations, and introducing new products. These will remain in the clinical environment and will contribute to hand hygiene adherence in the future.
This study has several limitations. First, the presence of external observers in their clinical settings might have affected the behavior of HCWs.28 Although they were not informed that their hand hygiene adherence was going to be monitored, the existence of an external observer in their clinical setting might have changed normal behavior. Second, the infrastructure and interventions for hand hygiene adherence before the intervention were different in each hospital, so there is a possibility that hospitals with less infrastructure for hand hygiene adherence had more room for improvement with the interventions. Third, we included observations at different units at each hospital, which might affect the results of the study because of the inclusion of different medical settings and HCWs. Fourth, the number of physician hand hygiene observations was limited: We conducted our observations between 8
In conclusion, a multimodal intervention to improve hand hygiene adherence successfully improved HCWs’ hand hygiene adherence in Niigata, Japan; however, the adherence rates are still relatively low compared with those reported from other countries. Further intervention is required to improve hand hygiene adherence.
1. Zimlichman E, Henderson D, Tamir O, et al. Health care-associated infections: a meta-analysis of costs and financial impact on the US health care system. JAMA Intern Med. 2013;173(22):2039-2046. https://doi.org/10.1001/jamainternmed.2013.9763.
2. Cassini A, Plachouras D, Eckmanns T, et al. Burden of six healthcare-associated infections on European population health: estimating incidence-based disability-adjusted life years through a population prevalence-based modelling study. PLoS Med. 2016;13(10):e1002150. https://doi.org/10.1371/journal.pmed.1002150.
3. Vrijens F, Hulstaert F, Van de Sande S, Devriese S, Morales I, Parmentier Y. Hospital-acquired, laboratory-confirmed bloodstream infections: linking national surveillance data to clinical and financial hospital data to estimate increased length of stay and healthcare costs. J Hosp Infect. 2010;75(3):158-162. https://doi.org/10.1016/j.jhin.2009.12.006.
4. de Lissovoy G, Fraeman K, Hutchins V, Murphy D, Song D, Vaughn BB. Surgical site infection: incidence and impact on hospital utilization and treatment costs. Am J Infect Control. 2009;37(5):387-397. https://doi.org/10.1016/j.ajic.2008.12.010.
5. Suka M, Yoshida K, Takezawa J. Epidemiological approach to nosocomial infection surveillance data: the Japanese Nosocomial Infection Surveillance System. Environ Health Prev Med. 2008;13(1):30-35. https:// doi.org/10.1007/s12199-007-0004-y.
6. Japan Nosocomial Infection Surveillance. JANIS Open Report. 2018. https://janis.mhlw.go.jp/english/report/open_report/2018/3/1/ken_Open_Report_Eng_201800_clsi2012.pdf. Accessed April 2, 2020.
7. Allegranzi B, Pittet D. Role of hand hygiene in healthcare-associated infection prevention. J Hosp Infect. 2009;73(4):305-315. https://doi.org/10.1016/j.jhin.2009.04.019.
8. Zhu N, Zhang D, Wang W, et al. A novel coronavirus from patients with pneumonia in China, 2019. N Engl J Med. 2020;382(8):727-733. https://doi.org/10.1056/NEJMoa2001017.
9. World Health Organization. Coronavirus disease (COVID-19) advice for the public. 2020. https://www.who.int/emergencies/diseases/novel-coronavirus-2019/advice-for-public. Accessed February 28, 2020.
10. Centers for Disease Control and Prevention. Interim Guidance for Preventing the Spread of Coronavirus Disease 2019 (COVID-19) in Homes and Residential Communities. 2020. https://www.cdc.gov/coronavirus/2019-ncov/hcp/guidance-prevent-spread.html. Accessed February 28, 2020.
11. Bai Y, Yao L, Wei T, et al. Presumed asymptomatic carrier transmission of COVID-19. JAMA. 2020;323(14):1406-1407. https://doi.org/10.1001/jama.2020.2565.
12. Burke JP. Infection control - a problem for patient safety. N Engl J Med. 2003;348(7):651-656. https://doi.org/10.1056/NEJMhpr020557.
13. World Health Organization. A Guide to the Implementation of the WHO Multimodal Hand Hygiene Improvement Strategy. 2013. https://www.who.int/gpsc/5may/Guide_to_Implementation.pdf. Accessed February 28, 2020.
14. Allegranzi B, Gayet-Ageron A, Damani N, et al. Global implementation of WHO’s multimodal strategy for improvement of hand hygiene: a quasi-experimental study. Lancet Infect Dis. 2013;13(10):843-851. https://doi.org/10.1016/S1473-3099(13)70163-4.
15. Pittet D, Hugonnet S, Harbarth S, et al. Effectiveness of a hospital-wide programme to improve compliance with hand hygiene. Infection Control Programme. Lancet. 2000;356(9238):1307-1312. https://doi.org/10.1016/s0140-6736(00)02814-2.
16. Rosenthal VD, Pawar M, Leblebicioglu H, et al. Impact of the International Nosocomial Infection Control Consortium (INICC) multidimensional hand hygiene approach over 13 years in 51 cities of 19 limited-resource countries from Latin America, Asia, the Middle East, and Europe. Infect Control Hosp Epidemiol. 2013;34(4):415-423. https://doi.org/10.1086/669860.
17. Pincock T, Bernstein P, Warthman S, Holst E. Bundling hand hygiene interventions and measurement to decrease health care-associated infections. Am J Infect Control. 2012;40(4 Suppl 1):S18-S27. https://doi.org/10.1016/j.ajic.2012.02.008.
18. Larson EL. APIC guideline for handwashing and hand antisepsis in health care settings. Am J Infect Control. 1995;23(4):251-269. https://doi.org/10.1016/0196-6553(95)90070-5.
19. Saint S, Conti A, Bartoloni A, et al. Improving healthcare worker hand hygiene adherence before patient contact: a before-and-after five-unit multimodal intervention in Tuscany. Qual Saf Health Care. 2009;18(6):429-433. https://doi.org/10.1136/qshc.2009.032771.
20. Bolon MK. Hand hygiene: an update. Infect Dis Clin North Am. 2016;30(3):591-607. https://doi.org/10.1016/j.idc.2016.04.007.
21. Sakihama T, Honda H, Saint S, et al. Hand hygiene adherence among health care workers at Japanese hospitals: a multicenter observational study in Japan. J Patient Saf. 2016;12(1):11-17. https://doi.org/10.1097/PTS.0000000000000108.
22. Sakihama T, Honda H, Saint S, et al. Improving healthcare worker hand hygiene adherence before patient contact: a multimodal intervention of hand hygiene practice in three Japanese tertiary care centers. J Hosp Med. 2016;11(3):199-205. https://doi.org/10.1002/jhm.2491.
23. Sakihama T, Kayauchi N, Kamiya T, et al. Assessing sustainability of hand hygiene adherence 5 years after a contest-based intervention in 3 Japanese hospitals. Am J Infect Control. 2020;48(1):77-81. https://doi.org/10.1016/j.ajic.2019.06.017.
24. World Health Organization. My 5 Moments for Hand Hygiene. https://www.who.int/infection-prevention/campaigns/clean-hands/5moments/en/. Accessed April 2, 2020.
25. World Health Organization. WHO Guidelines on Hand Hygiene in Health Care. 2009. https://www.who.int/gpsc/5may/tools/9789241597906/en/. Accessed February 28, 2020.
26. Saint S, Bartoloni A, Virgili G, et al. Marked variability in adherence to hand hygiene: a 5-unit observational study in Tuscany. Am J Infect Control. 2009;37(4):306-310. https://doi.org/10.1016/j.ajic.2008.08.004.
27. World Health Organization. WHO Guidelines on Hand Hygiene in Health Care: First Global Patient Safety Challenge Clean Care Is Safer Care. Geneva: World Health Organization; 2009. https://www.ncbi.nlm.nih.gov/books/NBK144013/pdf/Bookshelf_NBK144013.pdf. Accessed February 28, 2020.
28. Pan SC, Tien KL, Hung IC, et al. Compliance of health care workers with hand hygiene practices: independent advantages of overt and covert observers. PLoS One. 2013;8(1):e53746. https://doi.org/10.1371/journal.pone.0053746.
In the era of multidrug resistant organisms spreading to healthcare facilities, as well as in the community, prevention of healthcare-associated infections (HAIs) has become one of the most important issues in the world. HAIs impact morbidity and mortality of patients, increase healthcare costs,1,2 and are associated with a longer length of stay in the hospital.3,4 In Japan, HAIs are a salient problem; more than 9% of patients admitted to the intensive care unit (ICU) developed an infection during their ICU stay,5 and the numbers of multidrug resistant organism isolates causing HAIs have been increasing annually.6
Hand hygiene is the most important strategy for preventing the spread of MDROs and reducing HAIs.7 Heightened attention to hand hygiene has occurred because of the recent global outbreak of coronavirus disease 2019 (COVID-19), which first appeared in Wuhan, China.8 Because no proven antiviral or vaccine is currently available for the disease, hand hygiene, appropriate cough etiquette, and physical distancing, including school closures, are the only way to prevent spread of the illness.9,10 The virus appears to be highly contagious and spread by droplet or contact routes. The spread of COVID-19 in healthcare facilities has been significant,11 and it could be a source of further spread of the disease in the community.
Unfortunately, hand hygiene adherence remains low in most settings.12 The World Health Organization (WHO) created a strategy to improve hand hygiene adherence,13 which has been implemented in many countries.14 This strategy consists of five key components: (1) system change, (2) training/education, (3) evaluation and feedback, (4) reminders in the workplace, and (5) institutional safety climate.13 Implementing a multimodal intervention including these five elements has increased hand hygiene adherence among healthcare workers (HCWs) and appears to reduce HAIs in different locations.15-17 Improving hand hygiene practice among HCWs is considered one of the most important ways to decrease the incidence of HAIs.15,18,19
There are two types of practice for hand hygiene: either hand washing with soap and water or using alcohol-based hand rub (AHR). The former requires water, soap, a sink, and paper towels, whereas the latter requires only hand rub, which is easy to use and requires one-third the length of time as the former.20 Therefore, AHR is strongly recommended, especially in acute and intensive care settings in hospitals, which require urgent care of patients. Importantly, previous studies demonstrated that greater use of AHR resulted in significant reductions in HAIs.7,14
In Japan, the data related to hand hygiene adherence is limited. Previous studies at four hospitals in different regions of Japan demonstrated that hand hygiene rates were suboptimal21 and lower than reported adherence rates from other international studies.14 One study at three hospitals showed rates could be improved by a multimodal intervention tailored by each institution.22 A 5-year follow-up study demonstrated the sustainability of the multimodal intervention23; however, hand hygiene adherence rates remained low at approximately 32%.
We hypothesized that perhaps focusing attention on just one single region (or prefecture) could boost hand hygiene rates. Niigata prefecture is located 200 miles north of Tokyo and is the largest prefecture facing the Japan Sea. There are five major tertiary hospitals in Niigata, and they communicate frequently and discuss infection control issues as a group. To investigate hand hygiene adherence before touching patients, and to evaluate the improvement of hand hygiene adherence induced by a multimodal intervention, we performed a pre- and postintervention study among HCWs at four of these tertiary care hospitals in Niigata.
METHODS
Participating hospitals
Four tertiary care hospitals in Niigata, Japan, volunteered to participate in the study. The characteristics of the four participating hospitals are summarized in Table 1. All hospitals are public or community based. Hospital A included two units, consisting of a cardiovascular-cerebral ICU and an emergency department (ED), and Hospitals B, C, and D included various units containing surgical or medical wards, an ICU, or an ED. All four hospitals have at least one designated infection-prevention nurse and an infection-prevention department. In addition, there is an infection control network system among the hospitals, and they communicate well to update the information related to local, domestic, or global infectious diseases through regular seminars and by distributing and exchanging electronic communication.
Preintervention
The preintervention infrastructure and existing activities to improve HCW hand hygiene in each hospital are summarized in Table 1. These activities were developed by each individual hospital and had been in place for at least 6 months before the study intervention. All hospitals used AHR and did direct observation for hand washing in designated wards or units and monitoring of AHR consumption; however, Hospital B did not have a wash basin in each room and no use of portable AHR. Preintervention hand hygiene data were collected from June to August 2018.
Intervention
To improve hand hygiene adherence, we initiated a multimodal intervention from September 2018 to February 2019 based on WHO recommendations13 and the findings from prior hand hygiene studies.22 Each facility was provided the same guidance on how to improve hand hygiene adherence and was asked to tailor their intervention to their settings (Table 2 and Appendix Figure). Suggested interventions included feedback regarding hand hygiene adherence observed during the preintervention period, interventions related to AHR, direct observation of and feedback regarding hand hygiene, new posters promoting hand hygiene in the workplace, a 1-month campaign for hand hygiene, seminars for HCWs related to hand hygiene, creation of a handbook for education/training, feedback regarding hand hygiene adherence during the intervention period, and others. The infection control team at each hospital designed the plans and strategies to improve hand hygiene adherence. Postintervention data were collected from February 2019 to March 2019.
Observation of Hand Hygiene Adherence
Hand hygiene adherence before patient contact was evaluated by board-certified infection control nurses. To reduce observation bias, external nurses from other participating hospitals conducted the observations. To minimize intraobserver variation, the same training as the previous study in Japan21 was provided. Hand hygiene observations were usually performed during the day Monday to Friday from 8
Use of either AHR or soap and water before patient contact was defined as appropriate hand hygiene.24,25 Hand hygiene adherence before patient contact for each provider-patient encounter was observed and recorded using a data collection form used in the previous studies.19,26 The following information was obtained: unit name, time of initiation and completion of observations, HCW type (physician or nurse), and the type of hand hygiene (ie, AHR, hand washing with soap and water, or none). The observers kept an appropriate distance from the observed HCWs to avoid interfering with their regular clinical practice. In addition, we informed HCWs in the hospital that their clinical practices were going to be observed; however, they were not informed their hand hygiene adherence was going to be monitored.
Statistical Analysis
Overall hand hygiene adherence rates from the pre- and postintervention periods were compared based on hospitals and HCW subgroups. The Pearson’s chi-square test was used for the comparison of hand hygiene adherence rates between pre- and postintervention periods, and 95% CIs were estimated using binomial distribution. Poisson regression was used to look at changes in hand hygiene adherence with adjustment for HCW type. A two-tailed P value of <.05 was considered statistically significant. The study protocol was reviewed and approved by the ethics committees at all participating hospitals.
RESULTS
Overall Changes
In total, there were 2,018 and 1,630 observations of hand hygiene during the preintervention and postintervention periods, respectively. Most observations were of nurses: 1,643 of the 2,018 preintervention observations (81.4%) and 1,245 of the 1,630 postintervention observations (76.4%).
Findings from the HCW observations are summarized in Figure A. The overall postintervention hand hygiene adherence rate (548 of 1,630 observations; 33.6%; 95% CI, 31.3%-35.9%) was significantly higher than the preintervention rate (453 of 2,018 observations; 22.4%; 95% CI, 20.6%-24.3%; P < .001). This finding persisted after adjustment for the type of HCW (nurse vs physician), with proper hand hygiene adherence occurring 1.55 times more often after the intervention than before (95% CI, 1.37-1.76; P < .001). The overall improvement in hand hygiene adherence rates in the postintervention period was seen in all four hospitals (Figure B). However, the hand hygiene adherence rates of nurses in Hospitals C and D were lower than those in Hospitals A and B both before and after the intervention.
Use of AHR was the dominant appropriate hand hygiene practice vs hand washing with soap and water. Of those that practiced appropriate hand hygiene, the rate of AHR use was high and unchanged between preintervention (424 of 453; 93.6%) and postintervention periods (513 of 548; 93.6%; P = .99).
Changes by HCW Type
The rates of hand hygiene adherence in both physicians and nurses were higher in the postintervention period than in the preintervention period. However, the improvement of hand hygiene adherence among nurses—from 415 of 1,643 (25.2%) to 487 of 1,245 (39.1%) for an increase of 13.9 percentage points (95% CI,10.4-17.3)—was greater than that in physicians—from 38 of 375 (10.1%) to 61 of 385 (15.8%) for an increase of 5.7 percentage points (95% CI, 1.0-8.1; P < .001; Figure B). In general, nurse hand hygiene adherence was higher than that in physicians both in the preintervention period, with nurses at 25.2% (95% CI, 23.2%-27.4%) vs physicians at 10.1% (95% CI, 7.1%-13.2%; P < .001), and in the postintervention period, with nurses at 39.1% (95% CI, 36.4%-41.8%) vs physicians at 15.8% (95% CI, 12.2%-19.5%; P < .001).
Changes by Hospital
Overall, improvement of hand hygiene adherence was observed in all hospitals. However, the improvement rates differed in each hospital: They were 6.5 percentage points in Hospital A, 11.3 percentage points in Hospital C, 11.4 percentage points in Hospital D, and 18.4 percentage points in Hospital B. Hospital B achieved the highest postintervention adherence rates (42.6%), along with the highest improvement. The improvements of hand hygiene adherence in physicians were higher in Hospitals B (8.4 percentage points) and D (8.3 percentage points) than they were in Hospitals A (4.1 percentage points) and C (4.0 percentage points).
Interventions performed at each hospital to improve hand hygiene adherence are summarized in Table 2 and the Appendix Figure. All hospitals performed feedback of hand hygiene adherence after the preintervention period. Interventions related to AHR were frequently initiated; self-carry AHR was provided in two hospitals (Hospitals C and D), and location of AHR was moved (Hospitals B and D). In addition, new AHR products that caused less skin irritation were introduced in Hospital B. Direct observation by hospital staff (separate from our study observers) was also done as part of Hospital A and D’s improvement efforts. Other interventions included a 1-month campaign for hand hygiene including a contest for senryu (humorous 17-syllable poems; Table 2; Appendix Table), posters, seminars, and creation of a handbook related to hand hygiene. Posters emphasizing the importance of hand hygiene created by the local hospital infection control teams were put on the wall in several locations near wash basins. Seminars (1-hour lectures to emphasize the importance of hand hygiene) were provided to nurses. A 10-page hand hygiene handbook was created by one local infection control team and provided to nurses.
DISCUSSION
Our study demonstrated that the overall rate of hand hygiene adherence improved from 22.4% to 33.6% after multimodal intervention; however, the adherence rates even after intervention were suboptimal. The results were comparable with those of a previous study in Japan,22 which underscores how suboptimal HCW hand hygiene in Japan threatens patient safety. Hand hygiene among HCWs is one of the most important methods to prevent HAIs and to reduce spread of multidrug resistant organisms. High adherence has proven challenging because it requires behavior modification. We implemented WHO hand hygiene adherence strategies27 and evaluated the efficacy of a multimodal intervention in hopes of finding the specific factors that could be related to behavior modification for HCWs.
We observed several important relationships between the intervention components and their improvement in hand hygiene adherence. Among the four participating hospitals, Hospital B was the most successful with improvement of hand hygiene adherence from 24.2% to 42.6%. One unique intervention for Hospital B was the introduction of new AHR products for the people who had felt uncomfortable with current products. Frequent hand washing or the use of certain AHR products could irritate skin causing dry or rough hands, which could reduce hand hygiene practices. In Japan, there are several AHR products available. Among them, a few products contain skin moisturizing elements; these products are 10%-20% higher in cost than nonmoisturizing products. The HCWs in our study stated that the new products were more comfortable to use, and they requested to introduce them as daily use products. Thus, use of a product containing a hand moisturizer may reduce some factors negatively affecting hand hygiene practice and improve adherence rates.
Although this study was unable to determine which components are definitively associated with improving hand hygiene adherence, the findings suggest initiation of multiple intervention components simultaneously may provide more motivation for change than initiating only one or two components at a time. It is also possible that certain intervention components were more beneficial than others. Consistent with a previous study, improving hand hygiene adherence cannot be simply achieved by improving infrastructure (eg, introducing portable AHR) alone, but rather depends on altering the behavior of physicians and nurses.
This study was performed at four tertiary care hospitals in Niigata that are affiliated with Niigata University. They are located closely in the region, within 100 km, have quarterly conferences, and use a mutual monitoring system related to infection prevention. The members of infection control communicate regularly, which we thought would optimize improvements in hand hygiene adherence, compared with the circumstances of previous studies. In this setting, HCWs have similar education and share knowledge related to infection control, and the effects of interventions in each hospital were equally evaluated if similar interventions were implemented. In the current study, the interventions at each hospital were similar, and there was limited variety; therefore, specific, novel interventions that could affect hand hygiene adherence significantly were difficult to find.
There are a few possible reasons why hand hygiene adherence rates were low in the current study. First, part of this study was conducted during the summer so that the consciousness and caution for hand hygiene might be lower, compared with that in winter. In general, HCWs become more cautious for hand hygiene practice when they take care of patients diagnosed with influenza or respiratory syncytial virus infection. Second, the infrastructure for hand hygiene practice in the hospitals in Japan is inadequate and not well designed. Because of safety reasons, a single dispenser of AHR is placed at the entrance of each room in general and not at each bedside. The number of private rooms is limited, and most of the rooms in wards have multiple beds per room, with no access to AHR within the room. In fact, the interventions at all four hospitals included a change in the location and/or access of AHR. Easier access to AHR is likely a key step to improving hand hygiene adherence rates. Finally, there was not an active intervention to include hospital or unit leaders. This is important given the involvement of leaders in hand hygiene practice significantly changed the hand adherence rates in a previous study.19
Given the suboptimal hand hygiene adherence rates in Japan noted in this and previous Japanese studies,21,22 the spread of COVID-19 within the hospital setting is a concern. Transmission of COVID-19 by asymptomatic carriers has been suggested,11 which emphasizes the importance of regular standard precautions with good hand hygiene practice to prevent further transmission.
Although the hand hygiene rate was suboptimal, we were able to achieve a few sustainable, structural modifications in the clinical environment after the intervention. These include adding AHR in new locations, changing the location of existing AHR to more appropriate locations, and introducing new products. These will remain in the clinical environment and will contribute to hand hygiene adherence in the future.
This study has several limitations. First, the presence of external observers in their clinical settings might have affected the behavior of HCWs.28 Although they were not informed that their hand hygiene adherence was going to be monitored, the existence of an external observer in their clinical setting might have changed normal behavior. Second, the infrastructure and interventions for hand hygiene adherence before the intervention were different in each hospital, so there is a possibility that hospitals with less infrastructure for hand hygiene adherence had more room for improvement with the interventions. Third, we included observations at different units at each hospital, which might affect the results of the study because of the inclusion of different medical settings and HCWs. Fourth, the number of physician hand hygiene observations was limited: We conducted our observations between 8
In conclusion, a multimodal intervention to improve hand hygiene adherence successfully improved HCWs’ hand hygiene adherence in Niigata, Japan; however, the adherence rates are still relatively low compared with those reported from other countries. Further intervention is required to improve hand hygiene adherence.
In the era of multidrug resistant organisms spreading to healthcare facilities, as well as in the community, prevention of healthcare-associated infections (HAIs) has become one of the most important issues in the world. HAIs impact morbidity and mortality of patients, increase healthcare costs,1,2 and are associated with a longer length of stay in the hospital.3,4 In Japan, HAIs are a salient problem; more than 9% of patients admitted to the intensive care unit (ICU) developed an infection during their ICU stay,5 and the numbers of multidrug resistant organism isolates causing HAIs have been increasing annually.6
Hand hygiene is the most important strategy for preventing the spread of MDROs and reducing HAIs.7 Heightened attention to hand hygiene has occurred because of the recent global outbreak of coronavirus disease 2019 (COVID-19), which first appeared in Wuhan, China.8 Because no proven antiviral or vaccine is currently available for the disease, hand hygiene, appropriate cough etiquette, and physical distancing, including school closures, are the only way to prevent spread of the illness.9,10 The virus appears to be highly contagious and spread by droplet or contact routes. The spread of COVID-19 in healthcare facilities has been significant,11 and it could be a source of further spread of the disease in the community.
Unfortunately, hand hygiene adherence remains low in most settings.12 The World Health Organization (WHO) created a strategy to improve hand hygiene adherence,13 which has been implemented in many countries.14 This strategy consists of five key components: (1) system change, (2) training/education, (3) evaluation and feedback, (4) reminders in the workplace, and (5) institutional safety climate.13 Implementing a multimodal intervention including these five elements has increased hand hygiene adherence among healthcare workers (HCWs) and appears to reduce HAIs in different locations.15-17 Improving hand hygiene practice among HCWs is considered one of the most important ways to decrease the incidence of HAIs.15,18,19
There are two types of practice for hand hygiene: either hand washing with soap and water or using alcohol-based hand rub (AHR). The former requires water, soap, a sink, and paper towels, whereas the latter requires only hand rub, which is easy to use and requires one-third the length of time as the former.20 Therefore, AHR is strongly recommended, especially in acute and intensive care settings in hospitals, which require urgent care of patients. Importantly, previous studies demonstrated that greater use of AHR resulted in significant reductions in HAIs.7,14
In Japan, the data related to hand hygiene adherence is limited. Previous studies at four hospitals in different regions of Japan demonstrated that hand hygiene rates were suboptimal21 and lower than reported adherence rates from other international studies.14 One study at three hospitals showed rates could be improved by a multimodal intervention tailored by each institution.22 A 5-year follow-up study demonstrated the sustainability of the multimodal intervention23; however, hand hygiene adherence rates remained low at approximately 32%.
We hypothesized that perhaps focusing attention on just one single region (or prefecture) could boost hand hygiene rates. Niigata prefecture is located 200 miles north of Tokyo and is the largest prefecture facing the Japan Sea. There are five major tertiary hospitals in Niigata, and they communicate frequently and discuss infection control issues as a group. To investigate hand hygiene adherence before touching patients, and to evaluate the improvement of hand hygiene adherence induced by a multimodal intervention, we performed a pre- and postintervention study among HCWs at four of these tertiary care hospitals in Niigata.
METHODS
Participating hospitals
Four tertiary care hospitals in Niigata, Japan, volunteered to participate in the study. The characteristics of the four participating hospitals are summarized in Table 1. All hospitals are public or community based. Hospital A included two units, consisting of a cardiovascular-cerebral ICU and an emergency department (ED), and Hospitals B, C, and D included various units containing surgical or medical wards, an ICU, or an ED. All four hospitals have at least one designated infection-prevention nurse and an infection-prevention department. In addition, there is an infection control network system among the hospitals, and they communicate well to update the information related to local, domestic, or global infectious diseases through regular seminars and by distributing and exchanging electronic communication.
Preintervention
The preintervention infrastructure and existing activities to improve HCW hand hygiene in each hospital are summarized in Table 1. These activities were developed by each individual hospital and had been in place for at least 6 months before the study intervention. All hospitals used AHR and did direct observation for hand washing in designated wards or units and monitoring of AHR consumption; however, Hospital B did not have a wash basin in each room and no use of portable AHR. Preintervention hand hygiene data were collected from June to August 2018.
Intervention
To improve hand hygiene adherence, we initiated a multimodal intervention from September 2018 to February 2019 based on WHO recommendations13 and the findings from prior hand hygiene studies.22 Each facility was provided the same guidance on how to improve hand hygiene adherence and was asked to tailor their intervention to their settings (Table 2 and Appendix Figure). Suggested interventions included feedback regarding hand hygiene adherence observed during the preintervention period, interventions related to AHR, direct observation of and feedback regarding hand hygiene, new posters promoting hand hygiene in the workplace, a 1-month campaign for hand hygiene, seminars for HCWs related to hand hygiene, creation of a handbook for education/training, feedback regarding hand hygiene adherence during the intervention period, and others. The infection control team at each hospital designed the plans and strategies to improve hand hygiene adherence. Postintervention data were collected from February 2019 to March 2019.
Observation of Hand Hygiene Adherence
Hand hygiene adherence before patient contact was evaluated by board-certified infection control nurses. To reduce observation bias, external nurses from other participating hospitals conducted the observations. To minimize intraobserver variation, the same training as the previous study in Japan21 was provided. Hand hygiene observations were usually performed during the day Monday to Friday from 8
Use of either AHR or soap and water before patient contact was defined as appropriate hand hygiene.24,25 Hand hygiene adherence before patient contact for each provider-patient encounter was observed and recorded using a data collection form used in the previous studies.19,26 The following information was obtained: unit name, time of initiation and completion of observations, HCW type (physician or nurse), and the type of hand hygiene (ie, AHR, hand washing with soap and water, or none). The observers kept an appropriate distance from the observed HCWs to avoid interfering with their regular clinical practice. In addition, we informed HCWs in the hospital that their clinical practices were going to be observed; however, they were not informed their hand hygiene adherence was going to be monitored.
Statistical Analysis
Overall hand hygiene adherence rates from the pre- and postintervention periods were compared based on hospitals and HCW subgroups. The Pearson’s chi-square test was used for the comparison of hand hygiene adherence rates between pre- and postintervention periods, and 95% CIs were estimated using binomial distribution. Poisson regression was used to look at changes in hand hygiene adherence with adjustment for HCW type. A two-tailed P value of <.05 was considered statistically significant. The study protocol was reviewed and approved by the ethics committees at all participating hospitals.
RESULTS
Overall Changes
In total, there were 2,018 and 1,630 observations of hand hygiene during the preintervention and postintervention periods, respectively. Most observations were of nurses: 1,643 of the 2,018 preintervention observations (81.4%) and 1,245 of the 1,630 postintervention observations (76.4%).
Findings from the HCW observations are summarized in Figure A. The overall postintervention hand hygiene adherence rate (548 of 1,630 observations; 33.6%; 95% CI, 31.3%-35.9%) was significantly higher than the preintervention rate (453 of 2,018 observations; 22.4%; 95% CI, 20.6%-24.3%; P < .001). This finding persisted after adjustment for the type of HCW (nurse vs physician), with proper hand hygiene adherence occurring 1.55 times more often after the intervention than before (95% CI, 1.37-1.76; P < .001). The overall improvement in hand hygiene adherence rates in the postintervention period was seen in all four hospitals (Figure B). However, the hand hygiene adherence rates of nurses in Hospitals C and D were lower than those in Hospitals A and B both before and after the intervention.
Use of AHR was the dominant appropriate hand hygiene practice vs hand washing with soap and water. Of those that practiced appropriate hand hygiene, the rate of AHR use was high and unchanged between preintervention (424 of 453; 93.6%) and postintervention periods (513 of 548; 93.6%; P = .99).
Changes by HCW Type
The rates of hand hygiene adherence in both physicians and nurses were higher in the postintervention period than in the preintervention period. However, the improvement of hand hygiene adherence among nurses—from 415 of 1,643 (25.2%) to 487 of 1,245 (39.1%) for an increase of 13.9 percentage points (95% CI,10.4-17.3)—was greater than that in physicians—from 38 of 375 (10.1%) to 61 of 385 (15.8%) for an increase of 5.7 percentage points (95% CI, 1.0-8.1; P < .001; Figure B). In general, nurse hand hygiene adherence was higher than that in physicians both in the preintervention period, with nurses at 25.2% (95% CI, 23.2%-27.4%) vs physicians at 10.1% (95% CI, 7.1%-13.2%; P < .001), and in the postintervention period, with nurses at 39.1% (95% CI, 36.4%-41.8%) vs physicians at 15.8% (95% CI, 12.2%-19.5%; P < .001).
Changes by Hospital
Overall, improvement of hand hygiene adherence was observed in all hospitals. However, the improvement rates differed in each hospital: They were 6.5 percentage points in Hospital A, 11.3 percentage points in Hospital C, 11.4 percentage points in Hospital D, and 18.4 percentage points in Hospital B. Hospital B achieved the highest postintervention adherence rates (42.6%), along with the highest improvement. The improvements of hand hygiene adherence in physicians were higher in Hospitals B (8.4 percentage points) and D (8.3 percentage points) than they were in Hospitals A (4.1 percentage points) and C (4.0 percentage points).
Interventions performed at each hospital to improve hand hygiene adherence are summarized in Table 2 and the Appendix Figure. All hospitals performed feedback of hand hygiene adherence after the preintervention period. Interventions related to AHR were frequently initiated; self-carry AHR was provided in two hospitals (Hospitals C and D), and location of AHR was moved (Hospitals B and D). In addition, new AHR products that caused less skin irritation were introduced in Hospital B. Direct observation by hospital staff (separate from our study observers) was also done as part of Hospital A and D’s improvement efforts. Other interventions included a 1-month campaign for hand hygiene including a contest for senryu (humorous 17-syllable poems; Table 2; Appendix Table), posters, seminars, and creation of a handbook related to hand hygiene. Posters emphasizing the importance of hand hygiene created by the local hospital infection control teams were put on the wall in several locations near wash basins. Seminars (1-hour lectures to emphasize the importance of hand hygiene) were provided to nurses. A 10-page hand hygiene handbook was created by one local infection control team and provided to nurses.
DISCUSSION
Our study demonstrated that the overall rate of hand hygiene adherence improved from 22.4% to 33.6% after multimodal intervention; however, the adherence rates even after intervention were suboptimal. The results were comparable with those of a previous study in Japan,22 which underscores how suboptimal HCW hand hygiene in Japan threatens patient safety. Hand hygiene among HCWs is one of the most important methods to prevent HAIs and to reduce spread of multidrug resistant organisms. High adherence has proven challenging because it requires behavior modification. We implemented WHO hand hygiene adherence strategies27 and evaluated the efficacy of a multimodal intervention in hopes of finding the specific factors that could be related to behavior modification for HCWs.
We observed several important relationships between the intervention components and their improvement in hand hygiene adherence. Among the four participating hospitals, Hospital B was the most successful with improvement of hand hygiene adherence from 24.2% to 42.6%. One unique intervention for Hospital B was the introduction of new AHR products for the people who had felt uncomfortable with current products. Frequent hand washing or the use of certain AHR products could irritate skin causing dry or rough hands, which could reduce hand hygiene practices. In Japan, there are several AHR products available. Among them, a few products contain skin moisturizing elements; these products are 10%-20% higher in cost than nonmoisturizing products. The HCWs in our study stated that the new products were more comfortable to use, and they requested to introduce them as daily use products. Thus, use of a product containing a hand moisturizer may reduce some factors negatively affecting hand hygiene practice and improve adherence rates.
Although this study was unable to determine which components are definitively associated with improving hand hygiene adherence, the findings suggest initiation of multiple intervention components simultaneously may provide more motivation for change than initiating only one or two components at a time. It is also possible that certain intervention components were more beneficial than others. Consistent with a previous study, improving hand hygiene adherence cannot be simply achieved by improving infrastructure (eg, introducing portable AHR) alone, but rather depends on altering the behavior of physicians and nurses.
This study was performed at four tertiary care hospitals in Niigata that are affiliated with Niigata University. They are located closely in the region, within 100 km, have quarterly conferences, and use a mutual monitoring system related to infection prevention. The members of infection control communicate regularly, which we thought would optimize improvements in hand hygiene adherence, compared with the circumstances of previous studies. In this setting, HCWs have similar education and share knowledge related to infection control, and the effects of interventions in each hospital were equally evaluated if similar interventions were implemented. In the current study, the interventions at each hospital were similar, and there was limited variety; therefore, specific, novel interventions that could affect hand hygiene adherence significantly were difficult to find.
There are a few possible reasons why hand hygiene adherence rates were low in the current study. First, part of this study was conducted during the summer so that the consciousness and caution for hand hygiene might be lower, compared with that in winter. In general, HCWs become more cautious for hand hygiene practice when they take care of patients diagnosed with influenza or respiratory syncytial virus infection. Second, the infrastructure for hand hygiene practice in the hospitals in Japan is inadequate and not well designed. Because of safety reasons, a single dispenser of AHR is placed at the entrance of each room in general and not at each bedside. The number of private rooms is limited, and most of the rooms in wards have multiple beds per room, with no access to AHR within the room. In fact, the interventions at all four hospitals included a change in the location and/or access of AHR. Easier access to AHR is likely a key step to improving hand hygiene adherence rates. Finally, there was not an active intervention to include hospital or unit leaders. This is important given the involvement of leaders in hand hygiene practice significantly changed the hand adherence rates in a previous study.19
Given the suboptimal hand hygiene adherence rates in Japan noted in this and previous Japanese studies,21,22 the spread of COVID-19 within the hospital setting is a concern. Transmission of COVID-19 by asymptomatic carriers has been suggested,11 which emphasizes the importance of regular standard precautions with good hand hygiene practice to prevent further transmission.
Although the hand hygiene rate was suboptimal, we were able to achieve a few sustainable, structural modifications in the clinical environment after the intervention. These include adding AHR in new locations, changing the location of existing AHR to more appropriate locations, and introducing new products. These will remain in the clinical environment and will contribute to hand hygiene adherence in the future.
This study has several limitations. First, the presence of external observers in their clinical settings might have affected the behavior of HCWs.28 Although they were not informed that their hand hygiene adherence was going to be monitored, the existence of an external observer in their clinical setting might have changed normal behavior. Second, the infrastructure and interventions for hand hygiene adherence before the intervention were different in each hospital, so there is a possibility that hospitals with less infrastructure for hand hygiene adherence had more room for improvement with the interventions. Third, we included observations at different units at each hospital, which might affect the results of the study because of the inclusion of different medical settings and HCWs. Fourth, the number of physician hand hygiene observations was limited: We conducted our observations between 8
In conclusion, a multimodal intervention to improve hand hygiene adherence successfully improved HCWs’ hand hygiene adherence in Niigata, Japan; however, the adherence rates are still relatively low compared with those reported from other countries. Further intervention is required to improve hand hygiene adherence.
1. Zimlichman E, Henderson D, Tamir O, et al. Health care-associated infections: a meta-analysis of costs and financial impact on the US health care system. JAMA Intern Med. 2013;173(22):2039-2046. https://doi.org/10.1001/jamainternmed.2013.9763.
2. Cassini A, Plachouras D, Eckmanns T, et al. Burden of six healthcare-associated infections on European population health: estimating incidence-based disability-adjusted life years through a population prevalence-based modelling study. PLoS Med. 2016;13(10):e1002150. https://doi.org/10.1371/journal.pmed.1002150.
3. Vrijens F, Hulstaert F, Van de Sande S, Devriese S, Morales I, Parmentier Y. Hospital-acquired, laboratory-confirmed bloodstream infections: linking national surveillance data to clinical and financial hospital data to estimate increased length of stay and healthcare costs. J Hosp Infect. 2010;75(3):158-162. https://doi.org/10.1016/j.jhin.2009.12.006.
4. de Lissovoy G, Fraeman K, Hutchins V, Murphy D, Song D, Vaughn BB. Surgical site infection: incidence and impact on hospital utilization and treatment costs. Am J Infect Control. 2009;37(5):387-397. https://doi.org/10.1016/j.ajic.2008.12.010.
5. Suka M, Yoshida K, Takezawa J. Epidemiological approach to nosocomial infection surveillance data: the Japanese Nosocomial Infection Surveillance System. Environ Health Prev Med. 2008;13(1):30-35. https:// doi.org/10.1007/s12199-007-0004-y.
6. Japan Nosocomial Infection Surveillance. JANIS Open Report. 2018. https://janis.mhlw.go.jp/english/report/open_report/2018/3/1/ken_Open_Report_Eng_201800_clsi2012.pdf. Accessed April 2, 2020.
7. Allegranzi B, Pittet D. Role of hand hygiene in healthcare-associated infection prevention. J Hosp Infect. 2009;73(4):305-315. https://doi.org/10.1016/j.jhin.2009.04.019.
8. Zhu N, Zhang D, Wang W, et al. A novel coronavirus from patients with pneumonia in China, 2019. N Engl J Med. 2020;382(8):727-733. https://doi.org/10.1056/NEJMoa2001017.
9. World Health Organization. Coronavirus disease (COVID-19) advice for the public. 2020. https://www.who.int/emergencies/diseases/novel-coronavirus-2019/advice-for-public. Accessed February 28, 2020.
10. Centers for Disease Control and Prevention. Interim Guidance for Preventing the Spread of Coronavirus Disease 2019 (COVID-19) in Homes and Residential Communities. 2020. https://www.cdc.gov/coronavirus/2019-ncov/hcp/guidance-prevent-spread.html. Accessed February 28, 2020.
11. Bai Y, Yao L, Wei T, et al. Presumed asymptomatic carrier transmission of COVID-19. JAMA. 2020;323(14):1406-1407. https://doi.org/10.1001/jama.2020.2565.
12. Burke JP. Infection control - a problem for patient safety. N Engl J Med. 2003;348(7):651-656. https://doi.org/10.1056/NEJMhpr020557.
13. World Health Organization. A Guide to the Implementation of the WHO Multimodal Hand Hygiene Improvement Strategy. 2013. https://www.who.int/gpsc/5may/Guide_to_Implementation.pdf. Accessed February 28, 2020.
14. Allegranzi B, Gayet-Ageron A, Damani N, et al. Global implementation of WHO’s multimodal strategy for improvement of hand hygiene: a quasi-experimental study. Lancet Infect Dis. 2013;13(10):843-851. https://doi.org/10.1016/S1473-3099(13)70163-4.
15. Pittet D, Hugonnet S, Harbarth S, et al. Effectiveness of a hospital-wide programme to improve compliance with hand hygiene. Infection Control Programme. Lancet. 2000;356(9238):1307-1312. https://doi.org/10.1016/s0140-6736(00)02814-2.
16. Rosenthal VD, Pawar M, Leblebicioglu H, et al. Impact of the International Nosocomial Infection Control Consortium (INICC) multidimensional hand hygiene approach over 13 years in 51 cities of 19 limited-resource countries from Latin America, Asia, the Middle East, and Europe. Infect Control Hosp Epidemiol. 2013;34(4):415-423. https://doi.org/10.1086/669860.
17. Pincock T, Bernstein P, Warthman S, Holst E. Bundling hand hygiene interventions and measurement to decrease health care-associated infections. Am J Infect Control. 2012;40(4 Suppl 1):S18-S27. https://doi.org/10.1016/j.ajic.2012.02.008.
18. Larson EL. APIC guideline for handwashing and hand antisepsis in health care settings. Am J Infect Control. 1995;23(4):251-269. https://doi.org/10.1016/0196-6553(95)90070-5.
19. Saint S, Conti A, Bartoloni A, et al. Improving healthcare worker hand hygiene adherence before patient contact: a before-and-after five-unit multimodal intervention in Tuscany. Qual Saf Health Care. 2009;18(6):429-433. https://doi.org/10.1136/qshc.2009.032771.
20. Bolon MK. Hand hygiene: an update. Infect Dis Clin North Am. 2016;30(3):591-607. https://doi.org/10.1016/j.idc.2016.04.007.
21. Sakihama T, Honda H, Saint S, et al. Hand hygiene adherence among health care workers at Japanese hospitals: a multicenter observational study in Japan. J Patient Saf. 2016;12(1):11-17. https://doi.org/10.1097/PTS.0000000000000108.
22. Sakihama T, Honda H, Saint S, et al. Improving healthcare worker hand hygiene adherence before patient contact: a multimodal intervention of hand hygiene practice in three Japanese tertiary care centers. J Hosp Med. 2016;11(3):199-205. https://doi.org/10.1002/jhm.2491.
23. Sakihama T, Kayauchi N, Kamiya T, et al. Assessing sustainability of hand hygiene adherence 5 years after a contest-based intervention in 3 Japanese hospitals. Am J Infect Control. 2020;48(1):77-81. https://doi.org/10.1016/j.ajic.2019.06.017.
24. World Health Organization. My 5 Moments for Hand Hygiene. https://www.who.int/infection-prevention/campaigns/clean-hands/5moments/en/. Accessed April 2, 2020.
25. World Health Organization. WHO Guidelines on Hand Hygiene in Health Care. 2009. https://www.who.int/gpsc/5may/tools/9789241597906/en/. Accessed February 28, 2020.
26. Saint S, Bartoloni A, Virgili G, et al. Marked variability in adherence to hand hygiene: a 5-unit observational study in Tuscany. Am J Infect Control. 2009;37(4):306-310. https://doi.org/10.1016/j.ajic.2008.08.004.
27. World Health Organization. WHO Guidelines on Hand Hygiene in Health Care: First Global Patient Safety Challenge Clean Care Is Safer Care. Geneva: World Health Organization; 2009. https://www.ncbi.nlm.nih.gov/books/NBK144013/pdf/Bookshelf_NBK144013.pdf. Accessed February 28, 2020.
28. Pan SC, Tien KL, Hung IC, et al. Compliance of health care workers with hand hygiene practices: independent advantages of overt and covert observers. PLoS One. 2013;8(1):e53746. https://doi.org/10.1371/journal.pone.0053746.
1. Zimlichman E, Henderson D, Tamir O, et al. Health care-associated infections: a meta-analysis of costs and financial impact on the US health care system. JAMA Intern Med. 2013;173(22):2039-2046. https://doi.org/10.1001/jamainternmed.2013.9763.
2. Cassini A, Plachouras D, Eckmanns T, et al. Burden of six healthcare-associated infections on European population health: estimating incidence-based disability-adjusted life years through a population prevalence-based modelling study. PLoS Med. 2016;13(10):e1002150. https://doi.org/10.1371/journal.pmed.1002150.
3. Vrijens F, Hulstaert F, Van de Sande S, Devriese S, Morales I, Parmentier Y. Hospital-acquired, laboratory-confirmed bloodstream infections: linking national surveillance data to clinical and financial hospital data to estimate increased length of stay and healthcare costs. J Hosp Infect. 2010;75(3):158-162. https://doi.org/10.1016/j.jhin.2009.12.006.
4. de Lissovoy G, Fraeman K, Hutchins V, Murphy D, Song D, Vaughn BB. Surgical site infection: incidence and impact on hospital utilization and treatment costs. Am J Infect Control. 2009;37(5):387-397. https://doi.org/10.1016/j.ajic.2008.12.010.
5. Suka M, Yoshida K, Takezawa J. Epidemiological approach to nosocomial infection surveillance data: the Japanese Nosocomial Infection Surveillance System. Environ Health Prev Med. 2008;13(1):30-35. https:// doi.org/10.1007/s12199-007-0004-y.
6. Japan Nosocomial Infection Surveillance. JANIS Open Report. 2018. https://janis.mhlw.go.jp/english/report/open_report/2018/3/1/ken_Open_Report_Eng_201800_clsi2012.pdf. Accessed April 2, 2020.
7. Allegranzi B, Pittet D. Role of hand hygiene in healthcare-associated infection prevention. J Hosp Infect. 2009;73(4):305-315. https://doi.org/10.1016/j.jhin.2009.04.019.
8. Zhu N, Zhang D, Wang W, et al. A novel coronavirus from patients with pneumonia in China, 2019. N Engl J Med. 2020;382(8):727-733. https://doi.org/10.1056/NEJMoa2001017.
9. World Health Organization. Coronavirus disease (COVID-19) advice for the public. 2020. https://www.who.int/emergencies/diseases/novel-coronavirus-2019/advice-for-public. Accessed February 28, 2020.
10. Centers for Disease Control and Prevention. Interim Guidance for Preventing the Spread of Coronavirus Disease 2019 (COVID-19) in Homes and Residential Communities. 2020. https://www.cdc.gov/coronavirus/2019-ncov/hcp/guidance-prevent-spread.html. Accessed February 28, 2020.
11. Bai Y, Yao L, Wei T, et al. Presumed asymptomatic carrier transmission of COVID-19. JAMA. 2020;323(14):1406-1407. https://doi.org/10.1001/jama.2020.2565.
12. Burke JP. Infection control - a problem for patient safety. N Engl J Med. 2003;348(7):651-656. https://doi.org/10.1056/NEJMhpr020557.
13. World Health Organization. A Guide to the Implementation of the WHO Multimodal Hand Hygiene Improvement Strategy. 2013. https://www.who.int/gpsc/5may/Guide_to_Implementation.pdf. Accessed February 28, 2020.
14. Allegranzi B, Gayet-Ageron A, Damani N, et al. Global implementation of WHO’s multimodal strategy for improvement of hand hygiene: a quasi-experimental study. Lancet Infect Dis. 2013;13(10):843-851. https://doi.org/10.1016/S1473-3099(13)70163-4.
15. Pittet D, Hugonnet S, Harbarth S, et al. Effectiveness of a hospital-wide programme to improve compliance with hand hygiene. Infection Control Programme. Lancet. 2000;356(9238):1307-1312. https://doi.org/10.1016/s0140-6736(00)02814-2.
16. Rosenthal VD, Pawar M, Leblebicioglu H, et al. Impact of the International Nosocomial Infection Control Consortium (INICC) multidimensional hand hygiene approach over 13 years in 51 cities of 19 limited-resource countries from Latin America, Asia, the Middle East, and Europe. Infect Control Hosp Epidemiol. 2013;34(4):415-423. https://doi.org/10.1086/669860.
17. Pincock T, Bernstein P, Warthman S, Holst E. Bundling hand hygiene interventions and measurement to decrease health care-associated infections. Am J Infect Control. 2012;40(4 Suppl 1):S18-S27. https://doi.org/10.1016/j.ajic.2012.02.008.
18. Larson EL. APIC guideline for handwashing and hand antisepsis in health care settings. Am J Infect Control. 1995;23(4):251-269. https://doi.org/10.1016/0196-6553(95)90070-5.
19. Saint S, Conti A, Bartoloni A, et al. Improving healthcare worker hand hygiene adherence before patient contact: a before-and-after five-unit multimodal intervention in Tuscany. Qual Saf Health Care. 2009;18(6):429-433. https://doi.org/10.1136/qshc.2009.032771.
20. Bolon MK. Hand hygiene: an update. Infect Dis Clin North Am. 2016;30(3):591-607. https://doi.org/10.1016/j.idc.2016.04.007.
21. Sakihama T, Honda H, Saint S, et al. Hand hygiene adherence among health care workers at Japanese hospitals: a multicenter observational study in Japan. J Patient Saf. 2016;12(1):11-17. https://doi.org/10.1097/PTS.0000000000000108.
22. Sakihama T, Honda H, Saint S, et al. Improving healthcare worker hand hygiene adherence before patient contact: a multimodal intervention of hand hygiene practice in three Japanese tertiary care centers. J Hosp Med. 2016;11(3):199-205. https://doi.org/10.1002/jhm.2491.
23. Sakihama T, Kayauchi N, Kamiya T, et al. Assessing sustainability of hand hygiene adherence 5 years after a contest-based intervention in 3 Japanese hospitals. Am J Infect Control. 2020;48(1):77-81. https://doi.org/10.1016/j.ajic.2019.06.017.
24. World Health Organization. My 5 Moments for Hand Hygiene. https://www.who.int/infection-prevention/campaigns/clean-hands/5moments/en/. Accessed April 2, 2020.
25. World Health Organization. WHO Guidelines on Hand Hygiene in Health Care. 2009. https://www.who.int/gpsc/5may/tools/9789241597906/en/. Accessed February 28, 2020.
26. Saint S, Bartoloni A, Virgili G, et al. Marked variability in adherence to hand hygiene: a 5-unit observational study in Tuscany. Am J Infect Control. 2009;37(4):306-310. https://doi.org/10.1016/j.ajic.2008.08.004.
27. World Health Organization. WHO Guidelines on Hand Hygiene in Health Care: First Global Patient Safety Challenge Clean Care Is Safer Care. Geneva: World Health Organization; 2009. https://www.ncbi.nlm.nih.gov/books/NBK144013/pdf/Bookshelf_NBK144013.pdf. Accessed February 28, 2020.
28. Pan SC, Tien KL, Hung IC, et al. Compliance of health care workers with hand hygiene practices: independent advantages of overt and covert observers. PLoS One. 2013;8(1):e53746. https://doi.org/10.1371/journal.pone.0053746.
© 2020 Society of Hospital Medicine