User login
Gap Analysis for the Conversion to Area Under the Curve Vancomycin Monitoring in a Small Rural Hospital
The use of weight-based dosing with trough-based monitoring of vancomycin has been in clinical practice for more than a decade. The American Society of Health-System Pharmacists (ASHP), the Infectious Diseases Society of America (IDSA), and the Society of Infectious Diseases Pharmacists (SIDP) published the first guidelines for vancomycin monitoring in 2009.1 Although it has been well established that area under the curve (AUC) over the minimal inhibitory concentration (MIC) ratio > 400 mg.h/L is the best predictor of clinical efficacy, obtaining this value in clinical practice was not pragmatic. Therefore, the 2009 guidelines recommended a goal vancomycin trough of 15 to 20 mcg/ml as a surrogate marker for AUC/MIC > 400 mg.hr/L. This has since become a common practice despite little data that support this recommendation.
The efficacy and safety of trough-based monitoring has been evaluated extensively over the past several years and more recent data suggest that there is wide patient variability in AUC with this method and higher trough levels are associated with more nephrotoxicity.2,3 ASHP, IDSA, SIDP, and the Pediatric Infectious Diseases Society (PIDS) updated the consensus guidelines in 2020.4 Trough-based monitoring is no longer recommended. Instead AUC24 monitoring should be implemented with a goal range of 400 to 600 mg.h/L for efficacy and safety. Given concerns for vancomycin penetration into the central nervous system (CNS), many facility protocols utilize higher targets (> 600 mg.h/L) for CNS infections.
Some hospitals have been utilizing AUC-based monitoring for years. There are strategies from tertiary care centers that drive this practice change in the medical literature.5,6 However, it is important to reproduce these implementation practices in small, rural facilities that may face unique challenges with limited resources and may be slower to implement consensus guidelines.7,8 As this is a major practice change, it is imperative to evaluate the extent of transition and identify areas of needed improvement.
Accurate therapeutic drug monitoring ensures both the safety and efficacy of vancomycin therapy. Unfortunately, research shows that inappropriate laboratory tests are common in medical facilities.9 Drug levels taken inappropriately can lead to delays in therapeutic decision-making, inappropriate dosage adjustments and create a need for repeated drug levels, which increases the overall cost of admission.
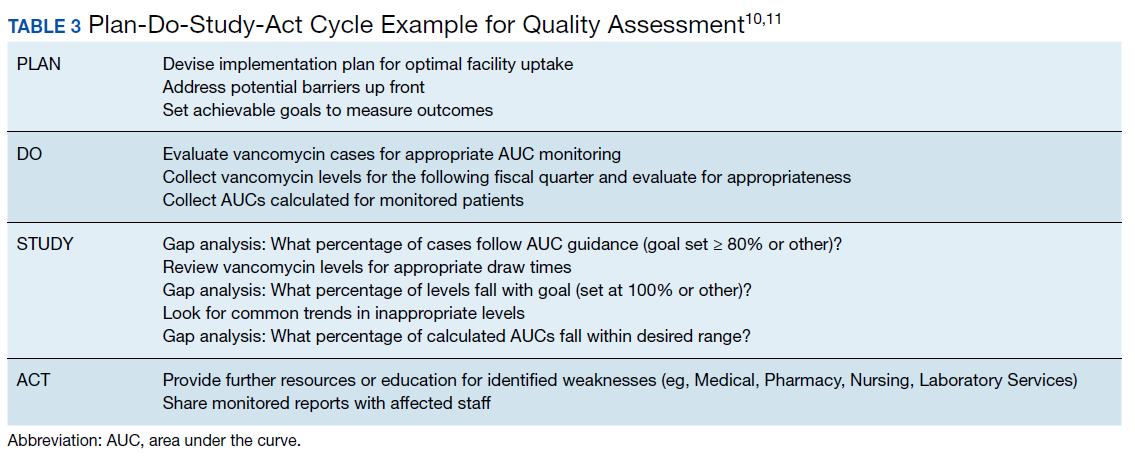
Given the multiple affected services needed to make successful practice transitions, it is paramount that facilities evaluate progress during the transition phase. The Agency for Healthcare Research and Quality and the Institute for Healthcare Improvement provide guidance in the Plan-Do-Study-Act Cycle for quality assessment and improvement of new initiatives.10,11 A gap analysis can be used as a simple tool for evaluating the transition of research into practice and to identify areas of needed improvement.
The Veterans Health Care System of the Ozarks (VHSO) in Fayetteville, Arkansas made the transition from trough-based monitoring to 2-level AUC-based monitoring on April 1, 2019. The purpose of this study was to evaluate the effectiveness of transition methods used to implement AUC-monitoring for vancomycin treated patients in a small, primary facility. A further goal of the study was to identify areas of needed improvement and education and whether the problems derived from deficiencies in knowledge and ordering (medical and pharmacy services) or execution (nursing and laboratory services).
Methods
VHSO is a 52-bed US Department of Veterans Affairs primary care hospital. The pharmacy and laboratory are staffed 24 hours each day. There is 1 clinical pharmacy specialist (CPS) available for therapeutic drug monitoring consults Monday through Friday between the hours of 7:30 AM and 4:00 PM. No partial full-time equivalent employees were added for this conversion. Pharmacy-driven vancomycin dosing and monitoring is conducted on a collaborative basis, with pharmacy managing the majority of vancomycin treated patients. Night and weekend pharmacy staff provide cross-coverage on vancomycin consultations. Laboratory orders and medication dosage adjustments fall within the CPS scope of practice. Nurses do not perform laboratory draws for therapeutic drug monitoring; this is done solely by phlebotomists. There is no infectious diseases specialist at the facility to champion antibiotic dosing initiatives.
The implementation strategy largely reflected those outlined from tertiary care centers.5,6 First, key personnel from the laboratory department met to discuss this practice change and to add vancomycin peaks to the ordering menu. A critical value was set at 40 mcg/ml. Vancomycin troughs and random levels already were orderable items. A comment field was added to all laboratory orders for further clarification. Verbiage was added to laboratory reports in the computerized medical record to assist clinicians in determining the appropriateness of the level. This was followed by an educational email to both the nursing and laboratory departments explaining the practice change and included a link to the Pharmacy Joe “Vancomycin Dosing by AUC:MIC Instead of Trough-level” podcast (www.pharmacyjoe.com episode 356).
The pharmacy department received an interactive 30-minute presentation, followed immediately by a group activity to discuss practice problems. This presentation was condensed, recorded, and emailed to all VHSO pharmacists. A shared folder contained pertinent material on AUC monitoring.
Finally, an interactive presentation was set up for hospitalists and a video teleconferencing was conducted for rotating medical residents. Both the podcast and recorded presentation were emailed to the entire medical staff with a brief introduction of the practice change. Additionally, the transition process was added as a standing item on the monthly antimicrobial stewardship meeting agenda.
The standardized pharmacokinetic model at the study facility consisted of a vancomycin volume of distribution of 0.7 mg/kg and elimination rate constant (Ke) by Matzke and colleagues for total daily dose calculations.12 Obese patients (BMI ≥ 30) undergo alternative clearance equations described by Crass and colleagues.13 Cockcroft-Gault methods using ideal body weight (or actual body weight if < ideal body weight) are used for determining creatinine clearance. In patients aged ≥ 65 years with a serum creatinine < 1.0 mg/dL, facility guidance was to round serum creatinine up to 1.0 mg/dL. Loading doses were determined on a case-by-case basis with a cap of 2,000 mg, maintenance doses were rounded to the nearest 250 mg.
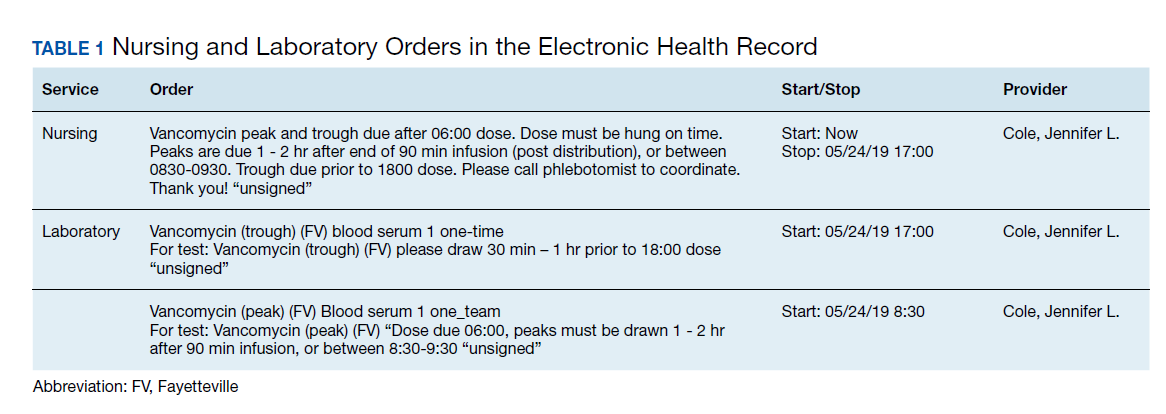
Vancomycin levels typically are drawn at steady state and analyzed using the logarithmic trapezoidal rule.14 The pharmacy and medical staff were educated to provide details on timing and coordination in nursing and laboratory orders (Table 1). Two-level AUC monitoring typically is not performed in patients with acute renal failure, expected duration of therapy < 72 hours, urinary tract infections, skin and soft tissue infections, or in renal replacement therapy.5
This gap analysis consisted of a retrospective chart review of vancomycin levels ordered after the implementation of AUC-based monitoring to determine the effectiveness of the transition. Three months of data were collected between April 2019 and June 2019. Vancomycin levels were deemed either appropriate or inappropriate based on timing and type (peak, trough, or random) of the laboratory test in relation to the previously administered vancomycin dose. Appropriate peaks were drawn within 2 hours after the end of infusion and troughs at least 1 half-life after the dose or just prior to the next dose and within the same dosing interval as the peak. Tests drawn outside of the specified time range, trough-only laboratory tests, or those drawn after vancomycin had been discontinued were considered inappropriate. Peaks and troughs drawn from separate dosing intervals also were considered inappropriate. Random levels were considered appropriate only if they fit the clinical context in acute renal failure or renal replacement therapy. An effective transition was defined as ≥ 80% of all vancomycin treated patients monitored with AUC methods rather than trough-based methods.
Inclusion criteria included all vancomycin levels ordered during the study period with no exclusions. The primary endpoint was the proportion of vancomycin levels drawn appropriately. Secondary endpoints were the proportion of AUC24 calculations within therapeutic range and a stratification of reasons for inappropriate levels. Descriptive statistics were collected to describe the scope of the project. Levels drawn from various shifts were compared (ie, day, night, or weekend). Calculated AUC24 levels between 400 and 600 mg.h/L were considered therapeutic unless treating CNS infection (600-700 mg.h/L). Given the operational outcomes (rather than clinical outcomes) and no comparator group, patient specific data were not collected.
Descriptive statistics without further analysis were used to describe proportions. The goal level for compliance was set at 100%. These methods were reviewed by the VHSO Institutional Review Board and granted nonresearch status, waiving the requirement for informed consent.
Results
The transition was effective with 97% of all cases utilizing AUC-based methods for monitoring. A total of 65 vancomycin levels were drawn in the study period; 32 peaks, 32 troughs, and 1 random level (drawn appropriately during acute renal failure 24 hours after starting therapy). All shifts were affected proportionately; days (n = 26, 40%), nights (n = 18, 27.7%), and weekends (n = 21, 32.3%). Based on time of dosage administration and laboratory test, there were 9 levels (13.8%) deemed inappropriate, 56 levels (86.1%) were appropriate. Reasons for inappropriate levels gleaned from chart review are presented in Table 2. Four levels had to be repeated for accurate calculations.
From the peak/trough couplets drawn appropriately, calculated AUC24 fell with the desired range in 61% (n = 17) of cases. Of the 11 that fell outside of range, 8 were subtherapeutic (< 400 mg.h/L) and 3 were supratherapeutic (> 600 mg.h/L). All levels were drawn at steady state. Indications for vancomycin monitoring were osteomyelitis (n = 13, 43%), sepsis (n = 10, 33%), pneumonia (n = 6, 20%), and 1 case of meningitis (3%).
Discussion
To the author’s knowledge, this is the first report of a vancomycin AUC24 monitoring conversion in a rural facility. This study adds to the existing medical literature in that it demonstrates that: (1) implementation methods described in large, tertiary centers can be effectively utilized in primary care, rural facilities; (2) the gap analysis used can be duplicated with minimal personnel and resources to ensure effective implementation (Table 3); and (3) the reported improvement needs can serve as a model for preventative measures at other facilities. The incidence of appropriate vancomycin levels was notably better than those reported in other single center studies.15-17 However, given variations in study design and facility operating procedures, it would be difficult to compare incidence among medical facilities. As such, there are no consensus benchmarks for comparison. The majority of inappropriate levels occurred early in the study period and on weekends. Appropriateness of drug levels may have improved with continued feedback and familiarity.
The calculated AUC24 fell within predicted range in 61% of cases. For comparison, a recent study from a large academic medical center reported that 73.5% of 2-level AUC24 cases had initial values within the therapeutic range.18 Of note, the target range used was much wider (400 - 800 mg.h/L) than the present study. Another study reported dose adjustments for subtherapeutic AUC levels in 25% of cases and dose reductions for supratherapeutic levels in 33.3% of cases.19
Of the AUC24 calculations that fell outside of therapeutic range, the majority (n = 8, 73%) were subtherapeutic (< 400 mg.h/L), half of these were for patients who were obese. It was unclear in the medical record which equation was used for initial dosing (Matzke vs Crass), or whether more conservative AUCs were used for calculating the total daily dose. The VHSO policy limiting loading doses also may have played a role; indeed the updated guidelines recommend a maximum loading dose of 3,000 mg depending on the severity of infection.4 Two of the 3 supratherapeutic levels were thought to be due to accumulation with long-term therapy.
Given such a large change from long-standing practices, there was surprisingly little resistance from the various clinical services. A recent survey of academic medical centers reported that the majority (88%) of all respondents who did not currently utilize AUC24 monitoring did not plan on making this immediate transition, largely citing unfamiliarity and training requirements.20 It is conceivable that the transition to AUC monitoring in smaller facilities may have fewer barriers than those seen in tertiary care centers. There are fewer health care providers and pharmacists to educate with the primary responsibilities falling on relatively few clinicians. There is little question as to who will be conducting follow up or whom to contact for questions. A smaller patient load and lesser patient acuity may translate to fewer vancomycin cases that require monitoring.
The interactive meetings were an important element for facility implementation. Research shows that emails alone are not effective for health care provider education, and interactive methods are recommended over passive methods.21,22 Assessing and avoiding barriers up front such as unclear laboratory orders, or communication failures is paramount to successful implementation strategies.23 Additionally, the detailed written ordering communication may have contributed to a smoother transition. The educational recording proved to be helpful in educating new staff and residents. An identified logistical error was that laboratory orders entered while patients were enrolled in sham clinics for electronic workload capture (eg, Pharmacy Inpatient Clinic) created confusion on the physical location of the patient for the phlebotomists, potentially causing delays in specimen collection.
A major development that stemmed from this intervention was that the Medical Service asked that policy changes be made so that the Pharmacy Service take over all vancomycin dosing at the facility. Previously, this had been done on a collaborative basis. Similar facilities with a collaborative practice model may need to anticipate such a request as this may present a new set of challenges. Accordingly, the pharmacy department is in the process of establishing standing operating procedures, pharmacist competencies, and a facility memorandum. Future research should evaluate the safety and efficacy of vancomycin therapy after the switch to AUC-based monitoring.
Limitations
There are several limitations to consider with this study. Operating procedures and implementation processes may vary between facilities, which could limit the generalizability of these results. Given the small facility size, the overall number of laboratory tests drawn was much smaller than those seen in larger facilities. The time needed for AUC calculations is notably longer than older methods of monitoring; however, this was not objectively assessed. It is important to note that clinical outcomes were beyond the scope of this gap analysis and this is an area of future research at the study facility. Vancomycin laboratory tests that were missed due to procedures and subsequently rescheduled were occasionally observed but not accounted for in this analysis. Additionally, vancomycin courses without monitoring (appropriate or otherwise) when indicated were not assessed. However, anecdotally speaking, this would be a very unlikely occurrence.
Conclusion
Conversion to AUC-based vancomycin monitoring is feasible in primary, rural medical centers. Implementation strategies from tertiary facilities can be successfully utilized in smaller hospitals. Quality assessment strategies such as a gap analysis can be utilized with minimal resources for facility uptake of new clinical practices.
1. Rybak M, Lomaestro B, Rotschafer JC, et al. Therapeutic monitoring of vancomycin in adult patients: a consensus review of the American Society of Health-System Pharmacists, the Infectious Diseases Society of America, and the Society of Infectious Diseases Pharmacists [published correction appears in Am J Health Syst Pharm. 2009;66(10):887]. Am J Health Syst Pharm. 2009;66(1):82‐98. doi:10.2146/ajhp080434
2. van Hal SJ, Paterson DL, Lodise TP. Systematic review and meta-analysis of vancomycin-induced nephrotoxicity associated with dosing schedules that maintain troughs between 15 and 20 milligrams per liter. Antimicrob Agents Chemother. 2013;57(2):734‐744. doi:10.1128/AAC.01568-12
3. Pai MP, Neely M, Rodvold KA, Lodise TP. Innovative approaches to optimizing the delivery of vancomycin in individual patients. Adv Drug Deliv Rev. 2014;77:50‐57. doi:10.1016/j.addr.2014.05.016
4. Rybak MJ, Le J, Lodise TP, et al. Therapeutic monitoring of vancomycin for serious methicillin-resistant Staphylococcus aureus infections: a revised consensus guideline and review by the American Society of Health-System Pharmacists, the Infectious Diseases Society of America, the Pediatric Infectious Diseases Society, and the Society of Infectious Diseases Pharmacists [published online ahead of print, 2020 Mar 19]. Am J Health Syst Pharm. 2020;zxaa036. doi:10.1093/ajhp/zxaa036
5. Heil EL, Claeys KC, Mynatt RP, et al. Making the change to area under the curve-based vancomycin dosing. Am J Health Syst Pharm. 2018;75(24):1986‐1995. doi:10.2146/ajhp180034
6. Gregory ER, Burgess DR, Cotner SE, et al. Vancomycin area under the curve dosing and monitoring at an academic medical center: transition strategies and lessons learned [published online ahead of print, 2019 Mar 10]. J Pharm Pract. 2019;897190019834369. doi:10.1177/0897190019834369
7. Septimus EJ, Owens RC Jr. Need and potential of antimicrobial stewardship in community hospitals. Clin Infect Dis. 2011;53 Suppl 1:S8‐S14. doi:10.1093/cid/cir363
8. Goldman LE, Dudley RA. United States rural hospital quality in the Hospital Compare database-accounting for hospital characteristics. Health Policy. 2008;87(1):112‐127. doi:10.1016/j.healthpol.2008.02.002
9. Zhi M, Ding EL, Theisen-Toupal J, Whelan J, Arnaout R. The landscape of inappropriate laboratory testing: a 15-year meta-analysis. PLoS One. 2013;8(11):e78962. doi:10.1371/journal.pone.0078962
10. Institute for Healthcare Improvement. Plan-do-study-act (PDSA) worksheet. http://www.ihi.org/resources/Pages/Tools/PlanDoStudyActWorksheet.aspx. Accessed May 13, 2020.
11. Agency for Healthcare Research and Quality. Plan-do-study-act (PDSA) cycle. https://innovations.ahrq.gov/qualitytools/plan-do-study-act-pdsa-cycle. Updated April 10, 2013. Accessed May 13, 2020.
12. Matzke GR, McGory RW, Halstenson CE, Keane WF. Pharmacokinetics of vancomycin in patients with various degrees of renal function. Antimicrob Agents Chemother. 1984;25(4):433‐437. doi:10.1128/aac.25.4.433
13. Crass RL, Dunn R, Hong J, Krop LC, Pai MP. Dosing vancomycin in the super obese: less is more. J Antimicrob Chemother. 2018;73(11):3081‐3086. doi:10.1093/jac/dky310
14. Pai MP, Russo A, Novelli A, Venditti M, Falcone M. Simplified equations using two concentrations to calculate area under the curve for antimicrobials with concentration-dependent pharmacodynamics: daptomycin as a motivating example. Antimicrob Agents Chemother. 2014;58(6):3162‐3167. doi:10.1128/AAC.02355-14
15. Suryadevara M, Steidl KE, Probst LA, Shaw J. Inappropriate vancomycin therapeutic drug monitoring in hospitalized pediatric patients increases pediatric trauma and hospital costs. J Pediatr Pharmacol Ther. 2012;17(2):159‐165. doi:10.5863/1551-6776-17.2.159
16. Morrison AP, Melanson SE, Carty MG, Bates DW, Szumita PM, Tanasijevic MJ. What proportion of vancomycin trough levels are drawn too early?: frequency and impact on clinical actions. Am J Clin Pathol. 2012;137(3):472‐478. doi:10.1309/AJCPDSYS0DVLKFOH
17. Melanson SE, Mijailovic AS, Wright AP, Szumita PM, Bates DW, Tanasijevic MJ. An intervention to improve the timing of vancomycin levels. Am J Clin Pathol. 2013;140(6):801‐806. doi:10.1309/AJCPKQ6EAH7OYQLB
18. Meng L, Wong T, Huang S, et al. Conversion from vancomycin trough concentration-guided dosing to area under the curve-guided dosing using two sample measurements in adults: implementation at an academic medical center. Pharmacotherapy. 2019;39(4):433‐442. doi:10.1002/phar.2234
19. Stoessel AM, Hale CM, Seabury RW, Miller CD, Steele JM. The impact of AUC-based monitoring on pharmacist-directed vancomycin dose adjustments in complicated methicillin-resistant staphylococcus aureus Infection. J Pharm Pract. 2019;32(4):442‐446. doi:10.1177/0897190018764564
20. Kufel WD, Seabury RW, Mogle BT, Beccari MV, Probst LA, Steele JM. Readiness to implement vancomycin monitoring based on area under the concentration-time curve: a cross-sectional survey of a national health consortium. Am J Health Syst Pharm. 2019;76(12):889‐894. doi:10.1093/ajhp/zxz070
21. Bluestone J, Johnson P, Fullerton J, Carr C, Alderman J, BonTempo J. Effective in-service training design and delivery: evidence from an integrative literature review. Hum Resour Health. 2013;11:51. doi:10.1186/1478-4491-11-51
22. Ebben RHA, Siqeca F, Madsen UR, Vloet LCM, van Achterberg T. Effectiveness of implementation strategies for the improvement of guideline and protocol adherence in emergency care: a systematic review. BMJ Open. 2018;8(11):e017572. doi:10.1136/bmjopen-2017-017572
23. Fischer F, Lange K, Klose K, Greiner W, Kraemer A. Barriers and Strategies in Guideline Implementation-A Scoping Review. Healthcare (Basel). 2016;4(3):36. doi:10.3390/healthcare4030036
The use of weight-based dosing with trough-based monitoring of vancomycin has been in clinical practice for more than a decade. The American Society of Health-System Pharmacists (ASHP), the Infectious Diseases Society of America (IDSA), and the Society of Infectious Diseases Pharmacists (SIDP) published the first guidelines for vancomycin monitoring in 2009.1 Although it has been well established that area under the curve (AUC) over the minimal inhibitory concentration (MIC) ratio > 400 mg.h/L is the best predictor of clinical efficacy, obtaining this value in clinical practice was not pragmatic. Therefore, the 2009 guidelines recommended a goal vancomycin trough of 15 to 20 mcg/ml as a surrogate marker for AUC/MIC > 400 mg.hr/L. This has since become a common practice despite little data that support this recommendation.
The efficacy and safety of trough-based monitoring has been evaluated extensively over the past several years and more recent data suggest that there is wide patient variability in AUC with this method and higher trough levels are associated with more nephrotoxicity.2,3 ASHP, IDSA, SIDP, and the Pediatric Infectious Diseases Society (PIDS) updated the consensus guidelines in 2020.4 Trough-based monitoring is no longer recommended. Instead AUC24 monitoring should be implemented with a goal range of 400 to 600 mg.h/L for efficacy and safety. Given concerns for vancomycin penetration into the central nervous system (CNS), many facility protocols utilize higher targets (> 600 mg.h/L) for CNS infections.
Some hospitals have been utilizing AUC-based monitoring for years. There are strategies from tertiary care centers that drive this practice change in the medical literature.5,6 However, it is important to reproduce these implementation practices in small, rural facilities that may face unique challenges with limited resources and may be slower to implement consensus guidelines.7,8 As this is a major practice change, it is imperative to evaluate the extent of transition and identify areas of needed improvement.
Accurate therapeutic drug monitoring ensures both the safety and efficacy of vancomycin therapy. Unfortunately, research shows that inappropriate laboratory tests are common in medical facilities.9 Drug levels taken inappropriately can lead to delays in therapeutic decision-making, inappropriate dosage adjustments and create a need for repeated drug levels, which increases the overall cost of admission.
Given the multiple affected services needed to make successful practice transitions, it is paramount that facilities evaluate progress during the transition phase. The Agency for Healthcare Research and Quality and the Institute for Healthcare Improvement provide guidance in the Plan-Do-Study-Act Cycle for quality assessment and improvement of new initiatives.10,11 A gap analysis can be used as a simple tool for evaluating the transition of research into practice and to identify areas of needed improvement.
The Veterans Health Care System of the Ozarks (VHSO) in Fayetteville, Arkansas made the transition from trough-based monitoring to 2-level AUC-based monitoring on April 1, 2019. The purpose of this study was to evaluate the effectiveness of transition methods used to implement AUC-monitoring for vancomycin treated patients in a small, primary facility. A further goal of the study was to identify areas of needed improvement and education and whether the problems derived from deficiencies in knowledge and ordering (medical and pharmacy services) or execution (nursing and laboratory services).
Methods
VHSO is a 52-bed US Department of Veterans Affairs primary care hospital. The pharmacy and laboratory are staffed 24 hours each day. There is 1 clinical pharmacy specialist (CPS) available for therapeutic drug monitoring consults Monday through Friday between the hours of 7:30 AM and 4:00 PM. No partial full-time equivalent employees were added for this conversion. Pharmacy-driven vancomycin dosing and monitoring is conducted on a collaborative basis, with pharmacy managing the majority of vancomycin treated patients. Night and weekend pharmacy staff provide cross-coverage on vancomycin consultations. Laboratory orders and medication dosage adjustments fall within the CPS scope of practice. Nurses do not perform laboratory draws for therapeutic drug monitoring; this is done solely by phlebotomists. There is no infectious diseases specialist at the facility to champion antibiotic dosing initiatives.
The implementation strategy largely reflected those outlined from tertiary care centers.5,6 First, key personnel from the laboratory department met to discuss this practice change and to add vancomycin peaks to the ordering menu. A critical value was set at 40 mcg/ml. Vancomycin troughs and random levels already were orderable items. A comment field was added to all laboratory orders for further clarification. Verbiage was added to laboratory reports in the computerized medical record to assist clinicians in determining the appropriateness of the level. This was followed by an educational email to both the nursing and laboratory departments explaining the practice change and included a link to the Pharmacy Joe “Vancomycin Dosing by AUC:MIC Instead of Trough-level” podcast (www.pharmacyjoe.com episode 356).
The pharmacy department received an interactive 30-minute presentation, followed immediately by a group activity to discuss practice problems. This presentation was condensed, recorded, and emailed to all VHSO pharmacists. A shared folder contained pertinent material on AUC monitoring.
Finally, an interactive presentation was set up for hospitalists and a video teleconferencing was conducted for rotating medical residents. Both the podcast and recorded presentation were emailed to the entire medical staff with a brief introduction of the practice change. Additionally, the transition process was added as a standing item on the monthly antimicrobial stewardship meeting agenda.
The standardized pharmacokinetic model at the study facility consisted of a vancomycin volume of distribution of 0.7 mg/kg and elimination rate constant (Ke) by Matzke and colleagues for total daily dose calculations.12 Obese patients (BMI ≥ 30) undergo alternative clearance equations described by Crass and colleagues.13 Cockcroft-Gault methods using ideal body weight (or actual body weight if < ideal body weight) are used for determining creatinine clearance. In patients aged ≥ 65 years with a serum creatinine < 1.0 mg/dL, facility guidance was to round serum creatinine up to 1.0 mg/dL. Loading doses were determined on a case-by-case basis with a cap of 2,000 mg, maintenance doses were rounded to the nearest 250 mg.
Vancomycin levels typically are drawn at steady state and analyzed using the logarithmic trapezoidal rule.14 The pharmacy and medical staff were educated to provide details on timing and coordination in nursing and laboratory orders (Table 1). Two-level AUC monitoring typically is not performed in patients with acute renal failure, expected duration of therapy < 72 hours, urinary tract infections, skin and soft tissue infections, or in renal replacement therapy.5
This gap analysis consisted of a retrospective chart review of vancomycin levels ordered after the implementation of AUC-based monitoring to determine the effectiveness of the transition. Three months of data were collected between April 2019 and June 2019. Vancomycin levels were deemed either appropriate or inappropriate based on timing and type (peak, trough, or random) of the laboratory test in relation to the previously administered vancomycin dose. Appropriate peaks were drawn within 2 hours after the end of infusion and troughs at least 1 half-life after the dose or just prior to the next dose and within the same dosing interval as the peak. Tests drawn outside of the specified time range, trough-only laboratory tests, or those drawn after vancomycin had been discontinued were considered inappropriate. Peaks and troughs drawn from separate dosing intervals also were considered inappropriate. Random levels were considered appropriate only if they fit the clinical context in acute renal failure or renal replacement therapy. An effective transition was defined as ≥ 80% of all vancomycin treated patients monitored with AUC methods rather than trough-based methods.
Inclusion criteria included all vancomycin levels ordered during the study period with no exclusions. The primary endpoint was the proportion of vancomycin levels drawn appropriately. Secondary endpoints were the proportion of AUC24 calculations within therapeutic range and a stratification of reasons for inappropriate levels. Descriptive statistics were collected to describe the scope of the project. Levels drawn from various shifts were compared (ie, day, night, or weekend). Calculated AUC24 levels between 400 and 600 mg.h/L were considered therapeutic unless treating CNS infection (600-700 mg.h/L). Given the operational outcomes (rather than clinical outcomes) and no comparator group, patient specific data were not collected.
Descriptive statistics without further analysis were used to describe proportions. The goal level for compliance was set at 100%. These methods were reviewed by the VHSO Institutional Review Board and granted nonresearch status, waiving the requirement for informed consent.
Results
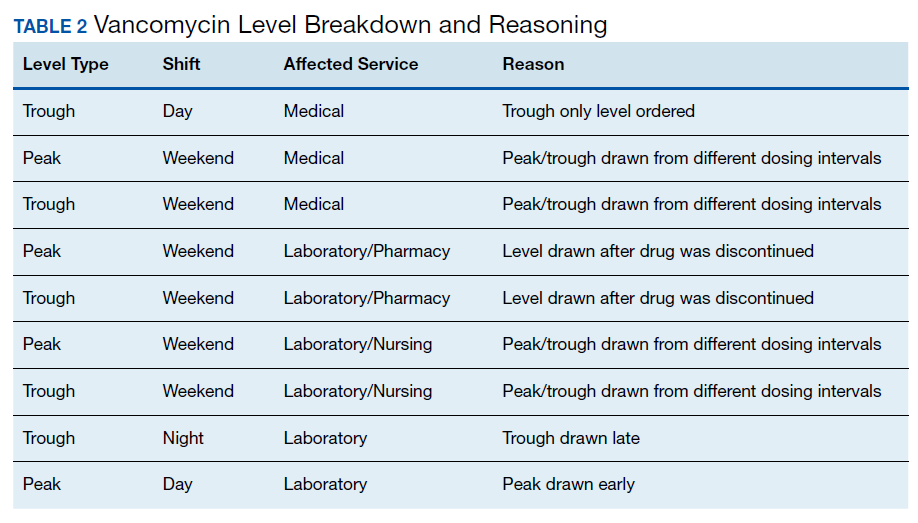
The transition was effective with 97% of all cases utilizing AUC-based methods for monitoring. A total of 65 vancomycin levels were drawn in the study period; 32 peaks, 32 troughs, and 1 random level (drawn appropriately during acute renal failure 24 hours after starting therapy). All shifts were affected proportionately; days (n = 26, 40%), nights (n = 18, 27.7%), and weekends (n = 21, 32.3%). Based on time of dosage administration and laboratory test, there were 9 levels (13.8%) deemed inappropriate, 56 levels (86.1%) were appropriate. Reasons for inappropriate levels gleaned from chart review are presented in Table 2. Four levels had to be repeated for accurate calculations.
From the peak/trough couplets drawn appropriately, calculated AUC24 fell with the desired range in 61% (n = 17) of cases. Of the 11 that fell outside of range, 8 were subtherapeutic (< 400 mg.h/L) and 3 were supratherapeutic (> 600 mg.h/L). All levels were drawn at steady state. Indications for vancomycin monitoring were osteomyelitis (n = 13, 43%), sepsis (n = 10, 33%), pneumonia (n = 6, 20%), and 1 case of meningitis (3%).
Discussion
To the author’s knowledge, this is the first report of a vancomycin AUC24 monitoring conversion in a rural facility. This study adds to the existing medical literature in that it demonstrates that: (1) implementation methods described in large, tertiary centers can be effectively utilized in primary care, rural facilities; (2) the gap analysis used can be duplicated with minimal personnel and resources to ensure effective implementation (Table 3); and (3) the reported improvement needs can serve as a model for preventative measures at other facilities. The incidence of appropriate vancomycin levels was notably better than those reported in other single center studies.15-17 However, given variations in study design and facility operating procedures, it would be difficult to compare incidence among medical facilities. As such, there are no consensus benchmarks for comparison. The majority of inappropriate levels occurred early in the study period and on weekends. Appropriateness of drug levels may have improved with continued feedback and familiarity.
The calculated AUC24 fell within predicted range in 61% of cases. For comparison, a recent study from a large academic medical center reported that 73.5% of 2-level AUC24 cases had initial values within the therapeutic range.18 Of note, the target range used was much wider (400 - 800 mg.h/L) than the present study. Another study reported dose adjustments for subtherapeutic AUC levels in 25% of cases and dose reductions for supratherapeutic levels in 33.3% of cases.19
Of the AUC24 calculations that fell outside of therapeutic range, the majority (n = 8, 73%) were subtherapeutic (< 400 mg.h/L), half of these were for patients who were obese. It was unclear in the medical record which equation was used for initial dosing (Matzke vs Crass), or whether more conservative AUCs were used for calculating the total daily dose. The VHSO policy limiting loading doses also may have played a role; indeed the updated guidelines recommend a maximum loading dose of 3,000 mg depending on the severity of infection.4 Two of the 3 supratherapeutic levels were thought to be due to accumulation with long-term therapy.
Given such a large change from long-standing practices, there was surprisingly little resistance from the various clinical services. A recent survey of academic medical centers reported that the majority (88%) of all respondents who did not currently utilize AUC24 monitoring did not plan on making this immediate transition, largely citing unfamiliarity and training requirements.20 It is conceivable that the transition to AUC monitoring in smaller facilities may have fewer barriers than those seen in tertiary care centers. There are fewer health care providers and pharmacists to educate with the primary responsibilities falling on relatively few clinicians. There is little question as to who will be conducting follow up or whom to contact for questions. A smaller patient load and lesser patient acuity may translate to fewer vancomycin cases that require monitoring.
The interactive meetings were an important element for facility implementation. Research shows that emails alone are not effective for health care provider education, and interactive methods are recommended over passive methods.21,22 Assessing and avoiding barriers up front such as unclear laboratory orders, or communication failures is paramount to successful implementation strategies.23 Additionally, the detailed written ordering communication may have contributed to a smoother transition. The educational recording proved to be helpful in educating new staff and residents. An identified logistical error was that laboratory orders entered while patients were enrolled in sham clinics for electronic workload capture (eg, Pharmacy Inpatient Clinic) created confusion on the physical location of the patient for the phlebotomists, potentially causing delays in specimen collection.
A major development that stemmed from this intervention was that the Medical Service asked that policy changes be made so that the Pharmacy Service take over all vancomycin dosing at the facility. Previously, this had been done on a collaborative basis. Similar facilities with a collaborative practice model may need to anticipate such a request as this may present a new set of challenges. Accordingly, the pharmacy department is in the process of establishing standing operating procedures, pharmacist competencies, and a facility memorandum. Future research should evaluate the safety and efficacy of vancomycin therapy after the switch to AUC-based monitoring.
Limitations
There are several limitations to consider with this study. Operating procedures and implementation processes may vary between facilities, which could limit the generalizability of these results. Given the small facility size, the overall number of laboratory tests drawn was much smaller than those seen in larger facilities. The time needed for AUC calculations is notably longer than older methods of monitoring; however, this was not objectively assessed. It is important to note that clinical outcomes were beyond the scope of this gap analysis and this is an area of future research at the study facility. Vancomycin laboratory tests that were missed due to procedures and subsequently rescheduled were occasionally observed but not accounted for in this analysis. Additionally, vancomycin courses without monitoring (appropriate or otherwise) when indicated were not assessed. However, anecdotally speaking, this would be a very unlikely occurrence.
Conclusion
Conversion to AUC-based vancomycin monitoring is feasible in primary, rural medical centers. Implementation strategies from tertiary facilities can be successfully utilized in smaller hospitals. Quality assessment strategies such as a gap analysis can be utilized with minimal resources for facility uptake of new clinical practices.
The use of weight-based dosing with trough-based monitoring of vancomycin has been in clinical practice for more than a decade. The American Society of Health-System Pharmacists (ASHP), the Infectious Diseases Society of America (IDSA), and the Society of Infectious Diseases Pharmacists (SIDP) published the first guidelines for vancomycin monitoring in 2009.1 Although it has been well established that area under the curve (AUC) over the minimal inhibitory concentration (MIC) ratio > 400 mg.h/L is the best predictor of clinical efficacy, obtaining this value in clinical practice was not pragmatic. Therefore, the 2009 guidelines recommended a goal vancomycin trough of 15 to 20 mcg/ml as a surrogate marker for AUC/MIC > 400 mg.hr/L. This has since become a common practice despite little data that support this recommendation.
The efficacy and safety of trough-based monitoring has been evaluated extensively over the past several years and more recent data suggest that there is wide patient variability in AUC with this method and higher trough levels are associated with more nephrotoxicity.2,3 ASHP, IDSA, SIDP, and the Pediatric Infectious Diseases Society (PIDS) updated the consensus guidelines in 2020.4 Trough-based monitoring is no longer recommended. Instead AUC24 monitoring should be implemented with a goal range of 400 to 600 mg.h/L for efficacy and safety. Given concerns for vancomycin penetration into the central nervous system (CNS), many facility protocols utilize higher targets (> 600 mg.h/L) for CNS infections.
Some hospitals have been utilizing AUC-based monitoring for years. There are strategies from tertiary care centers that drive this practice change in the medical literature.5,6 However, it is important to reproduce these implementation practices in small, rural facilities that may face unique challenges with limited resources and may be slower to implement consensus guidelines.7,8 As this is a major practice change, it is imperative to evaluate the extent of transition and identify areas of needed improvement.
Accurate therapeutic drug monitoring ensures both the safety and efficacy of vancomycin therapy. Unfortunately, research shows that inappropriate laboratory tests are common in medical facilities.9 Drug levels taken inappropriately can lead to delays in therapeutic decision-making, inappropriate dosage adjustments and create a need for repeated drug levels, which increases the overall cost of admission.
Given the multiple affected services needed to make successful practice transitions, it is paramount that facilities evaluate progress during the transition phase. The Agency for Healthcare Research and Quality and the Institute for Healthcare Improvement provide guidance in the Plan-Do-Study-Act Cycle for quality assessment and improvement of new initiatives.10,11 A gap analysis can be used as a simple tool for evaluating the transition of research into practice and to identify areas of needed improvement.
The Veterans Health Care System of the Ozarks (VHSO) in Fayetteville, Arkansas made the transition from trough-based monitoring to 2-level AUC-based monitoring on April 1, 2019. The purpose of this study was to evaluate the effectiveness of transition methods used to implement AUC-monitoring for vancomycin treated patients in a small, primary facility. A further goal of the study was to identify areas of needed improvement and education and whether the problems derived from deficiencies in knowledge and ordering (medical and pharmacy services) or execution (nursing and laboratory services).
Methods
VHSO is a 52-bed US Department of Veterans Affairs primary care hospital. The pharmacy and laboratory are staffed 24 hours each day. There is 1 clinical pharmacy specialist (CPS) available for therapeutic drug monitoring consults Monday through Friday between the hours of 7:30 AM and 4:00 PM. No partial full-time equivalent employees were added for this conversion. Pharmacy-driven vancomycin dosing and monitoring is conducted on a collaborative basis, with pharmacy managing the majority of vancomycin treated patients. Night and weekend pharmacy staff provide cross-coverage on vancomycin consultations. Laboratory orders and medication dosage adjustments fall within the CPS scope of practice. Nurses do not perform laboratory draws for therapeutic drug monitoring; this is done solely by phlebotomists. There is no infectious diseases specialist at the facility to champion antibiotic dosing initiatives.
The implementation strategy largely reflected those outlined from tertiary care centers.5,6 First, key personnel from the laboratory department met to discuss this practice change and to add vancomycin peaks to the ordering menu. A critical value was set at 40 mcg/ml. Vancomycin troughs and random levels already were orderable items. A comment field was added to all laboratory orders for further clarification. Verbiage was added to laboratory reports in the computerized medical record to assist clinicians in determining the appropriateness of the level. This was followed by an educational email to both the nursing and laboratory departments explaining the practice change and included a link to the Pharmacy Joe “Vancomycin Dosing by AUC:MIC Instead of Trough-level” podcast (www.pharmacyjoe.com episode 356).
The pharmacy department received an interactive 30-minute presentation, followed immediately by a group activity to discuss practice problems. This presentation was condensed, recorded, and emailed to all VHSO pharmacists. A shared folder contained pertinent material on AUC monitoring.
Finally, an interactive presentation was set up for hospitalists and a video teleconferencing was conducted for rotating medical residents. Both the podcast and recorded presentation were emailed to the entire medical staff with a brief introduction of the practice change. Additionally, the transition process was added as a standing item on the monthly antimicrobial stewardship meeting agenda.
The standardized pharmacokinetic model at the study facility consisted of a vancomycin volume of distribution of 0.7 mg/kg and elimination rate constant (Ke) by Matzke and colleagues for total daily dose calculations.12 Obese patients (BMI ≥ 30) undergo alternative clearance equations described by Crass and colleagues.13 Cockcroft-Gault methods using ideal body weight (or actual body weight if < ideal body weight) are used for determining creatinine clearance. In patients aged ≥ 65 years with a serum creatinine < 1.0 mg/dL, facility guidance was to round serum creatinine up to 1.0 mg/dL. Loading doses were determined on a case-by-case basis with a cap of 2,000 mg, maintenance doses were rounded to the nearest 250 mg.
Vancomycin levels typically are drawn at steady state and analyzed using the logarithmic trapezoidal rule.14 The pharmacy and medical staff were educated to provide details on timing and coordination in nursing and laboratory orders (Table 1). Two-level AUC monitoring typically is not performed in patients with acute renal failure, expected duration of therapy < 72 hours, urinary tract infections, skin and soft tissue infections, or in renal replacement therapy.5
This gap analysis consisted of a retrospective chart review of vancomycin levels ordered after the implementation of AUC-based monitoring to determine the effectiveness of the transition. Three months of data were collected between April 2019 and June 2019. Vancomycin levels were deemed either appropriate or inappropriate based on timing and type (peak, trough, or random) of the laboratory test in relation to the previously administered vancomycin dose. Appropriate peaks were drawn within 2 hours after the end of infusion and troughs at least 1 half-life after the dose or just prior to the next dose and within the same dosing interval as the peak. Tests drawn outside of the specified time range, trough-only laboratory tests, or those drawn after vancomycin had been discontinued were considered inappropriate. Peaks and troughs drawn from separate dosing intervals also were considered inappropriate. Random levels were considered appropriate only if they fit the clinical context in acute renal failure or renal replacement therapy. An effective transition was defined as ≥ 80% of all vancomycin treated patients monitored with AUC methods rather than trough-based methods.
Inclusion criteria included all vancomycin levels ordered during the study period with no exclusions. The primary endpoint was the proportion of vancomycin levels drawn appropriately. Secondary endpoints were the proportion of AUC24 calculations within therapeutic range and a stratification of reasons for inappropriate levels. Descriptive statistics were collected to describe the scope of the project. Levels drawn from various shifts were compared (ie, day, night, or weekend). Calculated AUC24 levels between 400 and 600 mg.h/L were considered therapeutic unless treating CNS infection (600-700 mg.h/L). Given the operational outcomes (rather than clinical outcomes) and no comparator group, patient specific data were not collected.
Descriptive statistics without further analysis were used to describe proportions. The goal level for compliance was set at 100%. These methods were reviewed by the VHSO Institutional Review Board and granted nonresearch status, waiving the requirement for informed consent.
Results
The transition was effective with 97% of all cases utilizing AUC-based methods for monitoring. A total of 65 vancomycin levels were drawn in the study period; 32 peaks, 32 troughs, and 1 random level (drawn appropriately during acute renal failure 24 hours after starting therapy). All shifts were affected proportionately; days (n = 26, 40%), nights (n = 18, 27.7%), and weekends (n = 21, 32.3%). Based on time of dosage administration and laboratory test, there were 9 levels (13.8%) deemed inappropriate, 56 levels (86.1%) were appropriate. Reasons for inappropriate levels gleaned from chart review are presented in Table 2. Four levels had to be repeated for accurate calculations.
From the peak/trough couplets drawn appropriately, calculated AUC24 fell with the desired range in 61% (n = 17) of cases. Of the 11 that fell outside of range, 8 were subtherapeutic (< 400 mg.h/L) and 3 were supratherapeutic (> 600 mg.h/L). All levels were drawn at steady state. Indications for vancomycin monitoring were osteomyelitis (n = 13, 43%), sepsis (n = 10, 33%), pneumonia (n = 6, 20%), and 1 case of meningitis (3%).
Discussion
To the author’s knowledge, this is the first report of a vancomycin AUC24 monitoring conversion in a rural facility. This study adds to the existing medical literature in that it demonstrates that: (1) implementation methods described in large, tertiary centers can be effectively utilized in primary care, rural facilities; (2) the gap analysis used can be duplicated with minimal personnel and resources to ensure effective implementation (Table 3); and (3) the reported improvement needs can serve as a model for preventative measures at other facilities. The incidence of appropriate vancomycin levels was notably better than those reported in other single center studies.15-17 However, given variations in study design and facility operating procedures, it would be difficult to compare incidence among medical facilities. As such, there are no consensus benchmarks for comparison. The majority of inappropriate levels occurred early in the study period and on weekends. Appropriateness of drug levels may have improved with continued feedback and familiarity.
The calculated AUC24 fell within predicted range in 61% of cases. For comparison, a recent study from a large academic medical center reported that 73.5% of 2-level AUC24 cases had initial values within the therapeutic range.18 Of note, the target range used was much wider (400 - 800 mg.h/L) than the present study. Another study reported dose adjustments for subtherapeutic AUC levels in 25% of cases and dose reductions for supratherapeutic levels in 33.3% of cases.19
Of the AUC24 calculations that fell outside of therapeutic range, the majority (n = 8, 73%) were subtherapeutic (< 400 mg.h/L), half of these were for patients who were obese. It was unclear in the medical record which equation was used for initial dosing (Matzke vs Crass), or whether more conservative AUCs were used for calculating the total daily dose. The VHSO policy limiting loading doses also may have played a role; indeed the updated guidelines recommend a maximum loading dose of 3,000 mg depending on the severity of infection.4 Two of the 3 supratherapeutic levels were thought to be due to accumulation with long-term therapy.
Given such a large change from long-standing practices, there was surprisingly little resistance from the various clinical services. A recent survey of academic medical centers reported that the majority (88%) of all respondents who did not currently utilize AUC24 monitoring did not plan on making this immediate transition, largely citing unfamiliarity and training requirements.20 It is conceivable that the transition to AUC monitoring in smaller facilities may have fewer barriers than those seen in tertiary care centers. There are fewer health care providers and pharmacists to educate with the primary responsibilities falling on relatively few clinicians. There is little question as to who will be conducting follow up or whom to contact for questions. A smaller patient load and lesser patient acuity may translate to fewer vancomycin cases that require monitoring.
The interactive meetings were an important element for facility implementation. Research shows that emails alone are not effective for health care provider education, and interactive methods are recommended over passive methods.21,22 Assessing and avoiding barriers up front such as unclear laboratory orders, or communication failures is paramount to successful implementation strategies.23 Additionally, the detailed written ordering communication may have contributed to a smoother transition. The educational recording proved to be helpful in educating new staff and residents. An identified logistical error was that laboratory orders entered while patients were enrolled in sham clinics for electronic workload capture (eg, Pharmacy Inpatient Clinic) created confusion on the physical location of the patient for the phlebotomists, potentially causing delays in specimen collection.
A major development that stemmed from this intervention was that the Medical Service asked that policy changes be made so that the Pharmacy Service take over all vancomycin dosing at the facility. Previously, this had been done on a collaborative basis. Similar facilities with a collaborative practice model may need to anticipate such a request as this may present a new set of challenges. Accordingly, the pharmacy department is in the process of establishing standing operating procedures, pharmacist competencies, and a facility memorandum. Future research should evaluate the safety and efficacy of vancomycin therapy after the switch to AUC-based monitoring.
Limitations
There are several limitations to consider with this study. Operating procedures and implementation processes may vary between facilities, which could limit the generalizability of these results. Given the small facility size, the overall number of laboratory tests drawn was much smaller than those seen in larger facilities. The time needed for AUC calculations is notably longer than older methods of monitoring; however, this was not objectively assessed. It is important to note that clinical outcomes were beyond the scope of this gap analysis and this is an area of future research at the study facility. Vancomycin laboratory tests that were missed due to procedures and subsequently rescheduled were occasionally observed but not accounted for in this analysis. Additionally, vancomycin courses without monitoring (appropriate or otherwise) when indicated were not assessed. However, anecdotally speaking, this would be a very unlikely occurrence.
Conclusion
Conversion to AUC-based vancomycin monitoring is feasible in primary, rural medical centers. Implementation strategies from tertiary facilities can be successfully utilized in smaller hospitals. Quality assessment strategies such as a gap analysis can be utilized with minimal resources for facility uptake of new clinical practices.
1. Rybak M, Lomaestro B, Rotschafer JC, et al. Therapeutic monitoring of vancomycin in adult patients: a consensus review of the American Society of Health-System Pharmacists, the Infectious Diseases Society of America, and the Society of Infectious Diseases Pharmacists [published correction appears in Am J Health Syst Pharm. 2009;66(10):887]. Am J Health Syst Pharm. 2009;66(1):82‐98. doi:10.2146/ajhp080434
2. van Hal SJ, Paterson DL, Lodise TP. Systematic review and meta-analysis of vancomycin-induced nephrotoxicity associated with dosing schedules that maintain troughs between 15 and 20 milligrams per liter. Antimicrob Agents Chemother. 2013;57(2):734‐744. doi:10.1128/AAC.01568-12
3. Pai MP, Neely M, Rodvold KA, Lodise TP. Innovative approaches to optimizing the delivery of vancomycin in individual patients. Adv Drug Deliv Rev. 2014;77:50‐57. doi:10.1016/j.addr.2014.05.016
4. Rybak MJ, Le J, Lodise TP, et al. Therapeutic monitoring of vancomycin for serious methicillin-resistant Staphylococcus aureus infections: a revised consensus guideline and review by the American Society of Health-System Pharmacists, the Infectious Diseases Society of America, the Pediatric Infectious Diseases Society, and the Society of Infectious Diseases Pharmacists [published online ahead of print, 2020 Mar 19]. Am J Health Syst Pharm. 2020;zxaa036. doi:10.1093/ajhp/zxaa036
5. Heil EL, Claeys KC, Mynatt RP, et al. Making the change to area under the curve-based vancomycin dosing. Am J Health Syst Pharm. 2018;75(24):1986‐1995. doi:10.2146/ajhp180034
6. Gregory ER, Burgess DR, Cotner SE, et al. Vancomycin area under the curve dosing and monitoring at an academic medical center: transition strategies and lessons learned [published online ahead of print, 2019 Mar 10]. J Pharm Pract. 2019;897190019834369. doi:10.1177/0897190019834369
7. Septimus EJ, Owens RC Jr. Need and potential of antimicrobial stewardship in community hospitals. Clin Infect Dis. 2011;53 Suppl 1:S8‐S14. doi:10.1093/cid/cir363
8. Goldman LE, Dudley RA. United States rural hospital quality in the Hospital Compare database-accounting for hospital characteristics. Health Policy. 2008;87(1):112‐127. doi:10.1016/j.healthpol.2008.02.002
9. Zhi M, Ding EL, Theisen-Toupal J, Whelan J, Arnaout R. The landscape of inappropriate laboratory testing: a 15-year meta-analysis. PLoS One. 2013;8(11):e78962. doi:10.1371/journal.pone.0078962
10. Institute for Healthcare Improvement. Plan-do-study-act (PDSA) worksheet. http://www.ihi.org/resources/Pages/Tools/PlanDoStudyActWorksheet.aspx. Accessed May 13, 2020.
11. Agency for Healthcare Research and Quality. Plan-do-study-act (PDSA) cycle. https://innovations.ahrq.gov/qualitytools/plan-do-study-act-pdsa-cycle. Updated April 10, 2013. Accessed May 13, 2020.
12. Matzke GR, McGory RW, Halstenson CE, Keane WF. Pharmacokinetics of vancomycin in patients with various degrees of renal function. Antimicrob Agents Chemother. 1984;25(4):433‐437. doi:10.1128/aac.25.4.433
13. Crass RL, Dunn R, Hong J, Krop LC, Pai MP. Dosing vancomycin in the super obese: less is more. J Antimicrob Chemother. 2018;73(11):3081‐3086. doi:10.1093/jac/dky310
14. Pai MP, Russo A, Novelli A, Venditti M, Falcone M. Simplified equations using two concentrations to calculate area under the curve for antimicrobials with concentration-dependent pharmacodynamics: daptomycin as a motivating example. Antimicrob Agents Chemother. 2014;58(6):3162‐3167. doi:10.1128/AAC.02355-14
15. Suryadevara M, Steidl KE, Probst LA, Shaw J. Inappropriate vancomycin therapeutic drug monitoring in hospitalized pediatric patients increases pediatric trauma and hospital costs. J Pediatr Pharmacol Ther. 2012;17(2):159‐165. doi:10.5863/1551-6776-17.2.159
16. Morrison AP, Melanson SE, Carty MG, Bates DW, Szumita PM, Tanasijevic MJ. What proportion of vancomycin trough levels are drawn too early?: frequency and impact on clinical actions. Am J Clin Pathol. 2012;137(3):472‐478. doi:10.1309/AJCPDSYS0DVLKFOH
17. Melanson SE, Mijailovic AS, Wright AP, Szumita PM, Bates DW, Tanasijevic MJ. An intervention to improve the timing of vancomycin levels. Am J Clin Pathol. 2013;140(6):801‐806. doi:10.1309/AJCPKQ6EAH7OYQLB
18. Meng L, Wong T, Huang S, et al. Conversion from vancomycin trough concentration-guided dosing to area under the curve-guided dosing using two sample measurements in adults: implementation at an academic medical center. Pharmacotherapy. 2019;39(4):433‐442. doi:10.1002/phar.2234
19. Stoessel AM, Hale CM, Seabury RW, Miller CD, Steele JM. The impact of AUC-based monitoring on pharmacist-directed vancomycin dose adjustments in complicated methicillin-resistant staphylococcus aureus Infection. J Pharm Pract. 2019;32(4):442‐446. doi:10.1177/0897190018764564
20. Kufel WD, Seabury RW, Mogle BT, Beccari MV, Probst LA, Steele JM. Readiness to implement vancomycin monitoring based on area under the concentration-time curve: a cross-sectional survey of a national health consortium. Am J Health Syst Pharm. 2019;76(12):889‐894. doi:10.1093/ajhp/zxz070
21. Bluestone J, Johnson P, Fullerton J, Carr C, Alderman J, BonTempo J. Effective in-service training design and delivery: evidence from an integrative literature review. Hum Resour Health. 2013;11:51. doi:10.1186/1478-4491-11-51
22. Ebben RHA, Siqeca F, Madsen UR, Vloet LCM, van Achterberg T. Effectiveness of implementation strategies for the improvement of guideline and protocol adherence in emergency care: a systematic review. BMJ Open. 2018;8(11):e017572. doi:10.1136/bmjopen-2017-017572
23. Fischer F, Lange K, Klose K, Greiner W, Kraemer A. Barriers and Strategies in Guideline Implementation-A Scoping Review. Healthcare (Basel). 2016;4(3):36. doi:10.3390/healthcare4030036
1. Rybak M, Lomaestro B, Rotschafer JC, et al. Therapeutic monitoring of vancomycin in adult patients: a consensus review of the American Society of Health-System Pharmacists, the Infectious Diseases Society of America, and the Society of Infectious Diseases Pharmacists [published correction appears in Am J Health Syst Pharm. 2009;66(10):887]. Am J Health Syst Pharm. 2009;66(1):82‐98. doi:10.2146/ajhp080434
2. van Hal SJ, Paterson DL, Lodise TP. Systematic review and meta-analysis of vancomycin-induced nephrotoxicity associated with dosing schedules that maintain troughs between 15 and 20 milligrams per liter. Antimicrob Agents Chemother. 2013;57(2):734‐744. doi:10.1128/AAC.01568-12
3. Pai MP, Neely M, Rodvold KA, Lodise TP. Innovative approaches to optimizing the delivery of vancomycin in individual patients. Adv Drug Deliv Rev. 2014;77:50‐57. doi:10.1016/j.addr.2014.05.016
4. Rybak MJ, Le J, Lodise TP, et al. Therapeutic monitoring of vancomycin for serious methicillin-resistant Staphylococcus aureus infections: a revised consensus guideline and review by the American Society of Health-System Pharmacists, the Infectious Diseases Society of America, the Pediatric Infectious Diseases Society, and the Society of Infectious Diseases Pharmacists [published online ahead of print, 2020 Mar 19]. Am J Health Syst Pharm. 2020;zxaa036. doi:10.1093/ajhp/zxaa036
5. Heil EL, Claeys KC, Mynatt RP, et al. Making the change to area under the curve-based vancomycin dosing. Am J Health Syst Pharm. 2018;75(24):1986‐1995. doi:10.2146/ajhp180034
6. Gregory ER, Burgess DR, Cotner SE, et al. Vancomycin area under the curve dosing and monitoring at an academic medical center: transition strategies and lessons learned [published online ahead of print, 2019 Mar 10]. J Pharm Pract. 2019;897190019834369. doi:10.1177/0897190019834369
7. Septimus EJ, Owens RC Jr. Need and potential of antimicrobial stewardship in community hospitals. Clin Infect Dis. 2011;53 Suppl 1:S8‐S14. doi:10.1093/cid/cir363
8. Goldman LE, Dudley RA. United States rural hospital quality in the Hospital Compare database-accounting for hospital characteristics. Health Policy. 2008;87(1):112‐127. doi:10.1016/j.healthpol.2008.02.002
9. Zhi M, Ding EL, Theisen-Toupal J, Whelan J, Arnaout R. The landscape of inappropriate laboratory testing: a 15-year meta-analysis. PLoS One. 2013;8(11):e78962. doi:10.1371/journal.pone.0078962
10. Institute for Healthcare Improvement. Plan-do-study-act (PDSA) worksheet. http://www.ihi.org/resources/Pages/Tools/PlanDoStudyActWorksheet.aspx. Accessed May 13, 2020.
11. Agency for Healthcare Research and Quality. Plan-do-study-act (PDSA) cycle. https://innovations.ahrq.gov/qualitytools/plan-do-study-act-pdsa-cycle. Updated April 10, 2013. Accessed May 13, 2020.
12. Matzke GR, McGory RW, Halstenson CE, Keane WF. Pharmacokinetics of vancomycin in patients with various degrees of renal function. Antimicrob Agents Chemother. 1984;25(4):433‐437. doi:10.1128/aac.25.4.433
13. Crass RL, Dunn R, Hong J, Krop LC, Pai MP. Dosing vancomycin in the super obese: less is more. J Antimicrob Chemother. 2018;73(11):3081‐3086. doi:10.1093/jac/dky310
14. Pai MP, Russo A, Novelli A, Venditti M, Falcone M. Simplified equations using two concentrations to calculate area under the curve for antimicrobials with concentration-dependent pharmacodynamics: daptomycin as a motivating example. Antimicrob Agents Chemother. 2014;58(6):3162‐3167. doi:10.1128/AAC.02355-14
15. Suryadevara M, Steidl KE, Probst LA, Shaw J. Inappropriate vancomycin therapeutic drug monitoring in hospitalized pediatric patients increases pediatric trauma and hospital costs. J Pediatr Pharmacol Ther. 2012;17(2):159‐165. doi:10.5863/1551-6776-17.2.159
16. Morrison AP, Melanson SE, Carty MG, Bates DW, Szumita PM, Tanasijevic MJ. What proportion of vancomycin trough levels are drawn too early?: frequency and impact on clinical actions. Am J Clin Pathol. 2012;137(3):472‐478. doi:10.1309/AJCPDSYS0DVLKFOH
17. Melanson SE, Mijailovic AS, Wright AP, Szumita PM, Bates DW, Tanasijevic MJ. An intervention to improve the timing of vancomycin levels. Am J Clin Pathol. 2013;140(6):801‐806. doi:10.1309/AJCPKQ6EAH7OYQLB
18. Meng L, Wong T, Huang S, et al. Conversion from vancomycin trough concentration-guided dosing to area under the curve-guided dosing using two sample measurements in adults: implementation at an academic medical center. Pharmacotherapy. 2019;39(4):433‐442. doi:10.1002/phar.2234
19. Stoessel AM, Hale CM, Seabury RW, Miller CD, Steele JM. The impact of AUC-based monitoring on pharmacist-directed vancomycin dose adjustments in complicated methicillin-resistant staphylococcus aureus Infection. J Pharm Pract. 2019;32(4):442‐446. doi:10.1177/0897190018764564
20. Kufel WD, Seabury RW, Mogle BT, Beccari MV, Probst LA, Steele JM. Readiness to implement vancomycin monitoring based on area under the concentration-time curve: a cross-sectional survey of a national health consortium. Am J Health Syst Pharm. 2019;76(12):889‐894. doi:10.1093/ajhp/zxz070
21. Bluestone J, Johnson P, Fullerton J, Carr C, Alderman J, BonTempo J. Effective in-service training design and delivery: evidence from an integrative literature review. Hum Resour Health. 2013;11:51. doi:10.1186/1478-4491-11-51
22. Ebben RHA, Siqeca F, Madsen UR, Vloet LCM, van Achterberg T. Effectiveness of implementation strategies for the improvement of guideline and protocol adherence in emergency care: a systematic review. BMJ Open. 2018;8(11):e017572. doi:10.1136/bmjopen-2017-017572
23. Fischer F, Lange K, Klose K, Greiner W, Kraemer A. Barriers and Strategies in Guideline Implementation-A Scoping Review. Healthcare (Basel). 2016;4(3):36. doi:10.3390/healthcare4030036
Open Clinical Trials for Patients With COVID-19
Finding effective treatment or a vaccine for COVID-19, the disease caused by the severe acute respiratory syndrome coronavirus 2 (SARS-CoV-2), has placed significant strains on the global health care system. The National Library of Medicine database lists > 1,800 trials that are aimed at addressing COVID-19-related health care. Already, trials developed by the US Department of Veterans Affairs (VA), US Department of Defense (DoD), and the National Institute of Allergy and Infectious Diseases have provided important data on effective treatment options. The clinical trials listed below are all open as of May 31, 2020 and have trial sites at VA and DoD facilities. For additional information and full inclusion/exclusion criteria, please consult clinicaltrials.gov.
Adaptive COVID-19 Treatment Trial (ACTT)
This study is an adaptive, randomized, double-blind, placebo-controlled trial to evaluate the safety and efficacy of novel therapeutic agents in hospitalized adults diagnosed with COVID-19. The study will compare different investigational therapeutic agents to a control arm. ID: NCT04280705
Sponsor: National Institute of Allergy and Infectious Diseases
Contact: Central Contact ([email protected])
Locations: VA Palo Alto Health Care System, California; Naval Medical Center San Diego, California; Southeast Louisiana Veterans Health Care System, New Orleans; Walter Reed National Military Medical Center, Bethesda, Maryland; National Institutes of Health - Clinical Center, National Institute of Allergy and Infectious Diseases Laboratory Of Immunoregulation, Bethesda, Maryland; Brooke Army Medical Center, Fort Sam Houston, Texas; Madigan Army Medical Center, Tacoma, Washington
Study to Evaluate the Safety and Antiviral Activity of Remdesivir (GS-5734) in Participants With Severe Coronavirus Disease (COVID-19)
The primary objective of this study is to evaluate the efficacy of 2 remdesivir (RDV) regimens with respect to clinical status assessed by a 7-point ordinal scale on Day 11 (NCT04292730) or Day 14 (NCT04292899).
ID: NCT04292730/NCT04292899
Sponsor: Gilead Sciences
Contact: Gilead Clinical Study Information Center (833-445-3230)
Location: James J. Peters VA Medical Center, Bronx, New York
Expanded Access Remdesivir (RDV; GS-5734)
The treatment of communicable Novel Coronavirus of 2019 with Remdesivir (RDV; GS-5734) also known as severe acute respiratory syndrome coronavirus 2.
ID: NCT04302766
Sponsor: US Army Medical Research and Development Command
Contact: Sandi Parriott ([email protected])
A Study to Evaluate the Safety and Efficacy of Tocilizumab in Patients With Severe COVID-19 Pneumonia (COVACTA)
This study will evaluate the efficacy, safety, pharmacodynamics, and pharmacokinetics of tocilizumab (TCZ) compared with a matching placebo in combination with standard of care (SOC) in hospitalized patients with severe COVID-19 pneumonia.
ID: NCT04320615
Sponsor: Hoffmann-La Roche
Location: James J Peters VA Medical Center, Bronx, New York
Administration of Intravenous Vitamin C in Novel Coronavirus Infection (COVID-19) and Decreased Oxygenation (AVoCaDO)
Previous research has shown that high dose intravenous vitamin C (HDIVC) may benefit patients with sepsis, acute lung injury (ALI), and the acute respiratory distress syndrome (ARDS). However, it is not known if early administration of HDIVC could prevent progression to ARDS. We hypothesize that HDIVC is safe and tolerable in COVID-19 subjects given early or late in the disease course and may reduce the risk of respiratory failure requiring mechanical ventilation and development of ARDS along with reductions in supplemental oxygen demand and inflammatory markers.
ID: NCT04357782
Sponsor: Hunter Holmes Mcguire VA Medical CenterContact: Brian Davis ([email protected])
Location: Hunter Holmes Mcguire VA Medical Center, Richmond, Virginia
Treatment Of CORONAVIRUS DISEASE 2019 (COVID-19) With Anti-Sars-CoV-2 Convalescent Plasma (ASCoV2CP)
This is an expanded access open-label, single-arm, multi-site protocol to provide convalescent plasma as a treatment for patients diagnosed with severe, or life-threatening COVID-19.
ID: NCT04360486
Sponsor: US Army Medical Research and Development Command
Contact: Andrew Cap ([email protected])
VA Remote and Equitable Access to COVID-19 Healthcare Delivery (VA-REACH TRIAL) (VA-REACH)
We propose a 3-arm randomized control trial to determine the efficacy of hydroxychloroquine or azithromycin in treating mild to moderate COVID-19 among veterans in the outpatient setting.
ID: NCT04363203
Sponsor: Salomeh Keyhani
Location: San Francisco VA Health Care System, California
A Study to Evaluate the Safety and Efficacy of MSTT1041A (Astegolimab) or UTTR1147A in Patients With Severe COVID-19 Pneumonia (COVASTIL)
This is a Phase II, randomized, double-blind, placebo-controlled, multicenter study to assess the efficacy and safety of MSTT1041A (astegolimab) or UTTR1147A in combination with standard of care (SOC) compared with matching placebo in combination with SOC in patients hospitalized with severe coronavirus disease 2019 (COVID-19) pneumonia.
ID: NCT04386616
Sponsor: Genentech
Contact: Study ID Number: GA42469 ([email protected])
Location: Southeast Louisiana Veterans Health Care System, New Orleans
Hormonal Intervention for the Treatment in Veterans With COVID-19 Requiring Hospitalization (HITCH)
The purpose of this study is to determine if temporary androgen suppression improves the clinical outcomes of veterans who are hospitalized to an acute care ward due to COVID-19.ID: NCT04397718
Sponsor: VA Office of Research and Development
Contact: Matthew B Rettig ([email protected]), Nicholas Nickols ([email protected])
Locations: VA Greater Los Angeles Healthcare System, California; VA NY Harbor Healthcare System, New York; VA Puget Sound Health Care System, Seattle, Washington
Adaptive COVID-19 Treatment Trial 2 (ACTT-II)
ACTT-II will evaluate the combination of baricitinib and remdesivir compared to remdesivir alone. Subjects will be assessed daily while hospitalized. If the subjects are discharged from the hospital, they will have a study visit at Days 15, 22, and 29.
ID: NCT04401579
Sponsor: National Institute of Allergy and Infectious Diseases (NIAID)
Contact: Central Contact ([email protected])
Locations: VA Palo Alto Health Care System, California; Naval Medical Center San Diego, California; Rocky Mountain Regional Veteran Affairs Medical Center, Aurora, Colorado; Southeast Louisiana Veterans Health Care System, New Orleans; Walter Reed National Military Medical Center, Bethesda, Maryland; National Institutes of Health - Clinical Center, National Institute of Allergy and Infectious Diseases Laboratory Of Immunoregulation, Bethesda, Maryland; Brooke Army Medical Center, Fort Sam Houston, Texas; Madigan Army Medical Center, Tacoma, Washington
Finding effective treatment or a vaccine for COVID-19, the disease caused by the severe acute respiratory syndrome coronavirus 2 (SARS-CoV-2), has placed significant strains on the global health care system. The National Library of Medicine database lists > 1,800 trials that are aimed at addressing COVID-19-related health care. Already, trials developed by the US Department of Veterans Affairs (VA), US Department of Defense (DoD), and the National Institute of Allergy and Infectious Diseases have provided important data on effective treatment options. The clinical trials listed below are all open as of May 31, 2020 and have trial sites at VA and DoD facilities. For additional information and full inclusion/exclusion criteria, please consult clinicaltrials.gov.
Adaptive COVID-19 Treatment Trial (ACTT)
This study is an adaptive, randomized, double-blind, placebo-controlled trial to evaluate the safety and efficacy of novel therapeutic agents in hospitalized adults diagnosed with COVID-19. The study will compare different investigational therapeutic agents to a control arm. ID: NCT04280705
Sponsor: National Institute of Allergy and Infectious Diseases
Contact: Central Contact ([email protected])
Locations: VA Palo Alto Health Care System, California; Naval Medical Center San Diego, California; Southeast Louisiana Veterans Health Care System, New Orleans; Walter Reed National Military Medical Center, Bethesda, Maryland; National Institutes of Health - Clinical Center, National Institute of Allergy and Infectious Diseases Laboratory Of Immunoregulation, Bethesda, Maryland; Brooke Army Medical Center, Fort Sam Houston, Texas; Madigan Army Medical Center, Tacoma, Washington
Study to Evaluate the Safety and Antiviral Activity of Remdesivir (GS-5734) in Participants With Severe Coronavirus Disease (COVID-19)
The primary objective of this study is to evaluate the efficacy of 2 remdesivir (RDV) regimens with respect to clinical status assessed by a 7-point ordinal scale on Day 11 (NCT04292730) or Day 14 (NCT04292899).
ID: NCT04292730/NCT04292899
Sponsor: Gilead Sciences
Contact: Gilead Clinical Study Information Center (833-445-3230)
Location: James J. Peters VA Medical Center, Bronx, New York
Expanded Access Remdesivir (RDV; GS-5734)
The treatment of communicable Novel Coronavirus of 2019 with Remdesivir (RDV; GS-5734) also known as severe acute respiratory syndrome coronavirus 2.
ID: NCT04302766
Sponsor: US Army Medical Research and Development Command
Contact: Sandi Parriott ([email protected])
A Study to Evaluate the Safety and Efficacy of Tocilizumab in Patients With Severe COVID-19 Pneumonia (COVACTA)
This study will evaluate the efficacy, safety, pharmacodynamics, and pharmacokinetics of tocilizumab (TCZ) compared with a matching placebo in combination with standard of care (SOC) in hospitalized patients with severe COVID-19 pneumonia.
ID: NCT04320615
Sponsor: Hoffmann-La Roche
Location: James J Peters VA Medical Center, Bronx, New York
Administration of Intravenous Vitamin C in Novel Coronavirus Infection (COVID-19) and Decreased Oxygenation (AVoCaDO)
Previous research has shown that high dose intravenous vitamin C (HDIVC) may benefit patients with sepsis, acute lung injury (ALI), and the acute respiratory distress syndrome (ARDS). However, it is not known if early administration of HDIVC could prevent progression to ARDS. We hypothesize that HDIVC is safe and tolerable in COVID-19 subjects given early or late in the disease course and may reduce the risk of respiratory failure requiring mechanical ventilation and development of ARDS along with reductions in supplemental oxygen demand and inflammatory markers.
ID: NCT04357782
Sponsor: Hunter Holmes Mcguire VA Medical CenterContact: Brian Davis ([email protected])
Location: Hunter Holmes Mcguire VA Medical Center, Richmond, Virginia
Treatment Of CORONAVIRUS DISEASE 2019 (COVID-19) With Anti-Sars-CoV-2 Convalescent Plasma (ASCoV2CP)
This is an expanded access open-label, single-arm, multi-site protocol to provide convalescent plasma as a treatment for patients diagnosed with severe, or life-threatening COVID-19.
ID: NCT04360486
Sponsor: US Army Medical Research and Development Command
Contact: Andrew Cap ([email protected])
VA Remote and Equitable Access to COVID-19 Healthcare Delivery (VA-REACH TRIAL) (VA-REACH)
We propose a 3-arm randomized control trial to determine the efficacy of hydroxychloroquine or azithromycin in treating mild to moderate COVID-19 among veterans in the outpatient setting.
ID: NCT04363203
Sponsor: Salomeh Keyhani
Location: San Francisco VA Health Care System, California
A Study to Evaluate the Safety and Efficacy of MSTT1041A (Astegolimab) or UTTR1147A in Patients With Severe COVID-19 Pneumonia (COVASTIL)
This is a Phase II, randomized, double-blind, placebo-controlled, multicenter study to assess the efficacy and safety of MSTT1041A (astegolimab) or UTTR1147A in combination with standard of care (SOC) compared with matching placebo in combination with SOC in patients hospitalized with severe coronavirus disease 2019 (COVID-19) pneumonia.
ID: NCT04386616
Sponsor: Genentech
Contact: Study ID Number: GA42469 ([email protected])
Location: Southeast Louisiana Veterans Health Care System, New Orleans
Hormonal Intervention for the Treatment in Veterans With COVID-19 Requiring Hospitalization (HITCH)
The purpose of this study is to determine if temporary androgen suppression improves the clinical outcomes of veterans who are hospitalized to an acute care ward due to COVID-19.ID: NCT04397718
Sponsor: VA Office of Research and Development
Contact: Matthew B Rettig ([email protected]), Nicholas Nickols ([email protected])
Locations: VA Greater Los Angeles Healthcare System, California; VA NY Harbor Healthcare System, New York; VA Puget Sound Health Care System, Seattle, Washington
Adaptive COVID-19 Treatment Trial 2 (ACTT-II)
ACTT-II will evaluate the combination of baricitinib and remdesivir compared to remdesivir alone. Subjects will be assessed daily while hospitalized. If the subjects are discharged from the hospital, they will have a study visit at Days 15, 22, and 29.
ID: NCT04401579
Sponsor: National Institute of Allergy and Infectious Diseases (NIAID)
Contact: Central Contact ([email protected])
Locations: VA Palo Alto Health Care System, California; Naval Medical Center San Diego, California; Rocky Mountain Regional Veteran Affairs Medical Center, Aurora, Colorado; Southeast Louisiana Veterans Health Care System, New Orleans; Walter Reed National Military Medical Center, Bethesda, Maryland; National Institutes of Health - Clinical Center, National Institute of Allergy and Infectious Diseases Laboratory Of Immunoregulation, Bethesda, Maryland; Brooke Army Medical Center, Fort Sam Houston, Texas; Madigan Army Medical Center, Tacoma, Washington
Finding effective treatment or a vaccine for COVID-19, the disease caused by the severe acute respiratory syndrome coronavirus 2 (SARS-CoV-2), has placed significant strains on the global health care system. The National Library of Medicine database lists > 1,800 trials that are aimed at addressing COVID-19-related health care. Already, trials developed by the US Department of Veterans Affairs (VA), US Department of Defense (DoD), and the National Institute of Allergy and Infectious Diseases have provided important data on effective treatment options. The clinical trials listed below are all open as of May 31, 2020 and have trial sites at VA and DoD facilities. For additional information and full inclusion/exclusion criteria, please consult clinicaltrials.gov.
Adaptive COVID-19 Treatment Trial (ACTT)
This study is an adaptive, randomized, double-blind, placebo-controlled trial to evaluate the safety and efficacy of novel therapeutic agents in hospitalized adults diagnosed with COVID-19. The study will compare different investigational therapeutic agents to a control arm. ID: NCT04280705
Sponsor: National Institute of Allergy and Infectious Diseases
Contact: Central Contact ([email protected])
Locations: VA Palo Alto Health Care System, California; Naval Medical Center San Diego, California; Southeast Louisiana Veterans Health Care System, New Orleans; Walter Reed National Military Medical Center, Bethesda, Maryland; National Institutes of Health - Clinical Center, National Institute of Allergy and Infectious Diseases Laboratory Of Immunoregulation, Bethesda, Maryland; Brooke Army Medical Center, Fort Sam Houston, Texas; Madigan Army Medical Center, Tacoma, Washington
Study to Evaluate the Safety and Antiviral Activity of Remdesivir (GS-5734) in Participants With Severe Coronavirus Disease (COVID-19)
The primary objective of this study is to evaluate the efficacy of 2 remdesivir (RDV) regimens with respect to clinical status assessed by a 7-point ordinal scale on Day 11 (NCT04292730) or Day 14 (NCT04292899).
ID: NCT04292730/NCT04292899
Sponsor: Gilead Sciences
Contact: Gilead Clinical Study Information Center (833-445-3230)
Location: James J. Peters VA Medical Center, Bronx, New York
Expanded Access Remdesivir (RDV; GS-5734)
The treatment of communicable Novel Coronavirus of 2019 with Remdesivir (RDV; GS-5734) also known as severe acute respiratory syndrome coronavirus 2.
ID: NCT04302766
Sponsor: US Army Medical Research and Development Command
Contact: Sandi Parriott ([email protected])
A Study to Evaluate the Safety and Efficacy of Tocilizumab in Patients With Severe COVID-19 Pneumonia (COVACTA)
This study will evaluate the efficacy, safety, pharmacodynamics, and pharmacokinetics of tocilizumab (TCZ) compared with a matching placebo in combination with standard of care (SOC) in hospitalized patients with severe COVID-19 pneumonia.
ID: NCT04320615
Sponsor: Hoffmann-La Roche
Location: James J Peters VA Medical Center, Bronx, New York
Administration of Intravenous Vitamin C in Novel Coronavirus Infection (COVID-19) and Decreased Oxygenation (AVoCaDO)
Previous research has shown that high dose intravenous vitamin C (HDIVC) may benefit patients with sepsis, acute lung injury (ALI), and the acute respiratory distress syndrome (ARDS). However, it is not known if early administration of HDIVC could prevent progression to ARDS. We hypothesize that HDIVC is safe and tolerable in COVID-19 subjects given early or late in the disease course and may reduce the risk of respiratory failure requiring mechanical ventilation and development of ARDS along with reductions in supplemental oxygen demand and inflammatory markers.
ID: NCT04357782
Sponsor: Hunter Holmes Mcguire VA Medical CenterContact: Brian Davis ([email protected])
Location: Hunter Holmes Mcguire VA Medical Center, Richmond, Virginia
Treatment Of CORONAVIRUS DISEASE 2019 (COVID-19) With Anti-Sars-CoV-2 Convalescent Plasma (ASCoV2CP)
This is an expanded access open-label, single-arm, multi-site protocol to provide convalescent plasma as a treatment for patients diagnosed with severe, or life-threatening COVID-19.
ID: NCT04360486
Sponsor: US Army Medical Research and Development Command
Contact: Andrew Cap ([email protected])
VA Remote and Equitable Access to COVID-19 Healthcare Delivery (VA-REACH TRIAL) (VA-REACH)
We propose a 3-arm randomized control trial to determine the efficacy of hydroxychloroquine or azithromycin in treating mild to moderate COVID-19 among veterans in the outpatient setting.
ID: NCT04363203
Sponsor: Salomeh Keyhani
Location: San Francisco VA Health Care System, California
A Study to Evaluate the Safety and Efficacy of MSTT1041A (Astegolimab) or UTTR1147A in Patients With Severe COVID-19 Pneumonia (COVASTIL)
This is a Phase II, randomized, double-blind, placebo-controlled, multicenter study to assess the efficacy and safety of MSTT1041A (astegolimab) or UTTR1147A in combination with standard of care (SOC) compared with matching placebo in combination with SOC in patients hospitalized with severe coronavirus disease 2019 (COVID-19) pneumonia.
ID: NCT04386616
Sponsor: Genentech
Contact: Study ID Number: GA42469 ([email protected])
Location: Southeast Louisiana Veterans Health Care System, New Orleans
Hormonal Intervention for the Treatment in Veterans With COVID-19 Requiring Hospitalization (HITCH)
The purpose of this study is to determine if temporary androgen suppression improves the clinical outcomes of veterans who are hospitalized to an acute care ward due to COVID-19.ID: NCT04397718
Sponsor: VA Office of Research and Development
Contact: Matthew B Rettig ([email protected]), Nicholas Nickols ([email protected])
Locations: VA Greater Los Angeles Healthcare System, California; VA NY Harbor Healthcare System, New York; VA Puget Sound Health Care System, Seattle, Washington
Adaptive COVID-19 Treatment Trial 2 (ACTT-II)
ACTT-II will evaluate the combination of baricitinib and remdesivir compared to remdesivir alone. Subjects will be assessed daily while hospitalized. If the subjects are discharged from the hospital, they will have a study visit at Days 15, 22, and 29.
ID: NCT04401579
Sponsor: National Institute of Allergy and Infectious Diseases (NIAID)
Contact: Central Contact ([email protected])
Locations: VA Palo Alto Health Care System, California; Naval Medical Center San Diego, California; Rocky Mountain Regional Veteran Affairs Medical Center, Aurora, Colorado; Southeast Louisiana Veterans Health Care System, New Orleans; Walter Reed National Military Medical Center, Bethesda, Maryland; National Institutes of Health - Clinical Center, National Institute of Allergy and Infectious Diseases Laboratory Of Immunoregulation, Bethesda, Maryland; Brooke Army Medical Center, Fort Sam Houston, Texas; Madigan Army Medical Center, Tacoma, Washington
Analysis of Pharmacist Interventions Used to Resolve Safety Target of Polypharmacy (STOP) Drug Interactions
Statins are one of the most common medications dispensed in the US and are associated with clinically significant drug interactions.1,2 The most common adverse drug reaction (ADR) of statin drug interactions is muscle-related toxicities.2 Despite technology advances to alert clinicians to drug interactions, updated statin manufacturer labeling, and guideline recommendations, inappropriate prescribing and dispensing of statin drug interactions continues to occur in health care systems.2-10
The medical literature has demonstrated many opportunities for pharmacists to prevent and mitigate drug interactions. At the points of prescribing and dispensing, pharmacists can reduce the number of potential drug interactions for the patient.11-13 Pharmacists also have identified and resolved drug interactions through quality assurance review after dispensing to a patient.7,8
Regardless of the time point of an intervention, the most common method pharmacists used to resolve drug interactions was through recommendations to a prescriber. The recommendations were generated through academic detailing, clinical decision support algorithms, drug conversions, or the pharmacist’s expertise. Regardless of the method the pharmacist used, the prescriber had the final authority to accept or decline the recommendation.7,8,11-13 Although these interventions were effective, pharmacists could further streamline the process by autonomously resolving drug interactions. However, these types of interventions are not well described in the medical literature.
Background
The US Department of Veterans Affairs (VA) Veterans Integrated Service Network (VISN), established the Safety Target of Polypharmacy (STOP) report in 2015. At each facility in the network, the report identified patients who were dispensed medications known to have drug interactions. The interactions were chosen by the VISN, and the severity of the interactions was based on coding parameters within the VA computerized order entry system, which uses a severity score based on First Databank data. At the Harry S. Truman Memorial Veterans’ Hospital (Truman VA) in Columbia, Missouri, > 500 drug interactions were initially active on the STOP report. The most common drug interactions were statins with gemfibrozil and statins with niacin.14-18 The Truman VA Pharmacy Service was charged with resolving the interactions for the facility.
The Truman VA employs 3 Patient Aligned Care Team (PACT) Clinical Pharmacy Specialists (CPS) practicing within primary care clinics. PACT is the patientcentered medical home model used by the VA. PACT CPS are ambulatory care pharmacists who assist providers in managing diseases using a scope of practice. Having a scope of practice would have allowed the PACT CPS to manage drug interactions with independent prescribing authority. However, due to the high volume of STOP report interactions and limited PACT CPS resources, the Pharmacy Service needed to develop an efficient, patient-centered method to resolve them. The intervention also needed to allow pharmacists, both with and without a scope of practice, to address the interactions.
Methods
The Truman VA Pharmacy Service developed protocols, approved by the Pharmacy and Therapeutics (P&T) Committee, to manage the specific gemfibrozil-statin and niacinstatin interactions chosen for the VISN 15 STOP report (Figures 1 and 2). The protocols were designed to identify patients who did not have a clear indication for gemfibrozil or niacin, were likely to maintain triglycerides (TGs) < 500 mg/dL without these medications, and would not likely require close monitoring after discontinuation.19 The protocols allowed pharmacists to autonomously discontinue gemfibrozil or niacin if patients did not have a history of pancreatitis, TGs ≥ 400 mg/dL or a nonlipid indication for niacin (eg, pellagra) after establishing care at Truman VA. Additionally, both interacting medications had to be dispensed by the VA. When pharmacists discontinued a medication, it was documented in a note in the patient electronic health record. The prescriber was notified through the note and the patient received a notification letter. Follow-up laboratory monitoring was not required as part of the protocol.
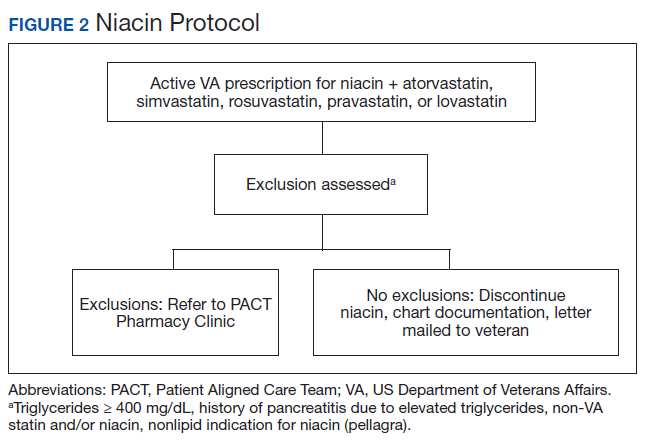
If patients met any of the exclusion criteria for discontinuation, the primary care provider (PCP) was notified to place a consult to the PACT Pharmacy Clinic for individualized interventions and close monitoring. Patients prescribed niacin for nonlipid indications were allowed to continue with their current drug regimen. At each encounter, the PACT CPS assessed for ADRs, made individualized medication changes, and arranged follow-up appointments. Once the interaction was resolved and treatment goals met, the PCP resumed monitoring of the patient’s lipid therapy.
Following all pharmacist interventions, a retrospective quality improvement analysis was conducted. The primary outcome was to evaluate the impact of discontinuing gemfibrozil and niacin by protocol on patients’ laboratory results. The coprimary endpoints were to describe the change in TG levels and the percentage of patients with TGs ≥ 500 mg/dL at least 5 weeks following the pharmacist-directed discontinuation by protocol. Secondary outcomes included the time required to resolve the interactions and a description of the PACT CPS pharmacologic interventions. Additionally, a quality assurance peer review was used to ensure the pharmacists appropriately utilized the protocols.
Data were collected from August 2016 to September 2017 for patients prescribed gemfibrozil and from May 2017 to January 2018 for patients prescribed niacin. The time spent resolving interactions was quantified based on encounter data. Descriptive statistics were used to analyze demographic information and the endpoints associated with each outcome. The project was reviewed by the University of Missouri Institutional Review Board, Truman VA privacy and information security officers, and was determined to meet guidelines for quality improvement.
Results
The original STOP report included 397 drug interactions involving statins with gemfibrozil or niacin (Table 1). The majority of patients were white and male aged 60 to 79 years. Gemfibrozil was the most common drug involved in all interactions (79.8%). The most common statins were atorvastatin (40%) and simvastatin (36.5%).
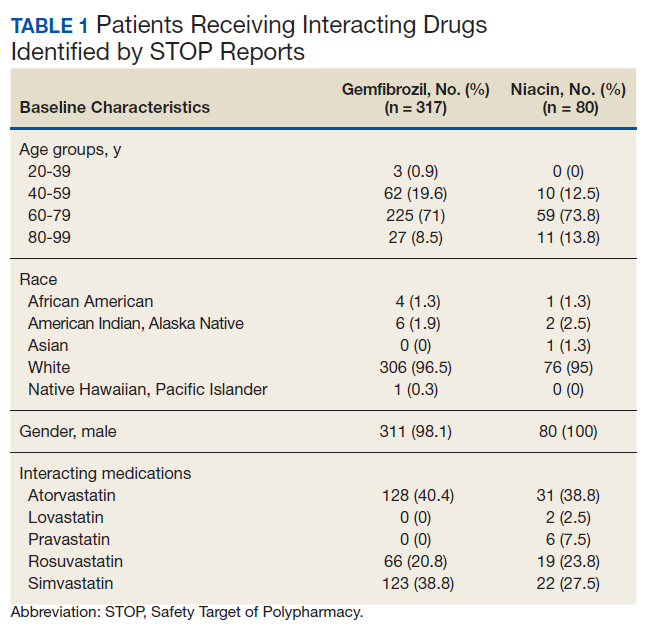
Gemfibrozil-Statin Interactions
Pharmacists discontinued gemfibrozil by protocol for 94 patients (29.6%), and 107 patients (33.8%) were referred to the PACT Pharmacy Clinic (Figure 3). For the remaining 116 patients (36.6%), the drug interaction was addressed outside of the protocol for the following reasons: the drug interaction was resolved prior to pharmacist review; an interacting prescription was expired and not to be continued; the patient self-discontinued ≥ 1 interacting medications; the patient was deceased; the patient moved; the patient was receiving ≥ 1 interacting medications outside of the VA; or the prescriber resolved the interaction following notification by the pharmacist.
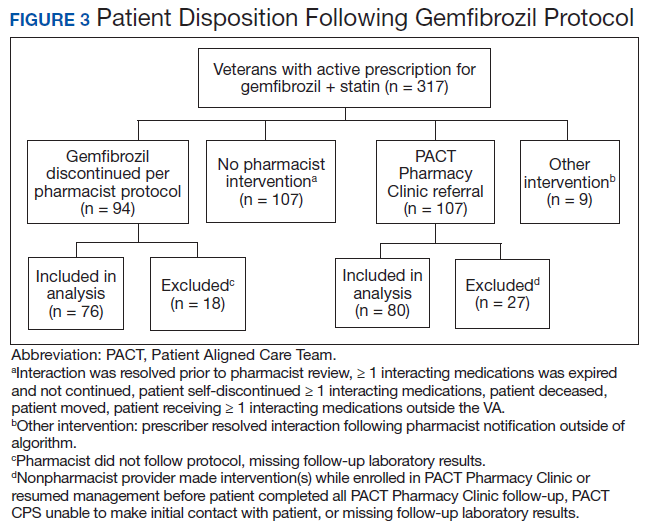
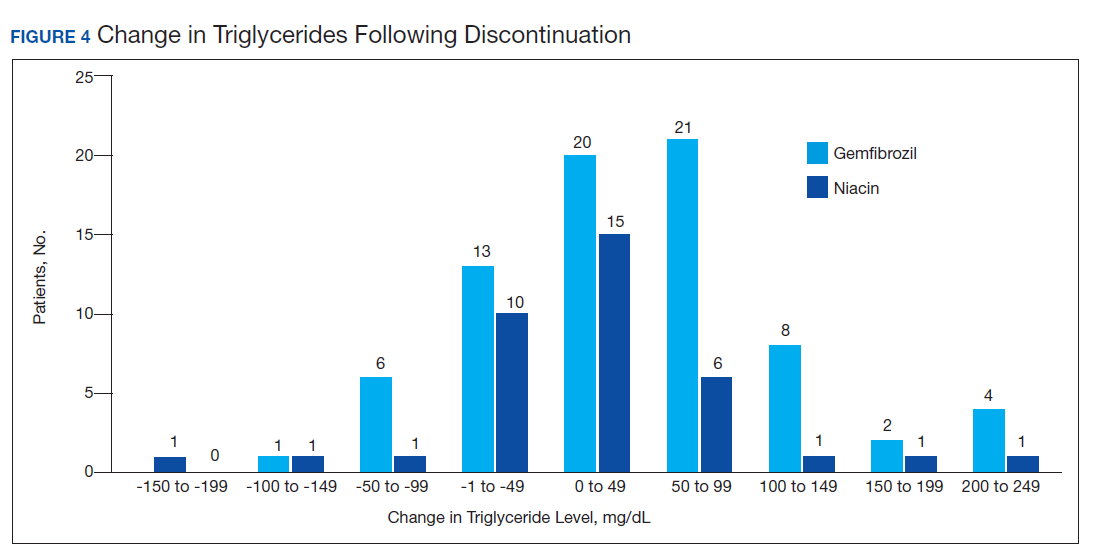
Ultimately, the interaction was resolved for all patients with a gemfibrozil-statin interaction on the STOP report. Following gemfibrozil discontinuation by protocol, 76 patients (80.9%) had TG laboratory results available and were included in the analysis. Sixty-two patients’ (82%) TG levels decreased or increased by < 100 mg/dL (Figure 4), and the TG levels of 1 patient (1.3%) increased above the threshold of 500 mg/dL. The mean (SD) time to the first laboratory result after the pharmacists mailed the notification letter was 6.5 (3.6) months (range, 1-17). The pharmacists spent a mean of 16 minutes per patient resolving each interaction.
Of the 107 patients referred to the PACT Pharmacy Clinic, 80 (74.8%) had TG laboratory results available and were included in the analysis. These patients were followed by the PACT CPS until the drug interaction was resolved and confirmed to have TG levels at goal (< 500 mg/dL). Gemfibrozil doses ranged from 300 mg daily to 600 mg twice daily, with 70% (n = 56) of patients taking 600 mg twice daily. The PACT CPS made 148 interventions (Table 2). Twenty-three (29%) patients required only gemfibrozil discontinuation. The remaining 57 patients (71%) required at least 2 medication interventions. The PACT CPS generated 213 encounters for resolving drug interactions with a median of 2 encounters per patient.
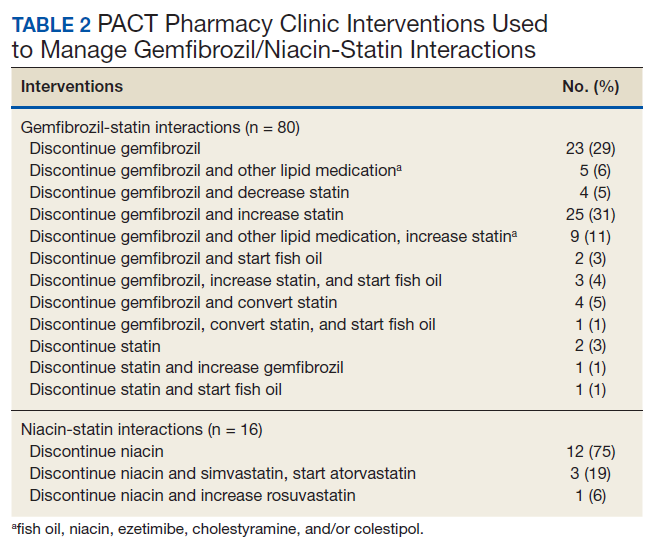
Quality assurance review identified 5 patients (5.3%) who underwent gemfibrozil discontinuation by protocol, despite having criteria that would have recommended against discontinuation. In accordance with the protocol criteria, these patients were later referred to the PACT Pharmacy Clinic. None of these patients experienced a TG increase at or above the threshold of 500 mg/dL after gemfibrozil was initially discontinued but were excluded from the earlier analysis.
Niacin-Statin Interactions
Pharmacists discontinued niacin by protocol for 48 patients (60.0%), and 22 patients (27.5%) were referred to the PACT Pharmacy Clinic (Figure 5). For the remaining 5 patients (6.3%), the interaction was either addressed outside the protocol prior to pharmacist review, or an interacting prescription was expired and not to be continued. Additionally, niacin was continued per prescriber preference in 5 patients (6.3%).
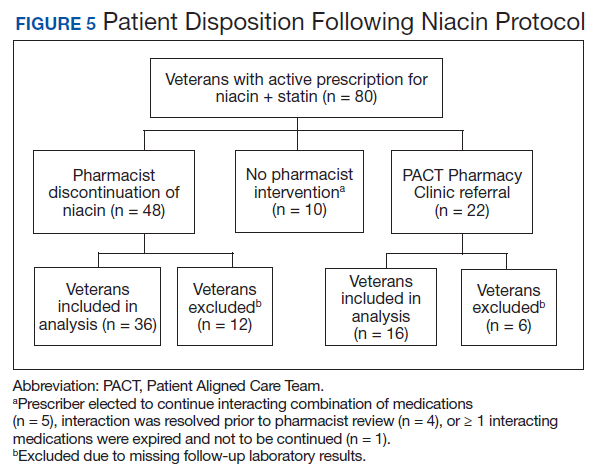
Thirty-six patients (75%) had TG laboratory results available following niacin discontinuation by protocol and were included in the analysis. Most patients’ (n = 33, 91.7%) TG levels decreased or increased by < 100 mg/dL. No patient had a TG level that increased higher than the threshold of 500 mg/dL. The mean (SD) time to the first laboratory result after the pharmacists mailed the notification letter, was 5.3 (2.5) months (range, 1.2-9.8). The pharmacists spent a mean of 15 minutes per patient resolving each interaction. The quality assurance review found no discrepancies in the pharmacists’ application of the protocol.
Of the 22 patients referred to the PACT Pharmacy Clinic, 16 (72.7%) patients had TG laboratory results available and were included in the analysis. As with the gemfibrozil interactions, these patients were followed by the PACT Pharmacy Clinic until the drug interaction was resolved and confirmed to have TGs at goal (< 500 mg/dL). Niacin doses ranged from 500 mg daily to 2,000 mg daily, with the majority of patients taking 1,000 mg daily. The PACT CPS made 23 interventions. The PACT CPS generated 46 encounters for resolving drug interactions with a median of 2 encounters per patient.
Discussion
Following gemfibrozil or niacin discontinuation by protocol, most patients with available laboratory results experienced either a decrease or modest TG elevation. The proportion of patients experiencing a decrease in TGs was unexpected but potentially multifactorial. Individual causes for the decrease in TGs were beyond the scope of this analysis. The retrospective design limited the ability to identify variables that could have impacted TG levels when gemfibrozil or niacin were started and discontinued. Although the treatment of TG levels is not indicated until it is ≥ 500 mg/dL, due to an increased risk of pancreatitis, both protocols excluded patients with a history of TGs ≥ 400 mg/dL.19 The lower threshold was set to compensate for anticipated increase in TG levels, following gemfibrozil or niacin discontinuation, and to minimize the number of patients with TG levels ≥ 500 mg/dL. The actual impact on patients’ TG levels supports the use of this lower threshold in the protocol.
When TG levels increased by 200 to 249 mg/dL after gemfibrozil or niacin discontinuation, patients were evaluated for possible underlying causes, which occurred for 4 gemfibrozil and 1 niacin patient. One patient started a β-blocker after gemfibrozil was initiated, and 3 patients were taking gemfibrozil prior to establishing care at the VA. The TG levels of the patient taking niacin correlated with an increased hemoglobin A1c. The TG level for only 1 patient taking gemfibrozil increased above the 500 mg/dL threshold. The patient had several comorbidities known to increase TG levels, but the comorbidities were previously well controlled. No additional medication changes were made at that time, and the TG levels on the next fasting lipid panel decreased to goal. The patient did not experience any negative clinical sequelae from the elevated TG levels.
Thirty-five patients (36%) who were referred to the PACT Pharmacy Clinic required only either gemfibrozil or niacin discontinuation. These patients were evaluated to identify whether adjustments to the protocols would have allowed for pharmacist discontinuation without referral to the PACT Pharmacy Clinic. Twenty-four of these patients (69%) had repeated TG levels ≥ 400 mg/dL prior to referral to the PACT Pharmacy Clinic. Additionally, there was no correlation between the gemfibrozil or niacin doses and the change in TG levels following discontinuation. These data indicate the protocols appropriately identified patients who did not have an indication for gemfibrozil or niacin.
In addition to drug interactions identified on the STOP report, the PACT CPS resolved 12 additional interactions involving simvastatin and gemfibrozil. Additionally, unnecessary lipid medications were deprescribed. The PACT CPS identified 13 patients who experienced myalgias, an ADR attributed to the gemfibrozil- statin interaction. Of those, 9 patients’ ADRs resolved after discontinuing gemfibrozil alone. For the remaining 4 patients, additional interventions to convert the patient to another statin were required to resolve the ADR.
Using pharmacists to address the drug interactions shifted workload from the prescribers and other primary care team members. The mean time spent to resolve both gemfibrozil and niacin interactions by protocol was 15.5 minutes. One hundred fortytwo patients (35.8%) had drug interactions resolved by protocol, saving the PACT CPS’ expertise for patients requiring individualized interventions. Drug interactions were resolved within 4 PACT CPS encounters for 93.8% of the patients taking gemfibrozil and within 3 PACT CPS encounters for 93.8% of the patients taking niacin.
The protocols allowed 12 additional pharmacists who did not have an ambulatory care scope of practice to assist the PACT CPS in mitigating the STOP drug interactions. These pharmacists otherwise would have been limited to making consultative recommendations. Simultaneously, the design allowed for the PACT pharmacists’ expertise to be allocated for patients most likely to require interventions beyond the protocols. This type of intraprofessional referral process is not well described in the medical literature. To the authors’ knowledge, the only studies described referrals from hospital pharmacists to community pharmacists during transitions of care on hospital discharge.20,21
Limitations
The results of this study are derived from a retrospective chart review at a single VA facility. The autonomous nature of PACT CPS interventions may be difficult to replicate in other settings that do not permit pharmacists the same prescriptive authority. This analysis was designed to demonstrate the impact of the pharmacist in resolving major drug interactions. Patients referred to the PACT Pharmacy Clinic who also had their lipid medications adjusted by a nonpharmacist provider were excluded. However, this may have minimized the impact of the PACT CPS on the patient care provided. As postintervention laboratory results were not available for all patients, some patients’ TG levels could have increased above the 500 mg/dL threshold but were not identified. The time investment was extensive and likely underestimates the true cost of implementing the interventions.
Because notification letters were used to instruct patients to stop gemfibrozil or niacin, several considerations need to be addressed when interpreting the follow-up laboratory results. First, we cannot confirm whether the patients received the letter or the exact date the letter was received. Additionally, we cannot confirm whether the patients followed the instructions to stop the interacting medications or the date the medications were stopped. It is possible some patients were still taking the interacting medication when the first laboratory was drawn. Should a patient have continued the interacting medication, most would have run out and been unable to obtain a refill within 90 days of receiving the letter, as this is the maximum amount dispensed at one time. The mean time to the first laboratory result for both gemfibrozil and niacin was 6.5 and 5.3 months, respectively. Approximately 85% of patients completed the first laboratory test at least 3 months after the letter was mailed.
The protocols were designed to assess whether gemfibrozil or niacin was indicated and did not assess whether the statin was indicated. Therefore, discontinuing the statin also could have resolved the interaction appropriately. However, due to characteristics of the patient population and recommendations in current lipid guidelines, it was more likely the statin would be indicated.22,23 The protocols also assumed that patients eligible for gemfibrozil or niacin discontinuation would not need additional changes to their lipid medications. The medication changes made by the PACT CPS may have gone beyond those minimally necessary to resolve the drug interaction and maintain TG goals. Patients who had gemfibrozil or niacin discontinued by protocol also may have benefited from additional optimization of their lipid medications.
Conclusions
This quality improvement analysis supports further evaluation of the complementary use of protocols and PACT CPS prescriptive authority to resolve statin drug interactions. The gemfibrozil and niacin protocols appropriately identified patients who were less likely to experience an adverse change in TG laboratory results. Patients more likely to require additional medication interventions were appropriately referred to the PACT Pharmacy Clinics for individualized care. These data support expanded roles for pharmacists, across various settings, to mitigate select drug interactions at the Truman VA.
Acknowledgments
This quality improvement project is the result of work supported with resources and use of the Harry S. Truman Memorial Veterans’ Hospital in Columbia, Missouri.
1. The top 200 drugs of 2020 Provided by the ClinCalc DrugStats Database. http://clincalc.com/DrugStats /Top200Drugs.aspx. Updated February 11, 2017. Accessed May 12, 2020.
2. Wiggins BS, Saseen JJ, Page RL 2nd, et al; American Heart Association Clinical Pharmacology Committee of the Council on Clinical Cardiology; Council on Hypertension; Council on Quality of Care and Outcomes Research; and Council on Functional Genomics and Translational Biology. Recommendations for management of clinically significant drug-drug interactions with statins and select agents used in patients with cardiovascular disease: a scientific statement from the American Heart Association. Circulation. 2016;134(21):e468‐e495. doi:10.1161/CIR.0000000000000456
3. Smithburger PL, Buckley MS, Bejian S, Burenheide K, Kane-Gill SL. A critical evaluation of clinical decision support for the detection of drug-drug interactions. Expert Opin Drug Saf. 2011;10(6):871‐882. doi:10.1517/14740338.2011.583916
4. US Food and Drug Administration. FDA drug safety communication: new restrictions, contraindications, and dose limitations for Zocor (simvastatin) to reduce the risk of muscle injury. https://www.fda.gov/Drugs/DrugSafety /ucm256581.htm. Updated December 15, 2017. Accessed May 12, 2020.
5. US Food and Drug Administration. FDA drug safety communication: important safety label changes to cholesterol-lowering statin drugs. https://www.fda.gov /Drugs/DrugSafety/ucm293101.htm. Updated January 19, 2016. Accessed May 12, 2020.
6. US Food and Drug Administration Federal Register. AbbVie Inc. et al; withdrawal of approval of indications related to the coadministration with statins in applications for niacin extended-release tablets and fenofibric acid delayed-release capsules. https://www.federalregister .gov/documents/2016/04/18/2016-08887/abbvie-inc -et-al-withdrawal-of-approval-of-indications-related -to-the-coadministration-with-statins. Published April 18, 2016. Accessed May 12, 2020.
7. Lamprecht DG Jr, Todd BA, Denham AM, Ruppe LK, Stadler SL. Clinical pharmacist patient-safety initiative to reduce against-label prescribing of statins with cyclosporine. Ann Pharmacother. 2017;51(2):140‐145. doi:10.1177/1060028016675352
8. Roblek T, Deticek A, Leskovar B, et al. Clinical-pharmacist intervention reduces clinically relevant drugdrug interactions in patients with heart failure: A randomized, double-blind, controlled trial. Int J Cardiol. 2016;203:647‐652. doi:10.1016/j.ijcard.2015.10.206
9. Tuchscherer RM, Nair K, Ghushchyan V, Saseen JJ. Simvastatin prescribing patterns before and after FDA dosing restrictions: a retrospective analysis of a large healthcare claims database. Am J Cardiovasc Drugs. 2015;15(1):27‐34. doi:10.1007/s40256-014-0096-x
10. Alford JC, Saseen JJ, Allen RR, Nair KV. Persistent use of against-label statin-fibrate combinations from 2003-2009 despite United States Food and Drug Administration dose restrictions. Pharmacotherapy. 2012;32(7):623‐630. doi:10.1002/j.1875-9114.2011.01090.x
11. Leape LL, Cullen DJ, Clapp MD, et al. Pharmacist participation on physician rounds and adverse drug events in the intensive care unit [published correction appears in JAMA 2000 Mar 8;283(10):1293]. JAMA. 1999;282(3):267‐270. doi:10.1001/jama.282.3.267
12. Kucukarslan SN, Peters M, Mlynarek M, Nafziger DA. Pharmacists on rounding teams reduce preventable adverse drug events in hospital general medicine units. Arch Intern Med. 2003;163(17):2014‐2018. doi:10.1001/archinte.163.17.2014
13. Humphries TL, Carroll N, Chester EA, Magid D, Rocho B. Evaluation of an electronic critical drug interaction program coupled with active pharmacist intervention. Ann Pharmacother. 2007;41(12):1979‐1985. doi:10.1345/aph.1K349
14. Zocor [package insert]. Whitehouse Station, NJ: Merck & Co, Inc; 2018.
15. Lipitor [package insert]. New York, NY: Pfizer; 2017.
16. Crestor [package insert]. Wilmington, DE: AstraZeneca; 2018.
17. Mevacor [package insert]. Whitehouse Station, NJ: Merck & Co, Inc; 2012.
18. Wolters Kluwer Health, Lexi-Drugs, Lexicomp. Pravastatin. www.online.lexi.com. [Source not verified.]
19. Miller M, Stone NJ, Ballantyne C, et al; American Heart Association Clinical Lipidology, Thrombosis, and Prevention Committee of the Council on Nutrition, Physical Activity, and Metabolism; Council on Arteriosclerosis, Thrombosis and Vascular Biology; Council on Cardiovascular Nursing; Council on the Kidney in Cardiovascular Disease. Triglycerides and cardiovascular disease: a scientific statement from the American Heart Association. Circulation. 2011;123(20):2292-2333. doi: 10.1161/CIR.0b013e3182160726
20. Ferguson J, Seston L, Ashcroft DM. Refer-to-pharmacy: a qualitative study exploring the implementation of an electronic transfer of care initiative to improve medicines optimisation following hospital discharge. BMC Health Serv Res. 2018;18(1):424. doi:10.1186/s12913-018-3262-z
21. Ensing HT, Koster ES, Dubero DJ, van Dooren AA, Bouvy ML. Collaboration between hospital and community pharmacists to address drug-related problems: the HomeCoMe-program. Res Social Adm Pharm. 2019;15(3):267‐278. doi:10.1016/j.sapharm.2018.05.001
22. US Department of Defense, US Department of Veterans Affairs. VA/DoD clinical practice guideline for the management of dyslipidemia for cardiovascular risk reduction guideline summary. https://www.healthquality.va.gov /guidelines/CD/lipids/LipidSumOptSinglePg31Aug15.pdf. Published 2014. Accessed May 14, 2020.
23. Stone NJ, Robinson JG, Lichtenstein AH, et al. 2013 ACC/AHA guideline on the treatment of blood cholesterol to reduce atherosclerotic cardiovascular risk in adults: a report of the American College of Cardiology/ American Heart Association Task Force on Practice Guidelines [published correction appears in Circulation. 2014 Jun 24;129(25) (suppl 2):S46-48] [published correction appears in Circulation. 2015 Dec 22;132(25):e396]. Circulation. 2014;129(25)(suppl 2): S1‐S45. doi:10.1161/01.cir.0000437738.63853.7a
Statins are one of the most common medications dispensed in the US and are associated with clinically significant drug interactions.1,2 The most common adverse drug reaction (ADR) of statin drug interactions is muscle-related toxicities.2 Despite technology advances to alert clinicians to drug interactions, updated statin manufacturer labeling, and guideline recommendations, inappropriate prescribing and dispensing of statin drug interactions continues to occur in health care systems.2-10
The medical literature has demonstrated many opportunities for pharmacists to prevent and mitigate drug interactions. At the points of prescribing and dispensing, pharmacists can reduce the number of potential drug interactions for the patient.11-13 Pharmacists also have identified and resolved drug interactions through quality assurance review after dispensing to a patient.7,8
Regardless of the time point of an intervention, the most common method pharmacists used to resolve drug interactions was through recommendations to a prescriber. The recommendations were generated through academic detailing, clinical decision support algorithms, drug conversions, or the pharmacist’s expertise. Regardless of the method the pharmacist used, the prescriber had the final authority to accept or decline the recommendation.7,8,11-13 Although these interventions were effective, pharmacists could further streamline the process by autonomously resolving drug interactions. However, these types of interventions are not well described in the medical literature.
Background
The US Department of Veterans Affairs (VA) Veterans Integrated Service Network (VISN), established the Safety Target of Polypharmacy (STOP) report in 2015. At each facility in the network, the report identified patients who were dispensed medications known to have drug interactions. The interactions were chosen by the VISN, and the severity of the interactions was based on coding parameters within the VA computerized order entry system, which uses a severity score based on First Databank data. At the Harry S. Truman Memorial Veterans’ Hospital (Truman VA) in Columbia, Missouri, > 500 drug interactions were initially active on the STOP report. The most common drug interactions were statins with gemfibrozil and statins with niacin.14-18 The Truman VA Pharmacy Service was charged with resolving the interactions for the facility.
The Truman VA employs 3 Patient Aligned Care Team (PACT) Clinical Pharmacy Specialists (CPS) practicing within primary care clinics. PACT is the patientcentered medical home model used by the VA. PACT CPS are ambulatory care pharmacists who assist providers in managing diseases using a scope of practice. Having a scope of practice would have allowed the PACT CPS to manage drug interactions with independent prescribing authority. However, due to the high volume of STOP report interactions and limited PACT CPS resources, the Pharmacy Service needed to develop an efficient, patient-centered method to resolve them. The intervention also needed to allow pharmacists, both with and without a scope of practice, to address the interactions.
Methods
The Truman VA Pharmacy Service developed protocols, approved by the Pharmacy and Therapeutics (P&T) Committee, to manage the specific gemfibrozil-statin and niacinstatin interactions chosen for the VISN 15 STOP report (Figures 1 and 2). The protocols were designed to identify patients who did not have a clear indication for gemfibrozil or niacin, were likely to maintain triglycerides (TGs) < 500 mg/dL without these medications, and would not likely require close monitoring after discontinuation.19 The protocols allowed pharmacists to autonomously discontinue gemfibrozil or niacin if patients did not have a history of pancreatitis, TGs ≥ 400 mg/dL or a nonlipid indication for niacin (eg, pellagra) after establishing care at Truman VA. Additionally, both interacting medications had to be dispensed by the VA. When pharmacists discontinued a medication, it was documented in a note in the patient electronic health record. The prescriber was notified through the note and the patient received a notification letter. Follow-up laboratory monitoring was not required as part of the protocol.
If patients met any of the exclusion criteria for discontinuation, the primary care provider (PCP) was notified to place a consult to the PACT Pharmacy Clinic for individualized interventions and close monitoring. Patients prescribed niacin for nonlipid indications were allowed to continue with their current drug regimen. At each encounter, the PACT CPS assessed for ADRs, made individualized medication changes, and arranged follow-up appointments. Once the interaction was resolved and treatment goals met, the PCP resumed monitoring of the patient’s lipid therapy.
Following all pharmacist interventions, a retrospective quality improvement analysis was conducted. The primary outcome was to evaluate the impact of discontinuing gemfibrozil and niacin by protocol on patients’ laboratory results. The coprimary endpoints were to describe the change in TG levels and the percentage of patients with TGs ≥ 500 mg/dL at least 5 weeks following the pharmacist-directed discontinuation by protocol. Secondary outcomes included the time required to resolve the interactions and a description of the PACT CPS pharmacologic interventions. Additionally, a quality assurance peer review was used to ensure the pharmacists appropriately utilized the protocols.
Data were collected from August 2016 to September 2017 for patients prescribed gemfibrozil and from May 2017 to January 2018 for patients prescribed niacin. The time spent resolving interactions was quantified based on encounter data. Descriptive statistics were used to analyze demographic information and the endpoints associated with each outcome. The project was reviewed by the University of Missouri Institutional Review Board, Truman VA privacy and information security officers, and was determined to meet guidelines for quality improvement.
Results
The original STOP report included 397 drug interactions involving statins with gemfibrozil or niacin (Table 1). The majority of patients were white and male aged 60 to 79 years. Gemfibrozil was the most common drug involved in all interactions (79.8%). The most common statins were atorvastatin (40%) and simvastatin (36.5%).
Gemfibrozil-Statin Interactions
Pharmacists discontinued gemfibrozil by protocol for 94 patients (29.6%), and 107 patients (33.8%) were referred to the PACT Pharmacy Clinic (Figure 3). For the remaining 116 patients (36.6%), the drug interaction was addressed outside of the protocol for the following reasons: the drug interaction was resolved prior to pharmacist review; an interacting prescription was expired and not to be continued; the patient self-discontinued ≥ 1 interacting medications; the patient was deceased; the patient moved; the patient was receiving ≥ 1 interacting medications outside of the VA; or the prescriber resolved the interaction following notification by the pharmacist.
Ultimately, the interaction was resolved for all patients with a gemfibrozil-statin interaction on the STOP report. Following gemfibrozil discontinuation by protocol, 76 patients (80.9%) had TG laboratory results available and were included in the analysis. Sixty-two patients’ (82%) TG levels decreased or increased by < 100 mg/dL (Figure 4), and the TG levels of 1 patient (1.3%) increased above the threshold of 500 mg/dL. The mean (SD) time to the first laboratory result after the pharmacists mailed the notification letter was 6.5 (3.6) months (range, 1-17). The pharmacists spent a mean of 16 minutes per patient resolving each interaction.
Of the 107 patients referred to the PACT Pharmacy Clinic, 80 (74.8%) had TG laboratory results available and were included in the analysis. These patients were followed by the PACT CPS until the drug interaction was resolved and confirmed to have TG levels at goal (< 500 mg/dL). Gemfibrozil doses ranged from 300 mg daily to 600 mg twice daily, with 70% (n = 56) of patients taking 600 mg twice daily. The PACT CPS made 148 interventions (Table 2). Twenty-three (29%) patients required only gemfibrozil discontinuation. The remaining 57 patients (71%) required at least 2 medication interventions. The PACT CPS generated 213 encounters for resolving drug interactions with a median of 2 encounters per patient.
Quality assurance review identified 5 patients (5.3%) who underwent gemfibrozil discontinuation by protocol, despite having criteria that would have recommended against discontinuation. In accordance with the protocol criteria, these patients were later referred to the PACT Pharmacy Clinic. None of these patients experienced a TG increase at or above the threshold of 500 mg/dL after gemfibrozil was initially discontinued but were excluded from the earlier analysis.
Niacin-Statin Interactions
Pharmacists discontinued niacin by protocol for 48 patients (60.0%), and 22 patients (27.5%) were referred to the PACT Pharmacy Clinic (Figure 5). For the remaining 5 patients (6.3%), the interaction was either addressed outside the protocol prior to pharmacist review, or an interacting prescription was expired and not to be continued. Additionally, niacin was continued per prescriber preference in 5 patients (6.3%).
Thirty-six patients (75%) had TG laboratory results available following niacin discontinuation by protocol and were included in the analysis. Most patients’ (n = 33, 91.7%) TG levels decreased or increased by < 100 mg/dL. No patient had a TG level that increased higher than the threshold of 500 mg/dL. The mean (SD) time to the first laboratory result after the pharmacists mailed the notification letter, was 5.3 (2.5) months (range, 1.2-9.8). The pharmacists spent a mean of 15 minutes per patient resolving each interaction. The quality assurance review found no discrepancies in the pharmacists’ application of the protocol.
Of the 22 patients referred to the PACT Pharmacy Clinic, 16 (72.7%) patients had TG laboratory results available and were included in the analysis. As with the gemfibrozil interactions, these patients were followed by the PACT Pharmacy Clinic until the drug interaction was resolved and confirmed to have TGs at goal (< 500 mg/dL). Niacin doses ranged from 500 mg daily to 2,000 mg daily, with the majority of patients taking 1,000 mg daily. The PACT CPS made 23 interventions. The PACT CPS generated 46 encounters for resolving drug interactions with a median of 2 encounters per patient.
Discussion
Following gemfibrozil or niacin discontinuation by protocol, most patients with available laboratory results experienced either a decrease or modest TG elevation. The proportion of patients experiencing a decrease in TGs was unexpected but potentially multifactorial. Individual causes for the decrease in TGs were beyond the scope of this analysis. The retrospective design limited the ability to identify variables that could have impacted TG levels when gemfibrozil or niacin were started and discontinued. Although the treatment of TG levels is not indicated until it is ≥ 500 mg/dL, due to an increased risk of pancreatitis, both protocols excluded patients with a history of TGs ≥ 400 mg/dL.19 The lower threshold was set to compensate for anticipated increase in TG levels, following gemfibrozil or niacin discontinuation, and to minimize the number of patients with TG levels ≥ 500 mg/dL. The actual impact on patients’ TG levels supports the use of this lower threshold in the protocol.
When TG levels increased by 200 to 249 mg/dL after gemfibrozil or niacin discontinuation, patients were evaluated for possible underlying causes, which occurred for 4 gemfibrozil and 1 niacin patient. One patient started a β-blocker after gemfibrozil was initiated, and 3 patients were taking gemfibrozil prior to establishing care at the VA. The TG levels of the patient taking niacin correlated with an increased hemoglobin A1c. The TG level for only 1 patient taking gemfibrozil increased above the 500 mg/dL threshold. The patient had several comorbidities known to increase TG levels, but the comorbidities were previously well controlled. No additional medication changes were made at that time, and the TG levels on the next fasting lipid panel decreased to goal. The patient did not experience any negative clinical sequelae from the elevated TG levels.
Thirty-five patients (36%) who were referred to the PACT Pharmacy Clinic required only either gemfibrozil or niacin discontinuation. These patients were evaluated to identify whether adjustments to the protocols would have allowed for pharmacist discontinuation without referral to the PACT Pharmacy Clinic. Twenty-four of these patients (69%) had repeated TG levels ≥ 400 mg/dL prior to referral to the PACT Pharmacy Clinic. Additionally, there was no correlation between the gemfibrozil or niacin doses and the change in TG levels following discontinuation. These data indicate the protocols appropriately identified patients who did not have an indication for gemfibrozil or niacin.
In addition to drug interactions identified on the STOP report, the PACT CPS resolved 12 additional interactions involving simvastatin and gemfibrozil. Additionally, unnecessary lipid medications were deprescribed. The PACT CPS identified 13 patients who experienced myalgias, an ADR attributed to the gemfibrozil- statin interaction. Of those, 9 patients’ ADRs resolved after discontinuing gemfibrozil alone. For the remaining 4 patients, additional interventions to convert the patient to another statin were required to resolve the ADR.
Using pharmacists to address the drug interactions shifted workload from the prescribers and other primary care team members. The mean time spent to resolve both gemfibrozil and niacin interactions by protocol was 15.5 minutes. One hundred fortytwo patients (35.8%) had drug interactions resolved by protocol, saving the PACT CPS’ expertise for patients requiring individualized interventions. Drug interactions were resolved within 4 PACT CPS encounters for 93.8% of the patients taking gemfibrozil and within 3 PACT CPS encounters for 93.8% of the patients taking niacin.
The protocols allowed 12 additional pharmacists who did not have an ambulatory care scope of practice to assist the PACT CPS in mitigating the STOP drug interactions. These pharmacists otherwise would have been limited to making consultative recommendations. Simultaneously, the design allowed for the PACT pharmacists’ expertise to be allocated for patients most likely to require interventions beyond the protocols. This type of intraprofessional referral process is not well described in the medical literature. To the authors’ knowledge, the only studies described referrals from hospital pharmacists to community pharmacists during transitions of care on hospital discharge.20,21
Limitations
The results of this study are derived from a retrospective chart review at a single VA facility. The autonomous nature of PACT CPS interventions may be difficult to replicate in other settings that do not permit pharmacists the same prescriptive authority. This analysis was designed to demonstrate the impact of the pharmacist in resolving major drug interactions. Patients referred to the PACT Pharmacy Clinic who also had their lipid medications adjusted by a nonpharmacist provider were excluded. However, this may have minimized the impact of the PACT CPS on the patient care provided. As postintervention laboratory results were not available for all patients, some patients’ TG levels could have increased above the 500 mg/dL threshold but were not identified. The time investment was extensive and likely underestimates the true cost of implementing the interventions.
Because notification letters were used to instruct patients to stop gemfibrozil or niacin, several considerations need to be addressed when interpreting the follow-up laboratory results. First, we cannot confirm whether the patients received the letter or the exact date the letter was received. Additionally, we cannot confirm whether the patients followed the instructions to stop the interacting medications or the date the medications were stopped. It is possible some patients were still taking the interacting medication when the first laboratory was drawn. Should a patient have continued the interacting medication, most would have run out and been unable to obtain a refill within 90 days of receiving the letter, as this is the maximum amount dispensed at one time. The mean time to the first laboratory result for both gemfibrozil and niacin was 6.5 and 5.3 months, respectively. Approximately 85% of patients completed the first laboratory test at least 3 months after the letter was mailed.
The protocols were designed to assess whether gemfibrozil or niacin was indicated and did not assess whether the statin was indicated. Therefore, discontinuing the statin also could have resolved the interaction appropriately. However, due to characteristics of the patient population and recommendations in current lipid guidelines, it was more likely the statin would be indicated.22,23 The protocols also assumed that patients eligible for gemfibrozil or niacin discontinuation would not need additional changes to their lipid medications. The medication changes made by the PACT CPS may have gone beyond those minimally necessary to resolve the drug interaction and maintain TG goals. Patients who had gemfibrozil or niacin discontinued by protocol also may have benefited from additional optimization of their lipid medications.
Conclusions
This quality improvement analysis supports further evaluation of the complementary use of protocols and PACT CPS prescriptive authority to resolve statin drug interactions. The gemfibrozil and niacin protocols appropriately identified patients who were less likely to experience an adverse change in TG laboratory results. Patients more likely to require additional medication interventions were appropriately referred to the PACT Pharmacy Clinics for individualized care. These data support expanded roles for pharmacists, across various settings, to mitigate select drug interactions at the Truman VA.
Acknowledgments
This quality improvement project is the result of work supported with resources and use of the Harry S. Truman Memorial Veterans’ Hospital in Columbia, Missouri.
Statins are one of the most common medications dispensed in the US and are associated with clinically significant drug interactions.1,2 The most common adverse drug reaction (ADR) of statin drug interactions is muscle-related toxicities.2 Despite technology advances to alert clinicians to drug interactions, updated statin manufacturer labeling, and guideline recommendations, inappropriate prescribing and dispensing of statin drug interactions continues to occur in health care systems.2-10
The medical literature has demonstrated many opportunities for pharmacists to prevent and mitigate drug interactions. At the points of prescribing and dispensing, pharmacists can reduce the number of potential drug interactions for the patient.11-13 Pharmacists also have identified and resolved drug interactions through quality assurance review after dispensing to a patient.7,8
Regardless of the time point of an intervention, the most common method pharmacists used to resolve drug interactions was through recommendations to a prescriber. The recommendations were generated through academic detailing, clinical decision support algorithms, drug conversions, or the pharmacist’s expertise. Regardless of the method the pharmacist used, the prescriber had the final authority to accept or decline the recommendation.7,8,11-13 Although these interventions were effective, pharmacists could further streamline the process by autonomously resolving drug interactions. However, these types of interventions are not well described in the medical literature.
Background
The US Department of Veterans Affairs (VA) Veterans Integrated Service Network (VISN), established the Safety Target of Polypharmacy (STOP) report in 2015. At each facility in the network, the report identified patients who were dispensed medications known to have drug interactions. The interactions were chosen by the VISN, and the severity of the interactions was based on coding parameters within the VA computerized order entry system, which uses a severity score based on First Databank data. At the Harry S. Truman Memorial Veterans’ Hospital (Truman VA) in Columbia, Missouri, > 500 drug interactions were initially active on the STOP report. The most common drug interactions were statins with gemfibrozil and statins with niacin.14-18 The Truman VA Pharmacy Service was charged with resolving the interactions for the facility.
The Truman VA employs 3 Patient Aligned Care Team (PACT) Clinical Pharmacy Specialists (CPS) practicing within primary care clinics. PACT is the patientcentered medical home model used by the VA. PACT CPS are ambulatory care pharmacists who assist providers in managing diseases using a scope of practice. Having a scope of practice would have allowed the PACT CPS to manage drug interactions with independent prescribing authority. However, due to the high volume of STOP report interactions and limited PACT CPS resources, the Pharmacy Service needed to develop an efficient, patient-centered method to resolve them. The intervention also needed to allow pharmacists, both with and without a scope of practice, to address the interactions.
Methods
The Truman VA Pharmacy Service developed protocols, approved by the Pharmacy and Therapeutics (P&T) Committee, to manage the specific gemfibrozil-statin and niacinstatin interactions chosen for the VISN 15 STOP report (Figures 1 and 2). The protocols were designed to identify patients who did not have a clear indication for gemfibrozil or niacin, were likely to maintain triglycerides (TGs) < 500 mg/dL without these medications, and would not likely require close monitoring after discontinuation.19 The protocols allowed pharmacists to autonomously discontinue gemfibrozil or niacin if patients did not have a history of pancreatitis, TGs ≥ 400 mg/dL or a nonlipid indication for niacin (eg, pellagra) after establishing care at Truman VA. Additionally, both interacting medications had to be dispensed by the VA. When pharmacists discontinued a medication, it was documented in a note in the patient electronic health record. The prescriber was notified through the note and the patient received a notification letter. Follow-up laboratory monitoring was not required as part of the protocol.
If patients met any of the exclusion criteria for discontinuation, the primary care provider (PCP) was notified to place a consult to the PACT Pharmacy Clinic for individualized interventions and close monitoring. Patients prescribed niacin for nonlipid indications were allowed to continue with their current drug regimen. At each encounter, the PACT CPS assessed for ADRs, made individualized medication changes, and arranged follow-up appointments. Once the interaction was resolved and treatment goals met, the PCP resumed monitoring of the patient’s lipid therapy.
Following all pharmacist interventions, a retrospective quality improvement analysis was conducted. The primary outcome was to evaluate the impact of discontinuing gemfibrozil and niacin by protocol on patients’ laboratory results. The coprimary endpoints were to describe the change in TG levels and the percentage of patients with TGs ≥ 500 mg/dL at least 5 weeks following the pharmacist-directed discontinuation by protocol. Secondary outcomes included the time required to resolve the interactions and a description of the PACT CPS pharmacologic interventions. Additionally, a quality assurance peer review was used to ensure the pharmacists appropriately utilized the protocols.
Data were collected from August 2016 to September 2017 for patients prescribed gemfibrozil and from May 2017 to January 2018 for patients prescribed niacin. The time spent resolving interactions was quantified based on encounter data. Descriptive statistics were used to analyze demographic information and the endpoints associated with each outcome. The project was reviewed by the University of Missouri Institutional Review Board, Truman VA privacy and information security officers, and was determined to meet guidelines for quality improvement.
Results
The original STOP report included 397 drug interactions involving statins with gemfibrozil or niacin (Table 1). The majority of patients were white and male aged 60 to 79 years. Gemfibrozil was the most common drug involved in all interactions (79.8%). The most common statins were atorvastatin (40%) and simvastatin (36.5%).
Gemfibrozil-Statin Interactions
Pharmacists discontinued gemfibrozil by protocol for 94 patients (29.6%), and 107 patients (33.8%) were referred to the PACT Pharmacy Clinic (Figure 3). For the remaining 116 patients (36.6%), the drug interaction was addressed outside of the protocol for the following reasons: the drug interaction was resolved prior to pharmacist review; an interacting prescription was expired and not to be continued; the patient self-discontinued ≥ 1 interacting medications; the patient was deceased; the patient moved; the patient was receiving ≥ 1 interacting medications outside of the VA; or the prescriber resolved the interaction following notification by the pharmacist.
Ultimately, the interaction was resolved for all patients with a gemfibrozil-statin interaction on the STOP report. Following gemfibrozil discontinuation by protocol, 76 patients (80.9%) had TG laboratory results available and were included in the analysis. Sixty-two patients’ (82%) TG levels decreased or increased by < 100 mg/dL (Figure 4), and the TG levels of 1 patient (1.3%) increased above the threshold of 500 mg/dL. The mean (SD) time to the first laboratory result after the pharmacists mailed the notification letter was 6.5 (3.6) months (range, 1-17). The pharmacists spent a mean of 16 minutes per patient resolving each interaction.
Of the 107 patients referred to the PACT Pharmacy Clinic, 80 (74.8%) had TG laboratory results available and were included in the analysis. These patients were followed by the PACT CPS until the drug interaction was resolved and confirmed to have TG levels at goal (< 500 mg/dL). Gemfibrozil doses ranged from 300 mg daily to 600 mg twice daily, with 70% (n = 56) of patients taking 600 mg twice daily. The PACT CPS made 148 interventions (Table 2). Twenty-three (29%) patients required only gemfibrozil discontinuation. The remaining 57 patients (71%) required at least 2 medication interventions. The PACT CPS generated 213 encounters for resolving drug interactions with a median of 2 encounters per patient.
Quality assurance review identified 5 patients (5.3%) who underwent gemfibrozil discontinuation by protocol, despite having criteria that would have recommended against discontinuation. In accordance with the protocol criteria, these patients were later referred to the PACT Pharmacy Clinic. None of these patients experienced a TG increase at or above the threshold of 500 mg/dL after gemfibrozil was initially discontinued but were excluded from the earlier analysis.
Niacin-Statin Interactions
Pharmacists discontinued niacin by protocol for 48 patients (60.0%), and 22 patients (27.5%) were referred to the PACT Pharmacy Clinic (Figure 5). For the remaining 5 patients (6.3%), the interaction was either addressed outside the protocol prior to pharmacist review, or an interacting prescription was expired and not to be continued. Additionally, niacin was continued per prescriber preference in 5 patients (6.3%).
Thirty-six patients (75%) had TG laboratory results available following niacin discontinuation by protocol and were included in the analysis. Most patients’ (n = 33, 91.7%) TG levels decreased or increased by < 100 mg/dL. No patient had a TG level that increased higher than the threshold of 500 mg/dL. The mean (SD) time to the first laboratory result after the pharmacists mailed the notification letter, was 5.3 (2.5) months (range, 1.2-9.8). The pharmacists spent a mean of 15 minutes per patient resolving each interaction. The quality assurance review found no discrepancies in the pharmacists’ application of the protocol.
Of the 22 patients referred to the PACT Pharmacy Clinic, 16 (72.7%) patients had TG laboratory results available and were included in the analysis. As with the gemfibrozil interactions, these patients were followed by the PACT Pharmacy Clinic until the drug interaction was resolved and confirmed to have TGs at goal (< 500 mg/dL). Niacin doses ranged from 500 mg daily to 2,000 mg daily, with the majority of patients taking 1,000 mg daily. The PACT CPS made 23 interventions. The PACT CPS generated 46 encounters for resolving drug interactions with a median of 2 encounters per patient.
Discussion
Following gemfibrozil or niacin discontinuation by protocol, most patients with available laboratory results experienced either a decrease or modest TG elevation. The proportion of patients experiencing a decrease in TGs was unexpected but potentially multifactorial. Individual causes for the decrease in TGs were beyond the scope of this analysis. The retrospective design limited the ability to identify variables that could have impacted TG levels when gemfibrozil or niacin were started and discontinued. Although the treatment of TG levels is not indicated until it is ≥ 500 mg/dL, due to an increased risk of pancreatitis, both protocols excluded patients with a history of TGs ≥ 400 mg/dL.19 The lower threshold was set to compensate for anticipated increase in TG levels, following gemfibrozil or niacin discontinuation, and to minimize the number of patients with TG levels ≥ 500 mg/dL. The actual impact on patients’ TG levels supports the use of this lower threshold in the protocol.
When TG levels increased by 200 to 249 mg/dL after gemfibrozil or niacin discontinuation, patients were evaluated for possible underlying causes, which occurred for 4 gemfibrozil and 1 niacin patient. One patient started a β-blocker after gemfibrozil was initiated, and 3 patients were taking gemfibrozil prior to establishing care at the VA. The TG levels of the patient taking niacin correlated with an increased hemoglobin A1c. The TG level for only 1 patient taking gemfibrozil increased above the 500 mg/dL threshold. The patient had several comorbidities known to increase TG levels, but the comorbidities were previously well controlled. No additional medication changes were made at that time, and the TG levels on the next fasting lipid panel decreased to goal. The patient did not experience any negative clinical sequelae from the elevated TG levels.
Thirty-five patients (36%) who were referred to the PACT Pharmacy Clinic required only either gemfibrozil or niacin discontinuation. These patients were evaluated to identify whether adjustments to the protocols would have allowed for pharmacist discontinuation without referral to the PACT Pharmacy Clinic. Twenty-four of these patients (69%) had repeated TG levels ≥ 400 mg/dL prior to referral to the PACT Pharmacy Clinic. Additionally, there was no correlation between the gemfibrozil or niacin doses and the change in TG levels following discontinuation. These data indicate the protocols appropriately identified patients who did not have an indication for gemfibrozil or niacin.
In addition to drug interactions identified on the STOP report, the PACT CPS resolved 12 additional interactions involving simvastatin and gemfibrozil. Additionally, unnecessary lipid medications were deprescribed. The PACT CPS identified 13 patients who experienced myalgias, an ADR attributed to the gemfibrozil- statin interaction. Of those, 9 patients’ ADRs resolved after discontinuing gemfibrozil alone. For the remaining 4 patients, additional interventions to convert the patient to another statin were required to resolve the ADR.
Using pharmacists to address the drug interactions shifted workload from the prescribers and other primary care team members. The mean time spent to resolve both gemfibrozil and niacin interactions by protocol was 15.5 minutes. One hundred fortytwo patients (35.8%) had drug interactions resolved by protocol, saving the PACT CPS’ expertise for patients requiring individualized interventions. Drug interactions were resolved within 4 PACT CPS encounters for 93.8% of the patients taking gemfibrozil and within 3 PACT CPS encounters for 93.8% of the patients taking niacin.
The protocols allowed 12 additional pharmacists who did not have an ambulatory care scope of practice to assist the PACT CPS in mitigating the STOP drug interactions. These pharmacists otherwise would have been limited to making consultative recommendations. Simultaneously, the design allowed for the PACT pharmacists’ expertise to be allocated for patients most likely to require interventions beyond the protocols. This type of intraprofessional referral process is not well described in the medical literature. To the authors’ knowledge, the only studies described referrals from hospital pharmacists to community pharmacists during transitions of care on hospital discharge.20,21
Limitations
The results of this study are derived from a retrospective chart review at a single VA facility. The autonomous nature of PACT CPS interventions may be difficult to replicate in other settings that do not permit pharmacists the same prescriptive authority. This analysis was designed to demonstrate the impact of the pharmacist in resolving major drug interactions. Patients referred to the PACT Pharmacy Clinic who also had their lipid medications adjusted by a nonpharmacist provider were excluded. However, this may have minimized the impact of the PACT CPS on the patient care provided. As postintervention laboratory results were not available for all patients, some patients’ TG levels could have increased above the 500 mg/dL threshold but were not identified. The time investment was extensive and likely underestimates the true cost of implementing the interventions.
Because notification letters were used to instruct patients to stop gemfibrozil or niacin, several considerations need to be addressed when interpreting the follow-up laboratory results. First, we cannot confirm whether the patients received the letter or the exact date the letter was received. Additionally, we cannot confirm whether the patients followed the instructions to stop the interacting medications or the date the medications were stopped. It is possible some patients were still taking the interacting medication when the first laboratory was drawn. Should a patient have continued the interacting medication, most would have run out and been unable to obtain a refill within 90 days of receiving the letter, as this is the maximum amount dispensed at one time. The mean time to the first laboratory result for both gemfibrozil and niacin was 6.5 and 5.3 months, respectively. Approximately 85% of patients completed the first laboratory test at least 3 months after the letter was mailed.
The protocols were designed to assess whether gemfibrozil or niacin was indicated and did not assess whether the statin was indicated. Therefore, discontinuing the statin also could have resolved the interaction appropriately. However, due to characteristics of the patient population and recommendations in current lipid guidelines, it was more likely the statin would be indicated.22,23 The protocols also assumed that patients eligible for gemfibrozil or niacin discontinuation would not need additional changes to their lipid medications. The medication changes made by the PACT CPS may have gone beyond those minimally necessary to resolve the drug interaction and maintain TG goals. Patients who had gemfibrozil or niacin discontinued by protocol also may have benefited from additional optimization of their lipid medications.
Conclusions
This quality improvement analysis supports further evaluation of the complementary use of protocols and PACT CPS prescriptive authority to resolve statin drug interactions. The gemfibrozil and niacin protocols appropriately identified patients who were less likely to experience an adverse change in TG laboratory results. Patients more likely to require additional medication interventions were appropriately referred to the PACT Pharmacy Clinics for individualized care. These data support expanded roles for pharmacists, across various settings, to mitigate select drug interactions at the Truman VA.
Acknowledgments
This quality improvement project is the result of work supported with resources and use of the Harry S. Truman Memorial Veterans’ Hospital in Columbia, Missouri.
1. The top 200 drugs of 2020 Provided by the ClinCalc DrugStats Database. http://clincalc.com/DrugStats /Top200Drugs.aspx. Updated February 11, 2017. Accessed May 12, 2020.
2. Wiggins BS, Saseen JJ, Page RL 2nd, et al; American Heart Association Clinical Pharmacology Committee of the Council on Clinical Cardiology; Council on Hypertension; Council on Quality of Care and Outcomes Research; and Council on Functional Genomics and Translational Biology. Recommendations for management of clinically significant drug-drug interactions with statins and select agents used in patients with cardiovascular disease: a scientific statement from the American Heart Association. Circulation. 2016;134(21):e468‐e495. doi:10.1161/CIR.0000000000000456
3. Smithburger PL, Buckley MS, Bejian S, Burenheide K, Kane-Gill SL. A critical evaluation of clinical decision support for the detection of drug-drug interactions. Expert Opin Drug Saf. 2011;10(6):871‐882. doi:10.1517/14740338.2011.583916
4. US Food and Drug Administration. FDA drug safety communication: new restrictions, contraindications, and dose limitations for Zocor (simvastatin) to reduce the risk of muscle injury. https://www.fda.gov/Drugs/DrugSafety /ucm256581.htm. Updated December 15, 2017. Accessed May 12, 2020.
5. US Food and Drug Administration. FDA drug safety communication: important safety label changes to cholesterol-lowering statin drugs. https://www.fda.gov /Drugs/DrugSafety/ucm293101.htm. Updated January 19, 2016. Accessed May 12, 2020.
6. US Food and Drug Administration Federal Register. AbbVie Inc. et al; withdrawal of approval of indications related to the coadministration with statins in applications for niacin extended-release tablets and fenofibric acid delayed-release capsules. https://www.federalregister .gov/documents/2016/04/18/2016-08887/abbvie-inc -et-al-withdrawal-of-approval-of-indications-related -to-the-coadministration-with-statins. Published April 18, 2016. Accessed May 12, 2020.
7. Lamprecht DG Jr, Todd BA, Denham AM, Ruppe LK, Stadler SL. Clinical pharmacist patient-safety initiative to reduce against-label prescribing of statins with cyclosporine. Ann Pharmacother. 2017;51(2):140‐145. doi:10.1177/1060028016675352
8. Roblek T, Deticek A, Leskovar B, et al. Clinical-pharmacist intervention reduces clinically relevant drugdrug interactions in patients with heart failure: A randomized, double-blind, controlled trial. Int J Cardiol. 2016;203:647‐652. doi:10.1016/j.ijcard.2015.10.206
9. Tuchscherer RM, Nair K, Ghushchyan V, Saseen JJ. Simvastatin prescribing patterns before and after FDA dosing restrictions: a retrospective analysis of a large healthcare claims database. Am J Cardiovasc Drugs. 2015;15(1):27‐34. doi:10.1007/s40256-014-0096-x
10. Alford JC, Saseen JJ, Allen RR, Nair KV. Persistent use of against-label statin-fibrate combinations from 2003-2009 despite United States Food and Drug Administration dose restrictions. Pharmacotherapy. 2012;32(7):623‐630. doi:10.1002/j.1875-9114.2011.01090.x
11. Leape LL, Cullen DJ, Clapp MD, et al. Pharmacist participation on physician rounds and adverse drug events in the intensive care unit [published correction appears in JAMA 2000 Mar 8;283(10):1293]. JAMA. 1999;282(3):267‐270. doi:10.1001/jama.282.3.267
12. Kucukarslan SN, Peters M, Mlynarek M, Nafziger DA. Pharmacists on rounding teams reduce preventable adverse drug events in hospital general medicine units. Arch Intern Med. 2003;163(17):2014‐2018. doi:10.1001/archinte.163.17.2014
13. Humphries TL, Carroll N, Chester EA, Magid D, Rocho B. Evaluation of an electronic critical drug interaction program coupled with active pharmacist intervention. Ann Pharmacother. 2007;41(12):1979‐1985. doi:10.1345/aph.1K349
14. Zocor [package insert]. Whitehouse Station, NJ: Merck & Co, Inc; 2018.
15. Lipitor [package insert]. New York, NY: Pfizer; 2017.
16. Crestor [package insert]. Wilmington, DE: AstraZeneca; 2018.
17. Mevacor [package insert]. Whitehouse Station, NJ: Merck & Co, Inc; 2012.
18. Wolters Kluwer Health, Lexi-Drugs, Lexicomp. Pravastatin. www.online.lexi.com. [Source not verified.]
19. Miller M, Stone NJ, Ballantyne C, et al; American Heart Association Clinical Lipidology, Thrombosis, and Prevention Committee of the Council on Nutrition, Physical Activity, and Metabolism; Council on Arteriosclerosis, Thrombosis and Vascular Biology; Council on Cardiovascular Nursing; Council on the Kidney in Cardiovascular Disease. Triglycerides and cardiovascular disease: a scientific statement from the American Heart Association. Circulation. 2011;123(20):2292-2333. doi: 10.1161/CIR.0b013e3182160726
20. Ferguson J, Seston L, Ashcroft DM. Refer-to-pharmacy: a qualitative study exploring the implementation of an electronic transfer of care initiative to improve medicines optimisation following hospital discharge. BMC Health Serv Res. 2018;18(1):424. doi:10.1186/s12913-018-3262-z
21. Ensing HT, Koster ES, Dubero DJ, van Dooren AA, Bouvy ML. Collaboration between hospital and community pharmacists to address drug-related problems: the HomeCoMe-program. Res Social Adm Pharm. 2019;15(3):267‐278. doi:10.1016/j.sapharm.2018.05.001
22. US Department of Defense, US Department of Veterans Affairs. VA/DoD clinical practice guideline for the management of dyslipidemia for cardiovascular risk reduction guideline summary. https://www.healthquality.va.gov /guidelines/CD/lipids/LipidSumOptSinglePg31Aug15.pdf. Published 2014. Accessed May 14, 2020.
23. Stone NJ, Robinson JG, Lichtenstein AH, et al. 2013 ACC/AHA guideline on the treatment of blood cholesterol to reduce atherosclerotic cardiovascular risk in adults: a report of the American College of Cardiology/ American Heart Association Task Force on Practice Guidelines [published correction appears in Circulation. 2014 Jun 24;129(25) (suppl 2):S46-48] [published correction appears in Circulation. 2015 Dec 22;132(25):e396]. Circulation. 2014;129(25)(suppl 2): S1‐S45. doi:10.1161/01.cir.0000437738.63853.7a
1. The top 200 drugs of 2020 Provided by the ClinCalc DrugStats Database. http://clincalc.com/DrugStats /Top200Drugs.aspx. Updated February 11, 2017. Accessed May 12, 2020.
2. Wiggins BS, Saseen JJ, Page RL 2nd, et al; American Heart Association Clinical Pharmacology Committee of the Council on Clinical Cardiology; Council on Hypertension; Council on Quality of Care and Outcomes Research; and Council on Functional Genomics and Translational Biology. Recommendations for management of clinically significant drug-drug interactions with statins and select agents used in patients with cardiovascular disease: a scientific statement from the American Heart Association. Circulation. 2016;134(21):e468‐e495. doi:10.1161/CIR.0000000000000456
3. Smithburger PL, Buckley MS, Bejian S, Burenheide K, Kane-Gill SL. A critical evaluation of clinical decision support for the detection of drug-drug interactions. Expert Opin Drug Saf. 2011;10(6):871‐882. doi:10.1517/14740338.2011.583916
4. US Food and Drug Administration. FDA drug safety communication: new restrictions, contraindications, and dose limitations for Zocor (simvastatin) to reduce the risk of muscle injury. https://www.fda.gov/Drugs/DrugSafety /ucm256581.htm. Updated December 15, 2017. Accessed May 12, 2020.
5. US Food and Drug Administration. FDA drug safety communication: important safety label changes to cholesterol-lowering statin drugs. https://www.fda.gov /Drugs/DrugSafety/ucm293101.htm. Updated January 19, 2016. Accessed May 12, 2020.
6. US Food and Drug Administration Federal Register. AbbVie Inc. et al; withdrawal of approval of indications related to the coadministration with statins in applications for niacin extended-release tablets and fenofibric acid delayed-release capsules. https://www.federalregister .gov/documents/2016/04/18/2016-08887/abbvie-inc -et-al-withdrawal-of-approval-of-indications-related -to-the-coadministration-with-statins. Published April 18, 2016. Accessed May 12, 2020.
7. Lamprecht DG Jr, Todd BA, Denham AM, Ruppe LK, Stadler SL. Clinical pharmacist patient-safety initiative to reduce against-label prescribing of statins with cyclosporine. Ann Pharmacother. 2017;51(2):140‐145. doi:10.1177/1060028016675352
8. Roblek T, Deticek A, Leskovar B, et al. Clinical-pharmacist intervention reduces clinically relevant drugdrug interactions in patients with heart failure: A randomized, double-blind, controlled trial. Int J Cardiol. 2016;203:647‐652. doi:10.1016/j.ijcard.2015.10.206
9. Tuchscherer RM, Nair K, Ghushchyan V, Saseen JJ. Simvastatin prescribing patterns before and after FDA dosing restrictions: a retrospective analysis of a large healthcare claims database. Am J Cardiovasc Drugs. 2015;15(1):27‐34. doi:10.1007/s40256-014-0096-x
10. Alford JC, Saseen JJ, Allen RR, Nair KV. Persistent use of against-label statin-fibrate combinations from 2003-2009 despite United States Food and Drug Administration dose restrictions. Pharmacotherapy. 2012;32(7):623‐630. doi:10.1002/j.1875-9114.2011.01090.x
11. Leape LL, Cullen DJ, Clapp MD, et al. Pharmacist participation on physician rounds and adverse drug events in the intensive care unit [published correction appears in JAMA 2000 Mar 8;283(10):1293]. JAMA. 1999;282(3):267‐270. doi:10.1001/jama.282.3.267
12. Kucukarslan SN, Peters M, Mlynarek M, Nafziger DA. Pharmacists on rounding teams reduce preventable adverse drug events in hospital general medicine units. Arch Intern Med. 2003;163(17):2014‐2018. doi:10.1001/archinte.163.17.2014
13. Humphries TL, Carroll N, Chester EA, Magid D, Rocho B. Evaluation of an electronic critical drug interaction program coupled with active pharmacist intervention. Ann Pharmacother. 2007;41(12):1979‐1985. doi:10.1345/aph.1K349
14. Zocor [package insert]. Whitehouse Station, NJ: Merck & Co, Inc; 2018.
15. Lipitor [package insert]. New York, NY: Pfizer; 2017.
16. Crestor [package insert]. Wilmington, DE: AstraZeneca; 2018.
17. Mevacor [package insert]. Whitehouse Station, NJ: Merck & Co, Inc; 2012.
18. Wolters Kluwer Health, Lexi-Drugs, Lexicomp. Pravastatin. www.online.lexi.com. [Source not verified.]
19. Miller M, Stone NJ, Ballantyne C, et al; American Heart Association Clinical Lipidology, Thrombosis, and Prevention Committee of the Council on Nutrition, Physical Activity, and Metabolism; Council on Arteriosclerosis, Thrombosis and Vascular Biology; Council on Cardiovascular Nursing; Council on the Kidney in Cardiovascular Disease. Triglycerides and cardiovascular disease: a scientific statement from the American Heart Association. Circulation. 2011;123(20):2292-2333. doi: 10.1161/CIR.0b013e3182160726
20. Ferguson J, Seston L, Ashcroft DM. Refer-to-pharmacy: a qualitative study exploring the implementation of an electronic transfer of care initiative to improve medicines optimisation following hospital discharge. BMC Health Serv Res. 2018;18(1):424. doi:10.1186/s12913-018-3262-z
21. Ensing HT, Koster ES, Dubero DJ, van Dooren AA, Bouvy ML. Collaboration between hospital and community pharmacists to address drug-related problems: the HomeCoMe-program. Res Social Adm Pharm. 2019;15(3):267‐278. doi:10.1016/j.sapharm.2018.05.001
22. US Department of Defense, US Department of Veterans Affairs. VA/DoD clinical practice guideline for the management of dyslipidemia for cardiovascular risk reduction guideline summary. https://www.healthquality.va.gov /guidelines/CD/lipids/LipidSumOptSinglePg31Aug15.pdf. Published 2014. Accessed May 14, 2020.
23. Stone NJ, Robinson JG, Lichtenstein AH, et al. 2013 ACC/AHA guideline on the treatment of blood cholesterol to reduce atherosclerotic cardiovascular risk in adults: a report of the American College of Cardiology/ American Heart Association Task Force on Practice Guidelines [published correction appears in Circulation. 2014 Jun 24;129(25) (suppl 2):S46-48] [published correction appears in Circulation. 2015 Dec 22;132(25):e396]. Circulation. 2014;129(25)(suppl 2): S1‐S45. doi:10.1161/01.cir.0000437738.63853.7a
When Grief and Crises Intersect: Perspectives of a Black Physician in the Time of Two Pandemics
“Hey there—just checking on you and letting you know I’m thinking of you.”
“I know words don’t suffice right now. You are in my thoughts.”
“If there’s any way that I can be of support or if there’s something you need, just let me know.”
The texts and emails have come in waves. Pinging into my already distracted headspace when, like them, I’m supposed to be focused on a Zoom or WebEx department meeting. These somber reminders underscore what I have known for years but struggled to describe with each new “justice for” hashtag accompanying the name of the latest unarmed Black person to die. This is grief.
With every headline in prior years, as Black Americans we have usually found solace in our collective fellowship of suffering. Social media timelines become flooded with our own amen choirs and outrage along with words of comfort and inspiration. We remind ourselves of the prior atrocities survived by our people. And like them, we vow to rally; clinging to one other and praying to make it to shore. Though intermittently joined by a smattering of allies, our suffering has mostly been a private, repetitive mourning.
THE TWO PANDEMICS
The year 2020 ushered in a new decade along with the novel SARS-CoV2 (COVID-19) global pandemic. In addition to the thousands of lives that have been lost in the United States alone, COVID-19 brought with it a disruption of life in ways never seen by most generations. Schools and businesses were closed to mitigate spread. Mandatory shelter-in-place orders coupled with physical distancing recommendations limited human interactions and cancelled everything from hospital visitations to graduations, intergenerational family gatherings, conferences, and weddings.1 As the data expanded, it quickly became apparent that minorities, particularly Black Americans, shouldered a disproportionate burden of COVID-19.2 Known health disparities were amplified.
While caring for our patients as Black physicians in the time of coronavirus, silently we mourned again. The connection and trust once found through racial concordance was now masked figuratively and literally by personal protective equipment (PPE). We ignored the sting of intimations that the staggering numbers of African Americans hospitalized and dying from COVID-19 could be explained by lack of discipline or, worse, genetic differences by race. Years of disenfranchisement and missed economic opportunities forced large numbers of our patients and loved ones out on the front lines to do essential jobs—but without the celebratory cheers or fanfare enjoyed by others. Frantic phone calls from family and acquaintances interrupted our quiet drives home from emotionally grueling shifts in the hospital—each conversation serving as our personal evidence of COVID-19 and her ruthless ravage of the Black community. Add to this trying to serve as cultural bridges between the complexities of medical distrust and patient advocacy along with wrestling with our own vulnerability as potential COVID-19 patients, these have been overwhelming times to say the least.
Then came the acute decompensation of the chronic racism we’d always known in the form of three recent killings of more unarmed African Americans. On March 13, 2020, 26-year-old Breonna Taylor was shot after police forcibly entered her home after midnight on a “no knock” warrant.3 The story was buried in the news of COVID-19—but we knew. Later we’d learn that 26-year-old Ahmaud Arbery was shot and killed by armed neighbors while running through a Brunswick, Georgia, neighborhood. His death on February 23, 2020, initially yielded no criminal charges.4 Then, on May 25, 2020, George Floyd, a 46-year-old father arrested for suspected use of a counterfeit $20 bill, died after a law enforcement official kneeled with his full body weight upon Floyd’s neck for over 8 minutes.5 The deaths of Arbery and Floyd were captured by cell phone cameras which, aided by social media, quickly reached the eyes of the entire world.
At first, it seemed plausible that this would be like it always has been. A Black mother would stand before a podium filled with multiple microphones crying out in anguish. She would be flanked by community leaders and attorneys demanding justice. Hashtags would be formed. Our people would stand up or kneel down in solidarity—holding fast to our historic resilience. Evanescent allies would appear with signs on lawns and held high over heads. A few weeks would pass by and things would go back to normal. Black people would be left with what always remains: heads bowed and praying at dinner tables petitioning a higher power for protection followed by reaffirmations of what, if anything, could be done to keep our own mamas away from that podium. We’ve learned to treat the grief of racism as endemic to us alone, knowing that it has been a pandemic all along.
A TIME OF RECKONING
The intersection of the crisis of the COVID-19 pandemic, complete with its social isolation and inordinate impact on minorities, and the acuity of the grief felt by the most recent events of abject racism have coalesced to form what feels like a pivotal point in the arc of justice. Like the bloated, disfigured face of lynched teenager Emmett Till lying lifeless in an open casket for the entire world to see in 1955,6 footage of these recent deaths typify a level of inhumanity that makes it too hard to turn away or carry on in indifference. The acute-on-chronic grief of racism felt by African Americans has risen into a tsunami, washing open the eyes of privileged persons belonging to all races, ethnicities, faiths, socioeconomic backgrounds, political views, and ages. The bulging neck veins, crackles, and thumping gallop rhythm of our hidden grief has declared itself: The rest of the world now knows that we can’t breathe.
Our moral outrage is pushing us to do something. Marches and demonstrations have occurred in nearly every major city. For those historically disenfranchised and let down by our societal contract, grief has, at times, met rage. Though we all feel an urgency, when we try to imagine ways to dismantle racism in the US it seems insurmountable. But as hospitalists and leaders, we will face black patients, colleagues, and neighbors navigating the pain of this exhausting collective trauma. While we won’t have all the answers immediately, we recognize the peculiar intersection between the COVID-19 crisis and the tipping point of grief felt by Black people with the recent deaths of Ahmaud Arbery, Breonna Taylor, and George Floyd, and it urges us to try.
Where can we start?
This is a time of deep sorrow for Black people. Recognizing it as such is an empathic place to begin. Everyone steers through grief differently, but a few things always hold true:
- Listen more than you talk—even if it’s uncomfortable. This isn’t a time to render opinions or draw suffering comparisons.
- Timely support is always appreciated. Leaders should feel the urgency to speak up early and often. Formal letters from leadership on behalf of organizations may feel like an echo chamber but they are worth the effort. Delays can be misunderstood as indifference and make the pain worse.
- The ministry of presence does not have to be physical. Those awkward text messages and emails create psychological safety in your organization and reduce loneliness. They also afford space to those who are still processing emotions and would prefer not to talk.
- Don’t place an expectation on the grieving to guide you through ways to help them heal. Though well-meaning, it can be overwhelming. This is particularly true in these current times.
- When in doubt, remember that support is a verb. Ultimately, sustained action or inaction will make your position clearer than any text message or email. Be sensitive to the unique intricacy of chronicity and missed opportunity when talking about racism.
Along with the pain we all feel from the impact of COVID-19, this is the time to recognize that your African American colleagues, patients, and friends have been navigating another tenacious and far more destructive pandemic at the same time. It is acute. It is chronic. It is acute-on-chronic. Perhaps 2020 will also be remembered for the opportunity it presented for the centuries old scourge of racism to no longer be our transparent cross to bear alone. Unlike COVID-19, this pandemic of racism is not “unprecedented.” We have been here before. It’s time we all grieve—and act—together.
1. COVID-19: Statewide Shelter in Place Order. https://georgia.gov/covid-19-state-services-georgia/covid-19-statewide-shelter-place-order. Accessed June 2, 2020.
2. Garg S, Kim L, Whitaker M, et al. Hospitalization Rates and Characteristics of Patients Hospitalized with Laboratory-Confirmed Coronavirus Disease 2019—COVID-NET, 14 States, March 1–30, 2020. MMWR Morb Mortal Wkly Rep. 2020;69:458–464. http://dx.doi.org/10.15585/mmwr.mm6915e3.
3. Oppel RA Jr. Here’s what you need to know about Breonna Taylor’s death. May 30, 2020. New York Times. https://www.nytimes.com/article/breonna-taylor-police.html. Accessed June 2, 2020.
4. Fausset R. What we know about the shooting death of Ahmaud Arbery. New York Times. May 22, 2020. https://www.nytimes.com/article/ahmaud-arbery-shooting-georgia.html. Accessed June 2, 2020.
5. Hill E, Tiefenthäler, Triebert C, Jordan D, Willis H, Stein R. 8 minutes and 46 seconds: how George Floyd was killed in police custody. May 31, 2020. New York Times. https://www.nytimes.com/2020/05/31/us/george-floyd-investigation.html. Accessed June 2, 2020.
6. Pilkington E. Will justice finally be done for Emmett Till? Family hope a 65-year wait may soon be over. April 25, 2020. The Guardian. https://www.theguardian.com/us-news/2020/apr/25/emmett-till-long-wait-for-justice. Accessed June 2, 2020.
“Hey there—just checking on you and letting you know I’m thinking of you.”
“I know words don’t suffice right now. You are in my thoughts.”
“If there’s any way that I can be of support or if there’s something you need, just let me know.”
The texts and emails have come in waves. Pinging into my already distracted headspace when, like them, I’m supposed to be focused on a Zoom or WebEx department meeting. These somber reminders underscore what I have known for years but struggled to describe with each new “justice for” hashtag accompanying the name of the latest unarmed Black person to die. This is grief.
With every headline in prior years, as Black Americans we have usually found solace in our collective fellowship of suffering. Social media timelines become flooded with our own amen choirs and outrage along with words of comfort and inspiration. We remind ourselves of the prior atrocities survived by our people. And like them, we vow to rally; clinging to one other and praying to make it to shore. Though intermittently joined by a smattering of allies, our suffering has mostly been a private, repetitive mourning.
THE TWO PANDEMICS
The year 2020 ushered in a new decade along with the novel SARS-CoV2 (COVID-19) global pandemic. In addition to the thousands of lives that have been lost in the United States alone, COVID-19 brought with it a disruption of life in ways never seen by most generations. Schools and businesses were closed to mitigate spread. Mandatory shelter-in-place orders coupled with physical distancing recommendations limited human interactions and cancelled everything from hospital visitations to graduations, intergenerational family gatherings, conferences, and weddings.1 As the data expanded, it quickly became apparent that minorities, particularly Black Americans, shouldered a disproportionate burden of COVID-19.2 Known health disparities were amplified.
While caring for our patients as Black physicians in the time of coronavirus, silently we mourned again. The connection and trust once found through racial concordance was now masked figuratively and literally by personal protective equipment (PPE). We ignored the sting of intimations that the staggering numbers of African Americans hospitalized and dying from COVID-19 could be explained by lack of discipline or, worse, genetic differences by race. Years of disenfranchisement and missed economic opportunities forced large numbers of our patients and loved ones out on the front lines to do essential jobs—but without the celebratory cheers or fanfare enjoyed by others. Frantic phone calls from family and acquaintances interrupted our quiet drives home from emotionally grueling shifts in the hospital—each conversation serving as our personal evidence of COVID-19 and her ruthless ravage of the Black community. Add to this trying to serve as cultural bridges between the complexities of medical distrust and patient advocacy along with wrestling with our own vulnerability as potential COVID-19 patients, these have been overwhelming times to say the least.
Then came the acute decompensation of the chronic racism we’d always known in the form of three recent killings of more unarmed African Americans. On March 13, 2020, 26-year-old Breonna Taylor was shot after police forcibly entered her home after midnight on a “no knock” warrant.3 The story was buried in the news of COVID-19—but we knew. Later we’d learn that 26-year-old Ahmaud Arbery was shot and killed by armed neighbors while running through a Brunswick, Georgia, neighborhood. His death on February 23, 2020, initially yielded no criminal charges.4 Then, on May 25, 2020, George Floyd, a 46-year-old father arrested for suspected use of a counterfeit $20 bill, died after a law enforcement official kneeled with his full body weight upon Floyd’s neck for over 8 minutes.5 The deaths of Arbery and Floyd were captured by cell phone cameras which, aided by social media, quickly reached the eyes of the entire world.
At first, it seemed plausible that this would be like it always has been. A Black mother would stand before a podium filled with multiple microphones crying out in anguish. She would be flanked by community leaders and attorneys demanding justice. Hashtags would be formed. Our people would stand up or kneel down in solidarity—holding fast to our historic resilience. Evanescent allies would appear with signs on lawns and held high over heads. A few weeks would pass by and things would go back to normal. Black people would be left with what always remains: heads bowed and praying at dinner tables petitioning a higher power for protection followed by reaffirmations of what, if anything, could be done to keep our own mamas away from that podium. We’ve learned to treat the grief of racism as endemic to us alone, knowing that it has been a pandemic all along.
A TIME OF RECKONING
The intersection of the crisis of the COVID-19 pandemic, complete with its social isolation and inordinate impact on minorities, and the acuity of the grief felt by the most recent events of abject racism have coalesced to form what feels like a pivotal point in the arc of justice. Like the bloated, disfigured face of lynched teenager Emmett Till lying lifeless in an open casket for the entire world to see in 1955,6 footage of these recent deaths typify a level of inhumanity that makes it too hard to turn away or carry on in indifference. The acute-on-chronic grief of racism felt by African Americans has risen into a tsunami, washing open the eyes of privileged persons belonging to all races, ethnicities, faiths, socioeconomic backgrounds, political views, and ages. The bulging neck veins, crackles, and thumping gallop rhythm of our hidden grief has declared itself: The rest of the world now knows that we can’t breathe.
Our moral outrage is pushing us to do something. Marches and demonstrations have occurred in nearly every major city. For those historically disenfranchised and let down by our societal contract, grief has, at times, met rage. Though we all feel an urgency, when we try to imagine ways to dismantle racism in the US it seems insurmountable. But as hospitalists and leaders, we will face black patients, colleagues, and neighbors navigating the pain of this exhausting collective trauma. While we won’t have all the answers immediately, we recognize the peculiar intersection between the COVID-19 crisis and the tipping point of grief felt by Black people with the recent deaths of Ahmaud Arbery, Breonna Taylor, and George Floyd, and it urges us to try.
Where can we start?
This is a time of deep sorrow for Black people. Recognizing it as such is an empathic place to begin. Everyone steers through grief differently, but a few things always hold true:
- Listen more than you talk—even if it’s uncomfortable. This isn’t a time to render opinions or draw suffering comparisons.
- Timely support is always appreciated. Leaders should feel the urgency to speak up early and often. Formal letters from leadership on behalf of organizations may feel like an echo chamber but they are worth the effort. Delays can be misunderstood as indifference and make the pain worse.
- The ministry of presence does not have to be physical. Those awkward text messages and emails create psychological safety in your organization and reduce loneliness. They also afford space to those who are still processing emotions and would prefer not to talk.
- Don’t place an expectation on the grieving to guide you through ways to help them heal. Though well-meaning, it can be overwhelming. This is particularly true in these current times.
- When in doubt, remember that support is a verb. Ultimately, sustained action or inaction will make your position clearer than any text message or email. Be sensitive to the unique intricacy of chronicity and missed opportunity when talking about racism.
Along with the pain we all feel from the impact of COVID-19, this is the time to recognize that your African American colleagues, patients, and friends have been navigating another tenacious and far more destructive pandemic at the same time. It is acute. It is chronic. It is acute-on-chronic. Perhaps 2020 will also be remembered for the opportunity it presented for the centuries old scourge of racism to no longer be our transparent cross to bear alone. Unlike COVID-19, this pandemic of racism is not “unprecedented.” We have been here before. It’s time we all grieve—and act—together.
“Hey there—just checking on you and letting you know I’m thinking of you.”
“I know words don’t suffice right now. You are in my thoughts.”
“If there’s any way that I can be of support or if there’s something you need, just let me know.”
The texts and emails have come in waves. Pinging into my already distracted headspace when, like them, I’m supposed to be focused on a Zoom or WebEx department meeting. These somber reminders underscore what I have known for years but struggled to describe with each new “justice for” hashtag accompanying the name of the latest unarmed Black person to die. This is grief.
With every headline in prior years, as Black Americans we have usually found solace in our collective fellowship of suffering. Social media timelines become flooded with our own amen choirs and outrage along with words of comfort and inspiration. We remind ourselves of the prior atrocities survived by our people. And like them, we vow to rally; clinging to one other and praying to make it to shore. Though intermittently joined by a smattering of allies, our suffering has mostly been a private, repetitive mourning.
THE TWO PANDEMICS
The year 2020 ushered in a new decade along with the novel SARS-CoV2 (COVID-19) global pandemic. In addition to the thousands of lives that have been lost in the United States alone, COVID-19 brought with it a disruption of life in ways never seen by most generations. Schools and businesses were closed to mitigate spread. Mandatory shelter-in-place orders coupled with physical distancing recommendations limited human interactions and cancelled everything from hospital visitations to graduations, intergenerational family gatherings, conferences, and weddings.1 As the data expanded, it quickly became apparent that minorities, particularly Black Americans, shouldered a disproportionate burden of COVID-19.2 Known health disparities were amplified.
While caring for our patients as Black physicians in the time of coronavirus, silently we mourned again. The connection and trust once found through racial concordance was now masked figuratively and literally by personal protective equipment (PPE). We ignored the sting of intimations that the staggering numbers of African Americans hospitalized and dying from COVID-19 could be explained by lack of discipline or, worse, genetic differences by race. Years of disenfranchisement and missed economic opportunities forced large numbers of our patients and loved ones out on the front lines to do essential jobs—but without the celebratory cheers or fanfare enjoyed by others. Frantic phone calls from family and acquaintances interrupted our quiet drives home from emotionally grueling shifts in the hospital—each conversation serving as our personal evidence of COVID-19 and her ruthless ravage of the Black community. Add to this trying to serve as cultural bridges between the complexities of medical distrust and patient advocacy along with wrestling with our own vulnerability as potential COVID-19 patients, these have been overwhelming times to say the least.
Then came the acute decompensation of the chronic racism we’d always known in the form of three recent killings of more unarmed African Americans. On March 13, 2020, 26-year-old Breonna Taylor was shot after police forcibly entered her home after midnight on a “no knock” warrant.3 The story was buried in the news of COVID-19—but we knew. Later we’d learn that 26-year-old Ahmaud Arbery was shot and killed by armed neighbors while running through a Brunswick, Georgia, neighborhood. His death on February 23, 2020, initially yielded no criminal charges.4 Then, on May 25, 2020, George Floyd, a 46-year-old father arrested for suspected use of a counterfeit $20 bill, died after a law enforcement official kneeled with his full body weight upon Floyd’s neck for over 8 minutes.5 The deaths of Arbery and Floyd were captured by cell phone cameras which, aided by social media, quickly reached the eyes of the entire world.
At first, it seemed plausible that this would be like it always has been. A Black mother would stand before a podium filled with multiple microphones crying out in anguish. She would be flanked by community leaders and attorneys demanding justice. Hashtags would be formed. Our people would stand up or kneel down in solidarity—holding fast to our historic resilience. Evanescent allies would appear with signs on lawns and held high over heads. A few weeks would pass by and things would go back to normal. Black people would be left with what always remains: heads bowed and praying at dinner tables petitioning a higher power for protection followed by reaffirmations of what, if anything, could be done to keep our own mamas away from that podium. We’ve learned to treat the grief of racism as endemic to us alone, knowing that it has been a pandemic all along.
A TIME OF RECKONING
The intersection of the crisis of the COVID-19 pandemic, complete with its social isolation and inordinate impact on minorities, and the acuity of the grief felt by the most recent events of abject racism have coalesced to form what feels like a pivotal point in the arc of justice. Like the bloated, disfigured face of lynched teenager Emmett Till lying lifeless in an open casket for the entire world to see in 1955,6 footage of these recent deaths typify a level of inhumanity that makes it too hard to turn away or carry on in indifference. The acute-on-chronic grief of racism felt by African Americans has risen into a tsunami, washing open the eyes of privileged persons belonging to all races, ethnicities, faiths, socioeconomic backgrounds, political views, and ages. The bulging neck veins, crackles, and thumping gallop rhythm of our hidden grief has declared itself: The rest of the world now knows that we can’t breathe.
Our moral outrage is pushing us to do something. Marches and demonstrations have occurred in nearly every major city. For those historically disenfranchised and let down by our societal contract, grief has, at times, met rage. Though we all feel an urgency, when we try to imagine ways to dismantle racism in the US it seems insurmountable. But as hospitalists and leaders, we will face black patients, colleagues, and neighbors navigating the pain of this exhausting collective trauma. While we won’t have all the answers immediately, we recognize the peculiar intersection between the COVID-19 crisis and the tipping point of grief felt by Black people with the recent deaths of Ahmaud Arbery, Breonna Taylor, and George Floyd, and it urges us to try.
Where can we start?
This is a time of deep sorrow for Black people. Recognizing it as such is an empathic place to begin. Everyone steers through grief differently, but a few things always hold true:
- Listen more than you talk—even if it’s uncomfortable. This isn’t a time to render opinions or draw suffering comparisons.
- Timely support is always appreciated. Leaders should feel the urgency to speak up early and often. Formal letters from leadership on behalf of organizations may feel like an echo chamber but they are worth the effort. Delays can be misunderstood as indifference and make the pain worse.
- The ministry of presence does not have to be physical. Those awkward text messages and emails create psychological safety in your organization and reduce loneliness. They also afford space to those who are still processing emotions and would prefer not to talk.
- Don’t place an expectation on the grieving to guide you through ways to help them heal. Though well-meaning, it can be overwhelming. This is particularly true in these current times.
- When in doubt, remember that support is a verb. Ultimately, sustained action or inaction will make your position clearer than any text message or email. Be sensitive to the unique intricacy of chronicity and missed opportunity when talking about racism.
Along with the pain we all feel from the impact of COVID-19, this is the time to recognize that your African American colleagues, patients, and friends have been navigating another tenacious and far more destructive pandemic at the same time. It is acute. It is chronic. It is acute-on-chronic. Perhaps 2020 will also be remembered for the opportunity it presented for the centuries old scourge of racism to no longer be our transparent cross to bear alone. Unlike COVID-19, this pandemic of racism is not “unprecedented.” We have been here before. It’s time we all grieve—and act—together.
1. COVID-19: Statewide Shelter in Place Order. https://georgia.gov/covid-19-state-services-georgia/covid-19-statewide-shelter-place-order. Accessed June 2, 2020.
2. Garg S, Kim L, Whitaker M, et al. Hospitalization Rates and Characteristics of Patients Hospitalized with Laboratory-Confirmed Coronavirus Disease 2019—COVID-NET, 14 States, March 1–30, 2020. MMWR Morb Mortal Wkly Rep. 2020;69:458–464. http://dx.doi.org/10.15585/mmwr.mm6915e3.
3. Oppel RA Jr. Here’s what you need to know about Breonna Taylor’s death. May 30, 2020. New York Times. https://www.nytimes.com/article/breonna-taylor-police.html. Accessed June 2, 2020.
4. Fausset R. What we know about the shooting death of Ahmaud Arbery. New York Times. May 22, 2020. https://www.nytimes.com/article/ahmaud-arbery-shooting-georgia.html. Accessed June 2, 2020.
5. Hill E, Tiefenthäler, Triebert C, Jordan D, Willis H, Stein R. 8 minutes and 46 seconds: how George Floyd was killed in police custody. May 31, 2020. New York Times. https://www.nytimes.com/2020/05/31/us/george-floyd-investigation.html. Accessed June 2, 2020.
6. Pilkington E. Will justice finally be done for Emmett Till? Family hope a 65-year wait may soon be over. April 25, 2020. The Guardian. https://www.theguardian.com/us-news/2020/apr/25/emmett-till-long-wait-for-justice. Accessed June 2, 2020.
1. COVID-19: Statewide Shelter in Place Order. https://georgia.gov/covid-19-state-services-georgia/covid-19-statewide-shelter-place-order. Accessed June 2, 2020.
2. Garg S, Kim L, Whitaker M, et al. Hospitalization Rates and Characteristics of Patients Hospitalized with Laboratory-Confirmed Coronavirus Disease 2019—COVID-NET, 14 States, March 1–30, 2020. MMWR Morb Mortal Wkly Rep. 2020;69:458–464. http://dx.doi.org/10.15585/mmwr.mm6915e3.
3. Oppel RA Jr. Here’s what you need to know about Breonna Taylor’s death. May 30, 2020. New York Times. https://www.nytimes.com/article/breonna-taylor-police.html. Accessed June 2, 2020.
4. Fausset R. What we know about the shooting death of Ahmaud Arbery. New York Times. May 22, 2020. https://www.nytimes.com/article/ahmaud-arbery-shooting-georgia.html. Accessed June 2, 2020.
5. Hill E, Tiefenthäler, Triebert C, Jordan D, Willis H, Stein R. 8 minutes and 46 seconds: how George Floyd was killed in police custody. May 31, 2020. New York Times. https://www.nytimes.com/2020/05/31/us/george-floyd-investigation.html. Accessed June 2, 2020.
6. Pilkington E. Will justice finally be done for Emmett Till? Family hope a 65-year wait may soon be over. April 25, 2020. The Guardian. https://www.theguardian.com/us-news/2020/apr/25/emmett-till-long-wait-for-justice. Accessed June 2, 2020.
© 2020 Society of Hospital Medicine
Intensive Care Unit Utilization After Adoption of a Ward-Based High-Flow Nasal Cannula Protocol
Children hospitalized for bronchiolitis frequently require admission to the intensive care unit (ICU), with estimates as high as 18%1,2 and 35%3 in two prospective, multicenter studies. The indication for ICU admission is nearly always a need for advanced respiratory support, which historically consisted of continuous or bilevel positive airway pressure (CPAP and BiPAP, respectively) or mechanical ventilation. High-flow nasal cannula (HFNC) is a recent addition to the respiratory support armamentarium, delivering heated and humidified oxygen at rates of up to 60 L/min and allowing for clinicians to titrate both flow rate and fraction of inspired oxygen (FiO2).4
Several studies have demonstrated that HFNC is capable of decreasing a child’s work of breathing,5-8 and it has the potential advantage of being better tolerated than other forms of advanced respiratory support.9,10 These case-series physiologic studies informed early ward-based HFNC protocols for bronchiolitis, which were adopted to decrease ICU utilization. Since then, single center observational studies examining the association between ward-based HFNC protocols and subsequent ICU utilization have come to discordant conclusions.11-14 Studying the effect of employing HFNC outside of the ICU is challenging in the context of a randomized, controlled trial (RCT) because it is difficult to blind healthcare providers to the intervention and because crossover from the control group to HFNC is frequent. Two unblinded RCTs published in 2017 and 2018 found that children randomized to conventional nasal cannula were frequently escalated to HFNC (flow rates of 1-2 L/kg per minute), but neither trial found a difference in ICU admission.15,16 Sample sizes substantially larger than those present in currently published or registered RCTs would be required to evaluate the impact of ward-based HFNC protocols on the outcome that inspired the protocols in the first place, namely ICU utilization.17
Children’s hospitals have adopted ward-based HFNC protocols at different time points over the last decade, which allows for a natural experiment—a promising alternative study design that avoids the challenges of blinding, crossover, and modest sample sizes. In order to have sufficient postadoption data for analyses, the present study is limited to ward-based HFNC protocols adopted prior to 2016, which we have termed “early” ward-based HFNC protocols. Among children with bronchiolitis, our objective was to measure the association between hospital-level adoption of a ward-based HFNC protocol and subsequent ICU utilization, using a multicenter network of children’s hospitals.
METHODS
We conducted a multicenter retrospective cohort study using the Pediatric Health Information System (PHIS) database. The PHIS database is operated by the Children’s Hospital Association (Lenexa, Kansas) and provides deidentified patient-level information for children who receive hospital care at 55 US children’s hospitals. Available data elements include patient demographic data, discharge diagnosis and procedure codes, and detailed billing information, such as laboratory, imaging, pharmacy, and supply charges. At the patient level, the use of HFNC vs standard oxygen therapy circuits cannot be discriminated.
Exposure
The study exposure was a hospital’s first ward-based HFNC protocol, with adoption measured at the hospital level at each PHIS site via direct communication with leaders in hospital medicine. In most cases, first contact was made with the pediatric hospital medicine division chief or fellowship program director, who then, if necessary, connected study investigators to local HFNC champions aware of site-specific historical HFNC protocol details. Contact with a hospital was made only if the hospital had contributed at least 6 consecutive years of data to PHIS. Hospitals were classified as “adopting” hospitals if their HFNC protocol met all of the following criteria: (a) allows initiation of HFNC outside of the ICU (on the floor or in the ED), (b) allows continued care outside of the ICU (on the floor), (c) not limited to a small unit like an intermediate care unit, and (d) adopted during a specific, known respiratory season. Hospitals for which ward-based HFNC protocols were adopted but did not meet these criteria were excluded from further analysis. Our intent was to identify large scale, programmatic protocol launches and exclude hospitals with exceptions that might preclude a sizable portion of our cohort from being eligible for the protocol. Hospitals for which inpatient use of HFNC remains limited to the ICU were defined as “nonadopting” hospitals. Respondents at adopting hospitals were asked to share details about their protocol, including patient eligibility criteria and maximum HFNC rates of flow permitted outside of the ICU.
Patient Characteristics
Patients aged 3 to 24 months who were hospitalized at adopting and nonadopting hospitals were included if an International Classification of Diseases, Ninth Revision (ICD-9) discharge diagnosis code for bronchiolitis (466.XX) was present in any position (not limited to a primary diagnosis). The lower age limit of 3 months was chosen to match the most restrictive age eligibility criteria of provided HFNC protocols (Appendix 1). A crosswalk available from the Centers for Medicare & Medicaid Services18 was used to convert ICD-10 diagnosis and procedure codes from recent years to ICD-9 diagnosis and procedure codes. Patients were excluded if their encounter contained a diagnosis or procedure code signifying a complex chronic condition,19 if their hospitalization involved care in the neonatal ICU, or if their admission date occurred outside of the respiratory season. Respiratory season was defined as November 1 through April 30.
Outcomes
Outcomes were measured during three respiratory seasons leading up to adoption and during three respiratory seasons after adoption. The primary outcome was ICU utilization, including the proportion of patients admitted to the ICU and ICU length of stay, expressed as ICU days per 100 patients. Secondary outcomes included mean total length of stay and the proportion of patients who received mechanical ventilation. Lengths of stay were measured in days, the most granular unit of time provided in PHIS over the entire study period. As such, partial days of care are rounded up to 1 full day. A previously published strict definition for mechanical ventilation that limits false positives was used, requiring that patients have a procedure or supply code for mechanical ventilation and a pharmacy charge for a neuromuscular blocking agent.20
Primary Analysis
The primary analysis was restricted to adopting hospitals. An interrupted time series approach was used to measure two possible types of change associated with HFNC protocol adoption: an immediate intervention effect and a change in the slope of an outcome.21 The immediate intervention effect represents the change in the level of the outcome that occurs in the period immediately following the introduction of the protocol. The change in slope is the extent to which the outcome changes on a per season basis, attributable to the protocol. Interrupted time series estimates were adjusted for patient age, gender, race, ethnicity, and insurance type; linear regression was used for continuous outcomes and logistic regression for dichotomous outcomes. An ordinary least squares time series model was used to adjust for autocorrelation and Newey-West standard errors were employed.22 Analyses were performed using STATA version 14 (Stata-Corp, College Station, Texas).
Supplementary Analyses
Two preplanned supplementary analyses were conducted. Supplementary analysis 1 was identical to the primary analysis, with the exception that the first season after adoption was censored. The rationale for censoring the first adoption season was to account for a potential learning effect and/or delayed start to full protocol implementation. Supplementary analysis 2 used the nonadopting hospitals as a control group and subtracted the effects measured from an interrupted time series analysis among nonadopting hospitals from the effects measured among adopting hospitals. The rationale for this approach was to control for unmeasured secular (eg, availability of ICU beds) and temporal (eg, severity of a given bronchiolitis season) factors that may have coincidentally occurred with HFNC adoption seasons. The only modification to the interrupted time series approach for supplementary analysis 2 was to provide the nonadopting hospitals with an artificial interruption point because nonadopting hospitals, by definition, did not have an adoption season that could be used in an interrupted time series approach. The interruption point for nonadopting hospitals was set at the median adoption season for adopting hospitals.
RESULTS
Exposure
Leaders at 44 hospitals were contacted regarding their hospital’s use of HFNC outside of the ICU (Figure 1). Responses were obtained for 41 hospitals (93% response rate), 18 of which were classified as nonadopting hospitals. Of the 23 hospitals where the presence of ward-based HFNC protocols were reported, 12 met inclusion criteria and were classified as adopting hospitals. HFNC protocols were adopted at these hospitals in a staggered fashion between the 2010-2011 and 2015-2016 respiratory seasons (Figure 2). The median adoption season was the 2013-14 respiratory season.
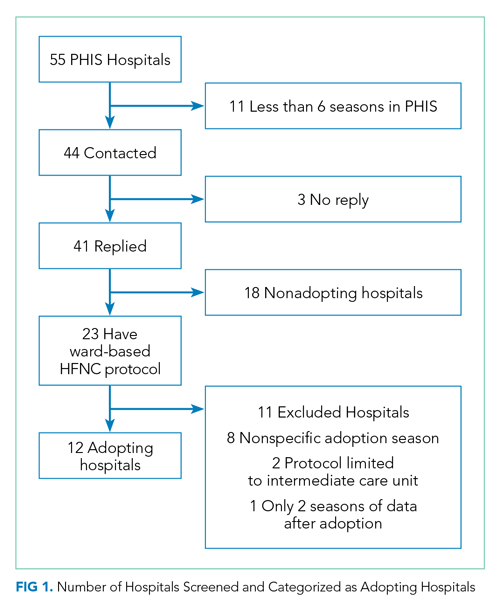
Nine adopting hospitals were able to provide details about their first HFNC protocols (Appendix 1). No two protocols were identical, but they shared many similarities. Minimum age requirements ranged from birth to a few months of age. Exclusion criteria were particularly variable, with a history of chronic lung disease or apnea being the most common criteria. Maximum allowed rates of flow ranged from 4 to 10 liters per minute. Criteria for transfer to the ICU were consistently based on an elevated FiO2 and duration of HFNC exposure.
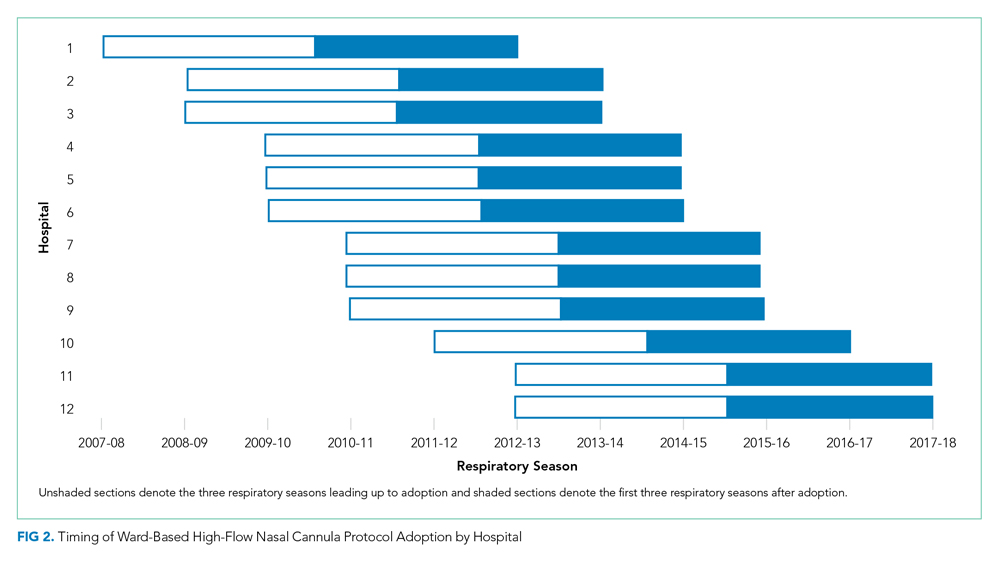
Patient Characteristics
A total of 32,809 bronchiolitis encounters occurred at adopting hospitals during qualifying respiratory seasons, of which 6,556 (20%) involved patients with a complex chronic condition and were excluded. Of the 26,253 included bronchiolitis encounters, 12,495 encounters occurred prior to ward-based HFNC protocol adoption and 13,758 encounters occurred after adoption. The median age of patients was 8 months (interquartile range, 5-14 months). Most patients were on government insurance (64%), male (58%), of white (56%) or black (18%) race, and of non-Hispanic ethnicity (72%). Pre- and postadoption patient demographics were similar (Appendix 2).
Primary Analysis
Shifts in the level of ICU use and ICU length of stay were observed at the time of adoption of a ward-based HFNC protocol (Figure 3). Specifically, ward-based HFNC protocol adoption was associated with an immediate 3.1% absolute increase (95% CI, 2.8%-3.4%) in the proportion of patients admitted to the ICU and a 9.1 days per 100 patients increase (95% CI, 5.1-13.2) in ICU length of stay (Table). The slope of ICU admissions per season was increasing after HFNC protocol adoption (1.0% increase per season; 95% CI, 0.8%-1.1%). When examined at the individual-hospital level (Appendix 3), seven hospitals were found to have significant increases in ICU admissions (immediate intervention effect or change in slope) after adoption, and one hospital was found to have a significant decrease in ICU admissions (change in slope only). Neither immediate intervention effects nor changes in the slopes of total length of stay and mechanical ventilation were observed, with mean total length of stay approximately 3 days and just over 1% of patients receiving mechanical ventilation (Figure 3).

Supplementary Analyses
Supplementary analyses were largely consistent with the primary analysis. Associations with increased ICU utilization were again observed, although the immediate change in ICU length of stay for supplementary analysis 1 was not significant and the slope for ICU length of stay in supplementary analysis 2 was down trending (Table). Changes in total length of stay and mechanical ventilation were not observed in either supplementary analysis, with the lone exception being an increase in the proportion of patients receiving mechanical ventilation per season (increase in slope) in supplementary analysis 1.
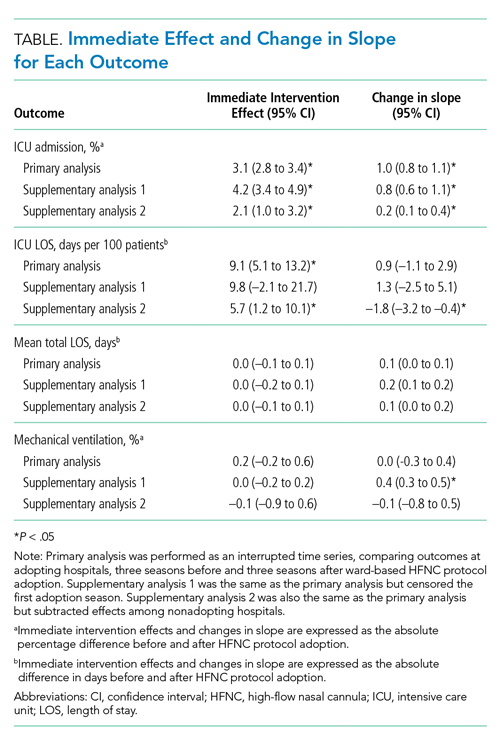
DISCUSSION
This is the largest multicenter study to date evaluating ICU utilization after adoption of a ward-based HFNC protocol for patients with bronchiolitis. While a principal goal of allowing HFNC use outside of the ICU is to reduce the time that patients with bronchiolitis spend in the ICU, we found that early protocols were, paradoxically, associated with increased ICU utilization. Ward-based HFNC protocols were not associated with changes in hospital length of stay or need for mechanical ventilation. Our findings are particularly relevant given that the majority of children’s hospitals in our sample have adopted ward-based HFNC protocols to care for patients with bronchiolitis.
The increase in ICU utilization measured in our study is a novel finding, seemingly in contradiction to existing literature. Early pilot studies inspired hope that employing HFNC on the general ward might prevent a portion of children from needing ICU care.11,12 Subsequent larger observational studies did not demonstrate decreases in ICU utilization after adoption of ward-based HFNC protocols.13,14 The two RCTs comparing low-flow and high-flow nasal cannula use outside of the ICU did not measure a statistically significant effect on ICU utilization, an exploratory outcome in both trials.15,16 However, the reported point estimates for absolute differences in ICU admission were 2% to 3% higher among patients randomized to HFNC, which is consistent with the 2% to 4% increase in ICU admission measured in the present study.
What might explain this surprising finding? While our observational study cannot speak to mechanism, the protocol details examined in the present study suggest that initial adoption of a ward-based HFNC protocol is often coupled with specific ICU transfer criteria that were unlikely in place prior to protocol initiation. For example, most protocols recommended consideration of ICU transfer for elevated FiO2 or prolonged duration of HFNC. Transfer to the ICU for prolonged HFNC duration is only possible in the setting of a ward-based HFNC protocol and transfer for elevated FiO2 was probably unnecessary prior to protocol adoption given that low-flow nasal cannula generally delivers 100% FiO2. It is also possible that with HFNC comes a perception of increased acuity. For example, medical providers may see patients on HFNC as sicker than patients with the same amount of work of breathing but off HFNC, which makes providers more likely to seek ICU admission for patients on HFNC. The combination of unchanged total length of stay and increased ICU utilization suggests that early ward-based HFNC protocols were an ineffective instrument to improve hospital bed availability during the peak census times that often occur in bronchiolitis season.
The large sample size afforded our study by its multicenter, retrospective design also allowed for a meaningful assessment of the association between a ward-based HFNC protocol and the need for mechanical ventilation. Early indications suggested a lack of substantial association between HFNC use outside of the ICU and rates of mechanical ventilation, but prior studies were limited by small numbers of patients receiving mechanical ventilation (<30 patients in each study).13,14,16 The present study, in which 783 patients received mechanical ventilation, supports the lack of association between early ward-based HFNC protocols and the need for mechanical ventilation. It should be noted that other studies have measured decreases in mechanical ventilation in association with ICU-based HFNC use.23-26 In addition to examining HFNC use in a different clinical context, decreases in mechanical ventilation measured after HFNC implementation in the ICU could be explained by preexisting practice trends to limit invasive ventilation and/or selection bias resulting from an increase in less severely ill patients being admitted to the ICU over time. The interrupted time series approach and the staggered adoption of HFNC protocols make the present study less susceptible to biases from preexisting trends and the inclusion of patients cared for both on the ward and within the ICU reduces selection bias.
Our study has several important limitations. First, all hospitals included in the analysis were US children’s hospitals and these findings may not generalize to other practice environments, including community hospitals and other countries. Second, our cohort and outcomes were defined using administrative billing data, which have been incompletely validated, making some degree of misclassification likely. Third, we measured HFNC exposure at the hospital level, but could not examine the extent to which individual patients were exposed to HFNC because such data are not present in PHIS. Even if we had access to patient-level HFNC exposure data, we would have still compared outcomes among all patients with bronchiolitis (not just those who received HFNC), to avoid selection bias. However, knowing HFNC exposure status at the patient level would have allowed for weighting of the effects measured at each hospital according to the extent of HFNC exposure. Fourth, there are likely other, unmeasured secular and temporal factors that could affect study outcomes. To some degree, the interrupted time series approach, observed staggered adoption of protocols, and nonadopting hospital supplementary analysis mitigate this risk of bias. Fifth, while the pre- and postadoption populations appeared demographically similar, it is possible that the populations might have differed by other unmeasured factors. Finally, early ward-based HFNC protocols have likely undergone iterative changes since adoption. We compared pre- and postadoption outcome slopes and censored the first adoption season in a supplementary analysis to attempt to account for this potential limitation.
In conclusion, our findings suggest that initial implementation of ward-based HFNC protocols were not successful at reducing ICU utilization for children with bronchiolitis. Future research should examine whether more evolved HFNC protocols that use higher flow rates, more generous ICU transfer criteria, and more rapid weaning criteria can reduce ICU utilization.
Acknowledgments
We thank Dr Vineeta Mittal (University of Texas Southwestern Medical Center) for providing feedback regarding the manuscript.
1. Mansbach JM, Piedra PA, Teach SJ, et al. Prospective multicenter study of viral etiology and hospital length of stay in children with severe bronchiolitis. Arch Pediatr Adolesc Med. 2012;166(8):700-706. https://doi.org/10.1001/archpediatrics.2011.1669.
2. Hasegawa K, Pate BM, Mansbach JM, et al. Risk factors for requiring intensive care among children admitted to ward with bronchiolitis. Acad Pediatr. 2015;15(1):77-81. https://doi.org/10.1016/j.acap.2014.06.008.
3. Schroeder AR, Destino LA, Brooks R, Wang CJ, Coon ER. Outcomes of follow-up visits after bronchiolitis hospitalizations. JAMA Pediatr. 2018;172(3):296-297. https://doi.org/10.1001/jamapediatrics.2017.4002.
4. Drake MG. High-flow nasal cannula oxygen in adults: an evidence-based assessment. Ann Am Thorac Soc. 2018;15(2):145-155. https://doi.org/10.1513/AnnalsATS.201707-548FR.
5. Rubin S, Ghuman A, Deakers T, Khemani R, Ross P, Newth CJ. Effort of breathing in children receiving high-flow nasal cannula. Pediatr Crit Care Med. 2014;15(1):1-6. https://doi.org/10.1097/PCC.0000000000000011.
6. Hough JL, Pham TM, Schibler A. Physiologic effect of high-flow nasal cannula in infants with bronchiolitis. Pediatr Crit Care Med. 2014;15(5):e214-e219. https://doi.org/10.1097/PCC.0000000000000112.
7. Pham TM, O’Malley L, Mayfield S, Martin S, Schibler A. The effect of high flow nasal cannula therapy on the work of breathing in infants with bronchiolitis. Pediatr Pulmonol. 2015;50(7):713-720. https://doi.org/10.1002/ppul.23060.
8. Weiler T, Kamerkar A, Hotz J, Ross PA, Newth CJL, Khemani RG. The relationship between high flow nasal cannula flow rate and effort of breathing in children. J Pediatr. 2017;189:66-71.e63. https://doi.org/10.1016/j.jpeds.2017.06.006.
9. Mayfield S, Jauncey-Cooke J, Hough JL, Schibler A, Gibbons K, Bogossian F. High-flow nasal cannula therapy for respiratory support in children. Cochrane Database Syst Rev. 2014(3):CD009850. https://doi.org/10.1002/14651858.CD009850.pub2.
10. Roca O, Riera J, Torres F, Masclans JR. High-flow oxygen therapy in acute respiratory failure. Respir Care. 2010;55(4):408-413.
11. Kallappa C, Hufton M, Millen G, Ninan TK. Use of high flow nasal cannula oxygen (HFNCO) in infants with bronchiolitis on a paediatric ward: a 3-year experience. Arch Dis Child. 2014;99(8):790-791. https://doi.org/10.1136/archdischild-2014-306637.
12. Mayfield S, Bogossian F, O’Malley L, Schibler A. High-flow nasal cannula oxygen therapy for infants with bronchiolitis: pilot study. J Paediatr Child Health. 2014;50(5):373-378. https://doi.org/10.1111/jpc.12509.
13. Riese J, Porter T, Fierce J, Riese A, Richardson T, Alverson BK. Clinical outcomes of bronchiolitis after implementation of a general ward high flow nasal cannula guideline. Hosp Pediatr. 2017;7(4):197-203. https://doi.org/10.1542/hpeds.2016-0195.
14. Mace AO, Gibbons J, Schultz A, Knight G, Martin AC. Humidified high-flow nasal cannula oxygen for bronchiolitis: should we go with the flow? Arch Dis Child. 2018;103(3):303. https://doi.org/10.1136/archdischild-2017-313950.
15. Kepreotes E, Whitehead B, Attia J, et al. High-flow warm humidified oxygen versus standard low-flow nasal cannula oxygen for moderate bronchiolitis (HFWHO RCT): an open, phase 4, randomised controlled trial. Lancet. 2017;389(10072):930-939. https://doi.org/10.1016/S0140-6736(17)30061-2.
16. Franklin D, Babl FE, Schlapbach LJ, et al. A randomized trial of high-flow oxygen therapy in infants with bronchiolitis. N Engl J Med. 2018;378(12):1121-1131. https://doi.org/10.1056/NEJMoa1714855.
17. Coon ER, Mittal V, Brady PW. High flow nasal cannula-just expensive paracetamol? Lancet Child Adolesc Health. 2019;3(9):593-595. https://doi.org/10.1016/S2352-4642(19)30235-4.
18. Roth J. CMS’ ICD-9-CM to and from ICD-10-CM and ICD-10-PCS Crosswalk or General Equivalence Mappings. 2012. http://www.nber.org/data/icd9-icd-10-cm-and-pcs-crosswalk-general-equivalence-mapping.html. Accessed November 19, 2016.
19. Feudtner C, Feinstein JA, Zhong W, Hall M, Dai D. Pediatric complex chronic conditions classification system version 2: updated for ICD-10 and complex medical technology dependence and transplantation. BMC Pediatr. 2014;14:199. https://doi.org/10.1186/1471-2431-14-199.
20. Shein SL, Slain K, Wilson-Costello D, McKee B, Rotta AT. Temporal changes in prescription of neuropharmacologic drugs and utilization of resources related to neurologic morbidity in mechanically ventilated children with bronchiolitis. Pediatr Crit Care Med. 2017;18(12):e606-e614. https://doi.org/10.1097/PCC.0000000000001351.
21. Penfold RB, Zhang F. Use of interrupted time series analysis in evaluating health care quality improvements. Acad Pediatr. 2013;13(6 Suppl):S38-S44. https://doi.org/10.1016/j.acap.2013.08.002.
22. Newey WK, West KD. A simple, positive semi-definite, heteroskedasticity and autocorrelation consistent covariance matrix. Econometrica. 1987;55(3):703-708.
23. McKiernan C, Chua LC, Visintainer PF, Allen H. High flow nasal cannulae therapy in infants with bronchiolitis. J Pediatr. 2010;156(4):634-638. https://doi.org/10.1016/j.jpeds.2009.10.039.
24. Schibler A, Pham TM, Dunster KR, et al. Reduced intubation rates for infants after introduction of high-flow nasal prong oxygen delivery. Intensive Care Med. 2011;37(5):847-852. https://doi.org/10.1007/s00134-011-2177-5.
25. Kawaguchi A, Yasui Y, deCaen A, Garros D. The clinical impact of heated humidified high-flow nasal cannula on pediatric respiratory distress. Pediatr Crit Care Med. 2017;18(2):112-119. https://doi.org/10.1097/PCC.0000000000000985.
26. Schlapbach LJ, Straney L, Gelbart B, et al. Burden of disease and change in practice in critically ill infants with bronchiolitis. Eur Respir J. 2017;49(6):1601648. https://doi.org/10.1183/13993003.01648-2016.
Children hospitalized for bronchiolitis frequently require admission to the intensive care unit (ICU), with estimates as high as 18%1,2 and 35%3 in two prospective, multicenter studies. The indication for ICU admission is nearly always a need for advanced respiratory support, which historically consisted of continuous or bilevel positive airway pressure (CPAP and BiPAP, respectively) or mechanical ventilation. High-flow nasal cannula (HFNC) is a recent addition to the respiratory support armamentarium, delivering heated and humidified oxygen at rates of up to 60 L/min and allowing for clinicians to titrate both flow rate and fraction of inspired oxygen (FiO2).4
Several studies have demonstrated that HFNC is capable of decreasing a child’s work of breathing,5-8 and it has the potential advantage of being better tolerated than other forms of advanced respiratory support.9,10 These case-series physiologic studies informed early ward-based HFNC protocols for bronchiolitis, which were adopted to decrease ICU utilization. Since then, single center observational studies examining the association between ward-based HFNC protocols and subsequent ICU utilization have come to discordant conclusions.11-14 Studying the effect of employing HFNC outside of the ICU is challenging in the context of a randomized, controlled trial (RCT) because it is difficult to blind healthcare providers to the intervention and because crossover from the control group to HFNC is frequent. Two unblinded RCTs published in 2017 and 2018 found that children randomized to conventional nasal cannula were frequently escalated to HFNC (flow rates of 1-2 L/kg per minute), but neither trial found a difference in ICU admission.15,16 Sample sizes substantially larger than those present in currently published or registered RCTs would be required to evaluate the impact of ward-based HFNC protocols on the outcome that inspired the protocols in the first place, namely ICU utilization.17
Children’s hospitals have adopted ward-based HFNC protocols at different time points over the last decade, which allows for a natural experiment—a promising alternative study design that avoids the challenges of blinding, crossover, and modest sample sizes. In order to have sufficient postadoption data for analyses, the present study is limited to ward-based HFNC protocols adopted prior to 2016, which we have termed “early” ward-based HFNC protocols. Among children with bronchiolitis, our objective was to measure the association between hospital-level adoption of a ward-based HFNC protocol and subsequent ICU utilization, using a multicenter network of children’s hospitals.
METHODS
We conducted a multicenter retrospective cohort study using the Pediatric Health Information System (PHIS) database. The PHIS database is operated by the Children’s Hospital Association (Lenexa, Kansas) and provides deidentified patient-level information for children who receive hospital care at 55 US children’s hospitals. Available data elements include patient demographic data, discharge diagnosis and procedure codes, and detailed billing information, such as laboratory, imaging, pharmacy, and supply charges. At the patient level, the use of HFNC vs standard oxygen therapy circuits cannot be discriminated.
Exposure
The study exposure was a hospital’s first ward-based HFNC protocol, with adoption measured at the hospital level at each PHIS site via direct communication with leaders in hospital medicine. In most cases, first contact was made with the pediatric hospital medicine division chief or fellowship program director, who then, if necessary, connected study investigators to local HFNC champions aware of site-specific historical HFNC protocol details. Contact with a hospital was made only if the hospital had contributed at least 6 consecutive years of data to PHIS. Hospitals were classified as “adopting” hospitals if their HFNC protocol met all of the following criteria: (a) allows initiation of HFNC outside of the ICU (on the floor or in the ED), (b) allows continued care outside of the ICU (on the floor), (c) not limited to a small unit like an intermediate care unit, and (d) adopted during a specific, known respiratory season. Hospitals for which ward-based HFNC protocols were adopted but did not meet these criteria were excluded from further analysis. Our intent was to identify large scale, programmatic protocol launches and exclude hospitals with exceptions that might preclude a sizable portion of our cohort from being eligible for the protocol. Hospitals for which inpatient use of HFNC remains limited to the ICU were defined as “nonadopting” hospitals. Respondents at adopting hospitals were asked to share details about their protocol, including patient eligibility criteria and maximum HFNC rates of flow permitted outside of the ICU.
Patient Characteristics
Patients aged 3 to 24 months who were hospitalized at adopting and nonadopting hospitals were included if an International Classification of Diseases, Ninth Revision (ICD-9) discharge diagnosis code for bronchiolitis (466.XX) was present in any position (not limited to a primary diagnosis). The lower age limit of 3 months was chosen to match the most restrictive age eligibility criteria of provided HFNC protocols (Appendix 1). A crosswalk available from the Centers for Medicare & Medicaid Services18 was used to convert ICD-10 diagnosis and procedure codes from recent years to ICD-9 diagnosis and procedure codes. Patients were excluded if their encounter contained a diagnosis or procedure code signifying a complex chronic condition,19 if their hospitalization involved care in the neonatal ICU, or if their admission date occurred outside of the respiratory season. Respiratory season was defined as November 1 through April 30.
Outcomes
Outcomes were measured during three respiratory seasons leading up to adoption and during three respiratory seasons after adoption. The primary outcome was ICU utilization, including the proportion of patients admitted to the ICU and ICU length of stay, expressed as ICU days per 100 patients. Secondary outcomes included mean total length of stay and the proportion of patients who received mechanical ventilation. Lengths of stay were measured in days, the most granular unit of time provided in PHIS over the entire study period. As such, partial days of care are rounded up to 1 full day. A previously published strict definition for mechanical ventilation that limits false positives was used, requiring that patients have a procedure or supply code for mechanical ventilation and a pharmacy charge for a neuromuscular blocking agent.20
Primary Analysis
The primary analysis was restricted to adopting hospitals. An interrupted time series approach was used to measure two possible types of change associated with HFNC protocol adoption: an immediate intervention effect and a change in the slope of an outcome.21 The immediate intervention effect represents the change in the level of the outcome that occurs in the period immediately following the introduction of the protocol. The change in slope is the extent to which the outcome changes on a per season basis, attributable to the protocol. Interrupted time series estimates were adjusted for patient age, gender, race, ethnicity, and insurance type; linear regression was used for continuous outcomes and logistic regression for dichotomous outcomes. An ordinary least squares time series model was used to adjust for autocorrelation and Newey-West standard errors were employed.22 Analyses were performed using STATA version 14 (Stata-Corp, College Station, Texas).
Supplementary Analyses
Two preplanned supplementary analyses were conducted. Supplementary analysis 1 was identical to the primary analysis, with the exception that the first season after adoption was censored. The rationale for censoring the first adoption season was to account for a potential learning effect and/or delayed start to full protocol implementation. Supplementary analysis 2 used the nonadopting hospitals as a control group and subtracted the effects measured from an interrupted time series analysis among nonadopting hospitals from the effects measured among adopting hospitals. The rationale for this approach was to control for unmeasured secular (eg, availability of ICU beds) and temporal (eg, severity of a given bronchiolitis season) factors that may have coincidentally occurred with HFNC adoption seasons. The only modification to the interrupted time series approach for supplementary analysis 2 was to provide the nonadopting hospitals with an artificial interruption point because nonadopting hospitals, by definition, did not have an adoption season that could be used in an interrupted time series approach. The interruption point for nonadopting hospitals was set at the median adoption season for adopting hospitals.
RESULTS
Exposure
Leaders at 44 hospitals were contacted regarding their hospital’s use of HFNC outside of the ICU (Figure 1). Responses were obtained for 41 hospitals (93% response rate), 18 of which were classified as nonadopting hospitals. Of the 23 hospitals where the presence of ward-based HFNC protocols were reported, 12 met inclusion criteria and were classified as adopting hospitals. HFNC protocols were adopted at these hospitals in a staggered fashion between the 2010-2011 and 2015-2016 respiratory seasons (Figure 2). The median adoption season was the 2013-14 respiratory season.
Nine adopting hospitals were able to provide details about their first HFNC protocols (Appendix 1). No two protocols were identical, but they shared many similarities. Minimum age requirements ranged from birth to a few months of age. Exclusion criteria were particularly variable, with a history of chronic lung disease or apnea being the most common criteria. Maximum allowed rates of flow ranged from 4 to 10 liters per minute. Criteria for transfer to the ICU were consistently based on an elevated FiO2 and duration of HFNC exposure.
Patient Characteristics
A total of 32,809 bronchiolitis encounters occurred at adopting hospitals during qualifying respiratory seasons, of which 6,556 (20%) involved patients with a complex chronic condition and were excluded. Of the 26,253 included bronchiolitis encounters, 12,495 encounters occurred prior to ward-based HFNC protocol adoption and 13,758 encounters occurred after adoption. The median age of patients was 8 months (interquartile range, 5-14 months). Most patients were on government insurance (64%), male (58%), of white (56%) or black (18%) race, and of non-Hispanic ethnicity (72%). Pre- and postadoption patient demographics were similar (Appendix 2).
Primary Analysis
Shifts in the level of ICU use and ICU length of stay were observed at the time of adoption of a ward-based HFNC protocol (Figure 3). Specifically, ward-based HFNC protocol adoption was associated with an immediate 3.1% absolute increase (95% CI, 2.8%-3.4%) in the proportion of patients admitted to the ICU and a 9.1 days per 100 patients increase (95% CI, 5.1-13.2) in ICU length of stay (Table). The slope of ICU admissions per season was increasing after HFNC protocol adoption (1.0% increase per season; 95% CI, 0.8%-1.1%). When examined at the individual-hospital level (Appendix 3), seven hospitals were found to have significant increases in ICU admissions (immediate intervention effect or change in slope) after adoption, and one hospital was found to have a significant decrease in ICU admissions (change in slope only). Neither immediate intervention effects nor changes in the slopes of total length of stay and mechanical ventilation were observed, with mean total length of stay approximately 3 days and just over 1% of patients receiving mechanical ventilation (Figure 3).
Supplementary Analyses
Supplementary analyses were largely consistent with the primary analysis. Associations with increased ICU utilization were again observed, although the immediate change in ICU length of stay for supplementary analysis 1 was not significant and the slope for ICU length of stay in supplementary analysis 2 was down trending (Table). Changes in total length of stay and mechanical ventilation were not observed in either supplementary analysis, with the lone exception being an increase in the proportion of patients receiving mechanical ventilation per season (increase in slope) in supplementary analysis 1.
DISCUSSION
This is the largest multicenter study to date evaluating ICU utilization after adoption of a ward-based HFNC protocol for patients with bronchiolitis. While a principal goal of allowing HFNC use outside of the ICU is to reduce the time that patients with bronchiolitis spend in the ICU, we found that early protocols were, paradoxically, associated with increased ICU utilization. Ward-based HFNC protocols were not associated with changes in hospital length of stay or need for mechanical ventilation. Our findings are particularly relevant given that the majority of children’s hospitals in our sample have adopted ward-based HFNC protocols to care for patients with bronchiolitis.
The increase in ICU utilization measured in our study is a novel finding, seemingly in contradiction to existing literature. Early pilot studies inspired hope that employing HFNC on the general ward might prevent a portion of children from needing ICU care.11,12 Subsequent larger observational studies did not demonstrate decreases in ICU utilization after adoption of ward-based HFNC protocols.13,14 The two RCTs comparing low-flow and high-flow nasal cannula use outside of the ICU did not measure a statistically significant effect on ICU utilization, an exploratory outcome in both trials.15,16 However, the reported point estimates for absolute differences in ICU admission were 2% to 3% higher among patients randomized to HFNC, which is consistent with the 2% to 4% increase in ICU admission measured in the present study.
What might explain this surprising finding? While our observational study cannot speak to mechanism, the protocol details examined in the present study suggest that initial adoption of a ward-based HFNC protocol is often coupled with specific ICU transfer criteria that were unlikely in place prior to protocol initiation. For example, most protocols recommended consideration of ICU transfer for elevated FiO2 or prolonged duration of HFNC. Transfer to the ICU for prolonged HFNC duration is only possible in the setting of a ward-based HFNC protocol and transfer for elevated FiO2 was probably unnecessary prior to protocol adoption given that low-flow nasal cannula generally delivers 100% FiO2. It is also possible that with HFNC comes a perception of increased acuity. For example, medical providers may see patients on HFNC as sicker than patients with the same amount of work of breathing but off HFNC, which makes providers more likely to seek ICU admission for patients on HFNC. The combination of unchanged total length of stay and increased ICU utilization suggests that early ward-based HFNC protocols were an ineffective instrument to improve hospital bed availability during the peak census times that often occur in bronchiolitis season.
The large sample size afforded our study by its multicenter, retrospective design also allowed for a meaningful assessment of the association between a ward-based HFNC protocol and the need for mechanical ventilation. Early indications suggested a lack of substantial association between HFNC use outside of the ICU and rates of mechanical ventilation, but prior studies were limited by small numbers of patients receiving mechanical ventilation (<30 patients in each study).13,14,16 The present study, in which 783 patients received mechanical ventilation, supports the lack of association between early ward-based HFNC protocols and the need for mechanical ventilation. It should be noted that other studies have measured decreases in mechanical ventilation in association with ICU-based HFNC use.23-26 In addition to examining HFNC use in a different clinical context, decreases in mechanical ventilation measured after HFNC implementation in the ICU could be explained by preexisting practice trends to limit invasive ventilation and/or selection bias resulting from an increase in less severely ill patients being admitted to the ICU over time. The interrupted time series approach and the staggered adoption of HFNC protocols make the present study less susceptible to biases from preexisting trends and the inclusion of patients cared for both on the ward and within the ICU reduces selection bias.
Our study has several important limitations. First, all hospitals included in the analysis were US children’s hospitals and these findings may not generalize to other practice environments, including community hospitals and other countries. Second, our cohort and outcomes were defined using administrative billing data, which have been incompletely validated, making some degree of misclassification likely. Third, we measured HFNC exposure at the hospital level, but could not examine the extent to which individual patients were exposed to HFNC because such data are not present in PHIS. Even if we had access to patient-level HFNC exposure data, we would have still compared outcomes among all patients with bronchiolitis (not just those who received HFNC), to avoid selection bias. However, knowing HFNC exposure status at the patient level would have allowed for weighting of the effects measured at each hospital according to the extent of HFNC exposure. Fourth, there are likely other, unmeasured secular and temporal factors that could affect study outcomes. To some degree, the interrupted time series approach, observed staggered adoption of protocols, and nonadopting hospital supplementary analysis mitigate this risk of bias. Fifth, while the pre- and postadoption populations appeared demographically similar, it is possible that the populations might have differed by other unmeasured factors. Finally, early ward-based HFNC protocols have likely undergone iterative changes since adoption. We compared pre- and postadoption outcome slopes and censored the first adoption season in a supplementary analysis to attempt to account for this potential limitation.
In conclusion, our findings suggest that initial implementation of ward-based HFNC protocols were not successful at reducing ICU utilization for children with bronchiolitis. Future research should examine whether more evolved HFNC protocols that use higher flow rates, more generous ICU transfer criteria, and more rapid weaning criteria can reduce ICU utilization.
Acknowledgments
We thank Dr Vineeta Mittal (University of Texas Southwestern Medical Center) for providing feedback regarding the manuscript.
Children hospitalized for bronchiolitis frequently require admission to the intensive care unit (ICU), with estimates as high as 18%1,2 and 35%3 in two prospective, multicenter studies. The indication for ICU admission is nearly always a need for advanced respiratory support, which historically consisted of continuous or bilevel positive airway pressure (CPAP and BiPAP, respectively) or mechanical ventilation. High-flow nasal cannula (HFNC) is a recent addition to the respiratory support armamentarium, delivering heated and humidified oxygen at rates of up to 60 L/min and allowing for clinicians to titrate both flow rate and fraction of inspired oxygen (FiO2).4
Several studies have demonstrated that HFNC is capable of decreasing a child’s work of breathing,5-8 and it has the potential advantage of being better tolerated than other forms of advanced respiratory support.9,10 These case-series physiologic studies informed early ward-based HFNC protocols for bronchiolitis, which were adopted to decrease ICU utilization. Since then, single center observational studies examining the association between ward-based HFNC protocols and subsequent ICU utilization have come to discordant conclusions.11-14 Studying the effect of employing HFNC outside of the ICU is challenging in the context of a randomized, controlled trial (RCT) because it is difficult to blind healthcare providers to the intervention and because crossover from the control group to HFNC is frequent. Two unblinded RCTs published in 2017 and 2018 found that children randomized to conventional nasal cannula were frequently escalated to HFNC (flow rates of 1-2 L/kg per minute), but neither trial found a difference in ICU admission.15,16 Sample sizes substantially larger than those present in currently published or registered RCTs would be required to evaluate the impact of ward-based HFNC protocols on the outcome that inspired the protocols in the first place, namely ICU utilization.17
Children’s hospitals have adopted ward-based HFNC protocols at different time points over the last decade, which allows for a natural experiment—a promising alternative study design that avoids the challenges of blinding, crossover, and modest sample sizes. In order to have sufficient postadoption data for analyses, the present study is limited to ward-based HFNC protocols adopted prior to 2016, which we have termed “early” ward-based HFNC protocols. Among children with bronchiolitis, our objective was to measure the association between hospital-level adoption of a ward-based HFNC protocol and subsequent ICU utilization, using a multicenter network of children’s hospitals.
METHODS
We conducted a multicenter retrospective cohort study using the Pediatric Health Information System (PHIS) database. The PHIS database is operated by the Children’s Hospital Association (Lenexa, Kansas) and provides deidentified patient-level information for children who receive hospital care at 55 US children’s hospitals. Available data elements include patient demographic data, discharge diagnosis and procedure codes, and detailed billing information, such as laboratory, imaging, pharmacy, and supply charges. At the patient level, the use of HFNC vs standard oxygen therapy circuits cannot be discriminated.
Exposure
The study exposure was a hospital’s first ward-based HFNC protocol, with adoption measured at the hospital level at each PHIS site via direct communication with leaders in hospital medicine. In most cases, first contact was made with the pediatric hospital medicine division chief or fellowship program director, who then, if necessary, connected study investigators to local HFNC champions aware of site-specific historical HFNC protocol details. Contact with a hospital was made only if the hospital had contributed at least 6 consecutive years of data to PHIS. Hospitals were classified as “adopting” hospitals if their HFNC protocol met all of the following criteria: (a) allows initiation of HFNC outside of the ICU (on the floor or in the ED), (b) allows continued care outside of the ICU (on the floor), (c) not limited to a small unit like an intermediate care unit, and (d) adopted during a specific, known respiratory season. Hospitals for which ward-based HFNC protocols were adopted but did not meet these criteria were excluded from further analysis. Our intent was to identify large scale, programmatic protocol launches and exclude hospitals with exceptions that might preclude a sizable portion of our cohort from being eligible for the protocol. Hospitals for which inpatient use of HFNC remains limited to the ICU were defined as “nonadopting” hospitals. Respondents at adopting hospitals were asked to share details about their protocol, including patient eligibility criteria and maximum HFNC rates of flow permitted outside of the ICU.
Patient Characteristics
Patients aged 3 to 24 months who were hospitalized at adopting and nonadopting hospitals were included if an International Classification of Diseases, Ninth Revision (ICD-9) discharge diagnosis code for bronchiolitis (466.XX) was present in any position (not limited to a primary diagnosis). The lower age limit of 3 months was chosen to match the most restrictive age eligibility criteria of provided HFNC protocols (Appendix 1). A crosswalk available from the Centers for Medicare & Medicaid Services18 was used to convert ICD-10 diagnosis and procedure codes from recent years to ICD-9 diagnosis and procedure codes. Patients were excluded if their encounter contained a diagnosis or procedure code signifying a complex chronic condition,19 if their hospitalization involved care in the neonatal ICU, or if their admission date occurred outside of the respiratory season. Respiratory season was defined as November 1 through April 30.
Outcomes
Outcomes were measured during three respiratory seasons leading up to adoption and during three respiratory seasons after adoption. The primary outcome was ICU utilization, including the proportion of patients admitted to the ICU and ICU length of stay, expressed as ICU days per 100 patients. Secondary outcomes included mean total length of stay and the proportion of patients who received mechanical ventilation. Lengths of stay were measured in days, the most granular unit of time provided in PHIS over the entire study period. As such, partial days of care are rounded up to 1 full day. A previously published strict definition for mechanical ventilation that limits false positives was used, requiring that patients have a procedure or supply code for mechanical ventilation and a pharmacy charge for a neuromuscular blocking agent.20
Primary Analysis
The primary analysis was restricted to adopting hospitals. An interrupted time series approach was used to measure two possible types of change associated with HFNC protocol adoption: an immediate intervention effect and a change in the slope of an outcome.21 The immediate intervention effect represents the change in the level of the outcome that occurs in the period immediately following the introduction of the protocol. The change in slope is the extent to which the outcome changes on a per season basis, attributable to the protocol. Interrupted time series estimates were adjusted for patient age, gender, race, ethnicity, and insurance type; linear regression was used for continuous outcomes and logistic regression for dichotomous outcomes. An ordinary least squares time series model was used to adjust for autocorrelation and Newey-West standard errors were employed.22 Analyses were performed using STATA version 14 (Stata-Corp, College Station, Texas).
Supplementary Analyses
Two preplanned supplementary analyses were conducted. Supplementary analysis 1 was identical to the primary analysis, with the exception that the first season after adoption was censored. The rationale for censoring the first adoption season was to account for a potential learning effect and/or delayed start to full protocol implementation. Supplementary analysis 2 used the nonadopting hospitals as a control group and subtracted the effects measured from an interrupted time series analysis among nonadopting hospitals from the effects measured among adopting hospitals. The rationale for this approach was to control for unmeasured secular (eg, availability of ICU beds) and temporal (eg, severity of a given bronchiolitis season) factors that may have coincidentally occurred with HFNC adoption seasons. The only modification to the interrupted time series approach for supplementary analysis 2 was to provide the nonadopting hospitals with an artificial interruption point because nonadopting hospitals, by definition, did not have an adoption season that could be used in an interrupted time series approach. The interruption point for nonadopting hospitals was set at the median adoption season for adopting hospitals.
RESULTS
Exposure
Leaders at 44 hospitals were contacted regarding their hospital’s use of HFNC outside of the ICU (Figure 1). Responses were obtained for 41 hospitals (93% response rate), 18 of which were classified as nonadopting hospitals. Of the 23 hospitals where the presence of ward-based HFNC protocols were reported, 12 met inclusion criteria and were classified as adopting hospitals. HFNC protocols were adopted at these hospitals in a staggered fashion between the 2010-2011 and 2015-2016 respiratory seasons (Figure 2). The median adoption season was the 2013-14 respiratory season.
Nine adopting hospitals were able to provide details about their first HFNC protocols (Appendix 1). No two protocols were identical, but they shared many similarities. Minimum age requirements ranged from birth to a few months of age. Exclusion criteria were particularly variable, with a history of chronic lung disease or apnea being the most common criteria. Maximum allowed rates of flow ranged from 4 to 10 liters per minute. Criteria for transfer to the ICU were consistently based on an elevated FiO2 and duration of HFNC exposure.
Patient Characteristics
A total of 32,809 bronchiolitis encounters occurred at adopting hospitals during qualifying respiratory seasons, of which 6,556 (20%) involved patients with a complex chronic condition and were excluded. Of the 26,253 included bronchiolitis encounters, 12,495 encounters occurred prior to ward-based HFNC protocol adoption and 13,758 encounters occurred after adoption. The median age of patients was 8 months (interquartile range, 5-14 months). Most patients were on government insurance (64%), male (58%), of white (56%) or black (18%) race, and of non-Hispanic ethnicity (72%). Pre- and postadoption patient demographics were similar (Appendix 2).
Primary Analysis
Shifts in the level of ICU use and ICU length of stay were observed at the time of adoption of a ward-based HFNC protocol (Figure 3). Specifically, ward-based HFNC protocol adoption was associated with an immediate 3.1% absolute increase (95% CI, 2.8%-3.4%) in the proportion of patients admitted to the ICU and a 9.1 days per 100 patients increase (95% CI, 5.1-13.2) in ICU length of stay (Table). The slope of ICU admissions per season was increasing after HFNC protocol adoption (1.0% increase per season; 95% CI, 0.8%-1.1%). When examined at the individual-hospital level (Appendix 3), seven hospitals were found to have significant increases in ICU admissions (immediate intervention effect or change in slope) after adoption, and one hospital was found to have a significant decrease in ICU admissions (change in slope only). Neither immediate intervention effects nor changes in the slopes of total length of stay and mechanical ventilation were observed, with mean total length of stay approximately 3 days and just over 1% of patients receiving mechanical ventilation (Figure 3).
Supplementary Analyses
Supplementary analyses were largely consistent with the primary analysis. Associations with increased ICU utilization were again observed, although the immediate change in ICU length of stay for supplementary analysis 1 was not significant and the slope for ICU length of stay in supplementary analysis 2 was down trending (Table). Changes in total length of stay and mechanical ventilation were not observed in either supplementary analysis, with the lone exception being an increase in the proportion of patients receiving mechanical ventilation per season (increase in slope) in supplementary analysis 1.
DISCUSSION
This is the largest multicenter study to date evaluating ICU utilization after adoption of a ward-based HFNC protocol for patients with bronchiolitis. While a principal goal of allowing HFNC use outside of the ICU is to reduce the time that patients with bronchiolitis spend in the ICU, we found that early protocols were, paradoxically, associated with increased ICU utilization. Ward-based HFNC protocols were not associated with changes in hospital length of stay or need for mechanical ventilation. Our findings are particularly relevant given that the majority of children’s hospitals in our sample have adopted ward-based HFNC protocols to care for patients with bronchiolitis.
The increase in ICU utilization measured in our study is a novel finding, seemingly in contradiction to existing literature. Early pilot studies inspired hope that employing HFNC on the general ward might prevent a portion of children from needing ICU care.11,12 Subsequent larger observational studies did not demonstrate decreases in ICU utilization after adoption of ward-based HFNC protocols.13,14 The two RCTs comparing low-flow and high-flow nasal cannula use outside of the ICU did not measure a statistically significant effect on ICU utilization, an exploratory outcome in both trials.15,16 However, the reported point estimates for absolute differences in ICU admission were 2% to 3% higher among patients randomized to HFNC, which is consistent with the 2% to 4% increase in ICU admission measured in the present study.
What might explain this surprising finding? While our observational study cannot speak to mechanism, the protocol details examined in the present study suggest that initial adoption of a ward-based HFNC protocol is often coupled with specific ICU transfer criteria that were unlikely in place prior to protocol initiation. For example, most protocols recommended consideration of ICU transfer for elevated FiO2 or prolonged duration of HFNC. Transfer to the ICU for prolonged HFNC duration is only possible in the setting of a ward-based HFNC protocol and transfer for elevated FiO2 was probably unnecessary prior to protocol adoption given that low-flow nasal cannula generally delivers 100% FiO2. It is also possible that with HFNC comes a perception of increased acuity. For example, medical providers may see patients on HFNC as sicker than patients with the same amount of work of breathing but off HFNC, which makes providers more likely to seek ICU admission for patients on HFNC. The combination of unchanged total length of stay and increased ICU utilization suggests that early ward-based HFNC protocols were an ineffective instrument to improve hospital bed availability during the peak census times that often occur in bronchiolitis season.
The large sample size afforded our study by its multicenter, retrospective design also allowed for a meaningful assessment of the association between a ward-based HFNC protocol and the need for mechanical ventilation. Early indications suggested a lack of substantial association between HFNC use outside of the ICU and rates of mechanical ventilation, but prior studies were limited by small numbers of patients receiving mechanical ventilation (<30 patients in each study).13,14,16 The present study, in which 783 patients received mechanical ventilation, supports the lack of association between early ward-based HFNC protocols and the need for mechanical ventilation. It should be noted that other studies have measured decreases in mechanical ventilation in association with ICU-based HFNC use.23-26 In addition to examining HFNC use in a different clinical context, decreases in mechanical ventilation measured after HFNC implementation in the ICU could be explained by preexisting practice trends to limit invasive ventilation and/or selection bias resulting from an increase in less severely ill patients being admitted to the ICU over time. The interrupted time series approach and the staggered adoption of HFNC protocols make the present study less susceptible to biases from preexisting trends and the inclusion of patients cared for both on the ward and within the ICU reduces selection bias.
Our study has several important limitations. First, all hospitals included in the analysis were US children’s hospitals and these findings may not generalize to other practice environments, including community hospitals and other countries. Second, our cohort and outcomes were defined using administrative billing data, which have been incompletely validated, making some degree of misclassification likely. Third, we measured HFNC exposure at the hospital level, but could not examine the extent to which individual patients were exposed to HFNC because such data are not present in PHIS. Even if we had access to patient-level HFNC exposure data, we would have still compared outcomes among all patients with bronchiolitis (not just those who received HFNC), to avoid selection bias. However, knowing HFNC exposure status at the patient level would have allowed for weighting of the effects measured at each hospital according to the extent of HFNC exposure. Fourth, there are likely other, unmeasured secular and temporal factors that could affect study outcomes. To some degree, the interrupted time series approach, observed staggered adoption of protocols, and nonadopting hospital supplementary analysis mitigate this risk of bias. Fifth, while the pre- and postadoption populations appeared demographically similar, it is possible that the populations might have differed by other unmeasured factors. Finally, early ward-based HFNC protocols have likely undergone iterative changes since adoption. We compared pre- and postadoption outcome slopes and censored the first adoption season in a supplementary analysis to attempt to account for this potential limitation.
In conclusion, our findings suggest that initial implementation of ward-based HFNC protocols were not successful at reducing ICU utilization for children with bronchiolitis. Future research should examine whether more evolved HFNC protocols that use higher flow rates, more generous ICU transfer criteria, and more rapid weaning criteria can reduce ICU utilization.
Acknowledgments
We thank Dr Vineeta Mittal (University of Texas Southwestern Medical Center) for providing feedback regarding the manuscript.
1. Mansbach JM, Piedra PA, Teach SJ, et al. Prospective multicenter study of viral etiology and hospital length of stay in children with severe bronchiolitis. Arch Pediatr Adolesc Med. 2012;166(8):700-706. https://doi.org/10.1001/archpediatrics.2011.1669.
2. Hasegawa K, Pate BM, Mansbach JM, et al. Risk factors for requiring intensive care among children admitted to ward with bronchiolitis. Acad Pediatr. 2015;15(1):77-81. https://doi.org/10.1016/j.acap.2014.06.008.
3. Schroeder AR, Destino LA, Brooks R, Wang CJ, Coon ER. Outcomes of follow-up visits after bronchiolitis hospitalizations. JAMA Pediatr. 2018;172(3):296-297. https://doi.org/10.1001/jamapediatrics.2017.4002.
4. Drake MG. High-flow nasal cannula oxygen in adults: an evidence-based assessment. Ann Am Thorac Soc. 2018;15(2):145-155. https://doi.org/10.1513/AnnalsATS.201707-548FR.
5. Rubin S, Ghuman A, Deakers T, Khemani R, Ross P, Newth CJ. Effort of breathing in children receiving high-flow nasal cannula. Pediatr Crit Care Med. 2014;15(1):1-6. https://doi.org/10.1097/PCC.0000000000000011.
6. Hough JL, Pham TM, Schibler A. Physiologic effect of high-flow nasal cannula in infants with bronchiolitis. Pediatr Crit Care Med. 2014;15(5):e214-e219. https://doi.org/10.1097/PCC.0000000000000112.
7. Pham TM, O’Malley L, Mayfield S, Martin S, Schibler A. The effect of high flow nasal cannula therapy on the work of breathing in infants with bronchiolitis. Pediatr Pulmonol. 2015;50(7):713-720. https://doi.org/10.1002/ppul.23060.
8. Weiler T, Kamerkar A, Hotz J, Ross PA, Newth CJL, Khemani RG. The relationship between high flow nasal cannula flow rate and effort of breathing in children. J Pediatr. 2017;189:66-71.e63. https://doi.org/10.1016/j.jpeds.2017.06.006.
9. Mayfield S, Jauncey-Cooke J, Hough JL, Schibler A, Gibbons K, Bogossian F. High-flow nasal cannula therapy for respiratory support in children. Cochrane Database Syst Rev. 2014(3):CD009850. https://doi.org/10.1002/14651858.CD009850.pub2.
10. Roca O, Riera J, Torres F, Masclans JR. High-flow oxygen therapy in acute respiratory failure. Respir Care. 2010;55(4):408-413.
11. Kallappa C, Hufton M, Millen G, Ninan TK. Use of high flow nasal cannula oxygen (HFNCO) in infants with bronchiolitis on a paediatric ward: a 3-year experience. Arch Dis Child. 2014;99(8):790-791. https://doi.org/10.1136/archdischild-2014-306637.
12. Mayfield S, Bogossian F, O’Malley L, Schibler A. High-flow nasal cannula oxygen therapy for infants with bronchiolitis: pilot study. J Paediatr Child Health. 2014;50(5):373-378. https://doi.org/10.1111/jpc.12509.
13. Riese J, Porter T, Fierce J, Riese A, Richardson T, Alverson BK. Clinical outcomes of bronchiolitis after implementation of a general ward high flow nasal cannula guideline. Hosp Pediatr. 2017;7(4):197-203. https://doi.org/10.1542/hpeds.2016-0195.
14. Mace AO, Gibbons J, Schultz A, Knight G, Martin AC. Humidified high-flow nasal cannula oxygen for bronchiolitis: should we go with the flow? Arch Dis Child. 2018;103(3):303. https://doi.org/10.1136/archdischild-2017-313950.
15. Kepreotes E, Whitehead B, Attia J, et al. High-flow warm humidified oxygen versus standard low-flow nasal cannula oxygen for moderate bronchiolitis (HFWHO RCT): an open, phase 4, randomised controlled trial. Lancet. 2017;389(10072):930-939. https://doi.org/10.1016/S0140-6736(17)30061-2.
16. Franklin D, Babl FE, Schlapbach LJ, et al. A randomized trial of high-flow oxygen therapy in infants with bronchiolitis. N Engl J Med. 2018;378(12):1121-1131. https://doi.org/10.1056/NEJMoa1714855.
17. Coon ER, Mittal V, Brady PW. High flow nasal cannula-just expensive paracetamol? Lancet Child Adolesc Health. 2019;3(9):593-595. https://doi.org/10.1016/S2352-4642(19)30235-4.
18. Roth J. CMS’ ICD-9-CM to and from ICD-10-CM and ICD-10-PCS Crosswalk or General Equivalence Mappings. 2012. http://www.nber.org/data/icd9-icd-10-cm-and-pcs-crosswalk-general-equivalence-mapping.html. Accessed November 19, 2016.
19. Feudtner C, Feinstein JA, Zhong W, Hall M, Dai D. Pediatric complex chronic conditions classification system version 2: updated for ICD-10 and complex medical technology dependence and transplantation. BMC Pediatr. 2014;14:199. https://doi.org/10.1186/1471-2431-14-199.
20. Shein SL, Slain K, Wilson-Costello D, McKee B, Rotta AT. Temporal changes in prescription of neuropharmacologic drugs and utilization of resources related to neurologic morbidity in mechanically ventilated children with bronchiolitis. Pediatr Crit Care Med. 2017;18(12):e606-e614. https://doi.org/10.1097/PCC.0000000000001351.
21. Penfold RB, Zhang F. Use of interrupted time series analysis in evaluating health care quality improvements. Acad Pediatr. 2013;13(6 Suppl):S38-S44. https://doi.org/10.1016/j.acap.2013.08.002.
22. Newey WK, West KD. A simple, positive semi-definite, heteroskedasticity and autocorrelation consistent covariance matrix. Econometrica. 1987;55(3):703-708.
23. McKiernan C, Chua LC, Visintainer PF, Allen H. High flow nasal cannulae therapy in infants with bronchiolitis. J Pediatr. 2010;156(4):634-638. https://doi.org/10.1016/j.jpeds.2009.10.039.
24. Schibler A, Pham TM, Dunster KR, et al. Reduced intubation rates for infants after introduction of high-flow nasal prong oxygen delivery. Intensive Care Med. 2011;37(5):847-852. https://doi.org/10.1007/s00134-011-2177-5.
25. Kawaguchi A, Yasui Y, deCaen A, Garros D. The clinical impact of heated humidified high-flow nasal cannula on pediatric respiratory distress. Pediatr Crit Care Med. 2017;18(2):112-119. https://doi.org/10.1097/PCC.0000000000000985.
26. Schlapbach LJ, Straney L, Gelbart B, et al. Burden of disease and change in practice in critically ill infants with bronchiolitis. Eur Respir J. 2017;49(6):1601648. https://doi.org/10.1183/13993003.01648-2016.
1. Mansbach JM, Piedra PA, Teach SJ, et al. Prospective multicenter study of viral etiology and hospital length of stay in children with severe bronchiolitis. Arch Pediatr Adolesc Med. 2012;166(8):700-706. https://doi.org/10.1001/archpediatrics.2011.1669.
2. Hasegawa K, Pate BM, Mansbach JM, et al. Risk factors for requiring intensive care among children admitted to ward with bronchiolitis. Acad Pediatr. 2015;15(1):77-81. https://doi.org/10.1016/j.acap.2014.06.008.
3. Schroeder AR, Destino LA, Brooks R, Wang CJ, Coon ER. Outcomes of follow-up visits after bronchiolitis hospitalizations. JAMA Pediatr. 2018;172(3):296-297. https://doi.org/10.1001/jamapediatrics.2017.4002.
4. Drake MG. High-flow nasal cannula oxygen in adults: an evidence-based assessment. Ann Am Thorac Soc. 2018;15(2):145-155. https://doi.org/10.1513/AnnalsATS.201707-548FR.
5. Rubin S, Ghuman A, Deakers T, Khemani R, Ross P, Newth CJ. Effort of breathing in children receiving high-flow nasal cannula. Pediatr Crit Care Med. 2014;15(1):1-6. https://doi.org/10.1097/PCC.0000000000000011.
6. Hough JL, Pham TM, Schibler A. Physiologic effect of high-flow nasal cannula in infants with bronchiolitis. Pediatr Crit Care Med. 2014;15(5):e214-e219. https://doi.org/10.1097/PCC.0000000000000112.
7. Pham TM, O’Malley L, Mayfield S, Martin S, Schibler A. The effect of high flow nasal cannula therapy on the work of breathing in infants with bronchiolitis. Pediatr Pulmonol. 2015;50(7):713-720. https://doi.org/10.1002/ppul.23060.
8. Weiler T, Kamerkar A, Hotz J, Ross PA, Newth CJL, Khemani RG. The relationship between high flow nasal cannula flow rate and effort of breathing in children. J Pediatr. 2017;189:66-71.e63. https://doi.org/10.1016/j.jpeds.2017.06.006.
9. Mayfield S, Jauncey-Cooke J, Hough JL, Schibler A, Gibbons K, Bogossian F. High-flow nasal cannula therapy for respiratory support in children. Cochrane Database Syst Rev. 2014(3):CD009850. https://doi.org/10.1002/14651858.CD009850.pub2.
10. Roca O, Riera J, Torres F, Masclans JR. High-flow oxygen therapy in acute respiratory failure. Respir Care. 2010;55(4):408-413.
11. Kallappa C, Hufton M, Millen G, Ninan TK. Use of high flow nasal cannula oxygen (HFNCO) in infants with bronchiolitis on a paediatric ward: a 3-year experience. Arch Dis Child. 2014;99(8):790-791. https://doi.org/10.1136/archdischild-2014-306637.
12. Mayfield S, Bogossian F, O’Malley L, Schibler A. High-flow nasal cannula oxygen therapy for infants with bronchiolitis: pilot study. J Paediatr Child Health. 2014;50(5):373-378. https://doi.org/10.1111/jpc.12509.
13. Riese J, Porter T, Fierce J, Riese A, Richardson T, Alverson BK. Clinical outcomes of bronchiolitis after implementation of a general ward high flow nasal cannula guideline. Hosp Pediatr. 2017;7(4):197-203. https://doi.org/10.1542/hpeds.2016-0195.
14. Mace AO, Gibbons J, Schultz A, Knight G, Martin AC. Humidified high-flow nasal cannula oxygen for bronchiolitis: should we go with the flow? Arch Dis Child. 2018;103(3):303. https://doi.org/10.1136/archdischild-2017-313950.
15. Kepreotes E, Whitehead B, Attia J, et al. High-flow warm humidified oxygen versus standard low-flow nasal cannula oxygen for moderate bronchiolitis (HFWHO RCT): an open, phase 4, randomised controlled trial. Lancet. 2017;389(10072):930-939. https://doi.org/10.1016/S0140-6736(17)30061-2.
16. Franklin D, Babl FE, Schlapbach LJ, et al. A randomized trial of high-flow oxygen therapy in infants with bronchiolitis. N Engl J Med. 2018;378(12):1121-1131. https://doi.org/10.1056/NEJMoa1714855.
17. Coon ER, Mittal V, Brady PW. High flow nasal cannula-just expensive paracetamol? Lancet Child Adolesc Health. 2019;3(9):593-595. https://doi.org/10.1016/S2352-4642(19)30235-4.
18. Roth J. CMS’ ICD-9-CM to and from ICD-10-CM and ICD-10-PCS Crosswalk or General Equivalence Mappings. 2012. http://www.nber.org/data/icd9-icd-10-cm-and-pcs-crosswalk-general-equivalence-mapping.html. Accessed November 19, 2016.
19. Feudtner C, Feinstein JA, Zhong W, Hall M, Dai D. Pediatric complex chronic conditions classification system version 2: updated for ICD-10 and complex medical technology dependence and transplantation. BMC Pediatr. 2014;14:199. https://doi.org/10.1186/1471-2431-14-199.
20. Shein SL, Slain K, Wilson-Costello D, McKee B, Rotta AT. Temporal changes in prescription of neuropharmacologic drugs and utilization of resources related to neurologic morbidity in mechanically ventilated children with bronchiolitis. Pediatr Crit Care Med. 2017;18(12):e606-e614. https://doi.org/10.1097/PCC.0000000000001351.
21. Penfold RB, Zhang F. Use of interrupted time series analysis in evaluating health care quality improvements. Acad Pediatr. 2013;13(6 Suppl):S38-S44. https://doi.org/10.1016/j.acap.2013.08.002.
22. Newey WK, West KD. A simple, positive semi-definite, heteroskedasticity and autocorrelation consistent covariance matrix. Econometrica. 1987;55(3):703-708.
23. McKiernan C, Chua LC, Visintainer PF, Allen H. High flow nasal cannulae therapy in infants with bronchiolitis. J Pediatr. 2010;156(4):634-638. https://doi.org/10.1016/j.jpeds.2009.10.039.
24. Schibler A, Pham TM, Dunster KR, et al. Reduced intubation rates for infants after introduction of high-flow nasal prong oxygen delivery. Intensive Care Med. 2011;37(5):847-852. https://doi.org/10.1007/s00134-011-2177-5.
25. Kawaguchi A, Yasui Y, deCaen A, Garros D. The clinical impact of heated humidified high-flow nasal cannula on pediatric respiratory distress. Pediatr Crit Care Med. 2017;18(2):112-119. https://doi.org/10.1097/PCC.0000000000000985.
26. Schlapbach LJ, Straney L, Gelbart B, et al. Burden of disease and change in practice in critically ill infants with bronchiolitis. Eur Respir J. 2017;49(6):1601648. https://doi.org/10.1183/13993003.01648-2016.
© 2020 Society of Hospital Medicine
Developing a Patient- and Family-Centered Research Agenda for Hospital Medicine: The Improving Hospital Outcomes through Patient Engagement (i-HOPE) Study
Thirty-six million people are hospitalized annually in the United States,1 and a significant proportion of these patients are rehospitalized within 30 days.2 Gaps in hospital care are many and well documented, including high rates of adverse events, hospital-acquired conditions, and suboptimal care transitions.3-5 Despite significant efforts to improve the care of hospitalized patients and some incremental improvement in the safety of hospital care, hospital care remains suboptimal.6-9 Importantly, hospitalization remains a challenging and vulnerable time for patients and caregivers.
Despite research efforts to improve hospital care, there remains very little data regarding what patients, caregivers, and other stakeholders believe are the most important priorities for improving hospital care, experiences, and outcomes. Small studies described in brief reports provide limited insights into what aspects of hospital care are most important to patients and to their families.10-13 These small studies suggest that communication and the comfort of caregivers and of patient family members are important priorities, as are the provision of adequate sleeping arrangements, food choices, and psychosocial support. However, the limited nature of these studies precludes the possibility of larger conclusions regarding patient priorities.10-13
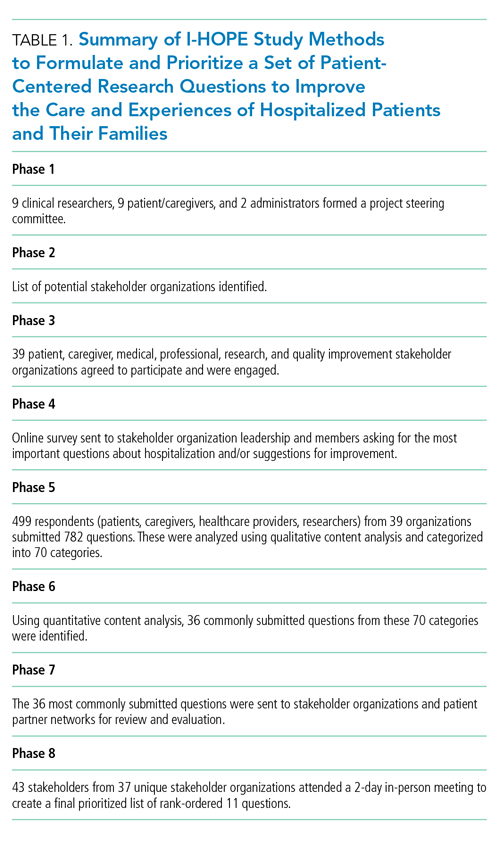
The evolution of patient-centered care has led to increasing efforts to engage, and partner, with patients, caregivers, and other stakeholders to obtain their input on healthcare, research, and improvement efforts.14 The guiding principle of this engagement is that patients and their caregivers are uniquely positioned to share their lived experiences of care and that their involvement ensures their voices are represented.15-17 Therefore to obtain greater insight into priority areas from the perspectives of patients, caregivers, and other healthcare stakeholders, we undertook a systematic engagement process to create a patient-partnered and stakeholder-partnered research agenda for improving the care of hospitalized adult patients.
METHODS
Guiding Frameworks for Study Methods
We used two established, validated methods to guide our collaborative, inclusive, and consultative approach to patient and stakeholder engagement and research prioritization:
- The Patient-Centered Outcomes Research Institute (PCORI) standards for formulating patient-centered research questions,18 which includes methods for stakeholder engagement that ensures the representativeness of engaged groups and dissemination of study results.18
- The James Lind Alliance (JLA) approach to “priority setting partnerships,” through which patients, caregivers, and clinicians partner to identify and prioritize unanswered questions.19
The Improving Hospital Outcomes through Patient Engagement (i-HOPE) study included eight stepwise phases to formulate and prioritize a set of patient-centered research questions to improve the care and experiences of hospitalized patients and their families.20 Our process is described below and summarized in Table 1.
Phases of Question Development
Phase 1: Steering Committee Formation
Nine clinical researchers, nine patients and/or caregivers, and two administrators from eight academic and community hospitals from across the United States formed a steering committee to participate in teleconferences every other week to manage all stages of the project including design, implementation, and dissemination. At the time of the project conceptualization, the researchers were a subgroup of the Society of Hospital Medicine Research Committee.21 Patient partners on the steering committee were identified from local patient and family advisory councils (PFACs) of the researchers’ institutions. Patients partners had previously participated in research or improvement initiatives with their hospitalist partners. Patient partners received stipends throughout the project in recognition of their participation and expertise. Included in the committee was a representative from the Society of Hospital Medicine (SHM)—our supporting and dissemination partner.
Phase 2: Stakeholder Identification
We created a list of potential stakeholder organizations to participate in the study based on the following:
- Organizations with which SHM has worked on initiatives related to the care of hospitalized adult patients
- Organizations with which steering committee members had worked
- Internet searches of organizations participating in similar PCORI-funded projects and of other professional societies that represented patients or providers who work in hospital or post-acute care settings
- Suggestions from stakeholders identified through the first two approaches as described above
We intended to have a broad representation of stakeholders to ensure diverse perspectives were included in the study. Stakeholder organizations included patient advocacy groups, providers, researchers, payers, policy makers and funding agencies.
Phase 3: Stakeholder Engagement and Awareness Training
Representatives from 39 stakeholder organizations who agreed to participate in the study were further orientated to the study rationale and methods via a series of interactive online webinars. This included reminding organziations that everyone’s input and perspective were valued and that we had a flat organization structure that ensured all stakeholders were equal.
Phase 4: Survey Development and Administration
We chose a survey approach to solicit input on identifying gaps in patient care and to generate research questions. The steering committee developed an online survey collaboratively with stakeholder organization representatives. We used survey pretesting with patient and researcher members from the steering committee. The goal of pretesting was to ensure accessibility and comprehension for all potential respondents, particularly patients and caregivers. The final survey asked respondents to record up to three questions that they thought would improve the care of hospitalized adult patients and their families. The specific wording of the survey is shown in the Figure and the entire survey in Appendix Document 1.
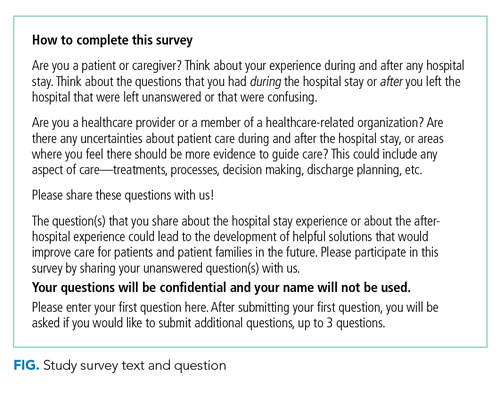
We chose three questions because that is the number of entries per participant that is recommended by JLA; it also minimizes responder burden.19 We asked respondents to identify the stakeholder group they represented (eg, patient, caregiver, healthcare provider, researcher) and for providers to identify where they primarily worked (eg, acute care hospital, post-acute care, advocacy group).
Survey Administration. We administered the survey electronically using Research Electronic Data Capture (REDCap), a secure web-based application used for collecting research data.22 Stakeholders were asked to disseminate the survey broadly using whatever methods that they felt was appropriate to their leadership or members.
Phase 5: Initial Question Categorization Using Qualitative Content Analysis
Six members of the steering committee independently performed qualitative content analysis to categorize all submitted questions.23,24 This analytic approach identifies, analyzes, and reports patterns within the data.23,24 We hypothesized that some of the submitted questions would relate to already-known problems with hospitalization. Therefore the steering committee developed an a priori codebook of 48 categories using common systems-based issues and diseases related to the care of hospitalized patients based on the hospitalist core competency topics developed by hospitalists and the SHM Education Committee,25 personal and clinical knowledge and experience related to the care of hospitalized adult patients, and published literature on the topic. These a priori categories and their definitions are shown in Appendix Document 2 and were the basis for our initial theory-driven (deductive) approach to data analysis.23
Once coding began, we identified 32 new and additional categories based on our review of the submitted questions, and these were the basis of our data-driven (inductive) approach to analysis.23 All proposed new codes and definitions were discussed with and approved by the entire steering committee prior to being added to the codebook (Appendix Document 2).
While coding categories were mutually exclusive, multiple codes could be attributed to a question depending on the content and meaning of a question. To ensure methodological rigor, reviewers met regularly via teleconference or communicated via email throughout the analysis to iteratively refine and define coding categories. All questions were reviewed independently, and then discussed, by at least two members of the analysis team. Any coding disparities were discussed and resolved by negotiated consensus.26 Analysis was conducted using Dedoose V8.0.35 (Sociocultural Research Consultants, Los Angeles, California).
Phase 6: Initial Question Identification Using Quantitative Content Analysis
Following thematic categorization, all steering committee members then reviewed each category to identify and quantify the most commonly submitted questions.27 A question was determined to be a commonly submitted question when it appeared at least 10 times.
Phase 7: Interim Priority Setting
We sent the list of the most commonly submitted questions (Appendix Document 3) to stakeholder organizations and patient partner networks for review and evaluation. Each organization was asked to engage with their constituents and leaders to collectively decide on which of these questions resonated and was most important. These preferences would then be used during the in-person meeting (Phase 8). We did not provide stakeholder organizations with information about how many times each question was submitted by respondents because we felt this could potentially bias their decision-making processes such that true importance and relevance would not obtained.
Phase 8: In-person Meeting for Final Question Prioritization and Refinement
Representatives from all 39 participating stakeholder organizations were invited to participate in a 2-day, in-person meeting to create a final prioritized list of questions to be used to guide patient-centered research seeking to improve the care of hospitalized adult patients and their caregivers. This meeting was attended by 43 stakeholders (26 stakeholder organization representatives and 17 steering committee members) from 37 unique stakeholder organizations. To facilitate the inclusiveness and to ensure a consensus-driven process, we used nominal group technique (NGT) to allow all of the meeting participants to discuss the list of prioritized questions in small groups.28 NGT allows participants to comprehend each other’s point of view to ensure no perpsectives are excluded.28 The NGT was followed by two rounds of individual voting. Stakeholders were then asked to frame their discussions and their votes based on the perspectives of their organizations or PFACs that they represent. The voting process required participants to make choices regarding the relative importance of all of the questions, which therefore makes the resulting list a true prioritized list. In the first round of voting, participants voted for up to five questions for inclusion on the prioritized list. Based on the distribution of votes, where one vote equals one point, each of the 36 questions was then ranked in order of the assigned points. The rank-ordering process resulted in a natural cut point or delineated point, resulting in the 11 questions considered to be the highest prioritized questions. Following this, a second round of voting took place with the same parameters as the first round and allowed us to rank order questions by order of importance and priority. Finally, during small and large group discussions, the original text of each question was edited, refined, and reformatted into questions that could drive a research agenda.
Ethical Oversight
This study was reviewed by the Institutional Review Board of the University of Texas Health Science Center at San Antonio and deemed not to be human subject research (UT Health San Antonio IRB Protocol Number: HSC20170058N).
RESULTS
In total, 499 respondents from 39 unique stakeholder organizations responded to our survey. Respondents self-identified into multiple categorizes resulting in 267 healthcare providers, 244 patients and caregivers, and 63 researchers. Characteristics of respondents to the survey are shown in Table 2.
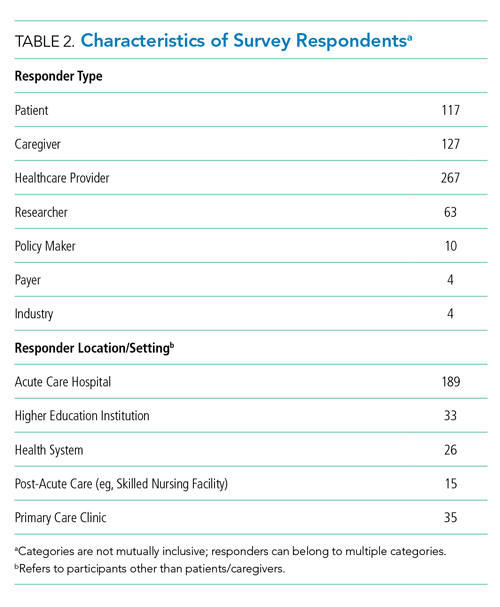
An overview of study results is shown in Table 1. Respondents submitted a total of 782 questions related to improving the care of hospitalized patients. These questions were categorized during thematic analysis into 70 distinct categories—52 that were health system related and 18 that were disease specific (Appendix 2). The most frequently used health system–related categories were related to discharge care transitions, medications, patient understanding, and patient-family-care team communication (Appendix 2).
From these categories, 36 questions met our criteria for “commonly identified,” ie, submitted at least 10 times (Appendix Document 3). Notably, these 36 questions were derived from 67 different coding categories, of which 24 (36%) were a priori (theory-driven) categories23 created by the Steering Committee before analysis began and 43 (64%) categories were created as a result of this study’s stakeholder-engaged process and a data-driven approach23 to analysis (Appendix Document 3). These groups of questions were then presented during the 2-day, in-person meeting and reduced to a final 11 questions that were identified in rank order as top priorities (Table 3). The questions considered highest priority related to ensuring shared treatment and goals of care decision making, improving hospital discharge handoff to other care facilities and providers, and reducing the confusion related to education on medications, conditions, hospital care, and discharge.
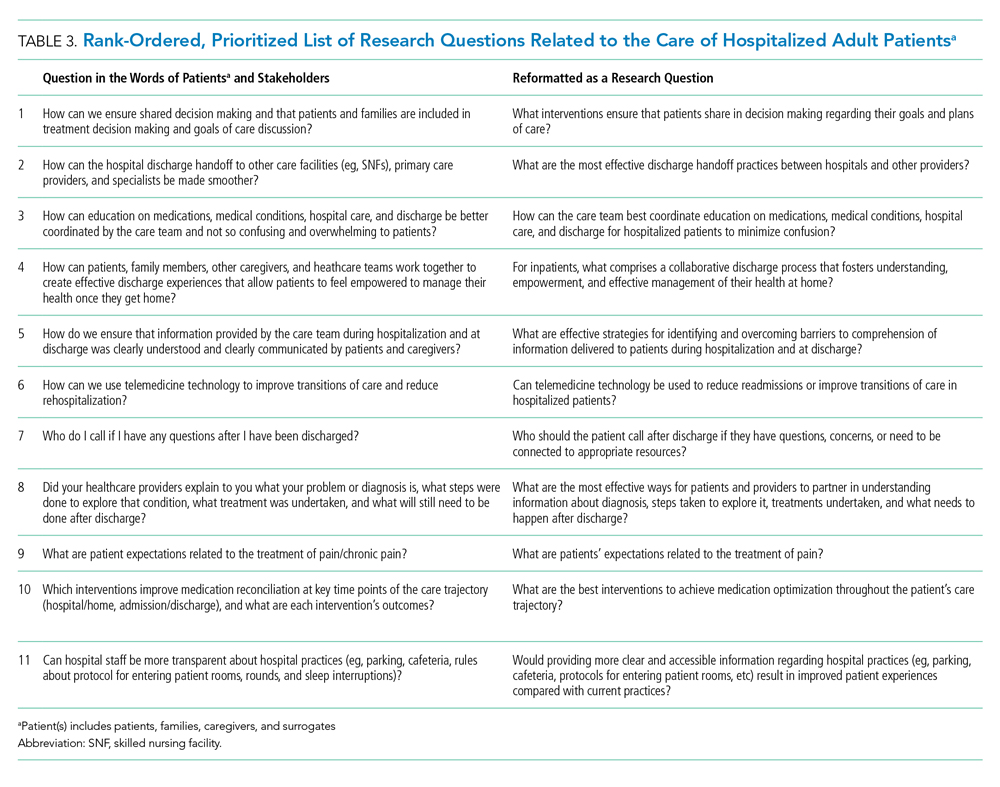
DISCUSSION
Using a dynamic and collaborative stakeholder engagement process, we identified 11 questions prioritized in order of importance by patients, caregivers, and other healthcare stakeholders to improve the care of hospitalized adult patients. While some of the topics identified are already well-known topics in need of research and improvement, our findings frame these topics according to the perspectives of patients, caregivers, and stakeholders. This unique perspective adds a level of richness and nuance that provides insight into how to better address these topics and ultimately inform research and quality improvement efforts.
The question considered to be the highest priority area for future research and improvement surmised how it may be possible to implement interventions that engage patients in shared decision making. Shared decision making involves patients and their care team working together to make decisions about treatment, and other aspects of care based on sound clinical evidence that balances the risks and outcomes with patient preferences and values. Although considered critically important,29 a recent evaluation of shared decision making practices in over 250 inpatient encounters identified significant gaps in physicians’ abilities to perform key elements of a shared decision making approach and reinforced the need to identify what strategies can best promote widespread shared decision making.30 While there has been considerable effort to faciliate shared decision making in practice, there remains mixed evidence regarding the sustainability and impact of tools seeking to support shared decision making, such as decision aids, question prompt lists, and coaches.31 This suggests that new approaches to shared decision making may be required and likely explains why this question was rated as a top priority by stakeholders in the current study.
Respondents frequently framed their questions in terms of their lived experiences, providing stories and scenarios to illustrate the importance of the questions they submitted. This personal framing highlighted to us the need to think about improving care delivery from the end-user perspective. For example, respondents framed questions about care transitions not with regard to early appointments, instructions, or medication lists, but rather in terms of whom to call with questions or how best to reach their physician, nurse, or other identified provider. These perspectives suggest that strategies and approaches to improvement that start with patient and caregiver experiences, such as design thinking,32 may be important to continued efforts to improve hospital care. Additionally, the focus on the interpersonal aspects of care delivery highlights the need to focus on the patient-provider relationship and communication.
Questions submitted by respondents demonstrated a stark difference between “patient education” and “patient understanding,” which suggests that being provided with education or education materials regarding care did not necessarily lead to a clear patient understanding. The potential for lack of understanding was particularly prominent in the context of care plan development and during times of care transition—topics that were encompassed in 9 out of 11 of our prioritized research questions. This may suggest that approaches that improve the ability for healthcare providers to deliver information may not be sufficient to meet the needs of patients and caregivers. Rather, partnering to develop a shared understanding—whether about prognosis, medications, hospital, or discharge care plans—is critical. Improved communication practices are not an endpoint for information delivery, but rather a starting point leading to a shared understanding.
Several of the priority areas identified in our study reflect the immensely complex intersections among patients, caregivers, clinicians, and the healthcare delivery system. Addressing these gaps in order to reach the goal of ideal hospital care and an improved patient experience will likely require coordinated approaches and strong involvement and buy-in from multiple stakeholders including the voices of patients and caregivers. Creating patient-centered and stakeholder-driven research has been an increasing priority nationally.33 Yet to realize this, we must continue to understand the foundations and best practices of authentic stakeholder engagement so that it can be achieved in practice.34 We intend for this prioritized list of questions to galvanize funders, researchers, clinicians, professional societies, and patient and caregiver advocacy groups to work together to address these topics through the creation of new research evidence or the sustainable implementation of existing evidence.
Our findings provide a foundation for stakeholder groups to work in partnership to find research and improvement solutions to the problems identified. Our efforts demonstrate the value and importance of a systematic and broad engagement process to ensure that the voices of patients, caregivers, and other healthcare stakeholders are included in guiding hospital research and quality improvement efforts. This is highlighted by the fact our results of prioritized category areas for research were largely only uncovered following the creation of coding categories during the analysis process and were not captured using a priori catgeories that were expected by the steering committee.
The strengths of this study include our attempts to systematically identify and engage a wide range of perspectives in hospital medicine, including perspectives from patients and their caregivers. There are also acknowledged limitations in our study. While we included patients and PFACs from across the country, the opinions of the people we included may not be representative of all patients. Similarly, the perspectives of the other participants may not have completely represented their stakeholder organizations. While we attempted to include a broad range of organizations, there may be other relevant groups who were not represented in our sample.
In summary, our findings provide direction for the multiple stakeholders involved in improving hospital care. The results will allow the research community to focus on questions that are most important to patients, caregivers, and other stakeholders, reframing them in ways that are more relevant to patients’ lived experiences and that reflect the complexity of the issues. Our findings can also be used by healthcare providers and delivery organizations to target local improvement efforts. We hope that patients and caregivers will use our results to advocate for research and improvement in areas that matter the most to them. We hope that policy makers and funding agencies use our results to promote work in these areas and drive a national conversation about how to most effectively improve hospital care.
Acknowledgments
The authors would like to thank all patients, caregivers, and stakeholders who completed the survey. The authors also would like to acknowledge the organizations and individuals who participated in this study (see Appendix Document 4 for full list). At SHM, the authors would like to specifically thank Claudia Stahl, Jenna Goldstein, Kevin Vuernick, Dr Brad Sharpe, and Dr Larry Wellikson for their support.
Disclaimer
The statements presented in this publication are solely the responsibility of the authors and do not necessarily represent the views of the Department of Veterans Affairs, Patient-Centered Outcomes Research Institute (PCORI), its Board of Governors, or Methodology Committee.
1. American Hospital Association. 2019 American Hospital Association Hospital Statistics. Chicago, Illinois: American Hospital Association; 2019.
2. Alper E, O’Malley T, Greenwald J. UptoDate: Hospital discharge and readmission. https://www.uptodate.com/contents/hospital-discharge-and-readmission. Accessed August 8, 2019.
3. de Vries EN, Ramrattan MA, Smorenburg SM, Gouma DJ, Boermeester MA. The incidence and nature of in-hospital adverse events: a systematic review. Qual Saf Heal Care. 2008;17(3):216-223. https://doi.org/10.1136/qshc.2007.023622.
4. Agency for Healthcare Research and Quality. Readmissions and Adverse Events After Discharge. https://psnet.ahrq.gov/primers/primer/11/Readmissions-and-Adverse-Events-After-Discharge. Accessed August 8, 2019.
5. Institute of Medicine (US) Committee on Quality of Health Care in America. Crossing the Quality Chasm: A New Health System for the 21st Century. Washington, DC; National Academies Press; 2001. https://doi.org/10.17226/10027.
6. Trivedi AN, Nsa W, Hausmann LRM, et al. Quality and equity of care in U.S. hospitals. N Engl J Med. 2014;371(24):2298-2308. https://doi.org/10.1056/NEJMsa1405003.
7. National Patient Safety Foundation. Free from Harm: Accelerating Patient Safety Improvement Fifteen Years after To Err Is Human. Boston: National Patient Safety Foundation; 2015.
8. Agency for Healthcare Research and Quality. AHRQ National Scorecard on Hospital-Acquired Conditions Updated Baseline Rates and Preliminary Results 2014–2017. https://www.ahrq.gov/sites/default/files/wysiwyg/professionals/quality-patient-safety/pfp/hacreport-2019.pdf. Accessed August 8, 2019.
9. Hansen LO, Greenwald JL, Budnitz T, et al. Project BOOST: effectiveness of a multihospital effort to reduce rehospitalization. J Hosp Med. 2013;8(8):421-427. https://doi.org/10.1002/jhm.2054.
10. Snyder HJ, Fletcher KE. The hospital experience through the patients’ eyes. J Patient Exp. 2019. https://doi.org/10.1177/2374373519843056.
11. Kebede S, Shihab HM, Berger ZD, Shah NG, Yeh H-C, Brotman DJ. Patients’ understanding of their hospitalizations and association with satisfaction. JAMA Intern Med. 2014;174(10):1698-1700. https://doi.org/10.1001/jamainternmed.2014.3765.
12. Shoeb M, Merel SE, Jackson MB, Anawalt BD. “Can we just stop and talk?” patients value verbal communication about discharge care plans. J Hosp Med. 2012;7(6):504-507. https://doi.org/10.1002/jhm.1937.
13. Neeman N, Quinn K, Shoeb M, Mourad M, Sehgal NL, Sliwka D. Postdischarge focus groups to improve the hospital experience. Am J Med Qual. 2013;28(6):536-538. https://doi.org/10.1177/1062860613488623.
14. Duffett L. Patient engagement: what partnering with patients in research is all about. Thromb Res. 2017;150:113-120. https://doi.org/10.1016/j.thromres.2016.10.029.
15. Pomey M, Hihat H, Khalifa M, Lebel P, Neron A, Dumez V. Patient partnership in quality improvement of healthcare services: patients’ inputs and challenges faced. Patient Exp J. 2015;2:29-42. https://doi.org/10.35680/2372-0247.1064.
16. Robbins M, Tufte J, Hsu C. Learning to “swim” with the experts: experiences of two patient co-investigators for a project funded by the Patient-Centered Outcomes Research Institute. Perm J. 2016;20(2):85-88. https://doi.org/10.7812/TPP/15-162.
17. Tai-Seale M, Sullivan G, Cheney A, Thomas K, Frosch D. The language of engagement: “aha!” moments from engaging patients and community partners in two pilot projects of the Patient-Centered Outcomes Research Institute. Perm J. 2016;20(2):89-92. https://doi.org/10.7812/TPP/15-123.
18. Patient-Centered Outcomes Research Institute (PCORI). PCORI Methodology Standards: Standards for Formulating Research Questions. https://www.pcori.org/research-results/about-our-research/research-methodology/pcori-methodology-standards#Formulating Research Questions. Accessed August 8, 2019.
19. James Lind Alliance. The James Lind Alliance Guidebook. Version 8. Southampton, England: James Lind Alliance; 2018.
20. Society of Hospital Medicine (SHM). Improving Hospital Outcomes through Patient Engagement: The i-HOPE Study. https://www.hospitalmedicine.org/clinical-topics/i-hope-study/. Accessed August 8, 2019.
21. Society of Hospital Medicine (SHM). Committees. https://www.hospitalmedicine.org/membership/committees/. Accessed August 8, 2019.
22. Harris PA, Taylor R, Thielke R, Payne J, Gonzalez N, Conde JG. Research Electronic Data Capture (REDCap) - a metadata-driven methodology and workflow process for providing translational research informatics support. J Biomed Inform. 2009;42(2):377-381. https://doi.org/10.1016/j.jbi.2008.08.010.
23. Schreier M. Qualitative content analysis in practice. Los Angeles, CA: SAGE Publications; 2012.
24. Elo S, Kyngäs H. The qualitative content analysis process. J Adv Nurs. 2008;62(1):107-115. https://doi.org/10.1111/j.1365-2648.2007.04569.x.
25. Nichani S, Crocker J, Fitterman N, Lukela M. Updating the core competencies in hospital medicine—2017 revision: introduction and methodology. J Hosp Med. 2017;12(4):283-287. https://doi.org/10.12788/jhm.2715.
26. Bradley EH, Curry LA, Devers KJ. Qualitative data analysis for health services research: developing taxonomy, themes, and theory. Health Serv Res. 2007;42(4):1758-1772. https://doi.org/10.1111/j.1475-6773.2006.00684.x.
27. Coe K, Scacco JM. Content analysis, quantitative. Int Encycl Commun Res Methods. 2017:1-11. https://doi.org/10.1002/9781118901731.iecrm0045.
28. Centers for Disease Control and Prevention. Evaluation Briefs: Gaining Consensus Among Stakeholders Through the Nominal Group Technique. Atlanta, GA; 2018. https://www.cdc.gov/healthyyouth/evaluation/pdf/brief7.pdf. Accessed August 8, 2019.
29. Charles C, Gafni A, Whelan T. Shared decision-making in the medical encounter: what does it mean? (or it takes at least two to tango). Soc Sci Med. 1997;44(5):681-692. https://doi.org/10.1016/s0277-9536(96)00221-3.
30. Blankenburg R, Hilton JF, Yuan P, et al. Shared decision-making during inpatient rounds: opportunities for improvement in patient engagement and communication. J Hosp Med. 2018;13(7):453-461. https://doi.org/10.12788/jhm.2909.
31. Legare F, Adekpedjou R, Stacey D, et al. Interventions for increasing the use of shared decision making by healthcare professionals. Cochrane Database Syst Rev. 2018;7(7):CD006732. https://doi.org/10.1002/14651858.CD006732.pub4.
32. Roberts JP, Fisher TR, Trowbridge MJ, Bent C. A design thinking framework for healthcare management and innovation. Healthc (Amst). 2016;4(1):11-14. https://doi.org/10.1016/j.hjdsi.2015.12.002.
33. Selby JV, Beal AC, Frank L. The Patient-Centered Outcomes Research Institute (PCORI) national priorities for research and initial research agenda. JAMA. 2012;307(15):1583-1584. https://doi.org/10.1001/jama.2012.500.
34. Harrison J, Auerbach A, Anderson W, et al. Patient stakeholder engagement in research: a narrative review to describe foundational principles and best practice activities. Health Expect. 2019;22(3):307-316. https://doi.org/10.1111/hex.12873.
Thirty-six million people are hospitalized annually in the United States,1 and a significant proportion of these patients are rehospitalized within 30 days.2 Gaps in hospital care are many and well documented, including high rates of adverse events, hospital-acquired conditions, and suboptimal care transitions.3-5 Despite significant efforts to improve the care of hospitalized patients and some incremental improvement in the safety of hospital care, hospital care remains suboptimal.6-9 Importantly, hospitalization remains a challenging and vulnerable time for patients and caregivers.
Despite research efforts to improve hospital care, there remains very little data regarding what patients, caregivers, and other stakeholders believe are the most important priorities for improving hospital care, experiences, and outcomes. Small studies described in brief reports provide limited insights into what aspects of hospital care are most important to patients and to their families.10-13 These small studies suggest that communication and the comfort of caregivers and of patient family members are important priorities, as are the provision of adequate sleeping arrangements, food choices, and psychosocial support. However, the limited nature of these studies precludes the possibility of larger conclusions regarding patient priorities.10-13
The evolution of patient-centered care has led to increasing efforts to engage, and partner, with patients, caregivers, and other stakeholders to obtain their input on healthcare, research, and improvement efforts.14 The guiding principle of this engagement is that patients and their caregivers are uniquely positioned to share their lived experiences of care and that their involvement ensures their voices are represented.15-17 Therefore to obtain greater insight into priority areas from the perspectives of patients, caregivers, and other healthcare stakeholders, we undertook a systematic engagement process to create a patient-partnered and stakeholder-partnered research agenda for improving the care of hospitalized adult patients.
METHODS
Guiding Frameworks for Study Methods
We used two established, validated methods to guide our collaborative, inclusive, and consultative approach to patient and stakeholder engagement and research prioritization:
- The Patient-Centered Outcomes Research Institute (PCORI) standards for formulating patient-centered research questions,18 which includes methods for stakeholder engagement that ensures the representativeness of engaged groups and dissemination of study results.18
- The James Lind Alliance (JLA) approach to “priority setting partnerships,” through which patients, caregivers, and clinicians partner to identify and prioritize unanswered questions.19
The Improving Hospital Outcomes through Patient Engagement (i-HOPE) study included eight stepwise phases to formulate and prioritize a set of patient-centered research questions to improve the care and experiences of hospitalized patients and their families.20 Our process is described below and summarized in Table 1.
Phases of Question Development
Phase 1: Steering Committee Formation
Nine clinical researchers, nine patients and/or caregivers, and two administrators from eight academic and community hospitals from across the United States formed a steering committee to participate in teleconferences every other week to manage all stages of the project including design, implementation, and dissemination. At the time of the project conceptualization, the researchers were a subgroup of the Society of Hospital Medicine Research Committee.21 Patient partners on the steering committee were identified from local patient and family advisory councils (PFACs) of the researchers’ institutions. Patients partners had previously participated in research or improvement initiatives with their hospitalist partners. Patient partners received stipends throughout the project in recognition of their participation and expertise. Included in the committee was a representative from the Society of Hospital Medicine (SHM)—our supporting and dissemination partner.
Phase 2: Stakeholder Identification
We created a list of potential stakeholder organizations to participate in the study based on the following:
- Organizations with which SHM has worked on initiatives related to the care of hospitalized adult patients
- Organizations with which steering committee members had worked
- Internet searches of organizations participating in similar PCORI-funded projects and of other professional societies that represented patients or providers who work in hospital or post-acute care settings
- Suggestions from stakeholders identified through the first two approaches as described above
We intended to have a broad representation of stakeholders to ensure diverse perspectives were included in the study. Stakeholder organizations included patient advocacy groups, providers, researchers, payers, policy makers and funding agencies.
Phase 3: Stakeholder Engagement and Awareness Training
Representatives from 39 stakeholder organizations who agreed to participate in the study were further orientated to the study rationale and methods via a series of interactive online webinars. This included reminding organziations that everyone’s input and perspective were valued and that we had a flat organization structure that ensured all stakeholders were equal.
Phase 4: Survey Development and Administration
We chose a survey approach to solicit input on identifying gaps in patient care and to generate research questions. The steering committee developed an online survey collaboratively with stakeholder organization representatives. We used survey pretesting with patient and researcher members from the steering committee. The goal of pretesting was to ensure accessibility and comprehension for all potential respondents, particularly patients and caregivers. The final survey asked respondents to record up to three questions that they thought would improve the care of hospitalized adult patients and their families. The specific wording of the survey is shown in the Figure and the entire survey in Appendix Document 1.
We chose three questions because that is the number of entries per participant that is recommended by JLA; it also minimizes responder burden.19 We asked respondents to identify the stakeholder group they represented (eg, patient, caregiver, healthcare provider, researcher) and for providers to identify where they primarily worked (eg, acute care hospital, post-acute care, advocacy group).
Survey Administration. We administered the survey electronically using Research Electronic Data Capture (REDCap), a secure web-based application used for collecting research data.22 Stakeholders were asked to disseminate the survey broadly using whatever methods that they felt was appropriate to their leadership or members.
Phase 5: Initial Question Categorization Using Qualitative Content Analysis
Six members of the steering committee independently performed qualitative content analysis to categorize all submitted questions.23,24 This analytic approach identifies, analyzes, and reports patterns within the data.23,24 We hypothesized that some of the submitted questions would relate to already-known problems with hospitalization. Therefore the steering committee developed an a priori codebook of 48 categories using common systems-based issues and diseases related to the care of hospitalized patients based on the hospitalist core competency topics developed by hospitalists and the SHM Education Committee,25 personal and clinical knowledge and experience related to the care of hospitalized adult patients, and published literature on the topic. These a priori categories and their definitions are shown in Appendix Document 2 and were the basis for our initial theory-driven (deductive) approach to data analysis.23
Once coding began, we identified 32 new and additional categories based on our review of the submitted questions, and these were the basis of our data-driven (inductive) approach to analysis.23 All proposed new codes and definitions were discussed with and approved by the entire steering committee prior to being added to the codebook (Appendix Document 2).
While coding categories were mutually exclusive, multiple codes could be attributed to a question depending on the content and meaning of a question. To ensure methodological rigor, reviewers met regularly via teleconference or communicated via email throughout the analysis to iteratively refine and define coding categories. All questions were reviewed independently, and then discussed, by at least two members of the analysis team. Any coding disparities were discussed and resolved by negotiated consensus.26 Analysis was conducted using Dedoose V8.0.35 (Sociocultural Research Consultants, Los Angeles, California).
Phase 6: Initial Question Identification Using Quantitative Content Analysis
Following thematic categorization, all steering committee members then reviewed each category to identify and quantify the most commonly submitted questions.27 A question was determined to be a commonly submitted question when it appeared at least 10 times.
Phase 7: Interim Priority Setting
We sent the list of the most commonly submitted questions (Appendix Document 3) to stakeholder organizations and patient partner networks for review and evaluation. Each organization was asked to engage with their constituents and leaders to collectively decide on which of these questions resonated and was most important. These preferences would then be used during the in-person meeting (Phase 8). We did not provide stakeholder organizations with information about how many times each question was submitted by respondents because we felt this could potentially bias their decision-making processes such that true importance and relevance would not obtained.
Phase 8: In-person Meeting for Final Question Prioritization and Refinement
Representatives from all 39 participating stakeholder organizations were invited to participate in a 2-day, in-person meeting to create a final prioritized list of questions to be used to guide patient-centered research seeking to improve the care of hospitalized adult patients and their caregivers. This meeting was attended by 43 stakeholders (26 stakeholder organization representatives and 17 steering committee members) from 37 unique stakeholder organizations. To facilitate the inclusiveness and to ensure a consensus-driven process, we used nominal group technique (NGT) to allow all of the meeting participants to discuss the list of prioritized questions in small groups.28 NGT allows participants to comprehend each other’s point of view to ensure no perpsectives are excluded.28 The NGT was followed by two rounds of individual voting. Stakeholders were then asked to frame their discussions and their votes based on the perspectives of their organizations or PFACs that they represent. The voting process required participants to make choices regarding the relative importance of all of the questions, which therefore makes the resulting list a true prioritized list. In the first round of voting, participants voted for up to five questions for inclusion on the prioritized list. Based on the distribution of votes, where one vote equals one point, each of the 36 questions was then ranked in order of the assigned points. The rank-ordering process resulted in a natural cut point or delineated point, resulting in the 11 questions considered to be the highest prioritized questions. Following this, a second round of voting took place with the same parameters as the first round and allowed us to rank order questions by order of importance and priority. Finally, during small and large group discussions, the original text of each question was edited, refined, and reformatted into questions that could drive a research agenda.
Ethical Oversight
This study was reviewed by the Institutional Review Board of the University of Texas Health Science Center at San Antonio and deemed not to be human subject research (UT Health San Antonio IRB Protocol Number: HSC20170058N).
RESULTS
In total, 499 respondents from 39 unique stakeholder organizations responded to our survey. Respondents self-identified into multiple categorizes resulting in 267 healthcare providers, 244 patients and caregivers, and 63 researchers. Characteristics of respondents to the survey are shown in Table 2.
An overview of study results is shown in Table 1. Respondents submitted a total of 782 questions related to improving the care of hospitalized patients. These questions were categorized during thematic analysis into 70 distinct categories—52 that were health system related and 18 that were disease specific (Appendix 2). The most frequently used health system–related categories were related to discharge care transitions, medications, patient understanding, and patient-family-care team communication (Appendix 2).
From these categories, 36 questions met our criteria for “commonly identified,” ie, submitted at least 10 times (Appendix Document 3). Notably, these 36 questions were derived from 67 different coding categories, of which 24 (36%) were a priori (theory-driven) categories23 created by the Steering Committee before analysis began and 43 (64%) categories were created as a result of this study’s stakeholder-engaged process and a data-driven approach23 to analysis (Appendix Document 3). These groups of questions were then presented during the 2-day, in-person meeting and reduced to a final 11 questions that were identified in rank order as top priorities (Table 3). The questions considered highest priority related to ensuring shared treatment and goals of care decision making, improving hospital discharge handoff to other care facilities and providers, and reducing the confusion related to education on medications, conditions, hospital care, and discharge.
DISCUSSION
Using a dynamic and collaborative stakeholder engagement process, we identified 11 questions prioritized in order of importance by patients, caregivers, and other healthcare stakeholders to improve the care of hospitalized adult patients. While some of the topics identified are already well-known topics in need of research and improvement, our findings frame these topics according to the perspectives of patients, caregivers, and stakeholders. This unique perspective adds a level of richness and nuance that provides insight into how to better address these topics and ultimately inform research and quality improvement efforts.
The question considered to be the highest priority area for future research and improvement surmised how it may be possible to implement interventions that engage patients in shared decision making. Shared decision making involves patients and their care team working together to make decisions about treatment, and other aspects of care based on sound clinical evidence that balances the risks and outcomes with patient preferences and values. Although considered critically important,29 a recent evaluation of shared decision making practices in over 250 inpatient encounters identified significant gaps in physicians’ abilities to perform key elements of a shared decision making approach and reinforced the need to identify what strategies can best promote widespread shared decision making.30 While there has been considerable effort to faciliate shared decision making in practice, there remains mixed evidence regarding the sustainability and impact of tools seeking to support shared decision making, such as decision aids, question prompt lists, and coaches.31 This suggests that new approaches to shared decision making may be required and likely explains why this question was rated as a top priority by stakeholders in the current study.
Respondents frequently framed their questions in terms of their lived experiences, providing stories and scenarios to illustrate the importance of the questions they submitted. This personal framing highlighted to us the need to think about improving care delivery from the end-user perspective. For example, respondents framed questions about care transitions not with regard to early appointments, instructions, or medication lists, but rather in terms of whom to call with questions or how best to reach their physician, nurse, or other identified provider. These perspectives suggest that strategies and approaches to improvement that start with patient and caregiver experiences, such as design thinking,32 may be important to continued efforts to improve hospital care. Additionally, the focus on the interpersonal aspects of care delivery highlights the need to focus on the patient-provider relationship and communication.
Questions submitted by respondents demonstrated a stark difference between “patient education” and “patient understanding,” which suggests that being provided with education or education materials regarding care did not necessarily lead to a clear patient understanding. The potential for lack of understanding was particularly prominent in the context of care plan development and during times of care transition—topics that were encompassed in 9 out of 11 of our prioritized research questions. This may suggest that approaches that improve the ability for healthcare providers to deliver information may not be sufficient to meet the needs of patients and caregivers. Rather, partnering to develop a shared understanding—whether about prognosis, medications, hospital, or discharge care plans—is critical. Improved communication practices are not an endpoint for information delivery, but rather a starting point leading to a shared understanding.
Several of the priority areas identified in our study reflect the immensely complex intersections among patients, caregivers, clinicians, and the healthcare delivery system. Addressing these gaps in order to reach the goal of ideal hospital care and an improved patient experience will likely require coordinated approaches and strong involvement and buy-in from multiple stakeholders including the voices of patients and caregivers. Creating patient-centered and stakeholder-driven research has been an increasing priority nationally.33 Yet to realize this, we must continue to understand the foundations and best practices of authentic stakeholder engagement so that it can be achieved in practice.34 We intend for this prioritized list of questions to galvanize funders, researchers, clinicians, professional societies, and patient and caregiver advocacy groups to work together to address these topics through the creation of new research evidence or the sustainable implementation of existing evidence.
Our findings provide a foundation for stakeholder groups to work in partnership to find research and improvement solutions to the problems identified. Our efforts demonstrate the value and importance of a systematic and broad engagement process to ensure that the voices of patients, caregivers, and other healthcare stakeholders are included in guiding hospital research and quality improvement efforts. This is highlighted by the fact our results of prioritized category areas for research were largely only uncovered following the creation of coding categories during the analysis process and were not captured using a priori catgeories that were expected by the steering committee.
The strengths of this study include our attempts to systematically identify and engage a wide range of perspectives in hospital medicine, including perspectives from patients and their caregivers. There are also acknowledged limitations in our study. While we included patients and PFACs from across the country, the opinions of the people we included may not be representative of all patients. Similarly, the perspectives of the other participants may not have completely represented their stakeholder organizations. While we attempted to include a broad range of organizations, there may be other relevant groups who were not represented in our sample.
In summary, our findings provide direction for the multiple stakeholders involved in improving hospital care. The results will allow the research community to focus on questions that are most important to patients, caregivers, and other stakeholders, reframing them in ways that are more relevant to patients’ lived experiences and that reflect the complexity of the issues. Our findings can also be used by healthcare providers and delivery organizations to target local improvement efforts. We hope that patients and caregivers will use our results to advocate for research and improvement in areas that matter the most to them. We hope that policy makers and funding agencies use our results to promote work in these areas and drive a national conversation about how to most effectively improve hospital care.
Acknowledgments
The authors would like to thank all patients, caregivers, and stakeholders who completed the survey. The authors also would like to acknowledge the organizations and individuals who participated in this study (see Appendix Document 4 for full list). At SHM, the authors would like to specifically thank Claudia Stahl, Jenna Goldstein, Kevin Vuernick, Dr Brad Sharpe, and Dr Larry Wellikson for their support.
Disclaimer
The statements presented in this publication are solely the responsibility of the authors and do not necessarily represent the views of the Department of Veterans Affairs, Patient-Centered Outcomes Research Institute (PCORI), its Board of Governors, or Methodology Committee.
Thirty-six million people are hospitalized annually in the United States,1 and a significant proportion of these patients are rehospitalized within 30 days.2 Gaps in hospital care are many and well documented, including high rates of adverse events, hospital-acquired conditions, and suboptimal care transitions.3-5 Despite significant efforts to improve the care of hospitalized patients and some incremental improvement in the safety of hospital care, hospital care remains suboptimal.6-9 Importantly, hospitalization remains a challenging and vulnerable time for patients and caregivers.
Despite research efforts to improve hospital care, there remains very little data regarding what patients, caregivers, and other stakeholders believe are the most important priorities for improving hospital care, experiences, and outcomes. Small studies described in brief reports provide limited insights into what aspects of hospital care are most important to patients and to their families.10-13 These small studies suggest that communication and the comfort of caregivers and of patient family members are important priorities, as are the provision of adequate sleeping arrangements, food choices, and psychosocial support. However, the limited nature of these studies precludes the possibility of larger conclusions regarding patient priorities.10-13
The evolution of patient-centered care has led to increasing efforts to engage, and partner, with patients, caregivers, and other stakeholders to obtain their input on healthcare, research, and improvement efforts.14 The guiding principle of this engagement is that patients and their caregivers are uniquely positioned to share their lived experiences of care and that their involvement ensures their voices are represented.15-17 Therefore to obtain greater insight into priority areas from the perspectives of patients, caregivers, and other healthcare stakeholders, we undertook a systematic engagement process to create a patient-partnered and stakeholder-partnered research agenda for improving the care of hospitalized adult patients.
METHODS
Guiding Frameworks for Study Methods
We used two established, validated methods to guide our collaborative, inclusive, and consultative approach to patient and stakeholder engagement and research prioritization:
- The Patient-Centered Outcomes Research Institute (PCORI) standards for formulating patient-centered research questions,18 which includes methods for stakeholder engagement that ensures the representativeness of engaged groups and dissemination of study results.18
- The James Lind Alliance (JLA) approach to “priority setting partnerships,” through which patients, caregivers, and clinicians partner to identify and prioritize unanswered questions.19
The Improving Hospital Outcomes through Patient Engagement (i-HOPE) study included eight stepwise phases to formulate and prioritize a set of patient-centered research questions to improve the care and experiences of hospitalized patients and their families.20 Our process is described below and summarized in Table 1.
Phases of Question Development
Phase 1: Steering Committee Formation
Nine clinical researchers, nine patients and/or caregivers, and two administrators from eight academic and community hospitals from across the United States formed a steering committee to participate in teleconferences every other week to manage all stages of the project including design, implementation, and dissemination. At the time of the project conceptualization, the researchers were a subgroup of the Society of Hospital Medicine Research Committee.21 Patient partners on the steering committee were identified from local patient and family advisory councils (PFACs) of the researchers’ institutions. Patients partners had previously participated in research or improvement initiatives with their hospitalist partners. Patient partners received stipends throughout the project in recognition of their participation and expertise. Included in the committee was a representative from the Society of Hospital Medicine (SHM)—our supporting and dissemination partner.
Phase 2: Stakeholder Identification
We created a list of potential stakeholder organizations to participate in the study based on the following:
- Organizations with which SHM has worked on initiatives related to the care of hospitalized adult patients
- Organizations with which steering committee members had worked
- Internet searches of organizations participating in similar PCORI-funded projects and of other professional societies that represented patients or providers who work in hospital or post-acute care settings
- Suggestions from stakeholders identified through the first two approaches as described above
We intended to have a broad representation of stakeholders to ensure diverse perspectives were included in the study. Stakeholder organizations included patient advocacy groups, providers, researchers, payers, policy makers and funding agencies.
Phase 3: Stakeholder Engagement and Awareness Training
Representatives from 39 stakeholder organizations who agreed to participate in the study were further orientated to the study rationale and methods via a series of interactive online webinars. This included reminding organziations that everyone’s input and perspective were valued and that we had a flat organization structure that ensured all stakeholders were equal.
Phase 4: Survey Development and Administration
We chose a survey approach to solicit input on identifying gaps in patient care and to generate research questions. The steering committee developed an online survey collaboratively with stakeholder organization representatives. We used survey pretesting with patient and researcher members from the steering committee. The goal of pretesting was to ensure accessibility and comprehension for all potential respondents, particularly patients and caregivers. The final survey asked respondents to record up to three questions that they thought would improve the care of hospitalized adult patients and their families. The specific wording of the survey is shown in the Figure and the entire survey in Appendix Document 1.
We chose three questions because that is the number of entries per participant that is recommended by JLA; it also minimizes responder burden.19 We asked respondents to identify the stakeholder group they represented (eg, patient, caregiver, healthcare provider, researcher) and for providers to identify where they primarily worked (eg, acute care hospital, post-acute care, advocacy group).
Survey Administration. We administered the survey electronically using Research Electronic Data Capture (REDCap), a secure web-based application used for collecting research data.22 Stakeholders were asked to disseminate the survey broadly using whatever methods that they felt was appropriate to their leadership or members.
Phase 5: Initial Question Categorization Using Qualitative Content Analysis
Six members of the steering committee independently performed qualitative content analysis to categorize all submitted questions.23,24 This analytic approach identifies, analyzes, and reports patterns within the data.23,24 We hypothesized that some of the submitted questions would relate to already-known problems with hospitalization. Therefore the steering committee developed an a priori codebook of 48 categories using common systems-based issues and diseases related to the care of hospitalized patients based on the hospitalist core competency topics developed by hospitalists and the SHM Education Committee,25 personal and clinical knowledge and experience related to the care of hospitalized adult patients, and published literature on the topic. These a priori categories and their definitions are shown in Appendix Document 2 and were the basis for our initial theory-driven (deductive) approach to data analysis.23
Once coding began, we identified 32 new and additional categories based on our review of the submitted questions, and these were the basis of our data-driven (inductive) approach to analysis.23 All proposed new codes and definitions were discussed with and approved by the entire steering committee prior to being added to the codebook (Appendix Document 2).
While coding categories were mutually exclusive, multiple codes could be attributed to a question depending on the content and meaning of a question. To ensure methodological rigor, reviewers met regularly via teleconference or communicated via email throughout the analysis to iteratively refine and define coding categories. All questions were reviewed independently, and then discussed, by at least two members of the analysis team. Any coding disparities were discussed and resolved by negotiated consensus.26 Analysis was conducted using Dedoose V8.0.35 (Sociocultural Research Consultants, Los Angeles, California).
Phase 6: Initial Question Identification Using Quantitative Content Analysis
Following thematic categorization, all steering committee members then reviewed each category to identify and quantify the most commonly submitted questions.27 A question was determined to be a commonly submitted question when it appeared at least 10 times.
Phase 7: Interim Priority Setting
We sent the list of the most commonly submitted questions (Appendix Document 3) to stakeholder organizations and patient partner networks for review and evaluation. Each organization was asked to engage with their constituents and leaders to collectively decide on which of these questions resonated and was most important. These preferences would then be used during the in-person meeting (Phase 8). We did not provide stakeholder organizations with information about how many times each question was submitted by respondents because we felt this could potentially bias their decision-making processes such that true importance and relevance would not obtained.
Phase 8: In-person Meeting for Final Question Prioritization and Refinement
Representatives from all 39 participating stakeholder organizations were invited to participate in a 2-day, in-person meeting to create a final prioritized list of questions to be used to guide patient-centered research seeking to improve the care of hospitalized adult patients and their caregivers. This meeting was attended by 43 stakeholders (26 stakeholder organization representatives and 17 steering committee members) from 37 unique stakeholder organizations. To facilitate the inclusiveness and to ensure a consensus-driven process, we used nominal group technique (NGT) to allow all of the meeting participants to discuss the list of prioritized questions in small groups.28 NGT allows participants to comprehend each other’s point of view to ensure no perpsectives are excluded.28 The NGT was followed by two rounds of individual voting. Stakeholders were then asked to frame their discussions and their votes based on the perspectives of their organizations or PFACs that they represent. The voting process required participants to make choices regarding the relative importance of all of the questions, which therefore makes the resulting list a true prioritized list. In the first round of voting, participants voted for up to five questions for inclusion on the prioritized list. Based on the distribution of votes, where one vote equals one point, each of the 36 questions was then ranked in order of the assigned points. The rank-ordering process resulted in a natural cut point or delineated point, resulting in the 11 questions considered to be the highest prioritized questions. Following this, a second round of voting took place with the same parameters as the first round and allowed us to rank order questions by order of importance and priority. Finally, during small and large group discussions, the original text of each question was edited, refined, and reformatted into questions that could drive a research agenda.
Ethical Oversight
This study was reviewed by the Institutional Review Board of the University of Texas Health Science Center at San Antonio and deemed not to be human subject research (UT Health San Antonio IRB Protocol Number: HSC20170058N).
RESULTS
In total, 499 respondents from 39 unique stakeholder organizations responded to our survey. Respondents self-identified into multiple categorizes resulting in 267 healthcare providers, 244 patients and caregivers, and 63 researchers. Characteristics of respondents to the survey are shown in Table 2.
An overview of study results is shown in Table 1. Respondents submitted a total of 782 questions related to improving the care of hospitalized patients. These questions were categorized during thematic analysis into 70 distinct categories—52 that were health system related and 18 that were disease specific (Appendix 2). The most frequently used health system–related categories were related to discharge care transitions, medications, patient understanding, and patient-family-care team communication (Appendix 2).
From these categories, 36 questions met our criteria for “commonly identified,” ie, submitted at least 10 times (Appendix Document 3). Notably, these 36 questions were derived from 67 different coding categories, of which 24 (36%) were a priori (theory-driven) categories23 created by the Steering Committee before analysis began and 43 (64%) categories were created as a result of this study’s stakeholder-engaged process and a data-driven approach23 to analysis (Appendix Document 3). These groups of questions were then presented during the 2-day, in-person meeting and reduced to a final 11 questions that were identified in rank order as top priorities (Table 3). The questions considered highest priority related to ensuring shared treatment and goals of care decision making, improving hospital discharge handoff to other care facilities and providers, and reducing the confusion related to education on medications, conditions, hospital care, and discharge.
DISCUSSION
Using a dynamic and collaborative stakeholder engagement process, we identified 11 questions prioritized in order of importance by patients, caregivers, and other healthcare stakeholders to improve the care of hospitalized adult patients. While some of the topics identified are already well-known topics in need of research and improvement, our findings frame these topics according to the perspectives of patients, caregivers, and stakeholders. This unique perspective adds a level of richness and nuance that provides insight into how to better address these topics and ultimately inform research and quality improvement efforts.
The question considered to be the highest priority area for future research and improvement surmised how it may be possible to implement interventions that engage patients in shared decision making. Shared decision making involves patients and their care team working together to make decisions about treatment, and other aspects of care based on sound clinical evidence that balances the risks and outcomes with patient preferences and values. Although considered critically important,29 a recent evaluation of shared decision making practices in over 250 inpatient encounters identified significant gaps in physicians’ abilities to perform key elements of a shared decision making approach and reinforced the need to identify what strategies can best promote widespread shared decision making.30 While there has been considerable effort to faciliate shared decision making in practice, there remains mixed evidence regarding the sustainability and impact of tools seeking to support shared decision making, such as decision aids, question prompt lists, and coaches.31 This suggests that new approaches to shared decision making may be required and likely explains why this question was rated as a top priority by stakeholders in the current study.
Respondents frequently framed their questions in terms of their lived experiences, providing stories and scenarios to illustrate the importance of the questions they submitted. This personal framing highlighted to us the need to think about improving care delivery from the end-user perspective. For example, respondents framed questions about care transitions not with regard to early appointments, instructions, or medication lists, but rather in terms of whom to call with questions or how best to reach their physician, nurse, or other identified provider. These perspectives suggest that strategies and approaches to improvement that start with patient and caregiver experiences, such as design thinking,32 may be important to continued efforts to improve hospital care. Additionally, the focus on the interpersonal aspects of care delivery highlights the need to focus on the patient-provider relationship and communication.
Questions submitted by respondents demonstrated a stark difference between “patient education” and “patient understanding,” which suggests that being provided with education or education materials regarding care did not necessarily lead to a clear patient understanding. The potential for lack of understanding was particularly prominent in the context of care plan development and during times of care transition—topics that were encompassed in 9 out of 11 of our prioritized research questions. This may suggest that approaches that improve the ability for healthcare providers to deliver information may not be sufficient to meet the needs of patients and caregivers. Rather, partnering to develop a shared understanding—whether about prognosis, medications, hospital, or discharge care plans—is critical. Improved communication practices are not an endpoint for information delivery, but rather a starting point leading to a shared understanding.
Several of the priority areas identified in our study reflect the immensely complex intersections among patients, caregivers, clinicians, and the healthcare delivery system. Addressing these gaps in order to reach the goal of ideal hospital care and an improved patient experience will likely require coordinated approaches and strong involvement and buy-in from multiple stakeholders including the voices of patients and caregivers. Creating patient-centered and stakeholder-driven research has been an increasing priority nationally.33 Yet to realize this, we must continue to understand the foundations and best practices of authentic stakeholder engagement so that it can be achieved in practice.34 We intend for this prioritized list of questions to galvanize funders, researchers, clinicians, professional societies, and patient and caregiver advocacy groups to work together to address these topics through the creation of new research evidence or the sustainable implementation of existing evidence.
Our findings provide a foundation for stakeholder groups to work in partnership to find research and improvement solutions to the problems identified. Our efforts demonstrate the value and importance of a systematic and broad engagement process to ensure that the voices of patients, caregivers, and other healthcare stakeholders are included in guiding hospital research and quality improvement efforts. This is highlighted by the fact our results of prioritized category areas for research were largely only uncovered following the creation of coding categories during the analysis process and were not captured using a priori catgeories that were expected by the steering committee.
The strengths of this study include our attempts to systematically identify and engage a wide range of perspectives in hospital medicine, including perspectives from patients and their caregivers. There are also acknowledged limitations in our study. While we included patients and PFACs from across the country, the opinions of the people we included may not be representative of all patients. Similarly, the perspectives of the other participants may not have completely represented their stakeholder organizations. While we attempted to include a broad range of organizations, there may be other relevant groups who were not represented in our sample.
In summary, our findings provide direction for the multiple stakeholders involved in improving hospital care. The results will allow the research community to focus on questions that are most important to patients, caregivers, and other stakeholders, reframing them in ways that are more relevant to patients’ lived experiences and that reflect the complexity of the issues. Our findings can also be used by healthcare providers and delivery organizations to target local improvement efforts. We hope that patients and caregivers will use our results to advocate for research and improvement in areas that matter the most to them. We hope that policy makers and funding agencies use our results to promote work in these areas and drive a national conversation about how to most effectively improve hospital care.
Acknowledgments
The authors would like to thank all patients, caregivers, and stakeholders who completed the survey. The authors also would like to acknowledge the organizations and individuals who participated in this study (see Appendix Document 4 for full list). At SHM, the authors would like to specifically thank Claudia Stahl, Jenna Goldstein, Kevin Vuernick, Dr Brad Sharpe, and Dr Larry Wellikson for their support.
Disclaimer
The statements presented in this publication are solely the responsibility of the authors and do not necessarily represent the views of the Department of Veterans Affairs, Patient-Centered Outcomes Research Institute (PCORI), its Board of Governors, or Methodology Committee.
1. American Hospital Association. 2019 American Hospital Association Hospital Statistics. Chicago, Illinois: American Hospital Association; 2019.
2. Alper E, O’Malley T, Greenwald J. UptoDate: Hospital discharge and readmission. https://www.uptodate.com/contents/hospital-discharge-and-readmission. Accessed August 8, 2019.
3. de Vries EN, Ramrattan MA, Smorenburg SM, Gouma DJ, Boermeester MA. The incidence and nature of in-hospital adverse events: a systematic review. Qual Saf Heal Care. 2008;17(3):216-223. https://doi.org/10.1136/qshc.2007.023622.
4. Agency for Healthcare Research and Quality. Readmissions and Adverse Events After Discharge. https://psnet.ahrq.gov/primers/primer/11/Readmissions-and-Adverse-Events-After-Discharge. Accessed August 8, 2019.
5. Institute of Medicine (US) Committee on Quality of Health Care in America. Crossing the Quality Chasm: A New Health System for the 21st Century. Washington, DC; National Academies Press; 2001. https://doi.org/10.17226/10027.
6. Trivedi AN, Nsa W, Hausmann LRM, et al. Quality and equity of care in U.S. hospitals. N Engl J Med. 2014;371(24):2298-2308. https://doi.org/10.1056/NEJMsa1405003.
7. National Patient Safety Foundation. Free from Harm: Accelerating Patient Safety Improvement Fifteen Years after To Err Is Human. Boston: National Patient Safety Foundation; 2015.
8. Agency for Healthcare Research and Quality. AHRQ National Scorecard on Hospital-Acquired Conditions Updated Baseline Rates and Preliminary Results 2014–2017. https://www.ahrq.gov/sites/default/files/wysiwyg/professionals/quality-patient-safety/pfp/hacreport-2019.pdf. Accessed August 8, 2019.
9. Hansen LO, Greenwald JL, Budnitz T, et al. Project BOOST: effectiveness of a multihospital effort to reduce rehospitalization. J Hosp Med. 2013;8(8):421-427. https://doi.org/10.1002/jhm.2054.
10. Snyder HJ, Fletcher KE. The hospital experience through the patients’ eyes. J Patient Exp. 2019. https://doi.org/10.1177/2374373519843056.
11. Kebede S, Shihab HM, Berger ZD, Shah NG, Yeh H-C, Brotman DJ. Patients’ understanding of their hospitalizations and association with satisfaction. JAMA Intern Med. 2014;174(10):1698-1700. https://doi.org/10.1001/jamainternmed.2014.3765.
12. Shoeb M, Merel SE, Jackson MB, Anawalt BD. “Can we just stop and talk?” patients value verbal communication about discharge care plans. J Hosp Med. 2012;7(6):504-507. https://doi.org/10.1002/jhm.1937.
13. Neeman N, Quinn K, Shoeb M, Mourad M, Sehgal NL, Sliwka D. Postdischarge focus groups to improve the hospital experience. Am J Med Qual. 2013;28(6):536-538. https://doi.org/10.1177/1062860613488623.
14. Duffett L. Patient engagement: what partnering with patients in research is all about. Thromb Res. 2017;150:113-120. https://doi.org/10.1016/j.thromres.2016.10.029.
15. Pomey M, Hihat H, Khalifa M, Lebel P, Neron A, Dumez V. Patient partnership in quality improvement of healthcare services: patients’ inputs and challenges faced. Patient Exp J. 2015;2:29-42. https://doi.org/10.35680/2372-0247.1064.
16. Robbins M, Tufte J, Hsu C. Learning to “swim” with the experts: experiences of two patient co-investigators for a project funded by the Patient-Centered Outcomes Research Institute. Perm J. 2016;20(2):85-88. https://doi.org/10.7812/TPP/15-162.
17. Tai-Seale M, Sullivan G, Cheney A, Thomas K, Frosch D. The language of engagement: “aha!” moments from engaging patients and community partners in two pilot projects of the Patient-Centered Outcomes Research Institute. Perm J. 2016;20(2):89-92. https://doi.org/10.7812/TPP/15-123.
18. Patient-Centered Outcomes Research Institute (PCORI). PCORI Methodology Standards: Standards for Formulating Research Questions. https://www.pcori.org/research-results/about-our-research/research-methodology/pcori-methodology-standards#Formulating Research Questions. Accessed August 8, 2019.
19. James Lind Alliance. The James Lind Alliance Guidebook. Version 8. Southampton, England: James Lind Alliance; 2018.
20. Society of Hospital Medicine (SHM). Improving Hospital Outcomes through Patient Engagement: The i-HOPE Study. https://www.hospitalmedicine.org/clinical-topics/i-hope-study/. Accessed August 8, 2019.
21. Society of Hospital Medicine (SHM). Committees. https://www.hospitalmedicine.org/membership/committees/. Accessed August 8, 2019.
22. Harris PA, Taylor R, Thielke R, Payne J, Gonzalez N, Conde JG. Research Electronic Data Capture (REDCap) - a metadata-driven methodology and workflow process for providing translational research informatics support. J Biomed Inform. 2009;42(2):377-381. https://doi.org/10.1016/j.jbi.2008.08.010.
23. Schreier M. Qualitative content analysis in practice. Los Angeles, CA: SAGE Publications; 2012.
24. Elo S, Kyngäs H. The qualitative content analysis process. J Adv Nurs. 2008;62(1):107-115. https://doi.org/10.1111/j.1365-2648.2007.04569.x.
25. Nichani S, Crocker J, Fitterman N, Lukela M. Updating the core competencies in hospital medicine—2017 revision: introduction and methodology. J Hosp Med. 2017;12(4):283-287. https://doi.org/10.12788/jhm.2715.
26. Bradley EH, Curry LA, Devers KJ. Qualitative data analysis for health services research: developing taxonomy, themes, and theory. Health Serv Res. 2007;42(4):1758-1772. https://doi.org/10.1111/j.1475-6773.2006.00684.x.
27. Coe K, Scacco JM. Content analysis, quantitative. Int Encycl Commun Res Methods. 2017:1-11. https://doi.org/10.1002/9781118901731.iecrm0045.
28. Centers for Disease Control and Prevention. Evaluation Briefs: Gaining Consensus Among Stakeholders Through the Nominal Group Technique. Atlanta, GA; 2018. https://www.cdc.gov/healthyyouth/evaluation/pdf/brief7.pdf. Accessed August 8, 2019.
29. Charles C, Gafni A, Whelan T. Shared decision-making in the medical encounter: what does it mean? (or it takes at least two to tango). Soc Sci Med. 1997;44(5):681-692. https://doi.org/10.1016/s0277-9536(96)00221-3.
30. Blankenburg R, Hilton JF, Yuan P, et al. Shared decision-making during inpatient rounds: opportunities for improvement in patient engagement and communication. J Hosp Med. 2018;13(7):453-461. https://doi.org/10.12788/jhm.2909.
31. Legare F, Adekpedjou R, Stacey D, et al. Interventions for increasing the use of shared decision making by healthcare professionals. Cochrane Database Syst Rev. 2018;7(7):CD006732. https://doi.org/10.1002/14651858.CD006732.pub4.
32. Roberts JP, Fisher TR, Trowbridge MJ, Bent C. A design thinking framework for healthcare management and innovation. Healthc (Amst). 2016;4(1):11-14. https://doi.org/10.1016/j.hjdsi.2015.12.002.
33. Selby JV, Beal AC, Frank L. The Patient-Centered Outcomes Research Institute (PCORI) national priorities for research and initial research agenda. JAMA. 2012;307(15):1583-1584. https://doi.org/10.1001/jama.2012.500.
34. Harrison J, Auerbach A, Anderson W, et al. Patient stakeholder engagement in research: a narrative review to describe foundational principles and best practice activities. Health Expect. 2019;22(3):307-316. https://doi.org/10.1111/hex.12873.
1. American Hospital Association. 2019 American Hospital Association Hospital Statistics. Chicago, Illinois: American Hospital Association; 2019.
2. Alper E, O’Malley T, Greenwald J. UptoDate: Hospital discharge and readmission. https://www.uptodate.com/contents/hospital-discharge-and-readmission. Accessed August 8, 2019.
3. de Vries EN, Ramrattan MA, Smorenburg SM, Gouma DJ, Boermeester MA. The incidence and nature of in-hospital adverse events: a systematic review. Qual Saf Heal Care. 2008;17(3):216-223. https://doi.org/10.1136/qshc.2007.023622.
4. Agency for Healthcare Research and Quality. Readmissions and Adverse Events After Discharge. https://psnet.ahrq.gov/primers/primer/11/Readmissions-and-Adverse-Events-After-Discharge. Accessed August 8, 2019.
5. Institute of Medicine (US) Committee on Quality of Health Care in America. Crossing the Quality Chasm: A New Health System for the 21st Century. Washington, DC; National Academies Press; 2001. https://doi.org/10.17226/10027.
6. Trivedi AN, Nsa W, Hausmann LRM, et al. Quality and equity of care in U.S. hospitals. N Engl J Med. 2014;371(24):2298-2308. https://doi.org/10.1056/NEJMsa1405003.
7. National Patient Safety Foundation. Free from Harm: Accelerating Patient Safety Improvement Fifteen Years after To Err Is Human. Boston: National Patient Safety Foundation; 2015.
8. Agency for Healthcare Research and Quality. AHRQ National Scorecard on Hospital-Acquired Conditions Updated Baseline Rates and Preliminary Results 2014–2017. https://www.ahrq.gov/sites/default/files/wysiwyg/professionals/quality-patient-safety/pfp/hacreport-2019.pdf. Accessed August 8, 2019.
9. Hansen LO, Greenwald JL, Budnitz T, et al. Project BOOST: effectiveness of a multihospital effort to reduce rehospitalization. J Hosp Med. 2013;8(8):421-427. https://doi.org/10.1002/jhm.2054.
10. Snyder HJ, Fletcher KE. The hospital experience through the patients’ eyes. J Patient Exp. 2019. https://doi.org/10.1177/2374373519843056.
11. Kebede S, Shihab HM, Berger ZD, Shah NG, Yeh H-C, Brotman DJ. Patients’ understanding of their hospitalizations and association with satisfaction. JAMA Intern Med. 2014;174(10):1698-1700. https://doi.org/10.1001/jamainternmed.2014.3765.
12. Shoeb M, Merel SE, Jackson MB, Anawalt BD. “Can we just stop and talk?” patients value verbal communication about discharge care plans. J Hosp Med. 2012;7(6):504-507. https://doi.org/10.1002/jhm.1937.
13. Neeman N, Quinn K, Shoeb M, Mourad M, Sehgal NL, Sliwka D. Postdischarge focus groups to improve the hospital experience. Am J Med Qual. 2013;28(6):536-538. https://doi.org/10.1177/1062860613488623.
14. Duffett L. Patient engagement: what partnering with patients in research is all about. Thromb Res. 2017;150:113-120. https://doi.org/10.1016/j.thromres.2016.10.029.
15. Pomey M, Hihat H, Khalifa M, Lebel P, Neron A, Dumez V. Patient partnership in quality improvement of healthcare services: patients’ inputs and challenges faced. Patient Exp J. 2015;2:29-42. https://doi.org/10.35680/2372-0247.1064.
16. Robbins M, Tufte J, Hsu C. Learning to “swim” with the experts: experiences of two patient co-investigators for a project funded by the Patient-Centered Outcomes Research Institute. Perm J. 2016;20(2):85-88. https://doi.org/10.7812/TPP/15-162.
17. Tai-Seale M, Sullivan G, Cheney A, Thomas K, Frosch D. The language of engagement: “aha!” moments from engaging patients and community partners in two pilot projects of the Patient-Centered Outcomes Research Institute. Perm J. 2016;20(2):89-92. https://doi.org/10.7812/TPP/15-123.
18. Patient-Centered Outcomes Research Institute (PCORI). PCORI Methodology Standards: Standards for Formulating Research Questions. https://www.pcori.org/research-results/about-our-research/research-methodology/pcori-methodology-standards#Formulating Research Questions. Accessed August 8, 2019.
19. James Lind Alliance. The James Lind Alliance Guidebook. Version 8. Southampton, England: James Lind Alliance; 2018.
20. Society of Hospital Medicine (SHM). Improving Hospital Outcomes through Patient Engagement: The i-HOPE Study. https://www.hospitalmedicine.org/clinical-topics/i-hope-study/. Accessed August 8, 2019.
21. Society of Hospital Medicine (SHM). Committees. https://www.hospitalmedicine.org/membership/committees/. Accessed August 8, 2019.
22. Harris PA, Taylor R, Thielke R, Payne J, Gonzalez N, Conde JG. Research Electronic Data Capture (REDCap) - a metadata-driven methodology and workflow process for providing translational research informatics support. J Biomed Inform. 2009;42(2):377-381. https://doi.org/10.1016/j.jbi.2008.08.010.
23. Schreier M. Qualitative content analysis in practice. Los Angeles, CA: SAGE Publications; 2012.
24. Elo S, Kyngäs H. The qualitative content analysis process. J Adv Nurs. 2008;62(1):107-115. https://doi.org/10.1111/j.1365-2648.2007.04569.x.
25. Nichani S, Crocker J, Fitterman N, Lukela M. Updating the core competencies in hospital medicine—2017 revision: introduction and methodology. J Hosp Med. 2017;12(4):283-287. https://doi.org/10.12788/jhm.2715.
26. Bradley EH, Curry LA, Devers KJ. Qualitative data analysis for health services research: developing taxonomy, themes, and theory. Health Serv Res. 2007;42(4):1758-1772. https://doi.org/10.1111/j.1475-6773.2006.00684.x.
27. Coe K, Scacco JM. Content analysis, quantitative. Int Encycl Commun Res Methods. 2017:1-11. https://doi.org/10.1002/9781118901731.iecrm0045.
28. Centers for Disease Control and Prevention. Evaluation Briefs: Gaining Consensus Among Stakeholders Through the Nominal Group Technique. Atlanta, GA; 2018. https://www.cdc.gov/healthyyouth/evaluation/pdf/brief7.pdf. Accessed August 8, 2019.
29. Charles C, Gafni A, Whelan T. Shared decision-making in the medical encounter: what does it mean? (or it takes at least two to tango). Soc Sci Med. 1997;44(5):681-692. https://doi.org/10.1016/s0277-9536(96)00221-3.
30. Blankenburg R, Hilton JF, Yuan P, et al. Shared decision-making during inpatient rounds: opportunities for improvement in patient engagement and communication. J Hosp Med. 2018;13(7):453-461. https://doi.org/10.12788/jhm.2909.
31. Legare F, Adekpedjou R, Stacey D, et al. Interventions for increasing the use of shared decision making by healthcare professionals. Cochrane Database Syst Rev. 2018;7(7):CD006732. https://doi.org/10.1002/14651858.CD006732.pub4.
32. Roberts JP, Fisher TR, Trowbridge MJ, Bent C. A design thinking framework for healthcare management and innovation. Healthc (Amst). 2016;4(1):11-14. https://doi.org/10.1016/j.hjdsi.2015.12.002.
33. Selby JV, Beal AC, Frank L. The Patient-Centered Outcomes Research Institute (PCORI) national priorities for research and initial research agenda. JAMA. 2012;307(15):1583-1584. https://doi.org/10.1001/jama.2012.500.
34. Harrison J, Auerbach A, Anderson W, et al. Patient stakeholder engagement in research: a narrative review to describe foundational principles and best practice activities. Health Expect. 2019;22(3):307-316. https://doi.org/10.1111/hex.12873.
© 2020 Society of Hospital Medicine
A Time Motion Study Evaluating the Impact of Geographic Cohorting of Hospitalists
Geographic cohorting (GCh, also known as “localization” or “regionalization”) refers to the practice wherein hospitalists are assigned to a single inpatient unit. Its adoption is increasing and in 2017, 30% of surveyed United States hospital medicine group leaders reported that their clinicians rounded on 1-2 units daily.1 As a component of intervention bundles, GCh is associated with reductions in mortality, length of stay, and costs.2,3
However, details on how GCh affects the hospitalist workday are unknown. Most time-motion studies of inpatient clinicians have reported the experiences of physicians in training with few specifically evaluating the workflow of attending hospitalists.4 Three studies of the attending hospitalist’s workday that were performed a decade ago excluded teams with learners, had patient loads as low as 9.4 per day, and did not differentiate between GCh and non-GCh models.5-7
The objective of this observational study was to describe and compare the workday of GCh and non-GCh hospitalists by using automated geographical-tracking methods supplemented by in-person observations.
METHODS
Setting and Participants
This work was conducted at a large academic center in the Midwestern US which adopted GCh in 2012. During the study, hospitalists staffed 11 GCh and four non-GCh teams. GCh teams aim to maintain ≥80% of their patients on their assigned unit and conduct interprofessional huddles on weekdays.3 Some units specialize in the care of specific populations (eg, patients with oncologic diagnoses), while others serve as general medical or surgical units. Non-GCh teams are assigned patients without regard to location. Resident housestaff are assigned only to GCh teams and residents and advanced practice providers (APPs) are never assigned to the same team. Based on team members, this yielded five distinct team types: GCh-hospitalist, GCh-hospitalist with APP, GCh-hospitalist with resident, non-GCh-hospitalist, and non-GCh-hospitalist with APP. Hospitalists provided verbal consent to participate. The protocol was reviewed and approved by the Indiana University Institutional Review Board. Two complementary observation modalities were used. Locator badges were used to quantify direct and indirect time unobtrusively over long periods. In-person observations were conducted to examine the workday in greater detail. Data were collected between October 2017 and May 2018.
Observations by Locator Badges
Our institution uses a system designed by Hill-Rom® (Cary, North Carolina) to facilitate staff communication. Staff wear the I-Badge® Locator Badge, which emits an infra-red signal.8 Centrally located receivers tabulate time spent by the badge wearer in each location (Appendix Figure 1). Each hospitalist was given a badge to wear at work for a minimum of six weeks, after which the I-Badge® data were downloaded.
Schedules detailing each team’s members and assigned units (if cohorted) were retrieved. For each observed day, the hospitalist was linked to his or her team type and unit. Team lists were retrieved to ascertain patient load at the start of the day. Data sources were merged to categorize observations.
Observation Categories for Locator Badge Data
The I-Badge® data provided details of how much time the hospitalist spent in each location (eg, nursing station, hallways, patient rooms). All observations in patient rooms were considered “direct care” while all other locations were categorized as “Indirect Care”. Observations were also categorized by the intensity of care provided on that unit, which included the Emergency Department (ED), Progressive Care Units (PCU), Medical-Surgical + PCU units (for units having a mixture of Medical-Surgical and PCU beds), and Medical-Surgical units.
In-person Observations
Four research assistants (RAs) were trained until interrater reliability using task times achieved an intraclass correlation coefficient of 0.98. Task categories included direct care (all time with patients), indirect care (computer interactions, communication), professional development, and travel and personal time. Interruptions were defined as “an unplanned and unscheduled task, causing a discontinuation, a noticeable break, or task switch behavior”.9 “Electronic interruptions” were caused by pagers or phones whereas in-person interruptions were “face-to-face” interruptions. When at least two tasks were performed simultaneously, it was considered multitasking. A data collection form created in REDCap was accessed on computer tablets or smartphones10 (Appendix Table 1). To limit each observation period to five hours, two RAs were scheduled each day. Observations were continued until the hospitalist reported that work activities were complete or until 5
Statistical Analysis
Due to the nested structure of the locator badge data, multilevel mode
Univariate three-level models predicting minutes spent in direct care were tested for each predictor. Predictors, described below, were selected due to their hypothesized relation to time spent in direct patient care, or to account statistically for differences among teams due to the observational nature of the study.12 Predictors were: Level 3, hospitalist characteristics (years since medical school, age, gender, international graduate, years at current hospital); Level 2, work day characteristics (number of units visited, number of patients visited, team type, weekday); and Level 1, individual observation characteristics (intensity of care on unit, number of visits to the same patient room per day
For total daily indirect care, a similar modeling process was used. A log normal distribution was used because the data was right-skewed and contained positive values. The restricted maximum likelihood method was used to calculate final estimates for models. Least square mean values for independent variables were subjected to backward transformation for interpretation. Post hoc pairwise comparisons between team types were conducted using Tukey–Kramer tests for direct and indirect care time. Analyses were conducted using SAS software version 9.4 (Cary, North Carolina).
The in-person observations were summarized using descriptive statistics. Exploratory analyses were performed using t-tests and Fisher’s exact tests to compare continuous and categorical variables respectively.
RESULTS
Locator Badge Observations
Participants
The 17 hospitalists had a mean (SD) age of 38 years (6.4); 10 (59%) were male, 7 (41%) were international medical graduates, and 10 (59%) had worked at the hospital ≥5 years. The duration of observation was <45 days for 7 hospitalists, 46-55 days for 4, and >55 days for 6, yielding observations for 666 hospitalist workdays. The mean time since medical school graduation was 13 years. Seven hospitalists were observed only in the GCh model, one was observed only in the non-GCh model, and nine were observed in both.
Team Characteristics
On average, non-GCh teams visited more units per day than GCh teams. Teams with APPs had higher patient loads (Table 1).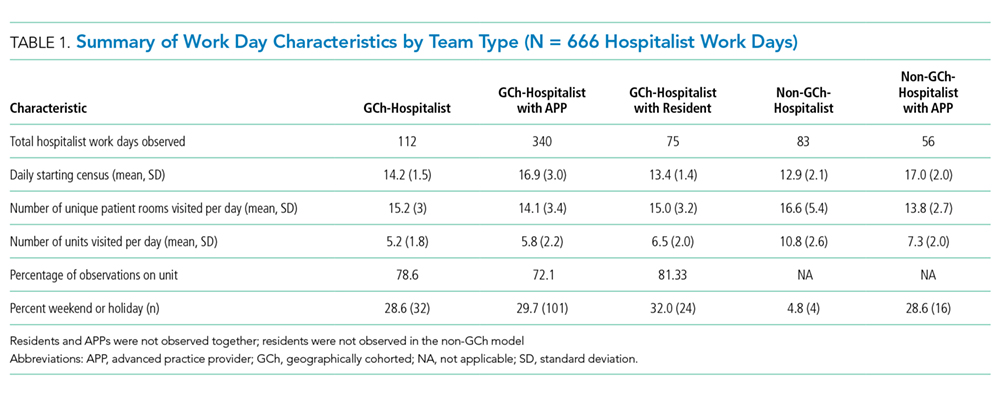
Time Observed in Direct and Indirect Care
In total, 10,522 observations were recorded in providing direct care. The average duration of a direct care encounter ranged from 4.1 to 5.8 minutes. The ratio of indirect to direct time ranged from 2.7 to 3.7 (Table 2).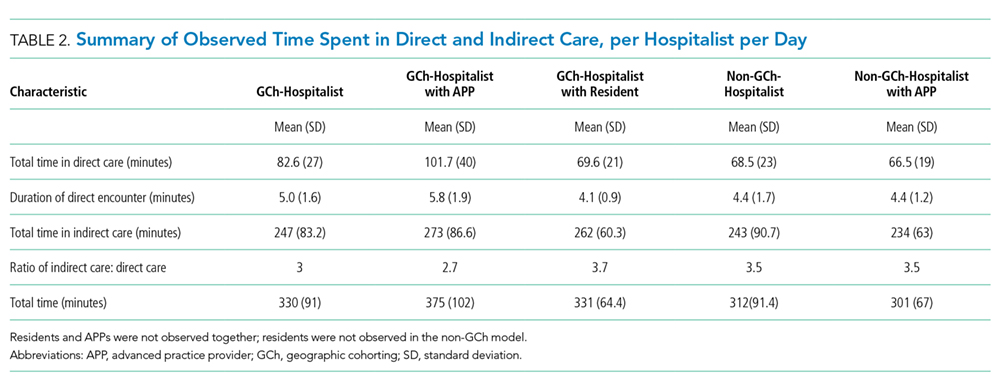
The number of times that a hospitalist visited the same patient room in one day ranged from 1 to 9. Most (84%) of the patient rooms were visited once per day. The odds that a GCh hospitalist would visit a patient more than once per day were 1.8 times higher (95% CI: 1.37, 2.34; P < .0001) than for a non-GCh hospitalist (data not shown).
Predictors Associated with Time Expenditure
Predictors significantly associated with both the duration of direct care encounters and total daily indirect care time included team type and patient count. Predicted time in direct care encounters was highest for the GCh-hospitalist team (9.5 minutes) and lowest for the GCh-hospitalist with residents team (7 minutes). Predicted total indirect care time was highest for the GCh-hospitalist with APP team (160 minutes) while the lowest expenditure in indirect care time was predicted for the non-GCh-hospitalist team (102 minutes). Increasing patient load from 10 to 20 was predicted to decrease the duration of a direct care encounter by one minute (14%) and increase the total indirect care time by a larger amount (39 min, 24%).
The duration of direct care encounters was also inversely related with years since medical school and number of visits made to same patient room. Finally, acuity of care was associated with the duration of direct care encounters with the longest predicted encounters in the ED (9.4 minutes). Physician gender and age, international graduation, years at current hospital, weekday, and the number of units visited in a day were neither associated with direct care time at P value < .05 nor improved model fit and therefore were not retained in the final model (Table 3).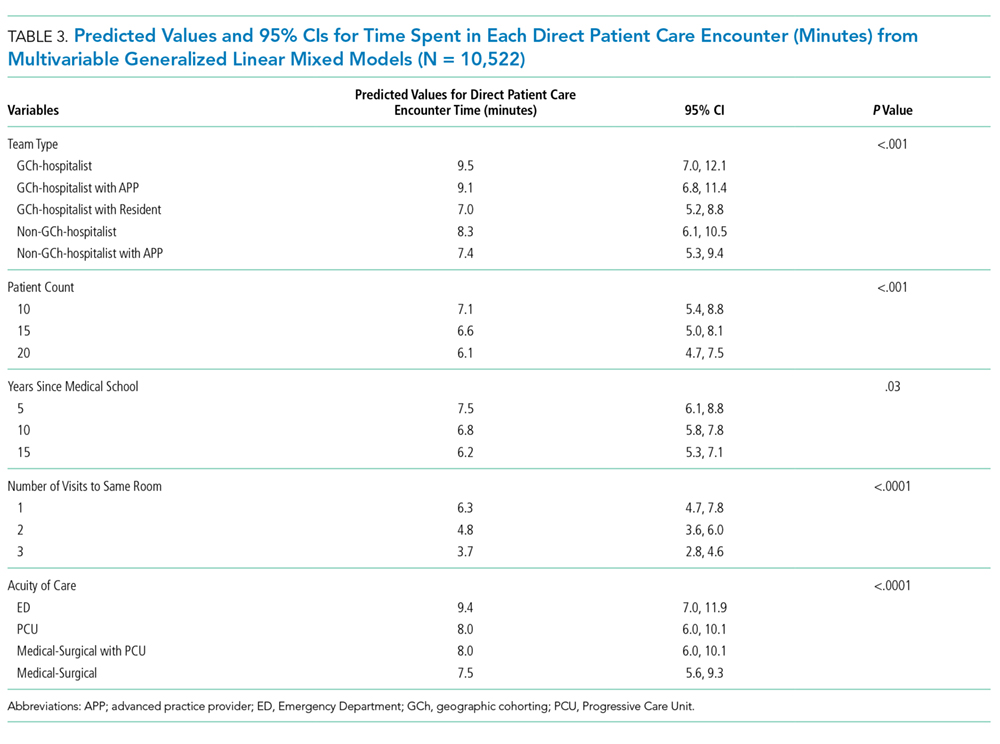
Additional predictors associated with total daily indirect care time included the number of units visited and working on a weekend or holiday. Total time spent in indirect care was predicted to increase as the number of units increased and decrease on weekends or holidays. Hospitalist characteristics were not associated with time in indirect care (Table 4).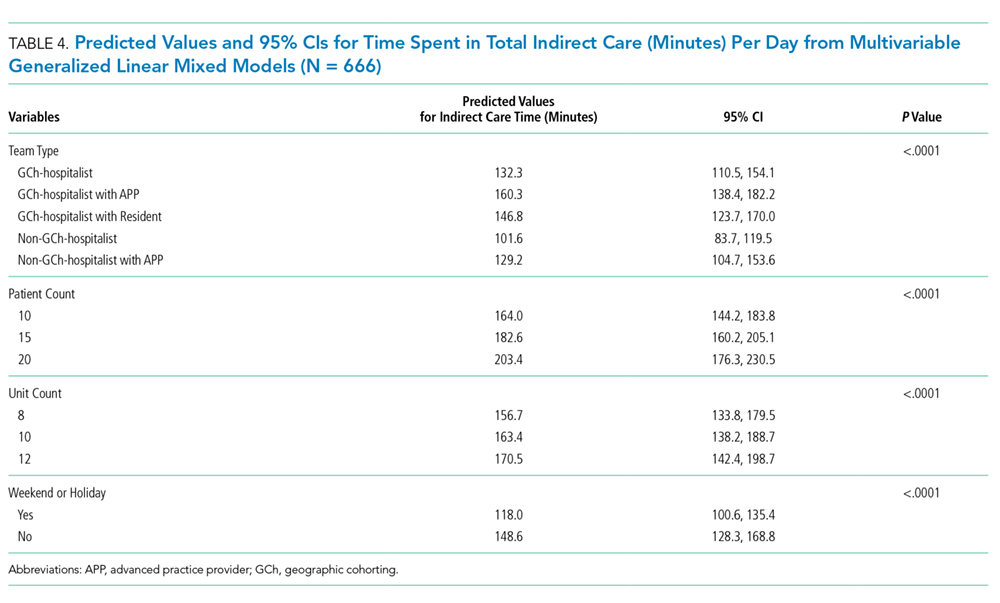
In-person Observations
Four hospitalists cohorted to general medical units and four non-GCh hospitalists were observed for one day each, yielding a total of 3,032 minutes of data. These hospitalists were on teams without residents or APPs. On average, GCh hospitalists had 78% of their patients on their assigned unit, rounded on fewer units (3 vs 6) and had two more patients at the start of the day than non-GCh hospitalists (14 vs 12). Age and gender distribution of the GCh and non-GCh hospitalists were similar.
As a percentage of total observed time, GCh hospitalists were noted to spend a larger proportion of the workday in computer interactions vs non-GCh hospitalists (56% vs 39%; P = .005). The proportion of time in other activities or locations was not statistically different between GCh and non-GCh hospitalists, including face-to-face communication (21% vs 15%), multitasking (18% vs 14%), time spent at the nursing station (58% vs 34%), direct care (15% vs 20%), and time traveling (4% vs 11%). The most frequently observed combination of multitasking was computer and phone use (59% of all multitasking) followed by computer use and face-to-face communication (17%; Appendix Figure 2).
The mean duration of an interruption was 1.3 minutes. More interruptions were observed in the GCh group than the non-GCh group (139 vs 102). Interruptions in the GCh group were face-to-face in 62% of instances and electronic in 25%. The remaining 13% were instances in which electronic and face-to-face interruptions occurred simultaneously. In the non-GCh group, 51% of interruptions were face-to-face; 47% were electronic; and 2% were simultaneous. GCh hospitalists were interrupted once every 14 minutes in the morning, with interruption frequency increasing to once every eight minutes in the afternoon. Non-GCh hospitalists were interrupted once every 13 minutes in the morning and saw interruption frequency decrease to once every 17 minutes in the afternoon. The task most frequently interrupted was computer use.
DISCUSSION
Previous investigations have studied the impact of cohorting on outcomes, including the facilitation of bedside rounding, adverse events, agreement between nurses and physicians on the plan of care, productivity, and the number of pages received.13-16 Cohorting’s benefits are theorized to include increased hospitalist time with patients, while its downsides are perceived to include increased interruptions.17,18 Neither has previously been evaluated by direct observation.
Our findings support cohorting’s association with increased hospitalist–patient time. While GCh hospitalists were observed spending 5% less time in direct care than non-GCh hospitalists by in-person observations, this difference did not achieve statistical significance and was unadjusted for hospitalist, patient load, team or patient characteristics. Using the larger badge dataset, the predicted values for time spent in direct care encounters were higher in cohorted teams. Pairwise comparisons consistently trended toward longer durations in cohorted vs noncohorted teams. The notable exception was in cohorted teams with residents, which had the shortest predicted patient visits; however, we did not have noncohorted teams with residents in our study, limiting interpretation. Additionally, the odds of repeat visits to a patient in a single day were almost twice as high in the cohorted vs noncohorted group. The magnitude of this gain, however, is estimated to be a modest 1.2 minutes for a hospitalist only team and 1.7 minutes for a hospitalist with APP team and may be insufficient to provide compassionate, patient-centered care.19
Furthermore, these gains may be eroded if patient loads are high: similar to a previous study, we found that the duration of each patient visit decreased by 14% when the load increased from 10 to 20 patients.6 The expected gains in efficiency from cohorting leads to an expectation that hospitalists can manage more patients, but such reflexive increases should be carefully considered.18
Similar to earlier investigations where hospitalists were found to spend 60 to 69% of the day in indirect care activities,5,6 hospitalists in both cohorted and noncohorted models spent approximately three times more time in indirect than direct care. Cohorting was associated with increased indirect care time. This association was expected as interdisciplinary huddles and increased nursing and physician communication are both related to cohorting.3,14 However, similar to previous reports, in-person observations revealed that the bulk of this indirect time was spent in computer interactions, rather than in interprofessional communication. Interactions with the electronic health record (EHR) consume between one-third to one-half of the day in inpatient settings.20,21 While EHRs are intended to enhance safety, they also fulfill multiple, nonclinical purposes and increase time spent on documentation.22,23 Nonclinical tasks may contribute to clinician burnout and detract from patient centeredness.22 Our findings suggest that cohorting may not offset the burden of these time-intensive EHR tasks. The larger expenditure of time spent in computer interactions observed in the GCh group may be partially explained both by the higher number of patients and the higher frequency of interruptions observed in this group; computer use was the task most frequently observed to be interrupted. While longer tasks are more likely to be interrupted, the interruption in turn further increases the time taken to complete the task.24
The interruption rates we observed are concerning. The hospitalist workday emerges as cognitively intense. GCh hospitalists were noted to be interrupted as frequently as once every eight minutes, a rate more than double that of an earlier investigation and approaching that of ED physicians.5,25,26 Interruptions and multitasking contribute to errors and a perception of increased workload and frustration for clinicians.9,27-29 Although interruptions were pervasive, GCh hospitalists were interrupted more frequently, corroborating a national survey in which hospitalists perceived that cohorting increased face-to-face interruptions.30 The prolonged availability of the cohorted hospitalist on the unit may require different strategies for promoting timely interactions while preserving uninterrupted work time. Our work, however, does not allow us to quantify appropriate and urgent interruptions that reflect improved teamwork and patient safety. Interruptions increase as patient loads increase.25 The contribution to interruptions by the higher patient census on the GCh teams cannot be quantified in this work, but without attention to these details, potential benefits from GCh may be attenuated.
Previous work has delineated variables important in determining hospitalist workload,31 and our work contributes additional considerations. Hospitalist experience and resident presence on cohorted teams was associated with shorter patient visits, while ED encounters were predicted to be the most time intensive. Increasing numbers of units visited in a day was associated with more indirect time, while weekends were associated with a lower burden of indirect care. As expected, APP presence was associated with more time in indirect care as the hospitalist spends time in providing oversight. As noted, cohorting was associated with increases in both direct and indirect care time. These findings may help inform hospital medicine groups. Additionally, attention should be paid to the fact that while support for cohorting stems from investigations in which it was used as part of a bundle of interventions,2,3 in practice, it is often implemented incompletely, with cohorted hospitalists dispersed over several units, or in isolation from other interventions.1
Our work has several limitations. As a single-center investigation, our findings may not be generalizable to other institutions. Second, we did not evaluate clinical outcomes, clinician, patient or nursing satisfaction to assess the effect of cohorting. Third, we cannot comment on whether the observed interruptions were beneficial or detrimental. Finally, while we used statistical control for the measured imbalanced variables between groups, unmeasured confounding factors between team types including differences in patient populations, pathologies and severity of illness, or the unit’s work environment and processes may have affected results.
Our work underscores the importance of paying careful attention to specific components and monitoring for unintended consequences in a complex intervention such as cohorting to allow subsequent refinement. Further studies to assess the interplay between models of care, their impact on interruptions, multitasking, errors and clinician burnout may be necessary. Such investigations will be critical to support the evolution of hospital medicine that enables it to be the driver of excellence in care.
Acknowledgments
The authors thank the participating hospitalists, research assistants, Shelly Harrison, Joni Godfrey, Mark Luetkemeyer, Deanne Kashiwagi, Tammy Kemlage, Dustin Hertel and Adeel Zaidi for their enthusiasm and support. The authors also thank Ann Cottingham, Rich Frankel and Greg Sachs from the ASPIRE program for their guidance and vision. Dr. Weiner is Chief of Health Services Research and Development at the Richard L. Roudebush Veterans Affairs Medical Center in Indianapolis, Indiana.
Disclaimer
The views expressed in this article are those of the authors and do not necessarily represent the views of the U.S. Department of Veterans Affairs.
1. O’Leary KJ, Johnson JK, Manojlovich M, Astik GJ, Williams MV. Use of unit-based interventions to improve the quality of care for hospitalized medical patients: a national survey. Jt Comm J Qual Patient Saf. 2017;43(11):573-579. https://doi.org/10.1016/j.jcjq.2017.05.008
2. Stein J, Payne C, Methvin A, et al. Reorganizing a hospital ward as an accountable care unit. J Hosp Med. 2015;10(1):36-40. https://doi.org/10.1002/jhm.2284.
3. Kara A, Johnson CS, Nicley A, Niemeier MR, Hui SL. Redesigning inpatient care: testing the effectiveness of an accountable care team model. J Hosp Med. 2015;10(12):773-779. https://doi.org/10.1002/jhm.2432.
4. Tipping MD, Forth VE, Magill DB, Englert K, Williams MV. Systematic review of time studies evaluating physicians in the hospital setting. J Hosp Med. 2010;5(6):353-359. https://doi.org/10.1002/jhm.647.
5. O’Leary KJ, Liebovitz DM, Baker DW. How hospitalists spend their time: Insights on efficiency and safety. J Hosp Med. 2006;1(2):88-93. https://doi.org/10.1002/jhm.88.
6. Tipping MD, Forth VE, O’Leary KJ, et al. Where did the day go? A time-motion study of hospitalists. J Hosp Med. 2010;5(6):323-328. https://doi.org/10.1002/jhm.790.
7. Rothberg MB, Steele JR, Wheeler J, Arora A, Priya A, Lindenauer PK. The relationship between time spent communicating and communication outcomes on a hospital medicine service. J Gen Intern Med. 2012;27(2):185-189. https://doi.org/10.1007/s11606-011-1857-8.
8. Hill-rom.com. (2019). Staff Locating | hill-rom.com. [online] Available at: https://www.hill-rom.com/ca/Products/Products-by-Category/Clinical-Workflow-Solutions/Hill-Rom-Staff-Locating/. Accessed July 7, 2019.
9. Weigl M, Müller A, Vincent C, Angerer P, Sevdalis N. The association of workflow interruptions and hospital doctors’ workload: a prospective observational study. BMJ Qual Saf. 2012;21(5):399-407. https://doi.org/10.1136/bmjqs-2011-000188.
10. Harris PA, Taylor R, Thielke R, Payne J, Gonzalez N, Conde JG. Research electronic data capture (REDCap)—A metadata-driven methodology and workflow process for providing translational research informatics support. J Biomed Inform. 2009;42(2):377-381. https://doi.org/10.1016/j.jbi.2008.08.010.
11. Snijders T, Bosker R. Multilevel Analysis. 2nd ed. London: Sage Publications; 2012.
12. Pourhoseingholi M, Baghestani A, Vahedi M. How to control confounding effects by statistical analysis. Gastroenterol Hepatol Bed Bench. 2012;5(2):79-83.
13. Huang KT, Minahan J, Brita-Rossi P, et al. All together now: impact of a regionalization and bedside rounding initiative on the efficiency and inclusiveness of clinical rounds. J Hosp Med. 2017;12(3):150-156. https://doi.org/10.12788/jhm.2696.
14. Mueller SK, Schnipper JL, Giannelli K, Roy CL, Boxer R. Impact of regionalized care on concordance of plan and preventable adverse events on general medicine services. J Hosp Med. 2016;11(9):620-627. https://doi.org/10.1002/jhm.2566.
15. O’Leary KJ, Wayne DB, Landler MP, et al. Impact of localizing physicians to hospital units on nurse—physician communication and agreement on the plan of care. J Gen Intern Med. 2009;24(11):1223-1227. https://doi.org/10.1007/s11606-009-1113-7.
16. Singh S, Tarima S, Rana V, et al. Impact of localizing general medical teams to a single nursing unit. J Hosp Med. 2012;7(7):551-556. https://doi.org/10.1002/jhm.1948.
17. Singh S, Fletcher KE. A qualitative evaluation of geographical localization of hospitalists: how unintended consequences may impact quality. J Gen Intern Med. 2014;29(7):1009-1016. https://doi.org/10.1007/s11606-014-2780-6.
18. Kara A, Johnson CS, Hui SL, Kashiwagi D. Hospital-based clinicians’ perceptions of geographic cohorting: identifying opportunities for improvement. Am J Med Qual. 2018;33(3):303-312. https://doi.org/10.1177/1062860617745123.
19. Lown BA. Seven guiding commitments: making the U.S. healthcare system more compassionate. J Patient Exp. 2014;1(2):6-15. https://doi.org/10.1177/237437431400100203.
20. Wenger N, Méan M, Castioni J, Marques-Vidal P, Waeber G, Garnier A. Allocation of internal medicine resident time in a swiss hospital: a time and motion study of day and evening shifts. Ann Intern Med. 2017;166(8):579-586. https://doi.org/10.7326/m16-2238.
21. Chen L, Guo U, Illipparambil LC, et al. Racing against the clock: internal medicine residents’ time spent on electronic health records. J Graduate Med Educ. 2015;8(1):39-44. https://doi.org/10.4300/jgme-d-15-00240.1.
22. Erickson SM, Rockwern B, Koltov M, McLean R. Putting patients first by reducing administrative tasks in health care: a position paper of the American College of Physicians. Ann Intern Med. 2017;166:659-661. https://doi.org/10.7326/m16-2697.
23. Poissant L, Pereira J, Tamblyn R, Kawasumi Y. The impact of electronic health records on time efficiency of physicians and nurses: a systematic review. J Am Med Inform Assn. 2005;12(5):505-516. https://doi.org/10.1197/jamia.m1700.
24. Coiera E. The science of interruption. Bmj Qual Saf. 2017;21(5):357-360. https://doi.org/10.1136/bmjqs-2012-00078.
25. Chisholm C, Collison E, Nelson D, Cordell W. Emergency department workplace interruptions: are emergency physicians “interrupt-driven” and “multitasking”? Academic Emerg Med. 2000;7(11):1239-1243. https://doi.org/10.1111/j.1553-2712.2000.tb00469.x.
26. Westbrook JI, Ampt A, Kearney L, Rob MI. All in a day’s work: an observational study to quantify how and with whom doctors on hospital wards spend their time. Med J Aust. 2008;188(9):506-509. https://doi.org/10.5694/j.1326-5377.2008.tb01762.x.
27. Westbrook JI, Woods A, Rob MI, Dunsmuir WT, Day RO. Association of interruptions with an increased risk and severity of medication administration errors. Arch Intern Med. 2010;170(8):683-690. https://doi.org/10.1001/archinternmed.2010.65.
28. Weigl M, Müller A, Angerer P, Hoffmann F. Workflow interruptions and mental workload in hospital pediatricians: an observational study. BMC Health Serv Res. 2014;14(1):433. https://doi.org/10.1186/1472-6963-14-433.
29. Shojania KG, Wald H, Gross R. Understanding medical error and improving patient safety in the inpatient setting. Med Clin N Am. 2002;86(4):847-867. https://doi.org/10.1016/s0025-7125(02)00016-0.
30. Kara A, Johnson CS, Hui SL, Kashiwagi D. Hospital-based clinicians’ perceptions of geographic cohorting: identifying opportunities for improvement. J Med Internet Res. 2017;6(3):106286061774512. https://doi.org/10.2196/jmir.6.3.e34.
31. Michtalik HJ, Pronovost PJ, Marsteller JA, Spetz J, Brotman DJ. Developing a model for attending physician workload and outcomes. Jama Intern Med. 2013;173(11):1026-1028. https://doi.org/10.1001/jamainternmed.2013.405.
Geographic cohorting (GCh, also known as “localization” or “regionalization”) refers to the practice wherein hospitalists are assigned to a single inpatient unit. Its adoption is increasing and in 2017, 30% of surveyed United States hospital medicine group leaders reported that their clinicians rounded on 1-2 units daily.1 As a component of intervention bundles, GCh is associated with reductions in mortality, length of stay, and costs.2,3
However, details on how GCh affects the hospitalist workday are unknown. Most time-motion studies of inpatient clinicians have reported the experiences of physicians in training with few specifically evaluating the workflow of attending hospitalists.4 Three studies of the attending hospitalist’s workday that were performed a decade ago excluded teams with learners, had patient loads as low as 9.4 per day, and did not differentiate between GCh and non-GCh models.5-7
The objective of this observational study was to describe and compare the workday of GCh and non-GCh hospitalists by using automated geographical-tracking methods supplemented by in-person observations.
METHODS
Setting and Participants
This work was conducted at a large academic center in the Midwestern US which adopted GCh in 2012. During the study, hospitalists staffed 11 GCh and four non-GCh teams. GCh teams aim to maintain ≥80% of their patients on their assigned unit and conduct interprofessional huddles on weekdays.3 Some units specialize in the care of specific populations (eg, patients with oncologic diagnoses), while others serve as general medical or surgical units. Non-GCh teams are assigned patients without regard to location. Resident housestaff are assigned only to GCh teams and residents and advanced practice providers (APPs) are never assigned to the same team. Based on team members, this yielded five distinct team types: GCh-hospitalist, GCh-hospitalist with APP, GCh-hospitalist with resident, non-GCh-hospitalist, and non-GCh-hospitalist with APP. Hospitalists provided verbal consent to participate. The protocol was reviewed and approved by the Indiana University Institutional Review Board. Two complementary observation modalities were used. Locator badges were used to quantify direct and indirect time unobtrusively over long periods. In-person observations were conducted to examine the workday in greater detail. Data were collected between October 2017 and May 2018.
Observations by Locator Badges
Our institution uses a system designed by Hill-Rom® (Cary, North Carolina) to facilitate staff communication. Staff wear the I-Badge® Locator Badge, which emits an infra-red signal.8 Centrally located receivers tabulate time spent by the badge wearer in each location (Appendix Figure 1). Each hospitalist was given a badge to wear at work for a minimum of six weeks, after which the I-Badge® data were downloaded.
Schedules detailing each team’s members and assigned units (if cohorted) were retrieved. For each observed day, the hospitalist was linked to his or her team type and unit. Team lists were retrieved to ascertain patient load at the start of the day. Data sources were merged to categorize observations.
Observation Categories for Locator Badge Data
The I-Badge® data provided details of how much time the hospitalist spent in each location (eg, nursing station, hallways, patient rooms). All observations in patient rooms were considered “direct care” while all other locations were categorized as “Indirect Care”. Observations were also categorized by the intensity of care provided on that unit, which included the Emergency Department (ED), Progressive Care Units (PCU), Medical-Surgical + PCU units (for units having a mixture of Medical-Surgical and PCU beds), and Medical-Surgical units.
In-person Observations
Four research assistants (RAs) were trained until interrater reliability using task times achieved an intraclass correlation coefficient of 0.98. Task categories included direct care (all time with patients), indirect care (computer interactions, communication), professional development, and travel and personal time. Interruptions were defined as “an unplanned and unscheduled task, causing a discontinuation, a noticeable break, or task switch behavior”.9 “Electronic interruptions” were caused by pagers or phones whereas in-person interruptions were “face-to-face” interruptions. When at least two tasks were performed simultaneously, it was considered multitasking. A data collection form created in REDCap was accessed on computer tablets or smartphones10 (Appendix Table 1). To limit each observation period to five hours, two RAs were scheduled each day. Observations were continued until the hospitalist reported that work activities were complete or until 5
Statistical Analysis
Due to the nested structure of the locator badge data, multilevel mode
Univariate three-level models predicting minutes spent in direct care were tested for each predictor. Predictors, described below, were selected due to their hypothesized relation to time spent in direct patient care, or to account statistically for differences among teams due to the observational nature of the study.12 Predictors were: Level 3, hospitalist characteristics (years since medical school, age, gender, international graduate, years at current hospital); Level 2, work day characteristics (number of units visited, number of patients visited, team type, weekday); and Level 1, individual observation characteristics (intensity of care on unit, number of visits to the same patient room per day
For total daily indirect care, a similar modeling process was used. A log normal distribution was used because the data was right-skewed and contained positive values. The restricted maximum likelihood method was used to calculate final estimates for models. Least square mean values for independent variables were subjected to backward transformation for interpretation. Post hoc pairwise comparisons between team types were conducted using Tukey–Kramer tests for direct and indirect care time. Analyses were conducted using SAS software version 9.4 (Cary, North Carolina).
The in-person observations were summarized using descriptive statistics. Exploratory analyses were performed using t-tests and Fisher’s exact tests to compare continuous and categorical variables respectively.
RESULTS
Locator Badge Observations
Participants
The 17 hospitalists had a mean (SD) age of 38 years (6.4); 10 (59%) were male, 7 (41%) were international medical graduates, and 10 (59%) had worked at the hospital ≥5 years. The duration of observation was <45 days for 7 hospitalists, 46-55 days for 4, and >55 days for 6, yielding observations for 666 hospitalist workdays. The mean time since medical school graduation was 13 years. Seven hospitalists were observed only in the GCh model, one was observed only in the non-GCh model, and nine were observed in both.
Team Characteristics
On average, non-GCh teams visited more units per day than GCh teams. Teams with APPs had higher patient loads (Table 1).
Time Observed in Direct and Indirect Care
In total, 10,522 observations were recorded in providing direct care. The average duration of a direct care encounter ranged from 4.1 to 5.8 minutes. The ratio of indirect to direct time ranged from 2.7 to 3.7 (Table 2).
The number of times that a hospitalist visited the same patient room in one day ranged from 1 to 9. Most (84%) of the patient rooms were visited once per day. The odds that a GCh hospitalist would visit a patient more than once per day were 1.8 times higher (95% CI: 1.37, 2.34; P < .0001) than for a non-GCh hospitalist (data not shown).
Predictors Associated with Time Expenditure
Predictors significantly associated with both the duration of direct care encounters and total daily indirect care time included team type and patient count. Predicted time in direct care encounters was highest for the GCh-hospitalist team (9.5 minutes) and lowest for the GCh-hospitalist with residents team (7 minutes). Predicted total indirect care time was highest for the GCh-hospitalist with APP team (160 minutes) while the lowest expenditure in indirect care time was predicted for the non-GCh-hospitalist team (102 minutes). Increasing patient load from 10 to 20 was predicted to decrease the duration of a direct care encounter by one minute (14%) and increase the total indirect care time by a larger amount (39 min, 24%).
The duration of direct care encounters was also inversely related with years since medical school and number of visits made to same patient room. Finally, acuity of care was associated with the duration of direct care encounters with the longest predicted encounters in the ED (9.4 minutes). Physician gender and age, international graduation, years at current hospital, weekday, and the number of units visited in a day were neither associated with direct care time at P value < .05 nor improved model fit and therefore were not retained in the final model (Table 3).
Additional predictors associated with total daily indirect care time included the number of units visited and working on a weekend or holiday. Total time spent in indirect care was predicted to increase as the number of units increased and decrease on weekends or holidays. Hospitalist characteristics were not associated with time in indirect care (Table 4).
In-person Observations
Four hospitalists cohorted to general medical units and four non-GCh hospitalists were observed for one day each, yielding a total of 3,032 minutes of data. These hospitalists were on teams without residents or APPs. On average, GCh hospitalists had 78% of their patients on their assigned unit, rounded on fewer units (3 vs 6) and had two more patients at the start of the day than non-GCh hospitalists (14 vs 12). Age and gender distribution of the GCh and non-GCh hospitalists were similar.
As a percentage of total observed time, GCh hospitalists were noted to spend a larger proportion of the workday in computer interactions vs non-GCh hospitalists (56% vs 39%; P = .005). The proportion of time in other activities or locations was not statistically different between GCh and non-GCh hospitalists, including face-to-face communication (21% vs 15%), multitasking (18% vs 14%), time spent at the nursing station (58% vs 34%), direct care (15% vs 20%), and time traveling (4% vs 11%). The most frequently observed combination of multitasking was computer and phone use (59% of all multitasking) followed by computer use and face-to-face communication (17%; Appendix Figure 2).
The mean duration of an interruption was 1.3 minutes. More interruptions were observed in the GCh group than the non-GCh group (139 vs 102). Interruptions in the GCh group were face-to-face in 62% of instances and electronic in 25%. The remaining 13% were instances in which electronic and face-to-face interruptions occurred simultaneously. In the non-GCh group, 51% of interruptions were face-to-face; 47% were electronic; and 2% were simultaneous. GCh hospitalists were interrupted once every 14 minutes in the morning, with interruption frequency increasing to once every eight minutes in the afternoon. Non-GCh hospitalists were interrupted once every 13 minutes in the morning and saw interruption frequency decrease to once every 17 minutes in the afternoon. The task most frequently interrupted was computer use.
DISCUSSION
Previous investigations have studied the impact of cohorting on outcomes, including the facilitation of bedside rounding, adverse events, agreement between nurses and physicians on the plan of care, productivity, and the number of pages received.13-16 Cohorting’s benefits are theorized to include increased hospitalist time with patients, while its downsides are perceived to include increased interruptions.17,18 Neither has previously been evaluated by direct observation.
Our findings support cohorting’s association with increased hospitalist–patient time. While GCh hospitalists were observed spending 5% less time in direct care than non-GCh hospitalists by in-person observations, this difference did not achieve statistical significance and was unadjusted for hospitalist, patient load, team or patient characteristics. Using the larger badge dataset, the predicted values for time spent in direct care encounters were higher in cohorted teams. Pairwise comparisons consistently trended toward longer durations in cohorted vs noncohorted teams. The notable exception was in cohorted teams with residents, which had the shortest predicted patient visits; however, we did not have noncohorted teams with residents in our study, limiting interpretation. Additionally, the odds of repeat visits to a patient in a single day were almost twice as high in the cohorted vs noncohorted group. The magnitude of this gain, however, is estimated to be a modest 1.2 minutes for a hospitalist only team and 1.7 minutes for a hospitalist with APP team and may be insufficient to provide compassionate, patient-centered care.19
Furthermore, these gains may be eroded if patient loads are high: similar to a previous study, we found that the duration of each patient visit decreased by 14% when the load increased from 10 to 20 patients.6 The expected gains in efficiency from cohorting leads to an expectation that hospitalists can manage more patients, but such reflexive increases should be carefully considered.18
Similar to earlier investigations where hospitalists were found to spend 60 to 69% of the day in indirect care activities,5,6 hospitalists in both cohorted and noncohorted models spent approximately three times more time in indirect than direct care. Cohorting was associated with increased indirect care time. This association was expected as interdisciplinary huddles and increased nursing and physician communication are both related to cohorting.3,14 However, similar to previous reports, in-person observations revealed that the bulk of this indirect time was spent in computer interactions, rather than in interprofessional communication. Interactions with the electronic health record (EHR) consume between one-third to one-half of the day in inpatient settings.20,21 While EHRs are intended to enhance safety, they also fulfill multiple, nonclinical purposes and increase time spent on documentation.22,23 Nonclinical tasks may contribute to clinician burnout and detract from patient centeredness.22 Our findings suggest that cohorting may not offset the burden of these time-intensive EHR tasks. The larger expenditure of time spent in computer interactions observed in the GCh group may be partially explained both by the higher number of patients and the higher frequency of interruptions observed in this group; computer use was the task most frequently observed to be interrupted. While longer tasks are more likely to be interrupted, the interruption in turn further increases the time taken to complete the task.24
The interruption rates we observed are concerning. The hospitalist workday emerges as cognitively intense. GCh hospitalists were noted to be interrupted as frequently as once every eight minutes, a rate more than double that of an earlier investigation and approaching that of ED physicians.5,25,26 Interruptions and multitasking contribute to errors and a perception of increased workload and frustration for clinicians.9,27-29 Although interruptions were pervasive, GCh hospitalists were interrupted more frequently, corroborating a national survey in which hospitalists perceived that cohorting increased face-to-face interruptions.30 The prolonged availability of the cohorted hospitalist on the unit may require different strategies for promoting timely interactions while preserving uninterrupted work time. Our work, however, does not allow us to quantify appropriate and urgent interruptions that reflect improved teamwork and patient safety. Interruptions increase as patient loads increase.25 The contribution to interruptions by the higher patient census on the GCh teams cannot be quantified in this work, but without attention to these details, potential benefits from GCh may be attenuated.
Previous work has delineated variables important in determining hospitalist workload,31 and our work contributes additional considerations. Hospitalist experience and resident presence on cohorted teams was associated with shorter patient visits, while ED encounters were predicted to be the most time intensive. Increasing numbers of units visited in a day was associated with more indirect time, while weekends were associated with a lower burden of indirect care. As expected, APP presence was associated with more time in indirect care as the hospitalist spends time in providing oversight. As noted, cohorting was associated with increases in both direct and indirect care time. These findings may help inform hospital medicine groups. Additionally, attention should be paid to the fact that while support for cohorting stems from investigations in which it was used as part of a bundle of interventions,2,3 in practice, it is often implemented incompletely, with cohorted hospitalists dispersed over several units, or in isolation from other interventions.1
Our work has several limitations. As a single-center investigation, our findings may not be generalizable to other institutions. Second, we did not evaluate clinical outcomes, clinician, patient or nursing satisfaction to assess the effect of cohorting. Third, we cannot comment on whether the observed interruptions were beneficial or detrimental. Finally, while we used statistical control for the measured imbalanced variables between groups, unmeasured confounding factors between team types including differences in patient populations, pathologies and severity of illness, or the unit’s work environment and processes may have affected results.
Our work underscores the importance of paying careful attention to specific components and monitoring for unintended consequences in a complex intervention such as cohorting to allow subsequent refinement. Further studies to assess the interplay between models of care, their impact on interruptions, multitasking, errors and clinician burnout may be necessary. Such investigations will be critical to support the evolution of hospital medicine that enables it to be the driver of excellence in care.
Acknowledgments
The authors thank the participating hospitalists, research assistants, Shelly Harrison, Joni Godfrey, Mark Luetkemeyer, Deanne Kashiwagi, Tammy Kemlage, Dustin Hertel and Adeel Zaidi for their enthusiasm and support. The authors also thank Ann Cottingham, Rich Frankel and Greg Sachs from the ASPIRE program for their guidance and vision. Dr. Weiner is Chief of Health Services Research and Development at the Richard L. Roudebush Veterans Affairs Medical Center in Indianapolis, Indiana.
Disclaimer
The views expressed in this article are those of the authors and do not necessarily represent the views of the U.S. Department of Veterans Affairs.
Geographic cohorting (GCh, also known as “localization” or “regionalization”) refers to the practice wherein hospitalists are assigned to a single inpatient unit. Its adoption is increasing and in 2017, 30% of surveyed United States hospital medicine group leaders reported that their clinicians rounded on 1-2 units daily.1 As a component of intervention bundles, GCh is associated with reductions in mortality, length of stay, and costs.2,3
However, details on how GCh affects the hospitalist workday are unknown. Most time-motion studies of inpatient clinicians have reported the experiences of physicians in training with few specifically evaluating the workflow of attending hospitalists.4 Three studies of the attending hospitalist’s workday that were performed a decade ago excluded teams with learners, had patient loads as low as 9.4 per day, and did not differentiate between GCh and non-GCh models.5-7
The objective of this observational study was to describe and compare the workday of GCh and non-GCh hospitalists by using automated geographical-tracking methods supplemented by in-person observations.
METHODS
Setting and Participants
This work was conducted at a large academic center in the Midwestern US which adopted GCh in 2012. During the study, hospitalists staffed 11 GCh and four non-GCh teams. GCh teams aim to maintain ≥80% of their patients on their assigned unit and conduct interprofessional huddles on weekdays.3 Some units specialize in the care of specific populations (eg, patients with oncologic diagnoses), while others serve as general medical or surgical units. Non-GCh teams are assigned patients without regard to location. Resident housestaff are assigned only to GCh teams and residents and advanced practice providers (APPs) are never assigned to the same team. Based on team members, this yielded five distinct team types: GCh-hospitalist, GCh-hospitalist with APP, GCh-hospitalist with resident, non-GCh-hospitalist, and non-GCh-hospitalist with APP. Hospitalists provided verbal consent to participate. The protocol was reviewed and approved by the Indiana University Institutional Review Board. Two complementary observation modalities were used. Locator badges were used to quantify direct and indirect time unobtrusively over long periods. In-person observations were conducted to examine the workday in greater detail. Data were collected between October 2017 and May 2018.
Observations by Locator Badges
Our institution uses a system designed by Hill-Rom® (Cary, North Carolina) to facilitate staff communication. Staff wear the I-Badge® Locator Badge, which emits an infra-red signal.8 Centrally located receivers tabulate time spent by the badge wearer in each location (Appendix Figure 1). Each hospitalist was given a badge to wear at work for a minimum of six weeks, after which the I-Badge® data were downloaded.
Schedules detailing each team’s members and assigned units (if cohorted) were retrieved. For each observed day, the hospitalist was linked to his or her team type and unit. Team lists were retrieved to ascertain patient load at the start of the day. Data sources were merged to categorize observations.
Observation Categories for Locator Badge Data
The I-Badge® data provided details of how much time the hospitalist spent in each location (eg, nursing station, hallways, patient rooms). All observations in patient rooms were considered “direct care” while all other locations were categorized as “Indirect Care”. Observations were also categorized by the intensity of care provided on that unit, which included the Emergency Department (ED), Progressive Care Units (PCU), Medical-Surgical + PCU units (for units having a mixture of Medical-Surgical and PCU beds), and Medical-Surgical units.
In-person Observations
Four research assistants (RAs) were trained until interrater reliability using task times achieved an intraclass correlation coefficient of 0.98. Task categories included direct care (all time with patients), indirect care (computer interactions, communication), professional development, and travel and personal time. Interruptions were defined as “an unplanned and unscheduled task, causing a discontinuation, a noticeable break, or task switch behavior”.9 “Electronic interruptions” were caused by pagers or phones whereas in-person interruptions were “face-to-face” interruptions. When at least two tasks were performed simultaneously, it was considered multitasking. A data collection form created in REDCap was accessed on computer tablets or smartphones10 (Appendix Table 1). To limit each observation period to five hours, two RAs were scheduled each day. Observations were continued until the hospitalist reported that work activities were complete or until 5
Statistical Analysis
Due to the nested structure of the locator badge data, multilevel mode
Univariate three-level models predicting minutes spent in direct care were tested for each predictor. Predictors, described below, were selected due to their hypothesized relation to time spent in direct patient care, or to account statistically for differences among teams due to the observational nature of the study.12 Predictors were: Level 3, hospitalist characteristics (years since medical school, age, gender, international graduate, years at current hospital); Level 2, work day characteristics (number of units visited, number of patients visited, team type, weekday); and Level 1, individual observation characteristics (intensity of care on unit, number of visits to the same patient room per day
For total daily indirect care, a similar modeling process was used. A log normal distribution was used because the data was right-skewed and contained positive values. The restricted maximum likelihood method was used to calculate final estimates for models. Least square mean values for independent variables were subjected to backward transformation for interpretation. Post hoc pairwise comparisons between team types were conducted using Tukey–Kramer tests for direct and indirect care time. Analyses were conducted using SAS software version 9.4 (Cary, North Carolina).
The in-person observations were summarized using descriptive statistics. Exploratory analyses were performed using t-tests and Fisher’s exact tests to compare continuous and categorical variables respectively.
RESULTS
Locator Badge Observations
Participants
The 17 hospitalists had a mean (SD) age of 38 years (6.4); 10 (59%) were male, 7 (41%) were international medical graduates, and 10 (59%) had worked at the hospital ≥5 years. The duration of observation was <45 days for 7 hospitalists, 46-55 days for 4, and >55 days for 6, yielding observations for 666 hospitalist workdays. The mean time since medical school graduation was 13 years. Seven hospitalists were observed only in the GCh model, one was observed only in the non-GCh model, and nine were observed in both.
Team Characteristics
On average, non-GCh teams visited more units per day than GCh teams. Teams with APPs had higher patient loads (Table 1).
Time Observed in Direct and Indirect Care
In total, 10,522 observations were recorded in providing direct care. The average duration of a direct care encounter ranged from 4.1 to 5.8 minutes. The ratio of indirect to direct time ranged from 2.7 to 3.7 (Table 2).
The number of times that a hospitalist visited the same patient room in one day ranged from 1 to 9. Most (84%) of the patient rooms were visited once per day. The odds that a GCh hospitalist would visit a patient more than once per day were 1.8 times higher (95% CI: 1.37, 2.34; P < .0001) than for a non-GCh hospitalist (data not shown).
Predictors Associated with Time Expenditure
Predictors significantly associated with both the duration of direct care encounters and total daily indirect care time included team type and patient count. Predicted time in direct care encounters was highest for the GCh-hospitalist team (9.5 minutes) and lowest for the GCh-hospitalist with residents team (7 minutes). Predicted total indirect care time was highest for the GCh-hospitalist with APP team (160 minutes) while the lowest expenditure in indirect care time was predicted for the non-GCh-hospitalist team (102 minutes). Increasing patient load from 10 to 20 was predicted to decrease the duration of a direct care encounter by one minute (14%) and increase the total indirect care time by a larger amount (39 min, 24%).
The duration of direct care encounters was also inversely related with years since medical school and number of visits made to same patient room. Finally, acuity of care was associated with the duration of direct care encounters with the longest predicted encounters in the ED (9.4 minutes). Physician gender and age, international graduation, years at current hospital, weekday, and the number of units visited in a day were neither associated with direct care time at P value < .05 nor improved model fit and therefore were not retained in the final model (Table 3).
Additional predictors associated with total daily indirect care time included the number of units visited and working on a weekend or holiday. Total time spent in indirect care was predicted to increase as the number of units increased and decrease on weekends or holidays. Hospitalist characteristics were not associated with time in indirect care (Table 4).
In-person Observations
Four hospitalists cohorted to general medical units and four non-GCh hospitalists were observed for one day each, yielding a total of 3,032 minutes of data. These hospitalists were on teams without residents or APPs. On average, GCh hospitalists had 78% of their patients on their assigned unit, rounded on fewer units (3 vs 6) and had two more patients at the start of the day than non-GCh hospitalists (14 vs 12). Age and gender distribution of the GCh and non-GCh hospitalists were similar.
As a percentage of total observed time, GCh hospitalists were noted to spend a larger proportion of the workday in computer interactions vs non-GCh hospitalists (56% vs 39%; P = .005). The proportion of time in other activities or locations was not statistically different between GCh and non-GCh hospitalists, including face-to-face communication (21% vs 15%), multitasking (18% vs 14%), time spent at the nursing station (58% vs 34%), direct care (15% vs 20%), and time traveling (4% vs 11%). The most frequently observed combination of multitasking was computer and phone use (59% of all multitasking) followed by computer use and face-to-face communication (17%; Appendix Figure 2).
The mean duration of an interruption was 1.3 minutes. More interruptions were observed in the GCh group than the non-GCh group (139 vs 102). Interruptions in the GCh group were face-to-face in 62% of instances and electronic in 25%. The remaining 13% were instances in which electronic and face-to-face interruptions occurred simultaneously. In the non-GCh group, 51% of interruptions were face-to-face; 47% were electronic; and 2% were simultaneous. GCh hospitalists were interrupted once every 14 minutes in the morning, with interruption frequency increasing to once every eight minutes in the afternoon. Non-GCh hospitalists were interrupted once every 13 minutes in the morning and saw interruption frequency decrease to once every 17 minutes in the afternoon. The task most frequently interrupted was computer use.
DISCUSSION
Previous investigations have studied the impact of cohorting on outcomes, including the facilitation of bedside rounding, adverse events, agreement between nurses and physicians on the plan of care, productivity, and the number of pages received.13-16 Cohorting’s benefits are theorized to include increased hospitalist time with patients, while its downsides are perceived to include increased interruptions.17,18 Neither has previously been evaluated by direct observation.
Our findings support cohorting’s association with increased hospitalist–patient time. While GCh hospitalists were observed spending 5% less time in direct care than non-GCh hospitalists by in-person observations, this difference did not achieve statistical significance and was unadjusted for hospitalist, patient load, team or patient characteristics. Using the larger badge dataset, the predicted values for time spent in direct care encounters were higher in cohorted teams. Pairwise comparisons consistently trended toward longer durations in cohorted vs noncohorted teams. The notable exception was in cohorted teams with residents, which had the shortest predicted patient visits; however, we did not have noncohorted teams with residents in our study, limiting interpretation. Additionally, the odds of repeat visits to a patient in a single day were almost twice as high in the cohorted vs noncohorted group. The magnitude of this gain, however, is estimated to be a modest 1.2 minutes for a hospitalist only team and 1.7 minutes for a hospitalist with APP team and may be insufficient to provide compassionate, patient-centered care.19
Furthermore, these gains may be eroded if patient loads are high: similar to a previous study, we found that the duration of each patient visit decreased by 14% when the load increased from 10 to 20 patients.6 The expected gains in efficiency from cohorting leads to an expectation that hospitalists can manage more patients, but such reflexive increases should be carefully considered.18
Similar to earlier investigations where hospitalists were found to spend 60 to 69% of the day in indirect care activities,5,6 hospitalists in both cohorted and noncohorted models spent approximately three times more time in indirect than direct care. Cohorting was associated with increased indirect care time. This association was expected as interdisciplinary huddles and increased nursing and physician communication are both related to cohorting.3,14 However, similar to previous reports, in-person observations revealed that the bulk of this indirect time was spent in computer interactions, rather than in interprofessional communication. Interactions with the electronic health record (EHR) consume between one-third to one-half of the day in inpatient settings.20,21 While EHRs are intended to enhance safety, they also fulfill multiple, nonclinical purposes and increase time spent on documentation.22,23 Nonclinical tasks may contribute to clinician burnout and detract from patient centeredness.22 Our findings suggest that cohorting may not offset the burden of these time-intensive EHR tasks. The larger expenditure of time spent in computer interactions observed in the GCh group may be partially explained both by the higher number of patients and the higher frequency of interruptions observed in this group; computer use was the task most frequently observed to be interrupted. While longer tasks are more likely to be interrupted, the interruption in turn further increases the time taken to complete the task.24
The interruption rates we observed are concerning. The hospitalist workday emerges as cognitively intense. GCh hospitalists were noted to be interrupted as frequently as once every eight minutes, a rate more than double that of an earlier investigation and approaching that of ED physicians.5,25,26 Interruptions and multitasking contribute to errors and a perception of increased workload and frustration for clinicians.9,27-29 Although interruptions were pervasive, GCh hospitalists were interrupted more frequently, corroborating a national survey in which hospitalists perceived that cohorting increased face-to-face interruptions.30 The prolonged availability of the cohorted hospitalist on the unit may require different strategies for promoting timely interactions while preserving uninterrupted work time. Our work, however, does not allow us to quantify appropriate and urgent interruptions that reflect improved teamwork and patient safety. Interruptions increase as patient loads increase.25 The contribution to interruptions by the higher patient census on the GCh teams cannot be quantified in this work, but without attention to these details, potential benefits from GCh may be attenuated.
Previous work has delineated variables important in determining hospitalist workload,31 and our work contributes additional considerations. Hospitalist experience and resident presence on cohorted teams was associated with shorter patient visits, while ED encounters were predicted to be the most time intensive. Increasing numbers of units visited in a day was associated with more indirect time, while weekends were associated with a lower burden of indirect care. As expected, APP presence was associated with more time in indirect care as the hospitalist spends time in providing oversight. As noted, cohorting was associated with increases in both direct and indirect care time. These findings may help inform hospital medicine groups. Additionally, attention should be paid to the fact that while support for cohorting stems from investigations in which it was used as part of a bundle of interventions,2,3 in practice, it is often implemented incompletely, with cohorted hospitalists dispersed over several units, or in isolation from other interventions.1
Our work has several limitations. As a single-center investigation, our findings may not be generalizable to other institutions. Second, we did not evaluate clinical outcomes, clinician, patient or nursing satisfaction to assess the effect of cohorting. Third, we cannot comment on whether the observed interruptions were beneficial or detrimental. Finally, while we used statistical control for the measured imbalanced variables between groups, unmeasured confounding factors between team types including differences in patient populations, pathologies and severity of illness, or the unit’s work environment and processes may have affected results.
Our work underscores the importance of paying careful attention to specific components and monitoring for unintended consequences in a complex intervention such as cohorting to allow subsequent refinement. Further studies to assess the interplay between models of care, their impact on interruptions, multitasking, errors and clinician burnout may be necessary. Such investigations will be critical to support the evolution of hospital medicine that enables it to be the driver of excellence in care.
Acknowledgments
The authors thank the participating hospitalists, research assistants, Shelly Harrison, Joni Godfrey, Mark Luetkemeyer, Deanne Kashiwagi, Tammy Kemlage, Dustin Hertel and Adeel Zaidi for their enthusiasm and support. The authors also thank Ann Cottingham, Rich Frankel and Greg Sachs from the ASPIRE program for their guidance and vision. Dr. Weiner is Chief of Health Services Research and Development at the Richard L. Roudebush Veterans Affairs Medical Center in Indianapolis, Indiana.
Disclaimer
The views expressed in this article are those of the authors and do not necessarily represent the views of the U.S. Department of Veterans Affairs.
1. O’Leary KJ, Johnson JK, Manojlovich M, Astik GJ, Williams MV. Use of unit-based interventions to improve the quality of care for hospitalized medical patients: a national survey. Jt Comm J Qual Patient Saf. 2017;43(11):573-579. https://doi.org/10.1016/j.jcjq.2017.05.008
2. Stein J, Payne C, Methvin A, et al. Reorganizing a hospital ward as an accountable care unit. J Hosp Med. 2015;10(1):36-40. https://doi.org/10.1002/jhm.2284.
3. Kara A, Johnson CS, Nicley A, Niemeier MR, Hui SL. Redesigning inpatient care: testing the effectiveness of an accountable care team model. J Hosp Med. 2015;10(12):773-779. https://doi.org/10.1002/jhm.2432.
4. Tipping MD, Forth VE, Magill DB, Englert K, Williams MV. Systematic review of time studies evaluating physicians in the hospital setting. J Hosp Med. 2010;5(6):353-359. https://doi.org/10.1002/jhm.647.
5. O’Leary KJ, Liebovitz DM, Baker DW. How hospitalists spend their time: Insights on efficiency and safety. J Hosp Med. 2006;1(2):88-93. https://doi.org/10.1002/jhm.88.
6. Tipping MD, Forth VE, O’Leary KJ, et al. Where did the day go? A time-motion study of hospitalists. J Hosp Med. 2010;5(6):323-328. https://doi.org/10.1002/jhm.790.
7. Rothberg MB, Steele JR, Wheeler J, Arora A, Priya A, Lindenauer PK. The relationship between time spent communicating and communication outcomes on a hospital medicine service. J Gen Intern Med. 2012;27(2):185-189. https://doi.org/10.1007/s11606-011-1857-8.
8. Hill-rom.com. (2019). Staff Locating | hill-rom.com. [online] Available at: https://www.hill-rom.com/ca/Products/Products-by-Category/Clinical-Workflow-Solutions/Hill-Rom-Staff-Locating/. Accessed July 7, 2019.
9. Weigl M, Müller A, Vincent C, Angerer P, Sevdalis N. The association of workflow interruptions and hospital doctors’ workload: a prospective observational study. BMJ Qual Saf. 2012;21(5):399-407. https://doi.org/10.1136/bmjqs-2011-000188.
10. Harris PA, Taylor R, Thielke R, Payne J, Gonzalez N, Conde JG. Research electronic data capture (REDCap)—A metadata-driven methodology and workflow process for providing translational research informatics support. J Biomed Inform. 2009;42(2):377-381. https://doi.org/10.1016/j.jbi.2008.08.010.
11. Snijders T, Bosker R. Multilevel Analysis. 2nd ed. London: Sage Publications; 2012.
12. Pourhoseingholi M, Baghestani A, Vahedi M. How to control confounding effects by statistical analysis. Gastroenterol Hepatol Bed Bench. 2012;5(2):79-83.
13. Huang KT, Minahan J, Brita-Rossi P, et al. All together now: impact of a regionalization and bedside rounding initiative on the efficiency and inclusiveness of clinical rounds. J Hosp Med. 2017;12(3):150-156. https://doi.org/10.12788/jhm.2696.
14. Mueller SK, Schnipper JL, Giannelli K, Roy CL, Boxer R. Impact of regionalized care on concordance of plan and preventable adverse events on general medicine services. J Hosp Med. 2016;11(9):620-627. https://doi.org/10.1002/jhm.2566.
15. O’Leary KJ, Wayne DB, Landler MP, et al. Impact of localizing physicians to hospital units on nurse—physician communication and agreement on the plan of care. J Gen Intern Med. 2009;24(11):1223-1227. https://doi.org/10.1007/s11606-009-1113-7.
16. Singh S, Tarima S, Rana V, et al. Impact of localizing general medical teams to a single nursing unit. J Hosp Med. 2012;7(7):551-556. https://doi.org/10.1002/jhm.1948.
17. Singh S, Fletcher KE. A qualitative evaluation of geographical localization of hospitalists: how unintended consequences may impact quality. J Gen Intern Med. 2014;29(7):1009-1016. https://doi.org/10.1007/s11606-014-2780-6.
18. Kara A, Johnson CS, Hui SL, Kashiwagi D. Hospital-based clinicians’ perceptions of geographic cohorting: identifying opportunities for improvement. Am J Med Qual. 2018;33(3):303-312. https://doi.org/10.1177/1062860617745123.
19. Lown BA. Seven guiding commitments: making the U.S. healthcare system more compassionate. J Patient Exp. 2014;1(2):6-15. https://doi.org/10.1177/237437431400100203.
20. Wenger N, Méan M, Castioni J, Marques-Vidal P, Waeber G, Garnier A. Allocation of internal medicine resident time in a swiss hospital: a time and motion study of day and evening shifts. Ann Intern Med. 2017;166(8):579-586. https://doi.org/10.7326/m16-2238.
21. Chen L, Guo U, Illipparambil LC, et al. Racing against the clock: internal medicine residents’ time spent on electronic health records. J Graduate Med Educ. 2015;8(1):39-44. https://doi.org/10.4300/jgme-d-15-00240.1.
22. Erickson SM, Rockwern B, Koltov M, McLean R. Putting patients first by reducing administrative tasks in health care: a position paper of the American College of Physicians. Ann Intern Med. 2017;166:659-661. https://doi.org/10.7326/m16-2697.
23. Poissant L, Pereira J, Tamblyn R, Kawasumi Y. The impact of electronic health records on time efficiency of physicians and nurses: a systematic review. J Am Med Inform Assn. 2005;12(5):505-516. https://doi.org/10.1197/jamia.m1700.
24. Coiera E. The science of interruption. Bmj Qual Saf. 2017;21(5):357-360. https://doi.org/10.1136/bmjqs-2012-00078.
25. Chisholm C, Collison E, Nelson D, Cordell W. Emergency department workplace interruptions: are emergency physicians “interrupt-driven” and “multitasking”? Academic Emerg Med. 2000;7(11):1239-1243. https://doi.org/10.1111/j.1553-2712.2000.tb00469.x.
26. Westbrook JI, Ampt A, Kearney L, Rob MI. All in a day’s work: an observational study to quantify how and with whom doctors on hospital wards spend their time. Med J Aust. 2008;188(9):506-509. https://doi.org/10.5694/j.1326-5377.2008.tb01762.x.
27. Westbrook JI, Woods A, Rob MI, Dunsmuir WT, Day RO. Association of interruptions with an increased risk and severity of medication administration errors. Arch Intern Med. 2010;170(8):683-690. https://doi.org/10.1001/archinternmed.2010.65.
28. Weigl M, Müller A, Angerer P, Hoffmann F. Workflow interruptions and mental workload in hospital pediatricians: an observational study. BMC Health Serv Res. 2014;14(1):433. https://doi.org/10.1186/1472-6963-14-433.
29. Shojania KG, Wald H, Gross R. Understanding medical error and improving patient safety in the inpatient setting. Med Clin N Am. 2002;86(4):847-867. https://doi.org/10.1016/s0025-7125(02)00016-0.
30. Kara A, Johnson CS, Hui SL, Kashiwagi D. Hospital-based clinicians’ perceptions of geographic cohorting: identifying opportunities for improvement. J Med Internet Res. 2017;6(3):106286061774512. https://doi.org/10.2196/jmir.6.3.e34.
31. Michtalik HJ, Pronovost PJ, Marsteller JA, Spetz J, Brotman DJ. Developing a model for attending physician workload and outcomes. Jama Intern Med. 2013;173(11):1026-1028. https://doi.org/10.1001/jamainternmed.2013.405.
1. O’Leary KJ, Johnson JK, Manojlovich M, Astik GJ, Williams MV. Use of unit-based interventions to improve the quality of care for hospitalized medical patients: a national survey. Jt Comm J Qual Patient Saf. 2017;43(11):573-579. https://doi.org/10.1016/j.jcjq.2017.05.008
2. Stein J, Payne C, Methvin A, et al. Reorganizing a hospital ward as an accountable care unit. J Hosp Med. 2015;10(1):36-40. https://doi.org/10.1002/jhm.2284.
3. Kara A, Johnson CS, Nicley A, Niemeier MR, Hui SL. Redesigning inpatient care: testing the effectiveness of an accountable care team model. J Hosp Med. 2015;10(12):773-779. https://doi.org/10.1002/jhm.2432.
4. Tipping MD, Forth VE, Magill DB, Englert K, Williams MV. Systematic review of time studies evaluating physicians in the hospital setting. J Hosp Med. 2010;5(6):353-359. https://doi.org/10.1002/jhm.647.
5. O’Leary KJ, Liebovitz DM, Baker DW. How hospitalists spend their time: Insights on efficiency and safety. J Hosp Med. 2006;1(2):88-93. https://doi.org/10.1002/jhm.88.
6. Tipping MD, Forth VE, O’Leary KJ, et al. Where did the day go? A time-motion study of hospitalists. J Hosp Med. 2010;5(6):323-328. https://doi.org/10.1002/jhm.790.
7. Rothberg MB, Steele JR, Wheeler J, Arora A, Priya A, Lindenauer PK. The relationship between time spent communicating and communication outcomes on a hospital medicine service. J Gen Intern Med. 2012;27(2):185-189. https://doi.org/10.1007/s11606-011-1857-8.
8. Hill-rom.com. (2019). Staff Locating | hill-rom.com. [online] Available at: https://www.hill-rom.com/ca/Products/Products-by-Category/Clinical-Workflow-Solutions/Hill-Rom-Staff-Locating/. Accessed July 7, 2019.
9. Weigl M, Müller A, Vincent C, Angerer P, Sevdalis N. The association of workflow interruptions and hospital doctors’ workload: a prospective observational study. BMJ Qual Saf. 2012;21(5):399-407. https://doi.org/10.1136/bmjqs-2011-000188.
10. Harris PA, Taylor R, Thielke R, Payne J, Gonzalez N, Conde JG. Research electronic data capture (REDCap)—A metadata-driven methodology and workflow process for providing translational research informatics support. J Biomed Inform. 2009;42(2):377-381. https://doi.org/10.1016/j.jbi.2008.08.010.
11. Snijders T, Bosker R. Multilevel Analysis. 2nd ed. London: Sage Publications; 2012.
12. Pourhoseingholi M, Baghestani A, Vahedi M. How to control confounding effects by statistical analysis. Gastroenterol Hepatol Bed Bench. 2012;5(2):79-83.
13. Huang KT, Minahan J, Brita-Rossi P, et al. All together now: impact of a regionalization and bedside rounding initiative on the efficiency and inclusiveness of clinical rounds. J Hosp Med. 2017;12(3):150-156. https://doi.org/10.12788/jhm.2696.
14. Mueller SK, Schnipper JL, Giannelli K, Roy CL, Boxer R. Impact of regionalized care on concordance of plan and preventable adverse events on general medicine services. J Hosp Med. 2016;11(9):620-627. https://doi.org/10.1002/jhm.2566.
15. O’Leary KJ, Wayne DB, Landler MP, et al. Impact of localizing physicians to hospital units on nurse—physician communication and agreement on the plan of care. J Gen Intern Med. 2009;24(11):1223-1227. https://doi.org/10.1007/s11606-009-1113-7.
16. Singh S, Tarima S, Rana V, et al. Impact of localizing general medical teams to a single nursing unit. J Hosp Med. 2012;7(7):551-556. https://doi.org/10.1002/jhm.1948.
17. Singh S, Fletcher KE. A qualitative evaluation of geographical localization of hospitalists: how unintended consequences may impact quality. J Gen Intern Med. 2014;29(7):1009-1016. https://doi.org/10.1007/s11606-014-2780-6.
18. Kara A, Johnson CS, Hui SL, Kashiwagi D. Hospital-based clinicians’ perceptions of geographic cohorting: identifying opportunities for improvement. Am J Med Qual. 2018;33(3):303-312. https://doi.org/10.1177/1062860617745123.
19. Lown BA. Seven guiding commitments: making the U.S. healthcare system more compassionate. J Patient Exp. 2014;1(2):6-15. https://doi.org/10.1177/237437431400100203.
20. Wenger N, Méan M, Castioni J, Marques-Vidal P, Waeber G, Garnier A. Allocation of internal medicine resident time in a swiss hospital: a time and motion study of day and evening shifts. Ann Intern Med. 2017;166(8):579-586. https://doi.org/10.7326/m16-2238.
21. Chen L, Guo U, Illipparambil LC, et al. Racing against the clock: internal medicine residents’ time spent on electronic health records. J Graduate Med Educ. 2015;8(1):39-44. https://doi.org/10.4300/jgme-d-15-00240.1.
22. Erickson SM, Rockwern B, Koltov M, McLean R. Putting patients first by reducing administrative tasks in health care: a position paper of the American College of Physicians. Ann Intern Med. 2017;166:659-661. https://doi.org/10.7326/m16-2697.
23. Poissant L, Pereira J, Tamblyn R, Kawasumi Y. The impact of electronic health records on time efficiency of physicians and nurses: a systematic review. J Am Med Inform Assn. 2005;12(5):505-516. https://doi.org/10.1197/jamia.m1700.
24. Coiera E. The science of interruption. Bmj Qual Saf. 2017;21(5):357-360. https://doi.org/10.1136/bmjqs-2012-00078.
25. Chisholm C, Collison E, Nelson D, Cordell W. Emergency department workplace interruptions: are emergency physicians “interrupt-driven” and “multitasking”? Academic Emerg Med. 2000;7(11):1239-1243. https://doi.org/10.1111/j.1553-2712.2000.tb00469.x.
26. Westbrook JI, Ampt A, Kearney L, Rob MI. All in a day’s work: an observational study to quantify how and with whom doctors on hospital wards spend their time. Med J Aust. 2008;188(9):506-509. https://doi.org/10.5694/j.1326-5377.2008.tb01762.x.
27. Westbrook JI, Woods A, Rob MI, Dunsmuir WT, Day RO. Association of interruptions with an increased risk and severity of medication administration errors. Arch Intern Med. 2010;170(8):683-690. https://doi.org/10.1001/archinternmed.2010.65.
28. Weigl M, Müller A, Angerer P, Hoffmann F. Workflow interruptions and mental workload in hospital pediatricians: an observational study. BMC Health Serv Res. 2014;14(1):433. https://doi.org/10.1186/1472-6963-14-433.
29. Shojania KG, Wald H, Gross R. Understanding medical error and improving patient safety in the inpatient setting. Med Clin N Am. 2002;86(4):847-867. https://doi.org/10.1016/s0025-7125(02)00016-0.
30. Kara A, Johnson CS, Hui SL, Kashiwagi D. Hospital-based clinicians’ perceptions of geographic cohorting: identifying opportunities for improvement. J Med Internet Res. 2017;6(3):106286061774512. https://doi.org/10.2196/jmir.6.3.e34.
31. Michtalik HJ, Pronovost PJ, Marsteller JA, Spetz J, Brotman DJ. Developing a model for attending physician workload and outcomes. Jama Intern Med. 2013;173(11):1026-1028. https://doi.org/10.1001/jamainternmed.2013.405.
© 2019 Society of Hospital Medicine
Patient and Care Team Perspectives of Telemedicine in Critical Access Hospitals
Healthcare delivery in rural America faces unique, growing challenges related to health and emergency care access.1 Telemedicine approaches have the potential to increase rural hospitals’ ability to deliver efficient emergency care and reduce clinician shortages.2 While initial evidence of telemedicine success exists, more quality research is needed to understand telemedicine patient and care team experiences,3 especially with real-time, clinician-initiated video conferencing in critical access hospital (CAH) emergency departments (ED). Some experience studies exist,4 but results are primarily quantitative5 and lack the nuanced qualitative depth needed to understand topics such as satisfaction and communication.6 Additionally, few explore combined patient and care team perspectives.5 The lack of breadth and depth makes it difficult to provide actionable recommendations for improvements and affects the feasibility of continuing this work and improving telemedicine care quality. To address these gaps, we evaluated a real-time, clinician-initiated video conferencing program with overnight clinicians servicing ED patients in three Midwestern care system CAHs. This evaluation assessed patient and care team (nurse and clinician) experience with telemedicine using quantitative and qualitative survey data analysis.
METHODS
Because this evaluation was designed to measure and improve program quality in a single healthcare system, it was deemed non-human subjects research by the organization’s institutional review board. This brief report follows telemedicine reporting guidelines.7
Setting and Telemedicine Program
This program, designed to reduce the need for on-call hospitalist clinicians to be onsite at CAHs overnight, was implemented in a large Midwestern nonprofit integrated healthcare system with three rural CAHs (combined capacity for 75 inpatient admissions, with full-time onsite ED clinicians and nurses, as well as on-call hospitalist clinicians) and a large metropolitan tertiary-care hospital. All adult patients presenting to CAH EDs between 6
Following a pilot period, the full-scale program was implemented in September 2017 and included 14 remote clinicians and 60 onsite nurses.
Survey Administration and Design
A postimplementation survey was designed to explore patient and care team experience with telemedicine. Patients who received a telemedicine visit between September 2017 and April 2018 were mailed a paper survey. Nonresponders were called by professional interviewers affiliated with the healthcare system. All participating clinicians (N = 14, all MDs) and nurses (N = 60, all RNs) were emailed an online care team survey with phone-in option. Care team nonresponders were sent up to two reminder emails.
Surveys captured the following five constructs: communication, workflow integration, telemedicine technology, quality of care, and general satisfaction. Existing questionnaires were used where possible; additional items were designed with clinical experts following survey design best practices.8 Patient-perceived communication was assessed via three Consumer Assessment of Healthcare Providers and Systems Outpatient and Ambulatory Surgery Survey items.9 Five additional program-developed patient survey items included satisfaction with clinician-nurse communication, satisfaction with technology, telemedicine quality of care overall and in comparison with traditional care, and whether or not patients would recommend telemedicine (Table). Four open-ended questions asked patients about improvement opportunities and general satisfaction.
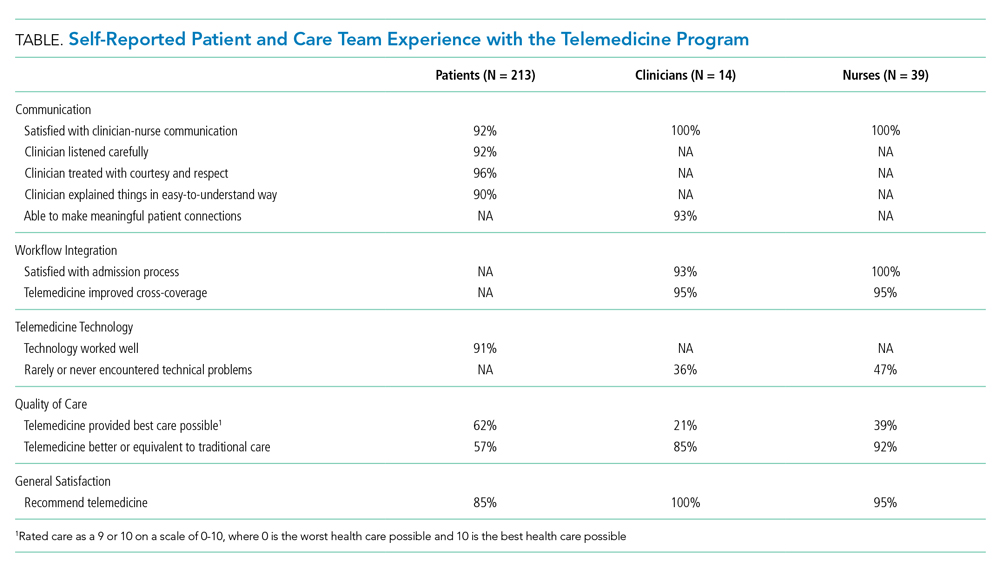
Care team surveys included two items regarding ability to effectively communicate, two about satisfaction with workflow integration, one about technical problems, two about quality of care, and one about general satisfaction. Open-ended questions gathered further information and recommendations to improve communication, workflow integration, technology issues, and general satisfaction.
Analysis
Closed-ended items were dichotomized (satisfied yes/no); descriptive statistics (frequencies/percents) are presented to quantify patient and care team experience. Quantitative analyses were conducted in SAS software version 9.4 (SAS Institute, Cary, North Carolina). Open-ended responses were coded separately for patient and care team experience, following qualitative content analysis best practices.10 A lead coder read all responses, created a coding framework of identified themes, and coded individual responses. A second coder independently coded responses using the same framework. Interrater reliability was calculated for each major theme using percent agreement and prevalence- and bias-adjusted
RESULTS
Of eligible patients mailed a survey (N = 408), 3% self-reported as ineligible, and 54% completed the survey. This is a maximum response rate (response rate 6) according to the American Association for Public Opinion Research.12 Patients were 67 years old on average (SD = 15), they were primarily white (97%), and 54% were female. All clinicians and 63% of nurses completed the survey.12 Clinicians and nurses were 29% and 95% female, respectively.
Quantitative results (Table) show generally positive experience across patient and care team respondents. Over 90% were satisfied with all measures of communication. Care teams had high satisfaction with admissions processes and reported telemedicine improved cross-coverage. Patient-reported technology experience was positive but was less positive from the care team perspective. Care teams reported lower absolute quality of care than did patients but were more likely to perceive telemedicine as high quality, compared with traditional care. Most patients, clinicians, and nurses would recommend telemedicine.
Qualitatively, four major themes were identified in open-ended responses with high interrater reliability (PABAK ranging from 0.92 to 0.98 in patient responses and 0.88 to 0.95 in care team responses) and aligned with the quantitative survey constructs: clinician-nurse communication, clinician-patient communication, workflow integration, and telemedicine technology. Patients reported satisfaction with communication with remote clinicians:
“[The clinician] was extremely attentive to me and what was going on. She was articulate and clear. I understood what was going to happen.” –Patient
Care teams suggested concrete improvement opportunities:
“I’d prefer to have some time with nursing staff both before and (sometimes) after the patient encounter.” –Clinician
“Since we cannot hear what [the clinicians] are hearing with the stethoscope, it’s nice when they tell us when to move it to the next spot.” –Nurse
Clinicians and nurses gave favorable responses regarding workflow integration, though time (both admissions wait time and session duration) was a reported opportunity:
“It would be helpful if we could speed up the time from admit request to screen time.” –Clinician
“When the [clinicians] get swamped, they’re hard to get a hold of, and admissions can take a long time. They may have too much on their plates dealing with several locations.” –Nurse
Technology issues—internet connection, stethoscope, sound, and screen or camera—were mentioned by patients and care teams, though technology was reviewed favorably overall by most patients:
“I was fascinated by the technology. Visiting someone over a television was impressive. ... The picture, the sound clarity, and the connection itself was flawless.” –Patient
Some patients commented that telemedicine was the best option given the situation, but still preferred an in-person doctor:
“If a doctor wasn’t available, telemedicine is better than nothing.” –Patient
Nurses who would not recommend telemedicine noted the need for personal connection:
“[I] still prefer [an] in-person MD for more personal contact. The older patients often state they wish the doctor would come and see them.” –Nurse
Patients who would not recommend telemedicine also desired personal connection:
“I would sooner talk to a person than a machine.” –Patient
A few clinicians noted the connection with patients would be improved if they knew about others in the room:
“It’d be nice if everyone in the room was introduced. Sometimes people are sitting out of view of the camera and I don’t realize they’re there until later.” –Clinician
CONCLUSION
These results make important contributions to understanding and improving the telemedicine experience in rural emergency hospital medicine. While the predominantly white patient respondent population limits generalizability, these demographics are representative of the overall population of the participating hospitals. A strength of this evaluation is its contemporaneous consideration of patient and care team experience with both quantitative and rich, qualitative analysis. Patients and care teams alike thought overnight telemedicine was better than the status quo. While our quality of care findings align with some previous literature,13 care teams in the current analysis overwhelmingly would recommend telemedicine, whereas some clinicians in prior work would not recommend telemedicine.14
In terms of communication, in line with existing literature, some patients still preferred in-person visits,15 a view also shared by some care team members. Workflow and technology barriers were raised, corroborating existing work,13 but actionable solutions (eg, adding care team–only time before visits or verbalizing when to move stethoscopes) were also identified.
Embedding patient and care team experience surveys and sharing results is critical in advancing telemedicine. Findings from this evaluation strengthen the case for payer reimbursement of telemedicine in rural acute care. Continued work to improve, test, and publish findings on patient and care team experience with telemedicine is critical to providing quality services in often-underserved communities.
Acknowledgments
The authors would like to acknowledge the contributions of Ann Werner in identifying the patient survey sample, Brian Barklind in identifying source data for the analysis, and both Brian Barklind and Rachael Rivard for conducting the analyses and summarizing results. We would also like to thank Kelly Logue for her involvement in conceptualizing the telemedicine evaluation described here, as well as Larisa Polynskaya for her help preparing the manuscript for publication, and the care teams and patients who provided valuable input.
1. Nelson R. Will rural community hospitals survive? Am J Nurs. 2017;117(9):18-19. https://doi.org/10.1097/01.NAJ.0000524538.11040.7f.
2. Ward MM, Merchant KAS, Carter KD, et al. Use of telemedicine for ED physician coverage in critical access hospitals increased after CMS policy clarification. Health Aff. 2018;37(12):2037-2044. https://doi.org/10.1377/hlthaff.2018.05103.
3. AlDossary S, Martin-Khan MG, Bradford NK, Smith AC. A systematic review of the methodologies used to evaluate telemedicine service initiatives in hospital facilities. Int J Med Inf. 2017;97:171-194. https://doi.org/10.1016/j.ijmedinf.2016.10.012.
4. Kuperman EF, Linson EL, Klefstad K, Perry E, Glenn K. The virtual hospitalist: a single-site implementation bringing hospitalist coverage to critical access hospitals. J Hosp Med. 2018;13(11):759-763. https://doi.org/10.12788/jhm.3061.
5. Garcia R, Adelakun OA. A review of patient and provider satisfaction with telemedicine. Paper presented at: Twenty-third Americas Conference on Information Systems; 2017; Boston, Massachusetts.
6. Mair F, Whitten P. Systematic review of studies of patient satisfaction with telemedicine. BMJ. 2000;320(7248):1517-1520. https://doi.org/10.1136/bmj.320.7248.1517.
7. Khanal S, Burgon J, Leonard S, Griffiths M, Eddowes LA. Recommendations for the improved effectiveness and reporting of telemedicine programs in developing countries: results of a systematic literature review. Telemed E Health. 2015;21(11):903-915. https://doi.org/10.1089/tmj.2014.0194.
8. Fowler Jr FJ. Improving survey questions: Design and evaluation. Vol 38. Thousand Oaks, California: Sage Publications, Inc.; 1995.
9. Agency for Healthcare Research and Quality. CAHPS Outpatient and Ambulatory Surgery Survey. https://www.ahrq.gov/cahps/surveys-guidance/oas/index.html. Accessed August 1, 2017.
10. Ulin PR, Robinson ET, Tolley EE. Qualitative methods in public health: A field guide for applied research. Hoboken, New Jersey: John Wiley & Sons; 2005.
11. Corden A, Sainsbury R. Using verbatim quotations in reporting qualitative social research: researches’ views. York, United Kingdom: University of York; 2006.
12. American Association for Public Opinion Research. Standard Definitions: Final Dispositions of Case Codes and Outcome Rates for Surveys. 2016. https://www.aapor.org/AAPOR_Main/media/publications/Standard-Definitions20169theditionfinal.pdf. Accessed August 1, 2019.
13. Mueller KJ, Potter AJ, MacKinney AC, Ward MM. Lessons from tele-emergency: improving care quality and health outcomes by expanding support for rural care systems. Health Aff. 2014;33(2):228-234. https://doi.org/10.1377/hlthaff.2013.1016.
14. Fairchild R, Kuo SFF, Laws S, O’Brien A, Rahmouni H. Perceptions of rural emergency department providers regarding telehealth-based care: perceived competency, satisfaction with care and Tele-ED patient disposition. Open J Nurs. 2017;7(07):721. https://doi.org/10.4236/ojn.2017.77054.
15. Weatherburn G, Dowie R, Mistry H, Young T. An assessment of parental satisfaction with mode of delivery of specialist advice for paediatric cardiology: face-to-face versus videoconference. J Telemed Telecare. 2006;12(suppl 1):57-59. https://doi.org/10.1258/135763306777978560.
Healthcare delivery in rural America faces unique, growing challenges related to health and emergency care access.1 Telemedicine approaches have the potential to increase rural hospitals’ ability to deliver efficient emergency care and reduce clinician shortages.2 While initial evidence of telemedicine success exists, more quality research is needed to understand telemedicine patient and care team experiences,3 especially with real-time, clinician-initiated video conferencing in critical access hospital (CAH) emergency departments (ED). Some experience studies exist,4 but results are primarily quantitative5 and lack the nuanced qualitative depth needed to understand topics such as satisfaction and communication.6 Additionally, few explore combined patient and care team perspectives.5 The lack of breadth and depth makes it difficult to provide actionable recommendations for improvements and affects the feasibility of continuing this work and improving telemedicine care quality. To address these gaps, we evaluated a real-time, clinician-initiated video conferencing program with overnight clinicians servicing ED patients in three Midwestern care system CAHs. This evaluation assessed patient and care team (nurse and clinician) experience with telemedicine using quantitative and qualitative survey data analysis.
METHODS
Because this evaluation was designed to measure and improve program quality in a single healthcare system, it was deemed non-human subjects research by the organization’s institutional review board. This brief report follows telemedicine reporting guidelines.7
Setting and Telemedicine Program
This program, designed to reduce the need for on-call hospitalist clinicians to be onsite at CAHs overnight, was implemented in a large Midwestern nonprofit integrated healthcare system with three rural CAHs (combined capacity for 75 inpatient admissions, with full-time onsite ED clinicians and nurses, as well as on-call hospitalist clinicians) and a large metropolitan tertiary-care hospital. All adult patients presenting to CAH EDs between 6
Following a pilot period, the full-scale program was implemented in September 2017 and included 14 remote clinicians and 60 onsite nurses.
Survey Administration and Design
A postimplementation survey was designed to explore patient and care team experience with telemedicine. Patients who received a telemedicine visit between September 2017 and April 2018 were mailed a paper survey. Nonresponders were called by professional interviewers affiliated with the healthcare system. All participating clinicians (N = 14, all MDs) and nurses (N = 60, all RNs) were emailed an online care team survey with phone-in option. Care team nonresponders were sent up to two reminder emails.
Surveys captured the following five constructs: communication, workflow integration, telemedicine technology, quality of care, and general satisfaction. Existing questionnaires were used where possible; additional items were designed with clinical experts following survey design best practices.8 Patient-perceived communication was assessed via three Consumer Assessment of Healthcare Providers and Systems Outpatient and Ambulatory Surgery Survey items.9 Five additional program-developed patient survey items included satisfaction with clinician-nurse communication, satisfaction with technology, telemedicine quality of care overall and in comparison with traditional care, and whether or not patients would recommend telemedicine (Table). Four open-ended questions asked patients about improvement opportunities and general satisfaction.
Care team surveys included two items regarding ability to effectively communicate, two about satisfaction with workflow integration, one about technical problems, two about quality of care, and one about general satisfaction. Open-ended questions gathered further information and recommendations to improve communication, workflow integration, technology issues, and general satisfaction.
Analysis
Closed-ended items were dichotomized (satisfied yes/no); descriptive statistics (frequencies/percents) are presented to quantify patient and care team experience. Quantitative analyses were conducted in SAS software version 9.4 (SAS Institute, Cary, North Carolina). Open-ended responses were coded separately for patient and care team experience, following qualitative content analysis best practices.10 A lead coder read all responses, created a coding framework of identified themes, and coded individual responses. A second coder independently coded responses using the same framework. Interrater reliability was calculated for each major theme using percent agreement and prevalence- and bias-adjusted
RESULTS
Of eligible patients mailed a survey (N = 408), 3% self-reported as ineligible, and 54% completed the survey. This is a maximum response rate (response rate 6) according to the American Association for Public Opinion Research.12 Patients were 67 years old on average (SD = 15), they were primarily white (97%), and 54% were female. All clinicians and 63% of nurses completed the survey.12 Clinicians and nurses were 29% and 95% female, respectively.
Quantitative results (Table) show generally positive experience across patient and care team respondents. Over 90% were satisfied with all measures of communication. Care teams had high satisfaction with admissions processes and reported telemedicine improved cross-coverage. Patient-reported technology experience was positive but was less positive from the care team perspective. Care teams reported lower absolute quality of care than did patients but were more likely to perceive telemedicine as high quality, compared with traditional care. Most patients, clinicians, and nurses would recommend telemedicine.
Qualitatively, four major themes were identified in open-ended responses with high interrater reliability (PABAK ranging from 0.92 to 0.98 in patient responses and 0.88 to 0.95 in care team responses) and aligned with the quantitative survey constructs: clinician-nurse communication, clinician-patient communication, workflow integration, and telemedicine technology. Patients reported satisfaction with communication with remote clinicians:
“[The clinician] was extremely attentive to me and what was going on. She was articulate and clear. I understood what was going to happen.” –Patient
Care teams suggested concrete improvement opportunities:
“I’d prefer to have some time with nursing staff both before and (sometimes) after the patient encounter.” –Clinician
“Since we cannot hear what [the clinicians] are hearing with the stethoscope, it’s nice when they tell us when to move it to the next spot.” –Nurse
Clinicians and nurses gave favorable responses regarding workflow integration, though time (both admissions wait time and session duration) was a reported opportunity:
“It would be helpful if we could speed up the time from admit request to screen time.” –Clinician
“When the [clinicians] get swamped, they’re hard to get a hold of, and admissions can take a long time. They may have too much on their plates dealing with several locations.” –Nurse
Technology issues—internet connection, stethoscope, sound, and screen or camera—were mentioned by patients and care teams, though technology was reviewed favorably overall by most patients:
“I was fascinated by the technology. Visiting someone over a television was impressive. ... The picture, the sound clarity, and the connection itself was flawless.” –Patient
Some patients commented that telemedicine was the best option given the situation, but still preferred an in-person doctor:
“If a doctor wasn’t available, telemedicine is better than nothing.” –Patient
Nurses who would not recommend telemedicine noted the need for personal connection:
“[I] still prefer [an] in-person MD for more personal contact. The older patients often state they wish the doctor would come and see them.” –Nurse
Patients who would not recommend telemedicine also desired personal connection:
“I would sooner talk to a person than a machine.” –Patient
A few clinicians noted the connection with patients would be improved if they knew about others in the room:
“It’d be nice if everyone in the room was introduced. Sometimes people are sitting out of view of the camera and I don’t realize they’re there until later.” –Clinician
CONCLUSION
These results make important contributions to understanding and improving the telemedicine experience in rural emergency hospital medicine. While the predominantly white patient respondent population limits generalizability, these demographics are representative of the overall population of the participating hospitals. A strength of this evaluation is its contemporaneous consideration of patient and care team experience with both quantitative and rich, qualitative analysis. Patients and care teams alike thought overnight telemedicine was better than the status quo. While our quality of care findings align with some previous literature,13 care teams in the current analysis overwhelmingly would recommend telemedicine, whereas some clinicians in prior work would not recommend telemedicine.14
In terms of communication, in line with existing literature, some patients still preferred in-person visits,15 a view also shared by some care team members. Workflow and technology barriers were raised, corroborating existing work,13 but actionable solutions (eg, adding care team–only time before visits or verbalizing when to move stethoscopes) were also identified.
Embedding patient and care team experience surveys and sharing results is critical in advancing telemedicine. Findings from this evaluation strengthen the case for payer reimbursement of telemedicine in rural acute care. Continued work to improve, test, and publish findings on patient and care team experience with telemedicine is critical to providing quality services in often-underserved communities.
Acknowledgments
The authors would like to acknowledge the contributions of Ann Werner in identifying the patient survey sample, Brian Barklind in identifying source data for the analysis, and both Brian Barklind and Rachael Rivard for conducting the analyses and summarizing results. We would also like to thank Kelly Logue for her involvement in conceptualizing the telemedicine evaluation described here, as well as Larisa Polynskaya for her help preparing the manuscript for publication, and the care teams and patients who provided valuable input.
Healthcare delivery in rural America faces unique, growing challenges related to health and emergency care access.1 Telemedicine approaches have the potential to increase rural hospitals’ ability to deliver efficient emergency care and reduce clinician shortages.2 While initial evidence of telemedicine success exists, more quality research is needed to understand telemedicine patient and care team experiences,3 especially with real-time, clinician-initiated video conferencing in critical access hospital (CAH) emergency departments (ED). Some experience studies exist,4 but results are primarily quantitative5 and lack the nuanced qualitative depth needed to understand topics such as satisfaction and communication.6 Additionally, few explore combined patient and care team perspectives.5 The lack of breadth and depth makes it difficult to provide actionable recommendations for improvements and affects the feasibility of continuing this work and improving telemedicine care quality. To address these gaps, we evaluated a real-time, clinician-initiated video conferencing program with overnight clinicians servicing ED patients in three Midwestern care system CAHs. This evaluation assessed patient and care team (nurse and clinician) experience with telemedicine using quantitative and qualitative survey data analysis.
METHODS
Because this evaluation was designed to measure and improve program quality in a single healthcare system, it was deemed non-human subjects research by the organization’s institutional review board. This brief report follows telemedicine reporting guidelines.7
Setting and Telemedicine Program
This program, designed to reduce the need for on-call hospitalist clinicians to be onsite at CAHs overnight, was implemented in a large Midwestern nonprofit integrated healthcare system with three rural CAHs (combined capacity for 75 inpatient admissions, with full-time onsite ED clinicians and nurses, as well as on-call hospitalist clinicians) and a large metropolitan tertiary-care hospital. All adult patients presenting to CAH EDs between 6
Following a pilot period, the full-scale program was implemented in September 2017 and included 14 remote clinicians and 60 onsite nurses.
Survey Administration and Design
A postimplementation survey was designed to explore patient and care team experience with telemedicine. Patients who received a telemedicine visit between September 2017 and April 2018 were mailed a paper survey. Nonresponders were called by professional interviewers affiliated with the healthcare system. All participating clinicians (N = 14, all MDs) and nurses (N = 60, all RNs) were emailed an online care team survey with phone-in option. Care team nonresponders were sent up to two reminder emails.
Surveys captured the following five constructs: communication, workflow integration, telemedicine technology, quality of care, and general satisfaction. Existing questionnaires were used where possible; additional items were designed with clinical experts following survey design best practices.8 Patient-perceived communication was assessed via three Consumer Assessment of Healthcare Providers and Systems Outpatient and Ambulatory Surgery Survey items.9 Five additional program-developed patient survey items included satisfaction with clinician-nurse communication, satisfaction with technology, telemedicine quality of care overall and in comparison with traditional care, and whether or not patients would recommend telemedicine (Table). Four open-ended questions asked patients about improvement opportunities and general satisfaction.
Care team surveys included two items regarding ability to effectively communicate, two about satisfaction with workflow integration, one about technical problems, two about quality of care, and one about general satisfaction. Open-ended questions gathered further information and recommendations to improve communication, workflow integration, technology issues, and general satisfaction.
Analysis
Closed-ended items were dichotomized (satisfied yes/no); descriptive statistics (frequencies/percents) are presented to quantify patient and care team experience. Quantitative analyses were conducted in SAS software version 9.4 (SAS Institute, Cary, North Carolina). Open-ended responses were coded separately for patient and care team experience, following qualitative content analysis best practices.10 A lead coder read all responses, created a coding framework of identified themes, and coded individual responses. A second coder independently coded responses using the same framework. Interrater reliability was calculated for each major theme using percent agreement and prevalence- and bias-adjusted
RESULTS
Of eligible patients mailed a survey (N = 408), 3% self-reported as ineligible, and 54% completed the survey. This is a maximum response rate (response rate 6) according to the American Association for Public Opinion Research.12 Patients were 67 years old on average (SD = 15), they were primarily white (97%), and 54% were female. All clinicians and 63% of nurses completed the survey.12 Clinicians and nurses were 29% and 95% female, respectively.
Quantitative results (Table) show generally positive experience across patient and care team respondents. Over 90% were satisfied with all measures of communication. Care teams had high satisfaction with admissions processes and reported telemedicine improved cross-coverage. Patient-reported technology experience was positive but was less positive from the care team perspective. Care teams reported lower absolute quality of care than did patients but were more likely to perceive telemedicine as high quality, compared with traditional care. Most patients, clinicians, and nurses would recommend telemedicine.
Qualitatively, four major themes were identified in open-ended responses with high interrater reliability (PABAK ranging from 0.92 to 0.98 in patient responses and 0.88 to 0.95 in care team responses) and aligned with the quantitative survey constructs: clinician-nurse communication, clinician-patient communication, workflow integration, and telemedicine technology. Patients reported satisfaction with communication with remote clinicians:
“[The clinician] was extremely attentive to me and what was going on. She was articulate and clear. I understood what was going to happen.” –Patient
Care teams suggested concrete improvement opportunities:
“I’d prefer to have some time with nursing staff both before and (sometimes) after the patient encounter.” –Clinician
“Since we cannot hear what [the clinicians] are hearing with the stethoscope, it’s nice when they tell us when to move it to the next spot.” –Nurse
Clinicians and nurses gave favorable responses regarding workflow integration, though time (both admissions wait time and session duration) was a reported opportunity:
“It would be helpful if we could speed up the time from admit request to screen time.” –Clinician
“When the [clinicians] get swamped, they’re hard to get a hold of, and admissions can take a long time. They may have too much on their plates dealing with several locations.” –Nurse
Technology issues—internet connection, stethoscope, sound, and screen or camera—were mentioned by patients and care teams, though technology was reviewed favorably overall by most patients:
“I was fascinated by the technology. Visiting someone over a television was impressive. ... The picture, the sound clarity, and the connection itself was flawless.” –Patient
Some patients commented that telemedicine was the best option given the situation, but still preferred an in-person doctor:
“If a doctor wasn’t available, telemedicine is better than nothing.” –Patient
Nurses who would not recommend telemedicine noted the need for personal connection:
“[I] still prefer [an] in-person MD for more personal contact. The older patients often state they wish the doctor would come and see them.” –Nurse
Patients who would not recommend telemedicine also desired personal connection:
“I would sooner talk to a person than a machine.” –Patient
A few clinicians noted the connection with patients would be improved if they knew about others in the room:
“It’d be nice if everyone in the room was introduced. Sometimes people are sitting out of view of the camera and I don’t realize they’re there until later.” –Clinician
CONCLUSION
These results make important contributions to understanding and improving the telemedicine experience in rural emergency hospital medicine. While the predominantly white patient respondent population limits generalizability, these demographics are representative of the overall population of the participating hospitals. A strength of this evaluation is its contemporaneous consideration of patient and care team experience with both quantitative and rich, qualitative analysis. Patients and care teams alike thought overnight telemedicine was better than the status quo. While our quality of care findings align with some previous literature,13 care teams in the current analysis overwhelmingly would recommend telemedicine, whereas some clinicians in prior work would not recommend telemedicine.14
In terms of communication, in line with existing literature, some patients still preferred in-person visits,15 a view also shared by some care team members. Workflow and technology barriers were raised, corroborating existing work,13 but actionable solutions (eg, adding care team–only time before visits or verbalizing when to move stethoscopes) were also identified.
Embedding patient and care team experience surveys and sharing results is critical in advancing telemedicine. Findings from this evaluation strengthen the case for payer reimbursement of telemedicine in rural acute care. Continued work to improve, test, and publish findings on patient and care team experience with telemedicine is critical to providing quality services in often-underserved communities.
Acknowledgments
The authors would like to acknowledge the contributions of Ann Werner in identifying the patient survey sample, Brian Barklind in identifying source data for the analysis, and both Brian Barklind and Rachael Rivard for conducting the analyses and summarizing results. We would also like to thank Kelly Logue for her involvement in conceptualizing the telemedicine evaluation described here, as well as Larisa Polynskaya for her help preparing the manuscript for publication, and the care teams and patients who provided valuable input.
1. Nelson R. Will rural community hospitals survive? Am J Nurs. 2017;117(9):18-19. https://doi.org/10.1097/01.NAJ.0000524538.11040.7f.
2. Ward MM, Merchant KAS, Carter KD, et al. Use of telemedicine for ED physician coverage in critical access hospitals increased after CMS policy clarification. Health Aff. 2018;37(12):2037-2044. https://doi.org/10.1377/hlthaff.2018.05103.
3. AlDossary S, Martin-Khan MG, Bradford NK, Smith AC. A systematic review of the methodologies used to evaluate telemedicine service initiatives in hospital facilities. Int J Med Inf. 2017;97:171-194. https://doi.org/10.1016/j.ijmedinf.2016.10.012.
4. Kuperman EF, Linson EL, Klefstad K, Perry E, Glenn K. The virtual hospitalist: a single-site implementation bringing hospitalist coverage to critical access hospitals. J Hosp Med. 2018;13(11):759-763. https://doi.org/10.12788/jhm.3061.
5. Garcia R, Adelakun OA. A review of patient and provider satisfaction with telemedicine. Paper presented at: Twenty-third Americas Conference on Information Systems; 2017; Boston, Massachusetts.
6. Mair F, Whitten P. Systematic review of studies of patient satisfaction with telemedicine. BMJ. 2000;320(7248):1517-1520. https://doi.org/10.1136/bmj.320.7248.1517.
7. Khanal S, Burgon J, Leonard S, Griffiths M, Eddowes LA. Recommendations for the improved effectiveness and reporting of telemedicine programs in developing countries: results of a systematic literature review. Telemed E Health. 2015;21(11):903-915. https://doi.org/10.1089/tmj.2014.0194.
8. Fowler Jr FJ. Improving survey questions: Design and evaluation. Vol 38. Thousand Oaks, California: Sage Publications, Inc.; 1995.
9. Agency for Healthcare Research and Quality. CAHPS Outpatient and Ambulatory Surgery Survey. https://www.ahrq.gov/cahps/surveys-guidance/oas/index.html. Accessed August 1, 2017.
10. Ulin PR, Robinson ET, Tolley EE. Qualitative methods in public health: A field guide for applied research. Hoboken, New Jersey: John Wiley & Sons; 2005.
11. Corden A, Sainsbury R. Using verbatim quotations in reporting qualitative social research: researches’ views. York, United Kingdom: University of York; 2006.
12. American Association for Public Opinion Research. Standard Definitions: Final Dispositions of Case Codes and Outcome Rates for Surveys. 2016. https://www.aapor.org/AAPOR_Main/media/publications/Standard-Definitions20169theditionfinal.pdf. Accessed August 1, 2019.
13. Mueller KJ, Potter AJ, MacKinney AC, Ward MM. Lessons from tele-emergency: improving care quality and health outcomes by expanding support for rural care systems. Health Aff. 2014;33(2):228-234. https://doi.org/10.1377/hlthaff.2013.1016.
14. Fairchild R, Kuo SFF, Laws S, O’Brien A, Rahmouni H. Perceptions of rural emergency department providers regarding telehealth-based care: perceived competency, satisfaction with care and Tele-ED patient disposition. Open J Nurs. 2017;7(07):721. https://doi.org/10.4236/ojn.2017.77054.
15. Weatherburn G, Dowie R, Mistry H, Young T. An assessment of parental satisfaction with mode of delivery of specialist advice for paediatric cardiology: face-to-face versus videoconference. J Telemed Telecare. 2006;12(suppl 1):57-59. https://doi.org/10.1258/135763306777978560.
1. Nelson R. Will rural community hospitals survive? Am J Nurs. 2017;117(9):18-19. https://doi.org/10.1097/01.NAJ.0000524538.11040.7f.
2. Ward MM, Merchant KAS, Carter KD, et al. Use of telemedicine for ED physician coverage in critical access hospitals increased after CMS policy clarification. Health Aff. 2018;37(12):2037-2044. https://doi.org/10.1377/hlthaff.2018.05103.
3. AlDossary S, Martin-Khan MG, Bradford NK, Smith AC. A systematic review of the methodologies used to evaluate telemedicine service initiatives in hospital facilities. Int J Med Inf. 2017;97:171-194. https://doi.org/10.1016/j.ijmedinf.2016.10.012.
4. Kuperman EF, Linson EL, Klefstad K, Perry E, Glenn K. The virtual hospitalist: a single-site implementation bringing hospitalist coverage to critical access hospitals. J Hosp Med. 2018;13(11):759-763. https://doi.org/10.12788/jhm.3061.
5. Garcia R, Adelakun OA. A review of patient and provider satisfaction with telemedicine. Paper presented at: Twenty-third Americas Conference on Information Systems; 2017; Boston, Massachusetts.
6. Mair F, Whitten P. Systematic review of studies of patient satisfaction with telemedicine. BMJ. 2000;320(7248):1517-1520. https://doi.org/10.1136/bmj.320.7248.1517.
7. Khanal S, Burgon J, Leonard S, Griffiths M, Eddowes LA. Recommendations for the improved effectiveness and reporting of telemedicine programs in developing countries: results of a systematic literature review. Telemed E Health. 2015;21(11):903-915. https://doi.org/10.1089/tmj.2014.0194.
8. Fowler Jr FJ. Improving survey questions: Design and evaluation. Vol 38. Thousand Oaks, California: Sage Publications, Inc.; 1995.
9. Agency for Healthcare Research and Quality. CAHPS Outpatient and Ambulatory Surgery Survey. https://www.ahrq.gov/cahps/surveys-guidance/oas/index.html. Accessed August 1, 2017.
10. Ulin PR, Robinson ET, Tolley EE. Qualitative methods in public health: A field guide for applied research. Hoboken, New Jersey: John Wiley & Sons; 2005.
11. Corden A, Sainsbury R. Using verbatim quotations in reporting qualitative social research: researches’ views. York, United Kingdom: University of York; 2006.
12. American Association for Public Opinion Research. Standard Definitions: Final Dispositions of Case Codes and Outcome Rates for Surveys. 2016. https://www.aapor.org/AAPOR_Main/media/publications/Standard-Definitions20169theditionfinal.pdf. Accessed August 1, 2019.
13. Mueller KJ, Potter AJ, MacKinney AC, Ward MM. Lessons from tele-emergency: improving care quality and health outcomes by expanding support for rural care systems. Health Aff. 2014;33(2):228-234. https://doi.org/10.1377/hlthaff.2013.1016.
14. Fairchild R, Kuo SFF, Laws S, O’Brien A, Rahmouni H. Perceptions of rural emergency department providers regarding telehealth-based care: perceived competency, satisfaction with care and Tele-ED patient disposition. Open J Nurs. 2017;7(07):721. https://doi.org/10.4236/ojn.2017.77054.
15. Weatherburn G, Dowie R, Mistry H, Young T. An assessment of parental satisfaction with mode of delivery of specialist advice for paediatric cardiology: face-to-face versus videoconference. J Telemed Telecare. 2006;12(suppl 1):57-59. https://doi.org/10.1258/135763306777978560.
© 2020 Society of Hospital Medicine
Melatonin Increasingly Used in Hospitalized Patients
Sleep disturbance is common in hospitals, and both the quality and quantity of sleep are negatively affected in hospitalized patients.1 Sleep disturbances in hospitals are associated with hyperglycemia,2 delirium,3 lower patient satisfaction,4 and increased risk of readmission.5
A significant proportion of hospitalized patients receive sleep medications (ie, hypnotic medication) despite limited evidence.6,7 Sleep medications have adverse effects including falls, fractures, cognitive impairment, and delirium.8 Commonly used nonbenzodiazepine sleep medications (eg, zopiclone) are perceived as safer but may have similar risks.9
Melatonin is increasingly used to treat insomnia, although evidence for its efficacy and safety is lacking.10 While melatonin use doubled between 2007 and 2012 in the United States,11 previous hospital-based studies have not included melatonin.7 It is not known if increased melatonin use in the hospital mitigates use of higher-risk medications. Melatonin preparations can also have quality issues, including deviations from labelled dosage and contamination with compounds such as serotonin,12 and patients continuing melatonin after discharge could have adverse effects if switched to different preparations.
In this study, we aimed to determine temporal trends in melatonin use in hospitalized patients, and compare them with trends in use of other sleep medications.
METHODS
We conducted the study at two urban academic hospitals with a total of 706 acute care beds in the same network in Toronto, Canada. This study was approved by the University Health Network’s research ethics board.
We abstracted pharmacy dispensing data on melatonin, zopiclone, and lorazepam from January 1, 2013, to December 31, 2018. We included oral medications dispensed to inpatient units or admitted patients in the emergency department (ED). Zopiclone is the most commonly used nonbenzodiazepine sleep medication in Canada.13 Lorazepam is the most commonly used benzodiazepine at our institution (97% of all oral benzodiazepine doses). While lorazepam is prescribed for many nonsleep indications, we included it to assess the impact of melatonin. We did not include antipsychotics or trazodone, which are rarely newly initiated for insomnia at our institution.
We abstracted the monthly number of doses dispensed by unit and hospital. We categorized units based on the primary patient population as either internal medicine, critical care, or other. Admitted patients in the ED were counted as “other” regardless of service. As the focus of our study was on internal medicine and critical care, we did not analyze by type of unit in the “other” group, which is heterogeneous.
Each medication-dispensing event was counted as one dose, regardless of the number or strength of tablets (eg, a patient dispensed two 3-mg tablets of melatonin, for a total of 6 mg, would be counted as a single dose). Most unused doses are credited back (ie, if a medication was refused and returned to pharmacy, it was not counted). Lorazepam and zopiclone are on hospital formulary, while melatonin is not. To order melatonin, clinicians must select “Nonformulary medication” in the electronic health record and manually enter medication name, dose, route, and frequency, as well as select a justification for use. The hospital supplies nonformulary medications such as melatonin to patients.
To account for changes in patient volumes, we standardized medication dispensing rates per 1,000 inpatient days. We discovered rare instances in which the monthly number of doses was a negative number because of pharmacy inventory accounting. This issue affected only 0.13% of observations and the magnitude was small (8 doses or fewer); in these cases, we assumed the number of doses was zero.
We used line charts to visualize changes in medication dispensing over time by medication and hospital. We compared rates of medications use between unit type and hospital with use of relative difference and rate difference. Statistical analysis was performed with R (The R Foundation for Statistical Computing, 2018) using lubridate (2011), dplyr (2018), ggplot2 (2016), fmsb (2019), and forcats (2018).
RESULTS
A total of 1,542,225 inpatient days were analyzed, of which 60.4% were at hospital A. Internal medicine accounted for 23.5% of inpatient days, critical care for 11.7%, and other units for 64.8%.
Overall Trends in Sleep Medication Use
There were 351,131 dispensed doses of study medications (13% melatonin, 43% lorazepam, and 44% zopiclone). Overall use of the three study medications per 1,000 inpatient days increased by 25.7% during the study.
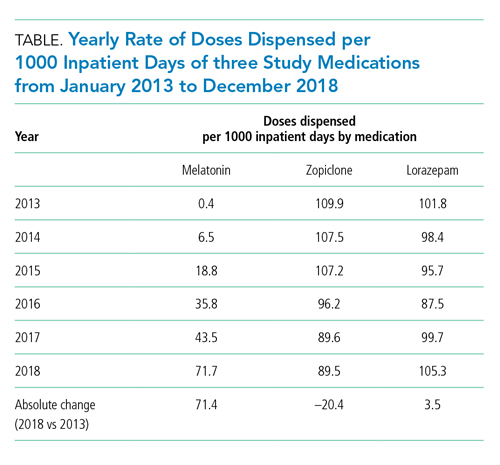
Melatonin use increased by 71.3 doses per 1,000 inpatient days during 2013-2018, while zopiclone use decreased by 20.4 doses per 1,000 inpatient days (Table). Lorazepam use increased slightly by 3.5 doses per 1,000 inpatient days. All rate differences reported in the results are statistically significant (Appendix Table).
Unit Type Comparison
Melatonin use was highest in critical care and internal medicine (50.9 and 48.4 doses per 1,000 inpatient days, respectively), compared with that in other units (19.3 doses per 1,000 inpatient days). Among critical care units, melatonin use was highest in medical-surgical units (67.4 doses per 1,000 inpatient days) and lower in cardiac and cardiovascular surgery units (24.6 and 18.3 doses per 1,000 inpatient days respectively). Zopiclone use was highest in critical care and other units (117.9 and 112.2 doses per 1,000 inpatient days, respectively) and lowest in internal medicine (57.0 doses per 1,000 inpatient days).
Hospital Site Comparison
Overall melatonin use was 65.4% higher at hospital B than at hospital A (42.4 vs 21.5 doses per 1,000 inpatient days; Figure). Zopiclone use was 81.7% lower at hospital B (54.6 vs 130.0 doses per 1,000 inpatient days).
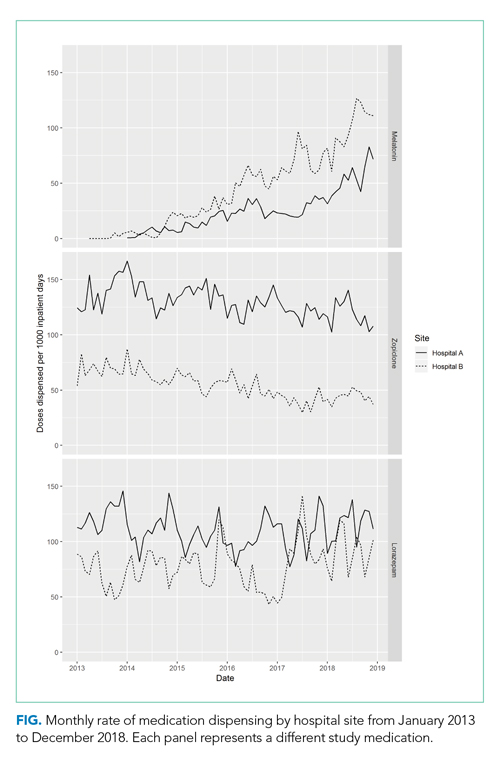
When similar units were compared between hospitals, the trends were similar. For example, among internal medicine units, melatonin use was 66.7% higher at hospital B than at hospital A (64.4 vs 32.3 doses per 1,000 inpatient days).
DISCUSSION
During this 6-year study period of sleep medication use at two academic hospitals, overall use of melatonin, zopiclone, and lorazepam increased by 25.7%. Melatonin increased from almost no use to more than 70 doses per 1,000 inpatient days. The increase in melatonin was not accompanied by a proportional decline in zopiclone, which only decreased by 20.4 doses per 1,000 inpatient days. Lorazepam use increased slightly. This suggests that melatonin is not simply being substituted for higher-risk sleep medications and is instead being given to patients who might not have received sleep medications otherwise.
There are a few potential explanations for the disproportionate increase in melatonin. Providers may be more liberal in prescribing melatonin for insomnia because of perceived greater safety, compared with other medications. Melatonin may also be prescribed for delirium, despite a lack of high-quality evidence.14 Interestingly, melatonin use has increased despite a paucity of evidence for its efficacy or safety in hospital.6 Considering the additional barriers that exist to ordering melatonin, a nonformulary medication at our institution, the magnitude of increase is even more striking.
Melatonin use was highest on internal medicine and critical care units. This may reflect patient differences (eg, older patients with more comorbid conditions might leave prescribers reluctant to use benzodiazepines), differences in the physical environment (eg, noise/lighting), differences in nursing practices (eg, intensity of monitoring or medication administration), or differences in prescribing.
Melatonin use was almost twice as high at hospital B as it was at hospital A. While the services differ at each hospital, the results were similar when comparing the same unit type (eg, internal medicine). Internal medicine units have similar (though not identical) patient populations and team structures at both hospitals, and residents rotate between hospitals. Attendings and nurses are based primarily at one hospital and their practice patterns might differ. Geriatricians have a stronger presence at hospital B. Higher zopiclone use at hospital A could explain lower melatonin use. Lastly, improvement initiatives may have contributed (eg, one unit at hospital B promoted melatonin in 2017).
LIMITATIONS
Our study has potential limitations. We studied dispensed rather than administered medications; however, numbers of doses dispensed but not administered are expected to be low because most unused doses are accounted for. By studying dispensing data, we might have underestimated the number of prescriptions (eg, if a patient was prescribed but refused a medication, this would not be captured). Our study did not examine medications after hospital discharge, although medications started in a hospital are often continued at discharge.7,15 Our study could not determine indications for medication prescribing, and melatonin and lorazepam are both used for nonsleep indications. Our study could not differentiate between continuation of home medications and new prescriptions. Finally, the results may not be generalizable to other settings.
CONCLUSION
In this 6-year study of sleep medication use at two academic hospitals, we found that overall use of melatonin, zopiclone, and lorazepam increased by 25%, predominantly because of markedly increased melatonin use. Given the current lack of high-quality evidence, further research on the use of melatonin in hospitalized patients is needed.
1. Wesselius HM, van den Ende ES, Alsma J, et al. Quality and quantity of sleep and factors associated with sleep disturbance in hospitalized patients. JAMA Intern Med. 2018;178(9):1201-1208. https://doi.org/10.1001/jamainternmed.2018.2669.
2. DePietro RH, Knutson KL, Spampinato L, et al. Association between inpatient sleep loss and hyperglycemia of hospitalization. Diabetes Care. 2017;40(2):188-193. https://doi.org/10.2337/dc16-1683.
3. Inouye SK, Bogardus ST Jr, Charpentier PA, et al. A multicomponent intervention to prevent delirium in hospitalized older patients. N Engl J Med. 1999;340(9):669-676. https://doi.org/10.1056/NEJM199903043400901.
4. Ho A, Raja B, Waldhorn R, Baez V, Mohammed I. New onset of insomnia in hospitalized patients in general medical wards: incidence, causes, and resolution rate. J Community Hosp Intern Med Perspect. 2017;7(5):309-313. https://doi.org/10.1080/20009666.2017.1374108.
5. Rawal S, Kwan JL, Razak F, et al. Association of the trauma of hospitalization with 30-day readmission or emergency department visit. JAMA Intern Med. 2019;179(1):38-45. https://doi.org/10.1001/jamainternmed.2018.5100.
6. Kanji S, Mera A, Hutton B, et al. Pharmacological interventions to improve sleep in hospitalised adults: a systematic review. BMJ Open. 2016;6(7):e012108. https://doi.org/10.1136/bmjopen-2016-012108.
7. Gillis CM, Poyant JO, Degrado JR, Ye L, Anger KE, Owens RL. Inpatient pharmacological sleep aid utilization is common at a tertiary medical center. J Hosp Med. 2014;9(10):652-657. https://doi.org/10.1002/jhm.2246.
8. Schroeck JL, Ford J, Conway EL, et al. Review of safety and efficacy of sleep medicines in older adults. Clin Ther. 2016;38(11):2340-2372. https://doi.org/10.1016/j.clinthera.2016.09.010.
9. Kolla BP, Lovely JK, Mansukhani MP, Morgenthaler TI. Zolpidem is independently associated with increased risk of inpatient falls. J Hosp Med. 2013;8(1):1-6. https://doi.org/10.1002/jhm.1985.
10. Buscemi N, Vandermeer B, Hooton N, et al. The efficacy and safety of exogenous melatonin for primary sleep disorders. a meta-analysis. J Gen Intern Med. 2005;20(12):1151-1158. doi:10.1111/j.1525-1497.2005.0243.x.
11. Clarke TC, Black LI, Stussman BJ, Barnes PM, Nahin RL. Trends in the use of complementary health approaches among adults: United States, 2002-2012. Natl Health Stat Report. 2015(79):1-16.
12. Erland LA, Saxena PK. Melatonin natural health products and supplements: presence of serotonin and significant variability of melatonin content. J Clin Sleep Med. 2017;13(2):275-281. https://doi.com/10.5664/jcsm.6462.
13. Brandt J, Alessi-Severini S, Singer A, Leong C. Novel measures of benzodiazepine and z-drug utilisation trends in a canadian provincial adult population (2001-2016). J Popul Ther Clin Pharmacol. 2019;26(1):e22-e38. https://doi.org/10.22374/1710-6222.26.1.3.
14. Siddiqi N, Harrison JK, Clegg A, et al. Interventions for preventing delirium in hospitalised non-ICU patients. Cochrane Database Syst Rev. 2016;3:CD005563. https://doi.org/10.1002/14651858.CD005563.pub3.
15. MacMillan TE, Kamali R, Cavalcanti RB. Missed opportunity to deprescribe: docusate for constipation in medical inpatients. Am J Med. 2016;129(9):1001.e1001-1007. https://doi.org/10.1016/j.amjmed.2016.04.008.
Sleep disturbance is common in hospitals, and both the quality and quantity of sleep are negatively affected in hospitalized patients.1 Sleep disturbances in hospitals are associated with hyperglycemia,2 delirium,3 lower patient satisfaction,4 and increased risk of readmission.5
A significant proportion of hospitalized patients receive sleep medications (ie, hypnotic medication) despite limited evidence.6,7 Sleep medications have adverse effects including falls, fractures, cognitive impairment, and delirium.8 Commonly used nonbenzodiazepine sleep medications (eg, zopiclone) are perceived as safer but may have similar risks.9
Melatonin is increasingly used to treat insomnia, although evidence for its efficacy and safety is lacking.10 While melatonin use doubled between 2007 and 2012 in the United States,11 previous hospital-based studies have not included melatonin.7 It is not known if increased melatonin use in the hospital mitigates use of higher-risk medications. Melatonin preparations can also have quality issues, including deviations from labelled dosage and contamination with compounds such as serotonin,12 and patients continuing melatonin after discharge could have adverse effects if switched to different preparations.
In this study, we aimed to determine temporal trends in melatonin use in hospitalized patients, and compare them with trends in use of other sleep medications.
METHODS
We conducted the study at two urban academic hospitals with a total of 706 acute care beds in the same network in Toronto, Canada. This study was approved by the University Health Network’s research ethics board.
We abstracted pharmacy dispensing data on melatonin, zopiclone, and lorazepam from January 1, 2013, to December 31, 2018. We included oral medications dispensed to inpatient units or admitted patients in the emergency department (ED). Zopiclone is the most commonly used nonbenzodiazepine sleep medication in Canada.13 Lorazepam is the most commonly used benzodiazepine at our institution (97% of all oral benzodiazepine doses). While lorazepam is prescribed for many nonsleep indications, we included it to assess the impact of melatonin. We did not include antipsychotics or trazodone, which are rarely newly initiated for insomnia at our institution.
We abstracted the monthly number of doses dispensed by unit and hospital. We categorized units based on the primary patient population as either internal medicine, critical care, or other. Admitted patients in the ED were counted as “other” regardless of service. As the focus of our study was on internal medicine and critical care, we did not analyze by type of unit in the “other” group, which is heterogeneous.
Each medication-dispensing event was counted as one dose, regardless of the number or strength of tablets (eg, a patient dispensed two 3-mg tablets of melatonin, for a total of 6 mg, would be counted as a single dose). Most unused doses are credited back (ie, if a medication was refused and returned to pharmacy, it was not counted). Lorazepam and zopiclone are on hospital formulary, while melatonin is not. To order melatonin, clinicians must select “Nonformulary medication” in the electronic health record and manually enter medication name, dose, route, and frequency, as well as select a justification for use. The hospital supplies nonformulary medications such as melatonin to patients.
To account for changes in patient volumes, we standardized medication dispensing rates per 1,000 inpatient days. We discovered rare instances in which the monthly number of doses was a negative number because of pharmacy inventory accounting. This issue affected only 0.13% of observations and the magnitude was small (8 doses or fewer); in these cases, we assumed the number of doses was zero.
We used line charts to visualize changes in medication dispensing over time by medication and hospital. We compared rates of medications use between unit type and hospital with use of relative difference and rate difference. Statistical analysis was performed with R (The R Foundation for Statistical Computing, 2018) using lubridate (2011), dplyr (2018), ggplot2 (2016), fmsb (2019), and forcats (2018).
RESULTS
A total of 1,542,225 inpatient days were analyzed, of which 60.4% were at hospital A. Internal medicine accounted for 23.5% of inpatient days, critical care for 11.7%, and other units for 64.8%.
Overall Trends in Sleep Medication Use
There were 351,131 dispensed doses of study medications (13% melatonin, 43% lorazepam, and 44% zopiclone). Overall use of the three study medications per 1,000 inpatient days increased by 25.7% during the study.
Melatonin use increased by 71.3 doses per 1,000 inpatient days during 2013-2018, while zopiclone use decreased by 20.4 doses per 1,000 inpatient days (Table). Lorazepam use increased slightly by 3.5 doses per 1,000 inpatient days. All rate differences reported in the results are statistically significant (Appendix Table).
Unit Type Comparison
Melatonin use was highest in critical care and internal medicine (50.9 and 48.4 doses per 1,000 inpatient days, respectively), compared with that in other units (19.3 doses per 1,000 inpatient days). Among critical care units, melatonin use was highest in medical-surgical units (67.4 doses per 1,000 inpatient days) and lower in cardiac and cardiovascular surgery units (24.6 and 18.3 doses per 1,000 inpatient days respectively). Zopiclone use was highest in critical care and other units (117.9 and 112.2 doses per 1,000 inpatient days, respectively) and lowest in internal medicine (57.0 doses per 1,000 inpatient days).
Hospital Site Comparison
Overall melatonin use was 65.4% higher at hospital B than at hospital A (42.4 vs 21.5 doses per 1,000 inpatient days; Figure). Zopiclone use was 81.7% lower at hospital B (54.6 vs 130.0 doses per 1,000 inpatient days).
When similar units were compared between hospitals, the trends were similar. For example, among internal medicine units, melatonin use was 66.7% higher at hospital B than at hospital A (64.4 vs 32.3 doses per 1,000 inpatient days).
DISCUSSION
During this 6-year study period of sleep medication use at two academic hospitals, overall use of melatonin, zopiclone, and lorazepam increased by 25.7%. Melatonin increased from almost no use to more than 70 doses per 1,000 inpatient days. The increase in melatonin was not accompanied by a proportional decline in zopiclone, which only decreased by 20.4 doses per 1,000 inpatient days. Lorazepam use increased slightly. This suggests that melatonin is not simply being substituted for higher-risk sleep medications and is instead being given to patients who might not have received sleep medications otherwise.
There are a few potential explanations for the disproportionate increase in melatonin. Providers may be more liberal in prescribing melatonin for insomnia because of perceived greater safety, compared with other medications. Melatonin may also be prescribed for delirium, despite a lack of high-quality evidence.14 Interestingly, melatonin use has increased despite a paucity of evidence for its efficacy or safety in hospital.6 Considering the additional barriers that exist to ordering melatonin, a nonformulary medication at our institution, the magnitude of increase is even more striking.
Melatonin use was highest on internal medicine and critical care units. This may reflect patient differences (eg, older patients with more comorbid conditions might leave prescribers reluctant to use benzodiazepines), differences in the physical environment (eg, noise/lighting), differences in nursing practices (eg, intensity of monitoring or medication administration), or differences in prescribing.
Melatonin use was almost twice as high at hospital B as it was at hospital A. While the services differ at each hospital, the results were similar when comparing the same unit type (eg, internal medicine). Internal medicine units have similar (though not identical) patient populations and team structures at both hospitals, and residents rotate between hospitals. Attendings and nurses are based primarily at one hospital and their practice patterns might differ. Geriatricians have a stronger presence at hospital B. Higher zopiclone use at hospital A could explain lower melatonin use. Lastly, improvement initiatives may have contributed (eg, one unit at hospital B promoted melatonin in 2017).
LIMITATIONS
Our study has potential limitations. We studied dispensed rather than administered medications; however, numbers of doses dispensed but not administered are expected to be low because most unused doses are accounted for. By studying dispensing data, we might have underestimated the number of prescriptions (eg, if a patient was prescribed but refused a medication, this would not be captured). Our study did not examine medications after hospital discharge, although medications started in a hospital are often continued at discharge.7,15 Our study could not determine indications for medication prescribing, and melatonin and lorazepam are both used for nonsleep indications. Our study could not differentiate between continuation of home medications and new prescriptions. Finally, the results may not be generalizable to other settings.
CONCLUSION
In this 6-year study of sleep medication use at two academic hospitals, we found that overall use of melatonin, zopiclone, and lorazepam increased by 25%, predominantly because of markedly increased melatonin use. Given the current lack of high-quality evidence, further research on the use of melatonin in hospitalized patients is needed.
Sleep disturbance is common in hospitals, and both the quality and quantity of sleep are negatively affected in hospitalized patients.1 Sleep disturbances in hospitals are associated with hyperglycemia,2 delirium,3 lower patient satisfaction,4 and increased risk of readmission.5
A significant proportion of hospitalized patients receive sleep medications (ie, hypnotic medication) despite limited evidence.6,7 Sleep medications have adverse effects including falls, fractures, cognitive impairment, and delirium.8 Commonly used nonbenzodiazepine sleep medications (eg, zopiclone) are perceived as safer but may have similar risks.9
Melatonin is increasingly used to treat insomnia, although evidence for its efficacy and safety is lacking.10 While melatonin use doubled between 2007 and 2012 in the United States,11 previous hospital-based studies have not included melatonin.7 It is not known if increased melatonin use in the hospital mitigates use of higher-risk medications. Melatonin preparations can also have quality issues, including deviations from labelled dosage and contamination with compounds such as serotonin,12 and patients continuing melatonin after discharge could have adverse effects if switched to different preparations.
In this study, we aimed to determine temporal trends in melatonin use in hospitalized patients, and compare them with trends in use of other sleep medications.
METHODS
We conducted the study at two urban academic hospitals with a total of 706 acute care beds in the same network in Toronto, Canada. This study was approved by the University Health Network’s research ethics board.
We abstracted pharmacy dispensing data on melatonin, zopiclone, and lorazepam from January 1, 2013, to December 31, 2018. We included oral medications dispensed to inpatient units or admitted patients in the emergency department (ED). Zopiclone is the most commonly used nonbenzodiazepine sleep medication in Canada.13 Lorazepam is the most commonly used benzodiazepine at our institution (97% of all oral benzodiazepine doses). While lorazepam is prescribed for many nonsleep indications, we included it to assess the impact of melatonin. We did not include antipsychotics or trazodone, which are rarely newly initiated for insomnia at our institution.
We abstracted the monthly number of doses dispensed by unit and hospital. We categorized units based on the primary patient population as either internal medicine, critical care, or other. Admitted patients in the ED were counted as “other” regardless of service. As the focus of our study was on internal medicine and critical care, we did not analyze by type of unit in the “other” group, which is heterogeneous.
Each medication-dispensing event was counted as one dose, regardless of the number or strength of tablets (eg, a patient dispensed two 3-mg tablets of melatonin, for a total of 6 mg, would be counted as a single dose). Most unused doses are credited back (ie, if a medication was refused and returned to pharmacy, it was not counted). Lorazepam and zopiclone are on hospital formulary, while melatonin is not. To order melatonin, clinicians must select “Nonformulary medication” in the electronic health record and manually enter medication name, dose, route, and frequency, as well as select a justification for use. The hospital supplies nonformulary medications such as melatonin to patients.
To account for changes in patient volumes, we standardized medication dispensing rates per 1,000 inpatient days. We discovered rare instances in which the monthly number of doses was a negative number because of pharmacy inventory accounting. This issue affected only 0.13% of observations and the magnitude was small (8 doses or fewer); in these cases, we assumed the number of doses was zero.
We used line charts to visualize changes in medication dispensing over time by medication and hospital. We compared rates of medications use between unit type and hospital with use of relative difference and rate difference. Statistical analysis was performed with R (The R Foundation for Statistical Computing, 2018) using lubridate (2011), dplyr (2018), ggplot2 (2016), fmsb (2019), and forcats (2018).
RESULTS
A total of 1,542,225 inpatient days were analyzed, of which 60.4% were at hospital A. Internal medicine accounted for 23.5% of inpatient days, critical care for 11.7%, and other units for 64.8%.
Overall Trends in Sleep Medication Use
There were 351,131 dispensed doses of study medications (13% melatonin, 43% lorazepam, and 44% zopiclone). Overall use of the three study medications per 1,000 inpatient days increased by 25.7% during the study.
Melatonin use increased by 71.3 doses per 1,000 inpatient days during 2013-2018, while zopiclone use decreased by 20.4 doses per 1,000 inpatient days (Table). Lorazepam use increased slightly by 3.5 doses per 1,000 inpatient days. All rate differences reported in the results are statistically significant (Appendix Table).
Unit Type Comparison
Melatonin use was highest in critical care and internal medicine (50.9 and 48.4 doses per 1,000 inpatient days, respectively), compared with that in other units (19.3 doses per 1,000 inpatient days). Among critical care units, melatonin use was highest in medical-surgical units (67.4 doses per 1,000 inpatient days) and lower in cardiac and cardiovascular surgery units (24.6 and 18.3 doses per 1,000 inpatient days respectively). Zopiclone use was highest in critical care and other units (117.9 and 112.2 doses per 1,000 inpatient days, respectively) and lowest in internal medicine (57.0 doses per 1,000 inpatient days).
Hospital Site Comparison
Overall melatonin use was 65.4% higher at hospital B than at hospital A (42.4 vs 21.5 doses per 1,000 inpatient days; Figure). Zopiclone use was 81.7% lower at hospital B (54.6 vs 130.0 doses per 1,000 inpatient days).
When similar units were compared between hospitals, the trends were similar. For example, among internal medicine units, melatonin use was 66.7% higher at hospital B than at hospital A (64.4 vs 32.3 doses per 1,000 inpatient days).
DISCUSSION
During this 6-year study period of sleep medication use at two academic hospitals, overall use of melatonin, zopiclone, and lorazepam increased by 25.7%. Melatonin increased from almost no use to more than 70 doses per 1,000 inpatient days. The increase in melatonin was not accompanied by a proportional decline in zopiclone, which only decreased by 20.4 doses per 1,000 inpatient days. Lorazepam use increased slightly. This suggests that melatonin is not simply being substituted for higher-risk sleep medications and is instead being given to patients who might not have received sleep medications otherwise.
There are a few potential explanations for the disproportionate increase in melatonin. Providers may be more liberal in prescribing melatonin for insomnia because of perceived greater safety, compared with other medications. Melatonin may also be prescribed for delirium, despite a lack of high-quality evidence.14 Interestingly, melatonin use has increased despite a paucity of evidence for its efficacy or safety in hospital.6 Considering the additional barriers that exist to ordering melatonin, a nonformulary medication at our institution, the magnitude of increase is even more striking.
Melatonin use was highest on internal medicine and critical care units. This may reflect patient differences (eg, older patients with more comorbid conditions might leave prescribers reluctant to use benzodiazepines), differences in the physical environment (eg, noise/lighting), differences in nursing practices (eg, intensity of monitoring or medication administration), or differences in prescribing.
Melatonin use was almost twice as high at hospital B as it was at hospital A. While the services differ at each hospital, the results were similar when comparing the same unit type (eg, internal medicine). Internal medicine units have similar (though not identical) patient populations and team structures at both hospitals, and residents rotate between hospitals. Attendings and nurses are based primarily at one hospital and their practice patterns might differ. Geriatricians have a stronger presence at hospital B. Higher zopiclone use at hospital A could explain lower melatonin use. Lastly, improvement initiatives may have contributed (eg, one unit at hospital B promoted melatonin in 2017).
LIMITATIONS
Our study has potential limitations. We studied dispensed rather than administered medications; however, numbers of doses dispensed but not administered are expected to be low because most unused doses are accounted for. By studying dispensing data, we might have underestimated the number of prescriptions (eg, if a patient was prescribed but refused a medication, this would not be captured). Our study did not examine medications after hospital discharge, although medications started in a hospital are often continued at discharge.7,15 Our study could not determine indications for medication prescribing, and melatonin and lorazepam are both used for nonsleep indications. Our study could not differentiate between continuation of home medications and new prescriptions. Finally, the results may not be generalizable to other settings.
CONCLUSION
In this 6-year study of sleep medication use at two academic hospitals, we found that overall use of melatonin, zopiclone, and lorazepam increased by 25%, predominantly because of markedly increased melatonin use. Given the current lack of high-quality evidence, further research on the use of melatonin in hospitalized patients is needed.
1. Wesselius HM, van den Ende ES, Alsma J, et al. Quality and quantity of sleep and factors associated with sleep disturbance in hospitalized patients. JAMA Intern Med. 2018;178(9):1201-1208. https://doi.org/10.1001/jamainternmed.2018.2669.
2. DePietro RH, Knutson KL, Spampinato L, et al. Association between inpatient sleep loss and hyperglycemia of hospitalization. Diabetes Care. 2017;40(2):188-193. https://doi.org/10.2337/dc16-1683.
3. Inouye SK, Bogardus ST Jr, Charpentier PA, et al. A multicomponent intervention to prevent delirium in hospitalized older patients. N Engl J Med. 1999;340(9):669-676. https://doi.org/10.1056/NEJM199903043400901.
4. Ho A, Raja B, Waldhorn R, Baez V, Mohammed I. New onset of insomnia in hospitalized patients in general medical wards: incidence, causes, and resolution rate. J Community Hosp Intern Med Perspect. 2017;7(5):309-313. https://doi.org/10.1080/20009666.2017.1374108.
5. Rawal S, Kwan JL, Razak F, et al. Association of the trauma of hospitalization with 30-day readmission or emergency department visit. JAMA Intern Med. 2019;179(1):38-45. https://doi.org/10.1001/jamainternmed.2018.5100.
6. Kanji S, Mera A, Hutton B, et al. Pharmacological interventions to improve sleep in hospitalised adults: a systematic review. BMJ Open. 2016;6(7):e012108. https://doi.org/10.1136/bmjopen-2016-012108.
7. Gillis CM, Poyant JO, Degrado JR, Ye L, Anger KE, Owens RL. Inpatient pharmacological sleep aid utilization is common at a tertiary medical center. J Hosp Med. 2014;9(10):652-657. https://doi.org/10.1002/jhm.2246.
8. Schroeck JL, Ford J, Conway EL, et al. Review of safety and efficacy of sleep medicines in older adults. Clin Ther. 2016;38(11):2340-2372. https://doi.org/10.1016/j.clinthera.2016.09.010.
9. Kolla BP, Lovely JK, Mansukhani MP, Morgenthaler TI. Zolpidem is independently associated with increased risk of inpatient falls. J Hosp Med. 2013;8(1):1-6. https://doi.org/10.1002/jhm.1985.
10. Buscemi N, Vandermeer B, Hooton N, et al. The efficacy and safety of exogenous melatonin for primary sleep disorders. a meta-analysis. J Gen Intern Med. 2005;20(12):1151-1158. doi:10.1111/j.1525-1497.2005.0243.x.
11. Clarke TC, Black LI, Stussman BJ, Barnes PM, Nahin RL. Trends in the use of complementary health approaches among adults: United States, 2002-2012. Natl Health Stat Report. 2015(79):1-16.
12. Erland LA, Saxena PK. Melatonin natural health products and supplements: presence of serotonin and significant variability of melatonin content. J Clin Sleep Med. 2017;13(2):275-281. https://doi.com/10.5664/jcsm.6462.
13. Brandt J, Alessi-Severini S, Singer A, Leong C. Novel measures of benzodiazepine and z-drug utilisation trends in a canadian provincial adult population (2001-2016). J Popul Ther Clin Pharmacol. 2019;26(1):e22-e38. https://doi.org/10.22374/1710-6222.26.1.3.
14. Siddiqi N, Harrison JK, Clegg A, et al. Interventions for preventing delirium in hospitalised non-ICU patients. Cochrane Database Syst Rev. 2016;3:CD005563. https://doi.org/10.1002/14651858.CD005563.pub3.
15. MacMillan TE, Kamali R, Cavalcanti RB. Missed opportunity to deprescribe: docusate for constipation in medical inpatients. Am J Med. 2016;129(9):1001.e1001-1007. https://doi.org/10.1016/j.amjmed.2016.04.008.
1. Wesselius HM, van den Ende ES, Alsma J, et al. Quality and quantity of sleep and factors associated with sleep disturbance in hospitalized patients. JAMA Intern Med. 2018;178(9):1201-1208. https://doi.org/10.1001/jamainternmed.2018.2669.
2. DePietro RH, Knutson KL, Spampinato L, et al. Association between inpatient sleep loss and hyperglycemia of hospitalization. Diabetes Care. 2017;40(2):188-193. https://doi.org/10.2337/dc16-1683.
3. Inouye SK, Bogardus ST Jr, Charpentier PA, et al. A multicomponent intervention to prevent delirium in hospitalized older patients. N Engl J Med. 1999;340(9):669-676. https://doi.org/10.1056/NEJM199903043400901.
4. Ho A, Raja B, Waldhorn R, Baez V, Mohammed I. New onset of insomnia in hospitalized patients in general medical wards: incidence, causes, and resolution rate. J Community Hosp Intern Med Perspect. 2017;7(5):309-313. https://doi.org/10.1080/20009666.2017.1374108.
5. Rawal S, Kwan JL, Razak F, et al. Association of the trauma of hospitalization with 30-day readmission or emergency department visit. JAMA Intern Med. 2019;179(1):38-45. https://doi.org/10.1001/jamainternmed.2018.5100.
6. Kanji S, Mera A, Hutton B, et al. Pharmacological interventions to improve sleep in hospitalised adults: a systematic review. BMJ Open. 2016;6(7):e012108. https://doi.org/10.1136/bmjopen-2016-012108.
7. Gillis CM, Poyant JO, Degrado JR, Ye L, Anger KE, Owens RL. Inpatient pharmacological sleep aid utilization is common at a tertiary medical center. J Hosp Med. 2014;9(10):652-657. https://doi.org/10.1002/jhm.2246.
8. Schroeck JL, Ford J, Conway EL, et al. Review of safety and efficacy of sleep medicines in older adults. Clin Ther. 2016;38(11):2340-2372. https://doi.org/10.1016/j.clinthera.2016.09.010.
9. Kolla BP, Lovely JK, Mansukhani MP, Morgenthaler TI. Zolpidem is independently associated with increased risk of inpatient falls. J Hosp Med. 2013;8(1):1-6. https://doi.org/10.1002/jhm.1985.
10. Buscemi N, Vandermeer B, Hooton N, et al. The efficacy and safety of exogenous melatonin for primary sleep disorders. a meta-analysis. J Gen Intern Med. 2005;20(12):1151-1158. doi:10.1111/j.1525-1497.2005.0243.x.
11. Clarke TC, Black LI, Stussman BJ, Barnes PM, Nahin RL. Trends in the use of complementary health approaches among adults: United States, 2002-2012. Natl Health Stat Report. 2015(79):1-16.
12. Erland LA, Saxena PK. Melatonin natural health products and supplements: presence of serotonin and significant variability of melatonin content. J Clin Sleep Med. 2017;13(2):275-281. https://doi.com/10.5664/jcsm.6462.
13. Brandt J, Alessi-Severini S, Singer A, Leong C. Novel measures of benzodiazepine and z-drug utilisation trends in a canadian provincial adult population (2001-2016). J Popul Ther Clin Pharmacol. 2019;26(1):e22-e38. https://doi.org/10.22374/1710-6222.26.1.3.
14. Siddiqi N, Harrison JK, Clegg A, et al. Interventions for preventing delirium in hospitalised non-ICU patients. Cochrane Database Syst Rev. 2016;3:CD005563. https://doi.org/10.1002/14651858.CD005563.pub3.
15. MacMillan TE, Kamali R, Cavalcanti RB. Missed opportunity to deprescribe: docusate for constipation in medical inpatients. Am J Med. 2016;129(9):1001.e1001-1007. https://doi.org/10.1016/j.amjmed.2016.04.008.
© 2020 Society of Hospital Medicine
Leadership & Professional Development: Authentic Impact: Grow Your Influence by Building Your Brand
“Knowing yourself is the beginning of all wisdom.”—Aristotle
On the wards, your white coat and stethoscope signal your role as a healthcare provider. These external symbols of your work represent your expertise, experience, and commitment to service, and your patients look to these signals for comfort and reassurance. But when you are running a meeting, managing projects, or leading people in your organization, how do others know what you have to offer? Although signaling your values, skills, and intentions is as important in leadership as it is in the clinical setting, few clinicians spend time reflecting on how best to do this. Crafting a strong, consistent personal leadership brand can help.
As described by Norm Smallwood and Dave Ulrich, a personal leadership brand is the external projection of your strengths and interests, which demonstrates how you create value for others.1,2 In other words, a personal leadership brand helps constituents, stakeholders, and potential partners understand what you offer as a leader. Having a brand keeps you on track as a leader and helps get you noticed for future opportunities by helping you shape and meet expectations in a way that is deliberate, dynamic, and authentic.
Building your personal leadership brand is an exercise in reflection. Leaders should challenge themselves to answer the following questions:
- What do I have to offer, and what do others appreciate about me?
- What are my values?
- Where am I trying to go?
- How does my path align with organizational goals?
The answers to these simple questions can help you create your personal leadership brand. First, reflect on what you want to be known for, your values, and how you are currently perceived. Then, identify the results you are aiming to produce, aligning them with your strengths and organizational goals. Write these down, and share your reflections with trusted peers and your mentoring team. Shape your thoughts into a personal vision statement with a focus on what you put out into the world to help you stay true to yourself while producing the desired results. For example, a vision statement for a gifted communicator with a background in quality improvement may be: “I will use my strong communication skills to address complex problems impacting our hospital to reduce cost and improve quality with the goal of building a career as a health system leader.” Finally, be authentic, and share your personal brand in an articulate and succinct way to help others understand your place in the structure and narrative of an organization.
Your personal leadership brand should not be static; rather, it is a process that should iterate over time. Ask for direct feedback from trusted advisers and allies at regular intervals. Investigate whether your organization offers a formal structure, such as a “360 Evaluation,” to get perspective on how your unique strengths, skills, and goals are perceived. Then, explore and clarify discrepancies between where you think you are and how others see you. Approaching these conversations with humility will keep you aligned with your values, which makes it easier for others to be invested in your development.
A strong personal leadership brand is a force multiplier, providing clarity within teams and helping align a leader’s assets and values with organizational goals. It is a solid external signal of what others can expect from your work and will help you focus on your strengths while identifying areas for growth. A personal leadership brand is formed through reflection and, at its core, its authenticity. In the words of Paracelsus, a Renaissance physician, astrologer, and alchemist, “Be not another, if you can be yourself.”3
1. Smallwood N. Define your personal leadership brand in five steps. Harvard Business Review. March 29, 2010. https://hbr.org/2010/03/define-your-personal-leadershi.
2. Ulrich D, Smallwood N. Leadership brand: developing customer-focused leaders to drive performance and build lasting value. Harvard Business Review. August 13, 2007. https://hbr.org/2007/07/building-a-leadership-brand.
3. Grandjean P. Paracelsus revisited: the dose concept in a complex world. Basic Clin Pharmacol Toxicol. 2016;119(2):126-132. https://doi.org/10.1111/bcpt.12622.
“Knowing yourself is the beginning of all wisdom.”—Aristotle
On the wards, your white coat and stethoscope signal your role as a healthcare provider. These external symbols of your work represent your expertise, experience, and commitment to service, and your patients look to these signals for comfort and reassurance. But when you are running a meeting, managing projects, or leading people in your organization, how do others know what you have to offer? Although signaling your values, skills, and intentions is as important in leadership as it is in the clinical setting, few clinicians spend time reflecting on how best to do this. Crafting a strong, consistent personal leadership brand can help.
As described by Norm Smallwood and Dave Ulrich, a personal leadership brand is the external projection of your strengths and interests, which demonstrates how you create value for others.1,2 In other words, a personal leadership brand helps constituents, stakeholders, and potential partners understand what you offer as a leader. Having a brand keeps you on track as a leader and helps get you noticed for future opportunities by helping you shape and meet expectations in a way that is deliberate, dynamic, and authentic.
Building your personal leadership brand is an exercise in reflection. Leaders should challenge themselves to answer the following questions:
- What do I have to offer, and what do others appreciate about me?
- What are my values?
- Where am I trying to go?
- How does my path align with organizational goals?
The answers to these simple questions can help you create your personal leadership brand. First, reflect on what you want to be known for, your values, and how you are currently perceived. Then, identify the results you are aiming to produce, aligning them with your strengths and organizational goals. Write these down, and share your reflections with trusted peers and your mentoring team. Shape your thoughts into a personal vision statement with a focus on what you put out into the world to help you stay true to yourself while producing the desired results. For example, a vision statement for a gifted communicator with a background in quality improvement may be: “I will use my strong communication skills to address complex problems impacting our hospital to reduce cost and improve quality with the goal of building a career as a health system leader.” Finally, be authentic, and share your personal brand in an articulate and succinct way to help others understand your place in the structure and narrative of an organization.
Your personal leadership brand should not be static; rather, it is a process that should iterate over time. Ask for direct feedback from trusted advisers and allies at regular intervals. Investigate whether your organization offers a formal structure, such as a “360 Evaluation,” to get perspective on how your unique strengths, skills, and goals are perceived. Then, explore and clarify discrepancies between where you think you are and how others see you. Approaching these conversations with humility will keep you aligned with your values, which makes it easier for others to be invested in your development.
A strong personal leadership brand is a force multiplier, providing clarity within teams and helping align a leader’s assets and values with organizational goals. It is a solid external signal of what others can expect from your work and will help you focus on your strengths while identifying areas for growth. A personal leadership brand is formed through reflection and, at its core, its authenticity. In the words of Paracelsus, a Renaissance physician, astrologer, and alchemist, “Be not another, if you can be yourself.”3
“Knowing yourself is the beginning of all wisdom.”—Aristotle
On the wards, your white coat and stethoscope signal your role as a healthcare provider. These external symbols of your work represent your expertise, experience, and commitment to service, and your patients look to these signals for comfort and reassurance. But when you are running a meeting, managing projects, or leading people in your organization, how do others know what you have to offer? Although signaling your values, skills, and intentions is as important in leadership as it is in the clinical setting, few clinicians spend time reflecting on how best to do this. Crafting a strong, consistent personal leadership brand can help.
As described by Norm Smallwood and Dave Ulrich, a personal leadership brand is the external projection of your strengths and interests, which demonstrates how you create value for others.1,2 In other words, a personal leadership brand helps constituents, stakeholders, and potential partners understand what you offer as a leader. Having a brand keeps you on track as a leader and helps get you noticed for future opportunities by helping you shape and meet expectations in a way that is deliberate, dynamic, and authentic.
Building your personal leadership brand is an exercise in reflection. Leaders should challenge themselves to answer the following questions:
- What do I have to offer, and what do others appreciate about me?
- What are my values?
- Where am I trying to go?
- How does my path align with organizational goals?
The answers to these simple questions can help you create your personal leadership brand. First, reflect on what you want to be known for, your values, and how you are currently perceived. Then, identify the results you are aiming to produce, aligning them with your strengths and organizational goals. Write these down, and share your reflections with trusted peers and your mentoring team. Shape your thoughts into a personal vision statement with a focus on what you put out into the world to help you stay true to yourself while producing the desired results. For example, a vision statement for a gifted communicator with a background in quality improvement may be: “I will use my strong communication skills to address complex problems impacting our hospital to reduce cost and improve quality with the goal of building a career as a health system leader.” Finally, be authentic, and share your personal brand in an articulate and succinct way to help others understand your place in the structure and narrative of an organization.
Your personal leadership brand should not be static; rather, it is a process that should iterate over time. Ask for direct feedback from trusted advisers and allies at regular intervals. Investigate whether your organization offers a formal structure, such as a “360 Evaluation,” to get perspective on how your unique strengths, skills, and goals are perceived. Then, explore and clarify discrepancies between where you think you are and how others see you. Approaching these conversations with humility will keep you aligned with your values, which makes it easier for others to be invested in your development.
A strong personal leadership brand is a force multiplier, providing clarity within teams and helping align a leader’s assets and values with organizational goals. It is a solid external signal of what others can expect from your work and will help you focus on your strengths while identifying areas for growth. A personal leadership brand is formed through reflection and, at its core, its authenticity. In the words of Paracelsus, a Renaissance physician, astrologer, and alchemist, “Be not another, if you can be yourself.”3
1. Smallwood N. Define your personal leadership brand in five steps. Harvard Business Review. March 29, 2010. https://hbr.org/2010/03/define-your-personal-leadershi.
2. Ulrich D, Smallwood N. Leadership brand: developing customer-focused leaders to drive performance and build lasting value. Harvard Business Review. August 13, 2007. https://hbr.org/2007/07/building-a-leadership-brand.
3. Grandjean P. Paracelsus revisited: the dose concept in a complex world. Basic Clin Pharmacol Toxicol. 2016;119(2):126-132. https://doi.org/10.1111/bcpt.12622.
1. Smallwood N. Define your personal leadership brand in five steps. Harvard Business Review. March 29, 2010. https://hbr.org/2010/03/define-your-personal-leadershi.
2. Ulrich D, Smallwood N. Leadership brand: developing customer-focused leaders to drive performance and build lasting value. Harvard Business Review. August 13, 2007. https://hbr.org/2007/07/building-a-leadership-brand.
3. Grandjean P. Paracelsus revisited: the dose concept in a complex world. Basic Clin Pharmacol Toxicol. 2016;119(2):126-132. https://doi.org/10.1111/bcpt.12622.
© 2020 Society of Hospital Medicine