User login
Inpatient Glycemic Control With Sliding Scale Insulin in Noncritical Patients With Type 2 Diabetes: Who Can Slide?
Sliding scale insulin (SSI) for inpatient glycemic control was first proposed by Elliott P Joslin in 1934 when he recommended titration of insulin based on urine glucose levels.1 As bedside glucose meters became widely available, physicians transitioned to dosing SSI based on capillary blood glucose (BG) levels,2,3 and SSI became widely used for the management of inpatient hyperglycemia.1 However, during the past decade, there has been strong opposition to the use of SSI in hospitals. Many authors oppose its use, highlighting the retrospective rather than prospective nature of SSI therapy and concerns about inadequate glycemic control.4-6 In 2004, the American College of Endocrinology first released a position statement discouraging the use of SSI alone and recommended basal-bolus insulin as the preferred method of glycemic control for inpatients with type 2 diabetes (T2D).7 The American Diabetes Association (ADA) inpatient guidelines in 20058 and the Endocrine Society guidelines in 20129 also opposed SSI monotherapy and reaffirmed that a basal-bolus insulin regimen should be used for most non–critically ill patients with diabetes. Those guidelines remain in place currently.
Several randomized controlled trials (RCTs) and meta-analyses have shown that basal-bolus insulin regimens provide superior glycemic control in non–critical inpatients when compared with SSI alone.10-14 In addition, the RABBIT 2 (Randomized Study of Basal-Bolus Insulin Therapy in the Inpatient Management of Patients With Type 2 Diabetes) trial showed a significant reduction in perioperative complications10 among surgical patients when treated with basal-bolus insulin therapy. Despite these studies and strong recommendations against its use, SSI continues to be widely used in the United States. According to a 2007 survey of 44 US hospitals, 41% of noncritical patients with hyperglycemia were treated with SSI alone.15 In addition, SSI remains one of the most commonly prescribed insulin regimens in many countries around the world.16-19 The persistence of SSI use raises questions as to why clinicians continue to use a therapy that has been strongly criticized. Some authors point to convenience and fear of hypoglycemia with a basal-bolus insulin regimen.20,21 Alternatively, it is possible that SSI usage remains so pervasive because it is effective in a subset of patients. In fact, a 2018 Cochrane review concluded that existing evidence is not sufficiently robust to definitively recommend basal-bolus insulin over SSI for inpatient diabetes management of non–critically ill patients despite existing guidelines.22
Owing to the ongoing controversy and widespread use of SSI, we designed an exploratory analysis to understand the rationale for such therapy by investigating whether a certain subpopulation of hospitalized patients with T2D may achieve target glycemic control with SSI alone. We hypothesized that noncritical patients with mild hyperglycemia and admission BG <180 mg/dL would do well with SSI alone and may not require intensive treatment with basal-bolus insulin regimens. To address this question, we used electronic health records with individual-level patient data to assess inpatient glycemic control of non–critically ill patients with T2D treated with SSI alone.
METHODS
Participants
Data from 25,813 adult noncritical inpatients with T2D, with an index admission between June 1, 2010, and June 30, 2018, were obtained through the Emory Healthcare Clinical Data Warehouse infrastructure program. All patients were admitted to Emory Healthcare hospitals, including Emory University Hospital, Emory University Hospital Midtown, and Emory Saint Joseph’s Hospital, in Atlanta, Georgia. Data were extracted for each patient during the index hospitalization, including demographics, anthropometrics, and admission and inpatient laboratory values. Information was collected on daily point-of-care glucose values, hemoglobin A1c (HbA1c), hypoglycemic events, insulin doses, hospital complications, comorbidities, and hospital setting (medical vs surgical admission). International Classification of Diseases, 9th and 10th Revisions (ICD-9/10) codes were used to determine diagnosis of T2D, comorbidities, and complications.
From our initial dataset, we identified 16,366 patients who were treated with SSI during hospitalization. We excluded patients who were admitted to the intensive care unit (ICU) or placed on intravenous insulin, patients with missing admission BG values, and patients with a length of stay less than 1 day. To prevent inclusion of patients presenting in diabetic ketoacidosis or hyperosmolar hyperglycemic syndrome, we excluded patients with an admission BG >500 mg/dL. We then excluded 6,739 patients who received basal insulin within the first 2 days of hospitalization, as well as 943 patients who were treated with noninsulin (oral or injectable) antidiabetic agents. Our final dataset included 8,095 patients (Appendix Figure).
Patients in the SSI cohort included all patients who were treated with short-acting insulin only (regular insulin or rapid-acting [lispro, aspart, glulisine] insulin analogs) during the first 2 days of hospitalization. Patients who remained on only short-acting insulin during the entire hospitalization were defined as continuous SSI patients. Patients who subsequently received basal insulin after day 2 of hospitalization were defined as patients who transitioned to basal. Patients were stratified according to admission BG levels (first BG available on day of admission) and HbA1c (when available during index admission). We compared the baseline characteristics and clinical outcomes of patients who remained on SSI alone throughout the entirety of hospitalization with those of patients who required transition to basal insulin. The mean hospital BG was calculated by taking the average of all BG measurements during the hospital stay. We defined hypoglycemia as a BG <70 mg/dL and severe hypoglycemia as BG <40 mg/dL. Repeated hypoglycemia values were excluded if they occurred within a period of 2 hours.
Outcome Measures
The primary outcome was the percentage of patients with T2D achieving target glycemic control with SSI therapy, defined as mean hospital BG between 70 and 180 mg/dL without hypoglycemia <70 mg/dL during hospital stay. This threshold was determined based on 2019 ADA recommendations targeting hospital BG <180 mg/dL and avoidance of hypoglycemia.23
Statistical Analysis
Patients were stratified according to continuous SSI versus transitioned to basal treatment. Patients who remained on continuous SSI were further categorized into four categories based on admission BG: <140 mg/dL, 140 to 180 mg/dL, 180 to 250 mg/dL, and ≥250 mg/dL. Clinical characteristics were compared using Wilcoxon rank-sum tests (if continuous) and chi-square tests or Fisher exact tests (if categorical). We then compared the clinical outcomes among continuous SSI patients with different admission BG levels (<140 mg/dL, 140-180 mg/dL, 180-250 mg/dL, and ≥250 mg/dL) and with different HbA1c levels (<7%, 7%-8%, 8%-9%, ≥9%). Within each scenario, logistic regression for the outcome of poor glycemic control, defined as mean hospital BG >180 mg/dL, was performed to evaluate the HbA1c levels and admission BG levels controlling for other factors (age, gender, body mass index [BMI], race, setting [medicine versus surgery] and Charlson Comorbidity Index score). A P value < .05 was regarded as statistically significant. All analyses were performed based on available cases and conducted in SAS version 9.4 (SAS Institute Inc.).
RESULTS
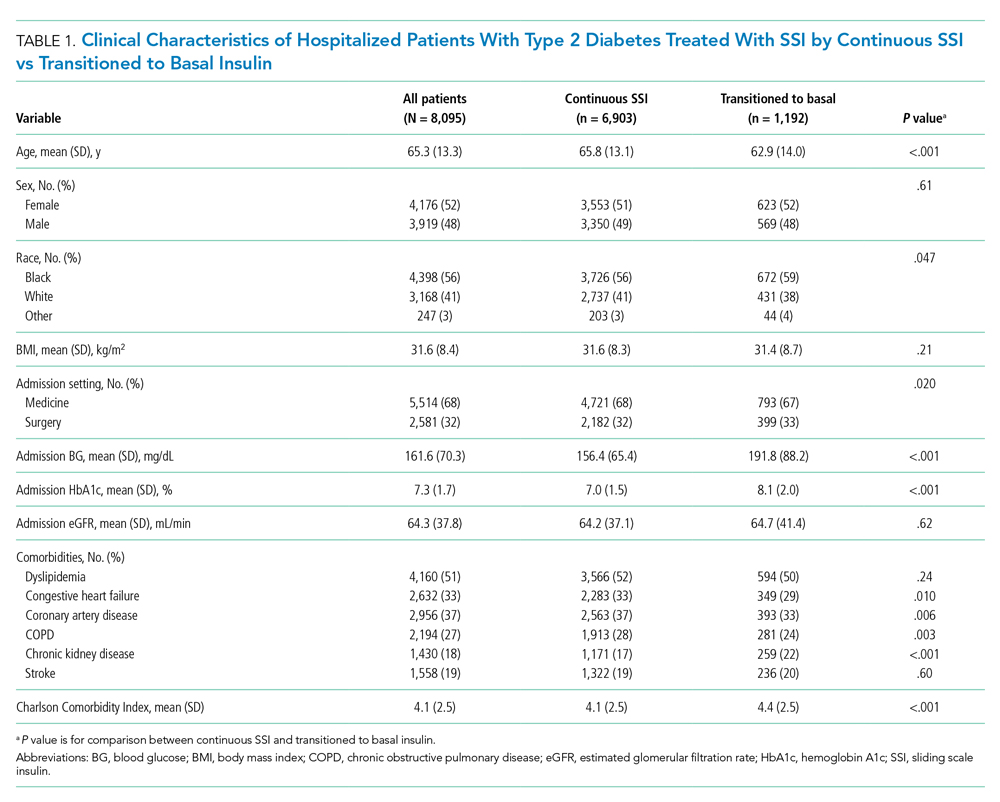
Among 25,813 adult patients with T2D, 8,095 patients (31.4%) were treated with SSI alone during the first 2 days of hospitalization. Of those patients treated with SSI, 6,903 (85%) remained on continuous SSI alone during the entire hospitalization, and 1,192 (15%) were transitioned to basal insulin. The clinical characteristics of these patients on continuous SSI and those who transitioned to basal insulin are shown in Table 1. Patients who transitioned to basal insulin had significantly higher mean (SD) admission BG (191.8 [88.2] mg/dL vs 156.4 [65.4] mg/dL, P < .001) and higher mean (SD) HbA1c (8.1% [2.0%] vs 7.01% [1.5%], P < .001), compared with those who remained on continuous SSI. Patients who transitioned to basal insulin were also younger and more likely to have chronic kidney disease (CKD), but less likely to have congestive heart failure, coronary artery disease, or chronic obstructive pulmonary disease (COPD). The Charlson Comorbidity Index score was significantly higher for patients who transitioned to basal (4.4 [2.5]) than for those who remained on continuous SSI (4.1 [2.5], P < .001). There were no significant differences among sex, BMI, or glomerular filtration rate (GFR) on admission. Of those transitioned to basal insulin, 53% achieved a mean hospitalization BG <180 mg/dL, compared with 82% of those on continuous SSI. The overall rate of hypoglycemia in the continuous SSI group was 8% compared with 18% in those transitioned to basal insulin.
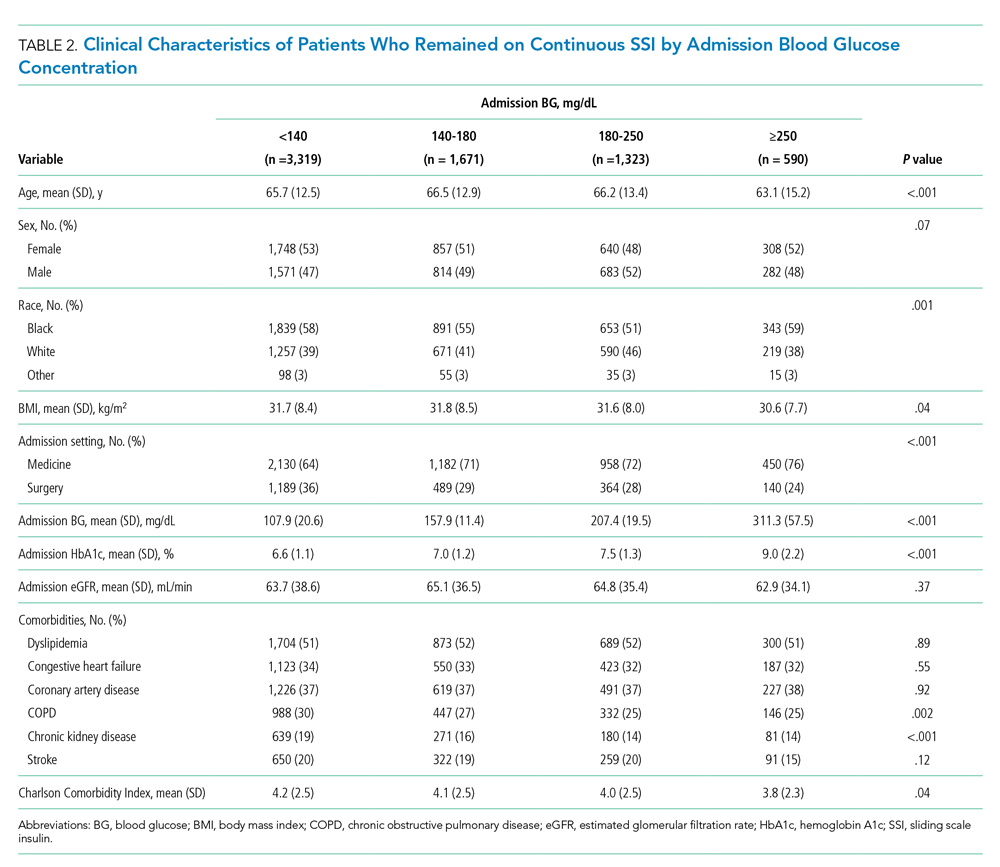
Of the patients who remained on continuous SSI throughout the hospitalization, 3,319 patients (48%) had admission BG <140 mg/dL, 1,671 patients (24%) had admission BG 140 to 180 mg/dL, and 1,913 patients (28%) had admission BG >180 mg/dL. Only 9% of patients who remained on continuous SSI had admission BG ≥250 mg/dL. Patients with admission BG <140 mg/dL were older, had lower BMI and HbA1c, had higher rates of COPD and CKD, and were more likely to be admitted to a surgical service compared with patients with admission BG >140 mg/dL (P < .05 for all; Table 2).
Hospital glycemic control for patients on continuous SSI according to admission BG is displayed in Table 3. Among patients who remained on continuous SSI, 96% of patients with admission BG <140 mg/dL had a mean hospital BG <180 mg/dL; of them, 86% achieved target control without hypoglycemia. Similar rates of target control were achieved in patients with admission BG 140 to 180 mg/dL (83%), in contrast to patients with admission BG ≥250 mg/dL, of whom only 18% achieved target control (P < .001). These findings parallel those seen in patients transitioned to basal insulin. Of patients in the transition group admitted with BG <140 mg/dL and <180 mg/dL, 88.5% and 84.6% had mean hospital BG <180 mg/dL, respectively, while 69.1% and 68.9% had mean BG between 70 and 180 mg/dL without hypoglycemia. The overall frequency of hypoglycemia <70 mg/dL among patients on continuous SSI was 8% and was more common in patients with admission BG <140 mg/dL (10%) compared with patients with higher admission glucose levels (BG 140-180 mg/dL [4%], 180-250 mg/dL [4%], or ≥250 mg/dL [6%], P < .001). There was no difference in rates of severe hypoglycemia <40 mg/dL among groups.

HbA1c data were available for 2,560 of the patients on continuous SSI (Table 3). Mean hospital BG increased significantly with increasing HbA1c values. Patients admitted with HbA1c <7% had lower mean (SD) hospital BG (132.2 [28.2] mg/dL) and were more likely to achieve target glucose control during hospitalization (85%) compared with those with HbA1c 7% to 8% (mean BG, 148.7 [30.8] mg/dL; 80% target control), HbA1c 8% to 9% (mean BG, 169.1 [37.9] mg/dL; 61% target control), or HbA1c ≥9% (mean BG, 194.9 [53.4] mg/dL; 38% target control) (P < .001).
In a logistic regression analysis adjusted for age, gender, BMI, race, setting (medicine vs surgery), and Charlson Comorbidity Index score, the odds of poor glycemic control increased with higher admission BG (admission BG 140-180 mg/dL: odds ratio [OR], 1.8; 95% CI, 1.5-2.2; admission BG 180-250 mg/dL: OR, 3.7; 95% CI, 3.1-4.4; admission BG ≥250 mg/dL: OR, 7.2; 95% CI, 5.8-9.0; reference admission BG <140 mg/dL; Figure). Similarly, the logistic regression analysis showed greater odds of poor in-hospital glycemic control with increasing HbA1c (OR, 6.1; 95% CI, 4.3-8.8 for HbA1c >9% compared with HbA1c <7%).

DISCUSSION
This large retrospective cohort study examined the effectiveness of SSI for glycemic control in noncritical inpatients with T2D. Our results indicate that SSI is still widely used in our hospital system, with 31.4% of our initial cohort managed with SSI alone. We found that 86% of patients with BG <140 mg/dL and 83% of patients with BG 140 to 180 mg/dL achieved glycemic control without hypoglycemia when managed with SSI alone, compared with 53% of those admitted with BG 180 to 250 mg/dL and only 18% of those with admission BG ≥250 mg/dL. This high success rate of achieving optimal BG control with SSI alone is comparable to that seen with transition to basal insulin and may explain the prevalent use of SSI for the management of patients with T2D and mild to moderate hyperglycemia.
Published clinical guideline recommendations promoting the use of basal-bolus insulin treatment algorithms are based on the results of a few RCTs that compared the efficacy of SSI vs a basal-bolus insulin regimen. These studies reported significantly lower mean daily BG concentration with basal or basal-bolus insulin therapy compared with SSI.10,11,24 However, it is interesting to note that the mean admission BG of patients treated with SSI in these RCTs ranged from 184 to 225 mg/dL. Patients in these trials were excluded if admission BG was <140 mg/dL.10,11,24 This is in contrast to our study evaluating real-world data in non–critically ill settings in which we found that 48% of patients treated with SSI had admission BG <140 mg/dL, and nearly 75% had admission BG <180 mg/dL. This suggests that by nature of study design, most RCTs excluded the population of patients who do achieve good glycemic control with SSI and may have contributed to the perception that basal insulin is preferable in all populations.
Our analysis indicates that healthcare professionals should consider admission BG when selecting the type of insulin regimen to manage patients with T2D in the hospital. Our results suggest that SSI may be appropriate for many patients with admission BG <180 mg/dL and should be avoided as monotherapy in patients with admission BG ≥180 mg/dL, as the proportion of patients achieving target control decreased with increasing admission BG. More importantly, if a patient is not controlled with SSI alone, intensification of therapy with the addition of basal insulin is indicated to achieve glycemic control. In addition, we found that the admission HbA1c is an appropriate marker to consider as well, with hospital glycemic control deteriorating with increasing HbA1c values, paralleling the admission BG. The main limitation to widespread use of HbA1c for therapeutic decision-making is access to values at time of patient admission; in our population, only 37% of patients had an HbA1c value available during the index hospitalization.
Previous publications have reported that hypoglycemia carries significant safety concerns, especially among a hospitalized population.25-27 As such, we included hypoglycemia as an important metric in our definition of target glycemic control rather than simply using mean hospital BG or number of hyperglycemic events to define treatment effectiveness. We did find a higher rate of hypoglycemia in patients with moderate admission BG treated with SSI compared with those with higher admission BG; however, few patients overall experienced clinically significant (<54 mg/dL) or severe (<40 mg/dL) hypoglycemia.
In our population, only 15% of patients started on SSI received additional basal insulin during hospitalization. This finding is similar to data reported in the Rabbit 2 trial, in which 14% of patients failed SSI alone, with a higher failure rate among those with higher BG on admission.10 Given the observational nature of this study, we cannot definitively state why certain patients in our population required additional basal insulin, but we can hypothesize that these patients admitted with BG ≥180 mg/dL had higher treatment failure rates and greater rates of hyperglycemia, therefore receiving intensified insulin therapy as clinically indicated at the discretion of the treating physician. Patients who transitioned from SSI to basal insulin had significantly higher admission BG and HbA1c compared with patients who remained on SSI alone. We noted that the rates of hypoglycemia were higher in the group that transitioned to basal (18% vs 8%) and similar to rates reported in previous RCTs.11,24
This observational study takes advantage of a large, diverse study population and a combination of medicine and surgery patients in a real-world setting. We acknowledge several limitations in our study. Our primary data were observational in nature, and as such, some baseline patient characteristics were notably different between groups, suggesting selection bias for treatment allocation to SSI. We do not know which patients were managed by primary teams compared with specialized diabetes consult services, which may also influence treatment regimens. We did not have access to information about patients’ at-home diabetes medication regimens or duration of diabetes, both of which have been shown in prior publications to affect an individual’s overall hospital glycemic control. Data on HbA1c values were available for only approximately one-third of patients. In addition, our study did not include patients without a history of diabetes who developed stress-induced hyperglycemia, a population that may benefit from conservative therapy such as SSI.28 A diagnosis of CKD was defined based on ICD 9/10 codes and not on admission estimated GFR. More specific data regarding stage of CKD or changes in renal function over the duration of hospitalization are not available, which could influence insulin prescribing practice. In addition, we defined the basal group as patients prescribed any form of basal insulin (NPH, glargine, detemir or degludec), and we do not have information on the use of prandial versus correction doses of rapid-acting insulin in the basal insulin–treated group.
CONCLUSION
In conclusion, our observational study indicates that the use of SSI results in appropriate target glycemic control for most noncritical medicine and surgery patients with admission BG <180 mg/dL. In agreement with previous RCTs, our study confirms that SSI as monotherapy is frequently inadequate in patients with significant hyperglycemia >180 mg/dL.10,11,24,29 We propose that an individualized approach to inpatient glycemic management is imperative, and cautious use of SSI may be a viable option for certain patients with mild hyperglycemia and admission BG <180 mg/dL. Further observational and randomized studies are needed to confirm the efficacy of SSI therapy in T2D patients with mild hyperglycemia. By identifying which subset of patients can be safely managed with SSI alone, we can better understand which patients will require escalation of therapy with intensive glucose management.
1. Umpierrez GE, Palacio A, Smiley D. Sliding scale insulin use: myth or insanity? Am J Med. 2007;120(7):563-567. https://doi.org/10.1016/j.amjmed.2006.05.070
2. Kitabchi AE, Ayyagari V, Guerra SM. The efficacy of low-dose versus conventional therapy of insulin for treatment of diabetic ketoacidosis. Ann Intern Med. 1976;84(6):633-638. https://doi.org/10.7326/0003-4819-84-6-633
3. Skyler JS, Skyler DL, Seigler DE, O’Sullivan MJ. Algorithms for adjustment of insulin dosage by patients who monitor blood glucose. Diabetes Care. 1981;4(2):311-318. https://doi.org/10.2337/diacare.4.2.311
4. Gearhart JG, Duncan JL 3rd, Replogle WH, Forbes RC, Walley EJ. Efficacy of sliding-scale insulin therapy: a comparison with prospective regimens. Fam Pract Res J. 1994;14(4):313-322.
5. Queale WS, Seidler AJ, Brancati FL. Glycemic control and sliding scale insulin use in medical inpatients with diabetes mellitus. Arch Intern Med. 1997;157(5):545-552.
6. Clement S, Braithwaite SS, Magee MF, et al. Management of diabetes and hyperglycemia in hospitals. Diabetes Care. 2004;27(2):553-591. https://doi.org/10.2337/diacare.27.2.553
7. Garber AJ, Moghissi ES, Bransome ED Jr, et al. American College of Endocrinology position statement on inpatient diabetes and metabolic control. Endocr Pract. 2004;10(1):78-82. https://doi.org/10.4158/EP.10.1.77
8. American Diabetes Association. Standards of medical care in diabetes. Diabetes Care. 2005;28(suppl 1):S4-S36.
9. Umpierrez GE, Hellman R, Korytkowski MT, , et al. Management of hyperglycemia in hospitalized patients in non-critical care setting: an Endocrine Society clinical practice guideline. J Clin Endocrinol Metab. 2012;97(1):16-38. https://doi.org/10.1210/jc.2011-2098
10. Umpierrez GE, Smiley D, Zisman A, et al. Randomized study of basal-bolus insulin therapy in the inpatient management of patients with type 2 diabetes. Diabetes Care. 2007;30(9):2181-2186. https://doi.org/10.2337/dc07-0295
11. Umpierrez GE, Smiley D, Jacobs S, et al. Randomized study of basal-bolus insulin therapy in the inpatient management of patients with type 2 diabetes undergoing general surgery (RABBIT 2 surgery). Diabetes Care. 2011;34(2):256-261. https://doi.org/10.2337/dc10-1407
12. Schroeder JE, Liebergall M, Raz I, Egleston R, Ben Sussan G, Peyser A. Benefits of a simple glycaemic protocol in an orthopaedic surgery ward: a randomized prospective study. Diabetes Metab Res Rev. 2012;28:71-75. https://doi.org/10.1002/dmrr.1217
13. Lee YY, Lin YM, Leu WJ, et al. Sliding-scale insulin used for blood glucose control: a meta-analysis of randomized controlled trials. Metabolism. 2015;64(9):1183-1192. https://doi.org/10.1016/j.metabol.2015.05.011
14. Christensen MB, Gotfredsen A, Nørgaard K. Efficacy of basal-bolus insulin regimens in the inpatient management of non-critically ill patients with type 2 diabetes: a systematic review and meta-analysis. Diabetes Metab Res Rev. 2017;33(5):e2885. https://doi.org/10.1002/dmrr.2885
15. Wexler DJ, Meigs JB, Cagliero E, Nathan DM, Grant RW. Prevalence of hyper- and hypoglycemia among inpatients with diabetes: a national survey of 44 U.S. hospitals. Diabetes Care. 2007;30(2):367-369. https://doi.org/10.2337/dc06-1715
16. Moreira ED Jr, Silveira PCB, Neves RCS, Souza C Jr, Nunes ZO, Almeida MdCC. Glycemic control and diabetes management in hospitalized patients in Brazil. Diabetol Metab Syndr. 2013;5(1):62. https://doi.org/10.1186/1758-5996-5-62
17. Akhtar ST, Mahmood K, Naqvi IH, Vaswani AS. Inpatient management of type 2 diabetes mellitus: does choice of insulin regimen really matter? Pakistan J Med Sci. 2014;30(4):895-898.
18. Gómez Cuervo C, Sánchez Morla A, Pérez-Jacoiste Asín MA, Bisbal Pardo O, Pérez Ordoño L, Vila Santos J. Effective adverse event reduction with bolus-basal versus sliding scale insulin therapy in patients with diabetes during conventional hospitalization: systematic review and meta-analysis. Endocrinol Nutr. 2016;63(4):145-156. https://doi.org/10.1016/j.endonu.2015.11.008
19. Bain A, Hasan SS, Babar ZUD. Interventions to improve insulin prescribing practice for people with diabetes in hospital: a systematic review. Diabet Med. 2019;36(8):948-960. https://doi.org/10.1111/dme.13982
20. Ambrus DB, O’Connor MJ. Things We Do For No Reason: sliding-scale insulin as monotherapy for glycemic control in hospitalized patients. J Hosp Med. 2019;14(2):114-116. https://doi.org/10.12788/jhm.3109
21. Nau KC, Lorenzetti RC, Cucuzzella M, Devine T, Kline J. Glycemic control in hospitalized patients not in intensive care: beyond sliding-scale insulin. Am Fam Physician. 2010;81(9):1130-1135.
22. Colunga-Lozano LE, Gonzalez Torres FJ, Delgado-Figueroa N, et al. Sliding scale insulin for non-critically ill hospitalised adults with diabetes mellitus. Cochrane Database Syst Rev. 2018;11(11):CD011296. https://doi.org/10.1002/14651858.CD011296.pub2
23. American Diabetes Association. Diabetes care in the hospital: Standards of Medical Care in Diabetes—2019. Diabetes Care. 2019;42(suppl 1):S173-S181. https://doi.org/10.2337/dc19-S015
24. Umpierrez GE, Smiley D, Hermayer K, et al. Randomized study comparing a basal-bolus with a basal plus correction management of medical and surgical patients with type 2 diabetes: basal plus trial. Diabetes Care. 2013;36(8):2169-2174. https://doi.org/10.2337/dc12-1988
25. Turchin A, Matheny ME, Shubina M, Scanlon SV, Greenwood B, Pendergrass ML. Hypoglycemia and clinical outcomes in patients with diabetes hospitalized in the general ward. Diabetes Care. 2009;32(7):1153-1157. https://doi.org/10.2337/dc08-2127
26. Garg R, Hurwitz S, Turchin A, Trivedi A. Hypoglycemia, with or without insulin therapy, is associated with increased mortality among hospitalized patients. Diabetes Care. 2013;36(5):1107-1110. https://doi.org/10.2337/dc12-1296
27. Zapatero A, Gómez-Huelgas R, González N, et al. Frequency of hypoglycemia and its impact on length of stay, mortality, and short-term readmission in patients with diabetes hospitalized in internal medicine wards. Endocr Pract. 2014;20(9):870-875. https://doi.org/10.4158/EP14006.OR
28. Umpierrez GE, Isaacs SD, Bazargan N, You X, Thaler LM, Kitabchi AE. Hyperglycemia: an independent marker of in-hospital mortality in patients with undiagnosed diabetes. J Clin Endocrinol Metab. 2002;87(3):978-982. https://doi.org/10.1210/jcem.87.3.8341
29. Dickerson LM, Ye X, Sack JL, Hueston WJ. Glycemic control in medical inpatients with type 2 diabetes mellitus receiving sliding scale insulin regimens versus routine diabetes medications: a multicenter randomized controlled trial. Ann Fam Med. 2003;1(1):29-35. https://doi.org/10.1370/afm.2
Sliding scale insulin (SSI) for inpatient glycemic control was first proposed by Elliott P Joslin in 1934 when he recommended titration of insulin based on urine glucose levels.1 As bedside glucose meters became widely available, physicians transitioned to dosing SSI based on capillary blood glucose (BG) levels,2,3 and SSI became widely used for the management of inpatient hyperglycemia.1 However, during the past decade, there has been strong opposition to the use of SSI in hospitals. Many authors oppose its use, highlighting the retrospective rather than prospective nature of SSI therapy and concerns about inadequate glycemic control.4-6 In 2004, the American College of Endocrinology first released a position statement discouraging the use of SSI alone and recommended basal-bolus insulin as the preferred method of glycemic control for inpatients with type 2 diabetes (T2D).7 The American Diabetes Association (ADA) inpatient guidelines in 20058 and the Endocrine Society guidelines in 20129 also opposed SSI monotherapy and reaffirmed that a basal-bolus insulin regimen should be used for most non–critically ill patients with diabetes. Those guidelines remain in place currently.
Several randomized controlled trials (RCTs) and meta-analyses have shown that basal-bolus insulin regimens provide superior glycemic control in non–critical inpatients when compared with SSI alone.10-14 In addition, the RABBIT 2 (Randomized Study of Basal-Bolus Insulin Therapy in the Inpatient Management of Patients With Type 2 Diabetes) trial showed a significant reduction in perioperative complications10 among surgical patients when treated with basal-bolus insulin therapy. Despite these studies and strong recommendations against its use, SSI continues to be widely used in the United States. According to a 2007 survey of 44 US hospitals, 41% of noncritical patients with hyperglycemia were treated with SSI alone.15 In addition, SSI remains one of the most commonly prescribed insulin regimens in many countries around the world.16-19 The persistence of SSI use raises questions as to why clinicians continue to use a therapy that has been strongly criticized. Some authors point to convenience and fear of hypoglycemia with a basal-bolus insulin regimen.20,21 Alternatively, it is possible that SSI usage remains so pervasive because it is effective in a subset of patients. In fact, a 2018 Cochrane review concluded that existing evidence is not sufficiently robust to definitively recommend basal-bolus insulin over SSI for inpatient diabetes management of non–critically ill patients despite existing guidelines.22
Owing to the ongoing controversy and widespread use of SSI, we designed an exploratory analysis to understand the rationale for such therapy by investigating whether a certain subpopulation of hospitalized patients with T2D may achieve target glycemic control with SSI alone. We hypothesized that noncritical patients with mild hyperglycemia and admission BG <180 mg/dL would do well with SSI alone and may not require intensive treatment with basal-bolus insulin regimens. To address this question, we used electronic health records with individual-level patient data to assess inpatient glycemic control of non–critically ill patients with T2D treated with SSI alone.
METHODS
Participants
Data from 25,813 adult noncritical inpatients with T2D, with an index admission between June 1, 2010, and June 30, 2018, were obtained through the Emory Healthcare Clinical Data Warehouse infrastructure program. All patients were admitted to Emory Healthcare hospitals, including Emory University Hospital, Emory University Hospital Midtown, and Emory Saint Joseph’s Hospital, in Atlanta, Georgia. Data were extracted for each patient during the index hospitalization, including demographics, anthropometrics, and admission and inpatient laboratory values. Information was collected on daily point-of-care glucose values, hemoglobin A1c (HbA1c), hypoglycemic events, insulin doses, hospital complications, comorbidities, and hospital setting (medical vs surgical admission). International Classification of Diseases, 9th and 10th Revisions (ICD-9/10) codes were used to determine diagnosis of T2D, comorbidities, and complications.
From our initial dataset, we identified 16,366 patients who were treated with SSI during hospitalization. We excluded patients who were admitted to the intensive care unit (ICU) or placed on intravenous insulin, patients with missing admission BG values, and patients with a length of stay less than 1 day. To prevent inclusion of patients presenting in diabetic ketoacidosis or hyperosmolar hyperglycemic syndrome, we excluded patients with an admission BG >500 mg/dL. We then excluded 6,739 patients who received basal insulin within the first 2 days of hospitalization, as well as 943 patients who were treated with noninsulin (oral or injectable) antidiabetic agents. Our final dataset included 8,095 patients (Appendix Figure).
Patients in the SSI cohort included all patients who were treated with short-acting insulin only (regular insulin or rapid-acting [lispro, aspart, glulisine] insulin analogs) during the first 2 days of hospitalization. Patients who remained on only short-acting insulin during the entire hospitalization were defined as continuous SSI patients. Patients who subsequently received basal insulin after day 2 of hospitalization were defined as patients who transitioned to basal. Patients were stratified according to admission BG levels (first BG available on day of admission) and HbA1c (when available during index admission). We compared the baseline characteristics and clinical outcomes of patients who remained on SSI alone throughout the entirety of hospitalization with those of patients who required transition to basal insulin. The mean hospital BG was calculated by taking the average of all BG measurements during the hospital stay. We defined hypoglycemia as a BG <70 mg/dL and severe hypoglycemia as BG <40 mg/dL. Repeated hypoglycemia values were excluded if they occurred within a period of 2 hours.
Outcome Measures
The primary outcome was the percentage of patients with T2D achieving target glycemic control with SSI therapy, defined as mean hospital BG between 70 and 180 mg/dL without hypoglycemia <70 mg/dL during hospital stay. This threshold was determined based on 2019 ADA recommendations targeting hospital BG <180 mg/dL and avoidance of hypoglycemia.23
Statistical Analysis
Patients were stratified according to continuous SSI versus transitioned to basal treatment. Patients who remained on continuous SSI were further categorized into four categories based on admission BG: <140 mg/dL, 140 to 180 mg/dL, 180 to 250 mg/dL, and ≥250 mg/dL. Clinical characteristics were compared using Wilcoxon rank-sum tests (if continuous) and chi-square tests or Fisher exact tests (if categorical). We then compared the clinical outcomes among continuous SSI patients with different admission BG levels (<140 mg/dL, 140-180 mg/dL, 180-250 mg/dL, and ≥250 mg/dL) and with different HbA1c levels (<7%, 7%-8%, 8%-9%, ≥9%). Within each scenario, logistic regression for the outcome of poor glycemic control, defined as mean hospital BG >180 mg/dL, was performed to evaluate the HbA1c levels and admission BG levels controlling for other factors (age, gender, body mass index [BMI], race, setting [medicine versus surgery] and Charlson Comorbidity Index score). A P value < .05 was regarded as statistically significant. All analyses were performed based on available cases and conducted in SAS version 9.4 (SAS Institute Inc.).
RESULTS
Among 25,813 adult patients with T2D, 8,095 patients (31.4%) were treated with SSI alone during the first 2 days of hospitalization. Of those patients treated with SSI, 6,903 (85%) remained on continuous SSI alone during the entire hospitalization, and 1,192 (15%) were transitioned to basal insulin. The clinical characteristics of these patients on continuous SSI and those who transitioned to basal insulin are shown in Table 1. Patients who transitioned to basal insulin had significantly higher mean (SD) admission BG (191.8 [88.2] mg/dL vs 156.4 [65.4] mg/dL, P < .001) and higher mean (SD) HbA1c (8.1% [2.0%] vs 7.01% [1.5%], P < .001), compared with those who remained on continuous SSI. Patients who transitioned to basal insulin were also younger and more likely to have chronic kidney disease (CKD), but less likely to have congestive heart failure, coronary artery disease, or chronic obstructive pulmonary disease (COPD). The Charlson Comorbidity Index score was significantly higher for patients who transitioned to basal (4.4 [2.5]) than for those who remained on continuous SSI (4.1 [2.5], P < .001). There were no significant differences among sex, BMI, or glomerular filtration rate (GFR) on admission. Of those transitioned to basal insulin, 53% achieved a mean hospitalization BG <180 mg/dL, compared with 82% of those on continuous SSI. The overall rate of hypoglycemia in the continuous SSI group was 8% compared with 18% in those transitioned to basal insulin.
Of the patients who remained on continuous SSI throughout the hospitalization, 3,319 patients (48%) had admission BG <140 mg/dL, 1,671 patients (24%) had admission BG 140 to 180 mg/dL, and 1,913 patients (28%) had admission BG >180 mg/dL. Only 9% of patients who remained on continuous SSI had admission BG ≥250 mg/dL. Patients with admission BG <140 mg/dL were older, had lower BMI and HbA1c, had higher rates of COPD and CKD, and were more likely to be admitted to a surgical service compared with patients with admission BG >140 mg/dL (P < .05 for all; Table 2).
Hospital glycemic control for patients on continuous SSI according to admission BG is displayed in Table 3. Among patients who remained on continuous SSI, 96% of patients with admission BG <140 mg/dL had a mean hospital BG <180 mg/dL; of them, 86% achieved target control without hypoglycemia. Similar rates of target control were achieved in patients with admission BG 140 to 180 mg/dL (83%), in contrast to patients with admission BG ≥250 mg/dL, of whom only 18% achieved target control (P < .001). These findings parallel those seen in patients transitioned to basal insulin. Of patients in the transition group admitted with BG <140 mg/dL and <180 mg/dL, 88.5% and 84.6% had mean hospital BG <180 mg/dL, respectively, while 69.1% and 68.9% had mean BG between 70 and 180 mg/dL without hypoglycemia. The overall frequency of hypoglycemia <70 mg/dL among patients on continuous SSI was 8% and was more common in patients with admission BG <140 mg/dL (10%) compared with patients with higher admission glucose levels (BG 140-180 mg/dL [4%], 180-250 mg/dL [4%], or ≥250 mg/dL [6%], P < .001). There was no difference in rates of severe hypoglycemia <40 mg/dL among groups.
HbA1c data were available for 2,560 of the patients on continuous SSI (Table 3). Mean hospital BG increased significantly with increasing HbA1c values. Patients admitted with HbA1c <7% had lower mean (SD) hospital BG (132.2 [28.2] mg/dL) and were more likely to achieve target glucose control during hospitalization (85%) compared with those with HbA1c 7% to 8% (mean BG, 148.7 [30.8] mg/dL; 80% target control), HbA1c 8% to 9% (mean BG, 169.1 [37.9] mg/dL; 61% target control), or HbA1c ≥9% (mean BG, 194.9 [53.4] mg/dL; 38% target control) (P < .001).
In a logistic regression analysis adjusted for age, gender, BMI, race, setting (medicine vs surgery), and Charlson Comorbidity Index score, the odds of poor glycemic control increased with higher admission BG (admission BG 140-180 mg/dL: odds ratio [OR], 1.8; 95% CI, 1.5-2.2; admission BG 180-250 mg/dL: OR, 3.7; 95% CI, 3.1-4.4; admission BG ≥250 mg/dL: OR, 7.2; 95% CI, 5.8-9.0; reference admission BG <140 mg/dL; Figure). Similarly, the logistic regression analysis showed greater odds of poor in-hospital glycemic control with increasing HbA1c (OR, 6.1; 95% CI, 4.3-8.8 for HbA1c >9% compared with HbA1c <7%).
DISCUSSION
This large retrospective cohort study examined the effectiveness of SSI for glycemic control in noncritical inpatients with T2D. Our results indicate that SSI is still widely used in our hospital system, with 31.4% of our initial cohort managed with SSI alone. We found that 86% of patients with BG <140 mg/dL and 83% of patients with BG 140 to 180 mg/dL achieved glycemic control without hypoglycemia when managed with SSI alone, compared with 53% of those admitted with BG 180 to 250 mg/dL and only 18% of those with admission BG ≥250 mg/dL. This high success rate of achieving optimal BG control with SSI alone is comparable to that seen with transition to basal insulin and may explain the prevalent use of SSI for the management of patients with T2D and mild to moderate hyperglycemia.
Published clinical guideline recommendations promoting the use of basal-bolus insulin treatment algorithms are based on the results of a few RCTs that compared the efficacy of SSI vs a basal-bolus insulin regimen. These studies reported significantly lower mean daily BG concentration with basal or basal-bolus insulin therapy compared with SSI.10,11,24 However, it is interesting to note that the mean admission BG of patients treated with SSI in these RCTs ranged from 184 to 225 mg/dL. Patients in these trials were excluded if admission BG was <140 mg/dL.10,11,24 This is in contrast to our study evaluating real-world data in non–critically ill settings in which we found that 48% of patients treated with SSI had admission BG <140 mg/dL, and nearly 75% had admission BG <180 mg/dL. This suggests that by nature of study design, most RCTs excluded the population of patients who do achieve good glycemic control with SSI and may have contributed to the perception that basal insulin is preferable in all populations.
Our analysis indicates that healthcare professionals should consider admission BG when selecting the type of insulin regimen to manage patients with T2D in the hospital. Our results suggest that SSI may be appropriate for many patients with admission BG <180 mg/dL and should be avoided as monotherapy in patients with admission BG ≥180 mg/dL, as the proportion of patients achieving target control decreased with increasing admission BG. More importantly, if a patient is not controlled with SSI alone, intensification of therapy with the addition of basal insulin is indicated to achieve glycemic control. In addition, we found that the admission HbA1c is an appropriate marker to consider as well, with hospital glycemic control deteriorating with increasing HbA1c values, paralleling the admission BG. The main limitation to widespread use of HbA1c for therapeutic decision-making is access to values at time of patient admission; in our population, only 37% of patients had an HbA1c value available during the index hospitalization.
Previous publications have reported that hypoglycemia carries significant safety concerns, especially among a hospitalized population.25-27 As such, we included hypoglycemia as an important metric in our definition of target glycemic control rather than simply using mean hospital BG or number of hyperglycemic events to define treatment effectiveness. We did find a higher rate of hypoglycemia in patients with moderate admission BG treated with SSI compared with those with higher admission BG; however, few patients overall experienced clinically significant (<54 mg/dL) or severe (<40 mg/dL) hypoglycemia.
In our population, only 15% of patients started on SSI received additional basal insulin during hospitalization. This finding is similar to data reported in the Rabbit 2 trial, in which 14% of patients failed SSI alone, with a higher failure rate among those with higher BG on admission.10 Given the observational nature of this study, we cannot definitively state why certain patients in our population required additional basal insulin, but we can hypothesize that these patients admitted with BG ≥180 mg/dL had higher treatment failure rates and greater rates of hyperglycemia, therefore receiving intensified insulin therapy as clinically indicated at the discretion of the treating physician. Patients who transitioned from SSI to basal insulin had significantly higher admission BG and HbA1c compared with patients who remained on SSI alone. We noted that the rates of hypoglycemia were higher in the group that transitioned to basal (18% vs 8%) and similar to rates reported in previous RCTs.11,24
This observational study takes advantage of a large, diverse study population and a combination of medicine and surgery patients in a real-world setting. We acknowledge several limitations in our study. Our primary data were observational in nature, and as such, some baseline patient characteristics were notably different between groups, suggesting selection bias for treatment allocation to SSI. We do not know which patients were managed by primary teams compared with specialized diabetes consult services, which may also influence treatment regimens. We did not have access to information about patients’ at-home diabetes medication regimens or duration of diabetes, both of which have been shown in prior publications to affect an individual’s overall hospital glycemic control. Data on HbA1c values were available for only approximately one-third of patients. In addition, our study did not include patients without a history of diabetes who developed stress-induced hyperglycemia, a population that may benefit from conservative therapy such as SSI.28 A diagnosis of CKD was defined based on ICD 9/10 codes and not on admission estimated GFR. More specific data regarding stage of CKD or changes in renal function over the duration of hospitalization are not available, which could influence insulin prescribing practice. In addition, we defined the basal group as patients prescribed any form of basal insulin (NPH, glargine, detemir or degludec), and we do not have information on the use of prandial versus correction doses of rapid-acting insulin in the basal insulin–treated group.
CONCLUSION
In conclusion, our observational study indicates that the use of SSI results in appropriate target glycemic control for most noncritical medicine and surgery patients with admission BG <180 mg/dL. In agreement with previous RCTs, our study confirms that SSI as monotherapy is frequently inadequate in patients with significant hyperglycemia >180 mg/dL.10,11,24,29 We propose that an individualized approach to inpatient glycemic management is imperative, and cautious use of SSI may be a viable option for certain patients with mild hyperglycemia and admission BG <180 mg/dL. Further observational and randomized studies are needed to confirm the efficacy of SSI therapy in T2D patients with mild hyperglycemia. By identifying which subset of patients can be safely managed with SSI alone, we can better understand which patients will require escalation of therapy with intensive glucose management.
Sliding scale insulin (SSI) for inpatient glycemic control was first proposed by Elliott P Joslin in 1934 when he recommended titration of insulin based on urine glucose levels.1 As bedside glucose meters became widely available, physicians transitioned to dosing SSI based on capillary blood glucose (BG) levels,2,3 and SSI became widely used for the management of inpatient hyperglycemia.1 However, during the past decade, there has been strong opposition to the use of SSI in hospitals. Many authors oppose its use, highlighting the retrospective rather than prospective nature of SSI therapy and concerns about inadequate glycemic control.4-6 In 2004, the American College of Endocrinology first released a position statement discouraging the use of SSI alone and recommended basal-bolus insulin as the preferred method of glycemic control for inpatients with type 2 diabetes (T2D).7 The American Diabetes Association (ADA) inpatient guidelines in 20058 and the Endocrine Society guidelines in 20129 also opposed SSI monotherapy and reaffirmed that a basal-bolus insulin regimen should be used for most non–critically ill patients with diabetes. Those guidelines remain in place currently.
Several randomized controlled trials (RCTs) and meta-analyses have shown that basal-bolus insulin regimens provide superior glycemic control in non–critical inpatients when compared with SSI alone.10-14 In addition, the RABBIT 2 (Randomized Study of Basal-Bolus Insulin Therapy in the Inpatient Management of Patients With Type 2 Diabetes) trial showed a significant reduction in perioperative complications10 among surgical patients when treated with basal-bolus insulin therapy. Despite these studies and strong recommendations against its use, SSI continues to be widely used in the United States. According to a 2007 survey of 44 US hospitals, 41% of noncritical patients with hyperglycemia were treated with SSI alone.15 In addition, SSI remains one of the most commonly prescribed insulin regimens in many countries around the world.16-19 The persistence of SSI use raises questions as to why clinicians continue to use a therapy that has been strongly criticized. Some authors point to convenience and fear of hypoglycemia with a basal-bolus insulin regimen.20,21 Alternatively, it is possible that SSI usage remains so pervasive because it is effective in a subset of patients. In fact, a 2018 Cochrane review concluded that existing evidence is not sufficiently robust to definitively recommend basal-bolus insulin over SSI for inpatient diabetes management of non–critically ill patients despite existing guidelines.22
Owing to the ongoing controversy and widespread use of SSI, we designed an exploratory analysis to understand the rationale for such therapy by investigating whether a certain subpopulation of hospitalized patients with T2D may achieve target glycemic control with SSI alone. We hypothesized that noncritical patients with mild hyperglycemia and admission BG <180 mg/dL would do well with SSI alone and may not require intensive treatment with basal-bolus insulin regimens. To address this question, we used electronic health records with individual-level patient data to assess inpatient glycemic control of non–critically ill patients with T2D treated with SSI alone.
METHODS
Participants
Data from 25,813 adult noncritical inpatients with T2D, with an index admission between June 1, 2010, and June 30, 2018, were obtained through the Emory Healthcare Clinical Data Warehouse infrastructure program. All patients were admitted to Emory Healthcare hospitals, including Emory University Hospital, Emory University Hospital Midtown, and Emory Saint Joseph’s Hospital, in Atlanta, Georgia. Data were extracted for each patient during the index hospitalization, including demographics, anthropometrics, and admission and inpatient laboratory values. Information was collected on daily point-of-care glucose values, hemoglobin A1c (HbA1c), hypoglycemic events, insulin doses, hospital complications, comorbidities, and hospital setting (medical vs surgical admission). International Classification of Diseases, 9th and 10th Revisions (ICD-9/10) codes were used to determine diagnosis of T2D, comorbidities, and complications.
From our initial dataset, we identified 16,366 patients who were treated with SSI during hospitalization. We excluded patients who were admitted to the intensive care unit (ICU) or placed on intravenous insulin, patients with missing admission BG values, and patients with a length of stay less than 1 day. To prevent inclusion of patients presenting in diabetic ketoacidosis or hyperosmolar hyperglycemic syndrome, we excluded patients with an admission BG >500 mg/dL. We then excluded 6,739 patients who received basal insulin within the first 2 days of hospitalization, as well as 943 patients who were treated with noninsulin (oral or injectable) antidiabetic agents. Our final dataset included 8,095 patients (Appendix Figure).
Patients in the SSI cohort included all patients who were treated with short-acting insulin only (regular insulin or rapid-acting [lispro, aspart, glulisine] insulin analogs) during the first 2 days of hospitalization. Patients who remained on only short-acting insulin during the entire hospitalization were defined as continuous SSI patients. Patients who subsequently received basal insulin after day 2 of hospitalization were defined as patients who transitioned to basal. Patients were stratified according to admission BG levels (first BG available on day of admission) and HbA1c (when available during index admission). We compared the baseline characteristics and clinical outcomes of patients who remained on SSI alone throughout the entirety of hospitalization with those of patients who required transition to basal insulin. The mean hospital BG was calculated by taking the average of all BG measurements during the hospital stay. We defined hypoglycemia as a BG <70 mg/dL and severe hypoglycemia as BG <40 mg/dL. Repeated hypoglycemia values were excluded if they occurred within a period of 2 hours.
Outcome Measures
The primary outcome was the percentage of patients with T2D achieving target glycemic control with SSI therapy, defined as mean hospital BG between 70 and 180 mg/dL without hypoglycemia <70 mg/dL during hospital stay. This threshold was determined based on 2019 ADA recommendations targeting hospital BG <180 mg/dL and avoidance of hypoglycemia.23
Statistical Analysis
Patients were stratified according to continuous SSI versus transitioned to basal treatment. Patients who remained on continuous SSI were further categorized into four categories based on admission BG: <140 mg/dL, 140 to 180 mg/dL, 180 to 250 mg/dL, and ≥250 mg/dL. Clinical characteristics were compared using Wilcoxon rank-sum tests (if continuous) and chi-square tests or Fisher exact tests (if categorical). We then compared the clinical outcomes among continuous SSI patients with different admission BG levels (<140 mg/dL, 140-180 mg/dL, 180-250 mg/dL, and ≥250 mg/dL) and with different HbA1c levels (<7%, 7%-8%, 8%-9%, ≥9%). Within each scenario, logistic regression for the outcome of poor glycemic control, defined as mean hospital BG >180 mg/dL, was performed to evaluate the HbA1c levels and admission BG levels controlling for other factors (age, gender, body mass index [BMI], race, setting [medicine versus surgery] and Charlson Comorbidity Index score). A P value < .05 was regarded as statistically significant. All analyses were performed based on available cases and conducted in SAS version 9.4 (SAS Institute Inc.).
RESULTS
Among 25,813 adult patients with T2D, 8,095 patients (31.4%) were treated with SSI alone during the first 2 days of hospitalization. Of those patients treated with SSI, 6,903 (85%) remained on continuous SSI alone during the entire hospitalization, and 1,192 (15%) were transitioned to basal insulin. The clinical characteristics of these patients on continuous SSI and those who transitioned to basal insulin are shown in Table 1. Patients who transitioned to basal insulin had significantly higher mean (SD) admission BG (191.8 [88.2] mg/dL vs 156.4 [65.4] mg/dL, P < .001) and higher mean (SD) HbA1c (8.1% [2.0%] vs 7.01% [1.5%], P < .001), compared with those who remained on continuous SSI. Patients who transitioned to basal insulin were also younger and more likely to have chronic kidney disease (CKD), but less likely to have congestive heart failure, coronary artery disease, or chronic obstructive pulmonary disease (COPD). The Charlson Comorbidity Index score was significantly higher for patients who transitioned to basal (4.4 [2.5]) than for those who remained on continuous SSI (4.1 [2.5], P < .001). There were no significant differences among sex, BMI, or glomerular filtration rate (GFR) on admission. Of those transitioned to basal insulin, 53% achieved a mean hospitalization BG <180 mg/dL, compared with 82% of those on continuous SSI. The overall rate of hypoglycemia in the continuous SSI group was 8% compared with 18% in those transitioned to basal insulin.
Of the patients who remained on continuous SSI throughout the hospitalization, 3,319 patients (48%) had admission BG <140 mg/dL, 1,671 patients (24%) had admission BG 140 to 180 mg/dL, and 1,913 patients (28%) had admission BG >180 mg/dL. Only 9% of patients who remained on continuous SSI had admission BG ≥250 mg/dL. Patients with admission BG <140 mg/dL were older, had lower BMI and HbA1c, had higher rates of COPD and CKD, and were more likely to be admitted to a surgical service compared with patients with admission BG >140 mg/dL (P < .05 for all; Table 2).
Hospital glycemic control for patients on continuous SSI according to admission BG is displayed in Table 3. Among patients who remained on continuous SSI, 96% of patients with admission BG <140 mg/dL had a mean hospital BG <180 mg/dL; of them, 86% achieved target control without hypoglycemia. Similar rates of target control were achieved in patients with admission BG 140 to 180 mg/dL (83%), in contrast to patients with admission BG ≥250 mg/dL, of whom only 18% achieved target control (P < .001). These findings parallel those seen in patients transitioned to basal insulin. Of patients in the transition group admitted with BG <140 mg/dL and <180 mg/dL, 88.5% and 84.6% had mean hospital BG <180 mg/dL, respectively, while 69.1% and 68.9% had mean BG between 70 and 180 mg/dL without hypoglycemia. The overall frequency of hypoglycemia <70 mg/dL among patients on continuous SSI was 8% and was more common in patients with admission BG <140 mg/dL (10%) compared with patients with higher admission glucose levels (BG 140-180 mg/dL [4%], 180-250 mg/dL [4%], or ≥250 mg/dL [6%], P < .001). There was no difference in rates of severe hypoglycemia <40 mg/dL among groups.
HbA1c data were available for 2,560 of the patients on continuous SSI (Table 3). Mean hospital BG increased significantly with increasing HbA1c values. Patients admitted with HbA1c <7% had lower mean (SD) hospital BG (132.2 [28.2] mg/dL) and were more likely to achieve target glucose control during hospitalization (85%) compared with those with HbA1c 7% to 8% (mean BG, 148.7 [30.8] mg/dL; 80% target control), HbA1c 8% to 9% (mean BG, 169.1 [37.9] mg/dL; 61% target control), or HbA1c ≥9% (mean BG, 194.9 [53.4] mg/dL; 38% target control) (P < .001).
In a logistic regression analysis adjusted for age, gender, BMI, race, setting (medicine vs surgery), and Charlson Comorbidity Index score, the odds of poor glycemic control increased with higher admission BG (admission BG 140-180 mg/dL: odds ratio [OR], 1.8; 95% CI, 1.5-2.2; admission BG 180-250 mg/dL: OR, 3.7; 95% CI, 3.1-4.4; admission BG ≥250 mg/dL: OR, 7.2; 95% CI, 5.8-9.0; reference admission BG <140 mg/dL; Figure). Similarly, the logistic regression analysis showed greater odds of poor in-hospital glycemic control with increasing HbA1c (OR, 6.1; 95% CI, 4.3-8.8 for HbA1c >9% compared with HbA1c <7%).
DISCUSSION
This large retrospective cohort study examined the effectiveness of SSI for glycemic control in noncritical inpatients with T2D. Our results indicate that SSI is still widely used in our hospital system, with 31.4% of our initial cohort managed with SSI alone. We found that 86% of patients with BG <140 mg/dL and 83% of patients with BG 140 to 180 mg/dL achieved glycemic control without hypoglycemia when managed with SSI alone, compared with 53% of those admitted with BG 180 to 250 mg/dL and only 18% of those with admission BG ≥250 mg/dL. This high success rate of achieving optimal BG control with SSI alone is comparable to that seen with transition to basal insulin and may explain the prevalent use of SSI for the management of patients with T2D and mild to moderate hyperglycemia.
Published clinical guideline recommendations promoting the use of basal-bolus insulin treatment algorithms are based on the results of a few RCTs that compared the efficacy of SSI vs a basal-bolus insulin regimen. These studies reported significantly lower mean daily BG concentration with basal or basal-bolus insulin therapy compared with SSI.10,11,24 However, it is interesting to note that the mean admission BG of patients treated with SSI in these RCTs ranged from 184 to 225 mg/dL. Patients in these trials were excluded if admission BG was <140 mg/dL.10,11,24 This is in contrast to our study evaluating real-world data in non–critically ill settings in which we found that 48% of patients treated with SSI had admission BG <140 mg/dL, and nearly 75% had admission BG <180 mg/dL. This suggests that by nature of study design, most RCTs excluded the population of patients who do achieve good glycemic control with SSI and may have contributed to the perception that basal insulin is preferable in all populations.
Our analysis indicates that healthcare professionals should consider admission BG when selecting the type of insulin regimen to manage patients with T2D in the hospital. Our results suggest that SSI may be appropriate for many patients with admission BG <180 mg/dL and should be avoided as monotherapy in patients with admission BG ≥180 mg/dL, as the proportion of patients achieving target control decreased with increasing admission BG. More importantly, if a patient is not controlled with SSI alone, intensification of therapy with the addition of basal insulin is indicated to achieve glycemic control. In addition, we found that the admission HbA1c is an appropriate marker to consider as well, with hospital glycemic control deteriorating with increasing HbA1c values, paralleling the admission BG. The main limitation to widespread use of HbA1c for therapeutic decision-making is access to values at time of patient admission; in our population, only 37% of patients had an HbA1c value available during the index hospitalization.
Previous publications have reported that hypoglycemia carries significant safety concerns, especially among a hospitalized population.25-27 As such, we included hypoglycemia as an important metric in our definition of target glycemic control rather than simply using mean hospital BG or number of hyperglycemic events to define treatment effectiveness. We did find a higher rate of hypoglycemia in patients with moderate admission BG treated with SSI compared with those with higher admission BG; however, few patients overall experienced clinically significant (<54 mg/dL) or severe (<40 mg/dL) hypoglycemia.
In our population, only 15% of patients started on SSI received additional basal insulin during hospitalization. This finding is similar to data reported in the Rabbit 2 trial, in which 14% of patients failed SSI alone, with a higher failure rate among those with higher BG on admission.10 Given the observational nature of this study, we cannot definitively state why certain patients in our population required additional basal insulin, but we can hypothesize that these patients admitted with BG ≥180 mg/dL had higher treatment failure rates and greater rates of hyperglycemia, therefore receiving intensified insulin therapy as clinically indicated at the discretion of the treating physician. Patients who transitioned from SSI to basal insulin had significantly higher admission BG and HbA1c compared with patients who remained on SSI alone. We noted that the rates of hypoglycemia were higher in the group that transitioned to basal (18% vs 8%) and similar to rates reported in previous RCTs.11,24
This observational study takes advantage of a large, diverse study population and a combination of medicine and surgery patients in a real-world setting. We acknowledge several limitations in our study. Our primary data were observational in nature, and as such, some baseline patient characteristics were notably different between groups, suggesting selection bias for treatment allocation to SSI. We do not know which patients were managed by primary teams compared with specialized diabetes consult services, which may also influence treatment regimens. We did not have access to information about patients’ at-home diabetes medication regimens or duration of diabetes, both of which have been shown in prior publications to affect an individual’s overall hospital glycemic control. Data on HbA1c values were available for only approximately one-third of patients. In addition, our study did not include patients without a history of diabetes who developed stress-induced hyperglycemia, a population that may benefit from conservative therapy such as SSI.28 A diagnosis of CKD was defined based on ICD 9/10 codes and not on admission estimated GFR. More specific data regarding stage of CKD or changes in renal function over the duration of hospitalization are not available, which could influence insulin prescribing practice. In addition, we defined the basal group as patients prescribed any form of basal insulin (NPH, glargine, detemir or degludec), and we do not have information on the use of prandial versus correction doses of rapid-acting insulin in the basal insulin–treated group.
CONCLUSION
In conclusion, our observational study indicates that the use of SSI results in appropriate target glycemic control for most noncritical medicine and surgery patients with admission BG <180 mg/dL. In agreement with previous RCTs, our study confirms that SSI as monotherapy is frequently inadequate in patients with significant hyperglycemia >180 mg/dL.10,11,24,29 We propose that an individualized approach to inpatient glycemic management is imperative, and cautious use of SSI may be a viable option for certain patients with mild hyperglycemia and admission BG <180 mg/dL. Further observational and randomized studies are needed to confirm the efficacy of SSI therapy in T2D patients with mild hyperglycemia. By identifying which subset of patients can be safely managed with SSI alone, we can better understand which patients will require escalation of therapy with intensive glucose management.
1. Umpierrez GE, Palacio A, Smiley D. Sliding scale insulin use: myth or insanity? Am J Med. 2007;120(7):563-567. https://doi.org/10.1016/j.amjmed.2006.05.070
2. Kitabchi AE, Ayyagari V, Guerra SM. The efficacy of low-dose versus conventional therapy of insulin for treatment of diabetic ketoacidosis. Ann Intern Med. 1976;84(6):633-638. https://doi.org/10.7326/0003-4819-84-6-633
3. Skyler JS, Skyler DL, Seigler DE, O’Sullivan MJ. Algorithms for adjustment of insulin dosage by patients who monitor blood glucose. Diabetes Care. 1981;4(2):311-318. https://doi.org/10.2337/diacare.4.2.311
4. Gearhart JG, Duncan JL 3rd, Replogle WH, Forbes RC, Walley EJ. Efficacy of sliding-scale insulin therapy: a comparison with prospective regimens. Fam Pract Res J. 1994;14(4):313-322.
5. Queale WS, Seidler AJ, Brancati FL. Glycemic control and sliding scale insulin use in medical inpatients with diabetes mellitus. Arch Intern Med. 1997;157(5):545-552.
6. Clement S, Braithwaite SS, Magee MF, et al. Management of diabetes and hyperglycemia in hospitals. Diabetes Care. 2004;27(2):553-591. https://doi.org/10.2337/diacare.27.2.553
7. Garber AJ, Moghissi ES, Bransome ED Jr, et al. American College of Endocrinology position statement on inpatient diabetes and metabolic control. Endocr Pract. 2004;10(1):78-82. https://doi.org/10.4158/EP.10.1.77
8. American Diabetes Association. Standards of medical care in diabetes. Diabetes Care. 2005;28(suppl 1):S4-S36.
9. Umpierrez GE, Hellman R, Korytkowski MT, , et al. Management of hyperglycemia in hospitalized patients in non-critical care setting: an Endocrine Society clinical practice guideline. J Clin Endocrinol Metab. 2012;97(1):16-38. https://doi.org/10.1210/jc.2011-2098
10. Umpierrez GE, Smiley D, Zisman A, et al. Randomized study of basal-bolus insulin therapy in the inpatient management of patients with type 2 diabetes. Diabetes Care. 2007;30(9):2181-2186. https://doi.org/10.2337/dc07-0295
11. Umpierrez GE, Smiley D, Jacobs S, et al. Randomized study of basal-bolus insulin therapy in the inpatient management of patients with type 2 diabetes undergoing general surgery (RABBIT 2 surgery). Diabetes Care. 2011;34(2):256-261. https://doi.org/10.2337/dc10-1407
12. Schroeder JE, Liebergall M, Raz I, Egleston R, Ben Sussan G, Peyser A. Benefits of a simple glycaemic protocol in an orthopaedic surgery ward: a randomized prospective study. Diabetes Metab Res Rev. 2012;28:71-75. https://doi.org/10.1002/dmrr.1217
13. Lee YY, Lin YM, Leu WJ, et al. Sliding-scale insulin used for blood glucose control: a meta-analysis of randomized controlled trials. Metabolism. 2015;64(9):1183-1192. https://doi.org/10.1016/j.metabol.2015.05.011
14. Christensen MB, Gotfredsen A, Nørgaard K. Efficacy of basal-bolus insulin regimens in the inpatient management of non-critically ill patients with type 2 diabetes: a systematic review and meta-analysis. Diabetes Metab Res Rev. 2017;33(5):e2885. https://doi.org/10.1002/dmrr.2885
15. Wexler DJ, Meigs JB, Cagliero E, Nathan DM, Grant RW. Prevalence of hyper- and hypoglycemia among inpatients with diabetes: a national survey of 44 U.S. hospitals. Diabetes Care. 2007;30(2):367-369. https://doi.org/10.2337/dc06-1715
16. Moreira ED Jr, Silveira PCB, Neves RCS, Souza C Jr, Nunes ZO, Almeida MdCC. Glycemic control and diabetes management in hospitalized patients in Brazil. Diabetol Metab Syndr. 2013;5(1):62. https://doi.org/10.1186/1758-5996-5-62
17. Akhtar ST, Mahmood K, Naqvi IH, Vaswani AS. Inpatient management of type 2 diabetes mellitus: does choice of insulin regimen really matter? Pakistan J Med Sci. 2014;30(4):895-898.
18. Gómez Cuervo C, Sánchez Morla A, Pérez-Jacoiste Asín MA, Bisbal Pardo O, Pérez Ordoño L, Vila Santos J. Effective adverse event reduction with bolus-basal versus sliding scale insulin therapy in patients with diabetes during conventional hospitalization: systematic review and meta-analysis. Endocrinol Nutr. 2016;63(4):145-156. https://doi.org/10.1016/j.endonu.2015.11.008
19. Bain A, Hasan SS, Babar ZUD. Interventions to improve insulin prescribing practice for people with diabetes in hospital: a systematic review. Diabet Med. 2019;36(8):948-960. https://doi.org/10.1111/dme.13982
20. Ambrus DB, O’Connor MJ. Things We Do For No Reason: sliding-scale insulin as monotherapy for glycemic control in hospitalized patients. J Hosp Med. 2019;14(2):114-116. https://doi.org/10.12788/jhm.3109
21. Nau KC, Lorenzetti RC, Cucuzzella M, Devine T, Kline J. Glycemic control in hospitalized patients not in intensive care: beyond sliding-scale insulin. Am Fam Physician. 2010;81(9):1130-1135.
22. Colunga-Lozano LE, Gonzalez Torres FJ, Delgado-Figueroa N, et al. Sliding scale insulin for non-critically ill hospitalised adults with diabetes mellitus. Cochrane Database Syst Rev. 2018;11(11):CD011296. https://doi.org/10.1002/14651858.CD011296.pub2
23. American Diabetes Association. Diabetes care in the hospital: Standards of Medical Care in Diabetes—2019. Diabetes Care. 2019;42(suppl 1):S173-S181. https://doi.org/10.2337/dc19-S015
24. Umpierrez GE, Smiley D, Hermayer K, et al. Randomized study comparing a basal-bolus with a basal plus correction management of medical and surgical patients with type 2 diabetes: basal plus trial. Diabetes Care. 2013;36(8):2169-2174. https://doi.org/10.2337/dc12-1988
25. Turchin A, Matheny ME, Shubina M, Scanlon SV, Greenwood B, Pendergrass ML. Hypoglycemia and clinical outcomes in patients with diabetes hospitalized in the general ward. Diabetes Care. 2009;32(7):1153-1157. https://doi.org/10.2337/dc08-2127
26. Garg R, Hurwitz S, Turchin A, Trivedi A. Hypoglycemia, with or without insulin therapy, is associated with increased mortality among hospitalized patients. Diabetes Care. 2013;36(5):1107-1110. https://doi.org/10.2337/dc12-1296
27. Zapatero A, Gómez-Huelgas R, González N, et al. Frequency of hypoglycemia and its impact on length of stay, mortality, and short-term readmission in patients with diabetes hospitalized in internal medicine wards. Endocr Pract. 2014;20(9):870-875. https://doi.org/10.4158/EP14006.OR
28. Umpierrez GE, Isaacs SD, Bazargan N, You X, Thaler LM, Kitabchi AE. Hyperglycemia: an independent marker of in-hospital mortality in patients with undiagnosed diabetes. J Clin Endocrinol Metab. 2002;87(3):978-982. https://doi.org/10.1210/jcem.87.3.8341
29. Dickerson LM, Ye X, Sack JL, Hueston WJ. Glycemic control in medical inpatients with type 2 diabetes mellitus receiving sliding scale insulin regimens versus routine diabetes medications: a multicenter randomized controlled trial. Ann Fam Med. 2003;1(1):29-35. https://doi.org/10.1370/afm.2
1. Umpierrez GE, Palacio A, Smiley D. Sliding scale insulin use: myth or insanity? Am J Med. 2007;120(7):563-567. https://doi.org/10.1016/j.amjmed.2006.05.070
2. Kitabchi AE, Ayyagari V, Guerra SM. The efficacy of low-dose versus conventional therapy of insulin for treatment of diabetic ketoacidosis. Ann Intern Med. 1976;84(6):633-638. https://doi.org/10.7326/0003-4819-84-6-633
3. Skyler JS, Skyler DL, Seigler DE, O’Sullivan MJ. Algorithms for adjustment of insulin dosage by patients who monitor blood glucose. Diabetes Care. 1981;4(2):311-318. https://doi.org/10.2337/diacare.4.2.311
4. Gearhart JG, Duncan JL 3rd, Replogle WH, Forbes RC, Walley EJ. Efficacy of sliding-scale insulin therapy: a comparison with prospective regimens. Fam Pract Res J. 1994;14(4):313-322.
5. Queale WS, Seidler AJ, Brancati FL. Glycemic control and sliding scale insulin use in medical inpatients with diabetes mellitus. Arch Intern Med. 1997;157(5):545-552.
6. Clement S, Braithwaite SS, Magee MF, et al. Management of diabetes and hyperglycemia in hospitals. Diabetes Care. 2004;27(2):553-591. https://doi.org/10.2337/diacare.27.2.553
7. Garber AJ, Moghissi ES, Bransome ED Jr, et al. American College of Endocrinology position statement on inpatient diabetes and metabolic control. Endocr Pract. 2004;10(1):78-82. https://doi.org/10.4158/EP.10.1.77
8. American Diabetes Association. Standards of medical care in diabetes. Diabetes Care. 2005;28(suppl 1):S4-S36.
9. Umpierrez GE, Hellman R, Korytkowski MT, , et al. Management of hyperglycemia in hospitalized patients in non-critical care setting: an Endocrine Society clinical practice guideline. J Clin Endocrinol Metab. 2012;97(1):16-38. https://doi.org/10.1210/jc.2011-2098
10. Umpierrez GE, Smiley D, Zisman A, et al. Randomized study of basal-bolus insulin therapy in the inpatient management of patients with type 2 diabetes. Diabetes Care. 2007;30(9):2181-2186. https://doi.org/10.2337/dc07-0295
11. Umpierrez GE, Smiley D, Jacobs S, et al. Randomized study of basal-bolus insulin therapy in the inpatient management of patients with type 2 diabetes undergoing general surgery (RABBIT 2 surgery). Diabetes Care. 2011;34(2):256-261. https://doi.org/10.2337/dc10-1407
12. Schroeder JE, Liebergall M, Raz I, Egleston R, Ben Sussan G, Peyser A. Benefits of a simple glycaemic protocol in an orthopaedic surgery ward: a randomized prospective study. Diabetes Metab Res Rev. 2012;28:71-75. https://doi.org/10.1002/dmrr.1217
13. Lee YY, Lin YM, Leu WJ, et al. Sliding-scale insulin used for blood glucose control: a meta-analysis of randomized controlled trials. Metabolism. 2015;64(9):1183-1192. https://doi.org/10.1016/j.metabol.2015.05.011
14. Christensen MB, Gotfredsen A, Nørgaard K. Efficacy of basal-bolus insulin regimens in the inpatient management of non-critically ill patients with type 2 diabetes: a systematic review and meta-analysis. Diabetes Metab Res Rev. 2017;33(5):e2885. https://doi.org/10.1002/dmrr.2885
15. Wexler DJ, Meigs JB, Cagliero E, Nathan DM, Grant RW. Prevalence of hyper- and hypoglycemia among inpatients with diabetes: a national survey of 44 U.S. hospitals. Diabetes Care. 2007;30(2):367-369. https://doi.org/10.2337/dc06-1715
16. Moreira ED Jr, Silveira PCB, Neves RCS, Souza C Jr, Nunes ZO, Almeida MdCC. Glycemic control and diabetes management in hospitalized patients in Brazil. Diabetol Metab Syndr. 2013;5(1):62. https://doi.org/10.1186/1758-5996-5-62
17. Akhtar ST, Mahmood K, Naqvi IH, Vaswani AS. Inpatient management of type 2 diabetes mellitus: does choice of insulin regimen really matter? Pakistan J Med Sci. 2014;30(4):895-898.
18. Gómez Cuervo C, Sánchez Morla A, Pérez-Jacoiste Asín MA, Bisbal Pardo O, Pérez Ordoño L, Vila Santos J. Effective adverse event reduction with bolus-basal versus sliding scale insulin therapy in patients with diabetes during conventional hospitalization: systematic review and meta-analysis. Endocrinol Nutr. 2016;63(4):145-156. https://doi.org/10.1016/j.endonu.2015.11.008
19. Bain A, Hasan SS, Babar ZUD. Interventions to improve insulin prescribing practice for people with diabetes in hospital: a systematic review. Diabet Med. 2019;36(8):948-960. https://doi.org/10.1111/dme.13982
20. Ambrus DB, O’Connor MJ. Things We Do For No Reason: sliding-scale insulin as monotherapy for glycemic control in hospitalized patients. J Hosp Med. 2019;14(2):114-116. https://doi.org/10.12788/jhm.3109
21. Nau KC, Lorenzetti RC, Cucuzzella M, Devine T, Kline J. Glycemic control in hospitalized patients not in intensive care: beyond sliding-scale insulin. Am Fam Physician. 2010;81(9):1130-1135.
22. Colunga-Lozano LE, Gonzalez Torres FJ, Delgado-Figueroa N, et al. Sliding scale insulin for non-critically ill hospitalised adults with diabetes mellitus. Cochrane Database Syst Rev. 2018;11(11):CD011296. https://doi.org/10.1002/14651858.CD011296.pub2
23. American Diabetes Association. Diabetes care in the hospital: Standards of Medical Care in Diabetes—2019. Diabetes Care. 2019;42(suppl 1):S173-S181. https://doi.org/10.2337/dc19-S015
24. Umpierrez GE, Smiley D, Hermayer K, et al. Randomized study comparing a basal-bolus with a basal plus correction management of medical and surgical patients with type 2 diabetes: basal plus trial. Diabetes Care. 2013;36(8):2169-2174. https://doi.org/10.2337/dc12-1988
25. Turchin A, Matheny ME, Shubina M, Scanlon SV, Greenwood B, Pendergrass ML. Hypoglycemia and clinical outcomes in patients with diabetes hospitalized in the general ward. Diabetes Care. 2009;32(7):1153-1157. https://doi.org/10.2337/dc08-2127
26. Garg R, Hurwitz S, Turchin A, Trivedi A. Hypoglycemia, with or without insulin therapy, is associated with increased mortality among hospitalized patients. Diabetes Care. 2013;36(5):1107-1110. https://doi.org/10.2337/dc12-1296
27. Zapatero A, Gómez-Huelgas R, González N, et al. Frequency of hypoglycemia and its impact on length of stay, mortality, and short-term readmission in patients with diabetes hospitalized in internal medicine wards. Endocr Pract. 2014;20(9):870-875. https://doi.org/10.4158/EP14006.OR
28. Umpierrez GE, Isaacs SD, Bazargan N, You X, Thaler LM, Kitabchi AE. Hyperglycemia: an independent marker of in-hospital mortality in patients with undiagnosed diabetes. J Clin Endocrinol Metab. 2002;87(3):978-982. https://doi.org/10.1210/jcem.87.3.8341
29. Dickerson LM, Ye X, Sack JL, Hueston WJ. Glycemic control in medical inpatients with type 2 diabetes mellitus receiving sliding scale insulin regimens versus routine diabetes medications: a multicenter randomized controlled trial. Ann Fam Med. 2003;1(1):29-35. https://doi.org/10.1370/afm.2
© 2021 Society of Hospital Medicine
Identifying the Sickest During Triage: Using Point-of-Care Severity Scores to Predict Prognosis in Emergency Department Patients With Suspected Sepsis
Sepsis is the leading cause of in-hospital mortality in the United States.1 Sepsis is present on admission in 85% of cases, and each hour delay in antibiotic treatment is associated with 4% to 7% increased odds of mortality.2,3 Prompt identification and treatment of sepsis is essential for reducing morbidity and mortality, but identifying sepsis during triage is challenging.2
Risk stratification scores that rely solely on data readily available at the bedside have been developed to quickly identify those at greatest risk of poor outcomes from sepsis in real time. The quick Sequential Organ Failure Assessment (qSOFA) score, the National Early Warning System (NEWS2), and the Shock Index are easy-to-calculate measures that use routinely collected clinical data that are not subject to laboratory delay. These scores can be incorporated into electronic health record (EHR)-based alerts and can be calculated longitudinally to track the risk of poor outcomes over time. qSOFA was developed to quantify patient risk at bedside in non-intensive care unit (ICU) settings, but there is no consensus about its ability to predict adverse outcomes such as mortality and ICU admission.4-6 The United Kingdom’s National Health Service uses NEWS2 to identify patients at risk for sepsis.7 NEWS has been shown to have similar or better sensitivity in identifying poorer outcomes in sepsis patients compared with systemic inflammatory response syndrome (SIRS) criteria and qSOFA.4,8-11 However, since the latest update of NEWS2 in 2017, there has been little study of its predictive ability. The Shock Index is a simple bedside score (heart rate divided by systolic blood pressure) that was developed to detect changes in cardiovascular performance before systemic shock onset. Although it was not developed for infection and has not been regularly applied in the sepsis literature, the Shock Index might be useful for identifying patients at increased risk of poor outcomes. Patients with higher and sustained Shock Index scores are more likely to experience morbidity, such as hyperlactatemia, vasopressor use, and organ failure, and also have an increased risk of mortality.12-14
Although the predictive abilities of these bedside risk stratification scores have been assessed individually using standard binary cut-points, the comparative performance of qSOFA, the Shock Index, and NEWS2 has not been evaluated in patients presenting to an emergency department (ED) with suspected sepsis.
METHODS
Design and Setting
We conducted a retrospective cohort study of ED patients who presented with suspected sepsis to the University of California San Francisco (UCSF) Helen Diller Medical Center at Parnassus Heights between June 1, 2012, and December 31, 2018. Our institution is a 785-bed academic teaching hospital with approximately 30,000 ED encounters per year. The study was approved with a waiver of informed consent by the UCSF Human Research Protection Program.
Participants
We use an Epic-based EHR platform (Epic 2017, Epic Systems Corporation) for clinical care, which was implemented on June 1, 2012. All data elements were obtained from Clarity, the relational database that stores Epic’s inpatient data. The study included encounters for patients age ≥18 years who had blood cultures ordered within 24 hours of ED presentation and administration of intravenous antibiotics within 24 hours. Repeat encounters were treated independently in our analysis.
Outcomes and Measures
We compared the ability of qSOFA, the Shock Index, and NEWS2 to predict in-hospital mortality and admission to the ICU from the ED (ED-to-ICU admission). We used the
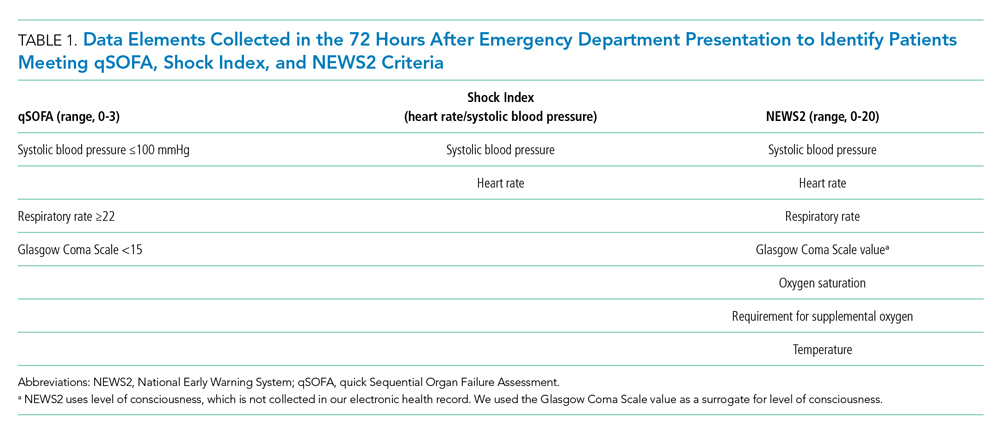
We compared demographic and clinical characteristics of patients who were positive for qSOFA, the Shock Index, and NEWS2. Demographic data were extracted from the EHR and included primary language, age, sex, and insurance status. All International Classification of Diseases (ICD)-9/10 diagnosis codes were pulled from Clarity billing tables. We used the Elixhauser comorbidity groupings19 of ICD-9/10 codes present on admission to identify preexisting comorbidities and underlying organ dysfunction. To estimate burden of comorbid illnesses, we calculated the validated van Walraven comorbidity index,20 which provides an estimated risk of in-hospital death based on documented Elixhauser comorbidities. Admission level of care (acute, stepdown, or intensive care) was collected for inpatient admissions to assess initial illness severity.21 We also evaluated discharge disposition and in-hospital mortality. Index blood culture results were collected, and dates and timestamps of mechanical ventilation, fluid, vasopressor, and antibiotic administration were obtained for the duration of the encounter.
UCSF uses an automated, real-time, algorithm-based severe sepsis alert that is triggered when a patient meets ≥2 SIRS criteria and again when the patient meets severe sepsis or septic shock criteria (ie, ≥2 SIRS criteria in addition to end-organ dysfunction and/or fluid nonresponsive hypotension). This sepsis screening alert was in use for the duration of our study.22
Statistical Analysis
We performed a subgroup analysis among those who were diagnosed with sepsis, according to the 2016 Third International Consensus Definitions for Sepsis and Septic Shock (Sepsis-3) criteria.
All statistical analyses were conducted using Stata 14 (StataCorp). We summarized differences in demographic and clinical characteristics among the populations meeting each severity score but elected not to conduct hypothesis testing because patients could be positive for one or more scores. We calculated sensitivity, specificity, positive predictive value (PPV), and negative predictive value (NPV) for each score to predict in-hospital mortality and ED-to-ICU admission. To allow comparison with other studies, we also created a composite outcome of either in-hospital mortality or ED-to-ICU admission.
RESULTS
Within our sample 23,837 ED patients had blood cultures ordered within 24 hours of ED presentation and were considered to have suspected sepsis. The mean age of the cohort was 60.8 years, and 1,612 (6.8%) had positive blood cultures. A total of 12,928 patients (54.2%) were found to have sepsis. We documented 1,427 in-hospital deaths (6.0%) and 3,149 (13.2%) ED-to-ICU admissions. At ED triage 1,921 (8.1%) were qSOFA-positive, 4,273 (17.9%) were Shock Index-positive, and 11,832 (49.6%) were NEWS2-positive. At ED triage, blood pressure, heart rate, respiratory rate, and oxygen saturated were documented in >99% of patients, 93.5% had temperature documented, and 28.5% had GCS recorded. If the window of assessment was widened to 1 hour, GCS was only documented among 44.2% of those with suspected sepsis.
Demographic Characteristics and Clinical Course
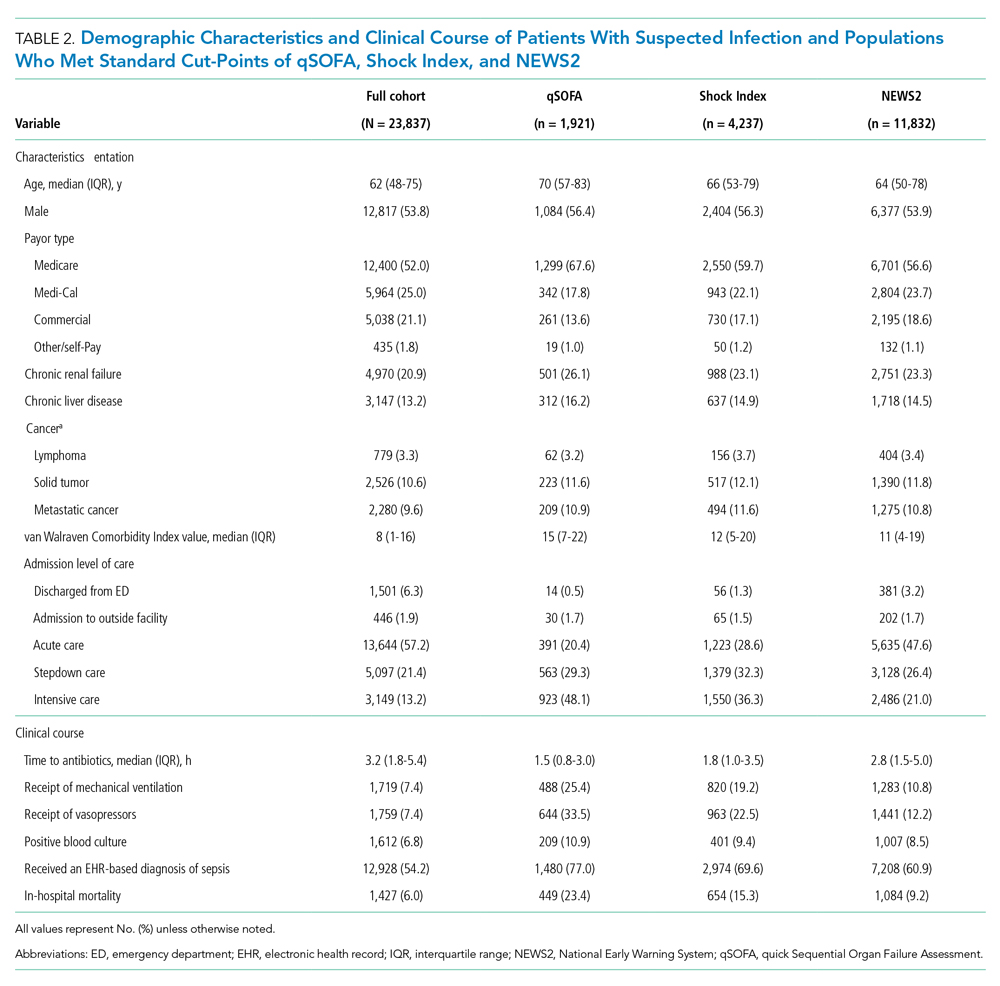
qSOFA-positive patients received antibiotics more quickly than those who were Shock Index-positive or NEWS2-positive (median 1.5, 1.8, and 2.8 hours after admission, respectively). In addition, those who were qSOFA-positive were more likely to have a positive blood culture (10.9%, 9.4%, and 8.5%, respectively) and to receive an EHR-based diagnosis of sepsis (77.0%, 69.6%, and 60.9%, respectively) than those who were Shock Index- or NEWS2-positive. Those who were qSOFA-positive also were more likely to be mechanically ventilated during their hospital stay (25.4%, 19.2%, and 10.8%, respectively) and to receive vasopressors (33.5%, 22.5%, and 12.2%, respectively). In-hospital mortality also was more common among those who were qSOFA-positive at triage (23.4%, 15.3%, and 9.2%, respectively).
Because both qSOFA and NEWS2 incorporate GCS, we explored baseline characteristics of patients with GCS documented at triage (n = 6,794). These patients were older (median age 63 and 61 years, P < .0001), more likely to be male (54.9% and 53.4%, P = .0031), more likely to have renal failure (22.8% and 20.1%, P < .0001), more likely to have liver disease (14.2% and 12.8%, P = .006), had a higher van Walraven comorbidity score on presentation (median 10 and 8, P < .0001), and were more likely to go directly to the ICU from the ED (20.2% and 10.6%, P < .0001). However, among the 6,397 GCS scores documented at triage, only 1,579 (24.7%) were abnormal.
Test Characteristics of qSOFA, Shock Index, and NEWS2 for Predicting In-hospital Mortality and ED-to-ICU Admission
Among 23,837 patients with suspected sepsis, NEWS2 had the highest sensitivity for predicting in-hospital mortality (76.0%; 95% CI, 73.7%-78.2%) and ED-to-ICU admission (78.9%; 95% CI, 77.5%-80.4%) but had the lowest specificity for in-hospital mortality (52.0%; 95% CI, 51.4%-52.7%) and for ED-to-ICU admission (54.8%; 95% CI, 54.1%-55.5%) (Table 3). qSOFA had the lowest sensitivity for in-hospital mortality (31.5%; 95% CI, 29.1%-33.9%) and ED-to-ICU admission (29.3%; 95% CI, 27.7%-30.9%) but the highest specificity for in-hospital mortality (93.4%; 95% CI, 93.1%-93.8%) and ED-to-ICU admission (95.2%; 95% CI, 94.9%-95.5%). The Shock Index had a sensitivity that fell between qSOFA and NEWS2 for in-hospital mortality (45.8%; 95% CI, 43.2%-48.5%) and ED-to-ICU admission (49.2%; 95% CI, 47.5%-51.0%). The specificity of the Shock Index also was between qSOFA and NEWS2 for in-hospital mortality (83.9%; 95% CI, 83.4%-84.3%) and ED-to-ICU admission (86.8%; 95% CI, 86.4%-87.3%). All three scores exhibited relatively low PPV, ranging from 9.2% to 23.4% for in-hospital mortality and 21.0% to 48.0% for ED-to-ICU triage. Conversely, all three scores exhibited relatively high NPV, ranging from 95.5% to 97.1% for in-hospital mortality and 89.8% to 94.5% for ED-to-ICU triage.
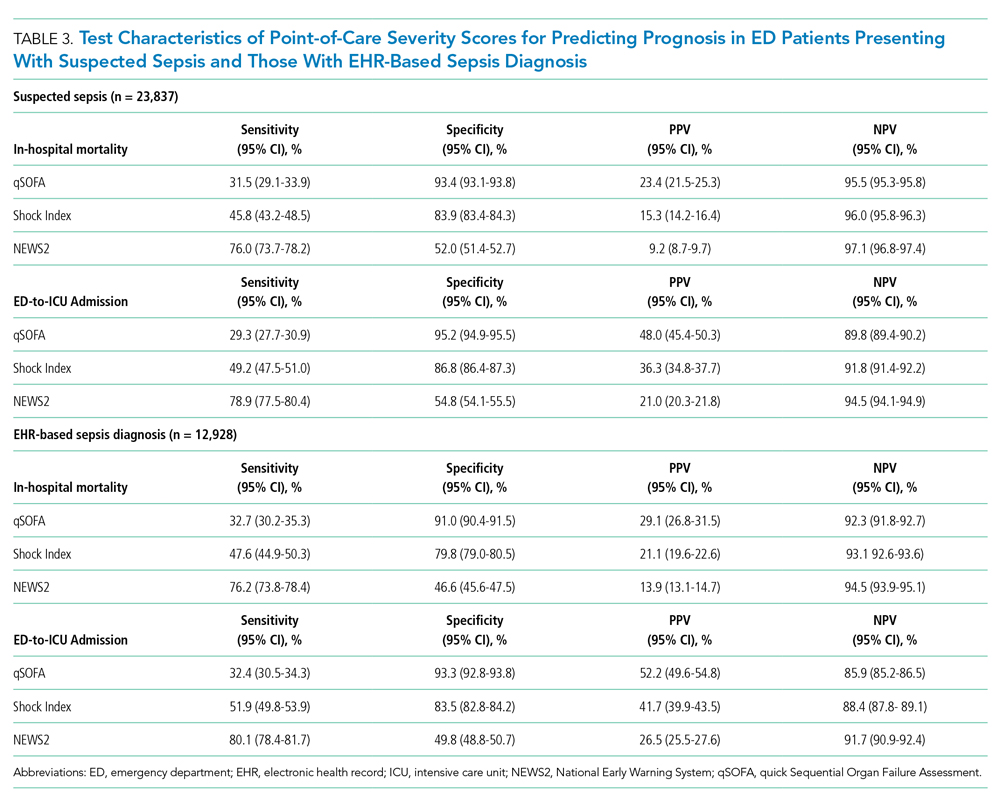
When considering a binary cutoff, the Shock Index exhibited the highest AUROC for in-hospital mortality (0.648; 95% CI, 0.635-0.662) and had a significantly higher AUROC than qSOFA (AUROC, 0.625; 95% CI, 0.612-0.637; P = .0005), but there was no difference compared with NEWS2 (AUROC, 0.640; 95% CI, 0.628-0.652; P = .2112). NEWS2 had a significantly higher AUROC than qSOFA for predicting in-hospital mortality (P = .0227). The Shock Index also exhibited the highest AUROC for ED-to-ICU admission (0.680; 95% CI, 0.617-0.689), which was significantly higher than the AUROC for qSOFA (P < .0001) and NEWS2 (P = 0.0151). NEWS2 had a significantly higher AUROC than qSOFA for predicting ED-to-ICU admission (P < .0001). Similar findings were seen in patients found to have sepsis. 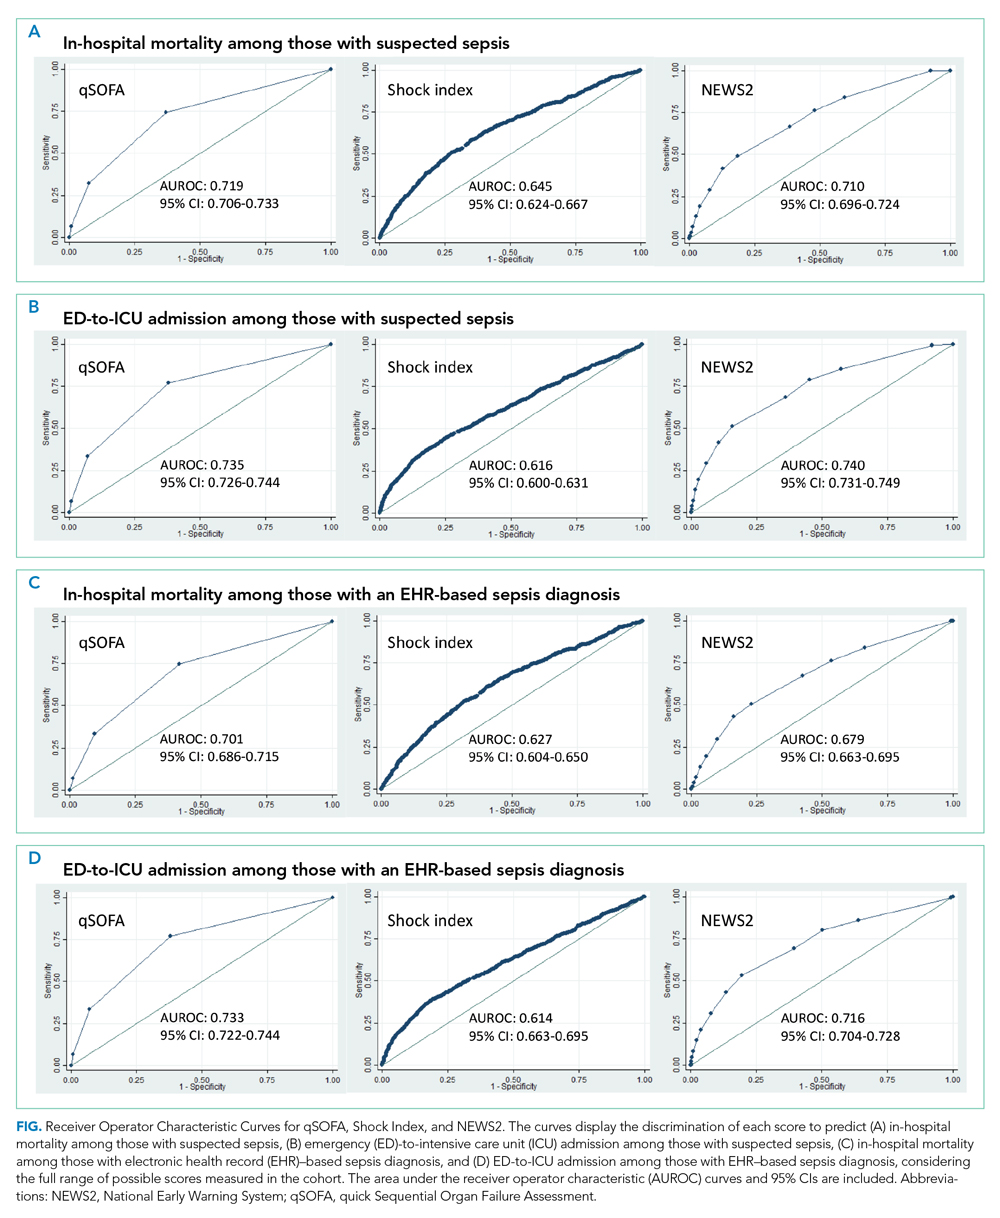
DISCUSSION
In this retrospective cohort study of 23,837 patients who presented to the ED with suspected sepsis, the standard qSOFA threshold was met least frequently, followed by the Shock Index and NEWS2. NEWS2 had the highest sensitivity but the lowest specificity for predicting in-hospital mortality and ED-to-ICU admission, making it a challenging bedside risk stratification scale for identifying patients at risk of poor clinical outcomes. When comparing predictive performance among the three scales, qSOFA had the highest specificity and the Shock Index had the highest AUROC for in-hospital mortality and ED-to-ICU admission in this cohort of patients with suspected sepsis. These trends in sensitivity, specificity, and AUROC were consistent among those who met EHR criteria for a sepsis diagnosis. In the analysis of the three scoring systems using all available cut-points, qSOFA and NEWS2 had the highest AUROCs, followed by the Shock Index.
Considering the rapid progression from organ dysfunction to death in sepsis patients, as well as the difficulty establishing a sepsis diagnosis at triage,23 providers must quickly identify patients at increased risk of poor outcomes when they present to the ED. Sepsis alerts often are built using SIRS criteria,27 including the one used for sepsis surveillance at UCSF since 2012,22 but the white blood cell count criterion is subject to a laboratory lag and could lead to a delay in identification. Implementation of a point-of-care bedside score alert that uses readily available clinical data could allow providers to identify patients at greatest risk of poor outcomes immediately at ED presentation and triage, which motivated us to explore the predictive performance of qSOFA, the Shock Index, and NEWS2.
Our study is the first to provide a head-to-head comparison of the predictive performance of qSOFA, the Shock Index, and NEWS2, three easy-to-calculate bedside risk scores that use EHR data collected among patients with suspected sepsis. The Sepsis-3 guidelines recommend qSOFA to quickly identify non-ICU patients at greatest risk of poor outcomes because the measure exhibited predictive performance similar to the more extensive SOFA score outside the ICU.16,23 Although some studies have confirmed qSOFA’s high predictive performance,28-31 our test characteristics and AUROC findings are in line with other published analyses.4,6,10,17 The UK National Health Service is using NEWS2 to screen for patients at risk of poor outcomes from sepsis. Several analyses that assessed the predictive ability of NEWS have reported estimates in line with our findings.4,10,32 The Shock Index was introduced in 1967 and provided a metric to evaluate hemodynamic stability based on heart rate and systolic blood pressure.33 The Shock Index has been studied in several contexts, including sepsis,34 and studies show that a sustained Shock Index is associated with increased odds of vasopressor administration, higher prevalence of hyperlactatemia, and increased risk of poor outcomes in the ICU.13,14
For our study, we were particularly interested in exploring how the Shock Index would compare with more frequently used severity scores such as qSOFA and NEWS2 among patients with suspected sepsis, given the simplicity of its calculation and the easy availability of required data. In our cohort of 23,837 patients, only 159 people had missing blood pressure and only 71 had omitted heart rate. In contrast, both qSOFA and NEWS2 include an assessment of level of consciousness that can be subject to variability in assessment methods and EHR documentation across institutions.11 In our cohort, GCS within 30 minutes of ED presentation was missing in 72 patients, which could have led to incomplete calculation of qSOFA and NEWS2 if a missing value was not actually within normal limits.
Several investigations relate qSOFA to NEWS but few compare qSOFA with the newer NEWS2, and even fewer evaluate the Shock Index with any of these scores.10,11,18,29,35-37 In general, studies have shown that NEWS exhibits a higher AUROC for predicting mortality, sepsis with organ dysfunction, and ICU admission, often as a composite outcome.4,11,18,37,38 A handful of studies compare the Shock Index to SIRS; however, little has been done to compare the Shock Index to qSOFA or NEWS2, scores that have been used specifically for sepsis and might be more predictive of poor outcomes than SIRS.33 In our study, the Shock Index had a higher AUROC than either qSOFA or NEWS2 for predicting in-hospital mortality and ED-to-ICU admission measured as separate outcomes and as a composite outcome using standard cut-points for these scores.
When selecting a severity score to apply in an institution, it is important to carefully evaluate the score’s test characteristics, in addition to considering the availability of reliable data. Tests with high sensitivity and NPV for the population being studied can be useful to rule out disease or risk of poor outcome, while tests with high specificity and PPV can be useful to rule in disease or risk of poor outcome.39 When considering specificity, qSOFA’s performance was superior to the Shock Index and NEWS2 in our study, but a small percentage of the population was identified using a cut-point of qSOFA ≥2. If we used qSOFA and applied this standard cut-point at our institution, we could be confident that those identified were at increased risk, but we would miss a significant number of patients who would experience a poor outcome. When considering sensitivity, performance of NEWS2 was superior to qSOFA and the Shock Index in our study, but one-half of the population was identified using a cut-point of NEWS2 ≥5. If we were to apply this standard NEWS2 cut-point at our institution, we would assume that one-half of our population was at risk, which might drive resource use towards patients who will not experience a poor outcome. Although none of the scores exhibited a robust AUROC measure, the Shock Index had the highest AUROC for in-hospital mortality and ED-to-ICU admission when using the standard binary cut-point, and its sensitivity and specificity is between that of qSOFA and NEWS2, potentially making it a score to use in settings where qSOFA and NEWS2 score components, such as altered mentation, are not reliably collected. Finally, our sensitivity analysis varying the binary cut-point of each score within our population demonstrated that the standard cut-points might not be as useful within a specific population and might need to be tailored for implementation, balancing sensitivity, specificity, PPV, and NPV to meet local priorities and ICU capacity.
Our study has limitations. It is a single-center, retrospective analysis, factors that could reduce generalizability. However, it does include a large and diverse patient population spanning several years. Missing GCS data could have affected the predictive ability of qSOFA and NEWS2 in our cohort. We could not reliably perform imputation of GCS because of the high missingness and therefore we assumed missing was normal, as was done in the Sepsis-3 derivation studies.16 Previous studies have attempted to impute GCS and have not observed improved performance of qSOFA to predict mortality.40 Because manually collected variables such as GCS are less reliably documented in the EHR, there might be limitations in their use for triage risk scores.
Although the current analysis focused on the predictive performance of qSOFA, the Shock Index, and NEWS2 at triage, performance of these scores could affect the ED team’s treatment decisions before handoff to the hospitalist team and the expected level of care the patient will receive after in-patient admission. These tests also have the advantage of being easy to calculate at the bedside over time, which could provide an objective assessment of longitudinal predicted prognosis.
CONCLUSION
Local priorities should drive selection of a screening tool, balancing sensitivity, specificity, PPV, and NPV to achieve the institution’s goals. qSOFA, Shock Index, and NEWS2 are risk stratification tools that can be easily implemented at ED triage using data available at the bedside. Although none of these scores performed strongly when comparing AUROCs, qSOFA was highly specific for identifying patients with poor outcomes, and NEWS2 was the most sensitive for ruling out those at high risk among patients with suspected sepsis. The Shock Index exhibited a sensitivity and specificity that fell between qSOFA and NEWS2 and also might be considered to identify those at increased risk, given its ease of implementation, particularly in settings where altered mentation is unreliably or inconsistently documented.
Acknowledgment
The authors thank the UCSF Division of Hospital Medicine Data Core for their assistance with data acquisition.
1. Jones SL, Ashton CM, Kiehne LB, et al. Outcomes and resource use of sepsis-associated stays by presence on admission, severity, and hospital type. Med Care. 2016;54(3):303-310. https://doi.org/10.1097/MLR.0000000000000481
2. Seymour CW, Gesten F, Prescott HC, et al. Time to treatment and mortality during mandated emergency care for sepsis. N Engl J Med. 2017;376(23):2235-2244. https://doi.org/10.1056/NEJMoa1703058
3. Kumar A, Roberts D, Wood KE, et al. Duration of hypotension before initiation of effective antimicrobial therapy is the critical determinant of survival in human septic shock. Crit Care Med. 2006;34(6):1589-1596. https://doi.org/10.1097/01.CCM.0000217961.75225.E9
4. Churpek MM, Snyder A, Sokol S, Pettit NN, Edelson DP. Investigating the impact of different suspicion of infection criteria on the accuracy of Quick Sepsis-Related Organ Failure Assessment, Systemic Inflammatory Response Syndrome, and Early Warning Scores. Crit Care Med. 2017;45(11):1805-1812. https://doi.org/10.1097/CCM.0000000000002648
5. Abdullah SMOB, Sørensen RH, Dessau RBC, Sattar SMRU, Wiese L, Nielsen FE. Prognostic accuracy of qSOFA in predicting 28-day mortality among infected patients in an emergency department: a prospective validation study. Emerg Med J. 2019;36(12):722-728. https://doi.org/10.1136/emermed-2019-208456
6. Kim KS, Suh GJ, Kim K, et al. Quick Sepsis-related Organ Failure Assessment score is not sensitive enough to predict 28-day mortality in emergency department patients with sepsis: a retrospective review. Clin Exp Emerg Med. 2019;6(1):77-83. HTTPS://DOI.ORG/ 10.15441/ceem.17.294
7. National Early Warning Score (NEWS) 2: Standardising the assessment of acute-illness severity in the NHS. Royal College of Physicians; 2017.
8. Brink A, Alsma J, Verdonschot RJCG, et al. Predicting mortality in patients with suspected sepsis at the emergency department: a retrospective cohort study comparing qSOFA, SIRS and National Early Warning Score. PLoS One. 2019;14(1):e0211133. https://doi.org/ 10.1371/journal.pone.0211133
9. Redfern OC, Smith GB, Prytherch DR, Meredith P, Inada-Kim M, Schmidt PE. A comparison of the Quick Sequential (Sepsis-Related) Organ Failure Assessment Score and the National Early Warning Score in non-ICU patients with/without infection. Crit Care Med. 2018;46(12):1923-1933. https://doi.org/10.1097/CCM.0000000000003359
10. Churpek MM, Snyder A, Han X, et al. Quick Sepsis-related Organ Failure Assessment, Systemic Inflammatory Response Syndrome, and Early Warning Scores for detecting clinical deterioration in infected patients outside the intensive care unit. Am J Respir Crit Care Med. 2017;195(7):906-911. https://doi.org/10.1164/rccm.201604-0854OC
11. Goulden R, Hoyle MC, Monis J, et al. qSOFA, SIRS and NEWS for predicting inhospital mortality and ICU admission in emergency admissions treated as sepsis. Emerg Med J. 2018;35(6):345-349. https://doi.org/10.1136/emermed-2017-207120
12. Biney I, Shepherd A, Thomas J, Mehari A. Shock Index and outcomes in patients admitted to the ICU with sepsis. Chest. 2015;148(suppl 4):337A. https://doi.org/https://doi.org/10.1378/chest.2281151
13. Wira CR, Francis MW, Bhat S, Ehrman R, Conner D, Siegel M. The shock index as a predictor of vasopressor use in emergency department patients with severe sepsis. West J Emerg Med. 2014;15(1):60-66. https://doi.org/10.5811/westjem.2013.7.18472
14. Berger T, Green J, Horeczko T, et al. Shock index and early recognition of sepsis in the emergency department: pilot study. West J Emerg Med. 2013;14(2):168-174. https://doi.org/10.5811/westjem.2012.8.11546
15. Middleton DJ, Smith TO, Bedford R, Neilly M, Myint PK. Shock Index predicts outcome in patients with suspected sepsis or community-acquired pneumonia: a systematic review. J Clin Med. 2019;8(8):1144. https://doi.org/10.3390/jcm8081144
16. Seymour CW, Liu VX, Iwashyna TJ, et al. Assessment of clinical criteria for sepsis: for the Third International Consensus Definitions for Sepsis and Septic Shock (Sepsis-3). JAMA. 2016;315(8):762-774. https://doi.org/ 10.1001/jama.2016.0288
17. Abdullah S, Sørensen RH, Dessau RBC, Sattar S, Wiese L, Nielsen FE. Prognostic accuracy of qSOFA in predicting 28-day mortality among infected patients in an emergency department: a prospective validation study. Emerg Med J. 2019;36(12):722-728. https://doi.org/10.1136/emermed-2019-208456
18. Usman OA, Usman AA, Ward MA. Comparison of SIRS, qSOFA, and NEWS for the early identification of sepsis in the Emergency Department. Am J Emerg Med. 2018;37(8):1490-1497. https://doi.org/10.1016/j.ajem.2018.10.058
19. Elixhauser A, Steiner C, Harris DR, Coffey RM. Comorbidity measures for use with administrative data. Med Care. 1998;36(1):8-27. https://doi.org/10.1097/00005650-199801000-00004
20. van Walraven C, Austin PC, Jennings A, Quan H, Forster AJ. A modification of the Elixhauser comorbidity measures into a point system for hospital death using administrative data. Med Care. 2009;47(6):626-633. https://doi.org/10.1097/MLR.0b013e31819432e5
21. Prin M, Wunsch H. The role of stepdown beds in hospital care. Am J Respir Crit Care Med. 2014;190(11):1210-1216. https://doi.org/10.1164/rccm.201406-1117PP
22. Narayanan N, Gross AK, Pintens M, Fee C, MacDougall C. Effect of an electronic medical record alert for severe sepsis among ED patients. Am J Emerg Med. 2016;34(2):185-188. https://doi.org/10.1016/j.ajem.2015.10.005
23. Singer M, Deutschman CS, Seymour CW, et al. The Third International Consensus Definitions for Sepsis and Septic Shock (Sepsis-3). JAMA. 2016;315(8):801-810. https://doi.org/10.1001/jama.2016.0287
24. Rhee C, Dantes R, Epstein L, et al. Incidence and trends of sepsis in US hospitals using clinical vs claims data, 2009-2014. JAMA. 2017;318(13):1241-1249. https://doi.org/10.1001/jama.2017.13836
25. Safari S, Baratloo A, Elfil M, Negida A. Evidence based emergency medicine; part 5 receiver operating curve and area under the curve. Emerg (Tehran). 2016;4(2):111-113.
26. DeLong ER, DeLong DM, Clarke-Pearson DL. Comparing the areas under two or more correlated receiver operating characteristic curves: a nonparametric approach. Biometrics. 1988;44(3):837-845.
27. Kangas C, Iverson L, Pierce D. Sepsis screening: combining Early Warning Scores and SIRS Criteria. Clin Nurs Res. 2021;30(1):42-49. https://doi.org/10.1177/1054773818823334.
28. Freund Y, Lemachatti N, Krastinova E, et al. Prognostic accuracy of Sepsis-3 Criteria for in-hospital mortality among patients with suspected infection presenting to the emergency department. JAMA. 2017;317(3):301-308. https://doi.org/10.1001/jama.2016.20329
29. Finkelsztein EJ, Jones DS, Ma KC, et al. Comparison of qSOFA and SIRS for predicting adverse outcomes of patients with suspicion of sepsis outside the intensive care unit. Crit Care. 2017;21(1):73. https://doi.org/10.1186/s13054-017-1658-5
30. Canet E, Taylor DM, Khor R, Krishnan V, Bellomo R. qSOFA as predictor of mortality and prolonged ICU admission in Emergency Department patients with suspected infection. J Crit Care. 2018;48:118-123. https://doi.org/10.1016/j.jcrc.2018.08.022
31. Anand V, Zhang Z, Kadri SS, Klompas M, Rhee C; CDC Prevention Epicenters Program. Epidemiology of Quick Sequential Organ Failure Assessment criteria in undifferentiated patients and association with suspected infection and sepsis. Chest. 2019;156(2):289-297. https://doi.org/10.1016/j.chest.2019.03.032
32. Hamilton F, Arnold D, Baird A, Albur M, Whiting P. Early Warning Scores do not accurately predict mortality in sepsis: A meta-analysis and systematic review of the literature. J Infect. 2018;76(3):241-248. https://doi.org/10.1016/j.jinf.2018.01.002
33. Koch E, Lovett S, Nghiem T, Riggs RA, Rech MA. Shock Index in the emergency department: utility and limitations. Open Access Emerg Med. 2019;11:179-199. https://doi.org/10.2147/OAEM.S178358
34. Yussof SJ, Zakaria MI, Mohamed FL, Bujang MA, Lakshmanan S, Asaari AH. Value of Shock Index in prognosticating the short-term outcome of death for patients presenting with severe sepsis and septic shock in the emergency department. Med J Malaysia. 2012;67(4):406-411.
35. Siddiqui S, Chua M, Kumaresh V, Choo R. A comparison of pre ICU admission SIRS, EWS and q SOFA scores for predicting mortality and length of stay in ICU. J Crit Care. 2017;41:191-193. https://doi.org/10.1016/j.jcrc.2017.05.017
36. Costa RT, Nassar AP, Caruso P. Accuracy of SOFA, qSOFA, and SIRS scores for mortality in cancer patients admitted to an intensive care unit with suspected infection. J Crit Care. 2018;45:52-57. https://doi.org/10.1016/j.jcrc.2017.12.024
37. Mellhammar L, Linder A, Tverring J, et al. NEWS2 is Superior to qSOFA in detecting sepsis with organ dysfunction in the emergency department. J Clin Med. 2019;8(8):1128. https://doi.org/10.3390/jcm8081128
38. Szakmany T, Pugh R, Kopczynska M, et al. Defining sepsis on the wards: results of a multi-centre point-prevalence study comparing two sepsis definitions. Anaesthesia. 2018;73(2):195-204. https://doi.org/10.1111/anae.14062
39. Newman TB, Kohn MA. Evidence-Based Diagnosis: An Introduction to Clinical Epidemiology. Cambridge University Press; 2009.
40. Askim Å, Moser F, Gustad LT, et al. Poor performance of quick-SOFA (qSOFA) score in predicting severe sepsis and mortality - a prospective study of patients admitted with infection to the emergency department. Scand J Trauma Resusc Emerg Med. 2017;25(1):56. https://doi.org/10.1186/s13049-017-0399-4
Sepsis is the leading cause of in-hospital mortality in the United States.1 Sepsis is present on admission in 85% of cases, and each hour delay in antibiotic treatment is associated with 4% to 7% increased odds of mortality.2,3 Prompt identification and treatment of sepsis is essential for reducing morbidity and mortality, but identifying sepsis during triage is challenging.2
Risk stratification scores that rely solely on data readily available at the bedside have been developed to quickly identify those at greatest risk of poor outcomes from sepsis in real time. The quick Sequential Organ Failure Assessment (qSOFA) score, the National Early Warning System (NEWS2), and the Shock Index are easy-to-calculate measures that use routinely collected clinical data that are not subject to laboratory delay. These scores can be incorporated into electronic health record (EHR)-based alerts and can be calculated longitudinally to track the risk of poor outcomes over time. qSOFA was developed to quantify patient risk at bedside in non-intensive care unit (ICU) settings, but there is no consensus about its ability to predict adverse outcomes such as mortality and ICU admission.4-6 The United Kingdom’s National Health Service uses NEWS2 to identify patients at risk for sepsis.7 NEWS has been shown to have similar or better sensitivity in identifying poorer outcomes in sepsis patients compared with systemic inflammatory response syndrome (SIRS) criteria and qSOFA.4,8-11 However, since the latest update of NEWS2 in 2017, there has been little study of its predictive ability. The Shock Index is a simple bedside score (heart rate divided by systolic blood pressure) that was developed to detect changes in cardiovascular performance before systemic shock onset. Although it was not developed for infection and has not been regularly applied in the sepsis literature, the Shock Index might be useful for identifying patients at increased risk of poor outcomes. Patients with higher and sustained Shock Index scores are more likely to experience morbidity, such as hyperlactatemia, vasopressor use, and organ failure, and also have an increased risk of mortality.12-14
Although the predictive abilities of these bedside risk stratification scores have been assessed individually using standard binary cut-points, the comparative performance of qSOFA, the Shock Index, and NEWS2 has not been evaluated in patients presenting to an emergency department (ED) with suspected sepsis.
METHODS
Design and Setting
We conducted a retrospective cohort study of ED patients who presented with suspected sepsis to the University of California San Francisco (UCSF) Helen Diller Medical Center at Parnassus Heights between June 1, 2012, and December 31, 2018. Our institution is a 785-bed academic teaching hospital with approximately 30,000 ED encounters per year. The study was approved with a waiver of informed consent by the UCSF Human Research Protection Program.
Participants
We use an Epic-based EHR platform (Epic 2017, Epic Systems Corporation) for clinical care, which was implemented on June 1, 2012. All data elements were obtained from Clarity, the relational database that stores Epic’s inpatient data. The study included encounters for patients age ≥18 years who had blood cultures ordered within 24 hours of ED presentation and administration of intravenous antibiotics within 24 hours. Repeat encounters were treated independently in our analysis.
Outcomes and Measures
We compared the ability of qSOFA, the Shock Index, and NEWS2 to predict in-hospital mortality and admission to the ICU from the ED (ED-to-ICU admission). We used the
We compared demographic and clinical characteristics of patients who were positive for qSOFA, the Shock Index, and NEWS2. Demographic data were extracted from the EHR and included primary language, age, sex, and insurance status. All International Classification of Diseases (ICD)-9/10 diagnosis codes were pulled from Clarity billing tables. We used the Elixhauser comorbidity groupings19 of ICD-9/10 codes present on admission to identify preexisting comorbidities and underlying organ dysfunction. To estimate burden of comorbid illnesses, we calculated the validated van Walraven comorbidity index,20 which provides an estimated risk of in-hospital death based on documented Elixhauser comorbidities. Admission level of care (acute, stepdown, or intensive care) was collected for inpatient admissions to assess initial illness severity.21 We also evaluated discharge disposition and in-hospital mortality. Index blood culture results were collected, and dates and timestamps of mechanical ventilation, fluid, vasopressor, and antibiotic administration were obtained for the duration of the encounter.
UCSF uses an automated, real-time, algorithm-based severe sepsis alert that is triggered when a patient meets ≥2 SIRS criteria and again when the patient meets severe sepsis or septic shock criteria (ie, ≥2 SIRS criteria in addition to end-organ dysfunction and/or fluid nonresponsive hypotension). This sepsis screening alert was in use for the duration of our study.22
Statistical Analysis
We performed a subgroup analysis among those who were diagnosed with sepsis, according to the 2016 Third International Consensus Definitions for Sepsis and Septic Shock (Sepsis-3) criteria.
All statistical analyses were conducted using Stata 14 (StataCorp). We summarized differences in demographic and clinical characteristics among the populations meeting each severity score but elected not to conduct hypothesis testing because patients could be positive for one or more scores. We calculated sensitivity, specificity, positive predictive value (PPV), and negative predictive value (NPV) for each score to predict in-hospital mortality and ED-to-ICU admission. To allow comparison with other studies, we also created a composite outcome of either in-hospital mortality or ED-to-ICU admission.
RESULTS
Within our sample 23,837 ED patients had blood cultures ordered within 24 hours of ED presentation and were considered to have suspected sepsis. The mean age of the cohort was 60.8 years, and 1,612 (6.8%) had positive blood cultures. A total of 12,928 patients (54.2%) were found to have sepsis. We documented 1,427 in-hospital deaths (6.0%) and 3,149 (13.2%) ED-to-ICU admissions. At ED triage 1,921 (8.1%) were qSOFA-positive, 4,273 (17.9%) were Shock Index-positive, and 11,832 (49.6%) were NEWS2-positive. At ED triage, blood pressure, heart rate, respiratory rate, and oxygen saturated were documented in >99% of patients, 93.5% had temperature documented, and 28.5% had GCS recorded. If the window of assessment was widened to 1 hour, GCS was only documented among 44.2% of those with suspected sepsis.
Demographic Characteristics and Clinical Course
qSOFA-positive patients received antibiotics more quickly than those who were Shock Index-positive or NEWS2-positive (median 1.5, 1.8, and 2.8 hours after admission, respectively). In addition, those who were qSOFA-positive were more likely to have a positive blood culture (10.9%, 9.4%, and 8.5%, respectively) and to receive an EHR-based diagnosis of sepsis (77.0%, 69.6%, and 60.9%, respectively) than those who were Shock Index- or NEWS2-positive. Those who were qSOFA-positive also were more likely to be mechanically ventilated during their hospital stay (25.4%, 19.2%, and 10.8%, respectively) and to receive vasopressors (33.5%, 22.5%, and 12.2%, respectively). In-hospital mortality also was more common among those who were qSOFA-positive at triage (23.4%, 15.3%, and 9.2%, respectively).
Because both qSOFA and NEWS2 incorporate GCS, we explored baseline characteristics of patients with GCS documented at triage (n = 6,794). These patients were older (median age 63 and 61 years, P < .0001), more likely to be male (54.9% and 53.4%, P = .0031), more likely to have renal failure (22.8% and 20.1%, P < .0001), more likely to have liver disease (14.2% and 12.8%, P = .006), had a higher van Walraven comorbidity score on presentation (median 10 and 8, P < .0001), and were more likely to go directly to the ICU from the ED (20.2% and 10.6%, P < .0001). However, among the 6,397 GCS scores documented at triage, only 1,579 (24.7%) were abnormal.
Test Characteristics of qSOFA, Shock Index, and NEWS2 for Predicting In-hospital Mortality and ED-to-ICU Admission
Among 23,837 patients with suspected sepsis, NEWS2 had the highest sensitivity for predicting in-hospital mortality (76.0%; 95% CI, 73.7%-78.2%) and ED-to-ICU admission (78.9%; 95% CI, 77.5%-80.4%) but had the lowest specificity for in-hospital mortality (52.0%; 95% CI, 51.4%-52.7%) and for ED-to-ICU admission (54.8%; 95% CI, 54.1%-55.5%) (Table 3). qSOFA had the lowest sensitivity for in-hospital mortality (31.5%; 95% CI, 29.1%-33.9%) and ED-to-ICU admission (29.3%; 95% CI, 27.7%-30.9%) but the highest specificity for in-hospital mortality (93.4%; 95% CI, 93.1%-93.8%) and ED-to-ICU admission (95.2%; 95% CI, 94.9%-95.5%). The Shock Index had a sensitivity that fell between qSOFA and NEWS2 for in-hospital mortality (45.8%; 95% CI, 43.2%-48.5%) and ED-to-ICU admission (49.2%; 95% CI, 47.5%-51.0%). The specificity of the Shock Index also was between qSOFA and NEWS2 for in-hospital mortality (83.9%; 95% CI, 83.4%-84.3%) and ED-to-ICU admission (86.8%; 95% CI, 86.4%-87.3%). All three scores exhibited relatively low PPV, ranging from 9.2% to 23.4% for in-hospital mortality and 21.0% to 48.0% for ED-to-ICU triage. Conversely, all three scores exhibited relatively high NPV, ranging from 95.5% to 97.1% for in-hospital mortality and 89.8% to 94.5% for ED-to-ICU triage.
When considering a binary cutoff, the Shock Index exhibited the highest AUROC for in-hospital mortality (0.648; 95% CI, 0.635-0.662) and had a significantly higher AUROC than qSOFA (AUROC, 0.625; 95% CI, 0.612-0.637; P = .0005), but there was no difference compared with NEWS2 (AUROC, 0.640; 95% CI, 0.628-0.652; P = .2112). NEWS2 had a significantly higher AUROC than qSOFA for predicting in-hospital mortality (P = .0227). The Shock Index also exhibited the highest AUROC for ED-to-ICU admission (0.680; 95% CI, 0.617-0.689), which was significantly higher than the AUROC for qSOFA (P < .0001) and NEWS2 (P = 0.0151). NEWS2 had a significantly higher AUROC than qSOFA for predicting ED-to-ICU admission (P < .0001). Similar findings were seen in patients found to have sepsis.
DISCUSSION
In this retrospective cohort study of 23,837 patients who presented to the ED with suspected sepsis, the standard qSOFA threshold was met least frequently, followed by the Shock Index and NEWS2. NEWS2 had the highest sensitivity but the lowest specificity for predicting in-hospital mortality and ED-to-ICU admission, making it a challenging bedside risk stratification scale for identifying patients at risk of poor clinical outcomes. When comparing predictive performance among the three scales, qSOFA had the highest specificity and the Shock Index had the highest AUROC for in-hospital mortality and ED-to-ICU admission in this cohort of patients with suspected sepsis. These trends in sensitivity, specificity, and AUROC were consistent among those who met EHR criteria for a sepsis diagnosis. In the analysis of the three scoring systems using all available cut-points, qSOFA and NEWS2 had the highest AUROCs, followed by the Shock Index.
Considering the rapid progression from organ dysfunction to death in sepsis patients, as well as the difficulty establishing a sepsis diagnosis at triage,23 providers must quickly identify patients at increased risk of poor outcomes when they present to the ED. Sepsis alerts often are built using SIRS criteria,27 including the one used for sepsis surveillance at UCSF since 2012,22 but the white blood cell count criterion is subject to a laboratory lag and could lead to a delay in identification. Implementation of a point-of-care bedside score alert that uses readily available clinical data could allow providers to identify patients at greatest risk of poor outcomes immediately at ED presentation and triage, which motivated us to explore the predictive performance of qSOFA, the Shock Index, and NEWS2.
Our study is the first to provide a head-to-head comparison of the predictive performance of qSOFA, the Shock Index, and NEWS2, three easy-to-calculate bedside risk scores that use EHR data collected among patients with suspected sepsis. The Sepsis-3 guidelines recommend qSOFA to quickly identify non-ICU patients at greatest risk of poor outcomes because the measure exhibited predictive performance similar to the more extensive SOFA score outside the ICU.16,23 Although some studies have confirmed qSOFA’s high predictive performance,28-31 our test characteristics and AUROC findings are in line with other published analyses.4,6,10,17 The UK National Health Service is using NEWS2 to screen for patients at risk of poor outcomes from sepsis. Several analyses that assessed the predictive ability of NEWS have reported estimates in line with our findings.4,10,32 The Shock Index was introduced in 1967 and provided a metric to evaluate hemodynamic stability based on heart rate and systolic blood pressure.33 The Shock Index has been studied in several contexts, including sepsis,34 and studies show that a sustained Shock Index is associated with increased odds of vasopressor administration, higher prevalence of hyperlactatemia, and increased risk of poor outcomes in the ICU.13,14
For our study, we were particularly interested in exploring how the Shock Index would compare with more frequently used severity scores such as qSOFA and NEWS2 among patients with suspected sepsis, given the simplicity of its calculation and the easy availability of required data. In our cohort of 23,837 patients, only 159 people had missing blood pressure and only 71 had omitted heart rate. In contrast, both qSOFA and NEWS2 include an assessment of level of consciousness that can be subject to variability in assessment methods and EHR documentation across institutions.11 In our cohort, GCS within 30 minutes of ED presentation was missing in 72 patients, which could have led to incomplete calculation of qSOFA and NEWS2 if a missing value was not actually within normal limits.
Several investigations relate qSOFA to NEWS but few compare qSOFA with the newer NEWS2, and even fewer evaluate the Shock Index with any of these scores.10,11,18,29,35-37 In general, studies have shown that NEWS exhibits a higher AUROC for predicting mortality, sepsis with organ dysfunction, and ICU admission, often as a composite outcome.4,11,18,37,38 A handful of studies compare the Shock Index to SIRS; however, little has been done to compare the Shock Index to qSOFA or NEWS2, scores that have been used specifically for sepsis and might be more predictive of poor outcomes than SIRS.33 In our study, the Shock Index had a higher AUROC than either qSOFA or NEWS2 for predicting in-hospital mortality and ED-to-ICU admission measured as separate outcomes and as a composite outcome using standard cut-points for these scores.
When selecting a severity score to apply in an institution, it is important to carefully evaluate the score’s test characteristics, in addition to considering the availability of reliable data. Tests with high sensitivity and NPV for the population being studied can be useful to rule out disease or risk of poor outcome, while tests with high specificity and PPV can be useful to rule in disease or risk of poor outcome.39 When considering specificity, qSOFA’s performance was superior to the Shock Index and NEWS2 in our study, but a small percentage of the population was identified using a cut-point of qSOFA ≥2. If we used qSOFA and applied this standard cut-point at our institution, we could be confident that those identified were at increased risk, but we would miss a significant number of patients who would experience a poor outcome. When considering sensitivity, performance of NEWS2 was superior to qSOFA and the Shock Index in our study, but one-half of the population was identified using a cut-point of NEWS2 ≥5. If we were to apply this standard NEWS2 cut-point at our institution, we would assume that one-half of our population was at risk, which might drive resource use towards patients who will not experience a poor outcome. Although none of the scores exhibited a robust AUROC measure, the Shock Index had the highest AUROC for in-hospital mortality and ED-to-ICU admission when using the standard binary cut-point, and its sensitivity and specificity is between that of qSOFA and NEWS2, potentially making it a score to use in settings where qSOFA and NEWS2 score components, such as altered mentation, are not reliably collected. Finally, our sensitivity analysis varying the binary cut-point of each score within our population demonstrated that the standard cut-points might not be as useful within a specific population and might need to be tailored for implementation, balancing sensitivity, specificity, PPV, and NPV to meet local priorities and ICU capacity.
Our study has limitations. It is a single-center, retrospective analysis, factors that could reduce generalizability. However, it does include a large and diverse patient population spanning several years. Missing GCS data could have affected the predictive ability of qSOFA and NEWS2 in our cohort. We could not reliably perform imputation of GCS because of the high missingness and therefore we assumed missing was normal, as was done in the Sepsis-3 derivation studies.16 Previous studies have attempted to impute GCS and have not observed improved performance of qSOFA to predict mortality.40 Because manually collected variables such as GCS are less reliably documented in the EHR, there might be limitations in their use for triage risk scores.
Although the current analysis focused on the predictive performance of qSOFA, the Shock Index, and NEWS2 at triage, performance of these scores could affect the ED team’s treatment decisions before handoff to the hospitalist team and the expected level of care the patient will receive after in-patient admission. These tests also have the advantage of being easy to calculate at the bedside over time, which could provide an objective assessment of longitudinal predicted prognosis.
CONCLUSION
Local priorities should drive selection of a screening tool, balancing sensitivity, specificity, PPV, and NPV to achieve the institution’s goals. qSOFA, Shock Index, and NEWS2 are risk stratification tools that can be easily implemented at ED triage using data available at the bedside. Although none of these scores performed strongly when comparing AUROCs, qSOFA was highly specific for identifying patients with poor outcomes, and NEWS2 was the most sensitive for ruling out those at high risk among patients with suspected sepsis. The Shock Index exhibited a sensitivity and specificity that fell between qSOFA and NEWS2 and also might be considered to identify those at increased risk, given its ease of implementation, particularly in settings where altered mentation is unreliably or inconsistently documented.
Acknowledgment
The authors thank the UCSF Division of Hospital Medicine Data Core for their assistance with data acquisition.
Sepsis is the leading cause of in-hospital mortality in the United States.1 Sepsis is present on admission in 85% of cases, and each hour delay in antibiotic treatment is associated with 4% to 7% increased odds of mortality.2,3 Prompt identification and treatment of sepsis is essential for reducing morbidity and mortality, but identifying sepsis during triage is challenging.2
Risk stratification scores that rely solely on data readily available at the bedside have been developed to quickly identify those at greatest risk of poor outcomes from sepsis in real time. The quick Sequential Organ Failure Assessment (qSOFA) score, the National Early Warning System (NEWS2), and the Shock Index are easy-to-calculate measures that use routinely collected clinical data that are not subject to laboratory delay. These scores can be incorporated into electronic health record (EHR)-based alerts and can be calculated longitudinally to track the risk of poor outcomes over time. qSOFA was developed to quantify patient risk at bedside in non-intensive care unit (ICU) settings, but there is no consensus about its ability to predict adverse outcomes such as mortality and ICU admission.4-6 The United Kingdom’s National Health Service uses NEWS2 to identify patients at risk for sepsis.7 NEWS has been shown to have similar or better sensitivity in identifying poorer outcomes in sepsis patients compared with systemic inflammatory response syndrome (SIRS) criteria and qSOFA.4,8-11 However, since the latest update of NEWS2 in 2017, there has been little study of its predictive ability. The Shock Index is a simple bedside score (heart rate divided by systolic blood pressure) that was developed to detect changes in cardiovascular performance before systemic shock onset. Although it was not developed for infection and has not been regularly applied in the sepsis literature, the Shock Index might be useful for identifying patients at increased risk of poor outcomes. Patients with higher and sustained Shock Index scores are more likely to experience morbidity, such as hyperlactatemia, vasopressor use, and organ failure, and also have an increased risk of mortality.12-14
Although the predictive abilities of these bedside risk stratification scores have been assessed individually using standard binary cut-points, the comparative performance of qSOFA, the Shock Index, and NEWS2 has not been evaluated in patients presenting to an emergency department (ED) with suspected sepsis.
METHODS
Design and Setting
We conducted a retrospective cohort study of ED patients who presented with suspected sepsis to the University of California San Francisco (UCSF) Helen Diller Medical Center at Parnassus Heights between June 1, 2012, and December 31, 2018. Our institution is a 785-bed academic teaching hospital with approximately 30,000 ED encounters per year. The study was approved with a waiver of informed consent by the UCSF Human Research Protection Program.
Participants
We use an Epic-based EHR platform (Epic 2017, Epic Systems Corporation) for clinical care, which was implemented on June 1, 2012. All data elements were obtained from Clarity, the relational database that stores Epic’s inpatient data. The study included encounters for patients age ≥18 years who had blood cultures ordered within 24 hours of ED presentation and administration of intravenous antibiotics within 24 hours. Repeat encounters were treated independently in our analysis.
Outcomes and Measures
We compared the ability of qSOFA, the Shock Index, and NEWS2 to predict in-hospital mortality and admission to the ICU from the ED (ED-to-ICU admission). We used the
We compared demographic and clinical characteristics of patients who were positive for qSOFA, the Shock Index, and NEWS2. Demographic data were extracted from the EHR and included primary language, age, sex, and insurance status. All International Classification of Diseases (ICD)-9/10 diagnosis codes were pulled from Clarity billing tables. We used the Elixhauser comorbidity groupings19 of ICD-9/10 codes present on admission to identify preexisting comorbidities and underlying organ dysfunction. To estimate burden of comorbid illnesses, we calculated the validated van Walraven comorbidity index,20 which provides an estimated risk of in-hospital death based on documented Elixhauser comorbidities. Admission level of care (acute, stepdown, or intensive care) was collected for inpatient admissions to assess initial illness severity.21 We also evaluated discharge disposition and in-hospital mortality. Index blood culture results were collected, and dates and timestamps of mechanical ventilation, fluid, vasopressor, and antibiotic administration were obtained for the duration of the encounter.
UCSF uses an automated, real-time, algorithm-based severe sepsis alert that is triggered when a patient meets ≥2 SIRS criteria and again when the patient meets severe sepsis or septic shock criteria (ie, ≥2 SIRS criteria in addition to end-organ dysfunction and/or fluid nonresponsive hypotension). This sepsis screening alert was in use for the duration of our study.22
Statistical Analysis
We performed a subgroup analysis among those who were diagnosed with sepsis, according to the 2016 Third International Consensus Definitions for Sepsis and Septic Shock (Sepsis-3) criteria.
All statistical analyses were conducted using Stata 14 (StataCorp). We summarized differences in demographic and clinical characteristics among the populations meeting each severity score but elected not to conduct hypothesis testing because patients could be positive for one or more scores. We calculated sensitivity, specificity, positive predictive value (PPV), and negative predictive value (NPV) for each score to predict in-hospital mortality and ED-to-ICU admission. To allow comparison with other studies, we also created a composite outcome of either in-hospital mortality or ED-to-ICU admission.
RESULTS
Within our sample 23,837 ED patients had blood cultures ordered within 24 hours of ED presentation and were considered to have suspected sepsis. The mean age of the cohort was 60.8 years, and 1,612 (6.8%) had positive blood cultures. A total of 12,928 patients (54.2%) were found to have sepsis. We documented 1,427 in-hospital deaths (6.0%) and 3,149 (13.2%) ED-to-ICU admissions. At ED triage 1,921 (8.1%) were qSOFA-positive, 4,273 (17.9%) were Shock Index-positive, and 11,832 (49.6%) were NEWS2-positive. At ED triage, blood pressure, heart rate, respiratory rate, and oxygen saturated were documented in >99% of patients, 93.5% had temperature documented, and 28.5% had GCS recorded. If the window of assessment was widened to 1 hour, GCS was only documented among 44.2% of those with suspected sepsis.
Demographic Characteristics and Clinical Course
qSOFA-positive patients received antibiotics more quickly than those who were Shock Index-positive or NEWS2-positive (median 1.5, 1.8, and 2.8 hours after admission, respectively). In addition, those who were qSOFA-positive were more likely to have a positive blood culture (10.9%, 9.4%, and 8.5%, respectively) and to receive an EHR-based diagnosis of sepsis (77.0%, 69.6%, and 60.9%, respectively) than those who were Shock Index- or NEWS2-positive. Those who were qSOFA-positive also were more likely to be mechanically ventilated during their hospital stay (25.4%, 19.2%, and 10.8%, respectively) and to receive vasopressors (33.5%, 22.5%, and 12.2%, respectively). In-hospital mortality also was more common among those who were qSOFA-positive at triage (23.4%, 15.3%, and 9.2%, respectively).
Because both qSOFA and NEWS2 incorporate GCS, we explored baseline characteristics of patients with GCS documented at triage (n = 6,794). These patients were older (median age 63 and 61 years, P < .0001), more likely to be male (54.9% and 53.4%, P = .0031), more likely to have renal failure (22.8% and 20.1%, P < .0001), more likely to have liver disease (14.2% and 12.8%, P = .006), had a higher van Walraven comorbidity score on presentation (median 10 and 8, P < .0001), and were more likely to go directly to the ICU from the ED (20.2% and 10.6%, P < .0001). However, among the 6,397 GCS scores documented at triage, only 1,579 (24.7%) were abnormal.
Test Characteristics of qSOFA, Shock Index, and NEWS2 for Predicting In-hospital Mortality and ED-to-ICU Admission
Among 23,837 patients with suspected sepsis, NEWS2 had the highest sensitivity for predicting in-hospital mortality (76.0%; 95% CI, 73.7%-78.2%) and ED-to-ICU admission (78.9%; 95% CI, 77.5%-80.4%) but had the lowest specificity for in-hospital mortality (52.0%; 95% CI, 51.4%-52.7%) and for ED-to-ICU admission (54.8%; 95% CI, 54.1%-55.5%) (Table 3). qSOFA had the lowest sensitivity for in-hospital mortality (31.5%; 95% CI, 29.1%-33.9%) and ED-to-ICU admission (29.3%; 95% CI, 27.7%-30.9%) but the highest specificity for in-hospital mortality (93.4%; 95% CI, 93.1%-93.8%) and ED-to-ICU admission (95.2%; 95% CI, 94.9%-95.5%). The Shock Index had a sensitivity that fell between qSOFA and NEWS2 for in-hospital mortality (45.8%; 95% CI, 43.2%-48.5%) and ED-to-ICU admission (49.2%; 95% CI, 47.5%-51.0%). The specificity of the Shock Index also was between qSOFA and NEWS2 for in-hospital mortality (83.9%; 95% CI, 83.4%-84.3%) and ED-to-ICU admission (86.8%; 95% CI, 86.4%-87.3%). All three scores exhibited relatively low PPV, ranging from 9.2% to 23.4% for in-hospital mortality and 21.0% to 48.0% for ED-to-ICU triage. Conversely, all three scores exhibited relatively high NPV, ranging from 95.5% to 97.1% for in-hospital mortality and 89.8% to 94.5% for ED-to-ICU triage.
When considering a binary cutoff, the Shock Index exhibited the highest AUROC for in-hospital mortality (0.648; 95% CI, 0.635-0.662) and had a significantly higher AUROC than qSOFA (AUROC, 0.625; 95% CI, 0.612-0.637; P = .0005), but there was no difference compared with NEWS2 (AUROC, 0.640; 95% CI, 0.628-0.652; P = .2112). NEWS2 had a significantly higher AUROC than qSOFA for predicting in-hospital mortality (P = .0227). The Shock Index also exhibited the highest AUROC for ED-to-ICU admission (0.680; 95% CI, 0.617-0.689), which was significantly higher than the AUROC for qSOFA (P < .0001) and NEWS2 (P = 0.0151). NEWS2 had a significantly higher AUROC than qSOFA for predicting ED-to-ICU admission (P < .0001). Similar findings were seen in patients found to have sepsis.
DISCUSSION
In this retrospective cohort study of 23,837 patients who presented to the ED with suspected sepsis, the standard qSOFA threshold was met least frequently, followed by the Shock Index and NEWS2. NEWS2 had the highest sensitivity but the lowest specificity for predicting in-hospital mortality and ED-to-ICU admission, making it a challenging bedside risk stratification scale for identifying patients at risk of poor clinical outcomes. When comparing predictive performance among the three scales, qSOFA had the highest specificity and the Shock Index had the highest AUROC for in-hospital mortality and ED-to-ICU admission in this cohort of patients with suspected sepsis. These trends in sensitivity, specificity, and AUROC were consistent among those who met EHR criteria for a sepsis diagnosis. In the analysis of the three scoring systems using all available cut-points, qSOFA and NEWS2 had the highest AUROCs, followed by the Shock Index.
Considering the rapid progression from organ dysfunction to death in sepsis patients, as well as the difficulty establishing a sepsis diagnosis at triage,23 providers must quickly identify patients at increased risk of poor outcomes when they present to the ED. Sepsis alerts often are built using SIRS criteria,27 including the one used for sepsis surveillance at UCSF since 2012,22 but the white blood cell count criterion is subject to a laboratory lag and could lead to a delay in identification. Implementation of a point-of-care bedside score alert that uses readily available clinical data could allow providers to identify patients at greatest risk of poor outcomes immediately at ED presentation and triage, which motivated us to explore the predictive performance of qSOFA, the Shock Index, and NEWS2.
Our study is the first to provide a head-to-head comparison of the predictive performance of qSOFA, the Shock Index, and NEWS2, three easy-to-calculate bedside risk scores that use EHR data collected among patients with suspected sepsis. The Sepsis-3 guidelines recommend qSOFA to quickly identify non-ICU patients at greatest risk of poor outcomes because the measure exhibited predictive performance similar to the more extensive SOFA score outside the ICU.16,23 Although some studies have confirmed qSOFA’s high predictive performance,28-31 our test characteristics and AUROC findings are in line with other published analyses.4,6,10,17 The UK National Health Service is using NEWS2 to screen for patients at risk of poor outcomes from sepsis. Several analyses that assessed the predictive ability of NEWS have reported estimates in line with our findings.4,10,32 The Shock Index was introduced in 1967 and provided a metric to evaluate hemodynamic stability based on heart rate and systolic blood pressure.33 The Shock Index has been studied in several contexts, including sepsis,34 and studies show that a sustained Shock Index is associated with increased odds of vasopressor administration, higher prevalence of hyperlactatemia, and increased risk of poor outcomes in the ICU.13,14
For our study, we were particularly interested in exploring how the Shock Index would compare with more frequently used severity scores such as qSOFA and NEWS2 among patients with suspected sepsis, given the simplicity of its calculation and the easy availability of required data. In our cohort of 23,837 patients, only 159 people had missing blood pressure and only 71 had omitted heart rate. In contrast, both qSOFA and NEWS2 include an assessment of level of consciousness that can be subject to variability in assessment methods and EHR documentation across institutions.11 In our cohort, GCS within 30 minutes of ED presentation was missing in 72 patients, which could have led to incomplete calculation of qSOFA and NEWS2 if a missing value was not actually within normal limits.
Several investigations relate qSOFA to NEWS but few compare qSOFA with the newer NEWS2, and even fewer evaluate the Shock Index with any of these scores.10,11,18,29,35-37 In general, studies have shown that NEWS exhibits a higher AUROC for predicting mortality, sepsis with organ dysfunction, and ICU admission, often as a composite outcome.4,11,18,37,38 A handful of studies compare the Shock Index to SIRS; however, little has been done to compare the Shock Index to qSOFA or NEWS2, scores that have been used specifically for sepsis and might be more predictive of poor outcomes than SIRS.33 In our study, the Shock Index had a higher AUROC than either qSOFA or NEWS2 for predicting in-hospital mortality and ED-to-ICU admission measured as separate outcomes and as a composite outcome using standard cut-points for these scores.
When selecting a severity score to apply in an institution, it is important to carefully evaluate the score’s test characteristics, in addition to considering the availability of reliable data. Tests with high sensitivity and NPV for the population being studied can be useful to rule out disease or risk of poor outcome, while tests with high specificity and PPV can be useful to rule in disease or risk of poor outcome.39 When considering specificity, qSOFA’s performance was superior to the Shock Index and NEWS2 in our study, but a small percentage of the population was identified using a cut-point of qSOFA ≥2. If we used qSOFA and applied this standard cut-point at our institution, we could be confident that those identified were at increased risk, but we would miss a significant number of patients who would experience a poor outcome. When considering sensitivity, performance of NEWS2 was superior to qSOFA and the Shock Index in our study, but one-half of the population was identified using a cut-point of NEWS2 ≥5. If we were to apply this standard NEWS2 cut-point at our institution, we would assume that one-half of our population was at risk, which might drive resource use towards patients who will not experience a poor outcome. Although none of the scores exhibited a robust AUROC measure, the Shock Index had the highest AUROC for in-hospital mortality and ED-to-ICU admission when using the standard binary cut-point, and its sensitivity and specificity is between that of qSOFA and NEWS2, potentially making it a score to use in settings where qSOFA and NEWS2 score components, such as altered mentation, are not reliably collected. Finally, our sensitivity analysis varying the binary cut-point of each score within our population demonstrated that the standard cut-points might not be as useful within a specific population and might need to be tailored for implementation, balancing sensitivity, specificity, PPV, and NPV to meet local priorities and ICU capacity.
Our study has limitations. It is a single-center, retrospective analysis, factors that could reduce generalizability. However, it does include a large and diverse patient population spanning several years. Missing GCS data could have affected the predictive ability of qSOFA and NEWS2 in our cohort. We could not reliably perform imputation of GCS because of the high missingness and therefore we assumed missing was normal, as was done in the Sepsis-3 derivation studies.16 Previous studies have attempted to impute GCS and have not observed improved performance of qSOFA to predict mortality.40 Because manually collected variables such as GCS are less reliably documented in the EHR, there might be limitations in their use for triage risk scores.
Although the current analysis focused on the predictive performance of qSOFA, the Shock Index, and NEWS2 at triage, performance of these scores could affect the ED team’s treatment decisions before handoff to the hospitalist team and the expected level of care the patient will receive after in-patient admission. These tests also have the advantage of being easy to calculate at the bedside over time, which could provide an objective assessment of longitudinal predicted prognosis.
CONCLUSION
Local priorities should drive selection of a screening tool, balancing sensitivity, specificity, PPV, and NPV to achieve the institution’s goals. qSOFA, Shock Index, and NEWS2 are risk stratification tools that can be easily implemented at ED triage using data available at the bedside. Although none of these scores performed strongly when comparing AUROCs, qSOFA was highly specific for identifying patients with poor outcomes, and NEWS2 was the most sensitive for ruling out those at high risk among patients with suspected sepsis. The Shock Index exhibited a sensitivity and specificity that fell between qSOFA and NEWS2 and also might be considered to identify those at increased risk, given its ease of implementation, particularly in settings where altered mentation is unreliably or inconsistently documented.
Acknowledgment
The authors thank the UCSF Division of Hospital Medicine Data Core for their assistance with data acquisition.
1. Jones SL, Ashton CM, Kiehne LB, et al. Outcomes and resource use of sepsis-associated stays by presence on admission, severity, and hospital type. Med Care. 2016;54(3):303-310. https://doi.org/10.1097/MLR.0000000000000481
2. Seymour CW, Gesten F, Prescott HC, et al. Time to treatment and mortality during mandated emergency care for sepsis. N Engl J Med. 2017;376(23):2235-2244. https://doi.org/10.1056/NEJMoa1703058
3. Kumar A, Roberts D, Wood KE, et al. Duration of hypotension before initiation of effective antimicrobial therapy is the critical determinant of survival in human septic shock. Crit Care Med. 2006;34(6):1589-1596. https://doi.org/10.1097/01.CCM.0000217961.75225.E9
4. Churpek MM, Snyder A, Sokol S, Pettit NN, Edelson DP. Investigating the impact of different suspicion of infection criteria on the accuracy of Quick Sepsis-Related Organ Failure Assessment, Systemic Inflammatory Response Syndrome, and Early Warning Scores. Crit Care Med. 2017;45(11):1805-1812. https://doi.org/10.1097/CCM.0000000000002648
5. Abdullah SMOB, Sørensen RH, Dessau RBC, Sattar SMRU, Wiese L, Nielsen FE. Prognostic accuracy of qSOFA in predicting 28-day mortality among infected patients in an emergency department: a prospective validation study. Emerg Med J. 2019;36(12):722-728. https://doi.org/10.1136/emermed-2019-208456
6. Kim KS, Suh GJ, Kim K, et al. Quick Sepsis-related Organ Failure Assessment score is not sensitive enough to predict 28-day mortality in emergency department patients with sepsis: a retrospective review. Clin Exp Emerg Med. 2019;6(1):77-83. HTTPS://DOI.ORG/ 10.15441/ceem.17.294
7. National Early Warning Score (NEWS) 2: Standardising the assessment of acute-illness severity in the NHS. Royal College of Physicians; 2017.
8. Brink A, Alsma J, Verdonschot RJCG, et al. Predicting mortality in patients with suspected sepsis at the emergency department: a retrospective cohort study comparing qSOFA, SIRS and National Early Warning Score. PLoS One. 2019;14(1):e0211133. https://doi.org/ 10.1371/journal.pone.0211133
9. Redfern OC, Smith GB, Prytherch DR, Meredith P, Inada-Kim M, Schmidt PE. A comparison of the Quick Sequential (Sepsis-Related) Organ Failure Assessment Score and the National Early Warning Score in non-ICU patients with/without infection. Crit Care Med. 2018;46(12):1923-1933. https://doi.org/10.1097/CCM.0000000000003359
10. Churpek MM, Snyder A, Han X, et al. Quick Sepsis-related Organ Failure Assessment, Systemic Inflammatory Response Syndrome, and Early Warning Scores for detecting clinical deterioration in infected patients outside the intensive care unit. Am J Respir Crit Care Med. 2017;195(7):906-911. https://doi.org/10.1164/rccm.201604-0854OC
11. Goulden R, Hoyle MC, Monis J, et al. qSOFA, SIRS and NEWS for predicting inhospital mortality and ICU admission in emergency admissions treated as sepsis. Emerg Med J. 2018;35(6):345-349. https://doi.org/10.1136/emermed-2017-207120
12. Biney I, Shepherd A, Thomas J, Mehari A. Shock Index and outcomes in patients admitted to the ICU with sepsis. Chest. 2015;148(suppl 4):337A. https://doi.org/https://doi.org/10.1378/chest.2281151
13. Wira CR, Francis MW, Bhat S, Ehrman R, Conner D, Siegel M. The shock index as a predictor of vasopressor use in emergency department patients with severe sepsis. West J Emerg Med. 2014;15(1):60-66. https://doi.org/10.5811/westjem.2013.7.18472
14. Berger T, Green J, Horeczko T, et al. Shock index and early recognition of sepsis in the emergency department: pilot study. West J Emerg Med. 2013;14(2):168-174. https://doi.org/10.5811/westjem.2012.8.11546
15. Middleton DJ, Smith TO, Bedford R, Neilly M, Myint PK. Shock Index predicts outcome in patients with suspected sepsis or community-acquired pneumonia: a systematic review. J Clin Med. 2019;8(8):1144. https://doi.org/10.3390/jcm8081144
16. Seymour CW, Liu VX, Iwashyna TJ, et al. Assessment of clinical criteria for sepsis: for the Third International Consensus Definitions for Sepsis and Septic Shock (Sepsis-3). JAMA. 2016;315(8):762-774. https://doi.org/ 10.1001/jama.2016.0288
17. Abdullah S, Sørensen RH, Dessau RBC, Sattar S, Wiese L, Nielsen FE. Prognostic accuracy of qSOFA in predicting 28-day mortality among infected patients in an emergency department: a prospective validation study. Emerg Med J. 2019;36(12):722-728. https://doi.org/10.1136/emermed-2019-208456
18. Usman OA, Usman AA, Ward MA. Comparison of SIRS, qSOFA, and NEWS for the early identification of sepsis in the Emergency Department. Am J Emerg Med. 2018;37(8):1490-1497. https://doi.org/10.1016/j.ajem.2018.10.058
19. Elixhauser A, Steiner C, Harris DR, Coffey RM. Comorbidity measures for use with administrative data. Med Care. 1998;36(1):8-27. https://doi.org/10.1097/00005650-199801000-00004
20. van Walraven C, Austin PC, Jennings A, Quan H, Forster AJ. A modification of the Elixhauser comorbidity measures into a point system for hospital death using administrative data. Med Care. 2009;47(6):626-633. https://doi.org/10.1097/MLR.0b013e31819432e5
21. Prin M, Wunsch H. The role of stepdown beds in hospital care. Am J Respir Crit Care Med. 2014;190(11):1210-1216. https://doi.org/10.1164/rccm.201406-1117PP
22. Narayanan N, Gross AK, Pintens M, Fee C, MacDougall C. Effect of an electronic medical record alert for severe sepsis among ED patients. Am J Emerg Med. 2016;34(2):185-188. https://doi.org/10.1016/j.ajem.2015.10.005
23. Singer M, Deutschman CS, Seymour CW, et al. The Third International Consensus Definitions for Sepsis and Septic Shock (Sepsis-3). JAMA. 2016;315(8):801-810. https://doi.org/10.1001/jama.2016.0287
24. Rhee C, Dantes R, Epstein L, et al. Incidence and trends of sepsis in US hospitals using clinical vs claims data, 2009-2014. JAMA. 2017;318(13):1241-1249. https://doi.org/10.1001/jama.2017.13836
25. Safari S, Baratloo A, Elfil M, Negida A. Evidence based emergency medicine; part 5 receiver operating curve and area under the curve. Emerg (Tehran). 2016;4(2):111-113.
26. DeLong ER, DeLong DM, Clarke-Pearson DL. Comparing the areas under two or more correlated receiver operating characteristic curves: a nonparametric approach. Biometrics. 1988;44(3):837-845.
27. Kangas C, Iverson L, Pierce D. Sepsis screening: combining Early Warning Scores and SIRS Criteria. Clin Nurs Res. 2021;30(1):42-49. https://doi.org/10.1177/1054773818823334.
28. Freund Y, Lemachatti N, Krastinova E, et al. Prognostic accuracy of Sepsis-3 Criteria for in-hospital mortality among patients with suspected infection presenting to the emergency department. JAMA. 2017;317(3):301-308. https://doi.org/10.1001/jama.2016.20329
29. Finkelsztein EJ, Jones DS, Ma KC, et al. Comparison of qSOFA and SIRS for predicting adverse outcomes of patients with suspicion of sepsis outside the intensive care unit. Crit Care. 2017;21(1):73. https://doi.org/10.1186/s13054-017-1658-5
30. Canet E, Taylor DM, Khor R, Krishnan V, Bellomo R. qSOFA as predictor of mortality and prolonged ICU admission in Emergency Department patients with suspected infection. J Crit Care. 2018;48:118-123. https://doi.org/10.1016/j.jcrc.2018.08.022
31. Anand V, Zhang Z, Kadri SS, Klompas M, Rhee C; CDC Prevention Epicenters Program. Epidemiology of Quick Sequential Organ Failure Assessment criteria in undifferentiated patients and association with suspected infection and sepsis. Chest. 2019;156(2):289-297. https://doi.org/10.1016/j.chest.2019.03.032
32. Hamilton F, Arnold D, Baird A, Albur M, Whiting P. Early Warning Scores do not accurately predict mortality in sepsis: A meta-analysis and systematic review of the literature. J Infect. 2018;76(3):241-248. https://doi.org/10.1016/j.jinf.2018.01.002
33. Koch E, Lovett S, Nghiem T, Riggs RA, Rech MA. Shock Index in the emergency department: utility and limitations. Open Access Emerg Med. 2019;11:179-199. https://doi.org/10.2147/OAEM.S178358
34. Yussof SJ, Zakaria MI, Mohamed FL, Bujang MA, Lakshmanan S, Asaari AH. Value of Shock Index in prognosticating the short-term outcome of death for patients presenting with severe sepsis and septic shock in the emergency department. Med J Malaysia. 2012;67(4):406-411.
35. Siddiqui S, Chua M, Kumaresh V, Choo R. A comparison of pre ICU admission SIRS, EWS and q SOFA scores for predicting mortality and length of stay in ICU. J Crit Care. 2017;41:191-193. https://doi.org/10.1016/j.jcrc.2017.05.017
36. Costa RT, Nassar AP, Caruso P. Accuracy of SOFA, qSOFA, and SIRS scores for mortality in cancer patients admitted to an intensive care unit with suspected infection. J Crit Care. 2018;45:52-57. https://doi.org/10.1016/j.jcrc.2017.12.024
37. Mellhammar L, Linder A, Tverring J, et al. NEWS2 is Superior to qSOFA in detecting sepsis with organ dysfunction in the emergency department. J Clin Med. 2019;8(8):1128. https://doi.org/10.3390/jcm8081128
38. Szakmany T, Pugh R, Kopczynska M, et al. Defining sepsis on the wards: results of a multi-centre point-prevalence study comparing two sepsis definitions. Anaesthesia. 2018;73(2):195-204. https://doi.org/10.1111/anae.14062
39. Newman TB, Kohn MA. Evidence-Based Diagnosis: An Introduction to Clinical Epidemiology. Cambridge University Press; 2009.
40. Askim Å, Moser F, Gustad LT, et al. Poor performance of quick-SOFA (qSOFA) score in predicting severe sepsis and mortality - a prospective study of patients admitted with infection to the emergency department. Scand J Trauma Resusc Emerg Med. 2017;25(1):56. https://doi.org/10.1186/s13049-017-0399-4
1. Jones SL, Ashton CM, Kiehne LB, et al. Outcomes and resource use of sepsis-associated stays by presence on admission, severity, and hospital type. Med Care. 2016;54(3):303-310. https://doi.org/10.1097/MLR.0000000000000481
2. Seymour CW, Gesten F, Prescott HC, et al. Time to treatment and mortality during mandated emergency care for sepsis. N Engl J Med. 2017;376(23):2235-2244. https://doi.org/10.1056/NEJMoa1703058
3. Kumar A, Roberts D, Wood KE, et al. Duration of hypotension before initiation of effective antimicrobial therapy is the critical determinant of survival in human septic shock. Crit Care Med. 2006;34(6):1589-1596. https://doi.org/10.1097/01.CCM.0000217961.75225.E9
4. Churpek MM, Snyder A, Sokol S, Pettit NN, Edelson DP. Investigating the impact of different suspicion of infection criteria on the accuracy of Quick Sepsis-Related Organ Failure Assessment, Systemic Inflammatory Response Syndrome, and Early Warning Scores. Crit Care Med. 2017;45(11):1805-1812. https://doi.org/10.1097/CCM.0000000000002648
5. Abdullah SMOB, Sørensen RH, Dessau RBC, Sattar SMRU, Wiese L, Nielsen FE. Prognostic accuracy of qSOFA in predicting 28-day mortality among infected patients in an emergency department: a prospective validation study. Emerg Med J. 2019;36(12):722-728. https://doi.org/10.1136/emermed-2019-208456
6. Kim KS, Suh GJ, Kim K, et al. Quick Sepsis-related Organ Failure Assessment score is not sensitive enough to predict 28-day mortality in emergency department patients with sepsis: a retrospective review. Clin Exp Emerg Med. 2019;6(1):77-83. HTTPS://DOI.ORG/ 10.15441/ceem.17.294
7. National Early Warning Score (NEWS) 2: Standardising the assessment of acute-illness severity in the NHS. Royal College of Physicians; 2017.
8. Brink A, Alsma J, Verdonschot RJCG, et al. Predicting mortality in patients with suspected sepsis at the emergency department: a retrospective cohort study comparing qSOFA, SIRS and National Early Warning Score. PLoS One. 2019;14(1):e0211133. https://doi.org/ 10.1371/journal.pone.0211133
9. Redfern OC, Smith GB, Prytherch DR, Meredith P, Inada-Kim M, Schmidt PE. A comparison of the Quick Sequential (Sepsis-Related) Organ Failure Assessment Score and the National Early Warning Score in non-ICU patients with/without infection. Crit Care Med. 2018;46(12):1923-1933. https://doi.org/10.1097/CCM.0000000000003359
10. Churpek MM, Snyder A, Han X, et al. Quick Sepsis-related Organ Failure Assessment, Systemic Inflammatory Response Syndrome, and Early Warning Scores for detecting clinical deterioration in infected patients outside the intensive care unit. Am J Respir Crit Care Med. 2017;195(7):906-911. https://doi.org/10.1164/rccm.201604-0854OC
11. Goulden R, Hoyle MC, Monis J, et al. qSOFA, SIRS and NEWS for predicting inhospital mortality and ICU admission in emergency admissions treated as sepsis. Emerg Med J. 2018;35(6):345-349. https://doi.org/10.1136/emermed-2017-207120
12. Biney I, Shepherd A, Thomas J, Mehari A. Shock Index and outcomes in patients admitted to the ICU with sepsis. Chest. 2015;148(suppl 4):337A. https://doi.org/https://doi.org/10.1378/chest.2281151
13. Wira CR, Francis MW, Bhat S, Ehrman R, Conner D, Siegel M. The shock index as a predictor of vasopressor use in emergency department patients with severe sepsis. West J Emerg Med. 2014;15(1):60-66. https://doi.org/10.5811/westjem.2013.7.18472
14. Berger T, Green J, Horeczko T, et al. Shock index and early recognition of sepsis in the emergency department: pilot study. West J Emerg Med. 2013;14(2):168-174. https://doi.org/10.5811/westjem.2012.8.11546
15. Middleton DJ, Smith TO, Bedford R, Neilly M, Myint PK. Shock Index predicts outcome in patients with suspected sepsis or community-acquired pneumonia: a systematic review. J Clin Med. 2019;8(8):1144. https://doi.org/10.3390/jcm8081144
16. Seymour CW, Liu VX, Iwashyna TJ, et al. Assessment of clinical criteria for sepsis: for the Third International Consensus Definitions for Sepsis and Septic Shock (Sepsis-3). JAMA. 2016;315(8):762-774. https://doi.org/ 10.1001/jama.2016.0288
17. Abdullah S, Sørensen RH, Dessau RBC, Sattar S, Wiese L, Nielsen FE. Prognostic accuracy of qSOFA in predicting 28-day mortality among infected patients in an emergency department: a prospective validation study. Emerg Med J. 2019;36(12):722-728. https://doi.org/10.1136/emermed-2019-208456
18. Usman OA, Usman AA, Ward MA. Comparison of SIRS, qSOFA, and NEWS for the early identification of sepsis in the Emergency Department. Am J Emerg Med. 2018;37(8):1490-1497. https://doi.org/10.1016/j.ajem.2018.10.058
19. Elixhauser A, Steiner C, Harris DR, Coffey RM. Comorbidity measures for use with administrative data. Med Care. 1998;36(1):8-27. https://doi.org/10.1097/00005650-199801000-00004
20. van Walraven C, Austin PC, Jennings A, Quan H, Forster AJ. A modification of the Elixhauser comorbidity measures into a point system for hospital death using administrative data. Med Care. 2009;47(6):626-633. https://doi.org/10.1097/MLR.0b013e31819432e5
21. Prin M, Wunsch H. The role of stepdown beds in hospital care. Am J Respir Crit Care Med. 2014;190(11):1210-1216. https://doi.org/10.1164/rccm.201406-1117PP
22. Narayanan N, Gross AK, Pintens M, Fee C, MacDougall C. Effect of an electronic medical record alert for severe sepsis among ED patients. Am J Emerg Med. 2016;34(2):185-188. https://doi.org/10.1016/j.ajem.2015.10.005
23. Singer M, Deutschman CS, Seymour CW, et al. The Third International Consensus Definitions for Sepsis and Septic Shock (Sepsis-3). JAMA. 2016;315(8):801-810. https://doi.org/10.1001/jama.2016.0287
24. Rhee C, Dantes R, Epstein L, et al. Incidence and trends of sepsis in US hospitals using clinical vs claims data, 2009-2014. JAMA. 2017;318(13):1241-1249. https://doi.org/10.1001/jama.2017.13836
25. Safari S, Baratloo A, Elfil M, Negida A. Evidence based emergency medicine; part 5 receiver operating curve and area under the curve. Emerg (Tehran). 2016;4(2):111-113.
26. DeLong ER, DeLong DM, Clarke-Pearson DL. Comparing the areas under two or more correlated receiver operating characteristic curves: a nonparametric approach. Biometrics. 1988;44(3):837-845.
27. Kangas C, Iverson L, Pierce D. Sepsis screening: combining Early Warning Scores and SIRS Criteria. Clin Nurs Res. 2021;30(1):42-49. https://doi.org/10.1177/1054773818823334.
28. Freund Y, Lemachatti N, Krastinova E, et al. Prognostic accuracy of Sepsis-3 Criteria for in-hospital mortality among patients with suspected infection presenting to the emergency department. JAMA. 2017;317(3):301-308. https://doi.org/10.1001/jama.2016.20329
29. Finkelsztein EJ, Jones DS, Ma KC, et al. Comparison of qSOFA and SIRS for predicting adverse outcomes of patients with suspicion of sepsis outside the intensive care unit. Crit Care. 2017;21(1):73. https://doi.org/10.1186/s13054-017-1658-5
30. Canet E, Taylor DM, Khor R, Krishnan V, Bellomo R. qSOFA as predictor of mortality and prolonged ICU admission in Emergency Department patients with suspected infection. J Crit Care. 2018;48:118-123. https://doi.org/10.1016/j.jcrc.2018.08.022
31. Anand V, Zhang Z, Kadri SS, Klompas M, Rhee C; CDC Prevention Epicenters Program. Epidemiology of Quick Sequential Organ Failure Assessment criteria in undifferentiated patients and association with suspected infection and sepsis. Chest. 2019;156(2):289-297. https://doi.org/10.1016/j.chest.2019.03.032
32. Hamilton F, Arnold D, Baird A, Albur M, Whiting P. Early Warning Scores do not accurately predict mortality in sepsis: A meta-analysis and systematic review of the literature. J Infect. 2018;76(3):241-248. https://doi.org/10.1016/j.jinf.2018.01.002
33. Koch E, Lovett S, Nghiem T, Riggs RA, Rech MA. Shock Index in the emergency department: utility and limitations. Open Access Emerg Med. 2019;11:179-199. https://doi.org/10.2147/OAEM.S178358
34. Yussof SJ, Zakaria MI, Mohamed FL, Bujang MA, Lakshmanan S, Asaari AH. Value of Shock Index in prognosticating the short-term outcome of death for patients presenting with severe sepsis and septic shock in the emergency department. Med J Malaysia. 2012;67(4):406-411.
35. Siddiqui S, Chua M, Kumaresh V, Choo R. A comparison of pre ICU admission SIRS, EWS and q SOFA scores for predicting mortality and length of stay in ICU. J Crit Care. 2017;41:191-193. https://doi.org/10.1016/j.jcrc.2017.05.017
36. Costa RT, Nassar AP, Caruso P. Accuracy of SOFA, qSOFA, and SIRS scores for mortality in cancer patients admitted to an intensive care unit with suspected infection. J Crit Care. 2018;45:52-57. https://doi.org/10.1016/j.jcrc.2017.12.024
37. Mellhammar L, Linder A, Tverring J, et al. NEWS2 is Superior to qSOFA in detecting sepsis with organ dysfunction in the emergency department. J Clin Med. 2019;8(8):1128. https://doi.org/10.3390/jcm8081128
38. Szakmany T, Pugh R, Kopczynska M, et al. Defining sepsis on the wards: results of a multi-centre point-prevalence study comparing two sepsis definitions. Anaesthesia. 2018;73(2):195-204. https://doi.org/10.1111/anae.14062
39. Newman TB, Kohn MA. Evidence-Based Diagnosis: An Introduction to Clinical Epidemiology. Cambridge University Press; 2009.
40. Askim Å, Moser F, Gustad LT, et al. Poor performance of quick-SOFA (qSOFA) score in predicting severe sepsis and mortality - a prospective study of patients admitted with infection to the emergency department. Scand J Trauma Resusc Emerg Med. 2017;25(1):56. https://doi.org/10.1186/s13049-017-0399-4
© 2021 Society of Hospital Medicine
Drawing Down From Crisis: More Lessons From a Soldier
Last year, I wrote an article for the Journal of Hospital Medicine offering tips to healthcare providers in what was then an expanding COVID-19 environment.1 These lessons were drawn from my experiences during the “tough fights” and crisis situations of my military career, situations similar to what healthcare providers experienced during the pandemic.
Now, as vaccination rates rise and hospitalization rates fall, the nation and healthcare profession begin the transition to “normalcy.” What should healthcare professionals expect as they transition from a year of operating in a crisis to resumption of the habitual? What memories and lessons will linger from a long, tough fight against COVID-19, and how might physicians best approach the many post-crisis challenges they will surely face?
My military experiences inform the tips I offer to those in the medical profession. Both professions depend on adeptly leading and building a functional and effective organizational culture under trying circumstances. It may seem strange, but the challenges healthcare workers (HCWs) faced in fighting COVID-19 are comparable to what soldiers experience on a battlefield. And now, as citizens return to “normal” (however normal is defined), only naïve HCWs will believe they can simply resume their previous habits and practices. This part of the journey will present new challenges and unique opportunities.
Healthcare has changed…and so have you! Just like soldiers coming home from the battlefield face a necessarily new and different world, HCWs will also face changing circumstances, environments, and organizational requirements. Given this new landscape, I offer some of my lessons learned coming out of combat to help you adapt.
REFLECTIONS
Heading home from my last combat tour in Iraq, I found myself gazing out the aircraft window and pondering my personal experiences during a very long combat tour commanding a multinational task force. Pulling out my green soldier’s notebook, I rapidly scratched out some reflections on where I was, what I had learned, and what I needed to address personally and professionally. In talking with physicians in the healthcare organization where I now work, this emotional checklist seems to mirror some of the same thoughts they face coming out of the COVID-19 crisis.
Expect exhaustion. There’s a military axiom that “fatigue can make cowards of us all,” and while I don’t think I had succumbed to cowardice in battle, after 15 months in combat I was exhausted. Commanders in combat—or HCWs fighting a pandemic—face unrelenting demands from a variety of audiences. Leaders are asked to solve unsolvable problems, be at the right place at the right time with the right answers, have more energy than others, be upbeat, and exhibit behaviors that will motivate the “troops.” That’s true even if they’re exhausted and weary to the bone, serving on multiple teams, and attending endless meetings. There is also the common and unfortunate expectation that leaders should not take any time for themselves.
During the pandemic, most HCWs reported sleeping less, having little time to interact casually with others, and having less time for personal reflection, exercise, personal growth, or even prayer. My solution for addressing exhaustion was to develop a personal plan to address each one of these areas—mental, emotional, physical, spiritual—with a detailed rest and recovery strategy. I wrote my plan down, knowing that I would need to discuss this blueprint with both my employer and my spouse, who I suspected would have different ideas on what my schedule should look like after returning “home.” Healthcare providers have been through the same kinds of stresses and need to ask themselves: What recovery plan have I designed to help me overcome the fatigue I feel, and have I talked about this plan with the people who will be affected by it?
Take pride in what your teams accomplished. I was proud of how my teams had accomplished the impossible and how they had adapted to continually changing situations. Whenever military organizations know they’ll face the enemy in combat, they feel heightened anxiety, increased fear, and concern about the preparedness of their team. The Army, like any successful team, attempts to mitigate those emotions through training. During my reflections, I remembered the teams that came together to accomplish very tough missions. Some of those teams were those I had concerns about prior to deployment, but fortunately they often surprised me with their adaptability and successes in combat.
Leaders in healthcare can likely relate. Even in normal situations, organizational fault lines exist between physicians, nurses, and administrators. These fault lines may manifest as communication disconnects and distrust between different members who may not completely trust one another due to differences in training, culture, or role within the organization. But during a crisis, rifts dissipate and trust evolves as different cultures are forced to work together. Many healthcare organizations report that, during the COVID crisis, most personality conflicts, communication disconnects, and organizational dysfunctions receded, and organizations saw more and greater coordination and collaboration. Extensive research on leadership demonstrates that crises drive teams to communicate better and become more effective and efficient in accomplishing stated goals, resulting in team members who relish “being there” for one another like never before. These positive changes must be reinforced to ensure these newly formed high-performing teams do not revert back to work silos, which usually occurs due to distrust.
Just as important as pride in teams is the pride in the accomplishment of specific individuals during times of crisis. Diverse members of any organization deliver some of the best solutions to the toughest problems when they are included in the discussion, allowed to bring their ideas to the table, and rewarded for their actions (and their courage)! Just one example is given by Dr Sasha Shillcut as she describes the innovations and adaptations of the women physicians she observed in her organization during the COVID-19 crisis,2 and there are many examples of other organizations citing similar transformation in areas like telemedicine, emergency department procedures, and equipment design and use.3,4
Anticipate “survivor’s guilt.” During my three combat tours, 253 soldiers under my command or in my organization sacrificed their lives for the mission, and many more were wounded in action. There are times when bad dreams remind me of some of the circumstances surrounding the incidents that took the lives of those who died, and I often wake with a start and in a sweat. The first question I always ask myself in the middle of the night when this happens is, “Why did they die, and why did I survive?” That question is always followed by, “What might I have done differently to prevent those deaths?”
As we draw down from treating patients during the COVID-19 crisis, healthcare providers must also be wary of “survivor’s guilt.” Survivor’s guilt is a strong emotion for anyone who has survived a crisis, especially when their friends or loved ones have not. Healthcare providers have lost many patients, but they have also lost colleagues, friends, and family members. Because you are in the healing profession, many of you will question what more you could have done to prevent the loss of life. You likely won’t ever be completely satisfied with the answer, but I have a recommendation that may assuage your emotions.
In combat, we continually memorialized our fallen comrades in ceremonies that are attended by the entire unit. One of my commanders had an idea to keep pictures of those who had made the ultimate sacrifice, and on my desk is a box with the 253 pictures of those dedicated individuals who were killed in action under my command or in my unit. On the top of the box are the words “Make It Matter.” I look at those pictures often to remember them and their selfless service to the nation, and I often ask myself whether I am “making it matter” in my daily activities. Does your healthcare facility have plans for a memorial service for all those who died while in your care? Is there a special tribute in your hospital to those healthcare providers who paid the ultimate sacrifice in caring for patients? Most importantly, have you rededicated yourself to your profession, knowing that what you learned during the pandemic will help you be a better physician in the future, and do you have the knowledge that you are making a meaningful difference every day you serve in healthcare?
Relish being home. On that flight back to family, my excitement was palpable. But there were challenges too, as I knew I had to continue to focus on my team, my organization, and my profession. While images on the internet often show soldiers returning from war rushing into the arms of their loved ones, soldiers never leave the demands associated with wearing the cloth of the country. As a result, many marriages and families are damaged when one member who has been so singularly focused returns home and is still caught up in the demands of the job. They find it is difficult to pick up where they’ve left off, forgetting their family has also been under a different kind of intense stress.
These same challenges will face HCWs. Many of you voluntarily distanced yourself from family and friends due to a fear of transmitting the disease. Spouses and children underwent traumatic challenges in their jobs, holding together the household and piloting kids through schooling. My biggest recommendation is this: strive for a return to a healthy balance, be wary of any sharp edges that appear in your personality or in your relationships, and be open in communicating with those you love. Relying on friends, counselors, and mentors who can provide trusted advice—as well as therapy, if necessary—is not a sign of weakness, but a sign of strength and courage. The pandemic has affected our lives more than we can imagine, and “coming out” of the crisis will continue to test our humanity and civility like never before. Trust me on this one. I’ve been there.
RECOMMENDATIONS FOR POST-CRISIS ACTIONS
These reflections open us to issues physicians must address in the months after your “redeployment” from dealing with the pandemic. When soldiers redeploy from combat, every unit develops a plan to address personal and professional growth for individual members of the team. Additionally, leaders develop a plan to sustain performance and improve teams and organizational approaches. The objective? Polish the diamond from what we learned during the crisis, while preparing for those things that might detract from effectiveness in future crises. It’s an SOP (standard operating procedure) for military units to do these things. Is this approach also advisable for healthcare professionals and teams in responding to crises?
Crises increase stress on individuals and disrupt the functioning of organizations, but crises also provide phenomenal opportunities for growth.5 Adaptive organizations, be they military or healthcare, must take time to understand how the crises affected people and the organizational framework, while also preparing for potential future disruptions. While HCWs and their respective organizations are usually adept at learning from short-term emergencies (eg, limited disease outbreaks, natural disasters, mass-casualty events), they are less practiced in addressing crises that affect the profession for months. It has been a century since the medical profession has been faced with a global pandemic, but experts suggest other pandemics may be on the short-term horizon.6 We ought to use this past year of experiences to prepare for them.
Pay attention to your personal needs and the conditions of others on your team. After returning from combat, I was exhausted and stressed intellectually, physically, emotionally, and spiritually. From what I’ve seen, healthcare providers fit that same description, and the fatigue is palpable. Many of you have experienced extreme stress. I have experienced extremepost-traumatic stress, and it is important to understand that this will affect some on your team.7 In addition to addressing stress—and this is advice I give to all the physicians I know—find the time to get a physical examination. While the Army requires yearly physicals for all soldiers (especially generals!), most healthcare providers I know are shockingly deficient in taking the time to get a checkup from one of their colleagues. Commit to fixing that.
Reflect on what you have learned during this period. Take an afternoon with an adult beverage (if that’s your style) and reflect on what you learned and what others might learn from your unique experiences. Then, take some notes and shape your ideas. What did you experience? What adaptations did you or your team make during the pandemic? What worked and what didn’t? What things do you want to sustain in your practice and what things do you want to eliminate? What did you learn about the medical arts…or even about your Hippocratic Oath? If you have a mentor, share these thoughts with them; if you don’t have a mentor, find one and then share your thoughts with them. Get some outside feedback.
Assess team strengths and weaknesses. If you’re a formal physician leader (someone with a title and a position on your team), it’s your responsibility to provide feedback on both people and processes. If you’re an informal leader (someone who is a member of the team but doesn’t have specific leadership responsibilities outside your clinical role) and you don’t see this happening, volunteer to run the session for your formal leader and your organization. This session should last several hours and be held in a comfortable setting. You should prepare your team so they aren’t defensive about the points that may arise. Determine strengths and opportunities by asking for feedback on communication, behaviors, medical knowledge, emotional intelligence, and execution of tasks. Determine which processes and systems either worked or didn’t work, and either polish the approaches or drive change to improve systems as you get back to normal. Crises provide an opportunity to fix what’s broken while also reinforcing the things that worked in the crisis that might not be normal procedure. Don’t go back to old ways if those weren’t the things or the approaches you were using under critical conditions.
Encourage completion of an organization-wide after-action review (AAR). As I started writing this article, I watched CNN’s Dr Sanjay Gupta conduct a review of actions with the key physicians who contributed to the last administration’s response to the pandemic. In watching that session—and having conducted hundreds of AARs in my military career—there was discussion of obvious good and bad leadership and management procedures, process issues that needed to be addressed, and decision-making that might be applauded or questioned. Every healthcare organization ought to conduct a similar AAR, with a review of the most important aspects of actions and teamwork, the hospital’s operations, logistical preparation, and leader and organization procedures that demand to be addressed.
The successful conduct of any AAR requires asking (and getting answers to) four questions: What happened?; Why did it happen the way it did?; What needs to be fixed or “polished” in the processes, systems, or leadership approach?; and Who is responsible for ensuring the fixes or adjustments occur? The facilitator (and the key leaders of the organization) must ask the right questions, must be deeply involved in getting the right people to comment on the issues, and must “pin the rose” on someone who will be responsible for carrying through on the fixes. At the end of the AAR, after the key topics are discussed, with a plan for addressing each, the person in charge of the organization must publish an action plan with details for ensuring the fixes.
Like all citizens across our nation, my family is grateful for the skill and professionalism exhibited by clinicians and healthcare providers during this devastating pandemic. While we are all breathing a sigh of relief as we see the end in sight, true professionals must take the opportunity to learn and grow from this crisis and adapt. Hopefully, the reflections and recommendations in this article—things I learned from a different profession—will provide ideas to my new colleagues in healthcare.
1. Hertling M. Ten tips for a crisis: lessons from a soldier. J Hosp Med. 2020;15(5): 275-276. https://doi.org/10.12788/jhm.3424
2. Shillcut S. The inspiring women physicians of the COVID-19 pandemic. MedPage Today. April 9, 2020. Accessed July 7, 2021. https://www.kevinmd.com/blog/2020/04/the-insiring-women-physicians-of-the-covid-19-pandemic.html
3. Daley B. Three medical innovations fueled by COVID-19 that will outlast the pandemic. The Conversation. March 9, 2021. Accessed July 7, 2021. https://theconversation.com/3-medical-innovations-fueled-by-covid-19-that-will-outlast-the-pandemic-156464
4. Drees J, Dyrda L, Adams K. Ten big advancements in healthcare tech during the pandemic. Becker’s Health IT. July 6, 2020. Accessed July 7, 2021. https://www.beckershospitalreview.com/digital-transformation/10-big-advancements-in-healthcare-tech-during-the-pandemic.html
5. Wang J. Developing organizational learning capacity in crisis management. Adv Developing Hum Resources. 10(3):425-445. https://doi.org/10.1177/1523422308316464
6. Morens DM, Fauci AS. Emerging pandemic diseases: how we got COVID-19. Cell. 2020;182(5):1077-1092. https://doi.org/10.1016/j.cell.2020.08.021
7. What is posttraumatic stress disorder? American Psychiatric Association. Reviewed August 2020. Accessed July 7, 2021. https://www.psychiatry.org/patients-families/ptsd/what-is-ptsd
Last year, I wrote an article for the Journal of Hospital Medicine offering tips to healthcare providers in what was then an expanding COVID-19 environment.1 These lessons were drawn from my experiences during the “tough fights” and crisis situations of my military career, situations similar to what healthcare providers experienced during the pandemic.
Now, as vaccination rates rise and hospitalization rates fall, the nation and healthcare profession begin the transition to “normalcy.” What should healthcare professionals expect as they transition from a year of operating in a crisis to resumption of the habitual? What memories and lessons will linger from a long, tough fight against COVID-19, and how might physicians best approach the many post-crisis challenges they will surely face?
My military experiences inform the tips I offer to those in the medical profession. Both professions depend on adeptly leading and building a functional and effective organizational culture under trying circumstances. It may seem strange, but the challenges healthcare workers (HCWs) faced in fighting COVID-19 are comparable to what soldiers experience on a battlefield. And now, as citizens return to “normal” (however normal is defined), only naïve HCWs will believe they can simply resume their previous habits and practices. This part of the journey will present new challenges and unique opportunities.
Healthcare has changed…and so have you! Just like soldiers coming home from the battlefield face a necessarily new and different world, HCWs will also face changing circumstances, environments, and organizational requirements. Given this new landscape, I offer some of my lessons learned coming out of combat to help you adapt.
REFLECTIONS
Heading home from my last combat tour in Iraq, I found myself gazing out the aircraft window and pondering my personal experiences during a very long combat tour commanding a multinational task force. Pulling out my green soldier’s notebook, I rapidly scratched out some reflections on where I was, what I had learned, and what I needed to address personally and professionally. In talking with physicians in the healthcare organization where I now work, this emotional checklist seems to mirror some of the same thoughts they face coming out of the COVID-19 crisis.
Expect exhaustion. There’s a military axiom that “fatigue can make cowards of us all,” and while I don’t think I had succumbed to cowardice in battle, after 15 months in combat I was exhausted. Commanders in combat—or HCWs fighting a pandemic—face unrelenting demands from a variety of audiences. Leaders are asked to solve unsolvable problems, be at the right place at the right time with the right answers, have more energy than others, be upbeat, and exhibit behaviors that will motivate the “troops.” That’s true even if they’re exhausted and weary to the bone, serving on multiple teams, and attending endless meetings. There is also the common and unfortunate expectation that leaders should not take any time for themselves.
During the pandemic, most HCWs reported sleeping less, having little time to interact casually with others, and having less time for personal reflection, exercise, personal growth, or even prayer. My solution for addressing exhaustion was to develop a personal plan to address each one of these areas—mental, emotional, physical, spiritual—with a detailed rest and recovery strategy. I wrote my plan down, knowing that I would need to discuss this blueprint with both my employer and my spouse, who I suspected would have different ideas on what my schedule should look like after returning “home.” Healthcare providers have been through the same kinds of stresses and need to ask themselves: What recovery plan have I designed to help me overcome the fatigue I feel, and have I talked about this plan with the people who will be affected by it?
Take pride in what your teams accomplished. I was proud of how my teams had accomplished the impossible and how they had adapted to continually changing situations. Whenever military organizations know they’ll face the enemy in combat, they feel heightened anxiety, increased fear, and concern about the preparedness of their team. The Army, like any successful team, attempts to mitigate those emotions through training. During my reflections, I remembered the teams that came together to accomplish very tough missions. Some of those teams were those I had concerns about prior to deployment, but fortunately they often surprised me with their adaptability and successes in combat.
Leaders in healthcare can likely relate. Even in normal situations, organizational fault lines exist between physicians, nurses, and administrators. These fault lines may manifest as communication disconnects and distrust between different members who may not completely trust one another due to differences in training, culture, or role within the organization. But during a crisis, rifts dissipate and trust evolves as different cultures are forced to work together. Many healthcare organizations report that, during the COVID crisis, most personality conflicts, communication disconnects, and organizational dysfunctions receded, and organizations saw more and greater coordination and collaboration. Extensive research on leadership demonstrates that crises drive teams to communicate better and become more effective and efficient in accomplishing stated goals, resulting in team members who relish “being there” for one another like never before. These positive changes must be reinforced to ensure these newly formed high-performing teams do not revert back to work silos, which usually occurs due to distrust.
Just as important as pride in teams is the pride in the accomplishment of specific individuals during times of crisis. Diverse members of any organization deliver some of the best solutions to the toughest problems when they are included in the discussion, allowed to bring their ideas to the table, and rewarded for their actions (and their courage)! Just one example is given by Dr Sasha Shillcut as she describes the innovations and adaptations of the women physicians she observed in her organization during the COVID-19 crisis,2 and there are many examples of other organizations citing similar transformation in areas like telemedicine, emergency department procedures, and equipment design and use.3,4
Anticipate “survivor’s guilt.” During my three combat tours, 253 soldiers under my command or in my organization sacrificed their lives for the mission, and many more were wounded in action. There are times when bad dreams remind me of some of the circumstances surrounding the incidents that took the lives of those who died, and I often wake with a start and in a sweat. The first question I always ask myself in the middle of the night when this happens is, “Why did they die, and why did I survive?” That question is always followed by, “What might I have done differently to prevent those deaths?”
As we draw down from treating patients during the COVID-19 crisis, healthcare providers must also be wary of “survivor’s guilt.” Survivor’s guilt is a strong emotion for anyone who has survived a crisis, especially when their friends or loved ones have not. Healthcare providers have lost many patients, but they have also lost colleagues, friends, and family members. Because you are in the healing profession, many of you will question what more you could have done to prevent the loss of life. You likely won’t ever be completely satisfied with the answer, but I have a recommendation that may assuage your emotions.
In combat, we continually memorialized our fallen comrades in ceremonies that are attended by the entire unit. One of my commanders had an idea to keep pictures of those who had made the ultimate sacrifice, and on my desk is a box with the 253 pictures of those dedicated individuals who were killed in action under my command or in my unit. On the top of the box are the words “Make It Matter.” I look at those pictures often to remember them and their selfless service to the nation, and I often ask myself whether I am “making it matter” in my daily activities. Does your healthcare facility have plans for a memorial service for all those who died while in your care? Is there a special tribute in your hospital to those healthcare providers who paid the ultimate sacrifice in caring for patients? Most importantly, have you rededicated yourself to your profession, knowing that what you learned during the pandemic will help you be a better physician in the future, and do you have the knowledge that you are making a meaningful difference every day you serve in healthcare?
Relish being home. On that flight back to family, my excitement was palpable. But there were challenges too, as I knew I had to continue to focus on my team, my organization, and my profession. While images on the internet often show soldiers returning from war rushing into the arms of their loved ones, soldiers never leave the demands associated with wearing the cloth of the country. As a result, many marriages and families are damaged when one member who has been so singularly focused returns home and is still caught up in the demands of the job. They find it is difficult to pick up where they’ve left off, forgetting their family has also been under a different kind of intense stress.
These same challenges will face HCWs. Many of you voluntarily distanced yourself from family and friends due to a fear of transmitting the disease. Spouses and children underwent traumatic challenges in their jobs, holding together the household and piloting kids through schooling. My biggest recommendation is this: strive for a return to a healthy balance, be wary of any sharp edges that appear in your personality or in your relationships, and be open in communicating with those you love. Relying on friends, counselors, and mentors who can provide trusted advice—as well as therapy, if necessary—is not a sign of weakness, but a sign of strength and courage. The pandemic has affected our lives more than we can imagine, and “coming out” of the crisis will continue to test our humanity and civility like never before. Trust me on this one. I’ve been there.
RECOMMENDATIONS FOR POST-CRISIS ACTIONS
These reflections open us to issues physicians must address in the months after your “redeployment” from dealing with the pandemic. When soldiers redeploy from combat, every unit develops a plan to address personal and professional growth for individual members of the team. Additionally, leaders develop a plan to sustain performance and improve teams and organizational approaches. The objective? Polish the diamond from what we learned during the crisis, while preparing for those things that might detract from effectiveness in future crises. It’s an SOP (standard operating procedure) for military units to do these things. Is this approach also advisable for healthcare professionals and teams in responding to crises?
Crises increase stress on individuals and disrupt the functioning of organizations, but crises also provide phenomenal opportunities for growth.5 Adaptive organizations, be they military or healthcare, must take time to understand how the crises affected people and the organizational framework, while also preparing for potential future disruptions. While HCWs and their respective organizations are usually adept at learning from short-term emergencies (eg, limited disease outbreaks, natural disasters, mass-casualty events), they are less practiced in addressing crises that affect the profession for months. It has been a century since the medical profession has been faced with a global pandemic, but experts suggest other pandemics may be on the short-term horizon.6 We ought to use this past year of experiences to prepare for them.
Pay attention to your personal needs and the conditions of others on your team. After returning from combat, I was exhausted and stressed intellectually, physically, emotionally, and spiritually. From what I’ve seen, healthcare providers fit that same description, and the fatigue is palpable. Many of you have experienced extreme stress. I have experienced extremepost-traumatic stress, and it is important to understand that this will affect some on your team.7 In addition to addressing stress—and this is advice I give to all the physicians I know—find the time to get a physical examination. While the Army requires yearly physicals for all soldiers (especially generals!), most healthcare providers I know are shockingly deficient in taking the time to get a checkup from one of their colleagues. Commit to fixing that.
Reflect on what you have learned during this period. Take an afternoon with an adult beverage (if that’s your style) and reflect on what you learned and what others might learn from your unique experiences. Then, take some notes and shape your ideas. What did you experience? What adaptations did you or your team make during the pandemic? What worked and what didn’t? What things do you want to sustain in your practice and what things do you want to eliminate? What did you learn about the medical arts…or even about your Hippocratic Oath? If you have a mentor, share these thoughts with them; if you don’t have a mentor, find one and then share your thoughts with them. Get some outside feedback.
Assess team strengths and weaknesses. If you’re a formal physician leader (someone with a title and a position on your team), it’s your responsibility to provide feedback on both people and processes. If you’re an informal leader (someone who is a member of the team but doesn’t have specific leadership responsibilities outside your clinical role) and you don’t see this happening, volunteer to run the session for your formal leader and your organization. This session should last several hours and be held in a comfortable setting. You should prepare your team so they aren’t defensive about the points that may arise. Determine strengths and opportunities by asking for feedback on communication, behaviors, medical knowledge, emotional intelligence, and execution of tasks. Determine which processes and systems either worked or didn’t work, and either polish the approaches or drive change to improve systems as you get back to normal. Crises provide an opportunity to fix what’s broken while also reinforcing the things that worked in the crisis that might not be normal procedure. Don’t go back to old ways if those weren’t the things or the approaches you were using under critical conditions.
Encourage completion of an organization-wide after-action review (AAR). As I started writing this article, I watched CNN’s Dr Sanjay Gupta conduct a review of actions with the key physicians who contributed to the last administration’s response to the pandemic. In watching that session—and having conducted hundreds of AARs in my military career—there was discussion of obvious good and bad leadership and management procedures, process issues that needed to be addressed, and decision-making that might be applauded or questioned. Every healthcare organization ought to conduct a similar AAR, with a review of the most important aspects of actions and teamwork, the hospital’s operations, logistical preparation, and leader and organization procedures that demand to be addressed.
The successful conduct of any AAR requires asking (and getting answers to) four questions: What happened?; Why did it happen the way it did?; What needs to be fixed or “polished” in the processes, systems, or leadership approach?; and Who is responsible for ensuring the fixes or adjustments occur? The facilitator (and the key leaders of the organization) must ask the right questions, must be deeply involved in getting the right people to comment on the issues, and must “pin the rose” on someone who will be responsible for carrying through on the fixes. At the end of the AAR, after the key topics are discussed, with a plan for addressing each, the person in charge of the organization must publish an action plan with details for ensuring the fixes.
Like all citizens across our nation, my family is grateful for the skill and professionalism exhibited by clinicians and healthcare providers during this devastating pandemic. While we are all breathing a sigh of relief as we see the end in sight, true professionals must take the opportunity to learn and grow from this crisis and adapt. Hopefully, the reflections and recommendations in this article—things I learned from a different profession—will provide ideas to my new colleagues in healthcare.
Last year, I wrote an article for the Journal of Hospital Medicine offering tips to healthcare providers in what was then an expanding COVID-19 environment.1 These lessons were drawn from my experiences during the “tough fights” and crisis situations of my military career, situations similar to what healthcare providers experienced during the pandemic.
Now, as vaccination rates rise and hospitalization rates fall, the nation and healthcare profession begin the transition to “normalcy.” What should healthcare professionals expect as they transition from a year of operating in a crisis to resumption of the habitual? What memories and lessons will linger from a long, tough fight against COVID-19, and how might physicians best approach the many post-crisis challenges they will surely face?
My military experiences inform the tips I offer to those in the medical profession. Both professions depend on adeptly leading and building a functional and effective organizational culture under trying circumstances. It may seem strange, but the challenges healthcare workers (HCWs) faced in fighting COVID-19 are comparable to what soldiers experience on a battlefield. And now, as citizens return to “normal” (however normal is defined), only naïve HCWs will believe they can simply resume their previous habits and practices. This part of the journey will present new challenges and unique opportunities.
Healthcare has changed…and so have you! Just like soldiers coming home from the battlefield face a necessarily new and different world, HCWs will also face changing circumstances, environments, and organizational requirements. Given this new landscape, I offer some of my lessons learned coming out of combat to help you adapt.
REFLECTIONS
Heading home from my last combat tour in Iraq, I found myself gazing out the aircraft window and pondering my personal experiences during a very long combat tour commanding a multinational task force. Pulling out my green soldier’s notebook, I rapidly scratched out some reflections on where I was, what I had learned, and what I needed to address personally and professionally. In talking with physicians in the healthcare organization where I now work, this emotional checklist seems to mirror some of the same thoughts they face coming out of the COVID-19 crisis.
Expect exhaustion. There’s a military axiom that “fatigue can make cowards of us all,” and while I don’t think I had succumbed to cowardice in battle, after 15 months in combat I was exhausted. Commanders in combat—or HCWs fighting a pandemic—face unrelenting demands from a variety of audiences. Leaders are asked to solve unsolvable problems, be at the right place at the right time with the right answers, have more energy than others, be upbeat, and exhibit behaviors that will motivate the “troops.” That’s true even if they’re exhausted and weary to the bone, serving on multiple teams, and attending endless meetings. There is also the common and unfortunate expectation that leaders should not take any time for themselves.
During the pandemic, most HCWs reported sleeping less, having little time to interact casually with others, and having less time for personal reflection, exercise, personal growth, or even prayer. My solution for addressing exhaustion was to develop a personal plan to address each one of these areas—mental, emotional, physical, spiritual—with a detailed rest and recovery strategy. I wrote my plan down, knowing that I would need to discuss this blueprint with both my employer and my spouse, who I suspected would have different ideas on what my schedule should look like after returning “home.” Healthcare providers have been through the same kinds of stresses and need to ask themselves: What recovery plan have I designed to help me overcome the fatigue I feel, and have I talked about this plan with the people who will be affected by it?
Take pride in what your teams accomplished. I was proud of how my teams had accomplished the impossible and how they had adapted to continually changing situations. Whenever military organizations know they’ll face the enemy in combat, they feel heightened anxiety, increased fear, and concern about the preparedness of their team. The Army, like any successful team, attempts to mitigate those emotions through training. During my reflections, I remembered the teams that came together to accomplish very tough missions. Some of those teams were those I had concerns about prior to deployment, but fortunately they often surprised me with their adaptability and successes in combat.
Leaders in healthcare can likely relate. Even in normal situations, organizational fault lines exist between physicians, nurses, and administrators. These fault lines may manifest as communication disconnects and distrust between different members who may not completely trust one another due to differences in training, culture, or role within the organization. But during a crisis, rifts dissipate and trust evolves as different cultures are forced to work together. Many healthcare organizations report that, during the COVID crisis, most personality conflicts, communication disconnects, and organizational dysfunctions receded, and organizations saw more and greater coordination and collaboration. Extensive research on leadership demonstrates that crises drive teams to communicate better and become more effective and efficient in accomplishing stated goals, resulting in team members who relish “being there” for one another like never before. These positive changes must be reinforced to ensure these newly formed high-performing teams do not revert back to work silos, which usually occurs due to distrust.
Just as important as pride in teams is the pride in the accomplishment of specific individuals during times of crisis. Diverse members of any organization deliver some of the best solutions to the toughest problems when they are included in the discussion, allowed to bring their ideas to the table, and rewarded for their actions (and their courage)! Just one example is given by Dr Sasha Shillcut as she describes the innovations and adaptations of the women physicians she observed in her organization during the COVID-19 crisis,2 and there are many examples of other organizations citing similar transformation in areas like telemedicine, emergency department procedures, and equipment design and use.3,4
Anticipate “survivor’s guilt.” During my three combat tours, 253 soldiers under my command or in my organization sacrificed their lives for the mission, and many more were wounded in action. There are times when bad dreams remind me of some of the circumstances surrounding the incidents that took the lives of those who died, and I often wake with a start and in a sweat. The first question I always ask myself in the middle of the night when this happens is, “Why did they die, and why did I survive?” That question is always followed by, “What might I have done differently to prevent those deaths?”
As we draw down from treating patients during the COVID-19 crisis, healthcare providers must also be wary of “survivor’s guilt.” Survivor’s guilt is a strong emotion for anyone who has survived a crisis, especially when their friends or loved ones have not. Healthcare providers have lost many patients, but they have also lost colleagues, friends, and family members. Because you are in the healing profession, many of you will question what more you could have done to prevent the loss of life. You likely won’t ever be completely satisfied with the answer, but I have a recommendation that may assuage your emotions.
In combat, we continually memorialized our fallen comrades in ceremonies that are attended by the entire unit. One of my commanders had an idea to keep pictures of those who had made the ultimate sacrifice, and on my desk is a box with the 253 pictures of those dedicated individuals who were killed in action under my command or in my unit. On the top of the box are the words “Make It Matter.” I look at those pictures often to remember them and their selfless service to the nation, and I often ask myself whether I am “making it matter” in my daily activities. Does your healthcare facility have plans for a memorial service for all those who died while in your care? Is there a special tribute in your hospital to those healthcare providers who paid the ultimate sacrifice in caring for patients? Most importantly, have you rededicated yourself to your profession, knowing that what you learned during the pandemic will help you be a better physician in the future, and do you have the knowledge that you are making a meaningful difference every day you serve in healthcare?
Relish being home. On that flight back to family, my excitement was palpable. But there were challenges too, as I knew I had to continue to focus on my team, my organization, and my profession. While images on the internet often show soldiers returning from war rushing into the arms of their loved ones, soldiers never leave the demands associated with wearing the cloth of the country. As a result, many marriages and families are damaged when one member who has been so singularly focused returns home and is still caught up in the demands of the job. They find it is difficult to pick up where they’ve left off, forgetting their family has also been under a different kind of intense stress.
These same challenges will face HCWs. Many of you voluntarily distanced yourself from family and friends due to a fear of transmitting the disease. Spouses and children underwent traumatic challenges in their jobs, holding together the household and piloting kids through schooling. My biggest recommendation is this: strive for a return to a healthy balance, be wary of any sharp edges that appear in your personality or in your relationships, and be open in communicating with those you love. Relying on friends, counselors, and mentors who can provide trusted advice—as well as therapy, if necessary—is not a sign of weakness, but a sign of strength and courage. The pandemic has affected our lives more than we can imagine, and “coming out” of the crisis will continue to test our humanity and civility like never before. Trust me on this one. I’ve been there.
RECOMMENDATIONS FOR POST-CRISIS ACTIONS
These reflections open us to issues physicians must address in the months after your “redeployment” from dealing with the pandemic. When soldiers redeploy from combat, every unit develops a plan to address personal and professional growth for individual members of the team. Additionally, leaders develop a plan to sustain performance and improve teams and organizational approaches. The objective? Polish the diamond from what we learned during the crisis, while preparing for those things that might detract from effectiveness in future crises. It’s an SOP (standard operating procedure) for military units to do these things. Is this approach also advisable for healthcare professionals and teams in responding to crises?
Crises increase stress on individuals and disrupt the functioning of organizations, but crises also provide phenomenal opportunities for growth.5 Adaptive organizations, be they military or healthcare, must take time to understand how the crises affected people and the organizational framework, while also preparing for potential future disruptions. While HCWs and their respective organizations are usually adept at learning from short-term emergencies (eg, limited disease outbreaks, natural disasters, mass-casualty events), they are less practiced in addressing crises that affect the profession for months. It has been a century since the medical profession has been faced with a global pandemic, but experts suggest other pandemics may be on the short-term horizon.6 We ought to use this past year of experiences to prepare for them.
Pay attention to your personal needs and the conditions of others on your team. After returning from combat, I was exhausted and stressed intellectually, physically, emotionally, and spiritually. From what I’ve seen, healthcare providers fit that same description, and the fatigue is palpable. Many of you have experienced extreme stress. I have experienced extremepost-traumatic stress, and it is important to understand that this will affect some on your team.7 In addition to addressing stress—and this is advice I give to all the physicians I know—find the time to get a physical examination. While the Army requires yearly physicals for all soldiers (especially generals!), most healthcare providers I know are shockingly deficient in taking the time to get a checkup from one of their colleagues. Commit to fixing that.
Reflect on what you have learned during this period. Take an afternoon with an adult beverage (if that’s your style) and reflect on what you learned and what others might learn from your unique experiences. Then, take some notes and shape your ideas. What did you experience? What adaptations did you or your team make during the pandemic? What worked and what didn’t? What things do you want to sustain in your practice and what things do you want to eliminate? What did you learn about the medical arts…or even about your Hippocratic Oath? If you have a mentor, share these thoughts with them; if you don’t have a mentor, find one and then share your thoughts with them. Get some outside feedback.
Assess team strengths and weaknesses. If you’re a formal physician leader (someone with a title and a position on your team), it’s your responsibility to provide feedback on both people and processes. If you’re an informal leader (someone who is a member of the team but doesn’t have specific leadership responsibilities outside your clinical role) and you don’t see this happening, volunteer to run the session for your formal leader and your organization. This session should last several hours and be held in a comfortable setting. You should prepare your team so they aren’t defensive about the points that may arise. Determine strengths and opportunities by asking for feedback on communication, behaviors, medical knowledge, emotional intelligence, and execution of tasks. Determine which processes and systems either worked or didn’t work, and either polish the approaches or drive change to improve systems as you get back to normal. Crises provide an opportunity to fix what’s broken while also reinforcing the things that worked in the crisis that might not be normal procedure. Don’t go back to old ways if those weren’t the things or the approaches you were using under critical conditions.
Encourage completion of an organization-wide after-action review (AAR). As I started writing this article, I watched CNN’s Dr Sanjay Gupta conduct a review of actions with the key physicians who contributed to the last administration’s response to the pandemic. In watching that session—and having conducted hundreds of AARs in my military career—there was discussion of obvious good and bad leadership and management procedures, process issues that needed to be addressed, and decision-making that might be applauded or questioned. Every healthcare organization ought to conduct a similar AAR, with a review of the most important aspects of actions and teamwork, the hospital’s operations, logistical preparation, and leader and organization procedures that demand to be addressed.
The successful conduct of any AAR requires asking (and getting answers to) four questions: What happened?; Why did it happen the way it did?; What needs to be fixed or “polished” in the processes, systems, or leadership approach?; and Who is responsible for ensuring the fixes or adjustments occur? The facilitator (and the key leaders of the organization) must ask the right questions, must be deeply involved in getting the right people to comment on the issues, and must “pin the rose” on someone who will be responsible for carrying through on the fixes. At the end of the AAR, after the key topics are discussed, with a plan for addressing each, the person in charge of the organization must publish an action plan with details for ensuring the fixes.
Like all citizens across our nation, my family is grateful for the skill and professionalism exhibited by clinicians and healthcare providers during this devastating pandemic. While we are all breathing a sigh of relief as we see the end in sight, true professionals must take the opportunity to learn and grow from this crisis and adapt. Hopefully, the reflections and recommendations in this article—things I learned from a different profession—will provide ideas to my new colleagues in healthcare.
1. Hertling M. Ten tips for a crisis: lessons from a soldier. J Hosp Med. 2020;15(5): 275-276. https://doi.org/10.12788/jhm.3424
2. Shillcut S. The inspiring women physicians of the COVID-19 pandemic. MedPage Today. April 9, 2020. Accessed July 7, 2021. https://www.kevinmd.com/blog/2020/04/the-insiring-women-physicians-of-the-covid-19-pandemic.html
3. Daley B. Three medical innovations fueled by COVID-19 that will outlast the pandemic. The Conversation. March 9, 2021. Accessed July 7, 2021. https://theconversation.com/3-medical-innovations-fueled-by-covid-19-that-will-outlast-the-pandemic-156464
4. Drees J, Dyrda L, Adams K. Ten big advancements in healthcare tech during the pandemic. Becker’s Health IT. July 6, 2020. Accessed July 7, 2021. https://www.beckershospitalreview.com/digital-transformation/10-big-advancements-in-healthcare-tech-during-the-pandemic.html
5. Wang J. Developing organizational learning capacity in crisis management. Adv Developing Hum Resources. 10(3):425-445. https://doi.org/10.1177/1523422308316464
6. Morens DM, Fauci AS. Emerging pandemic diseases: how we got COVID-19. Cell. 2020;182(5):1077-1092. https://doi.org/10.1016/j.cell.2020.08.021
7. What is posttraumatic stress disorder? American Psychiatric Association. Reviewed August 2020. Accessed July 7, 2021. https://www.psychiatry.org/patients-families/ptsd/what-is-ptsd
1. Hertling M. Ten tips for a crisis: lessons from a soldier. J Hosp Med. 2020;15(5): 275-276. https://doi.org/10.12788/jhm.3424
2. Shillcut S. The inspiring women physicians of the COVID-19 pandemic. MedPage Today. April 9, 2020. Accessed July 7, 2021. https://www.kevinmd.com/blog/2020/04/the-insiring-women-physicians-of-the-covid-19-pandemic.html
3. Daley B. Three medical innovations fueled by COVID-19 that will outlast the pandemic. The Conversation. March 9, 2021. Accessed July 7, 2021. https://theconversation.com/3-medical-innovations-fueled-by-covid-19-that-will-outlast-the-pandemic-156464
4. Drees J, Dyrda L, Adams K. Ten big advancements in healthcare tech during the pandemic. Becker’s Health IT. July 6, 2020. Accessed July 7, 2021. https://www.beckershospitalreview.com/digital-transformation/10-big-advancements-in-healthcare-tech-during-the-pandemic.html
5. Wang J. Developing organizational learning capacity in crisis management. Adv Developing Hum Resources. 10(3):425-445. https://doi.org/10.1177/1523422308316464
6. Morens DM, Fauci AS. Emerging pandemic diseases: how we got COVID-19. Cell. 2020;182(5):1077-1092. https://doi.org/10.1016/j.cell.2020.08.021
7. What is posttraumatic stress disorder? American Psychiatric Association. Reviewed August 2020. Accessed July 7, 2021. https://www.psychiatry.org/patients-families/ptsd/what-is-ptsd
© 2021 Society of Hospital Medicine
Preoperative Care Assessment of Need Scores Are Associated With Postoperative Mortality and Length of Stay in Veterans Undergoing Knee Replacement
Risk calculators can be of great value in guiding clinical decision making, patient-centered precision medicine, and resource allocation.1 Several perioperative risk prediction models have emerged in recent decades that estimate specific hazards (eg, cardiovascular complications after noncardiac surgery) with varying accuracy and utility. In the perioperative sphere, the time windows are often limited to an index hospitalization or 30 days following surgery or discharge.2-9 Although longer periods are of interest to patients, families, and health systems, few widely used or validated models are designed to look beyond this very narrow window.10,11 In addition, perioperative risk prediction models do not routinely incorporate parameters of a wide variety of health or demographic domains, such as patterns of health care, health care utilization, or medication use.
In 2013, in response to the need for near real-time information to guide delivery of enhanced care management services, the Veterans Health Administration (VHA) Office of Informatics and Analytics developed automated risk prediction models that used detailed electronic health record (EHR) data. These models were used to report Care Assessment Need (CAN) scores each week for all VHA enrollees and include data from a wide array of health domains. These CAN scores predict the risk for hospitalization, death, or either event within 90 days and 1 year.12,13 Each score is reported as both a predicted probability (0-1) and as a percentile in relation to all other VHA enrollees (a value between 1 and 99).13 The data used to calculate CAN scores are listed in Table 1.12
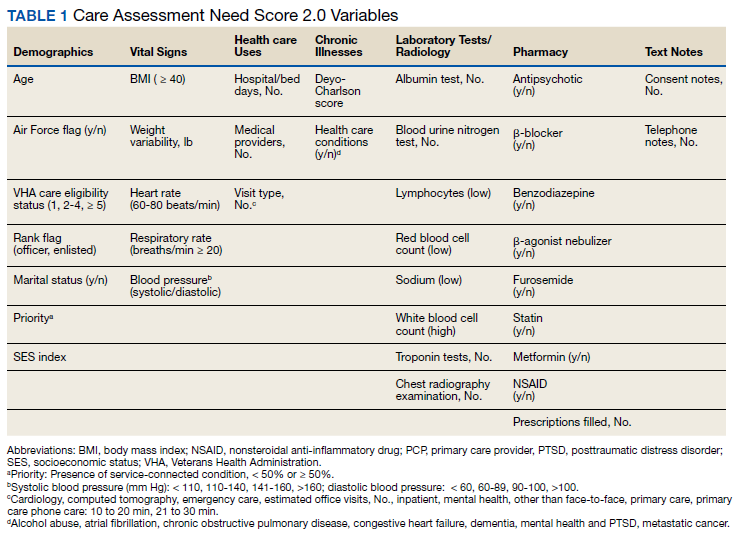
Surgical procedures or admissions would not be differentiated from nonsurgical admissions or other procedural clinic visits, and as such, it is not possible to isolate the effect of undergoing a surgical procedure from another health-related event on the CAN score. At the same time though, a short-term increase in system utilization caused by an elective surgical procedure such as a total knee replacement (TKR) would presumably be reflected in a change in CAN score, but this has not been studied.
Since their introduction, CAN scores have been routinely accessed by primary care teams and used to facilitate care coordination for thousands of VHA patients. However, these CAN scores are currently not available to VHA surgeons, anesthesiologists, or other perioperative clinicians. In this study, we examine the distributions of preoperative CAN scores and explore the relationships of preoperative CAN 1-year mortality scores with 1-year survival following discharge and length of stay (LOS) during index hospitalization in a cohort of US veterans who underwent TKR, the most common elective operation performed within the VHA system.
Methods
Following approval of the Durham Veterans Affairs Medical Center Institutional Review Board, all necessary data were extracted from the VHA Corporate Data Warehouse (CDW) repository.14 Informed consent was waived due to the minimal risk nature of the study.
We used Current Procedural Terminology codes (27438, 27446, 27447, 27486, 27487, 27488) and International Classification of Diseases, 9th edition clinical modification procedure codes (81.54, 81.55, 81.59, 00.80-00.84) to identify all veterans who had undergone primary or revision TKR between July 2014 and December 2015 in VHA Veterans Integrated Service Network 1 (Maine, Vermont, New Hampshire, Massachusetts, Connecticut, Rhode Island, New York, Pennsylvania, West Virginia, Virginia, North Carolina). Because we focused on outcomes following hospital discharge, patients who died before discharge were excluded from the analysis. Preoperative CAN 1-year mortality score was chosen as the measure under the assumption that long-term survival may be the most meaningful of the 4 possible CAN score measures.
Our primary objective was to determine distribution of preoperative CAN scores in the study population. Our secondary was to study relationships among the preoperative CAN 1-year mortality scores and 1-year mortality and hospital LOS.
Study Variables
For each patient, we extracted the date of index surgery. The primary exposure or independent variable was the CAN score in the week prior to this date. Because prior study has shown that CAN scores trajectories do not significantly change over time, the date-stamped CAN scores in the week before surgery represent what would have been available to clinicians in a preoperative setting.15 Since CAN scores are refreshed and overwritten every week, we extracted archived scores from the CDW.
For the 1-year survival outcome, the primary dependent variable, we queried the vital status files in the CDW for the date of death if applicable. We confirmed survival beyond 1 year by examining vital signs in the CDW for a minimum of 2 independent encounters beyond 1 year after the date of discharge. To compute the index LOS, the secondary outcome, we computed the difference between the date of admission and date of hospital discharge.
Statistical Methods
The parameters and performance of the multivariable logistic regression models developed to compute the various CAN mortality and hospitalization risk scores have been previously described.12 Briefly, Wang and colleagues created parsimonious regression models using backward selection. Model discrimination was evaluated using C (concordance)-statistic. Model calibration was assessed by comparing predicted vs observed event rates by risk deciles and performing Cox proportional hazards regression.
We plotted histograms to display preoperative CAN scores as a simple measure of distribution (Figure 1). We also examined the cumulative proportion of patients at each preoperative CAN 1-year mortality score.
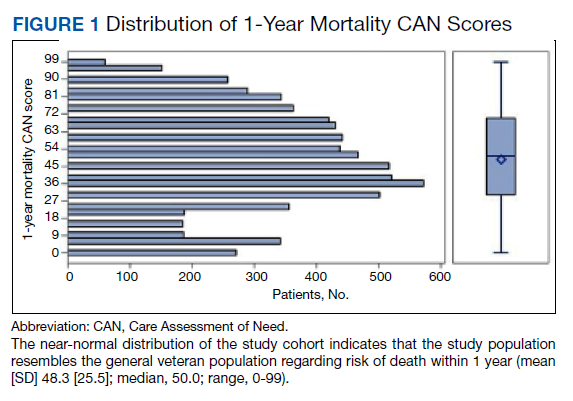
Using a conventional t test, we compared means of preoperative CAN 1-year mortality scores in patients who survived vs those who died within 1 year. We also constructed a plot of the proportion of patients who had died within 1 year vs preoperative CAN 1-year mortality scores. Kaplan-Meier curves were then constructed examining 1-year survival by CAN 1-year mortality score by terciles.
Finally, we examined the relationship between preoperative CAN 1-year mortality scores and index LOS in 2 ways: We plotted LOS across CAN scores, and we constructed a
Results
We identified 8206 patients who had undergone a TKR over the 18-month study period. The overall mean (SD) for age was 65 (8.41) years; 93% were male, and 78% were White veterans. Patient demographics are well described in a previous publication.16,17
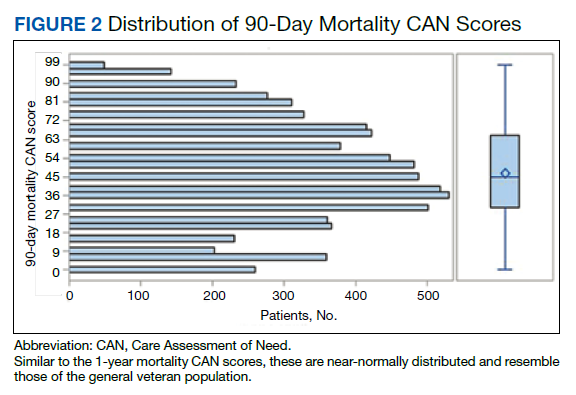
In terms of model parameters for the CAN score models, C-statistics for the 90-day outcome models were as follows: 0.833 for the model predicting hospitalization (95% CI, 0.832-0.834); 0.865 for the model predicting death (95% CI, 0.863-0.876); and 0.811 for the model predicting either event (95% CI, 0.810-0.812). C-statistics for the 1-year outcome models were 0.809 for the model predicting hospitalization (95% CI, 0.808-0.810); 0.851 for the model predicting death (95% CI, 0.849-0.852); and 0.787 for the model predicting either event (95% CI, 0.786-0.787). Models were well calibrated with α = 0 and β = 1, demonstrating strong agreement between observed and predicted event rates.
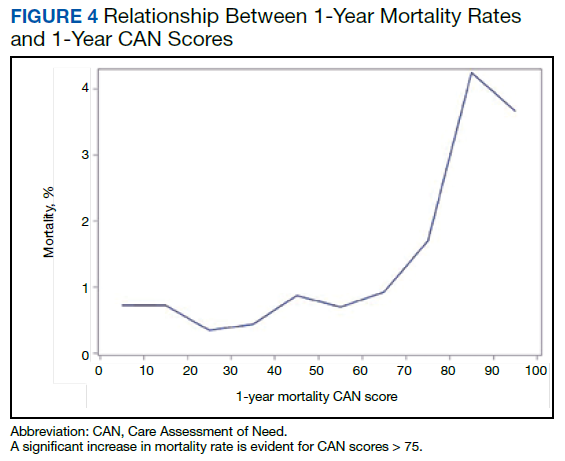
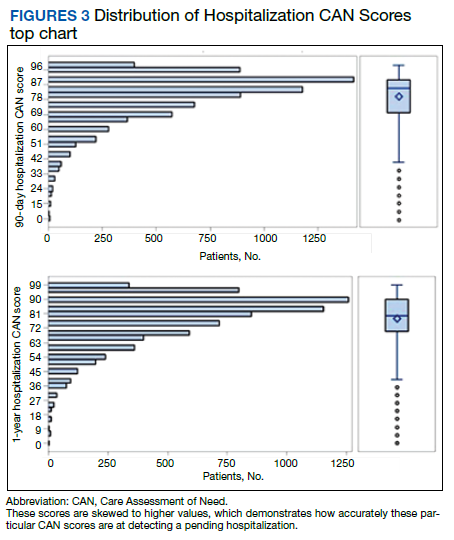
The distribution of preoperative CAN 1-year mortality scores was close to normal (median, 50; interquartile range, 40; mean [SD] 48 [25.6]) (eTable). The original CAN score models were developed having an equal number of patients in each strata and as such, are normally distributed.12 Our cohort was similar in pattern of distribution. Distributions of the remaining preoperative CAN scores (90-day mortality, 1-year hospitalization, 90-day hospitalization) are shown in Figures 2, 3, and 4. Not surprisingly, histograms for both 90-day and 1-year hospitalization were skewed toward higher scores, indicating that these patients were expected to be hospitalized in the near future.
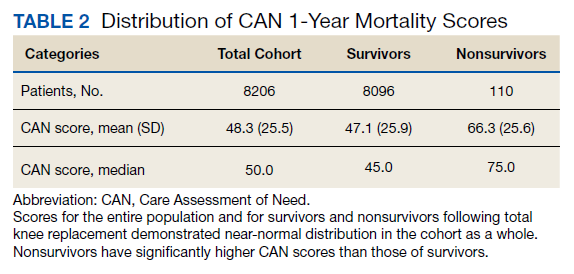
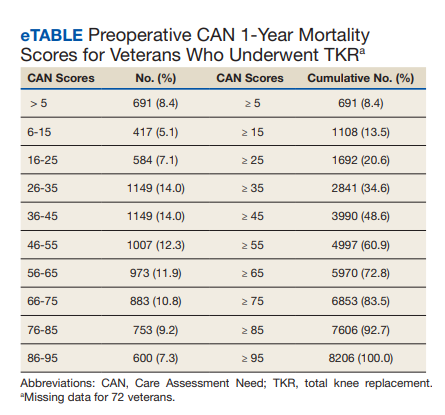
Overall, 1.4% (110/8096) of patients died within 1 year of surgery. Comparing 1-year mortality CAN scores in survivors vs nonsurvivors, we found statistically significant differences in means (47 vs 66 respectively, P < .001) and medians (45 vs 75 respectively, P < .001) (Table 2). In the plot examining the relationship between preoperative 1-year mortality CAN scores and 1-year mortality, the percentage who died within 1 year increased initially for patients with CAN scores > 60 and again exponentially for patients with CAN scores > 80. Examining Kaplan-Meier curves, we found that survivors and nonsurvivors separated early after surgery, and the differences between the top tercile and the middle/lower terciles were statistically significant (P < .001). Mortality rates were about 0.5% in the lower and middle terciles but about 2% in the upper tercile (Figure 5).
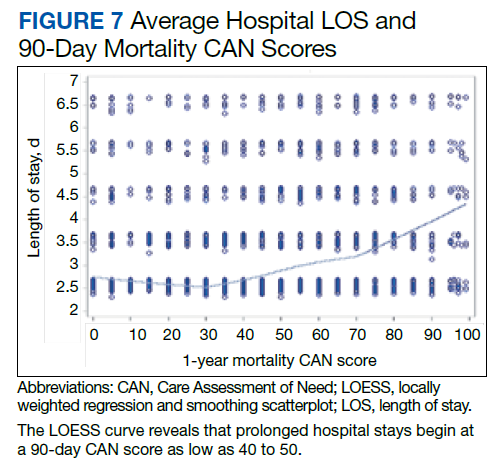
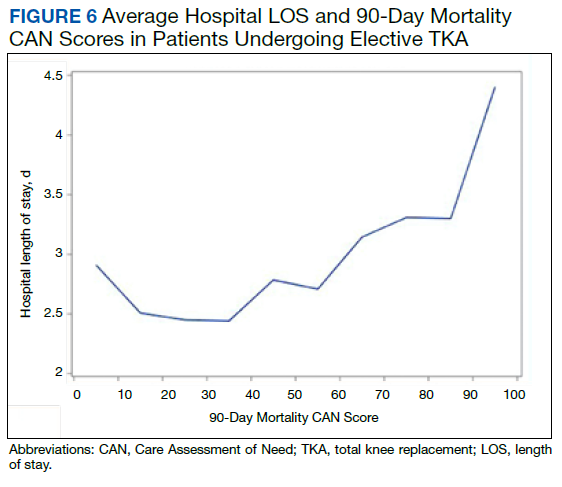
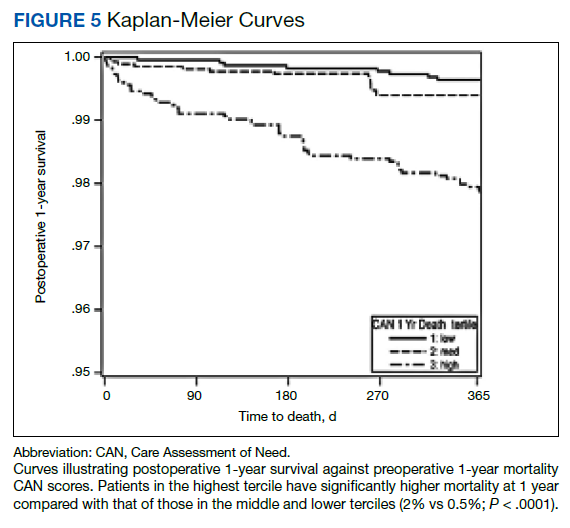
In the plot examining the relationship between CAN scores and index LOS, the LOS rose significantly beyond a CAN score of 60 and dramatically beyond a CAN score of 80 (Figure 6). LOESS curves also showed 2 inflection points suggesting an incremental and sequential rise in the LOS with increasing CAN scores (Figure 7). Mean (SD) LOS in days for the lowest to highest terciles was 2.6 (1.7), 2.8 (2.1), and 3.6 (2.2), respectively.
Discussion
CAN scores are automatically generated each week by EHR-based multivariable risk models. These scores have excellent predictive accuracy for 90-day and 1-year mortality and hospitalization and are routinely used by VHA primary care teams to assist with clinical operations.13 We studied the distribution of CAN 1-year mortality scores in a preoperative context and examined relationships of the preoperative CAN 1-year mortality scores with postoperative mortality and LOS in 8206 veterans who underwent TKR.
There are several noteworthy findings. First, the overall 1-year mortality rate observed following TKR (1.4%) was similar to other published reports.18,19 Not surprisingly, preoperative CAN 1-year mortality scores were significantly higher in veterans who died compared with those of survivors. The majority of patients who died had a preoperative CAN 1-year mortality score > 75 while most who survived had a preoperative CAN 1-year mortality score < 45 (P < .001). Interestingly, the same scores showed a nonlinear correlation with LOS. Index LOS was about 4 days in patients in the highest tercile of CAN scores vs 2.5 days in the lowest tercile, but the initial increase in LOS was detected at a CAN score of about 55 to 60.
In addition, mortality rate varied widely in different segments of the population when grouped according to preoperative CAN scores. One-year mortality rates in the highest tercile reached 2%, about 4-fold higher than that of lower terciles (0.5%). Examination of the Kaplan-Meier curves showed that this difference in mortality between the highest tercile and the lower 2 groups appears soon after discharge and continues to increase over time, suggesting that the factors contributing to the increased mortality are present at the time of discharge and persist beyond the postoperative period. In summary, although CAN scores were not designed for use in the perioperative context, we found that preoperative CAN 1-year mortality scores are broadly predictive of mortality, but especially for increases in LOS following elective TKA, both increases in hospital LOS following elective TKA and mortality over the year after TKA.
Our findings raise several important questions. The decision to undergo elective surgery is complex. Arguably, individuals who undergo elective knee replacement should be healthy enough to undergo, recover, and reap the benefits from a procedure that does not extend life. The distribution of preoperative CAN 1-year mortality scores for our study population was similar to that of the general VHA enrollee population with similar measured mortality rates (≤ 0.5% vs ≥ 1.7% in the low and high terciles, respectively).1 Further study comparing outcomes in matched cohorts who did and did not undergo joint replacement would be of interest. In lieu of this, though, the association of high but not extreme CAN scores with increased hospital LOS may potentially be used to guide allocation of resources to this group, obviating the increased cost and risk to which this group is exposed. And the additional insight afforded by CAN scores may enhance shared decision-making models by identifying patients at the very highest risk (eg, 1-year mortality CAN score ≥ 90), patients who conceivably might not survive long enough to recover from and enjoy their reconstructed knee, who might in the long run be harmed by undergoing the procedure.
Many total joint arthroplasties are performed in older patients, a population in which frailty is increasingly recognized as a significant risk factor for poor outcomes.20,21 CAN scores reliably identify high-risk patients and have been shown to correlate with frailty in this group.22 Multiple authors have reported improved outcomes with cost reductions after implementation of programs targeting modifiable risk factors in high-risk surgical candidates.23-25 A preoperative assessment that includes the CAN score may be valuable in identifying patients who would benefit most from prehabilitation programs or other interventions designed to blunt the impact of frailty. It is true that many elements used to calculate the CAN score would not be considered modifiable, especially in the short term. However, specific contributors to frailty, such as nutritional status and polypharmacy might be potential candidates. As with all multivariable risk prediction models, there are multiple paths to a high CAN score, and further research to identify clinically relevant subgroups may help inform efforts to improve perioperative care within this population.
Hospital LOS is of intense interest for many reasons, not least its utility as a surrogate for cost and increased risk for immediate perioperative adverse events, such as multidrug-resistant hospital acquired infections, need for postacute facility-based rehabilitation, and deconditioning that increase risks of falls and fractures in the older population.26-29 In addition, its importance is magnified due to the COVID-19 pandemic context in which restarting elective surgery programs has changed traditional criteria by which patients are scheduled for surgery.
We have shown that elevated CAN scores are able to identify patients at risk for extended hospital stays and, as such, may be useful additional data in allocating scarce operating room time and other resources for optimal patient and health care provider safety.30,31 Individual surgeons and hospital systems would, of course, decide which patients should be triaged to go first, based on local priorities; however, choosing lower risk patients with minimal risk of morbidity and mortality while pursuing prehabilitation for higher risk patients is a reasonable approach.
Limitations
Our study has several limitations. Only a single surgical procedure was included, albeit the most common one performed in the VHA. In addition, no information was available concerning the precise clinical course for these patients, such as the duration of surgery, anesthetic technique, and management of acute, perioperative course. Although the assumption was made that patients received standard care in a manner such that these factors would not significantly affect either their mortality or their LOS out of proportion to their preoperative clinical status, confounding cannot be excluded. Therefore, further study is necessary to determine whether CAN scores can accurately predict mortality and/or LOS for patients undergoing other procedures. Further, a clinical trial is required to assess whether systematic provision of the CAN score at the point of surgery would impact care and, more important, impact outcomes. In addition, multivariable analyses were not performed, including and excluding various components of the CAN score models. Currently, CAN scores could be made available to the surgical/anesthesia communities at minimal or no cost and are updated automatically. Model calibration and discrimination in this particular setting were not validated.
Because our interest is in leveraging an existing resource to a current clinical and operational problem rather than in creating or validating a new tool, we chose to test the simple bivariate relationship between preoperative CAN scores and outcomes. We chose the preoperative 1-year mortality CAN score from among the 4 options under the assumption that long-term survival is the most meaningful of the 4 candidate outcomes. Finally, while the CAN scores are currently only calculated and generated for patients cared for within the VHA, few data elements are unavailable to civilian health systems. The most problematic would be documentation of actual prescription filling, but this is a topic of increasing interest to the medical and academic communities and access to such information we hope will improve.32-34
Conclusions
Although designed for use by VHA primary care teams, CAN scores also may have value for perioperative clinicians, predicting mortality and prolonged hospital LOS in those with elevated 1-year mortality scores. Advantages of CAN scores relative to other perioperative risk calculators lies in their ability to predict long-term rather than 30-day survival and that they are automatically generated on a near-real-time basis for all patients who receive care in VHA ambulatory clinics. Further study is needed to determine practical utility in shared decision making, preoperative evaluation and optimization, and perioperative resource allocation.
Acknowledgments
This work was supported by the US Department of Veterans Affairs (VA) National Center for Patient Safety, Field Office 10A4E, through the Patient Safety Center of Inquiry at the Durham VA Medical Center in North Carolina. The study also received support from the Center of Innovation to Accelerate Discovery and Practice Transformation (CIN 13-410) at the Durham VA Health Care System.
1. McNair AGK, MacKichan F, Donovan JL, et al. What surgeons tell patients and what patients want to know before major cancer surgery: a qualitative study. BMC Cancer. 2016;16:258. doi:10.1186/s12885-016-2292-3
2. Grover FL, Hammermeister KE, Burchfiel C. Initial report of the Veterans Administration Preoperative Risk Assessment Study for Cardiac Surgery. Ann Thorac Surg. 1990;50(1):12-26; discussion 27-18. doi:10.1016/0003-4975(90)90073-f
3. Khuri SF, Daley J, Henderson W, et al. The National Veterans Administration Surgical Risk Study: risk adjustment for the comparative assessment of the quality of surgical care. J Am Coll Surg. 1995;180(5):519-531.
4. Glance LG, Lustik SJ, Hannan EL, et al. The Surgical Mortality Probability Model: derivation and validation of a simple simple risk prediction rule for noncardiac surgery. Ann Surg. 2012;255(4):696-702. doi:10.1097/SLA.0b013e31824b45af
5. Keller DS, Kroll D, Papaconstantinou HT, Ellis CN. Development and validation of a methodology to reduce mortality using the veterans affairs surgical quality improvement program risk calculator. J Am Coll Surg. 2017;224(4):602-607. doi:10.1016/j.jamcollsurg.2016.12.033
6. Bilimoria KY, Liu Y, Paruch JL, et al. Development and evaluation of the universal ACS NSQIP surgical risk calculator: a decision aid and informed consent tool for patients and surgeons. J Am Coll Surg. 2013;217(5):833-842.e831-833. doi:10.1016/j.jamcollsurg.2013.07.385
7. Ford MK, Beattie WS, Wijeysundera DN. Systematic review: prediction of perioperative cardiac complications and mortality by the revised cardiac risk index. Ann Intern Med. 2010;152(1):26-35. doi:10.7326/0003-4819-152-1-201001050-00007
8. Gupta PK, Gupta H, Sundaram A, et al. Development and validation of a risk calculator for prediction of cardiac risk after surgery. Circulation. 2011;124(4):381-387. doi:10.1161/CIRCULATIONAHA.110.015701
9. Lee TH, Marcantonio ER, Mangione CM, et al. Derivation and prospective validation of a simple index for prediction of cardiac risk of major noncardiac surgery. Circulation. 1999;100(10):1043-1049. doi:10.1161/01.cir.100.10.1043
10. Smith T, Li X, Nylander W, Gunnar W. Thirty-day postoperative mortality risk estimates and 1-year survival in Veterans Health Administration surgery patients. JAMA Surg. 2016;151(5):417-422. doi:10.1001/jamasurg.2015.4882
11. Damhuis RA, Wijnhoven BP, Plaisier PW, Kirkels WJ, Kranse R, van Lanschot JJ. Comparison of 30-day, 90- day and in-hospital postoperative mortality for eight different cancer types. Br J Surg. 2012;99(8):1149-1154. doi:10.1002/bjs.8813
12. Wang L, Porter B, Maynard C, et al. Predicting risk of hospitalization or death among patients receiving primary care in the Veterans Health Administration. Med Care. 2013;51(4):368-373. doi:10.1016/j.amjcard.2012.06.038
13. Fihn SD, Francis J, Clancy C, et al. Insights from advanced analytics at the Veterans Health Administration. Health Aff (Millwood). 2014;33(7):1203-1211. doi:10.1377/hlthaff.2014.0054
14. Noël PH, Copeland LA, Perrin RA, et al. VHA Corporate Data Warehouse height and weight data: opportunities and challenges for health services research. J Rehabil Res Dev. 2010;47(8):739-750. doi:10.1682/jrrd.2009.08.0110
15. Wong ES, Yoon J, Piegari RI, Rosland AM, Fihn SD, Chang ET. Identifying latent subgroups of high-risk patients using risk score trajectories. J Gen Intern Med. 2018;33(12):2120-2126. doi:10.1007/s11606-018-4653-x
16. Chen Q, Hsia HL, Overman R, et al. Impact of an opioid safety initiative on patients undergoing total knee arthroplasty: a time series analysis. Anesthesiology. 2019;131(2):369-380. doi:10.1097/ALN.0000000000002771
17. Hsia HL, Takemoto S, van de Ven T, et al. Acute pain is associated with chronic opioid use after total knee arthroplasty. Reg Anesth Pain Med. 2018;43(7):705-711. doi:10.1097/AAP.0000000000000831
18. Inacio MCS, Dillon MT, Miric A, Navarro RA, Paxton EW. Mortality after total knee and total hip arthroplasty in a large integrated health care system. Perm J. 2017;21:16-171. doi:10.7812/TPP/16-171
19. Lee QJ, Mak WP, Wong YC. Mortality following primary total knee replacement in public hospitals in Hong Kong. Hong Kong Med J. 2016;22(3):237-241. doi:10.12809/hkmj154712
20. Lin HS, Watts JN, Peel NM, Hubbard RE. Frailty and post-operative outcomes in older surgical patients: a systematic review. BMC Geriatr. 2016;16(1):157. doi:10.1186/s12877-016-0329-8
21. Shinall MC Jr, Arya S, Youk A, et al. Association of preoperative patient frailty and operative stress with postoperative mortality. JAMA Surg. 2019;155(1):e194620. doi:10.1001/jamasurg.2019.4620
22. Ruiz JG, Priyadarshni S, Rahaman Z, et al. Validation of an automatically generated screening score for frailty: the care assessment need (CAN) score. BMC Geriatr. 2018;18(1):106. doi:10.1186/s12877-018-0802-7
23. Bernstein DN, Liu TC, Winegar AL, et al. Evaluation of a preoperative optimization protocol for primary hip and knee arthroplasty patients. J Arthroplasty. 2018;33(12):3642- 3648. doi:10.1016/j.arth.2018.08.018
24. Sodhi N, Anis HK, Coste M, et al. A nationwide analysis of preoperative planning on operative times and postoperative complications in total knee arthroplasty. J Knee Surg. 2019;32(11):1040-1045. doi:10.1055/s-0039-1677790
25. Krause A, Sayeed Z, El-Othmani M, Pallekonda V, Mihalko W, Saleh KJ. Outpatient total knee arthroplasty: are we there yet? (part 1). Orthop Clin North Am. 2018;49(1):1-6. doi:10.1016/j.ocl.2017.08.002
26. Barrasa-Villar JI, Aibar-Remón C, Prieto-Andrés P, Mareca- Doñate R, Moliner-Lahoz J. Impact on morbidity, mortality, and length of stay of hospital-acquired infections by resistant microorganisms. Clin Infect Dis. 2017;65(4):644-652. doi:10.1093/cid/cix411
27. Nikkel LE, Kates SL, Schreck M, Maceroli M, Mahmood B, Elfar JC. Length of hospital stay after hip fracture and risk of early mortality after discharge in New York state: retrospective cohort study. BMJ. 2015;351:h6246. doi:10.1136/bmj.h6246
28. Marfil-Garza BA, Belaunzarán-Zamudio PF, Gulias-Herrero A, et al. Risk factors associated with prolonged hospital length-of-stay: 18-year retrospective study of hospitalizations in a tertiary healthcare center in Mexico. PLoS One. 2018;13(11):e0207203. doi:10.1371/journal.pone.0207203
29. Hirsch CH, Sommers L, Olsen A, Mullen L, Winograd CH. The natural history of functional morbidity in hospitalized older patients. J Am Geriatr Soc. 1990;38(12):1296-1303. doi:10.1111/j.1532-5415.1990.tb03451.x
30. Iyengar KP, Jain VK, Vaish A, Vaishya R, Maini L, Lal H. Post COVID-19: planning strategies to resume orthopaedic surgery -challenges and considerations. J Clin Orthop Trauma. 2020;11(suppl 3):S291-S295. doi:10.1016/j.jcot.2020.04.028
31. O’Connor CM, Anoushiravani AA, DiCaprio MR, Healy WL, Iorio R. Economic recovery after the COVID-19 pandemic: resuming elective orthopedic surgery and total joint arthroplasty. J Arthroplasty. 2020;35(suppl 7):S32-S36. doi:10.1016/j.arth.2020.04.038.
32. Mauseth SA, Skurtveit S, Skovlund E, Langhammer A, Spigset O. Medication use and association with urinary incontinence in women: data from the Norwegian Prescription Database and the HUNT study. Neurourol Urodyn. 2018;37(4):1448-1457. doi:10.1002/nau.23473
33. Sultan RS, Correll CU, Schoenbaum M, King M, Walkup JT, Olfson M. National patterns of commonly prescribed psychotropic medications to young people. J Child Adolesc Psychopharmacol. 2018;28(3):158-165. doi:10.1089/cap.2017.0077
34. McCoy RG, Dykhoff HJ, Sangaralingham L, et al. Adoption of new glucose-lowering medications in the U.S.-the case of SGLT2 inhibitors: nationwide cohort study. Diabetes Technol Ther. 2019;21(12):702-712. doi:10.1089/dia.2019.0213
Risk calculators can be of great value in guiding clinical decision making, patient-centered precision medicine, and resource allocation.1 Several perioperative risk prediction models have emerged in recent decades that estimate specific hazards (eg, cardiovascular complications after noncardiac surgery) with varying accuracy and utility. In the perioperative sphere, the time windows are often limited to an index hospitalization or 30 days following surgery or discharge.2-9 Although longer periods are of interest to patients, families, and health systems, few widely used or validated models are designed to look beyond this very narrow window.10,11 In addition, perioperative risk prediction models do not routinely incorporate parameters of a wide variety of health or demographic domains, such as patterns of health care, health care utilization, or medication use.
In 2013, in response to the need for near real-time information to guide delivery of enhanced care management services, the Veterans Health Administration (VHA) Office of Informatics and Analytics developed automated risk prediction models that used detailed electronic health record (EHR) data. These models were used to report Care Assessment Need (CAN) scores each week for all VHA enrollees and include data from a wide array of health domains. These CAN scores predict the risk for hospitalization, death, or either event within 90 days and 1 year.12,13 Each score is reported as both a predicted probability (0-1) and as a percentile in relation to all other VHA enrollees (a value between 1 and 99).13 The data used to calculate CAN scores are listed in Table 1.12
Surgical procedures or admissions would not be differentiated from nonsurgical admissions or other procedural clinic visits, and as such, it is not possible to isolate the effect of undergoing a surgical procedure from another health-related event on the CAN score. At the same time though, a short-term increase in system utilization caused by an elective surgical procedure such as a total knee replacement (TKR) would presumably be reflected in a change in CAN score, but this has not been studied.
Since their introduction, CAN scores have been routinely accessed by primary care teams and used to facilitate care coordination for thousands of VHA patients. However, these CAN scores are currently not available to VHA surgeons, anesthesiologists, or other perioperative clinicians. In this study, we examine the distributions of preoperative CAN scores and explore the relationships of preoperative CAN 1-year mortality scores with 1-year survival following discharge and length of stay (LOS) during index hospitalization in a cohort of US veterans who underwent TKR, the most common elective operation performed within the VHA system.
Methods
Following approval of the Durham Veterans Affairs Medical Center Institutional Review Board, all necessary data were extracted from the VHA Corporate Data Warehouse (CDW) repository.14 Informed consent was waived due to the minimal risk nature of the study.
We used Current Procedural Terminology codes (27438, 27446, 27447, 27486, 27487, 27488) and International Classification of Diseases, 9th edition clinical modification procedure codes (81.54, 81.55, 81.59, 00.80-00.84) to identify all veterans who had undergone primary or revision TKR between July 2014 and December 2015 in VHA Veterans Integrated Service Network 1 (Maine, Vermont, New Hampshire, Massachusetts, Connecticut, Rhode Island, New York, Pennsylvania, West Virginia, Virginia, North Carolina). Because we focused on outcomes following hospital discharge, patients who died before discharge were excluded from the analysis. Preoperative CAN 1-year mortality score was chosen as the measure under the assumption that long-term survival may be the most meaningful of the 4 possible CAN score measures.
Our primary objective was to determine distribution of preoperative CAN scores in the study population. Our secondary was to study relationships among the preoperative CAN 1-year mortality scores and 1-year mortality and hospital LOS.
Study Variables
For each patient, we extracted the date of index surgery. The primary exposure or independent variable was the CAN score in the week prior to this date. Because prior study has shown that CAN scores trajectories do not significantly change over time, the date-stamped CAN scores in the week before surgery represent what would have been available to clinicians in a preoperative setting.15 Since CAN scores are refreshed and overwritten every week, we extracted archived scores from the CDW.
For the 1-year survival outcome, the primary dependent variable, we queried the vital status files in the CDW for the date of death if applicable. We confirmed survival beyond 1 year by examining vital signs in the CDW for a minimum of 2 independent encounters beyond 1 year after the date of discharge. To compute the index LOS, the secondary outcome, we computed the difference between the date of admission and date of hospital discharge.
Statistical Methods
The parameters and performance of the multivariable logistic regression models developed to compute the various CAN mortality and hospitalization risk scores have been previously described.12 Briefly, Wang and colleagues created parsimonious regression models using backward selection. Model discrimination was evaluated using C (concordance)-statistic. Model calibration was assessed by comparing predicted vs observed event rates by risk deciles and performing Cox proportional hazards regression.
We plotted histograms to display preoperative CAN scores as a simple measure of distribution (Figure 1). We also examined the cumulative proportion of patients at each preoperative CAN 1-year mortality score.
Using a conventional t test, we compared means of preoperative CAN 1-year mortality scores in patients who survived vs those who died within 1 year. We also constructed a plot of the proportion of patients who had died within 1 year vs preoperative CAN 1-year mortality scores. Kaplan-Meier curves were then constructed examining 1-year survival by CAN 1-year mortality score by terciles.
Finally, we examined the relationship between preoperative CAN 1-year mortality scores and index LOS in 2 ways: We plotted LOS across CAN scores, and we constructed a
Results
We identified 8206 patients who had undergone a TKR over the 18-month study period. The overall mean (SD) for age was 65 (8.41) years; 93% were male, and 78% were White veterans. Patient demographics are well described in a previous publication.16,17
In terms of model parameters for the CAN score models, C-statistics for the 90-day outcome models were as follows: 0.833 for the model predicting hospitalization (95% CI, 0.832-0.834); 0.865 for the model predicting death (95% CI, 0.863-0.876); and 0.811 for the model predicting either event (95% CI, 0.810-0.812). C-statistics for the 1-year outcome models were 0.809 for the model predicting hospitalization (95% CI, 0.808-0.810); 0.851 for the model predicting death (95% CI, 0.849-0.852); and 0.787 for the model predicting either event (95% CI, 0.786-0.787). Models were well calibrated with α = 0 and β = 1, demonstrating strong agreement between observed and predicted event rates.
The distribution of preoperative CAN 1-year mortality scores was close to normal (median, 50; interquartile range, 40; mean [SD] 48 [25.6]) (eTable). The original CAN score models were developed having an equal number of patients in each strata and as such, are normally distributed.12 Our cohort was similar in pattern of distribution. Distributions of the remaining preoperative CAN scores (90-day mortality, 1-year hospitalization, 90-day hospitalization) are shown in Figures 2, 3, and 4. Not surprisingly, histograms for both 90-day and 1-year hospitalization were skewed toward higher scores, indicating that these patients were expected to be hospitalized in the near future.
Overall, 1.4% (110/8096) of patients died within 1 year of surgery. Comparing 1-year mortality CAN scores in survivors vs nonsurvivors, we found statistically significant differences in means (47 vs 66 respectively, P < .001) and medians (45 vs 75 respectively, P < .001) (Table 2). In the plot examining the relationship between preoperative 1-year mortality CAN scores and 1-year mortality, the percentage who died within 1 year increased initially for patients with CAN scores > 60 and again exponentially for patients with CAN scores > 80. Examining Kaplan-Meier curves, we found that survivors and nonsurvivors separated early after surgery, and the differences between the top tercile and the middle/lower terciles were statistically significant (P < .001). Mortality rates were about 0.5% in the lower and middle terciles but about 2% in the upper tercile (Figure 5).
In the plot examining the relationship between CAN scores and index LOS, the LOS rose significantly beyond a CAN score of 60 and dramatically beyond a CAN score of 80 (Figure 6). LOESS curves also showed 2 inflection points suggesting an incremental and sequential rise in the LOS with increasing CAN scores (Figure 7). Mean (SD) LOS in days for the lowest to highest terciles was 2.6 (1.7), 2.8 (2.1), and 3.6 (2.2), respectively.
Discussion
CAN scores are automatically generated each week by EHR-based multivariable risk models. These scores have excellent predictive accuracy for 90-day and 1-year mortality and hospitalization and are routinely used by VHA primary care teams to assist with clinical operations.13 We studied the distribution of CAN 1-year mortality scores in a preoperative context and examined relationships of the preoperative CAN 1-year mortality scores with postoperative mortality and LOS in 8206 veterans who underwent TKR.
There are several noteworthy findings. First, the overall 1-year mortality rate observed following TKR (1.4%) was similar to other published reports.18,19 Not surprisingly, preoperative CAN 1-year mortality scores were significantly higher in veterans who died compared with those of survivors. The majority of patients who died had a preoperative CAN 1-year mortality score > 75 while most who survived had a preoperative CAN 1-year mortality score < 45 (P < .001). Interestingly, the same scores showed a nonlinear correlation with LOS. Index LOS was about 4 days in patients in the highest tercile of CAN scores vs 2.5 days in the lowest tercile, but the initial increase in LOS was detected at a CAN score of about 55 to 60.
In addition, mortality rate varied widely in different segments of the population when grouped according to preoperative CAN scores. One-year mortality rates in the highest tercile reached 2%, about 4-fold higher than that of lower terciles (0.5%). Examination of the Kaplan-Meier curves showed that this difference in mortality between the highest tercile and the lower 2 groups appears soon after discharge and continues to increase over time, suggesting that the factors contributing to the increased mortality are present at the time of discharge and persist beyond the postoperative period. In summary, although CAN scores were not designed for use in the perioperative context, we found that preoperative CAN 1-year mortality scores are broadly predictive of mortality, but especially for increases in LOS following elective TKA, both increases in hospital LOS following elective TKA and mortality over the year after TKA.
Our findings raise several important questions. The decision to undergo elective surgery is complex. Arguably, individuals who undergo elective knee replacement should be healthy enough to undergo, recover, and reap the benefits from a procedure that does not extend life. The distribution of preoperative CAN 1-year mortality scores for our study population was similar to that of the general VHA enrollee population with similar measured mortality rates (≤ 0.5% vs ≥ 1.7% in the low and high terciles, respectively).1 Further study comparing outcomes in matched cohorts who did and did not undergo joint replacement would be of interest. In lieu of this, though, the association of high but not extreme CAN scores with increased hospital LOS may potentially be used to guide allocation of resources to this group, obviating the increased cost and risk to which this group is exposed. And the additional insight afforded by CAN scores may enhance shared decision-making models by identifying patients at the very highest risk (eg, 1-year mortality CAN score ≥ 90), patients who conceivably might not survive long enough to recover from and enjoy their reconstructed knee, who might in the long run be harmed by undergoing the procedure.
Many total joint arthroplasties are performed in older patients, a population in which frailty is increasingly recognized as a significant risk factor for poor outcomes.20,21 CAN scores reliably identify high-risk patients and have been shown to correlate with frailty in this group.22 Multiple authors have reported improved outcomes with cost reductions after implementation of programs targeting modifiable risk factors in high-risk surgical candidates.23-25 A preoperative assessment that includes the CAN score may be valuable in identifying patients who would benefit most from prehabilitation programs or other interventions designed to blunt the impact of frailty. It is true that many elements used to calculate the CAN score would not be considered modifiable, especially in the short term. However, specific contributors to frailty, such as nutritional status and polypharmacy might be potential candidates. As with all multivariable risk prediction models, there are multiple paths to a high CAN score, and further research to identify clinically relevant subgroups may help inform efforts to improve perioperative care within this population.
Hospital LOS is of intense interest for many reasons, not least its utility as a surrogate for cost and increased risk for immediate perioperative adverse events, such as multidrug-resistant hospital acquired infections, need for postacute facility-based rehabilitation, and deconditioning that increase risks of falls and fractures in the older population.26-29 In addition, its importance is magnified due to the COVID-19 pandemic context in which restarting elective surgery programs has changed traditional criteria by which patients are scheduled for surgery.
We have shown that elevated CAN scores are able to identify patients at risk for extended hospital stays and, as such, may be useful additional data in allocating scarce operating room time and other resources for optimal patient and health care provider safety.30,31 Individual surgeons and hospital systems would, of course, decide which patients should be triaged to go first, based on local priorities; however, choosing lower risk patients with minimal risk of morbidity and mortality while pursuing prehabilitation for higher risk patients is a reasonable approach.
Limitations
Our study has several limitations. Only a single surgical procedure was included, albeit the most common one performed in the VHA. In addition, no information was available concerning the precise clinical course for these patients, such as the duration of surgery, anesthetic technique, and management of acute, perioperative course. Although the assumption was made that patients received standard care in a manner such that these factors would not significantly affect either their mortality or their LOS out of proportion to their preoperative clinical status, confounding cannot be excluded. Therefore, further study is necessary to determine whether CAN scores can accurately predict mortality and/or LOS for patients undergoing other procedures. Further, a clinical trial is required to assess whether systematic provision of the CAN score at the point of surgery would impact care and, more important, impact outcomes. In addition, multivariable analyses were not performed, including and excluding various components of the CAN score models. Currently, CAN scores could be made available to the surgical/anesthesia communities at minimal or no cost and are updated automatically. Model calibration and discrimination in this particular setting were not validated.
Because our interest is in leveraging an existing resource to a current clinical and operational problem rather than in creating or validating a new tool, we chose to test the simple bivariate relationship between preoperative CAN scores and outcomes. We chose the preoperative 1-year mortality CAN score from among the 4 options under the assumption that long-term survival is the most meaningful of the 4 candidate outcomes. Finally, while the CAN scores are currently only calculated and generated for patients cared for within the VHA, few data elements are unavailable to civilian health systems. The most problematic would be documentation of actual prescription filling, but this is a topic of increasing interest to the medical and academic communities and access to such information we hope will improve.32-34
Conclusions
Although designed for use by VHA primary care teams, CAN scores also may have value for perioperative clinicians, predicting mortality and prolonged hospital LOS in those with elevated 1-year mortality scores. Advantages of CAN scores relative to other perioperative risk calculators lies in their ability to predict long-term rather than 30-day survival and that they are automatically generated on a near-real-time basis for all patients who receive care in VHA ambulatory clinics. Further study is needed to determine practical utility in shared decision making, preoperative evaluation and optimization, and perioperative resource allocation.
Acknowledgments
This work was supported by the US Department of Veterans Affairs (VA) National Center for Patient Safety, Field Office 10A4E, through the Patient Safety Center of Inquiry at the Durham VA Medical Center in North Carolina. The study also received support from the Center of Innovation to Accelerate Discovery and Practice Transformation (CIN 13-410) at the Durham VA Health Care System.
Risk calculators can be of great value in guiding clinical decision making, patient-centered precision medicine, and resource allocation.1 Several perioperative risk prediction models have emerged in recent decades that estimate specific hazards (eg, cardiovascular complications after noncardiac surgery) with varying accuracy and utility. In the perioperative sphere, the time windows are often limited to an index hospitalization or 30 days following surgery or discharge.2-9 Although longer periods are of interest to patients, families, and health systems, few widely used or validated models are designed to look beyond this very narrow window.10,11 In addition, perioperative risk prediction models do not routinely incorporate parameters of a wide variety of health or demographic domains, such as patterns of health care, health care utilization, or medication use.
In 2013, in response to the need for near real-time information to guide delivery of enhanced care management services, the Veterans Health Administration (VHA) Office of Informatics and Analytics developed automated risk prediction models that used detailed electronic health record (EHR) data. These models were used to report Care Assessment Need (CAN) scores each week for all VHA enrollees and include data from a wide array of health domains. These CAN scores predict the risk for hospitalization, death, or either event within 90 days and 1 year.12,13 Each score is reported as both a predicted probability (0-1) and as a percentile in relation to all other VHA enrollees (a value between 1 and 99).13 The data used to calculate CAN scores are listed in Table 1.12
Surgical procedures or admissions would not be differentiated from nonsurgical admissions or other procedural clinic visits, and as such, it is not possible to isolate the effect of undergoing a surgical procedure from another health-related event on the CAN score. At the same time though, a short-term increase in system utilization caused by an elective surgical procedure such as a total knee replacement (TKR) would presumably be reflected in a change in CAN score, but this has not been studied.
Since their introduction, CAN scores have been routinely accessed by primary care teams and used to facilitate care coordination for thousands of VHA patients. However, these CAN scores are currently not available to VHA surgeons, anesthesiologists, or other perioperative clinicians. In this study, we examine the distributions of preoperative CAN scores and explore the relationships of preoperative CAN 1-year mortality scores with 1-year survival following discharge and length of stay (LOS) during index hospitalization in a cohort of US veterans who underwent TKR, the most common elective operation performed within the VHA system.
Methods
Following approval of the Durham Veterans Affairs Medical Center Institutional Review Board, all necessary data were extracted from the VHA Corporate Data Warehouse (CDW) repository.14 Informed consent was waived due to the minimal risk nature of the study.
We used Current Procedural Terminology codes (27438, 27446, 27447, 27486, 27487, 27488) and International Classification of Diseases, 9th edition clinical modification procedure codes (81.54, 81.55, 81.59, 00.80-00.84) to identify all veterans who had undergone primary or revision TKR between July 2014 and December 2015 in VHA Veterans Integrated Service Network 1 (Maine, Vermont, New Hampshire, Massachusetts, Connecticut, Rhode Island, New York, Pennsylvania, West Virginia, Virginia, North Carolina). Because we focused on outcomes following hospital discharge, patients who died before discharge were excluded from the analysis. Preoperative CAN 1-year mortality score was chosen as the measure under the assumption that long-term survival may be the most meaningful of the 4 possible CAN score measures.
Our primary objective was to determine distribution of preoperative CAN scores in the study population. Our secondary was to study relationships among the preoperative CAN 1-year mortality scores and 1-year mortality and hospital LOS.
Study Variables
For each patient, we extracted the date of index surgery. The primary exposure or independent variable was the CAN score in the week prior to this date. Because prior study has shown that CAN scores trajectories do not significantly change over time, the date-stamped CAN scores in the week before surgery represent what would have been available to clinicians in a preoperative setting.15 Since CAN scores are refreshed and overwritten every week, we extracted archived scores from the CDW.
For the 1-year survival outcome, the primary dependent variable, we queried the vital status files in the CDW for the date of death if applicable. We confirmed survival beyond 1 year by examining vital signs in the CDW for a minimum of 2 independent encounters beyond 1 year after the date of discharge. To compute the index LOS, the secondary outcome, we computed the difference between the date of admission and date of hospital discharge.
Statistical Methods
The parameters and performance of the multivariable logistic regression models developed to compute the various CAN mortality and hospitalization risk scores have been previously described.12 Briefly, Wang and colleagues created parsimonious regression models using backward selection. Model discrimination was evaluated using C (concordance)-statistic. Model calibration was assessed by comparing predicted vs observed event rates by risk deciles and performing Cox proportional hazards regression.
We plotted histograms to display preoperative CAN scores as a simple measure of distribution (Figure 1). We also examined the cumulative proportion of patients at each preoperative CAN 1-year mortality score.
Using a conventional t test, we compared means of preoperative CAN 1-year mortality scores in patients who survived vs those who died within 1 year. We also constructed a plot of the proportion of patients who had died within 1 year vs preoperative CAN 1-year mortality scores. Kaplan-Meier curves were then constructed examining 1-year survival by CAN 1-year mortality score by terciles.
Finally, we examined the relationship between preoperative CAN 1-year mortality scores and index LOS in 2 ways: We plotted LOS across CAN scores, and we constructed a
Results
We identified 8206 patients who had undergone a TKR over the 18-month study period. The overall mean (SD) for age was 65 (8.41) years; 93% were male, and 78% were White veterans. Patient demographics are well described in a previous publication.16,17
In terms of model parameters for the CAN score models, C-statistics for the 90-day outcome models were as follows: 0.833 for the model predicting hospitalization (95% CI, 0.832-0.834); 0.865 for the model predicting death (95% CI, 0.863-0.876); and 0.811 for the model predicting either event (95% CI, 0.810-0.812). C-statistics for the 1-year outcome models were 0.809 for the model predicting hospitalization (95% CI, 0.808-0.810); 0.851 for the model predicting death (95% CI, 0.849-0.852); and 0.787 for the model predicting either event (95% CI, 0.786-0.787). Models were well calibrated with α = 0 and β = 1, demonstrating strong agreement between observed and predicted event rates.
The distribution of preoperative CAN 1-year mortality scores was close to normal (median, 50; interquartile range, 40; mean [SD] 48 [25.6]) (eTable). The original CAN score models were developed having an equal number of patients in each strata and as such, are normally distributed.12 Our cohort was similar in pattern of distribution. Distributions of the remaining preoperative CAN scores (90-day mortality, 1-year hospitalization, 90-day hospitalization) are shown in Figures 2, 3, and 4. Not surprisingly, histograms for both 90-day and 1-year hospitalization were skewed toward higher scores, indicating that these patients were expected to be hospitalized in the near future.
Overall, 1.4% (110/8096) of patients died within 1 year of surgery. Comparing 1-year mortality CAN scores in survivors vs nonsurvivors, we found statistically significant differences in means (47 vs 66 respectively, P < .001) and medians (45 vs 75 respectively, P < .001) (Table 2). In the plot examining the relationship between preoperative 1-year mortality CAN scores and 1-year mortality, the percentage who died within 1 year increased initially for patients with CAN scores > 60 and again exponentially for patients with CAN scores > 80. Examining Kaplan-Meier curves, we found that survivors and nonsurvivors separated early after surgery, and the differences between the top tercile and the middle/lower terciles were statistically significant (P < .001). Mortality rates were about 0.5% in the lower and middle terciles but about 2% in the upper tercile (Figure 5).
In the plot examining the relationship between CAN scores and index LOS, the LOS rose significantly beyond a CAN score of 60 and dramatically beyond a CAN score of 80 (Figure 6). LOESS curves also showed 2 inflection points suggesting an incremental and sequential rise in the LOS with increasing CAN scores (Figure 7). Mean (SD) LOS in days for the lowest to highest terciles was 2.6 (1.7), 2.8 (2.1), and 3.6 (2.2), respectively.
Discussion
CAN scores are automatically generated each week by EHR-based multivariable risk models. These scores have excellent predictive accuracy for 90-day and 1-year mortality and hospitalization and are routinely used by VHA primary care teams to assist with clinical operations.13 We studied the distribution of CAN 1-year mortality scores in a preoperative context and examined relationships of the preoperative CAN 1-year mortality scores with postoperative mortality and LOS in 8206 veterans who underwent TKR.
There are several noteworthy findings. First, the overall 1-year mortality rate observed following TKR (1.4%) was similar to other published reports.18,19 Not surprisingly, preoperative CAN 1-year mortality scores were significantly higher in veterans who died compared with those of survivors. The majority of patients who died had a preoperative CAN 1-year mortality score > 75 while most who survived had a preoperative CAN 1-year mortality score < 45 (P < .001). Interestingly, the same scores showed a nonlinear correlation with LOS. Index LOS was about 4 days in patients in the highest tercile of CAN scores vs 2.5 days in the lowest tercile, but the initial increase in LOS was detected at a CAN score of about 55 to 60.
In addition, mortality rate varied widely in different segments of the population when grouped according to preoperative CAN scores. One-year mortality rates in the highest tercile reached 2%, about 4-fold higher than that of lower terciles (0.5%). Examination of the Kaplan-Meier curves showed that this difference in mortality between the highest tercile and the lower 2 groups appears soon after discharge and continues to increase over time, suggesting that the factors contributing to the increased mortality are present at the time of discharge and persist beyond the postoperative period. In summary, although CAN scores were not designed for use in the perioperative context, we found that preoperative CAN 1-year mortality scores are broadly predictive of mortality, but especially for increases in LOS following elective TKA, both increases in hospital LOS following elective TKA and mortality over the year after TKA.
Our findings raise several important questions. The decision to undergo elective surgery is complex. Arguably, individuals who undergo elective knee replacement should be healthy enough to undergo, recover, and reap the benefits from a procedure that does not extend life. The distribution of preoperative CAN 1-year mortality scores for our study population was similar to that of the general VHA enrollee population with similar measured mortality rates (≤ 0.5% vs ≥ 1.7% in the low and high terciles, respectively).1 Further study comparing outcomes in matched cohorts who did and did not undergo joint replacement would be of interest. In lieu of this, though, the association of high but not extreme CAN scores with increased hospital LOS may potentially be used to guide allocation of resources to this group, obviating the increased cost and risk to which this group is exposed. And the additional insight afforded by CAN scores may enhance shared decision-making models by identifying patients at the very highest risk (eg, 1-year mortality CAN score ≥ 90), patients who conceivably might not survive long enough to recover from and enjoy their reconstructed knee, who might in the long run be harmed by undergoing the procedure.
Many total joint arthroplasties are performed in older patients, a population in which frailty is increasingly recognized as a significant risk factor for poor outcomes.20,21 CAN scores reliably identify high-risk patients and have been shown to correlate with frailty in this group.22 Multiple authors have reported improved outcomes with cost reductions after implementation of programs targeting modifiable risk factors in high-risk surgical candidates.23-25 A preoperative assessment that includes the CAN score may be valuable in identifying patients who would benefit most from prehabilitation programs or other interventions designed to blunt the impact of frailty. It is true that many elements used to calculate the CAN score would not be considered modifiable, especially in the short term. However, specific contributors to frailty, such as nutritional status and polypharmacy might be potential candidates. As with all multivariable risk prediction models, there are multiple paths to a high CAN score, and further research to identify clinically relevant subgroups may help inform efforts to improve perioperative care within this population.
Hospital LOS is of intense interest for many reasons, not least its utility as a surrogate for cost and increased risk for immediate perioperative adverse events, such as multidrug-resistant hospital acquired infections, need for postacute facility-based rehabilitation, and deconditioning that increase risks of falls and fractures in the older population.26-29 In addition, its importance is magnified due to the COVID-19 pandemic context in which restarting elective surgery programs has changed traditional criteria by which patients are scheduled for surgery.
We have shown that elevated CAN scores are able to identify patients at risk for extended hospital stays and, as such, may be useful additional data in allocating scarce operating room time and other resources for optimal patient and health care provider safety.30,31 Individual surgeons and hospital systems would, of course, decide which patients should be triaged to go first, based on local priorities; however, choosing lower risk patients with minimal risk of morbidity and mortality while pursuing prehabilitation for higher risk patients is a reasonable approach.
Limitations
Our study has several limitations. Only a single surgical procedure was included, albeit the most common one performed in the VHA. In addition, no information was available concerning the precise clinical course for these patients, such as the duration of surgery, anesthetic technique, and management of acute, perioperative course. Although the assumption was made that patients received standard care in a manner such that these factors would not significantly affect either their mortality or their LOS out of proportion to their preoperative clinical status, confounding cannot be excluded. Therefore, further study is necessary to determine whether CAN scores can accurately predict mortality and/or LOS for patients undergoing other procedures. Further, a clinical trial is required to assess whether systematic provision of the CAN score at the point of surgery would impact care and, more important, impact outcomes. In addition, multivariable analyses were not performed, including and excluding various components of the CAN score models. Currently, CAN scores could be made available to the surgical/anesthesia communities at minimal or no cost and are updated automatically. Model calibration and discrimination in this particular setting were not validated.
Because our interest is in leveraging an existing resource to a current clinical and operational problem rather than in creating or validating a new tool, we chose to test the simple bivariate relationship between preoperative CAN scores and outcomes. We chose the preoperative 1-year mortality CAN score from among the 4 options under the assumption that long-term survival is the most meaningful of the 4 candidate outcomes. Finally, while the CAN scores are currently only calculated and generated for patients cared for within the VHA, few data elements are unavailable to civilian health systems. The most problematic would be documentation of actual prescription filling, but this is a topic of increasing interest to the medical and academic communities and access to such information we hope will improve.32-34
Conclusions
Although designed for use by VHA primary care teams, CAN scores also may have value for perioperative clinicians, predicting mortality and prolonged hospital LOS in those with elevated 1-year mortality scores. Advantages of CAN scores relative to other perioperative risk calculators lies in their ability to predict long-term rather than 30-day survival and that they are automatically generated on a near-real-time basis for all patients who receive care in VHA ambulatory clinics. Further study is needed to determine practical utility in shared decision making, preoperative evaluation and optimization, and perioperative resource allocation.
Acknowledgments
This work was supported by the US Department of Veterans Affairs (VA) National Center for Patient Safety, Field Office 10A4E, through the Patient Safety Center of Inquiry at the Durham VA Medical Center in North Carolina. The study also received support from the Center of Innovation to Accelerate Discovery and Practice Transformation (CIN 13-410) at the Durham VA Health Care System.
1. McNair AGK, MacKichan F, Donovan JL, et al. What surgeons tell patients and what patients want to know before major cancer surgery: a qualitative study. BMC Cancer. 2016;16:258. doi:10.1186/s12885-016-2292-3
2. Grover FL, Hammermeister KE, Burchfiel C. Initial report of the Veterans Administration Preoperative Risk Assessment Study for Cardiac Surgery. Ann Thorac Surg. 1990;50(1):12-26; discussion 27-18. doi:10.1016/0003-4975(90)90073-f
3. Khuri SF, Daley J, Henderson W, et al. The National Veterans Administration Surgical Risk Study: risk adjustment for the comparative assessment of the quality of surgical care. J Am Coll Surg. 1995;180(5):519-531.
4. Glance LG, Lustik SJ, Hannan EL, et al. The Surgical Mortality Probability Model: derivation and validation of a simple simple risk prediction rule for noncardiac surgery. Ann Surg. 2012;255(4):696-702. doi:10.1097/SLA.0b013e31824b45af
5. Keller DS, Kroll D, Papaconstantinou HT, Ellis CN. Development and validation of a methodology to reduce mortality using the veterans affairs surgical quality improvement program risk calculator. J Am Coll Surg. 2017;224(4):602-607. doi:10.1016/j.jamcollsurg.2016.12.033
6. Bilimoria KY, Liu Y, Paruch JL, et al. Development and evaluation of the universal ACS NSQIP surgical risk calculator: a decision aid and informed consent tool for patients and surgeons. J Am Coll Surg. 2013;217(5):833-842.e831-833. doi:10.1016/j.jamcollsurg.2013.07.385
7. Ford MK, Beattie WS, Wijeysundera DN. Systematic review: prediction of perioperative cardiac complications and mortality by the revised cardiac risk index. Ann Intern Med. 2010;152(1):26-35. doi:10.7326/0003-4819-152-1-201001050-00007
8. Gupta PK, Gupta H, Sundaram A, et al. Development and validation of a risk calculator for prediction of cardiac risk after surgery. Circulation. 2011;124(4):381-387. doi:10.1161/CIRCULATIONAHA.110.015701
9. Lee TH, Marcantonio ER, Mangione CM, et al. Derivation and prospective validation of a simple index for prediction of cardiac risk of major noncardiac surgery. Circulation. 1999;100(10):1043-1049. doi:10.1161/01.cir.100.10.1043
10. Smith T, Li X, Nylander W, Gunnar W. Thirty-day postoperative mortality risk estimates and 1-year survival in Veterans Health Administration surgery patients. JAMA Surg. 2016;151(5):417-422. doi:10.1001/jamasurg.2015.4882
11. Damhuis RA, Wijnhoven BP, Plaisier PW, Kirkels WJ, Kranse R, van Lanschot JJ. Comparison of 30-day, 90- day and in-hospital postoperative mortality for eight different cancer types. Br J Surg. 2012;99(8):1149-1154. doi:10.1002/bjs.8813
12. Wang L, Porter B, Maynard C, et al. Predicting risk of hospitalization or death among patients receiving primary care in the Veterans Health Administration. Med Care. 2013;51(4):368-373. doi:10.1016/j.amjcard.2012.06.038
13. Fihn SD, Francis J, Clancy C, et al. Insights from advanced analytics at the Veterans Health Administration. Health Aff (Millwood). 2014;33(7):1203-1211. doi:10.1377/hlthaff.2014.0054
14. Noël PH, Copeland LA, Perrin RA, et al. VHA Corporate Data Warehouse height and weight data: opportunities and challenges for health services research. J Rehabil Res Dev. 2010;47(8):739-750. doi:10.1682/jrrd.2009.08.0110
15. Wong ES, Yoon J, Piegari RI, Rosland AM, Fihn SD, Chang ET. Identifying latent subgroups of high-risk patients using risk score trajectories. J Gen Intern Med. 2018;33(12):2120-2126. doi:10.1007/s11606-018-4653-x
16. Chen Q, Hsia HL, Overman R, et al. Impact of an opioid safety initiative on patients undergoing total knee arthroplasty: a time series analysis. Anesthesiology. 2019;131(2):369-380. doi:10.1097/ALN.0000000000002771
17. Hsia HL, Takemoto S, van de Ven T, et al. Acute pain is associated with chronic opioid use after total knee arthroplasty. Reg Anesth Pain Med. 2018;43(7):705-711. doi:10.1097/AAP.0000000000000831
18. Inacio MCS, Dillon MT, Miric A, Navarro RA, Paxton EW. Mortality after total knee and total hip arthroplasty in a large integrated health care system. Perm J. 2017;21:16-171. doi:10.7812/TPP/16-171
19. Lee QJ, Mak WP, Wong YC. Mortality following primary total knee replacement in public hospitals in Hong Kong. Hong Kong Med J. 2016;22(3):237-241. doi:10.12809/hkmj154712
20. Lin HS, Watts JN, Peel NM, Hubbard RE. Frailty and post-operative outcomes in older surgical patients: a systematic review. BMC Geriatr. 2016;16(1):157. doi:10.1186/s12877-016-0329-8
21. Shinall MC Jr, Arya S, Youk A, et al. Association of preoperative patient frailty and operative stress with postoperative mortality. JAMA Surg. 2019;155(1):e194620. doi:10.1001/jamasurg.2019.4620
22. Ruiz JG, Priyadarshni S, Rahaman Z, et al. Validation of an automatically generated screening score for frailty: the care assessment need (CAN) score. BMC Geriatr. 2018;18(1):106. doi:10.1186/s12877-018-0802-7
23. Bernstein DN, Liu TC, Winegar AL, et al. Evaluation of a preoperative optimization protocol for primary hip and knee arthroplasty patients. J Arthroplasty. 2018;33(12):3642- 3648. doi:10.1016/j.arth.2018.08.018
24. Sodhi N, Anis HK, Coste M, et al. A nationwide analysis of preoperative planning on operative times and postoperative complications in total knee arthroplasty. J Knee Surg. 2019;32(11):1040-1045. doi:10.1055/s-0039-1677790
25. Krause A, Sayeed Z, El-Othmani M, Pallekonda V, Mihalko W, Saleh KJ. Outpatient total knee arthroplasty: are we there yet? (part 1). Orthop Clin North Am. 2018;49(1):1-6. doi:10.1016/j.ocl.2017.08.002
26. Barrasa-Villar JI, Aibar-Remón C, Prieto-Andrés P, Mareca- Doñate R, Moliner-Lahoz J. Impact on morbidity, mortality, and length of stay of hospital-acquired infections by resistant microorganisms. Clin Infect Dis. 2017;65(4):644-652. doi:10.1093/cid/cix411
27. Nikkel LE, Kates SL, Schreck M, Maceroli M, Mahmood B, Elfar JC. Length of hospital stay after hip fracture and risk of early mortality after discharge in New York state: retrospective cohort study. BMJ. 2015;351:h6246. doi:10.1136/bmj.h6246
28. Marfil-Garza BA, Belaunzarán-Zamudio PF, Gulias-Herrero A, et al. Risk factors associated with prolonged hospital length-of-stay: 18-year retrospective study of hospitalizations in a tertiary healthcare center in Mexico. PLoS One. 2018;13(11):e0207203. doi:10.1371/journal.pone.0207203
29. Hirsch CH, Sommers L, Olsen A, Mullen L, Winograd CH. The natural history of functional morbidity in hospitalized older patients. J Am Geriatr Soc. 1990;38(12):1296-1303. doi:10.1111/j.1532-5415.1990.tb03451.x
30. Iyengar KP, Jain VK, Vaish A, Vaishya R, Maini L, Lal H. Post COVID-19: planning strategies to resume orthopaedic surgery -challenges and considerations. J Clin Orthop Trauma. 2020;11(suppl 3):S291-S295. doi:10.1016/j.jcot.2020.04.028
31. O’Connor CM, Anoushiravani AA, DiCaprio MR, Healy WL, Iorio R. Economic recovery after the COVID-19 pandemic: resuming elective orthopedic surgery and total joint arthroplasty. J Arthroplasty. 2020;35(suppl 7):S32-S36. doi:10.1016/j.arth.2020.04.038.
32. Mauseth SA, Skurtveit S, Skovlund E, Langhammer A, Spigset O. Medication use and association with urinary incontinence in women: data from the Norwegian Prescription Database and the HUNT study. Neurourol Urodyn. 2018;37(4):1448-1457. doi:10.1002/nau.23473
33. Sultan RS, Correll CU, Schoenbaum M, King M, Walkup JT, Olfson M. National patterns of commonly prescribed psychotropic medications to young people. J Child Adolesc Psychopharmacol. 2018;28(3):158-165. doi:10.1089/cap.2017.0077
34. McCoy RG, Dykhoff HJ, Sangaralingham L, et al. Adoption of new glucose-lowering medications in the U.S.-the case of SGLT2 inhibitors: nationwide cohort study. Diabetes Technol Ther. 2019;21(12):702-712. doi:10.1089/dia.2019.0213
1. McNair AGK, MacKichan F, Donovan JL, et al. What surgeons tell patients and what patients want to know before major cancer surgery: a qualitative study. BMC Cancer. 2016;16:258. doi:10.1186/s12885-016-2292-3
2. Grover FL, Hammermeister KE, Burchfiel C. Initial report of the Veterans Administration Preoperative Risk Assessment Study for Cardiac Surgery. Ann Thorac Surg. 1990;50(1):12-26; discussion 27-18. doi:10.1016/0003-4975(90)90073-f
3. Khuri SF, Daley J, Henderson W, et al. The National Veterans Administration Surgical Risk Study: risk adjustment for the comparative assessment of the quality of surgical care. J Am Coll Surg. 1995;180(5):519-531.
4. Glance LG, Lustik SJ, Hannan EL, et al. The Surgical Mortality Probability Model: derivation and validation of a simple simple risk prediction rule for noncardiac surgery. Ann Surg. 2012;255(4):696-702. doi:10.1097/SLA.0b013e31824b45af
5. Keller DS, Kroll D, Papaconstantinou HT, Ellis CN. Development and validation of a methodology to reduce mortality using the veterans affairs surgical quality improvement program risk calculator. J Am Coll Surg. 2017;224(4):602-607. doi:10.1016/j.jamcollsurg.2016.12.033
6. Bilimoria KY, Liu Y, Paruch JL, et al. Development and evaluation of the universal ACS NSQIP surgical risk calculator: a decision aid and informed consent tool for patients and surgeons. J Am Coll Surg. 2013;217(5):833-842.e831-833. doi:10.1016/j.jamcollsurg.2013.07.385
7. Ford MK, Beattie WS, Wijeysundera DN. Systematic review: prediction of perioperative cardiac complications and mortality by the revised cardiac risk index. Ann Intern Med. 2010;152(1):26-35. doi:10.7326/0003-4819-152-1-201001050-00007
8. Gupta PK, Gupta H, Sundaram A, et al. Development and validation of a risk calculator for prediction of cardiac risk after surgery. Circulation. 2011;124(4):381-387. doi:10.1161/CIRCULATIONAHA.110.015701
9. Lee TH, Marcantonio ER, Mangione CM, et al. Derivation and prospective validation of a simple index for prediction of cardiac risk of major noncardiac surgery. Circulation. 1999;100(10):1043-1049. doi:10.1161/01.cir.100.10.1043
10. Smith T, Li X, Nylander W, Gunnar W. Thirty-day postoperative mortality risk estimates and 1-year survival in Veterans Health Administration surgery patients. JAMA Surg. 2016;151(5):417-422. doi:10.1001/jamasurg.2015.4882
11. Damhuis RA, Wijnhoven BP, Plaisier PW, Kirkels WJ, Kranse R, van Lanschot JJ. Comparison of 30-day, 90- day and in-hospital postoperative mortality for eight different cancer types. Br J Surg. 2012;99(8):1149-1154. doi:10.1002/bjs.8813
12. Wang L, Porter B, Maynard C, et al. Predicting risk of hospitalization or death among patients receiving primary care in the Veterans Health Administration. Med Care. 2013;51(4):368-373. doi:10.1016/j.amjcard.2012.06.038
13. Fihn SD, Francis J, Clancy C, et al. Insights from advanced analytics at the Veterans Health Administration. Health Aff (Millwood). 2014;33(7):1203-1211. doi:10.1377/hlthaff.2014.0054
14. Noël PH, Copeland LA, Perrin RA, et al. VHA Corporate Data Warehouse height and weight data: opportunities and challenges for health services research. J Rehabil Res Dev. 2010;47(8):739-750. doi:10.1682/jrrd.2009.08.0110
15. Wong ES, Yoon J, Piegari RI, Rosland AM, Fihn SD, Chang ET. Identifying latent subgroups of high-risk patients using risk score trajectories. J Gen Intern Med. 2018;33(12):2120-2126. doi:10.1007/s11606-018-4653-x
16. Chen Q, Hsia HL, Overman R, et al. Impact of an opioid safety initiative on patients undergoing total knee arthroplasty: a time series analysis. Anesthesiology. 2019;131(2):369-380. doi:10.1097/ALN.0000000000002771
17. Hsia HL, Takemoto S, van de Ven T, et al. Acute pain is associated with chronic opioid use after total knee arthroplasty. Reg Anesth Pain Med. 2018;43(7):705-711. doi:10.1097/AAP.0000000000000831
18. Inacio MCS, Dillon MT, Miric A, Navarro RA, Paxton EW. Mortality after total knee and total hip arthroplasty in a large integrated health care system. Perm J. 2017;21:16-171. doi:10.7812/TPP/16-171
19. Lee QJ, Mak WP, Wong YC. Mortality following primary total knee replacement in public hospitals in Hong Kong. Hong Kong Med J. 2016;22(3):237-241. doi:10.12809/hkmj154712
20. Lin HS, Watts JN, Peel NM, Hubbard RE. Frailty and post-operative outcomes in older surgical patients: a systematic review. BMC Geriatr. 2016;16(1):157. doi:10.1186/s12877-016-0329-8
21. Shinall MC Jr, Arya S, Youk A, et al. Association of preoperative patient frailty and operative stress with postoperative mortality. JAMA Surg. 2019;155(1):e194620. doi:10.1001/jamasurg.2019.4620
22. Ruiz JG, Priyadarshni S, Rahaman Z, et al. Validation of an automatically generated screening score for frailty: the care assessment need (CAN) score. BMC Geriatr. 2018;18(1):106. doi:10.1186/s12877-018-0802-7
23. Bernstein DN, Liu TC, Winegar AL, et al. Evaluation of a preoperative optimization protocol for primary hip and knee arthroplasty patients. J Arthroplasty. 2018;33(12):3642- 3648. doi:10.1016/j.arth.2018.08.018
24. Sodhi N, Anis HK, Coste M, et al. A nationwide analysis of preoperative planning on operative times and postoperative complications in total knee arthroplasty. J Knee Surg. 2019;32(11):1040-1045. doi:10.1055/s-0039-1677790
25. Krause A, Sayeed Z, El-Othmani M, Pallekonda V, Mihalko W, Saleh KJ. Outpatient total knee arthroplasty: are we there yet? (part 1). Orthop Clin North Am. 2018;49(1):1-6. doi:10.1016/j.ocl.2017.08.002
26. Barrasa-Villar JI, Aibar-Remón C, Prieto-Andrés P, Mareca- Doñate R, Moliner-Lahoz J. Impact on morbidity, mortality, and length of stay of hospital-acquired infections by resistant microorganisms. Clin Infect Dis. 2017;65(4):644-652. doi:10.1093/cid/cix411
27. Nikkel LE, Kates SL, Schreck M, Maceroli M, Mahmood B, Elfar JC. Length of hospital stay after hip fracture and risk of early mortality after discharge in New York state: retrospective cohort study. BMJ. 2015;351:h6246. doi:10.1136/bmj.h6246
28. Marfil-Garza BA, Belaunzarán-Zamudio PF, Gulias-Herrero A, et al. Risk factors associated with prolonged hospital length-of-stay: 18-year retrospective study of hospitalizations in a tertiary healthcare center in Mexico. PLoS One. 2018;13(11):e0207203. doi:10.1371/journal.pone.0207203
29. Hirsch CH, Sommers L, Olsen A, Mullen L, Winograd CH. The natural history of functional morbidity in hospitalized older patients. J Am Geriatr Soc. 1990;38(12):1296-1303. doi:10.1111/j.1532-5415.1990.tb03451.x
30. Iyengar KP, Jain VK, Vaish A, Vaishya R, Maini L, Lal H. Post COVID-19: planning strategies to resume orthopaedic surgery -challenges and considerations. J Clin Orthop Trauma. 2020;11(suppl 3):S291-S295. doi:10.1016/j.jcot.2020.04.028
31. O’Connor CM, Anoushiravani AA, DiCaprio MR, Healy WL, Iorio R. Economic recovery after the COVID-19 pandemic: resuming elective orthopedic surgery and total joint arthroplasty. J Arthroplasty. 2020;35(suppl 7):S32-S36. doi:10.1016/j.arth.2020.04.038.
32. Mauseth SA, Skurtveit S, Skovlund E, Langhammer A, Spigset O. Medication use and association with urinary incontinence in women: data from the Norwegian Prescription Database and the HUNT study. Neurourol Urodyn. 2018;37(4):1448-1457. doi:10.1002/nau.23473
33. Sultan RS, Correll CU, Schoenbaum M, King M, Walkup JT, Olfson M. National patterns of commonly prescribed psychotropic medications to young people. J Child Adolesc Psychopharmacol. 2018;28(3):158-165. doi:10.1089/cap.2017.0077
34. McCoy RG, Dykhoff HJ, Sangaralingham L, et al. Adoption of new glucose-lowering medications in the U.S.-the case of SGLT2 inhibitors: nationwide cohort study. Diabetes Technol Ther. 2019;21(12):702-712. doi:10.1089/dia.2019.0213
The Hospital Readmissions Reduction Program: Inconvenient Observations
Centers for Medicare and Medicaid Services (CMS)–promulgated quality metrics continue to attract critics. Physicians decry that many metrics are outside their control, while patient groups are frustrated that metrics lack meaning for beneficiaries. The Hospital Readmissions Reduction Program (HRRP) reduces payments for “excess” 30-day risk-standardized readmissions for six conditions and procedures, and may be less effective in reducing readmissions than previously reported due to intentional and increasing use of hospital observation stays.1
In this issue, Sheehy et al2 report that nearly one in five rehospitalizations were unrecognized because either the index hospitalization or the rehospitalization was an observation stay, highlighting yet another challenge with the HRRP. Limitations of their study include the use of a single year of claims data and the exclusion of Medicare Advantage claims data, as one might expect lower readmission rates in this capitated program. Opportunities for improving the HRRP could consist of updating the HRRP metric to include observation stays and, for surgical hospitalizations, extended-stay surgical recovery, wherein patients may be observed for up to 2 days following a procedure. Unfortunately, despite the HRRP missing nearly one in five readmissions, CMS would likely need additional statutory authority from Congress in order to reinterpret the definition of readmission3 to include observation stays.
Challenges with the HRRP metrics raise broader concerns about the program. For decades, administrators viewed readmissions as a utilization metric, only to have the Affordable Care Act re-designate and define all-cause readmissions as a quality metric. Yet hospitals and health systems control only some factors driving readmission. Readmissions occur for a variety of reasons, including not only poor quality of initial hospital care and inadequate care coordination, but also factors that are beyond the hospital’s purview, such as lack of access to ambulatory services, multiple and severe chronic conditions that progress or remain unresponsive to intervention,4 and demographic and social factors such as housing instability, health literacy, or residence in a food desert. These non-hospital factors reside within the domain of other market participants or local, state, and federal government agencies.
Challenges to the utility, validity, and appropriateness of HRRP metrics should remind policymakers of the dangers of over-legislating the details of healthcare policy and the statutory inflexibility that can ensue. Clinical care evolves, and artificial constructs—including payment categories such as observation status—may age poorly over time, exemplified best by the challenges of accessing post-acute care due to the 3-day rule.5 Introduced as a statutory requirement in 1967, when the average length of stay was 13.8 days and observation care did not exist as a payment category, the 3-day rule requires Medicare beneficiaries to spend 3 days admitted to the hospital in order to qualify for coverage of post-acute care, creating care gaps for observation stay patients.
Observation care itself is an artificial construct of CMS payment policy. In the Medicare program, observation care falls under Part B, exposing patients to both greater financial responsibility and billing complexity through the engagement of their supplemental insurance, even though those receiving observation care experience the same care as if hospitalized— routine monitoring, nursing care, blood draws, imaging, and diagnostic tests. While CMS requires notification of observation status and explanation of the difference in patient financial responsibility, in clinical practice, patient understanding is limited. Policymakers can support both Medicare beneficiaries and hospitals by reexamining observation care as a payment category.
Sheehy and colleagues’ work simultaneously challenges the face validity of the HRRP and the reasonableness of categorizing some inpatient stays as outpatient care in the hospital—issues that policymakers can and should address.
1. Sabbatini AK, Wright B. Excluding observation stays from readmission rates – what quality measures are missing. N Engl J Med. 2018;378(22):2062-2065. https://doi.org/10.1056/NEJMp1800732
2. Sheehy AM, Kaiksow F, Powell WR, et al. The hospital readmissions reduction program’s blind spot: observation hospitalizations. J Hosp Med. 2021;16(7):409-411. https://doi.org/10.12788/jhm.3634
3. The Patient Protection and Affordable Care Act, 42 USC 18001§3025 (2010).
4. Reuben DB, Tinetti ME. The hospital-dependent patient. N Engl J Med. 2014;370(8):694-697. https://doi.org/10.1056/NEJMp1315568
5. Patel N, Slota JM, Miller BJ. The continued conundrum of discharge to a skilled nursing facility after a medicare observation stay. JAMA Health Forum. 2020;1(5):e200577. https://doi.org/10.1001/jamahealthforum.2020.0577
Centers for Medicare and Medicaid Services (CMS)–promulgated quality metrics continue to attract critics. Physicians decry that many metrics are outside their control, while patient groups are frustrated that metrics lack meaning for beneficiaries. The Hospital Readmissions Reduction Program (HRRP) reduces payments for “excess” 30-day risk-standardized readmissions for six conditions and procedures, and may be less effective in reducing readmissions than previously reported due to intentional and increasing use of hospital observation stays.1
In this issue, Sheehy et al2 report that nearly one in five rehospitalizations were unrecognized because either the index hospitalization or the rehospitalization was an observation stay, highlighting yet another challenge with the HRRP. Limitations of their study include the use of a single year of claims data and the exclusion of Medicare Advantage claims data, as one might expect lower readmission rates in this capitated program. Opportunities for improving the HRRP could consist of updating the HRRP metric to include observation stays and, for surgical hospitalizations, extended-stay surgical recovery, wherein patients may be observed for up to 2 days following a procedure. Unfortunately, despite the HRRP missing nearly one in five readmissions, CMS would likely need additional statutory authority from Congress in order to reinterpret the definition of readmission3 to include observation stays.
Challenges with the HRRP metrics raise broader concerns about the program. For decades, administrators viewed readmissions as a utilization metric, only to have the Affordable Care Act re-designate and define all-cause readmissions as a quality metric. Yet hospitals and health systems control only some factors driving readmission. Readmissions occur for a variety of reasons, including not only poor quality of initial hospital care and inadequate care coordination, but also factors that are beyond the hospital’s purview, such as lack of access to ambulatory services, multiple and severe chronic conditions that progress or remain unresponsive to intervention,4 and demographic and social factors such as housing instability, health literacy, or residence in a food desert. These non-hospital factors reside within the domain of other market participants or local, state, and federal government agencies.
Challenges to the utility, validity, and appropriateness of HRRP metrics should remind policymakers of the dangers of over-legislating the details of healthcare policy and the statutory inflexibility that can ensue. Clinical care evolves, and artificial constructs—including payment categories such as observation status—may age poorly over time, exemplified best by the challenges of accessing post-acute care due to the 3-day rule.5 Introduced as a statutory requirement in 1967, when the average length of stay was 13.8 days and observation care did not exist as a payment category, the 3-day rule requires Medicare beneficiaries to spend 3 days admitted to the hospital in order to qualify for coverage of post-acute care, creating care gaps for observation stay patients.
Observation care itself is an artificial construct of CMS payment policy. In the Medicare program, observation care falls under Part B, exposing patients to both greater financial responsibility and billing complexity through the engagement of their supplemental insurance, even though those receiving observation care experience the same care as if hospitalized— routine monitoring, nursing care, blood draws, imaging, and diagnostic tests. While CMS requires notification of observation status and explanation of the difference in patient financial responsibility, in clinical practice, patient understanding is limited. Policymakers can support both Medicare beneficiaries and hospitals by reexamining observation care as a payment category.
Sheehy and colleagues’ work simultaneously challenges the face validity of the HRRP and the reasonableness of categorizing some inpatient stays as outpatient care in the hospital—issues that policymakers can and should address.
Centers for Medicare and Medicaid Services (CMS)–promulgated quality metrics continue to attract critics. Physicians decry that many metrics are outside their control, while patient groups are frustrated that metrics lack meaning for beneficiaries. The Hospital Readmissions Reduction Program (HRRP) reduces payments for “excess” 30-day risk-standardized readmissions for six conditions and procedures, and may be less effective in reducing readmissions than previously reported due to intentional and increasing use of hospital observation stays.1
In this issue, Sheehy et al2 report that nearly one in five rehospitalizations were unrecognized because either the index hospitalization or the rehospitalization was an observation stay, highlighting yet another challenge with the HRRP. Limitations of their study include the use of a single year of claims data and the exclusion of Medicare Advantage claims data, as one might expect lower readmission rates in this capitated program. Opportunities for improving the HRRP could consist of updating the HRRP metric to include observation stays and, for surgical hospitalizations, extended-stay surgical recovery, wherein patients may be observed for up to 2 days following a procedure. Unfortunately, despite the HRRP missing nearly one in five readmissions, CMS would likely need additional statutory authority from Congress in order to reinterpret the definition of readmission3 to include observation stays.
Challenges with the HRRP metrics raise broader concerns about the program. For decades, administrators viewed readmissions as a utilization metric, only to have the Affordable Care Act re-designate and define all-cause readmissions as a quality metric. Yet hospitals and health systems control only some factors driving readmission. Readmissions occur for a variety of reasons, including not only poor quality of initial hospital care and inadequate care coordination, but also factors that are beyond the hospital’s purview, such as lack of access to ambulatory services, multiple and severe chronic conditions that progress or remain unresponsive to intervention,4 and demographic and social factors such as housing instability, health literacy, or residence in a food desert. These non-hospital factors reside within the domain of other market participants or local, state, and federal government agencies.
Challenges to the utility, validity, and appropriateness of HRRP metrics should remind policymakers of the dangers of over-legislating the details of healthcare policy and the statutory inflexibility that can ensue. Clinical care evolves, and artificial constructs—including payment categories such as observation status—may age poorly over time, exemplified best by the challenges of accessing post-acute care due to the 3-day rule.5 Introduced as a statutory requirement in 1967, when the average length of stay was 13.8 days and observation care did not exist as a payment category, the 3-day rule requires Medicare beneficiaries to spend 3 days admitted to the hospital in order to qualify for coverage of post-acute care, creating care gaps for observation stay patients.
Observation care itself is an artificial construct of CMS payment policy. In the Medicare program, observation care falls under Part B, exposing patients to both greater financial responsibility and billing complexity through the engagement of their supplemental insurance, even though those receiving observation care experience the same care as if hospitalized— routine monitoring, nursing care, blood draws, imaging, and diagnostic tests. While CMS requires notification of observation status and explanation of the difference in patient financial responsibility, in clinical practice, patient understanding is limited. Policymakers can support both Medicare beneficiaries and hospitals by reexamining observation care as a payment category.
Sheehy and colleagues’ work simultaneously challenges the face validity of the HRRP and the reasonableness of categorizing some inpatient stays as outpatient care in the hospital—issues that policymakers can and should address.
1. Sabbatini AK, Wright B. Excluding observation stays from readmission rates – what quality measures are missing. N Engl J Med. 2018;378(22):2062-2065. https://doi.org/10.1056/NEJMp1800732
2. Sheehy AM, Kaiksow F, Powell WR, et al. The hospital readmissions reduction program’s blind spot: observation hospitalizations. J Hosp Med. 2021;16(7):409-411. https://doi.org/10.12788/jhm.3634
3. The Patient Protection and Affordable Care Act, 42 USC 18001§3025 (2010).
4. Reuben DB, Tinetti ME. The hospital-dependent patient. N Engl J Med. 2014;370(8):694-697. https://doi.org/10.1056/NEJMp1315568
5. Patel N, Slota JM, Miller BJ. The continued conundrum of discharge to a skilled nursing facility after a medicare observation stay. JAMA Health Forum. 2020;1(5):e200577. https://doi.org/10.1001/jamahealthforum.2020.0577
1. Sabbatini AK, Wright B. Excluding observation stays from readmission rates – what quality measures are missing. N Engl J Med. 2018;378(22):2062-2065. https://doi.org/10.1056/NEJMp1800732
2. Sheehy AM, Kaiksow F, Powell WR, et al. The hospital readmissions reduction program’s blind spot: observation hospitalizations. J Hosp Med. 2021;16(7):409-411. https://doi.org/10.12788/jhm.3634
3. The Patient Protection and Affordable Care Act, 42 USC 18001§3025 (2010).
4. Reuben DB, Tinetti ME. The hospital-dependent patient. N Engl J Med. 2014;370(8):694-697. https://doi.org/10.1056/NEJMp1315568
5. Patel N, Slota JM, Miller BJ. The continued conundrum of discharge to a skilled nursing facility after a medicare observation stay. JAMA Health Forum. 2020;1(5):e200577. https://doi.org/10.1001/jamahealthforum.2020.0577
© 2021 Society of Hospital Medicine
Measuring Trainee Duty Hours: The Times They Are a-Changin’
“If your time to you is worth savin’
Then you better start swimmin’ or you’ll sink like a stone
For the times they are a-changin’...”
–Bob Dylan
The Accreditation Council for Graduate Medical Education requires residency programs to limit and track trainee work hours to reduce the risk of fatigue, burnout, and medical errors. These hours are documented most often by self-report, at the cost of additional administrative burden for trainees and programs, dubious accuracy, and potentially incentivizing misrepresentation.1
Thus, the study by Soleimani and colleagues2 in this issue is a welcome addition to the literature on duty-hours tracking. Using timestamp data from the electronic health record (EHR), the authors developed and collected validity evidence for an automated computerized algorithm to measure how much time trainees were spending on clinical work. The study was conducted at a large academic internal medicine residency program and tracked 203 trainees working 14,610 days. The authors compared their results to trainee self-report data. Though the approach centered on EHR access logs, it accommodated common scenarios of time away from the computer while at the hospital (eg, during patient rounds). Crucially, the algorithm included EHR access while at home. The absolute discrepancy between the algorithm and self-report averaged 1.38 hours per day. Notably, EHR work at home accounted for about an extra hour per day. When considering in-hospital work alone, the authors found 3% to 13% of trainees exceeding 80-hour workweek limits, but when adding out-of-hospital work, this percentage rose to 10% to 21%.
The authors used inventive methods to improve accuracy. They prespecified EHR functions that constituted active clinical work, classifying reading without editing notes or placing orders simply as “educational study,” which they excluded from duty hours. They ensured that time spent off-site was included and that logins from personal devices while in-hospital were not double-counted. Caveats to the study include the limited generalizability for institutions without the computational resources to replicate the model. The authors acknowledged the inherent flaw in using trainee self-report as the “gold standard,” and potentially some subset of the results could have been corroborated with time-motion observation studies.3 The decision to exclude passive medical record review at home as work arguably discounts the integral value that the “chart biopsy” has on direct patient care; it probably led to systematic underestimation of duty hours for junior and senior residents, who may be most likely to contribute in this way. Similarly, not counting time spent with patients at the end of the day after sign-out risks undercounting hours as well. Nonetheless, this study represents a rigorously designed and scalable approach to meeting regulatory requirements that can potentially lighten the administrative task load for trainees, improve reporting accuracy, and facilitate research comparing work hours to other variables of interest (eg, efficiency). The model can be generalized to other specialties and could document workload for staff physicians as well.
Merits of the study aside, the algorithm underscores troubling realities about the practice of medicine in the 21st century. Do we now equate clinical work with time on the computer? Is our contribution as physicians defined primarily by our presence at the keyboard, rather than the bedside?4 Future research facilitated by automated hours tracking is likely to further elucidate a connection between time spent in the EHR with burnout4 and job dissatisfaction, and the premise of this study is emblematic of the erosion of clinical work-life boundaries that began even before the pandemic.5 While the “times they are a-changin’,” in this respect, it may not be for the better.
1. Grabski DF, Goudreau BJ, Gillen JR, et al. Compliance with the Accreditation Council for Graduate Medical Education duty hours in a general surgery residency program: challenges and solutions in a teaching hospital. Surgery. 2020;167(2):302-307. https://doi.org/10.1016/j.surg.2019.05.029
2. Soleimani H, Adler-Milstein J, Cucina RJ, Murray SG. Automating measurement of trainee work hours. J Hosp Med. 2021;16(7):404-408. https://doi.org/10.12788/jhm.3607
3. Tipping MD, Forth VE, O’Leary KJ, et al. Where did the day go?—a time-motion study of hospitalists. J Hosp Med. 2010;5(6):323-328. https://doi.org/10.1002/jhm.790
4. Gardner RL, Cooper E, Haskell J, et al. Physician stress and burnout: the impact of health information technology. J Am Med Inform Assoc. 2019;26(2):106-114. https://doi.org/10.1093/jamia/ocy145
5. Saag HS, Shah K, Jones SA, Testa PA, Horwitz LI. Pajama time: working after work in the electronic health record. J Gen Intern Med. 2019;34(9):1695-1696. https://doi.org/10.1007/s11606-019-05055-x
“If your time to you is worth savin’
Then you better start swimmin’ or you’ll sink like a stone
For the times they are a-changin’...”
–Bob Dylan
The Accreditation Council for Graduate Medical Education requires residency programs to limit and track trainee work hours to reduce the risk of fatigue, burnout, and medical errors. These hours are documented most often by self-report, at the cost of additional administrative burden for trainees and programs, dubious accuracy, and potentially incentivizing misrepresentation.1
Thus, the study by Soleimani and colleagues2 in this issue is a welcome addition to the literature on duty-hours tracking. Using timestamp data from the electronic health record (EHR), the authors developed and collected validity evidence for an automated computerized algorithm to measure how much time trainees were spending on clinical work. The study was conducted at a large academic internal medicine residency program and tracked 203 trainees working 14,610 days. The authors compared their results to trainee self-report data. Though the approach centered on EHR access logs, it accommodated common scenarios of time away from the computer while at the hospital (eg, during patient rounds). Crucially, the algorithm included EHR access while at home. The absolute discrepancy between the algorithm and self-report averaged 1.38 hours per day. Notably, EHR work at home accounted for about an extra hour per day. When considering in-hospital work alone, the authors found 3% to 13% of trainees exceeding 80-hour workweek limits, but when adding out-of-hospital work, this percentage rose to 10% to 21%.
The authors used inventive methods to improve accuracy. They prespecified EHR functions that constituted active clinical work, classifying reading without editing notes or placing orders simply as “educational study,” which they excluded from duty hours. They ensured that time spent off-site was included and that logins from personal devices while in-hospital were not double-counted. Caveats to the study include the limited generalizability for institutions without the computational resources to replicate the model. The authors acknowledged the inherent flaw in using trainee self-report as the “gold standard,” and potentially some subset of the results could have been corroborated with time-motion observation studies.3 The decision to exclude passive medical record review at home as work arguably discounts the integral value that the “chart biopsy” has on direct patient care; it probably led to systematic underestimation of duty hours for junior and senior residents, who may be most likely to contribute in this way. Similarly, not counting time spent with patients at the end of the day after sign-out risks undercounting hours as well. Nonetheless, this study represents a rigorously designed and scalable approach to meeting regulatory requirements that can potentially lighten the administrative task load for trainees, improve reporting accuracy, and facilitate research comparing work hours to other variables of interest (eg, efficiency). The model can be generalized to other specialties and could document workload for staff physicians as well.
Merits of the study aside, the algorithm underscores troubling realities about the practice of medicine in the 21st century. Do we now equate clinical work with time on the computer? Is our contribution as physicians defined primarily by our presence at the keyboard, rather than the bedside?4 Future research facilitated by automated hours tracking is likely to further elucidate a connection between time spent in the EHR with burnout4 and job dissatisfaction, and the premise of this study is emblematic of the erosion of clinical work-life boundaries that began even before the pandemic.5 While the “times they are a-changin’,” in this respect, it may not be for the better.
“If your time to you is worth savin’
Then you better start swimmin’ or you’ll sink like a stone
For the times they are a-changin’...”
–Bob Dylan
The Accreditation Council for Graduate Medical Education requires residency programs to limit and track trainee work hours to reduce the risk of fatigue, burnout, and medical errors. These hours are documented most often by self-report, at the cost of additional administrative burden for trainees and programs, dubious accuracy, and potentially incentivizing misrepresentation.1
Thus, the study by Soleimani and colleagues2 in this issue is a welcome addition to the literature on duty-hours tracking. Using timestamp data from the electronic health record (EHR), the authors developed and collected validity evidence for an automated computerized algorithm to measure how much time trainees were spending on clinical work. The study was conducted at a large academic internal medicine residency program and tracked 203 trainees working 14,610 days. The authors compared their results to trainee self-report data. Though the approach centered on EHR access logs, it accommodated common scenarios of time away from the computer while at the hospital (eg, during patient rounds). Crucially, the algorithm included EHR access while at home. The absolute discrepancy between the algorithm and self-report averaged 1.38 hours per day. Notably, EHR work at home accounted for about an extra hour per day. When considering in-hospital work alone, the authors found 3% to 13% of trainees exceeding 80-hour workweek limits, but when adding out-of-hospital work, this percentage rose to 10% to 21%.
The authors used inventive methods to improve accuracy. They prespecified EHR functions that constituted active clinical work, classifying reading without editing notes or placing orders simply as “educational study,” which they excluded from duty hours. They ensured that time spent off-site was included and that logins from personal devices while in-hospital were not double-counted. Caveats to the study include the limited generalizability for institutions without the computational resources to replicate the model. The authors acknowledged the inherent flaw in using trainee self-report as the “gold standard,” and potentially some subset of the results could have been corroborated with time-motion observation studies.3 The decision to exclude passive medical record review at home as work arguably discounts the integral value that the “chart biopsy” has on direct patient care; it probably led to systematic underestimation of duty hours for junior and senior residents, who may be most likely to contribute in this way. Similarly, not counting time spent with patients at the end of the day after sign-out risks undercounting hours as well. Nonetheless, this study represents a rigorously designed and scalable approach to meeting regulatory requirements that can potentially lighten the administrative task load for trainees, improve reporting accuracy, and facilitate research comparing work hours to other variables of interest (eg, efficiency). The model can be generalized to other specialties and could document workload for staff physicians as well.
Merits of the study aside, the algorithm underscores troubling realities about the practice of medicine in the 21st century. Do we now equate clinical work with time on the computer? Is our contribution as physicians defined primarily by our presence at the keyboard, rather than the bedside?4 Future research facilitated by automated hours tracking is likely to further elucidate a connection between time spent in the EHR with burnout4 and job dissatisfaction, and the premise of this study is emblematic of the erosion of clinical work-life boundaries that began even before the pandemic.5 While the “times they are a-changin’,” in this respect, it may not be for the better.
1. Grabski DF, Goudreau BJ, Gillen JR, et al. Compliance with the Accreditation Council for Graduate Medical Education duty hours in a general surgery residency program: challenges and solutions in a teaching hospital. Surgery. 2020;167(2):302-307. https://doi.org/10.1016/j.surg.2019.05.029
2. Soleimani H, Adler-Milstein J, Cucina RJ, Murray SG. Automating measurement of trainee work hours. J Hosp Med. 2021;16(7):404-408. https://doi.org/10.12788/jhm.3607
3. Tipping MD, Forth VE, O’Leary KJ, et al. Where did the day go?—a time-motion study of hospitalists. J Hosp Med. 2010;5(6):323-328. https://doi.org/10.1002/jhm.790
4. Gardner RL, Cooper E, Haskell J, et al. Physician stress and burnout: the impact of health information technology. J Am Med Inform Assoc. 2019;26(2):106-114. https://doi.org/10.1093/jamia/ocy145
5. Saag HS, Shah K, Jones SA, Testa PA, Horwitz LI. Pajama time: working after work in the electronic health record. J Gen Intern Med. 2019;34(9):1695-1696. https://doi.org/10.1007/s11606-019-05055-x
1. Grabski DF, Goudreau BJ, Gillen JR, et al. Compliance with the Accreditation Council for Graduate Medical Education duty hours in a general surgery residency program: challenges and solutions in a teaching hospital. Surgery. 2020;167(2):302-307. https://doi.org/10.1016/j.surg.2019.05.029
2. Soleimani H, Adler-Milstein J, Cucina RJ, Murray SG. Automating measurement of trainee work hours. J Hosp Med. 2021;16(7):404-408. https://doi.org/10.12788/jhm.3607
3. Tipping MD, Forth VE, O’Leary KJ, et al. Where did the day go?—a time-motion study of hospitalists. J Hosp Med. 2010;5(6):323-328. https://doi.org/10.1002/jhm.790
4. Gardner RL, Cooper E, Haskell J, et al. Physician stress and burnout: the impact of health information technology. J Am Med Inform Assoc. 2019;26(2):106-114. https://doi.org/10.1093/jamia/ocy145
5. Saag HS, Shah K, Jones SA, Testa PA, Horwitz LI. Pajama time: working after work in the electronic health record. J Gen Intern Med. 2019;34(9):1695-1696. https://doi.org/10.1007/s11606-019-05055-x
© 2021 Society of Hospital Medicine
The Medical Liability Environment: Is It Really Any Worse for Hospitalists?
Although malpractice “crises” come and go, liability fears persist near top of mind for most physicians.1 Liability insurance premiums have plateaued in recent years, but remain at high levels, and the prospect of being reported to the National Practitioner Data Bank (NPDB) or listed on a state medical board’s website for a paid liability claim is unsettling. The high-acuity setting and the absence of longitudinal patient relationships in hospital medicine may theoretically raise malpractice risk, yet hospitalists’ liability risk remains understudied.2
The contribution by Schaffer and colleagues3 in this issue of the Journal of Hospital Medicine is thus welcome and illuminating. The researchers examine the liability risk of hospitalists compared to that of other specialties by utilizing a large database of malpractice claims compiled from multiple insurers across a decade.3 In a field of research plagued by inadequate data, the Comparative Benchmarking System (CBS) built by CRICO/RMF is a treasure. Unlike the primary national database of malpractice claims, the NPDB, the CBS contains information on claims that did not result in a payment, as well as physicians’ specialty and detailed information on the allegations, injuries, and their causes. The CBS contains almost a third of all medical liability claims made in the United States during the study period, supporting generalizability.
Schaffer and colleagues1 found that hospitalists had a lower claims rate than physicians in emergency medicine or neurosurgery. The rate was on par with that for non-hospital general internists, even though hospitalists often care for higher-acuity patients. Although claims rates dropped over the study period for physicians in neurosurgery, emergency medicine, psychiatry, and internal medicine subspecialties, the rate for hospitalists did not change significantly. Further, the median payout on claims against hospitalists was the highest of all the specialties examined, except neurosurgery. This reflects higher injury severity in hospitalist cases: half the claims against hospitalists involved death and three-quarters were high severity.
The study is not without limitations. Due to missing data, only a fraction of the claims (8.2% to 11%) in the full dataset are used in the claims rate analysis. Regression models predicting a payment are based on a small number of payments for hospitalists (n = 363). Further, the authors advance, as a potential explanation for hospitalists’ higher liability risk, that hospitalists are disproportionately young compared to other specialists, but the dataset lacks age data. These limitations suggest caution in the authors’ overall conclusion that “the malpractice environment for hospitalists is becoming less favorable.”
Nevertheless, several important insights emerge from their analysis. The very existence of claims demonstrates that patient harm continues. The contributing factors and judgment errors found in these claims demonstrate that much of this harm is potentially preventable and a risk to patient safety. Whether or not the authors’ young-hospitalist hypothesis is ultimately proven, it is difficult to argue with more mentorship as a means to improve safety. Also, preventing or intercepting judgment errors remains a vexing challenge in medicine that undoubtedly calls for creative clinical decision support solutions. Schaffer and colleagues1 also note that hospitalists are increasingly co-managing patients with other specialties, such as orthopedic surgery. Whether this new practice model drives hospitalist liability risk because hospitalists are practicing in areas in which they have less experience (as the authors posit) or whether hospitalists are simply more likely to be named in a suit as part of a specialty team with higher liability risk remains unknown and merits further investigation.
Ultimately, regardless of whether the liability environment is worsening for hospitalists, the need to improve our liability system is clear. There is room to improve the system on a number of metrics, including properly compensating negligently harmed patients without unduly burdening providers. The system also induces defensive medicine and has not driven safety improvements as expected. The liability environment, as a result, remains challenging not just for hospitalists, but for all patients and physicians as well.
1. Sage WM, Boothman RC, Gallagher TH. Another medical malpractice crisis? Try something different. JAMA. 2020;324(14):1395-1396. https://doi.org/10.1001/jama.2020.16557
2. Schaffer AC, Puopolo AL, Raman S, Kachalia A. Liability impact of the hospitalist model of care. J Hosp Med. 2014;9(12):750-755. https://doi.org/10.1002/jhm.2244
3. Schaffer AC, Yu-Moe CW, Babayan A, Wachter RM, Einbinder JS. Rates and characteristics of medical malpractice claims against hospitalists. J Hosp Med. 2021;16(7):390-396. https://doi.org/10.12788/jhm.3557
Although malpractice “crises” come and go, liability fears persist near top of mind for most physicians.1 Liability insurance premiums have plateaued in recent years, but remain at high levels, and the prospect of being reported to the National Practitioner Data Bank (NPDB) or listed on a state medical board’s website for a paid liability claim is unsettling. The high-acuity setting and the absence of longitudinal patient relationships in hospital medicine may theoretically raise malpractice risk, yet hospitalists’ liability risk remains understudied.2
The contribution by Schaffer and colleagues3 in this issue of the Journal of Hospital Medicine is thus welcome and illuminating. The researchers examine the liability risk of hospitalists compared to that of other specialties by utilizing a large database of malpractice claims compiled from multiple insurers across a decade.3 In a field of research plagued by inadequate data, the Comparative Benchmarking System (CBS) built by CRICO/RMF is a treasure. Unlike the primary national database of malpractice claims, the NPDB, the CBS contains information on claims that did not result in a payment, as well as physicians’ specialty and detailed information on the allegations, injuries, and their causes. The CBS contains almost a third of all medical liability claims made in the United States during the study period, supporting generalizability.
Schaffer and colleagues1 found that hospitalists had a lower claims rate than physicians in emergency medicine or neurosurgery. The rate was on par with that for non-hospital general internists, even though hospitalists often care for higher-acuity patients. Although claims rates dropped over the study period for physicians in neurosurgery, emergency medicine, psychiatry, and internal medicine subspecialties, the rate for hospitalists did not change significantly. Further, the median payout on claims against hospitalists was the highest of all the specialties examined, except neurosurgery. This reflects higher injury severity in hospitalist cases: half the claims against hospitalists involved death and three-quarters were high severity.
The study is not without limitations. Due to missing data, only a fraction of the claims (8.2% to 11%) in the full dataset are used in the claims rate analysis. Regression models predicting a payment are based on a small number of payments for hospitalists (n = 363). Further, the authors advance, as a potential explanation for hospitalists’ higher liability risk, that hospitalists are disproportionately young compared to other specialists, but the dataset lacks age data. These limitations suggest caution in the authors’ overall conclusion that “the malpractice environment for hospitalists is becoming less favorable.”
Nevertheless, several important insights emerge from their analysis. The very existence of claims demonstrates that patient harm continues. The contributing factors and judgment errors found in these claims demonstrate that much of this harm is potentially preventable and a risk to patient safety. Whether or not the authors’ young-hospitalist hypothesis is ultimately proven, it is difficult to argue with more mentorship as a means to improve safety. Also, preventing or intercepting judgment errors remains a vexing challenge in medicine that undoubtedly calls for creative clinical decision support solutions. Schaffer and colleagues1 also note that hospitalists are increasingly co-managing patients with other specialties, such as orthopedic surgery. Whether this new practice model drives hospitalist liability risk because hospitalists are practicing in areas in which they have less experience (as the authors posit) or whether hospitalists are simply more likely to be named in a suit as part of a specialty team with higher liability risk remains unknown and merits further investigation.
Ultimately, regardless of whether the liability environment is worsening for hospitalists, the need to improve our liability system is clear. There is room to improve the system on a number of metrics, including properly compensating negligently harmed patients without unduly burdening providers. The system also induces defensive medicine and has not driven safety improvements as expected. The liability environment, as a result, remains challenging not just for hospitalists, but for all patients and physicians as well.
Although malpractice “crises” come and go, liability fears persist near top of mind for most physicians.1 Liability insurance premiums have plateaued in recent years, but remain at high levels, and the prospect of being reported to the National Practitioner Data Bank (NPDB) or listed on a state medical board’s website for a paid liability claim is unsettling. The high-acuity setting and the absence of longitudinal patient relationships in hospital medicine may theoretically raise malpractice risk, yet hospitalists’ liability risk remains understudied.2
The contribution by Schaffer and colleagues3 in this issue of the Journal of Hospital Medicine is thus welcome and illuminating. The researchers examine the liability risk of hospitalists compared to that of other specialties by utilizing a large database of malpractice claims compiled from multiple insurers across a decade.3 In a field of research plagued by inadequate data, the Comparative Benchmarking System (CBS) built by CRICO/RMF is a treasure. Unlike the primary national database of malpractice claims, the NPDB, the CBS contains information on claims that did not result in a payment, as well as physicians’ specialty and detailed information on the allegations, injuries, and their causes. The CBS contains almost a third of all medical liability claims made in the United States during the study period, supporting generalizability.
Schaffer and colleagues1 found that hospitalists had a lower claims rate than physicians in emergency medicine or neurosurgery. The rate was on par with that for non-hospital general internists, even though hospitalists often care for higher-acuity patients. Although claims rates dropped over the study period for physicians in neurosurgery, emergency medicine, psychiatry, and internal medicine subspecialties, the rate for hospitalists did not change significantly. Further, the median payout on claims against hospitalists was the highest of all the specialties examined, except neurosurgery. This reflects higher injury severity in hospitalist cases: half the claims against hospitalists involved death and three-quarters were high severity.
The study is not without limitations. Due to missing data, only a fraction of the claims (8.2% to 11%) in the full dataset are used in the claims rate analysis. Regression models predicting a payment are based on a small number of payments for hospitalists (n = 363). Further, the authors advance, as a potential explanation for hospitalists’ higher liability risk, that hospitalists are disproportionately young compared to other specialists, but the dataset lacks age data. These limitations suggest caution in the authors’ overall conclusion that “the malpractice environment for hospitalists is becoming less favorable.”
Nevertheless, several important insights emerge from their analysis. The very existence of claims demonstrates that patient harm continues. The contributing factors and judgment errors found in these claims demonstrate that much of this harm is potentially preventable and a risk to patient safety. Whether or not the authors’ young-hospitalist hypothesis is ultimately proven, it is difficult to argue with more mentorship as a means to improve safety. Also, preventing or intercepting judgment errors remains a vexing challenge in medicine that undoubtedly calls for creative clinical decision support solutions. Schaffer and colleagues1 also note that hospitalists are increasingly co-managing patients with other specialties, such as orthopedic surgery. Whether this new practice model drives hospitalist liability risk because hospitalists are practicing in areas in which they have less experience (as the authors posit) or whether hospitalists are simply more likely to be named in a suit as part of a specialty team with higher liability risk remains unknown and merits further investigation.
Ultimately, regardless of whether the liability environment is worsening for hospitalists, the need to improve our liability system is clear. There is room to improve the system on a number of metrics, including properly compensating negligently harmed patients without unduly burdening providers. The system also induces defensive medicine and has not driven safety improvements as expected. The liability environment, as a result, remains challenging not just for hospitalists, but for all patients and physicians as well.
1. Sage WM, Boothman RC, Gallagher TH. Another medical malpractice crisis? Try something different. JAMA. 2020;324(14):1395-1396. https://doi.org/10.1001/jama.2020.16557
2. Schaffer AC, Puopolo AL, Raman S, Kachalia A. Liability impact of the hospitalist model of care. J Hosp Med. 2014;9(12):750-755. https://doi.org/10.1002/jhm.2244
3. Schaffer AC, Yu-Moe CW, Babayan A, Wachter RM, Einbinder JS. Rates and characteristics of medical malpractice claims against hospitalists. J Hosp Med. 2021;16(7):390-396. https://doi.org/10.12788/jhm.3557
1. Sage WM, Boothman RC, Gallagher TH. Another medical malpractice crisis? Try something different. JAMA. 2020;324(14):1395-1396. https://doi.org/10.1001/jama.2020.16557
2. Schaffer AC, Puopolo AL, Raman S, Kachalia A. Liability impact of the hospitalist model of care. J Hosp Med. 2014;9(12):750-755. https://doi.org/10.1002/jhm.2244
3. Schaffer AC, Yu-Moe CW, Babayan A, Wachter RM, Einbinder JS. Rates and characteristics of medical malpractice claims against hospitalists. J Hosp Med. 2021;16(7):390-396. https://doi.org/10.12788/jhm.3557
© 2021 Society of Hospital Medicine
Leadership & Professional Development: Cultivating Microcultures of Well-being
“As we work to create light for others, we naturally light our own way.”
– Mary Anne Radmacher
Perhaps unknowingly, hospitalists establish microcultures in their everyday work. Hospitalists’ interactions with colleagues often occur in the context of shared workspaces. The nature of these seemingly minor exchanges shapes the microculture, often described as the culture shared by a small group based on location within an organization. Hospitalists have an opportunity to cultivate well-being within these microcultures through gracious and thoughtful acknowledgments of their peers. Collegial support at the micro level influences wellness at the organizational level. A larger shared culture of wellness is necessary to nurture physicians’ personal fulfillment and professional development.1
We propose the CARE framework for cultivating well-being within the microcultures of hospital medicine shared workspaces. CARE consists of Capitalization, Active listening, Recognition, and Empathy. This framework is based on positive psychology research and inspired by lessons from The Happiness Advantage by Shawn Achor.2
Capitalization. Capitalization is defined as sharing upbeat news and receiving a positive reaction. Emotional support during good times, more so than during bad times, strengthens relationships. When a peer shares good news, show enthusiasm and counter with an active, constructive response to maximize the validation she perceives.2
For example, Alex sits at her desk and says to Kristen: “
My workshop proposal was accepted for medical education day!” “
Congratulations, Alex! Tell me more about the workshop.”
Active listening. Active listening requires concentration and observation of body language. Show engagement by maintaining an open posture, using positive facial expressions, and providing occasional cues that you’re paying attention. Paraphrasing and asking targeted questions to dive deeper demonstrates genuine interest.
“Katie, I could use your advice. Do you have a minute?”
Katie turns to face John and smiles. “Of course. How can I help?”
“My team seems drained after a code this morning. I planned a lecture for later, but I’m not sure this is the right time.”
Katie nods. “I think you’re right, John. How have you thought about handling the situation?”
Recognition. Acts of recognition and encouragement are catalysts for boosting morale. Even brief expressions of gratitude can have a significant emotional impact. Recognition is most meaningful when delivered deliberately and with warmth.
Kevin walks into the hospitalist workroom. “Diane, congratulations on your publication! I plan to make a medication interaction review part of my discharge workflow.”
Leah turns to Diane. “Diane, that’s great news! Can you send me the link to your article?”
Empathy. Burnout is prevalent in medicine, and our fellow hospitalists deserve empathy. Showing empathy reduces stress and promotes connectedness. Sense when your colleagues are in distress and take time to share in their feelings and emotions. Draw on your own clinical experience to find common ground and convey understanding.
“I transferred another patient with COVID-19 to the ICU. I spent the last hour talking to family.”
“Ashwin, you’ve had a tough week. I know how you must feel—I had to transfer a patient yesterday. Want to take a quick walk outside?”
Hospitalists are inherently busy while on service, but these four interventions are brief, requiring only several minutes. Each small investment of your time will pay significant emotional dividends. These practices will not only enhance your colleagues’ sense of well-being, but will also bolster your happiness and productivity. A positive mindset fosters creative thinking and enhances complex problem solving. Recharging the microcultures of hospitalist workspaces with positivity will spark a larger transformation at the organizational level. That’s because positive actions are contagious.2 One hospitalist’s commitment to CARE will encourage other hospitalists to adopt these behaviors, establishing a virtuous cycle that sustains an organization’s culture of wellness.
1. Bohman B, Dyrbye L, Sinsky CA, et al. Physician well-being: the reciprocity of practice efficiency, culture of wellness, and personal resilience. NEJM Catalyst. August 7, 2017. Accessed June 24, 2021. https://catalyst.nejm.org/doi/full/10.1056/CAT.17.0429
2. Achor S. The Happiness Advantage: How a Positive Brain Fuels Success in Work and Life. Currency; 2010.
“As we work to create light for others, we naturally light our own way.”
– Mary Anne Radmacher
Perhaps unknowingly, hospitalists establish microcultures in their everyday work. Hospitalists’ interactions with colleagues often occur in the context of shared workspaces. The nature of these seemingly minor exchanges shapes the microculture, often described as the culture shared by a small group based on location within an organization. Hospitalists have an opportunity to cultivate well-being within these microcultures through gracious and thoughtful acknowledgments of their peers. Collegial support at the micro level influences wellness at the organizational level. A larger shared culture of wellness is necessary to nurture physicians’ personal fulfillment and professional development.1
We propose the CARE framework for cultivating well-being within the microcultures of hospital medicine shared workspaces. CARE consists of Capitalization, Active listening, Recognition, and Empathy. This framework is based on positive psychology research and inspired by lessons from The Happiness Advantage by Shawn Achor.2
Capitalization. Capitalization is defined as sharing upbeat news and receiving a positive reaction. Emotional support during good times, more so than during bad times, strengthens relationships. When a peer shares good news, show enthusiasm and counter with an active, constructive response to maximize the validation she perceives.2
For example, Alex sits at her desk and says to Kristen: “
My workshop proposal was accepted for medical education day!” “
Congratulations, Alex! Tell me more about the workshop.”
Active listening. Active listening requires concentration and observation of body language. Show engagement by maintaining an open posture, using positive facial expressions, and providing occasional cues that you’re paying attention. Paraphrasing and asking targeted questions to dive deeper demonstrates genuine interest.
“Katie, I could use your advice. Do you have a minute?”
Katie turns to face John and smiles. “Of course. How can I help?”
“My team seems drained after a code this morning. I planned a lecture for later, but I’m not sure this is the right time.”
Katie nods. “I think you’re right, John. How have you thought about handling the situation?”
Recognition. Acts of recognition and encouragement are catalysts for boosting morale. Even brief expressions of gratitude can have a significant emotional impact. Recognition is most meaningful when delivered deliberately and with warmth.
Kevin walks into the hospitalist workroom. “Diane, congratulations on your publication! I plan to make a medication interaction review part of my discharge workflow.”
Leah turns to Diane. “Diane, that’s great news! Can you send me the link to your article?”
Empathy. Burnout is prevalent in medicine, and our fellow hospitalists deserve empathy. Showing empathy reduces stress and promotes connectedness. Sense when your colleagues are in distress and take time to share in their feelings and emotions. Draw on your own clinical experience to find common ground and convey understanding.
“I transferred another patient with COVID-19 to the ICU. I spent the last hour talking to family.”
“Ashwin, you’ve had a tough week. I know how you must feel—I had to transfer a patient yesterday. Want to take a quick walk outside?”
Hospitalists are inherently busy while on service, but these four interventions are brief, requiring only several minutes. Each small investment of your time will pay significant emotional dividends. These practices will not only enhance your colleagues’ sense of well-being, but will also bolster your happiness and productivity. A positive mindset fosters creative thinking and enhances complex problem solving. Recharging the microcultures of hospitalist workspaces with positivity will spark a larger transformation at the organizational level. That’s because positive actions are contagious.2 One hospitalist’s commitment to CARE will encourage other hospitalists to adopt these behaviors, establishing a virtuous cycle that sustains an organization’s culture of wellness.
“As we work to create light for others, we naturally light our own way.”
– Mary Anne Radmacher
Perhaps unknowingly, hospitalists establish microcultures in their everyday work. Hospitalists’ interactions with colleagues often occur in the context of shared workspaces. The nature of these seemingly minor exchanges shapes the microculture, often described as the culture shared by a small group based on location within an organization. Hospitalists have an opportunity to cultivate well-being within these microcultures through gracious and thoughtful acknowledgments of their peers. Collegial support at the micro level influences wellness at the organizational level. A larger shared culture of wellness is necessary to nurture physicians’ personal fulfillment and professional development.1
We propose the CARE framework for cultivating well-being within the microcultures of hospital medicine shared workspaces. CARE consists of Capitalization, Active listening, Recognition, and Empathy. This framework is based on positive psychology research and inspired by lessons from The Happiness Advantage by Shawn Achor.2
Capitalization. Capitalization is defined as sharing upbeat news and receiving a positive reaction. Emotional support during good times, more so than during bad times, strengthens relationships. When a peer shares good news, show enthusiasm and counter with an active, constructive response to maximize the validation she perceives.2
For example, Alex sits at her desk and says to Kristen: “
My workshop proposal was accepted for medical education day!” “
Congratulations, Alex! Tell me more about the workshop.”
Active listening. Active listening requires concentration and observation of body language. Show engagement by maintaining an open posture, using positive facial expressions, and providing occasional cues that you’re paying attention. Paraphrasing and asking targeted questions to dive deeper demonstrates genuine interest.
“Katie, I could use your advice. Do you have a minute?”
Katie turns to face John and smiles. “Of course. How can I help?”
“My team seems drained after a code this morning. I planned a lecture for later, but I’m not sure this is the right time.”
Katie nods. “I think you’re right, John. How have you thought about handling the situation?”
Recognition. Acts of recognition and encouragement are catalysts for boosting morale. Even brief expressions of gratitude can have a significant emotional impact. Recognition is most meaningful when delivered deliberately and with warmth.
Kevin walks into the hospitalist workroom. “Diane, congratulations on your publication! I plan to make a medication interaction review part of my discharge workflow.”
Leah turns to Diane. “Diane, that’s great news! Can you send me the link to your article?”
Empathy. Burnout is prevalent in medicine, and our fellow hospitalists deserve empathy. Showing empathy reduces stress and promotes connectedness. Sense when your colleagues are in distress and take time to share in their feelings and emotions. Draw on your own clinical experience to find common ground and convey understanding.
“I transferred another patient with COVID-19 to the ICU. I spent the last hour talking to family.”
“Ashwin, you’ve had a tough week. I know how you must feel—I had to transfer a patient yesterday. Want to take a quick walk outside?”
Hospitalists are inherently busy while on service, but these four interventions are brief, requiring only several minutes. Each small investment of your time will pay significant emotional dividends. These practices will not only enhance your colleagues’ sense of well-being, but will also bolster your happiness and productivity. A positive mindset fosters creative thinking and enhances complex problem solving. Recharging the microcultures of hospitalist workspaces with positivity will spark a larger transformation at the organizational level. That’s because positive actions are contagious.2 One hospitalist’s commitment to CARE will encourage other hospitalists to adopt these behaviors, establishing a virtuous cycle that sustains an organization’s culture of wellness.
1. Bohman B, Dyrbye L, Sinsky CA, et al. Physician well-being: the reciprocity of practice efficiency, culture of wellness, and personal resilience. NEJM Catalyst. August 7, 2017. Accessed June 24, 2021. https://catalyst.nejm.org/doi/full/10.1056/CAT.17.0429
2. Achor S. The Happiness Advantage: How a Positive Brain Fuels Success in Work and Life. Currency; 2010.
1. Bohman B, Dyrbye L, Sinsky CA, et al. Physician well-being: the reciprocity of practice efficiency, culture of wellness, and personal resilience. NEJM Catalyst. August 7, 2017. Accessed June 24, 2021. https://catalyst.nejm.org/doi/full/10.1056/CAT.17.0429
2. Achor S. The Happiness Advantage: How a Positive Brain Fuels Success in Work and Life. Currency; 2010.
© 2021 Society of Hospital Medicine
Algorithms for Prediction of Clinical Deterioration on the General Wards: A Scoping Review
The early identification of clinical deterioration among adult hospitalized patients remains a challenge.1 Delayed identification is associated with increased morbidity and mortality, unplanned intensive care unit (ICU) admissions, prolonged hospitalization, and higher costs.2,3 Earlier detection of deterioration using predictive algorithms of vital sign monitoring might avoid these negative outcomes.4 In this scoping review, we summarize current algorithms and their evidence.
Vital signs provide the backbone for detecting clinical deterioration. Early warning scores (EWS) and outreach protocols were developed to bring structure to the assessment of vital signs. Most EWS claim to predict clinical end points such as unplanned ICU admission up to 24 hours in advance.5,6 Reviews of EWS showed a positive trend toward reduced length of stay and mortality. However, conclusions about general efficacy could not be generated because of case heterogeneity and methodologic shortcomings.4,7 Continuous automated vital sign monitoring of patients on the general ward can now be accomplished with wearable devices.8 The first reports on continuous monitoring showed earlier detection of deterioration but not improved clinical end points.4,9 Since then, different reports on continuous monitoring have shown positive effects but concluded that unprocessed monitoring data per se falls short of generating actionable alarms.4,10,11
Predictive algorithms, which often use artificial intelligence (AI), are increasingly employed to recognize complex patterns or abnormalities and support predictions of events in big data sets.12,13 Especially when combined with continuous vital sign monitoring, predictive algorithms have the potential to expedite detection of clinical deterioration and improve patient outcomes. Predictive algorithms using vital signs in the ICU have shown promising results.14 The impact of predictive algorithms on the general wards, however, is unclear.
The aims of our scoping review were to explore the extent and range of and evidence for predictive vital signs–based algorithms on the adult general ward; to describe the variety of these algorithms; and to categorize effects, facilitators, and barriers of their implementation.15
MATERIALS AND METHODS
We performed a scoping review to create a summary of the current state of research. We used the five-step method of Levac and followed the Preferred Reporting Items for Systematic reviews and Meta-Analyses Extension for Scoping Reviews guidelines (Appendix 1).16,17
PubMed, Embase, and CINAHL databases were searched for English-language articles written between January 1, 2010, and November 20, 2020. We developed the search queries with an experienced information scientist, and we used database-specific terms and strategies for input, clinical outcome, method, predictive capability, and population (Appendix 2). Additionally, we searched the references of the selected articles, as well as publications citing these articles.
All studies identified were screened by title and abstract by two researchers (RP and YE). The selected studies were read in their entirety and checked for eligibility using the following inclusion criteria: automated algorithm; vital signs-based; real-time prediction; of clinical deterioration; in an adult, general ward population. In cases where there were successive publications with the same algorithm and population, we selected the most recent study.
For screening and selection, we used the Rayyan QCRI online tool (Qatar Computing Research Institute) and Endnote X9 (Clarivate Analytics). We extracted information using a data extraction form and organized it into descriptive characteristics of the selected studies (Table 1): an input data table showing number of admissions, intermittent or continuous measurements, vital signs measured, laboratory results (Appendix Table 1), a table summarizing study designs and settings (Appendix Table 2), and a prediction performance table (Table 2). We report characteristics of the populations and algorithms, prediction specifications such as area under the receiver operating curve (AUROC), and predictive values. Predictive values are affected by prevalence, which may differ among populations. To compare the algorithms, we calculated an indexed positive predictive value (PPV) and a number needed to evaluate (NNE) using a weighted average prevalence of clinical deterioration of 3.0%.

We defined clinical deterioration as end points, including rapid response team activation, cardiopulmonary resuscitation, transfer to an ICU, or death.
Effects, facilitators, and barriers were identified and categorized using ATLAS.ti 8 software (ATLAS.ti) and evaluated by three researchers (RP, MK, and THvdB). These were categorized using the adapted frameworks of Gagnon et al18 for the barriers and facilitators and of Donabedian19 for the effects (Appendix 3).
The Gagnon et al framework was adapted by changing two of four domains—that is, “Individual” was changed to “Professional” and “Human” to “Physiology.” The domains of “Technology” and “Organization” remained unchanged. The Donabedian domains of “Outcome,” “Process,” and “Structure” also remained unchanged (Table 3).
We divided the studies into two groups: studies on predictive algorithms with and without AI when reporting on characteristics and performance. For the secondary aim of exploring implementation impact, we reported facilitators and barriers in a narrative way, highlighting the most frequent and notable findings.
RESULTS
As shown in the Figure, we found 1741 publications, of which we read the full-text of 109. There were 1632 publications that did not meet the inclusion criteria. The publications by Churpek et al,20,21 Bartkiowak et al,22 Edelson et al,23 Escobar et al,24,25 and Kipnis et al26 reported on the same algorithms or databases but had significantly different approaches. For multiple publications using the same algorithm and population, the most recent was named with inclusion of the earlier findings.20,21,27-29 The resulting 21 papers are included in this review.
Descriptive characteristics of the studies are summarized in Table 1. Nineteen of the publications were full papers and two were conference abstracts. Most of the studies (n = 18) were from the United States; there was one study from South Korea,30 one study from Portugal,31 and one study from the United Kingdom.32 In 15 of the studies, there was a strict focus on general or specific wards; 6 studies also included the ICU and/or emergency departments.
Two of the studies were clinical trials, 2 were prospective observational studies, and 17 were retrospective studies. Five studies reported on an active predictive model during admission. Of these, 3 reported that the model was clinically implemented, using the predictions in their clinical workflow. None of the implemented studies used AI.
All input variables are presented in Appendix Table 1.
The non-AI algorithm prediction horizons ranged from 4 to 24 hours, with a median of 24 hours (interquartile range [IQR], 12-24 hours). The AI algorithms ranged from 2 to 48 hours and had a median horizon of 14 hours (IQR, 12-24 hours).
We found three studies reporting patient outcomes. The most recent of these was a large multicenter implementation study by Escobar et al25 that included an extensive follow-up response. This study reported a significantly decreased 30-day mortality in the intervention cohort. A smaller randomized controlled trial reported no significant differences in patient outcomes with earlier warning alarms.27 A third study reported more appropriate rapid response team deployment and decreased mortality in a subgroup analysis.35
Effects, Facilitators, and Barriers
As shown in the Appendix Figure and further detailed in Table 3, the described effects were predominantly positive—57 positive effects vs 11 negative effects. These positive effects sorted primarily into the outcome and process domains.
All of the studies that compared their proposed model with one of various warning systems (eg, EWS, National Early Warning Score [NEWS], Modified Early Warning Score [MEWS]) showed superior performance (based on AUROC and reported predictive values). In 17 studies, the authors reported their model as more useful or superior to the EWS.20-23,26-28,34,36-41 Four studies reported real-time detection of deterioration before regular EWS,20,26,42 and three studies reported positive effects on patient-related outcomes.26,35 Four negative effects were noted on the controllability, validity, and potential limitations.27,42
Of the 38 remarks in the Technology domain, difficulty with implementation in daily practice was a commonly cited barrier.22,24,40,42 Difficulties included creating real-time data feeds out of the EMR, though there were mentions of some successful examples.25,27,36 Difficulty in the interpretability of AI was also considered a potential barrier.30,32,33,35,39,41 There were remarks as to the applicability of the prolonged prediction horizon because of the associated decoupling from the clinical view.39,42
Conservative attitudes toward new technologies and inadequate knowledge were mentioned as barriers.39 Repeated remarks were made on the difficulty of interpreting and responding to a predicted escalation, as the clinical pattern might not be recognizable at such an early stage. On the other hand, it is expected that less invasive countermeasures would be adequate to avert further escalation. Earlier recognition of possible escalations also raised potential ethical questions, such as when to discuss palliative care.24
The heterogeneity of the general ward population and the relatively low prevalence of deterioration were mentioned as barriers.24,30,38,41 There were also concerns that not all escalations are preventable and that some patient outcomes may not be modifiable.24,38
Many investigators expected reductions in false alarms and associated alarm fatigue (reflected as higher PPVs). Furthermore, they expected workflow to improve and workload to decrease.21,23,27,31,33,35,38,41 Despite the capacity of modern EMRs to store large amounts of patient data, some investigators felt improvements to real-time access, data quality and validity, and data density are needed to ensure valid associated predictions.21,22,24,32,37
DISCUSSION
As the complexity and comorbidity of hospitalized adults grow, predicting clinical deterioration is becoming more important. With an ever-increasing amount of available
There are several important limitations across these studies. In a clinical setting, these models would function as a screening test. Almost all studies report an AUROC; however, sensitivity and PPV or NNE (defined as 1/PPV) may be more useful than AUROC when predicting low-frequency events with high-potential clinical impact.44 Assessing the NNE is especially relevant because of its relation to alarm fatigue and responsiveness of clinicians.43 Alarm fatigue and lack of adequate response to alarms were repeatedly cited as potential barriers for application of automated scores.
Although the results of our scoping review are promising, there are limited data on clinical outcomes using these algorithms. Only three of five algorithms were used to guide clinical decision-making.25,27,35 Kollef et al27 showed shorter hospitalizations and Evans et al35 found decreased mortality rates in a multimorbid subgroup. Escobar et al25 found an overall and consistent decrease in mortality in a large, heterogenic population of inpatients across 21 hospitals. While Escobar et al’s findings provide strong evidence that predictive algorithms and structured follow-up on alarms can improve patient outcomes, it recognizes that not all facilities will have the resources to implement them.25 Dedicated round-the-clock follow-up of alarms has yet to be proven feasible for smaller institutions, and leaner solutions must be explored. The example set by Escobar et al25 should be translated into various settings to prove its reproducibility and to substantiate the clinical impact of predictive models and structured follow-up.
According to expert opinion, the use of high-frequency or continuous monitoring at low-acuity wards and AI algorithms to detect trends and patterns will reduce failure-to-rescue rates.4,9,43 However, most studies in our review focused on periodic spot-checked vital signs, and none of the AI algorithms were implemented in clinical care (Appendix Table 1
STRENGTHS AND LIMITATIONS
We performed a comprehensive review of the current literature using a clear and reproducible methodology to minimize the risk of missing relevant publications. The identified research is mainly limited to large US centers and consists of mostly retrospective studies. Heterogeneity among inputs, endpoints, time horizons, and evaluation metrics make comparisons challenging. Comments on facilitators, barriers, and effects were limited.
RECOMMENDATIONS FOR FUTURE RESEARCH
Artificial intelligence and the use of continuous monitoring hold great promise in creating optimal predictive algorithms. Future studies should directly compare AI- and non-AI-based algorithms using continuous monitoring to determine predictive accuracy, feasibility, costs, and outcomes. A consensus on endpoint definitions, input variables, methodology, and reporting is needed to enhance reproducibility, comparability, and generalizability of future research.
CONCLUSION
- van Galen LS, Struik PW, Driesen BEJM, et al. Delayed recognition of deterioration of patients in general wards is mostly caused by human related monitoring failures: a root cause analysis of unplanned ICU admissions. PLoS One. 2016;11(8):e0161393. https://doi.org/10.1371/journal. pone.0161393
- Mardini L, Lipes J, Jayaraman D. Adverse outcomes associated with delayed intensive care consultation in medical and surgical inpatients. J Crit Care. 2012;27(6):688-693. https://doi.org/10.1016/j.jcrc.2012.04.011
- Young MP, Gooder VJ, McBride K, James B, Fisher ES. Inpatient transfers to the intensive care unit: delays are associated with increased mortality and morbidity. J Gen Intern Med. 2003;18(2):77-83. https://doi.org/10.1046/ j.1525-1497.2003.20441.x
- Khanna AK, Hoppe P, Saugel B. Automated continuous noninvasive ward monitoring: future directions and challenges. Crit Care. 2019;23(1):194. https://doi.org/10.1186/s13054-019-2485-7
- Ludikhuize J, Hamming A, de Jonge E, Fikkers BG. Rapid response systems in The Netherlands. Jt Comm J Qual Patient Saf. 2011;37(3):138-197. https:// doi.org/10.1016/s1553-7250(11)37017-1
- Cuthbertson BH, Boroujerdi M, McKie L, Aucott L, Prescott G. Can physiological variables and early warning scoring systems allow early recognition of the deteriorating surgical patient? Crit Care Med. 2007;35(2):402-409. https://doi.org/10.1097/01.ccm.0000254826.10520.87
- Alam N, Hobbelink EL, van Tienhoven AJ, van de Ven PM, Jansma EP, Nanayakkara PWB. The impact of the use of the Early Warning Score (EWS) on patient outcomes: a systematic review. Resuscitation. 2014;85(5):587-594. https://doi.org/10.1016/j.resuscitation.2014.01.013
- Weenk M, Koeneman M, van de Belt TH, Engelen LJLPG, van Goor H, Bredie SJH. Wireless and continuous monitoring of vital signs in patients at the general ward. Resuscitation. 2019;136:47-53. https://doi.org/10.1016/j.resuscitation.2019.01.017
- Cardona-Morrell M, Prgomet M, Turner RM, Nicholson M, Hillman K. Effectiveness of continuous or intermittent vital signs monitoring in preventing adverse events on general wards: a systematic review and meta-analysis. Int J Clin Pract. 2016;70(10):806-824. https://doi.org/10.1111/ijcp.12846
- Brown H, Terrence J, Vasquez P, Bates DW, Zimlichman E. Continuous monitoring in an inpatient medical-surgical unit: a controlled clinical trial. Am J Med. 2014;127(3):226-232. https://doi.org/10.1016/j.amjmed.2013.12.004
- Mestrom E, De Bie A, van de Steeg M, Driessen M, Atallah L, Bezemer R. Implementation of an automated early warning scoring system in a E8 Journal of Hospital Medicine® Published Online June 2021 An Official Publication of the Society of Hospital Medicine Peelen et al | Predicting Deterioration: A Scoping Review surgical ward: practical use and effects on patient outcomes. PLoS One. 2019;14(5):e0213402. https://doi.org/10.1371/journal.pone.0213402
- Jiang F, Jiang Y, Zhi H, et al. Artificial intelligence in healthcare: past, present and future. Stroke Vasc Neurol. 2017;2(4):230-243. https://doi.org/10.1136/ svn-2017-000101
- Iwashyna TJ, Liu V. What’s so different about big data? A primer for clinicians trained to think epidemiologically. Ann Am Thorac Soc. 2014;11(7):1130- 1135. https://doi.org/10.1513/annalsats.201405-185as
- Jalali A, Bender D, Rehman M, Nadkanri V, Nataraj C. Advanced analytics for outcome prediction in intensive care units. Conf Proc IEEE Eng Med Biol Soc. 2016;2016:2520-2524. https://doi.org/10.1109/embc.2016.7591243
- Munn Z, Peters MDJ, Stern C, Tufanaru C, McArthur A, Aromataris E. Systematic review or scoping review? Guidance for authors when choosing between a systematic or scoping review approach. BMC Med Res Methodol. 2018;18(1):143. https://doi.org/10.1186/s12874-018-0611-x
- Arksey H, O’Malley L. Scoping studies: towards a methodological framework. Int J Soc Res Methodol. 2005;8(1):19-32. https://doi.org/10.1080/13645 57032000119616
- Tricco AC, Lillie E, Zarin W, et al. PRISMA extension for scoping reviews (PRISMAScR): checklist and explanation. Ann Intern Med. 2018;169(7):467- 473. https://doi.org/10.7326/m18-0850
- Gagnon MP, Desmartis M, Gagnon J, et al. Framework for user involvement in health technology assessment at the local level: views of health managers, user representatives, and clinicians. Int J Technol Assess Health Care. 2015;31(1-2):68-77. https://doi.org/10.1017/s0266462315000070
- Donabedian A. The quality of care. How can it be assessed? JAMA. 1988;260(12):1743-1748. https://doi.org/10.1001/jama.260.12.1743
- Churpek MM, Yuen TC, Winslow C, et al. Multicenter development and validation of a risk stratification tool for ward patients. Am J Respir Crit Care Med. 2014;190(6):649-655. https://doi.org/10.1164/rccm.201406-1022oc
- Churpek MM, Yuen TC, Winslow C, Meltzer DO, Kattan MW, Edelson DP. Multicenter comparison of machine learning methods and conventional regression for predicting clinical deterioration on the wards. Crit Care Med. 2016;44(2):368-374. https://doi.org/10.1097/ccm.0000000000001571
- Bartkowiak B, Snyder AM, Benjamin A, et al. Validating the electronic cardiac arrest risk triage (eCART) score for risk stratification of surgical inpatients in the postoperative setting: retrospective cohort study. Ann Surg. 2019;269(6):1059-1063. https://doi.org/10.1097/sla.0000000000002665
- Edelson DP, Carey K, Winslow CJ, Churpek MM. Less is more: detecting clinical deterioration in the hospital with machine learning using only age, heart rate and respiratory rate. Abstract presented at: American Thoracic Society International Conference; May 22, 2018; San Diego, California. Am J Resp Crit Care Med. 2018;197:A4444.
- Escobar GJ, LaGuardia JC, Turk BJ, Ragins A, Kipnis P, Draper D. Early detection of impending physiologic deterioration among patients who are not in intensive care: development of predictive models using data from an automated electronic medical record. J Hosp Med. 2012;7(5):388-395. https:// doi.org/10.1002/jhm.1929
- Escobar GJ, Liu VX, Schuler A, Lawson B, Greene JD, Kipnis P. Automated identification of adults at risk for in-hospital clinical deterioration. N Engl J Med. 2020;383(20):1951-1960. https://doi.org/10.1056/nejmsa2001090
- Kipnis P, Turk BJ, Wulf DA, et al. Development and validation of an electronic medical record-based alert score for detection of inpatient deterioration outside the ICU. J Biomed Inform. 2016;64:10-19. https://doi.org/10.1016/j. jbi.2016.09.013
- Kollef MH, Chen Y, Heard K, et al. A randomized trial of real-time automated clinical deterioration alerts sent to a rapid response team. J Hosp Med. 2014;9(7):424-429. https://doi.org/10.1002/jhm.2193
- Hackmann G, Chen M, Chipara O, et al. Toward a two-tier clinical warning system for hospitalized patients. AMIA Annu Symp Proc. 2011;2011:511-519.
- Bailey TC, Chen Y, Mao Y, Lu, C, Hackmann G, Micek ST. A trial of a real-time alert for clinical deterioration in patients hospitalized on general medical wards. J Hosp Med. 2013;8(5):236-242. https://doi.org/10.1002/jhm.2009
- Kwon JM, Lee Y, Lee Y, Lee S, Park J. An algorithm based on deep learning for predicting in-hospital cardiac arrest. J Am Heart Assoc. 2018;7(13):e008678. https://doi.org/10.1161/jaha.118.008678
- Correia S, Gomes A, Shahriari S, Almeida JP, Severo M, Azevedo A. Performance of the early warning system vital to predict unanticipated higher-level of care admission and in-hospital death of ward patients. Value Health. 2018;21(S3):S360. https://doi.org/10.1016/j.jval.2018.09.2152
- Shamout FE, Zhu T, Sharma P, Watkinson PJ, Clifton DA. Deep interpretable early warning system for the detection of clinical deterioration. IEEE J Biomed Health Inform. 2020;24(2):437-446. https://doi.org/10.1109/ jbhi.2019.2937803
- Bai Y, Do DH, Harris PRE, et al. Integrating monitor alarms with laboratory test results to enhance patient deterioration prediction. J Biomed Inform. 2015;53:81-92. https://doi.org/10.1016/j.jbi.2014.09.006
- Hu X, Sapo M, Nenov V, et al. Predictive combinations of monitor alarms preceding in-hospital code blue events. J Biomed Inform. 2012;45(5):913-921. https://doi.org/10.1016/j.jbi.2012.03.001
- Evans RS, Kuttler KG, Simpson KJ, et al. Automated detection of physiologic deterioration in hospitalized patients. J Am Med Inform Assoc. 2015;22(2):350-360. https://doi.org/10.1136/amiajnl-2014-002816
- Ghosh E, Eshelman L, Yang L, Carlson E, Lord B. Early deterioration indicator: data-driven approach to detecting deterioration in general ward. Resuscitation. 2018;122:99-105. https://doi.org/10.1016/j.resuscitation. 2017.10.026
- Kang MA, Churpek MM, Zadravecz FJ, Adhikari R, Twu NM, Edelson DP: Real-time risk prediction on the wards: a feasibility study. Crit Care Med. 2016;44(8):1468-1473. https://doi.org/10.1097/ccm.0000000000001716
- Hu SB, Wong DJL, Correa A, Li N, Deng JC. Prediction of clinical deterioration in hospitalized adult patients with hematologic malignancies using a neural network model. PLoS One. 2016;11(8):e0161401. https://doi. org/10.1371/journal.pone.0161401
- Rothman MJ, Rothman SI, Beals J 4th. Development and validation of a continuous measure of patient condition using the electronic medical record. J Biomed Inform. 2013;46(5):837-848. https://doi.org/10.1016/j. jbi.2013.06.011
- Alaa AM, Yoon J, Hu S, van der Schaar M. Personalized risk scoring for critical care prognosis using mixtures of Gaussian processes. IEEE Trans Biomed Eng. 2018;65(1):207-218. https://doi.org/10.1109/tbme.2017.2698602
- Mohamadlou H, Panchavati S, Calvert J, et al. Multicenter validation of a machine-learning algorithm for 48-h all-cause mortality prediction. Health Informatics J. 2020;26(3):1912-1925. https://doi.org/10.1177/1460458219894494
- Alvarez CA, Clark CA, Zhang S, et al. Predicting out of intensive care unit cardiopulmonary arrest or death using electronic medical record data. BMC Med Inform Decis Mak. 2013;13:28. https://doi.org/10.1186/1472-6947-13-28
- Vincent JL, Einav S, Pearse R, et al. Improving detection of patient deterioration in the general hospital ward environment. Eur J Anaesthesiol. 2018;35(5):325-333. https://doi.org/10.1097/eja.0000000000000798
- Romero-Brufau S, Huddleston JM, Escobar GJ, Liebow M. Why the C-statistic is not informative to evaluate early warning scores and what metrics to use. Crit Care. 2015;19(1):285. https://doi.org/10.1186/s13054-015-0999-1
- Weenk M, Bredie SJ, Koeneman M, Hesselink G, van Goor H, van de Belt TH. Continuous monitoring of the vital signs in the general ward using wearable devices: randomized controlled trial. J Med Internet Res. 2020;22(6):e15471. https://doi.org/10.2196/15471
- Wellner B, Grand J, Canzone E, et al. Predicting unplanned transfers to the intensive care unit: a machine learning approach leveraging diverse clinical elements. JMIR Med Inform. 2017;5(4):e45. https://doi.org/10.2196/medinform.8680
- Elliott M, Baird J. Pulse oximetry and the enduring neglect of respiratory rate assessment: a commentary on patient surveillance. Br J Nurs. 2019;28(19):1256-1259. https://doi.org/10.12968/bjon.2019.28.19.1256
- Blackwell JN, Keim-Malpass J, Clark MT, et al. Early detection of in-patient deterioration: one prediction model does not fit all. Crit Care Explor. 2020;2(5):e0116. https://doi.org/10.1097/cce.0000000000000116
- Johnson AEW, Pollard TJ, Shen L, et al. MIMIC-III, a freely accessible critical care database. Sci Data. 2016;3:160035. https://doi.org/10.1038/sdata.2016.35
- Bodenheimer T, Sinsky C. From triple to quadruple aim: care of the patient requires care of the provider. Ann Fam Med. 2014;12(6):573-576. https://doi. org/10.1370/afm.1713
- Kirkland LL, Malinchoc M, O’Byrne M, et al. A clinical deterioration prediction tool for internal medicine patients. Am J Med Qual. 2013;28(2):135-142 https://doi.org/10.1177/1062860612450459
The early identification of clinical deterioration among adult hospitalized patients remains a challenge.1 Delayed identification is associated with increased morbidity and mortality, unplanned intensive care unit (ICU) admissions, prolonged hospitalization, and higher costs.2,3 Earlier detection of deterioration using predictive algorithms of vital sign monitoring might avoid these negative outcomes.4 In this scoping review, we summarize current algorithms and their evidence.
Vital signs provide the backbone for detecting clinical deterioration. Early warning scores (EWS) and outreach protocols were developed to bring structure to the assessment of vital signs. Most EWS claim to predict clinical end points such as unplanned ICU admission up to 24 hours in advance.5,6 Reviews of EWS showed a positive trend toward reduced length of stay and mortality. However, conclusions about general efficacy could not be generated because of case heterogeneity and methodologic shortcomings.4,7 Continuous automated vital sign monitoring of patients on the general ward can now be accomplished with wearable devices.8 The first reports on continuous monitoring showed earlier detection of deterioration but not improved clinical end points.4,9 Since then, different reports on continuous monitoring have shown positive effects but concluded that unprocessed monitoring data per se falls short of generating actionable alarms.4,10,11
Predictive algorithms, which often use artificial intelligence (AI), are increasingly employed to recognize complex patterns or abnormalities and support predictions of events in big data sets.12,13 Especially when combined with continuous vital sign monitoring, predictive algorithms have the potential to expedite detection of clinical deterioration and improve patient outcomes. Predictive algorithms using vital signs in the ICU have shown promising results.14 The impact of predictive algorithms on the general wards, however, is unclear.
The aims of our scoping review were to explore the extent and range of and evidence for predictive vital signs–based algorithms on the adult general ward; to describe the variety of these algorithms; and to categorize effects, facilitators, and barriers of their implementation.15
MATERIALS AND METHODS
We performed a scoping review to create a summary of the current state of research. We used the five-step method of Levac and followed the Preferred Reporting Items for Systematic reviews and Meta-Analyses Extension for Scoping Reviews guidelines (Appendix 1).16,17
PubMed, Embase, and CINAHL databases were searched for English-language articles written between January 1, 2010, and November 20, 2020. We developed the search queries with an experienced information scientist, and we used database-specific terms and strategies for input, clinical outcome, method, predictive capability, and population (Appendix 2). Additionally, we searched the references of the selected articles, as well as publications citing these articles.
All studies identified were screened by title and abstract by two researchers (RP and YE). The selected studies were read in their entirety and checked for eligibility using the following inclusion criteria: automated algorithm; vital signs-based; real-time prediction; of clinical deterioration; in an adult, general ward population. In cases where there were successive publications with the same algorithm and population, we selected the most recent study.
For screening and selection, we used the Rayyan QCRI online tool (Qatar Computing Research Institute) and Endnote X9 (Clarivate Analytics). We extracted information using a data extraction form and organized it into descriptive characteristics of the selected studies (Table 1): an input data table showing number of admissions, intermittent or continuous measurements, vital signs measured, laboratory results (Appendix Table 1), a table summarizing study designs and settings (Appendix Table 2), and a prediction performance table (Table 2). We report characteristics of the populations and algorithms, prediction specifications such as area under the receiver operating curve (AUROC), and predictive values. Predictive values are affected by prevalence, which may differ among populations. To compare the algorithms, we calculated an indexed positive predictive value (PPV) and a number needed to evaluate (NNE) using a weighted average prevalence of clinical deterioration of 3.0%.
We defined clinical deterioration as end points, including rapid response team activation, cardiopulmonary resuscitation, transfer to an ICU, or death.
Effects, facilitators, and barriers were identified and categorized using ATLAS.ti 8 software (ATLAS.ti) and evaluated by three researchers (RP, MK, and THvdB). These were categorized using the adapted frameworks of Gagnon et al18 for the barriers and facilitators and of Donabedian19 for the effects (Appendix 3).
The Gagnon et al framework was adapted by changing two of four domains—that is, “Individual” was changed to “Professional” and “Human” to “Physiology.” The domains of “Technology” and “Organization” remained unchanged. The Donabedian domains of “Outcome,” “Process,” and “Structure” also remained unchanged (Table 3).
We divided the studies into two groups: studies on predictive algorithms with and without AI when reporting on characteristics and performance. For the secondary aim of exploring implementation impact, we reported facilitators and barriers in a narrative way, highlighting the most frequent and notable findings.
RESULTS
As shown in the Figure, we found 1741 publications, of which we read the full-text of 109. There were 1632 publications that did not meet the inclusion criteria. The publications by Churpek et al,20,21 Bartkiowak et al,22 Edelson et al,23 Escobar et al,24,25 and Kipnis et al26 reported on the same algorithms or databases but had significantly different approaches. For multiple publications using the same algorithm and population, the most recent was named with inclusion of the earlier findings.20,21,27-29 The resulting 21 papers are included in this review.
Descriptive characteristics of the studies are summarized in Table 1. Nineteen of the publications were full papers and two were conference abstracts. Most of the studies (n = 18) were from the United States; there was one study from South Korea,30 one study from Portugal,31 and one study from the United Kingdom.32 In 15 of the studies, there was a strict focus on general or specific wards; 6 studies also included the ICU and/or emergency departments.
Two of the studies were clinical trials, 2 were prospective observational studies, and 17 were retrospective studies. Five studies reported on an active predictive model during admission. Of these, 3 reported that the model was clinically implemented, using the predictions in their clinical workflow. None of the implemented studies used AI.
All input variables are presented in Appendix Table 1.
The non-AI algorithm prediction horizons ranged from 4 to 24 hours, with a median of 24 hours (interquartile range [IQR], 12-24 hours). The AI algorithms ranged from 2 to 48 hours and had a median horizon of 14 hours (IQR, 12-24 hours).
We found three studies reporting patient outcomes. The most recent of these was a large multicenter implementation study by Escobar et al25 that included an extensive follow-up response. This study reported a significantly decreased 30-day mortality in the intervention cohort. A smaller randomized controlled trial reported no significant differences in patient outcomes with earlier warning alarms.27 A third study reported more appropriate rapid response team deployment and decreased mortality in a subgroup analysis.35
Effects, Facilitators, and Barriers
As shown in the Appendix Figure and further detailed in Table 3, the described effects were predominantly positive—57 positive effects vs 11 negative effects. These positive effects sorted primarily into the outcome and process domains.
All of the studies that compared their proposed model with one of various warning systems (eg, EWS, National Early Warning Score [NEWS], Modified Early Warning Score [MEWS]) showed superior performance (based on AUROC and reported predictive values). In 17 studies, the authors reported their model as more useful or superior to the EWS.20-23,26-28,34,36-41 Four studies reported real-time detection of deterioration before regular EWS,20,26,42 and three studies reported positive effects on patient-related outcomes.26,35 Four negative effects were noted on the controllability, validity, and potential limitations.27,42
Of the 38 remarks in the Technology domain, difficulty with implementation in daily practice was a commonly cited barrier.22,24,40,42 Difficulties included creating real-time data feeds out of the EMR, though there were mentions of some successful examples.25,27,36 Difficulty in the interpretability of AI was also considered a potential barrier.30,32,33,35,39,41 There were remarks as to the applicability of the prolonged prediction horizon because of the associated decoupling from the clinical view.39,42
Conservative attitudes toward new technologies and inadequate knowledge were mentioned as barriers.39 Repeated remarks were made on the difficulty of interpreting and responding to a predicted escalation, as the clinical pattern might not be recognizable at such an early stage. On the other hand, it is expected that less invasive countermeasures would be adequate to avert further escalation. Earlier recognition of possible escalations also raised potential ethical questions, such as when to discuss palliative care.24
The heterogeneity of the general ward population and the relatively low prevalence of deterioration were mentioned as barriers.24,30,38,41 There were also concerns that not all escalations are preventable and that some patient outcomes may not be modifiable.24,38
Many investigators expected reductions in false alarms and associated alarm fatigue (reflected as higher PPVs). Furthermore, they expected workflow to improve and workload to decrease.21,23,27,31,33,35,38,41 Despite the capacity of modern EMRs to store large amounts of patient data, some investigators felt improvements to real-time access, data quality and validity, and data density are needed to ensure valid associated predictions.21,22,24,32,37
DISCUSSION
As the complexity and comorbidity of hospitalized adults grow, predicting clinical deterioration is becoming more important. With an ever-increasing amount of available
There are several important limitations across these studies. In a clinical setting, these models would function as a screening test. Almost all studies report an AUROC; however, sensitivity and PPV or NNE (defined as 1/PPV) may be more useful than AUROC when predicting low-frequency events with high-potential clinical impact.44 Assessing the NNE is especially relevant because of its relation to alarm fatigue and responsiveness of clinicians.43 Alarm fatigue and lack of adequate response to alarms were repeatedly cited as potential barriers for application of automated scores.
Although the results of our scoping review are promising, there are limited data on clinical outcomes using these algorithms. Only three of five algorithms were used to guide clinical decision-making.25,27,35 Kollef et al27 showed shorter hospitalizations and Evans et al35 found decreased mortality rates in a multimorbid subgroup. Escobar et al25 found an overall and consistent decrease in mortality in a large, heterogenic population of inpatients across 21 hospitals. While Escobar et al’s findings provide strong evidence that predictive algorithms and structured follow-up on alarms can improve patient outcomes, it recognizes that not all facilities will have the resources to implement them.25 Dedicated round-the-clock follow-up of alarms has yet to be proven feasible for smaller institutions, and leaner solutions must be explored. The example set by Escobar et al25 should be translated into various settings to prove its reproducibility and to substantiate the clinical impact of predictive models and structured follow-up.
According to expert opinion, the use of high-frequency or continuous monitoring at low-acuity wards and AI algorithms to detect trends and patterns will reduce failure-to-rescue rates.4,9,43 However, most studies in our review focused on periodic spot-checked vital signs, and none of the AI algorithms were implemented in clinical care (Appendix Table 1
STRENGTHS AND LIMITATIONS
We performed a comprehensive review of the current literature using a clear and reproducible methodology to minimize the risk of missing relevant publications. The identified research is mainly limited to large US centers and consists of mostly retrospective studies. Heterogeneity among inputs, endpoints, time horizons, and evaluation metrics make comparisons challenging. Comments on facilitators, barriers, and effects were limited.
RECOMMENDATIONS FOR FUTURE RESEARCH
Artificial intelligence and the use of continuous monitoring hold great promise in creating optimal predictive algorithms. Future studies should directly compare AI- and non-AI-based algorithms using continuous monitoring to determine predictive accuracy, feasibility, costs, and outcomes. A consensus on endpoint definitions, input variables, methodology, and reporting is needed to enhance reproducibility, comparability, and generalizability of future research.
CONCLUSION
The early identification of clinical deterioration among adult hospitalized patients remains a challenge.1 Delayed identification is associated with increased morbidity and mortality, unplanned intensive care unit (ICU) admissions, prolonged hospitalization, and higher costs.2,3 Earlier detection of deterioration using predictive algorithms of vital sign monitoring might avoid these negative outcomes.4 In this scoping review, we summarize current algorithms and their evidence.
Vital signs provide the backbone for detecting clinical deterioration. Early warning scores (EWS) and outreach protocols were developed to bring structure to the assessment of vital signs. Most EWS claim to predict clinical end points such as unplanned ICU admission up to 24 hours in advance.5,6 Reviews of EWS showed a positive trend toward reduced length of stay and mortality. However, conclusions about general efficacy could not be generated because of case heterogeneity and methodologic shortcomings.4,7 Continuous automated vital sign monitoring of patients on the general ward can now be accomplished with wearable devices.8 The first reports on continuous monitoring showed earlier detection of deterioration but not improved clinical end points.4,9 Since then, different reports on continuous monitoring have shown positive effects but concluded that unprocessed monitoring data per se falls short of generating actionable alarms.4,10,11
Predictive algorithms, which often use artificial intelligence (AI), are increasingly employed to recognize complex patterns or abnormalities and support predictions of events in big data sets.12,13 Especially when combined with continuous vital sign monitoring, predictive algorithms have the potential to expedite detection of clinical deterioration and improve patient outcomes. Predictive algorithms using vital signs in the ICU have shown promising results.14 The impact of predictive algorithms on the general wards, however, is unclear.
The aims of our scoping review were to explore the extent and range of and evidence for predictive vital signs–based algorithms on the adult general ward; to describe the variety of these algorithms; and to categorize effects, facilitators, and barriers of their implementation.15
MATERIALS AND METHODS
We performed a scoping review to create a summary of the current state of research. We used the five-step method of Levac and followed the Preferred Reporting Items for Systematic reviews and Meta-Analyses Extension for Scoping Reviews guidelines (Appendix 1).16,17
PubMed, Embase, and CINAHL databases were searched for English-language articles written between January 1, 2010, and November 20, 2020. We developed the search queries with an experienced information scientist, and we used database-specific terms and strategies for input, clinical outcome, method, predictive capability, and population (Appendix 2). Additionally, we searched the references of the selected articles, as well as publications citing these articles.
All studies identified were screened by title and abstract by two researchers (RP and YE). The selected studies were read in their entirety and checked for eligibility using the following inclusion criteria: automated algorithm; vital signs-based; real-time prediction; of clinical deterioration; in an adult, general ward population. In cases where there were successive publications with the same algorithm and population, we selected the most recent study.
For screening and selection, we used the Rayyan QCRI online tool (Qatar Computing Research Institute) and Endnote X9 (Clarivate Analytics). We extracted information using a data extraction form and organized it into descriptive characteristics of the selected studies (Table 1): an input data table showing number of admissions, intermittent or continuous measurements, vital signs measured, laboratory results (Appendix Table 1), a table summarizing study designs and settings (Appendix Table 2), and a prediction performance table (Table 2). We report characteristics of the populations and algorithms, prediction specifications such as area under the receiver operating curve (AUROC), and predictive values. Predictive values are affected by prevalence, which may differ among populations. To compare the algorithms, we calculated an indexed positive predictive value (PPV) and a number needed to evaluate (NNE) using a weighted average prevalence of clinical deterioration of 3.0%.
We defined clinical deterioration as end points, including rapid response team activation, cardiopulmonary resuscitation, transfer to an ICU, or death.
Effects, facilitators, and barriers were identified and categorized using ATLAS.ti 8 software (ATLAS.ti) and evaluated by three researchers (RP, MK, and THvdB). These were categorized using the adapted frameworks of Gagnon et al18 for the barriers and facilitators and of Donabedian19 for the effects (Appendix 3).
The Gagnon et al framework was adapted by changing two of four domains—that is, “Individual” was changed to “Professional” and “Human” to “Physiology.” The domains of “Technology” and “Organization” remained unchanged. The Donabedian domains of “Outcome,” “Process,” and “Structure” also remained unchanged (Table 3).
We divided the studies into two groups: studies on predictive algorithms with and without AI when reporting on characteristics and performance. For the secondary aim of exploring implementation impact, we reported facilitators and barriers in a narrative way, highlighting the most frequent and notable findings.
RESULTS
As shown in the Figure, we found 1741 publications, of which we read the full-text of 109. There were 1632 publications that did not meet the inclusion criteria. The publications by Churpek et al,20,21 Bartkiowak et al,22 Edelson et al,23 Escobar et al,24,25 and Kipnis et al26 reported on the same algorithms or databases but had significantly different approaches. For multiple publications using the same algorithm and population, the most recent was named with inclusion of the earlier findings.20,21,27-29 The resulting 21 papers are included in this review.
Descriptive characteristics of the studies are summarized in Table 1. Nineteen of the publications were full papers and two were conference abstracts. Most of the studies (n = 18) were from the United States; there was one study from South Korea,30 one study from Portugal,31 and one study from the United Kingdom.32 In 15 of the studies, there was a strict focus on general or specific wards; 6 studies also included the ICU and/or emergency departments.
Two of the studies were clinical trials, 2 were prospective observational studies, and 17 were retrospective studies. Five studies reported on an active predictive model during admission. Of these, 3 reported that the model was clinically implemented, using the predictions in their clinical workflow. None of the implemented studies used AI.
All input variables are presented in Appendix Table 1.
The non-AI algorithm prediction horizons ranged from 4 to 24 hours, with a median of 24 hours (interquartile range [IQR], 12-24 hours). The AI algorithms ranged from 2 to 48 hours and had a median horizon of 14 hours (IQR, 12-24 hours).
We found three studies reporting patient outcomes. The most recent of these was a large multicenter implementation study by Escobar et al25 that included an extensive follow-up response. This study reported a significantly decreased 30-day mortality in the intervention cohort. A smaller randomized controlled trial reported no significant differences in patient outcomes with earlier warning alarms.27 A third study reported more appropriate rapid response team deployment and decreased mortality in a subgroup analysis.35
Effects, Facilitators, and Barriers
As shown in the Appendix Figure and further detailed in Table 3, the described effects were predominantly positive—57 positive effects vs 11 negative effects. These positive effects sorted primarily into the outcome and process domains.
All of the studies that compared their proposed model with one of various warning systems (eg, EWS, National Early Warning Score [NEWS], Modified Early Warning Score [MEWS]) showed superior performance (based on AUROC and reported predictive values). In 17 studies, the authors reported their model as more useful or superior to the EWS.20-23,26-28,34,36-41 Four studies reported real-time detection of deterioration before regular EWS,20,26,42 and three studies reported positive effects on patient-related outcomes.26,35 Four negative effects were noted on the controllability, validity, and potential limitations.27,42
Of the 38 remarks in the Technology domain, difficulty with implementation in daily practice was a commonly cited barrier.22,24,40,42 Difficulties included creating real-time data feeds out of the EMR, though there were mentions of some successful examples.25,27,36 Difficulty in the interpretability of AI was also considered a potential barrier.30,32,33,35,39,41 There were remarks as to the applicability of the prolonged prediction horizon because of the associated decoupling from the clinical view.39,42
Conservative attitudes toward new technologies and inadequate knowledge were mentioned as barriers.39 Repeated remarks were made on the difficulty of interpreting and responding to a predicted escalation, as the clinical pattern might not be recognizable at such an early stage. On the other hand, it is expected that less invasive countermeasures would be adequate to avert further escalation. Earlier recognition of possible escalations also raised potential ethical questions, such as when to discuss palliative care.24
The heterogeneity of the general ward population and the relatively low prevalence of deterioration were mentioned as barriers.24,30,38,41 There were also concerns that not all escalations are preventable and that some patient outcomes may not be modifiable.24,38
Many investigators expected reductions in false alarms and associated alarm fatigue (reflected as higher PPVs). Furthermore, they expected workflow to improve and workload to decrease.21,23,27,31,33,35,38,41 Despite the capacity of modern EMRs to store large amounts of patient data, some investigators felt improvements to real-time access, data quality and validity, and data density are needed to ensure valid associated predictions.21,22,24,32,37
DISCUSSION
As the complexity and comorbidity of hospitalized adults grow, predicting clinical deterioration is becoming more important. With an ever-increasing amount of available
There are several important limitations across these studies. In a clinical setting, these models would function as a screening test. Almost all studies report an AUROC; however, sensitivity and PPV or NNE (defined as 1/PPV) may be more useful than AUROC when predicting low-frequency events with high-potential clinical impact.44 Assessing the NNE is especially relevant because of its relation to alarm fatigue and responsiveness of clinicians.43 Alarm fatigue and lack of adequate response to alarms were repeatedly cited as potential barriers for application of automated scores.
Although the results of our scoping review are promising, there are limited data on clinical outcomes using these algorithms. Only three of five algorithms were used to guide clinical decision-making.25,27,35 Kollef et al27 showed shorter hospitalizations and Evans et al35 found decreased mortality rates in a multimorbid subgroup. Escobar et al25 found an overall and consistent decrease in mortality in a large, heterogenic population of inpatients across 21 hospitals. While Escobar et al’s findings provide strong evidence that predictive algorithms and structured follow-up on alarms can improve patient outcomes, it recognizes that not all facilities will have the resources to implement them.25 Dedicated round-the-clock follow-up of alarms has yet to be proven feasible for smaller institutions, and leaner solutions must be explored. The example set by Escobar et al25 should be translated into various settings to prove its reproducibility and to substantiate the clinical impact of predictive models and structured follow-up.
According to expert opinion, the use of high-frequency or continuous monitoring at low-acuity wards and AI algorithms to detect trends and patterns will reduce failure-to-rescue rates.4,9,43 However, most studies in our review focused on periodic spot-checked vital signs, and none of the AI algorithms were implemented in clinical care (Appendix Table 1
STRENGTHS AND LIMITATIONS
We performed a comprehensive review of the current literature using a clear and reproducible methodology to minimize the risk of missing relevant publications. The identified research is mainly limited to large US centers and consists of mostly retrospective studies. Heterogeneity among inputs, endpoints, time horizons, and evaluation metrics make comparisons challenging. Comments on facilitators, barriers, and effects were limited.
RECOMMENDATIONS FOR FUTURE RESEARCH
Artificial intelligence and the use of continuous monitoring hold great promise in creating optimal predictive algorithms. Future studies should directly compare AI- and non-AI-based algorithms using continuous monitoring to determine predictive accuracy, feasibility, costs, and outcomes. A consensus on endpoint definitions, input variables, methodology, and reporting is needed to enhance reproducibility, comparability, and generalizability of future research.
CONCLUSION
- van Galen LS, Struik PW, Driesen BEJM, et al. Delayed recognition of deterioration of patients in general wards is mostly caused by human related monitoring failures: a root cause analysis of unplanned ICU admissions. PLoS One. 2016;11(8):e0161393. https://doi.org/10.1371/journal. pone.0161393
- Mardini L, Lipes J, Jayaraman D. Adverse outcomes associated with delayed intensive care consultation in medical and surgical inpatients. J Crit Care. 2012;27(6):688-693. https://doi.org/10.1016/j.jcrc.2012.04.011
- Young MP, Gooder VJ, McBride K, James B, Fisher ES. Inpatient transfers to the intensive care unit: delays are associated with increased mortality and morbidity. J Gen Intern Med. 2003;18(2):77-83. https://doi.org/10.1046/ j.1525-1497.2003.20441.x
- Khanna AK, Hoppe P, Saugel B. Automated continuous noninvasive ward monitoring: future directions and challenges. Crit Care. 2019;23(1):194. https://doi.org/10.1186/s13054-019-2485-7
- Ludikhuize J, Hamming A, de Jonge E, Fikkers BG. Rapid response systems in The Netherlands. Jt Comm J Qual Patient Saf. 2011;37(3):138-197. https:// doi.org/10.1016/s1553-7250(11)37017-1
- Cuthbertson BH, Boroujerdi M, McKie L, Aucott L, Prescott G. Can physiological variables and early warning scoring systems allow early recognition of the deteriorating surgical patient? Crit Care Med. 2007;35(2):402-409. https://doi.org/10.1097/01.ccm.0000254826.10520.87
- Alam N, Hobbelink EL, van Tienhoven AJ, van de Ven PM, Jansma EP, Nanayakkara PWB. The impact of the use of the Early Warning Score (EWS) on patient outcomes: a systematic review. Resuscitation. 2014;85(5):587-594. https://doi.org/10.1016/j.resuscitation.2014.01.013
- Weenk M, Koeneman M, van de Belt TH, Engelen LJLPG, van Goor H, Bredie SJH. Wireless and continuous monitoring of vital signs in patients at the general ward. Resuscitation. 2019;136:47-53. https://doi.org/10.1016/j.resuscitation.2019.01.017
- Cardona-Morrell M, Prgomet M, Turner RM, Nicholson M, Hillman K. Effectiveness of continuous or intermittent vital signs monitoring in preventing adverse events on general wards: a systematic review and meta-analysis. Int J Clin Pract. 2016;70(10):806-824. https://doi.org/10.1111/ijcp.12846
- Brown H, Terrence J, Vasquez P, Bates DW, Zimlichman E. Continuous monitoring in an inpatient medical-surgical unit: a controlled clinical trial. Am J Med. 2014;127(3):226-232. https://doi.org/10.1016/j.amjmed.2013.12.004
- Mestrom E, De Bie A, van de Steeg M, Driessen M, Atallah L, Bezemer R. Implementation of an automated early warning scoring system in a E8 Journal of Hospital Medicine® Published Online June 2021 An Official Publication of the Society of Hospital Medicine Peelen et al | Predicting Deterioration: A Scoping Review surgical ward: practical use and effects on patient outcomes. PLoS One. 2019;14(5):e0213402. https://doi.org/10.1371/journal.pone.0213402
- Jiang F, Jiang Y, Zhi H, et al. Artificial intelligence in healthcare: past, present and future. Stroke Vasc Neurol. 2017;2(4):230-243. https://doi.org/10.1136/ svn-2017-000101
- Iwashyna TJ, Liu V. What’s so different about big data? A primer for clinicians trained to think epidemiologically. Ann Am Thorac Soc. 2014;11(7):1130- 1135. https://doi.org/10.1513/annalsats.201405-185as
- Jalali A, Bender D, Rehman M, Nadkanri V, Nataraj C. Advanced analytics for outcome prediction in intensive care units. Conf Proc IEEE Eng Med Biol Soc. 2016;2016:2520-2524. https://doi.org/10.1109/embc.2016.7591243
- Munn Z, Peters MDJ, Stern C, Tufanaru C, McArthur A, Aromataris E. Systematic review or scoping review? Guidance for authors when choosing between a systematic or scoping review approach. BMC Med Res Methodol. 2018;18(1):143. https://doi.org/10.1186/s12874-018-0611-x
- Arksey H, O’Malley L. Scoping studies: towards a methodological framework. Int J Soc Res Methodol. 2005;8(1):19-32. https://doi.org/10.1080/13645 57032000119616
- Tricco AC, Lillie E, Zarin W, et al. PRISMA extension for scoping reviews (PRISMAScR): checklist and explanation. Ann Intern Med. 2018;169(7):467- 473. https://doi.org/10.7326/m18-0850
- Gagnon MP, Desmartis M, Gagnon J, et al. Framework for user involvement in health technology assessment at the local level: views of health managers, user representatives, and clinicians. Int J Technol Assess Health Care. 2015;31(1-2):68-77. https://doi.org/10.1017/s0266462315000070
- Donabedian A. The quality of care. How can it be assessed? JAMA. 1988;260(12):1743-1748. https://doi.org/10.1001/jama.260.12.1743
- Churpek MM, Yuen TC, Winslow C, et al. Multicenter development and validation of a risk stratification tool for ward patients. Am J Respir Crit Care Med. 2014;190(6):649-655. https://doi.org/10.1164/rccm.201406-1022oc
- Churpek MM, Yuen TC, Winslow C, Meltzer DO, Kattan MW, Edelson DP. Multicenter comparison of machine learning methods and conventional regression for predicting clinical deterioration on the wards. Crit Care Med. 2016;44(2):368-374. https://doi.org/10.1097/ccm.0000000000001571
- Bartkowiak B, Snyder AM, Benjamin A, et al. Validating the electronic cardiac arrest risk triage (eCART) score for risk stratification of surgical inpatients in the postoperative setting: retrospective cohort study. Ann Surg. 2019;269(6):1059-1063. https://doi.org/10.1097/sla.0000000000002665
- Edelson DP, Carey K, Winslow CJ, Churpek MM. Less is more: detecting clinical deterioration in the hospital with machine learning using only age, heart rate and respiratory rate. Abstract presented at: American Thoracic Society International Conference; May 22, 2018; San Diego, California. Am J Resp Crit Care Med. 2018;197:A4444.
- Escobar GJ, LaGuardia JC, Turk BJ, Ragins A, Kipnis P, Draper D. Early detection of impending physiologic deterioration among patients who are not in intensive care: development of predictive models using data from an automated electronic medical record. J Hosp Med. 2012;7(5):388-395. https:// doi.org/10.1002/jhm.1929
- Escobar GJ, Liu VX, Schuler A, Lawson B, Greene JD, Kipnis P. Automated identification of adults at risk for in-hospital clinical deterioration. N Engl J Med. 2020;383(20):1951-1960. https://doi.org/10.1056/nejmsa2001090
- Kipnis P, Turk BJ, Wulf DA, et al. Development and validation of an electronic medical record-based alert score for detection of inpatient deterioration outside the ICU. J Biomed Inform. 2016;64:10-19. https://doi.org/10.1016/j. jbi.2016.09.013
- Kollef MH, Chen Y, Heard K, et al. A randomized trial of real-time automated clinical deterioration alerts sent to a rapid response team. J Hosp Med. 2014;9(7):424-429. https://doi.org/10.1002/jhm.2193
- Hackmann G, Chen M, Chipara O, et al. Toward a two-tier clinical warning system for hospitalized patients. AMIA Annu Symp Proc. 2011;2011:511-519.
- Bailey TC, Chen Y, Mao Y, Lu, C, Hackmann G, Micek ST. A trial of a real-time alert for clinical deterioration in patients hospitalized on general medical wards. J Hosp Med. 2013;8(5):236-242. https://doi.org/10.1002/jhm.2009
- Kwon JM, Lee Y, Lee Y, Lee S, Park J. An algorithm based on deep learning for predicting in-hospital cardiac arrest. J Am Heart Assoc. 2018;7(13):e008678. https://doi.org/10.1161/jaha.118.008678
- Correia S, Gomes A, Shahriari S, Almeida JP, Severo M, Azevedo A. Performance of the early warning system vital to predict unanticipated higher-level of care admission and in-hospital death of ward patients. Value Health. 2018;21(S3):S360. https://doi.org/10.1016/j.jval.2018.09.2152
- Shamout FE, Zhu T, Sharma P, Watkinson PJ, Clifton DA. Deep interpretable early warning system for the detection of clinical deterioration. IEEE J Biomed Health Inform. 2020;24(2):437-446. https://doi.org/10.1109/ jbhi.2019.2937803
- Bai Y, Do DH, Harris PRE, et al. Integrating monitor alarms with laboratory test results to enhance patient deterioration prediction. J Biomed Inform. 2015;53:81-92. https://doi.org/10.1016/j.jbi.2014.09.006
- Hu X, Sapo M, Nenov V, et al. Predictive combinations of monitor alarms preceding in-hospital code blue events. J Biomed Inform. 2012;45(5):913-921. https://doi.org/10.1016/j.jbi.2012.03.001
- Evans RS, Kuttler KG, Simpson KJ, et al. Automated detection of physiologic deterioration in hospitalized patients. J Am Med Inform Assoc. 2015;22(2):350-360. https://doi.org/10.1136/amiajnl-2014-002816
- Ghosh E, Eshelman L, Yang L, Carlson E, Lord B. Early deterioration indicator: data-driven approach to detecting deterioration in general ward. Resuscitation. 2018;122:99-105. https://doi.org/10.1016/j.resuscitation. 2017.10.026
- Kang MA, Churpek MM, Zadravecz FJ, Adhikari R, Twu NM, Edelson DP: Real-time risk prediction on the wards: a feasibility study. Crit Care Med. 2016;44(8):1468-1473. https://doi.org/10.1097/ccm.0000000000001716
- Hu SB, Wong DJL, Correa A, Li N, Deng JC. Prediction of clinical deterioration in hospitalized adult patients with hematologic malignancies using a neural network model. PLoS One. 2016;11(8):e0161401. https://doi. org/10.1371/journal.pone.0161401
- Rothman MJ, Rothman SI, Beals J 4th. Development and validation of a continuous measure of patient condition using the electronic medical record. J Biomed Inform. 2013;46(5):837-848. https://doi.org/10.1016/j. jbi.2013.06.011
- Alaa AM, Yoon J, Hu S, van der Schaar M. Personalized risk scoring for critical care prognosis using mixtures of Gaussian processes. IEEE Trans Biomed Eng. 2018;65(1):207-218. https://doi.org/10.1109/tbme.2017.2698602
- Mohamadlou H, Panchavati S, Calvert J, et al. Multicenter validation of a machine-learning algorithm for 48-h all-cause mortality prediction. Health Informatics J. 2020;26(3):1912-1925. https://doi.org/10.1177/1460458219894494
- Alvarez CA, Clark CA, Zhang S, et al. Predicting out of intensive care unit cardiopulmonary arrest or death using electronic medical record data. BMC Med Inform Decis Mak. 2013;13:28. https://doi.org/10.1186/1472-6947-13-28
- Vincent JL, Einav S, Pearse R, et al. Improving detection of patient deterioration in the general hospital ward environment. Eur J Anaesthesiol. 2018;35(5):325-333. https://doi.org/10.1097/eja.0000000000000798
- Romero-Brufau S, Huddleston JM, Escobar GJ, Liebow M. Why the C-statistic is not informative to evaluate early warning scores and what metrics to use. Crit Care. 2015;19(1):285. https://doi.org/10.1186/s13054-015-0999-1
- Weenk M, Bredie SJ, Koeneman M, Hesselink G, van Goor H, van de Belt TH. Continuous monitoring of the vital signs in the general ward using wearable devices: randomized controlled trial. J Med Internet Res. 2020;22(6):e15471. https://doi.org/10.2196/15471
- Wellner B, Grand J, Canzone E, et al. Predicting unplanned transfers to the intensive care unit: a machine learning approach leveraging diverse clinical elements. JMIR Med Inform. 2017;5(4):e45. https://doi.org/10.2196/medinform.8680
- Elliott M, Baird J. Pulse oximetry and the enduring neglect of respiratory rate assessment: a commentary on patient surveillance. Br J Nurs. 2019;28(19):1256-1259. https://doi.org/10.12968/bjon.2019.28.19.1256
- Blackwell JN, Keim-Malpass J, Clark MT, et al. Early detection of in-patient deterioration: one prediction model does not fit all. Crit Care Explor. 2020;2(5):e0116. https://doi.org/10.1097/cce.0000000000000116
- Johnson AEW, Pollard TJ, Shen L, et al. MIMIC-III, a freely accessible critical care database. Sci Data. 2016;3:160035. https://doi.org/10.1038/sdata.2016.35
- Bodenheimer T, Sinsky C. From triple to quadruple aim: care of the patient requires care of the provider. Ann Fam Med. 2014;12(6):573-576. https://doi. org/10.1370/afm.1713
- Kirkland LL, Malinchoc M, O’Byrne M, et al. A clinical deterioration prediction tool for internal medicine patients. Am J Med Qual. 2013;28(2):135-142 https://doi.org/10.1177/1062860612450459
- van Galen LS, Struik PW, Driesen BEJM, et al. Delayed recognition of deterioration of patients in general wards is mostly caused by human related monitoring failures: a root cause analysis of unplanned ICU admissions. PLoS One. 2016;11(8):e0161393. https://doi.org/10.1371/journal. pone.0161393
- Mardini L, Lipes J, Jayaraman D. Adverse outcomes associated with delayed intensive care consultation in medical and surgical inpatients. J Crit Care. 2012;27(6):688-693. https://doi.org/10.1016/j.jcrc.2012.04.011
- Young MP, Gooder VJ, McBride K, James B, Fisher ES. Inpatient transfers to the intensive care unit: delays are associated with increased mortality and morbidity. J Gen Intern Med. 2003;18(2):77-83. https://doi.org/10.1046/ j.1525-1497.2003.20441.x
- Khanna AK, Hoppe P, Saugel B. Automated continuous noninvasive ward monitoring: future directions and challenges. Crit Care. 2019;23(1):194. https://doi.org/10.1186/s13054-019-2485-7
- Ludikhuize J, Hamming A, de Jonge E, Fikkers BG. Rapid response systems in The Netherlands. Jt Comm J Qual Patient Saf. 2011;37(3):138-197. https:// doi.org/10.1016/s1553-7250(11)37017-1
- Cuthbertson BH, Boroujerdi M, McKie L, Aucott L, Prescott G. Can physiological variables and early warning scoring systems allow early recognition of the deteriorating surgical patient? Crit Care Med. 2007;35(2):402-409. https://doi.org/10.1097/01.ccm.0000254826.10520.87
- Alam N, Hobbelink EL, van Tienhoven AJ, van de Ven PM, Jansma EP, Nanayakkara PWB. The impact of the use of the Early Warning Score (EWS) on patient outcomes: a systematic review. Resuscitation. 2014;85(5):587-594. https://doi.org/10.1016/j.resuscitation.2014.01.013
- Weenk M, Koeneman M, van de Belt TH, Engelen LJLPG, van Goor H, Bredie SJH. Wireless and continuous monitoring of vital signs in patients at the general ward. Resuscitation. 2019;136:47-53. https://doi.org/10.1016/j.resuscitation.2019.01.017
- Cardona-Morrell M, Prgomet M, Turner RM, Nicholson M, Hillman K. Effectiveness of continuous or intermittent vital signs monitoring in preventing adverse events on general wards: a systematic review and meta-analysis. Int J Clin Pract. 2016;70(10):806-824. https://doi.org/10.1111/ijcp.12846
- Brown H, Terrence J, Vasquez P, Bates DW, Zimlichman E. Continuous monitoring in an inpatient medical-surgical unit: a controlled clinical trial. Am J Med. 2014;127(3):226-232. https://doi.org/10.1016/j.amjmed.2013.12.004
- Mestrom E, De Bie A, van de Steeg M, Driessen M, Atallah L, Bezemer R. Implementation of an automated early warning scoring system in a E8 Journal of Hospital Medicine® Published Online June 2021 An Official Publication of the Society of Hospital Medicine Peelen et al | Predicting Deterioration: A Scoping Review surgical ward: practical use and effects on patient outcomes. PLoS One. 2019;14(5):e0213402. https://doi.org/10.1371/journal.pone.0213402
- Jiang F, Jiang Y, Zhi H, et al. Artificial intelligence in healthcare: past, present and future. Stroke Vasc Neurol. 2017;2(4):230-243. https://doi.org/10.1136/ svn-2017-000101
- Iwashyna TJ, Liu V. What’s so different about big data? A primer for clinicians trained to think epidemiologically. Ann Am Thorac Soc. 2014;11(7):1130- 1135. https://doi.org/10.1513/annalsats.201405-185as
- Jalali A, Bender D, Rehman M, Nadkanri V, Nataraj C. Advanced analytics for outcome prediction in intensive care units. Conf Proc IEEE Eng Med Biol Soc. 2016;2016:2520-2524. https://doi.org/10.1109/embc.2016.7591243
- Munn Z, Peters MDJ, Stern C, Tufanaru C, McArthur A, Aromataris E. Systematic review or scoping review? Guidance for authors when choosing between a systematic or scoping review approach. BMC Med Res Methodol. 2018;18(1):143. https://doi.org/10.1186/s12874-018-0611-x
- Arksey H, O’Malley L. Scoping studies: towards a methodological framework. Int J Soc Res Methodol. 2005;8(1):19-32. https://doi.org/10.1080/13645 57032000119616
- Tricco AC, Lillie E, Zarin W, et al. PRISMA extension for scoping reviews (PRISMAScR): checklist and explanation. Ann Intern Med. 2018;169(7):467- 473. https://doi.org/10.7326/m18-0850
- Gagnon MP, Desmartis M, Gagnon J, et al. Framework for user involvement in health technology assessment at the local level: views of health managers, user representatives, and clinicians. Int J Technol Assess Health Care. 2015;31(1-2):68-77. https://doi.org/10.1017/s0266462315000070
- Donabedian A. The quality of care. How can it be assessed? JAMA. 1988;260(12):1743-1748. https://doi.org/10.1001/jama.260.12.1743
- Churpek MM, Yuen TC, Winslow C, et al. Multicenter development and validation of a risk stratification tool for ward patients. Am J Respir Crit Care Med. 2014;190(6):649-655. https://doi.org/10.1164/rccm.201406-1022oc
- Churpek MM, Yuen TC, Winslow C, Meltzer DO, Kattan MW, Edelson DP. Multicenter comparison of machine learning methods and conventional regression for predicting clinical deterioration on the wards. Crit Care Med. 2016;44(2):368-374. https://doi.org/10.1097/ccm.0000000000001571
- Bartkowiak B, Snyder AM, Benjamin A, et al. Validating the electronic cardiac arrest risk triage (eCART) score for risk stratification of surgical inpatients in the postoperative setting: retrospective cohort study. Ann Surg. 2019;269(6):1059-1063. https://doi.org/10.1097/sla.0000000000002665
- Edelson DP, Carey K, Winslow CJ, Churpek MM. Less is more: detecting clinical deterioration in the hospital with machine learning using only age, heart rate and respiratory rate. Abstract presented at: American Thoracic Society International Conference; May 22, 2018; San Diego, California. Am J Resp Crit Care Med. 2018;197:A4444.
- Escobar GJ, LaGuardia JC, Turk BJ, Ragins A, Kipnis P, Draper D. Early detection of impending physiologic deterioration among patients who are not in intensive care: development of predictive models using data from an automated electronic medical record. J Hosp Med. 2012;7(5):388-395. https:// doi.org/10.1002/jhm.1929
- Escobar GJ, Liu VX, Schuler A, Lawson B, Greene JD, Kipnis P. Automated identification of adults at risk for in-hospital clinical deterioration. N Engl J Med. 2020;383(20):1951-1960. https://doi.org/10.1056/nejmsa2001090
- Kipnis P, Turk BJ, Wulf DA, et al. Development and validation of an electronic medical record-based alert score for detection of inpatient deterioration outside the ICU. J Biomed Inform. 2016;64:10-19. https://doi.org/10.1016/j. jbi.2016.09.013
- Kollef MH, Chen Y, Heard K, et al. A randomized trial of real-time automated clinical deterioration alerts sent to a rapid response team. J Hosp Med. 2014;9(7):424-429. https://doi.org/10.1002/jhm.2193
- Hackmann G, Chen M, Chipara O, et al. Toward a two-tier clinical warning system for hospitalized patients. AMIA Annu Symp Proc. 2011;2011:511-519.
- Bailey TC, Chen Y, Mao Y, Lu, C, Hackmann G, Micek ST. A trial of a real-time alert for clinical deterioration in patients hospitalized on general medical wards. J Hosp Med. 2013;8(5):236-242. https://doi.org/10.1002/jhm.2009
- Kwon JM, Lee Y, Lee Y, Lee S, Park J. An algorithm based on deep learning for predicting in-hospital cardiac arrest. J Am Heart Assoc. 2018;7(13):e008678. https://doi.org/10.1161/jaha.118.008678
- Correia S, Gomes A, Shahriari S, Almeida JP, Severo M, Azevedo A. Performance of the early warning system vital to predict unanticipated higher-level of care admission and in-hospital death of ward patients. Value Health. 2018;21(S3):S360. https://doi.org/10.1016/j.jval.2018.09.2152
- Shamout FE, Zhu T, Sharma P, Watkinson PJ, Clifton DA. Deep interpretable early warning system for the detection of clinical deterioration. IEEE J Biomed Health Inform. 2020;24(2):437-446. https://doi.org/10.1109/ jbhi.2019.2937803
- Bai Y, Do DH, Harris PRE, et al. Integrating monitor alarms with laboratory test results to enhance patient deterioration prediction. J Biomed Inform. 2015;53:81-92. https://doi.org/10.1016/j.jbi.2014.09.006
- Hu X, Sapo M, Nenov V, et al. Predictive combinations of monitor alarms preceding in-hospital code blue events. J Biomed Inform. 2012;45(5):913-921. https://doi.org/10.1016/j.jbi.2012.03.001
- Evans RS, Kuttler KG, Simpson KJ, et al. Automated detection of physiologic deterioration in hospitalized patients. J Am Med Inform Assoc. 2015;22(2):350-360. https://doi.org/10.1136/amiajnl-2014-002816
- Ghosh E, Eshelman L, Yang L, Carlson E, Lord B. Early deterioration indicator: data-driven approach to detecting deterioration in general ward. Resuscitation. 2018;122:99-105. https://doi.org/10.1016/j.resuscitation. 2017.10.026
- Kang MA, Churpek MM, Zadravecz FJ, Adhikari R, Twu NM, Edelson DP: Real-time risk prediction on the wards: a feasibility study. Crit Care Med. 2016;44(8):1468-1473. https://doi.org/10.1097/ccm.0000000000001716
- Hu SB, Wong DJL, Correa A, Li N, Deng JC. Prediction of clinical deterioration in hospitalized adult patients with hematologic malignancies using a neural network model. PLoS One. 2016;11(8):e0161401. https://doi. org/10.1371/journal.pone.0161401
- Rothman MJ, Rothman SI, Beals J 4th. Development and validation of a continuous measure of patient condition using the electronic medical record. J Biomed Inform. 2013;46(5):837-848. https://doi.org/10.1016/j. jbi.2013.06.011
- Alaa AM, Yoon J, Hu S, van der Schaar M. Personalized risk scoring for critical care prognosis using mixtures of Gaussian processes. IEEE Trans Biomed Eng. 2018;65(1):207-218. https://doi.org/10.1109/tbme.2017.2698602
- Mohamadlou H, Panchavati S, Calvert J, et al. Multicenter validation of a machine-learning algorithm for 48-h all-cause mortality prediction. Health Informatics J. 2020;26(3):1912-1925. https://doi.org/10.1177/1460458219894494
- Alvarez CA, Clark CA, Zhang S, et al. Predicting out of intensive care unit cardiopulmonary arrest or death using electronic medical record data. BMC Med Inform Decis Mak. 2013;13:28. https://doi.org/10.1186/1472-6947-13-28
- Vincent JL, Einav S, Pearse R, et al. Improving detection of patient deterioration in the general hospital ward environment. Eur J Anaesthesiol. 2018;35(5):325-333. https://doi.org/10.1097/eja.0000000000000798
- Romero-Brufau S, Huddleston JM, Escobar GJ, Liebow M. Why the C-statistic is not informative to evaluate early warning scores and what metrics to use. Crit Care. 2015;19(1):285. https://doi.org/10.1186/s13054-015-0999-1
- Weenk M, Bredie SJ, Koeneman M, Hesselink G, van Goor H, van de Belt TH. Continuous monitoring of the vital signs in the general ward using wearable devices: randomized controlled trial. J Med Internet Res. 2020;22(6):e15471. https://doi.org/10.2196/15471
- Wellner B, Grand J, Canzone E, et al. Predicting unplanned transfers to the intensive care unit: a machine learning approach leveraging diverse clinical elements. JMIR Med Inform. 2017;5(4):e45. https://doi.org/10.2196/medinform.8680
- Elliott M, Baird J. Pulse oximetry and the enduring neglect of respiratory rate assessment: a commentary on patient surveillance. Br J Nurs. 2019;28(19):1256-1259. https://doi.org/10.12968/bjon.2019.28.19.1256
- Blackwell JN, Keim-Malpass J, Clark MT, et al. Early detection of in-patient deterioration: one prediction model does not fit all. Crit Care Explor. 2020;2(5):e0116. https://doi.org/10.1097/cce.0000000000000116
- Johnson AEW, Pollard TJ, Shen L, et al. MIMIC-III, a freely accessible critical care database. Sci Data. 2016;3:160035. https://doi.org/10.1038/sdata.2016.35
- Bodenheimer T, Sinsky C. From triple to quadruple aim: care of the patient requires care of the provider. Ann Fam Med. 2014;12(6):573-576. https://doi. org/10.1370/afm.1713
- Kirkland LL, Malinchoc M, O’Byrne M, et al. A clinical deterioration prediction tool for internal medicine patients. Am J Med Qual. 2013;28(2):135-142 https://doi.org/10.1177/1062860612450459
Reducing Overuse of Proton Pump Inhibitors for Stress Ulcer Prophylaxis and Nonvariceal Gastrointestinal Bleeding in the Hospital: A Narrative Review and Implementation Guide
Proton pump inhibitors (PPIs) are among the most commonly used drugs worldwide to treat dyspepsia and prevent gastrointestinal bleeding (GIB).1 Between 40% and 70% of hospitalized patients receive acid-suppressive therapy (AST; defined as PPIs or histamine-receptor antagonists), and nearly half of these are initiated during the inpatient stay.2,3 While up to 50% of inpatients who received a new AST were discharged on these medications,2 there were no evidence-based indications for a majority of the prescriptions.2,3
Growing evidence shows that PPIs are overutilized and may be associated with wide-ranging adverse events, such as acute and chronic kidney disease,4Clostridium difficile infection,5 hypomagnesemia,6 and fractures.7 Because of the widespread overuse and the potential harm associated with PPIs, a concerted effort to promote their appropriate use in the inpatient setting is necessary. It is important to note that reducing the use of PPIs does not increase the risks of GIB or worsening dyspepsia. Rather, reducing overuse of PPIs lowers the risk of harm to patients. The efforts to reduce overuse, however, are complex and difficult.
This article summarizes evidence regarding interventions to reduce overuse and offers an implementation guide based on this evidence. This guide promotes value-based quality improvement and provides a blueprint for implementing an institution-wide program to reduce PPI overuse in the inpatient setting. We begin with a discussion about quality initiatives to reduce PPI overuse, followed by a review of the safety outcomes associated with reduced use of PPIs.
METHODS
A focused search of the US National Library of Medicine’s PubMed database was performed to identify English-language articles published between 2000 and 2018 that addressed strategies to reduce PPI overuse for stress ulcer prophylaxis (SUP) and nonvariceal GIB. The following search terms were used: PPI and inappropriate use; acid-suppressive therapy and inappropriate use; PPI and discontinuation; acid-suppressive (or suppressant) therapy and discontinuation; SUP and cost; and histamine receptor antagonist and PPI. Inpatient or outpatient studies of patients aged 18 years or older were considered for inclusion in this narrative review, and all study types were included. The primary exclusion criterion was patients aged younger than 18 years. A manual review of the full text of the retrieved articles was performed and references were reviewed for missed citations.
RESULTS
We identified a total of 1,497 unique citations through our initial search. After performing a manual review, we excluded 1,483 of the references and added an additional 2, resulting in 16 articles selected for inclusion. The selected articles addressed interventions falling into three main groupings: implementation of institutional guidelines with or without electronic health record (EHR)–based decision support, educational interventions alone, and multifaceted interventions. Each of these interventions is discussed in the sections that follow. Table 1, Table 2, and Table 3 summarize the results of the studies included in our narrative review.
QUALITY INITIATIVES TO REDUCE PPI OVERUSE
Institutional Guidelines With or Without EHR-Based Decision Support
Table 1 summarizes institutional guidelines, with or without EHR-based decision support, to reduce inappropriate PPI use. The implementation of institutional guidelines for the appropriate reduction of PPI use has had some success. Coursol and Sanzari evaluated the impact of a treatment algorithm on the appropriateness of prescriptions for SUP in the intensive care unit (ICU).8 Risk factors of patients in this study included mechanical ventilation for 48 hours, coagulopathy for 24 hours, postoperative transplant, severe burns, active gastrointestinal (GI) disease, multiple trauma, multiple organ failure, and septicemia. The three treatment options chosen for the algorithm were intravenous (IV) famotidine (if the oral route was unavailable or impractical), omeprazole tablets (if oral access was available), and omeprazole suspension (in cases of dysphagia and presence of nasogastric or orogastric tube). After implementation of the treatment algorithm, the proportion of inappropriate prophylaxis decreased from 95.7% to 88.2% (P = .033), and the cost per patient decreased from $11.11 to $8.49 Canadian dollars (P = .003).
Van Vliet et al implemented a clinical practice guideline listing specific criteria for prescribing a PPI.9 Their criteria included the presence of gastric or duodenal ulcer and use of a nonsteroidal anti-inflammatory drug (NSAID) or aspirin, plus at least one additional risk factor (eg, history of gastroduodenal hemorrhage or age >70 years). The proportion of patients started on PPIs during hospitalization decreased from 21% to 13% (odds ratio, 0.56; 95% CI, 0.33-0.97).
Michal et al utilized an institutional pharmacist-driven protocol that stipulated criteria for appropriate PPI use (eg, upper GIB, mechanical ventilation, peptic ulcer disease, gastroesophageal reflux disease, coagulopathy).10 Pharmacists in the study evaluated patients for PPI appropriateness and recommended changes in medication or discontinuation of use. This institutional intervention decreased PPI use in non-ICU hospitalized adults. Discontinuation of PPIs increased from 41% of patients in the preintervention group to 66% of patients in the postintervention group (P = .001).
In addition to implementing guidelines and intervention strategies, institutions have also adopted changes to the EHR to reduce inappropriate PPI use. Herzig et al utilized a computerized clinical decision support intervention to decrease SUP in non-ICU hospitalized patients.11 Of the available response options for acid-suppressive medication, when SUP was chosen as the only indication for PPI use a prompt alerted the clinician that “[SUP] is not recommended for patients outside the [ICU]”; the alert resulted in a significant reduction in AST for the sole purpose of SUP. With this intervention, the percentage of patients who had any inappropriate acid-suppressive exposure decreased from 4.0% to 0.6% (P < .001).
EDUCATION
Table 2 summarizes educational interventions to reduce inappropriate PPI use.
Agee et al employed a pharmacist-led educational seminar that described SUP indications, risks, and costs.12 Inappropriate SUP prescriptions decreased from 55.5% to 30.5% after the intervention (P < .0001). However, there was no reduction in the percentage of patients discharged on inappropriate AST.
Chui et al performed an intervention with academic detailing wherein a one-on-one visit with a physician took place, providing education to improve physician prescribing behavior.13 In this study, academic detailing focused on the most common instances for which PPIs were inappropriately utilized at that hospital (eg, surgical prophylaxis, anemia). Inappropriate use of double-dose PPIs was also targeted. Despite these efforts, no significant difference in inappropriate PPI prescribing was observed post intervention.
Hamzat et al implemented an educational strategy to reduce inappropriate PPI prescribing during hospital stays, which included dissemination of fliers, posters, emails, and presentations over a 4-week period.14 Educational efforts targeted clinical pharmacists, nurses, physicians, and patients. Appropriate indications for PPI use in this study included peptic ulcer disease (current or previous), H pylori infection, and treatment or prevention of an NSAID-induced ulcer. The primary outcome was a reduction in PPI dose or discontinuation of PPI during the hospital admission, which increased from 9% in the preintervention (pre-education) phase to 43% during the intervention (education) phase and to 46% in the postintervention (posteducation) phase (P = .006).
Liberman and Whelan also implemented an educational intervention among internal medicine residents to reduce inappropriate use of SUP; this intervention was based on practice-based learning and improvement methodology.15 They noted that the rate of inappropriate prophylaxis with AST decreased from 59% preintervention to 33% post intervention (P < .007).
MULTIFACETED APPROACHES
Table 3 summarizes several multifaceted approaches aimed at reducing inappropriate PPI use. Belfield et al utilized an intervention consisting of an institutional guideline review, education, and monitoring of AST by clinical pharmacists to reduce inappropriate use of PPI for SUP.16 With this intervention, the primary outcome of total inappropriate days of AST during hospitalization decreased from 279 to 116 (48% relative reduction in risk, P < .01, across 142 patients studied). Furthermore, inappropriate AST prescriptions at discharge decreased from 32% to 8% (P = .006). The one case of GIB noted in this study occurred in the control group.
Del Giorno et al combined audit and feedback with education to reduce new PPI prescriptions at the time of discharge from the hospital.17 The educational component of this intervention included guidance regarding potentially inappropriate PPI use and associated side effects and targeted multiple departments in the hospital. This intervention led to a sustained reduction in new PPI prescriptions at discharge during the 3-year study period. The annual rate of new PPI prescriptions was 19%, 19%, 18%, and 16% in years 2014, 2015, 2016, and 2017, respectively, in the internal medicine department (postintervention group), compared with rates of 30%, 29%, 36%, 36% (P < .001) for the same years in the surgery department (control group).
Education and the use of medication reconciliation forms on admission and discharge were utilized by Gupta et al to reduce inappropriate AST in hospitalized patients from 51% prior to intervention to 22% post intervention (P < .001).18 Furthermore, the proportion of patients discharged on inappropriate AST decreased from 69% to 20% (P < .001).
Hatch et al also used educational resources and pharmacist-led medication reconciliation to reduce use of SUP.19 Before the intervention, 24.4% of patients were continued on SUP after hospital discharge in the absence of a clear indication for use; post intervention, 11% of patients were continued on SUP after hospital discharge (of these patients, 8.7% had no clear indication for use). This represented a 64.4% decrease in inappropriately prescribed SUP after discharge (P < .0001).
Khalili et al combined an educational intervention with an institutional guideline in an infectious disease ward to reduce inappropriate use of SUP.20 This intervention reduced the inappropriate use of AST from 80.9% before the intervention to 47.1% post intervention (P < .001).
Masood et al implemented two interventions wherein pharmacists reviewed SUP indications for each patient during daily team rounds, and ICU residents and fellows received education about indications for SUP and the implemented initiative on a bimonthly basis.21 Inappropriate AST decreased from 26.75 to 7.14 prescriptions per 100 patient-days of care (P < .001).
McDonald et al combined education with a web-based quality improvement tool to reduce inappropriate exit prescriptions for PPIs.22 The proportion of PPIs discontinued at hospital discharge increased from 7.7% per month to 18.5% per month (P = .03).
Finally, the initiative implemented by Tasaka et al to reduce overutilization of SUP included an institutional guideline, a pharmacist-led intervention, and an institutional education and awareness campaign.23 Their initiative led to a reduction in inappropriate SUP both at the time of transfer out of the ICU (8% before intervention, 4% post intervention, P = .54) and at the time of discharge from the hospital (7% before intervention, 0% post intervention, P = .22).
REDUCING PPI USE AND SAFETY OUTCOMES
Proton pump inhibitors are often initiated in the hospital setting, with up to half of these new prescriptions continued at discharge.2,24,25 Inappropriate prescriptions for PPIs expose patients to excess risk of long-term adverse events.26 De-escalating PPIs, however, raises concern among clinicians and patients for potential recurrence of dyspepsia and GIB. There is limited evidence regarding long-term safety outcomes (including GIB) following the discontinuation of PPIs deemed to have been inappropriately initiated in the hospital. In view of this, clinicians should educate and monitor individual patients for symptom relapse to ensure timely and appropriate resumption of AST.
LIMITATIONS
Our literature search for this narrative review and implementation guide has limitations. First, the time frame we included (2000-2018) may have excluded relevant articles published before our starting year. We did not include articles published before 2000 based on concerns these might contain outdated information. Also, there may have been incomplete retrieval of relevant studies/articles due to the labor-intensive nature involved in determining whether PPI prescriptions are appropriate or inappropriate.
We noted that interventional studies aimed at reducing overuse of PPIs were often limited by a low number of participants; these studies were also more likely to be single-center interventions, which limits generalizability. In addition, the studies often had low methodological rigor and lacked randomization or controls. Moreover, to fully evaluate the sustainability of interventions, some of the studies had a limited postimplementation period. For multifaceted interventions, the efficacy of individual components of the interventions was not clearly evaluated. Moreover, there was a high risk of bias in many of the included studies. Some of the larger studies used overall AST prescriptions as a surrogate for more appropriate use. It would be advantageous for a site to perform a pilot study that provides well-defined parameters for appropriate prescribing, and then correlate with the total number of prescriptions (automated and much easier) thereafter. Further, although the evidence regarding appropriate PPI use for SUP and GIB has shifted rapidly in recent years, society guidelines have not been updated to reflect this change. As such, quality improvement interventions have predominantly focused on reducing PPI use for the indications reflected by these guidelines.
IMPLEMENTATION BLUEPRINT
The following are our recommendations for successfully implementing an evidence-based, institution-wide initiative to promote the appropriate use of PPIs during hospitalization. These recommendations are informed by the evidence review and reflect the consensus of the combined committees coauthoring this review.
For an initiative to succeed, participation from multiple disciplines is necessary to formulate local guidelines and design and implement interventions. Such an interdisciplinary approach requires advocates to closely monitor and evaluate the program; sustainability will be greatly facilitated by the active engagement of key stakeholders, including the hospital’s executive administration, supply chain, pharmacists, and gastroenterologists. Lack of adequate buy-in on the part of key stakeholders is a barrier to the success of any intervention. Accordingly, before selecting a particular intervention, it is important to understand local factors driving the overuse of PPI.
1. Develop evidence-based institutional guidelines for both SUP and nonvariceal upper GIB through an interdisciplinary workgroup.
- Establish an interdisciplinary group including, but not limited to, pharmacists, hospitalists, gastroenterologists, and intensivists so that changes in practice will be widely adopted as institutional policy.
- Incorporate the best evidence and clearly convey appropriate and inappropriate uses.
2. Integrate changes to the EHR.
- If possible, the EHR should be leveraged to implement changes in PPI ordering practices.
- While integrating changes to the EHR, it is important to consider informatics and implementation science, since the utility of hard stops and best practice alerts has been questioned in the setting of operational inefficiencies and alert fatigue.
- Options for integrating changes to the EHR include the following:
- Create an ordering pathway that provides clinical decision support for PPI use.
- Incorporate a best practice alert in the EMR to notify clinicians of institutional guidelines when they initiate an order for PPI outside of the pathway.
- Consider restricting the authority to order IV PPIs by requiring a code or password or implement another means of using the EHR to limit the supply of PPI.
- Limit the duration of IV PPI by requiring daily renewal of IV PPI dosing or by altering the period of time that use of IV PPI is permitted (eg, 48 to 72 hours).
- PPIs should be removed from any current order sets that include medications for SUP.
3. Foster pharmacy-driven interventions.
- Consider requiring pharmacist approval for IV PPIs.
- Pharmacist-led review and feedback to clinicians for discontinuation of inappropriate PPIs can be effective in decreasing inappropriate utilization.
4. Provide education, audit data, and obtain feedback.
- Data auditing is needed to measure the efficacy of interventions. Outcome measures may include the number of non-ICU and ICU patients who are started on a PPI during an admission; the audit should be continued through discharge. A process measure may be the number of pharmacist calls for inappropriate PPIs. A balancing measure would be ulcer-specific upper GIB in patients who do not receive SUP during their admission. (Upper GIB from other etiologies, such as varices, portal hypertensive gastropathy, and Mallory-Weiss tear would not be affected by PPI SUP.)
- Run or control charts should be utilized, and data should be shared with project champions and ordering clinicians—in real time if possible.
- Project champions should provide feedback to colleagues; they should also work with hospital leadership to develop new strategies to improve adherence.
- Provide ongoing education about appropriate indications for PPIs and potential adverse effects associated with their use. Whenever possible, point-of-care or just-in-time teaching is the preferred format.
CONCLUSION
Excessive use of PPIs during hospitalization is prevalent; however, quality improvement interventions can be effective in achieving sustainable reductions in overuse. There is a need for the American College of Gastroenterology to revisit and update their guidelines for management of patients with ulcer bleeding to include stronger evidence-based recommendations on the proper use of PPIs.27 These updated guidelines could be used to update the implementation blueprint.
Quality improvement teams have an opportunity to use the principles of value-based healthcare to reduce inappropriate PPI use. By following the blueprint outlined in this article, institutions can safely and effectively tailor the use of PPIs to suitable patients in the appropriate settings. Reduction of PPI overuse can be employed as an institutional catalyst to promote implementation of further value-based measures to improve efficiency and quality of patient care.
1. Savarino V, Marabotto E, Zentilin P, et al. Proton pump inhibitors: use and misuse in the clinical setting. Exp Rev Clin Pharmacol. 2018;11(11):1123-1134. https://doi.org/10.1080/17512433.2018.1531703
2. Nardino RJ, Vender RJ, Herbert PN. Overuse of acid-suppressive therapy in hospitalized patients. Am J Gastroenterol. 2000;95(11):3118-3122. https://doi.org/10.1111/j.1572-0241.2000.03259.x
3. Ahrens D, Behrens G, Himmel W, Kochen MM, Chenot JF. Appropriateness of proton pump inhibitor recommendations at hospital discharge and continuation in primary care. Int J Clin Pract. 2012;66(8):767-773. https://doi.org/10.1111/j.1742-1241.2012.02973.x
4. Moledina DG, Perazella MA. PPIs and kidney disease: from AIN to CKD. J Nephrol. 2016;29(5):611-616. https://doi.org/10.1007/s40620-016-0309-2
5. Kwok CS, Arthur AK, Anibueze CI, Singh S, Cavallazzi R, Loke YK. Risk of Clostridium difficile infection with acid suppressing drugs and antibiotics: meta-analysis. Am J Gastroenterol. 2012;107(7):1011-1019. https://doi.org/10.1038/ajg.2012.108
6. Cheungpasitporn W, Thongprayoon C, Kittanamongkolchai W, et al. Proton pump inhibitors linked to hypomagnesemia: a systematic review and meta-analysis of observational studies. Ren Fail. 2015;37(7):1237-1241. https://doi.org/10.3109/0886022x.2015.1057800
7. Yang YX, Lewis JD, Epstein S, Metz DC. Long-term proton pump inhibitor therapy and risk of hip fracture. JAMA. 2006;296(24):2947-2953. https://doi.org/10.1001/jama.296.24.2947
8. Coursol CJ, Sanzari SE. Impact of stress ulcer prophylaxis algorithm study. Ann Pharmacother. 2005;39(5):810-816. https://doi.org/10.1345/aph.1d129
9. van Vliet EPM, Steyerberg EW, Otten HJ, et al. The effects of guideline implementation for proton pump inhibitor prescription on two pulmonary medicine wards. Aliment Pharmacol Ther. 2009;29(2):213-221. https://doi.org/10.1111/j.1365-2036.2008.03875.x
10. Michal J, Henry T, Street C. Impact of a pharmacist-driven protocol to decrease proton pump inhibitor use in non-intensive care hospitalized adults. Am J Health Syst Pharm. 2016;73(17 Suppl 4):S126-S132. https://doi.org/10.2146/ajhp150519
11. Herzig SJ, Guess JR, Feinbloom DB, et al. Improving appropriateness of acid-suppressive medication use via computerized clinical decision support. J Hosp Med. 2015;10(1):41-45. https://doi.org/10.1002/jhm.2260
12. Agee C, Coulter L, Hudson J. Effects of pharmacy resident led education on resident physician prescribing habits associated with stress ulcer prophylaxis in non-intensive care unit patients. Am J Health Syst Pharm. 2015;72(11 Suppl 1):S48-S52. https://doi.org/10.2146/sp150013
13. Chui D, Young F, Tejani AM, Dillon EC. Impact of academic detailing on proton pump inhibitor prescribing behaviour in a community hospital. Can Pharm J (Ott). 2011;144(2):66-71. https://doi.org/10.3821/1913-701X-144.2.66
14. Hamzat H, Sun H, Ford JC, Macleod J, Soiza RL, Mangoni AA. Inappropriate prescribing of proton pump inhibitors in older patients: effects of an educational strategy. Drugs Aging. 2012;29(8):681-690. https://doi.org/10.1007/bf03262283
15. Liberman JD, Whelan CT. Brief report: Reducing inappropriate usage of stress ulcer prophylaxis among internal medicine residents. A practice-based educational intervention. J Gen Intern Med. 2006;21(5):498-500. https://doi.org/10.1111/j.1525-1497.2006.00435.x
16. Belfield KD, Kuyumjian AG, Teran R, Amadi M, Blatt M, Bicking K. Impact of a collaborative strategy to reduce the inappropriate use of acid suppressive therapy in non-intensive care unit patients. Ann Pharmacother. 2017;51(7):577-583. https://doi.org/10.1177/1060028017698797
17. Del Giorno R, Ceschi A, Pironi M, Zasa A, Greco A, Gabutti L. Multifaceted intervention to curb in-hospital over-prescription of proton pump inhibitors: a longitudinal multicenter quasi-experimental before-and-after study. Eur J Intern Med. 2018;50:52-59. https://doi.org/10.1016/j.ejim.2017.11.002
18. Gupta R, Marshall J, Munoz JC, Kottoor R, Jamal MM, Vega KJ. Decreased acid suppression therapy overuse after education and medication reconciliation. Int J Clin Pract. 2013;67(1):60-65. https://doi.org/10.1111/ijcp.12046
19. Hatch JB, Schulz L, Fish JT. Stress ulcer prophylaxis: reducing non-indicated prescribing after hospital discharge. Ann Pharmacother. 2010;44(10):1565-1571. https://doi.org/10.1345/aph.1p167
20. Khalili H, Dashti-Khavidaki S, Hossein Talasaz AH, Tabeefar H, Hendoiee N. Descriptive analysis of a clinical pharmacy intervention to improve the appropriate use of stress ulcer prophylaxis in a hospital infectious disease ward. J Manag Care Pharm. 2010;16(2):114-121. https://doi.org/10.18553/jmcp.2010.16.2.114
21. Masood U, Sharma A, Bhatti Z, et al. A successful pharmacist-based quality initiative to reduce inappropriate stress ulcer prophylaxis use in an academic medical intensive care unit. Inquiry. 2018;55:46958018759116. https://doi.org/10.1177/0046958018759116
22. McDonald EG, Jones J, Green L, Jayaraman D, Lee TC. Reduction of inappropriate exit prescriptions for proton pump inhibitors: a before-after study using education paired with a web-based quality-improvement tool. J Hosp Med. 2015;10(5):281-286. https://doi.org/10.1002/jhm.2330
23. Tasaka CL, Burg C, VanOsdol SJ, et al. An interprofessional approach to reducing the overutilization of stress ulcer prophylaxis in adult medical and surgical intensive care units. Ann Pharmacother. 2014;48(4):462-469. https://doi.org/10.1177/1060028013517088
24. Zink DA, Pohlman M, Barnes M, Cannon ME. Long-term use of acid suppression started inappropriately during hospitalization. Aliment Pharmacol Ther. 2005;21(10):1203-1209. https://doi.org/10.1111/j.1365-2036.2005.02454.x
25. Pham CQ, Regal RE, Bostwick TR, Knauf KS. Acid suppressive therapy use on an inpatient internal medicine service. Ann Pharmacother. 2006;40(7-8):1261-1266. https://doi.org/10.1345/aph.1g703
26. Schoenfeld AJ, Grady D. Adverse effects associated with proton pump inhibitors [editorial]. JAMA Intern Med. 2016;176(2):172-174. https://doi.org/10.1001/jamainternmed.2015.7927
27. Laine L, Jensen DM. Management of patients with ulcer bleeding. Am J Gastroenterol. 2012;107(3):345-360; quiz 361. https://doi.org/10.1038/ajg.2011.480
Proton pump inhibitors (PPIs) are among the most commonly used drugs worldwide to treat dyspepsia and prevent gastrointestinal bleeding (GIB).1 Between 40% and 70% of hospitalized patients receive acid-suppressive therapy (AST; defined as PPIs or histamine-receptor antagonists), and nearly half of these are initiated during the inpatient stay.2,3 While up to 50% of inpatients who received a new AST were discharged on these medications,2 there were no evidence-based indications for a majority of the prescriptions.2,3
Growing evidence shows that PPIs are overutilized and may be associated with wide-ranging adverse events, such as acute and chronic kidney disease,4Clostridium difficile infection,5 hypomagnesemia,6 and fractures.7 Because of the widespread overuse and the potential harm associated with PPIs, a concerted effort to promote their appropriate use in the inpatient setting is necessary. It is important to note that reducing the use of PPIs does not increase the risks of GIB or worsening dyspepsia. Rather, reducing overuse of PPIs lowers the risk of harm to patients. The efforts to reduce overuse, however, are complex and difficult.
This article summarizes evidence regarding interventions to reduce overuse and offers an implementation guide based on this evidence. This guide promotes value-based quality improvement and provides a blueprint for implementing an institution-wide program to reduce PPI overuse in the inpatient setting. We begin with a discussion about quality initiatives to reduce PPI overuse, followed by a review of the safety outcomes associated with reduced use of PPIs.
METHODS
A focused search of the US National Library of Medicine’s PubMed database was performed to identify English-language articles published between 2000 and 2018 that addressed strategies to reduce PPI overuse for stress ulcer prophylaxis (SUP) and nonvariceal GIB. The following search terms were used: PPI and inappropriate use; acid-suppressive therapy and inappropriate use; PPI and discontinuation; acid-suppressive (or suppressant) therapy and discontinuation; SUP and cost; and histamine receptor antagonist and PPI. Inpatient or outpatient studies of patients aged 18 years or older were considered for inclusion in this narrative review, and all study types were included. The primary exclusion criterion was patients aged younger than 18 years. A manual review of the full text of the retrieved articles was performed and references were reviewed for missed citations.
RESULTS
We identified a total of 1,497 unique citations through our initial search. After performing a manual review, we excluded 1,483 of the references and added an additional 2, resulting in 16 articles selected for inclusion. The selected articles addressed interventions falling into three main groupings: implementation of institutional guidelines with or without electronic health record (EHR)–based decision support, educational interventions alone, and multifaceted interventions. Each of these interventions is discussed in the sections that follow. Table 1, Table 2, and Table 3 summarize the results of the studies included in our narrative review.
QUALITY INITIATIVES TO REDUCE PPI OVERUSE
Institutional Guidelines With or Without EHR-Based Decision Support
Table 1 summarizes institutional guidelines, with or without EHR-based decision support, to reduce inappropriate PPI use. The implementation of institutional guidelines for the appropriate reduction of PPI use has had some success. Coursol and Sanzari evaluated the impact of a treatment algorithm on the appropriateness of prescriptions for SUP in the intensive care unit (ICU).8 Risk factors of patients in this study included mechanical ventilation for 48 hours, coagulopathy for 24 hours, postoperative transplant, severe burns, active gastrointestinal (GI) disease, multiple trauma, multiple organ failure, and septicemia. The three treatment options chosen for the algorithm were intravenous (IV) famotidine (if the oral route was unavailable or impractical), omeprazole tablets (if oral access was available), and omeprazole suspension (in cases of dysphagia and presence of nasogastric or orogastric tube). After implementation of the treatment algorithm, the proportion of inappropriate prophylaxis decreased from 95.7% to 88.2% (P = .033), and the cost per patient decreased from $11.11 to $8.49 Canadian dollars (P = .003).
Van Vliet et al implemented a clinical practice guideline listing specific criteria for prescribing a PPI.9 Their criteria included the presence of gastric or duodenal ulcer and use of a nonsteroidal anti-inflammatory drug (NSAID) or aspirin, plus at least one additional risk factor (eg, history of gastroduodenal hemorrhage or age >70 years). The proportion of patients started on PPIs during hospitalization decreased from 21% to 13% (odds ratio, 0.56; 95% CI, 0.33-0.97).
Michal et al utilized an institutional pharmacist-driven protocol that stipulated criteria for appropriate PPI use (eg, upper GIB, mechanical ventilation, peptic ulcer disease, gastroesophageal reflux disease, coagulopathy).10 Pharmacists in the study evaluated patients for PPI appropriateness and recommended changes in medication or discontinuation of use. This institutional intervention decreased PPI use in non-ICU hospitalized adults. Discontinuation of PPIs increased from 41% of patients in the preintervention group to 66% of patients in the postintervention group (P = .001).
In addition to implementing guidelines and intervention strategies, institutions have also adopted changes to the EHR to reduce inappropriate PPI use. Herzig et al utilized a computerized clinical decision support intervention to decrease SUP in non-ICU hospitalized patients.11 Of the available response options for acid-suppressive medication, when SUP was chosen as the only indication for PPI use a prompt alerted the clinician that “[SUP] is not recommended for patients outside the [ICU]”; the alert resulted in a significant reduction in AST for the sole purpose of SUP. With this intervention, the percentage of patients who had any inappropriate acid-suppressive exposure decreased from 4.0% to 0.6% (P < .001).
EDUCATION
Table 2 summarizes educational interventions to reduce inappropriate PPI use.
Agee et al employed a pharmacist-led educational seminar that described SUP indications, risks, and costs.12 Inappropriate SUP prescriptions decreased from 55.5% to 30.5% after the intervention (P < .0001). However, there was no reduction in the percentage of patients discharged on inappropriate AST.
Chui et al performed an intervention with academic detailing wherein a one-on-one visit with a physician took place, providing education to improve physician prescribing behavior.13 In this study, academic detailing focused on the most common instances for which PPIs were inappropriately utilized at that hospital (eg, surgical prophylaxis, anemia). Inappropriate use of double-dose PPIs was also targeted. Despite these efforts, no significant difference in inappropriate PPI prescribing was observed post intervention.
Hamzat et al implemented an educational strategy to reduce inappropriate PPI prescribing during hospital stays, which included dissemination of fliers, posters, emails, and presentations over a 4-week period.14 Educational efforts targeted clinical pharmacists, nurses, physicians, and patients. Appropriate indications for PPI use in this study included peptic ulcer disease (current or previous), H pylori infection, and treatment or prevention of an NSAID-induced ulcer. The primary outcome was a reduction in PPI dose or discontinuation of PPI during the hospital admission, which increased from 9% in the preintervention (pre-education) phase to 43% during the intervention (education) phase and to 46% in the postintervention (posteducation) phase (P = .006).
Liberman and Whelan also implemented an educational intervention among internal medicine residents to reduce inappropriate use of SUP; this intervention was based on practice-based learning and improvement methodology.15 They noted that the rate of inappropriate prophylaxis with AST decreased from 59% preintervention to 33% post intervention (P < .007).
MULTIFACETED APPROACHES
Table 3 summarizes several multifaceted approaches aimed at reducing inappropriate PPI use. Belfield et al utilized an intervention consisting of an institutional guideline review, education, and monitoring of AST by clinical pharmacists to reduce inappropriate use of PPI for SUP.16 With this intervention, the primary outcome of total inappropriate days of AST during hospitalization decreased from 279 to 116 (48% relative reduction in risk, P < .01, across 142 patients studied). Furthermore, inappropriate AST prescriptions at discharge decreased from 32% to 8% (P = .006). The one case of GIB noted in this study occurred in the control group.
Del Giorno et al combined audit and feedback with education to reduce new PPI prescriptions at the time of discharge from the hospital.17 The educational component of this intervention included guidance regarding potentially inappropriate PPI use and associated side effects and targeted multiple departments in the hospital. This intervention led to a sustained reduction in new PPI prescriptions at discharge during the 3-year study period. The annual rate of new PPI prescriptions was 19%, 19%, 18%, and 16% in years 2014, 2015, 2016, and 2017, respectively, in the internal medicine department (postintervention group), compared with rates of 30%, 29%, 36%, 36% (P < .001) for the same years in the surgery department (control group).
Education and the use of medication reconciliation forms on admission and discharge were utilized by Gupta et al to reduce inappropriate AST in hospitalized patients from 51% prior to intervention to 22% post intervention (P < .001).18 Furthermore, the proportion of patients discharged on inappropriate AST decreased from 69% to 20% (P < .001).
Hatch et al also used educational resources and pharmacist-led medication reconciliation to reduce use of SUP.19 Before the intervention, 24.4% of patients were continued on SUP after hospital discharge in the absence of a clear indication for use; post intervention, 11% of patients were continued on SUP after hospital discharge (of these patients, 8.7% had no clear indication for use). This represented a 64.4% decrease in inappropriately prescribed SUP after discharge (P < .0001).
Khalili et al combined an educational intervention with an institutional guideline in an infectious disease ward to reduce inappropriate use of SUP.20 This intervention reduced the inappropriate use of AST from 80.9% before the intervention to 47.1% post intervention (P < .001).
Masood et al implemented two interventions wherein pharmacists reviewed SUP indications for each patient during daily team rounds, and ICU residents and fellows received education about indications for SUP and the implemented initiative on a bimonthly basis.21 Inappropriate AST decreased from 26.75 to 7.14 prescriptions per 100 patient-days of care (P < .001).
McDonald et al combined education with a web-based quality improvement tool to reduce inappropriate exit prescriptions for PPIs.22 The proportion of PPIs discontinued at hospital discharge increased from 7.7% per month to 18.5% per month (P = .03).
Finally, the initiative implemented by Tasaka et al to reduce overutilization of SUP included an institutional guideline, a pharmacist-led intervention, and an institutional education and awareness campaign.23 Their initiative led to a reduction in inappropriate SUP both at the time of transfer out of the ICU (8% before intervention, 4% post intervention, P = .54) and at the time of discharge from the hospital (7% before intervention, 0% post intervention, P = .22).
REDUCING PPI USE AND SAFETY OUTCOMES
Proton pump inhibitors are often initiated in the hospital setting, with up to half of these new prescriptions continued at discharge.2,24,25 Inappropriate prescriptions for PPIs expose patients to excess risk of long-term adverse events.26 De-escalating PPIs, however, raises concern among clinicians and patients for potential recurrence of dyspepsia and GIB. There is limited evidence regarding long-term safety outcomes (including GIB) following the discontinuation of PPIs deemed to have been inappropriately initiated in the hospital. In view of this, clinicians should educate and monitor individual patients for symptom relapse to ensure timely and appropriate resumption of AST.
LIMITATIONS
Our literature search for this narrative review and implementation guide has limitations. First, the time frame we included (2000-2018) may have excluded relevant articles published before our starting year. We did not include articles published before 2000 based on concerns these might contain outdated information. Also, there may have been incomplete retrieval of relevant studies/articles due to the labor-intensive nature involved in determining whether PPI prescriptions are appropriate or inappropriate.
We noted that interventional studies aimed at reducing overuse of PPIs were often limited by a low number of participants; these studies were also more likely to be single-center interventions, which limits generalizability. In addition, the studies often had low methodological rigor and lacked randomization or controls. Moreover, to fully evaluate the sustainability of interventions, some of the studies had a limited postimplementation period. For multifaceted interventions, the efficacy of individual components of the interventions was not clearly evaluated. Moreover, there was a high risk of bias in many of the included studies. Some of the larger studies used overall AST prescriptions as a surrogate for more appropriate use. It would be advantageous for a site to perform a pilot study that provides well-defined parameters for appropriate prescribing, and then correlate with the total number of prescriptions (automated and much easier) thereafter. Further, although the evidence regarding appropriate PPI use for SUP and GIB has shifted rapidly in recent years, society guidelines have not been updated to reflect this change. As such, quality improvement interventions have predominantly focused on reducing PPI use for the indications reflected by these guidelines.
IMPLEMENTATION BLUEPRINT
The following are our recommendations for successfully implementing an evidence-based, institution-wide initiative to promote the appropriate use of PPIs during hospitalization. These recommendations are informed by the evidence review and reflect the consensus of the combined committees coauthoring this review.
For an initiative to succeed, participation from multiple disciplines is necessary to formulate local guidelines and design and implement interventions. Such an interdisciplinary approach requires advocates to closely monitor and evaluate the program; sustainability will be greatly facilitated by the active engagement of key stakeholders, including the hospital’s executive administration, supply chain, pharmacists, and gastroenterologists. Lack of adequate buy-in on the part of key stakeholders is a barrier to the success of any intervention. Accordingly, before selecting a particular intervention, it is important to understand local factors driving the overuse of PPI.
1. Develop evidence-based institutional guidelines for both SUP and nonvariceal upper GIB through an interdisciplinary workgroup.
- Establish an interdisciplinary group including, but not limited to, pharmacists, hospitalists, gastroenterologists, and intensivists so that changes in practice will be widely adopted as institutional policy.
- Incorporate the best evidence and clearly convey appropriate and inappropriate uses.
2. Integrate changes to the EHR.
- If possible, the EHR should be leveraged to implement changes in PPI ordering practices.
- While integrating changes to the EHR, it is important to consider informatics and implementation science, since the utility of hard stops and best practice alerts has been questioned in the setting of operational inefficiencies and alert fatigue.
- Options for integrating changes to the EHR include the following:
- Create an ordering pathway that provides clinical decision support for PPI use.
- Incorporate a best practice alert in the EMR to notify clinicians of institutional guidelines when they initiate an order for PPI outside of the pathway.
- Consider restricting the authority to order IV PPIs by requiring a code or password or implement another means of using the EHR to limit the supply of PPI.
- Limit the duration of IV PPI by requiring daily renewal of IV PPI dosing or by altering the period of time that use of IV PPI is permitted (eg, 48 to 72 hours).
- PPIs should be removed from any current order sets that include medications for SUP.
3. Foster pharmacy-driven interventions.
- Consider requiring pharmacist approval for IV PPIs.
- Pharmacist-led review and feedback to clinicians for discontinuation of inappropriate PPIs can be effective in decreasing inappropriate utilization.
4. Provide education, audit data, and obtain feedback.
- Data auditing is needed to measure the efficacy of interventions. Outcome measures may include the number of non-ICU and ICU patients who are started on a PPI during an admission; the audit should be continued through discharge. A process measure may be the number of pharmacist calls for inappropriate PPIs. A balancing measure would be ulcer-specific upper GIB in patients who do not receive SUP during their admission. (Upper GIB from other etiologies, such as varices, portal hypertensive gastropathy, and Mallory-Weiss tear would not be affected by PPI SUP.)
- Run or control charts should be utilized, and data should be shared with project champions and ordering clinicians—in real time if possible.
- Project champions should provide feedback to colleagues; they should also work with hospital leadership to develop new strategies to improve adherence.
- Provide ongoing education about appropriate indications for PPIs and potential adverse effects associated with their use. Whenever possible, point-of-care or just-in-time teaching is the preferred format.
CONCLUSION
Excessive use of PPIs during hospitalization is prevalent; however, quality improvement interventions can be effective in achieving sustainable reductions in overuse. There is a need for the American College of Gastroenterology to revisit and update their guidelines for management of patients with ulcer bleeding to include stronger evidence-based recommendations on the proper use of PPIs.27 These updated guidelines could be used to update the implementation blueprint.
Quality improvement teams have an opportunity to use the principles of value-based healthcare to reduce inappropriate PPI use. By following the blueprint outlined in this article, institutions can safely and effectively tailor the use of PPIs to suitable patients in the appropriate settings. Reduction of PPI overuse can be employed as an institutional catalyst to promote implementation of further value-based measures to improve efficiency and quality of patient care.
Proton pump inhibitors (PPIs) are among the most commonly used drugs worldwide to treat dyspepsia and prevent gastrointestinal bleeding (GIB).1 Between 40% and 70% of hospitalized patients receive acid-suppressive therapy (AST; defined as PPIs or histamine-receptor antagonists), and nearly half of these are initiated during the inpatient stay.2,3 While up to 50% of inpatients who received a new AST were discharged on these medications,2 there were no evidence-based indications for a majority of the prescriptions.2,3
Growing evidence shows that PPIs are overutilized and may be associated with wide-ranging adverse events, such as acute and chronic kidney disease,4Clostridium difficile infection,5 hypomagnesemia,6 and fractures.7 Because of the widespread overuse and the potential harm associated with PPIs, a concerted effort to promote their appropriate use in the inpatient setting is necessary. It is important to note that reducing the use of PPIs does not increase the risks of GIB or worsening dyspepsia. Rather, reducing overuse of PPIs lowers the risk of harm to patients. The efforts to reduce overuse, however, are complex and difficult.
This article summarizes evidence regarding interventions to reduce overuse and offers an implementation guide based on this evidence. This guide promotes value-based quality improvement and provides a blueprint for implementing an institution-wide program to reduce PPI overuse in the inpatient setting. We begin with a discussion about quality initiatives to reduce PPI overuse, followed by a review of the safety outcomes associated with reduced use of PPIs.
METHODS
A focused search of the US National Library of Medicine’s PubMed database was performed to identify English-language articles published between 2000 and 2018 that addressed strategies to reduce PPI overuse for stress ulcer prophylaxis (SUP) and nonvariceal GIB. The following search terms were used: PPI and inappropriate use; acid-suppressive therapy and inappropriate use; PPI and discontinuation; acid-suppressive (or suppressant) therapy and discontinuation; SUP and cost; and histamine receptor antagonist and PPI. Inpatient or outpatient studies of patients aged 18 years or older were considered for inclusion in this narrative review, and all study types were included. The primary exclusion criterion was patients aged younger than 18 years. A manual review of the full text of the retrieved articles was performed and references were reviewed for missed citations.
RESULTS
We identified a total of 1,497 unique citations through our initial search. After performing a manual review, we excluded 1,483 of the references and added an additional 2, resulting in 16 articles selected for inclusion. The selected articles addressed interventions falling into three main groupings: implementation of institutional guidelines with or without electronic health record (EHR)–based decision support, educational interventions alone, and multifaceted interventions. Each of these interventions is discussed in the sections that follow. Table 1, Table 2, and Table 3 summarize the results of the studies included in our narrative review.
QUALITY INITIATIVES TO REDUCE PPI OVERUSE
Institutional Guidelines With or Without EHR-Based Decision Support
Table 1 summarizes institutional guidelines, with or without EHR-based decision support, to reduce inappropriate PPI use. The implementation of institutional guidelines for the appropriate reduction of PPI use has had some success. Coursol and Sanzari evaluated the impact of a treatment algorithm on the appropriateness of prescriptions for SUP in the intensive care unit (ICU).8 Risk factors of patients in this study included mechanical ventilation for 48 hours, coagulopathy for 24 hours, postoperative transplant, severe burns, active gastrointestinal (GI) disease, multiple trauma, multiple organ failure, and septicemia. The three treatment options chosen for the algorithm were intravenous (IV) famotidine (if the oral route was unavailable or impractical), omeprazole tablets (if oral access was available), and omeprazole suspension (in cases of dysphagia and presence of nasogastric or orogastric tube). After implementation of the treatment algorithm, the proportion of inappropriate prophylaxis decreased from 95.7% to 88.2% (P = .033), and the cost per patient decreased from $11.11 to $8.49 Canadian dollars (P = .003).
Van Vliet et al implemented a clinical practice guideline listing specific criteria for prescribing a PPI.9 Their criteria included the presence of gastric or duodenal ulcer and use of a nonsteroidal anti-inflammatory drug (NSAID) or aspirin, plus at least one additional risk factor (eg, history of gastroduodenal hemorrhage or age >70 years). The proportion of patients started on PPIs during hospitalization decreased from 21% to 13% (odds ratio, 0.56; 95% CI, 0.33-0.97).
Michal et al utilized an institutional pharmacist-driven protocol that stipulated criteria for appropriate PPI use (eg, upper GIB, mechanical ventilation, peptic ulcer disease, gastroesophageal reflux disease, coagulopathy).10 Pharmacists in the study evaluated patients for PPI appropriateness and recommended changes in medication or discontinuation of use. This institutional intervention decreased PPI use in non-ICU hospitalized adults. Discontinuation of PPIs increased from 41% of patients in the preintervention group to 66% of patients in the postintervention group (P = .001).
In addition to implementing guidelines and intervention strategies, institutions have also adopted changes to the EHR to reduce inappropriate PPI use. Herzig et al utilized a computerized clinical decision support intervention to decrease SUP in non-ICU hospitalized patients.11 Of the available response options for acid-suppressive medication, when SUP was chosen as the only indication for PPI use a prompt alerted the clinician that “[SUP] is not recommended for patients outside the [ICU]”; the alert resulted in a significant reduction in AST for the sole purpose of SUP. With this intervention, the percentage of patients who had any inappropriate acid-suppressive exposure decreased from 4.0% to 0.6% (P < .001).
EDUCATION
Table 2 summarizes educational interventions to reduce inappropriate PPI use.
Agee et al employed a pharmacist-led educational seminar that described SUP indications, risks, and costs.12 Inappropriate SUP prescriptions decreased from 55.5% to 30.5% after the intervention (P < .0001). However, there was no reduction in the percentage of patients discharged on inappropriate AST.
Chui et al performed an intervention with academic detailing wherein a one-on-one visit with a physician took place, providing education to improve physician prescribing behavior.13 In this study, academic detailing focused on the most common instances for which PPIs were inappropriately utilized at that hospital (eg, surgical prophylaxis, anemia). Inappropriate use of double-dose PPIs was also targeted. Despite these efforts, no significant difference in inappropriate PPI prescribing was observed post intervention.
Hamzat et al implemented an educational strategy to reduce inappropriate PPI prescribing during hospital stays, which included dissemination of fliers, posters, emails, and presentations over a 4-week period.14 Educational efforts targeted clinical pharmacists, nurses, physicians, and patients. Appropriate indications for PPI use in this study included peptic ulcer disease (current or previous), H pylori infection, and treatment or prevention of an NSAID-induced ulcer. The primary outcome was a reduction in PPI dose or discontinuation of PPI during the hospital admission, which increased from 9% in the preintervention (pre-education) phase to 43% during the intervention (education) phase and to 46% in the postintervention (posteducation) phase (P = .006).
Liberman and Whelan also implemented an educational intervention among internal medicine residents to reduce inappropriate use of SUP; this intervention was based on practice-based learning and improvement methodology.15 They noted that the rate of inappropriate prophylaxis with AST decreased from 59% preintervention to 33% post intervention (P < .007).
MULTIFACETED APPROACHES
Table 3 summarizes several multifaceted approaches aimed at reducing inappropriate PPI use. Belfield et al utilized an intervention consisting of an institutional guideline review, education, and monitoring of AST by clinical pharmacists to reduce inappropriate use of PPI for SUP.16 With this intervention, the primary outcome of total inappropriate days of AST during hospitalization decreased from 279 to 116 (48% relative reduction in risk, P < .01, across 142 patients studied). Furthermore, inappropriate AST prescriptions at discharge decreased from 32% to 8% (P = .006). The one case of GIB noted in this study occurred in the control group.
Del Giorno et al combined audit and feedback with education to reduce new PPI prescriptions at the time of discharge from the hospital.17 The educational component of this intervention included guidance regarding potentially inappropriate PPI use and associated side effects and targeted multiple departments in the hospital. This intervention led to a sustained reduction in new PPI prescriptions at discharge during the 3-year study period. The annual rate of new PPI prescriptions was 19%, 19%, 18%, and 16% in years 2014, 2015, 2016, and 2017, respectively, in the internal medicine department (postintervention group), compared with rates of 30%, 29%, 36%, 36% (P < .001) for the same years in the surgery department (control group).
Education and the use of medication reconciliation forms on admission and discharge were utilized by Gupta et al to reduce inappropriate AST in hospitalized patients from 51% prior to intervention to 22% post intervention (P < .001).18 Furthermore, the proportion of patients discharged on inappropriate AST decreased from 69% to 20% (P < .001).
Hatch et al also used educational resources and pharmacist-led medication reconciliation to reduce use of SUP.19 Before the intervention, 24.4% of patients were continued on SUP after hospital discharge in the absence of a clear indication for use; post intervention, 11% of patients were continued on SUP after hospital discharge (of these patients, 8.7% had no clear indication for use). This represented a 64.4% decrease in inappropriately prescribed SUP after discharge (P < .0001).
Khalili et al combined an educational intervention with an institutional guideline in an infectious disease ward to reduce inappropriate use of SUP.20 This intervention reduced the inappropriate use of AST from 80.9% before the intervention to 47.1% post intervention (P < .001).
Masood et al implemented two interventions wherein pharmacists reviewed SUP indications for each patient during daily team rounds, and ICU residents and fellows received education about indications for SUP and the implemented initiative on a bimonthly basis.21 Inappropriate AST decreased from 26.75 to 7.14 prescriptions per 100 patient-days of care (P < .001).
McDonald et al combined education with a web-based quality improvement tool to reduce inappropriate exit prescriptions for PPIs.22 The proportion of PPIs discontinued at hospital discharge increased from 7.7% per month to 18.5% per month (P = .03).
Finally, the initiative implemented by Tasaka et al to reduce overutilization of SUP included an institutional guideline, a pharmacist-led intervention, and an institutional education and awareness campaign.23 Their initiative led to a reduction in inappropriate SUP both at the time of transfer out of the ICU (8% before intervention, 4% post intervention, P = .54) and at the time of discharge from the hospital (7% before intervention, 0% post intervention, P = .22).
REDUCING PPI USE AND SAFETY OUTCOMES
Proton pump inhibitors are often initiated in the hospital setting, with up to half of these new prescriptions continued at discharge.2,24,25 Inappropriate prescriptions for PPIs expose patients to excess risk of long-term adverse events.26 De-escalating PPIs, however, raises concern among clinicians and patients for potential recurrence of dyspepsia and GIB. There is limited evidence regarding long-term safety outcomes (including GIB) following the discontinuation of PPIs deemed to have been inappropriately initiated in the hospital. In view of this, clinicians should educate and monitor individual patients for symptom relapse to ensure timely and appropriate resumption of AST.
LIMITATIONS
Our literature search for this narrative review and implementation guide has limitations. First, the time frame we included (2000-2018) may have excluded relevant articles published before our starting year. We did not include articles published before 2000 based on concerns these might contain outdated information. Also, there may have been incomplete retrieval of relevant studies/articles due to the labor-intensive nature involved in determining whether PPI prescriptions are appropriate or inappropriate.
We noted that interventional studies aimed at reducing overuse of PPIs were often limited by a low number of participants; these studies were also more likely to be single-center interventions, which limits generalizability. In addition, the studies often had low methodological rigor and lacked randomization or controls. Moreover, to fully evaluate the sustainability of interventions, some of the studies had a limited postimplementation period. For multifaceted interventions, the efficacy of individual components of the interventions was not clearly evaluated. Moreover, there was a high risk of bias in many of the included studies. Some of the larger studies used overall AST prescriptions as a surrogate for more appropriate use. It would be advantageous for a site to perform a pilot study that provides well-defined parameters for appropriate prescribing, and then correlate with the total number of prescriptions (automated and much easier) thereafter. Further, although the evidence regarding appropriate PPI use for SUP and GIB has shifted rapidly in recent years, society guidelines have not been updated to reflect this change. As such, quality improvement interventions have predominantly focused on reducing PPI use for the indications reflected by these guidelines.
IMPLEMENTATION BLUEPRINT
The following are our recommendations for successfully implementing an evidence-based, institution-wide initiative to promote the appropriate use of PPIs during hospitalization. These recommendations are informed by the evidence review and reflect the consensus of the combined committees coauthoring this review.
For an initiative to succeed, participation from multiple disciplines is necessary to formulate local guidelines and design and implement interventions. Such an interdisciplinary approach requires advocates to closely monitor and evaluate the program; sustainability will be greatly facilitated by the active engagement of key stakeholders, including the hospital’s executive administration, supply chain, pharmacists, and gastroenterologists. Lack of adequate buy-in on the part of key stakeholders is a barrier to the success of any intervention. Accordingly, before selecting a particular intervention, it is important to understand local factors driving the overuse of PPI.
1. Develop evidence-based institutional guidelines for both SUP and nonvariceal upper GIB through an interdisciplinary workgroup.
- Establish an interdisciplinary group including, but not limited to, pharmacists, hospitalists, gastroenterologists, and intensivists so that changes in practice will be widely adopted as institutional policy.
- Incorporate the best evidence and clearly convey appropriate and inappropriate uses.
2. Integrate changes to the EHR.
- If possible, the EHR should be leveraged to implement changes in PPI ordering practices.
- While integrating changes to the EHR, it is important to consider informatics and implementation science, since the utility of hard stops and best practice alerts has been questioned in the setting of operational inefficiencies and alert fatigue.
- Options for integrating changes to the EHR include the following:
- Create an ordering pathway that provides clinical decision support for PPI use.
- Incorporate a best practice alert in the EMR to notify clinicians of institutional guidelines when they initiate an order for PPI outside of the pathway.
- Consider restricting the authority to order IV PPIs by requiring a code or password or implement another means of using the EHR to limit the supply of PPI.
- Limit the duration of IV PPI by requiring daily renewal of IV PPI dosing or by altering the period of time that use of IV PPI is permitted (eg, 48 to 72 hours).
- PPIs should be removed from any current order sets that include medications for SUP.
3. Foster pharmacy-driven interventions.
- Consider requiring pharmacist approval for IV PPIs.
- Pharmacist-led review and feedback to clinicians for discontinuation of inappropriate PPIs can be effective in decreasing inappropriate utilization.
4. Provide education, audit data, and obtain feedback.
- Data auditing is needed to measure the efficacy of interventions. Outcome measures may include the number of non-ICU and ICU patients who are started on a PPI during an admission; the audit should be continued through discharge. A process measure may be the number of pharmacist calls for inappropriate PPIs. A balancing measure would be ulcer-specific upper GIB in patients who do not receive SUP during their admission. (Upper GIB from other etiologies, such as varices, portal hypertensive gastropathy, and Mallory-Weiss tear would not be affected by PPI SUP.)
- Run or control charts should be utilized, and data should be shared with project champions and ordering clinicians—in real time if possible.
- Project champions should provide feedback to colleagues; they should also work with hospital leadership to develop new strategies to improve adherence.
- Provide ongoing education about appropriate indications for PPIs and potential adverse effects associated with their use. Whenever possible, point-of-care or just-in-time teaching is the preferred format.
CONCLUSION
Excessive use of PPIs during hospitalization is prevalent; however, quality improvement interventions can be effective in achieving sustainable reductions in overuse. There is a need for the American College of Gastroenterology to revisit and update their guidelines for management of patients with ulcer bleeding to include stronger evidence-based recommendations on the proper use of PPIs.27 These updated guidelines could be used to update the implementation blueprint.
Quality improvement teams have an opportunity to use the principles of value-based healthcare to reduce inappropriate PPI use. By following the blueprint outlined in this article, institutions can safely and effectively tailor the use of PPIs to suitable patients in the appropriate settings. Reduction of PPI overuse can be employed as an institutional catalyst to promote implementation of further value-based measures to improve efficiency and quality of patient care.
1. Savarino V, Marabotto E, Zentilin P, et al. Proton pump inhibitors: use and misuse in the clinical setting. Exp Rev Clin Pharmacol. 2018;11(11):1123-1134. https://doi.org/10.1080/17512433.2018.1531703
2. Nardino RJ, Vender RJ, Herbert PN. Overuse of acid-suppressive therapy in hospitalized patients. Am J Gastroenterol. 2000;95(11):3118-3122. https://doi.org/10.1111/j.1572-0241.2000.03259.x
3. Ahrens D, Behrens G, Himmel W, Kochen MM, Chenot JF. Appropriateness of proton pump inhibitor recommendations at hospital discharge and continuation in primary care. Int J Clin Pract. 2012;66(8):767-773. https://doi.org/10.1111/j.1742-1241.2012.02973.x
4. Moledina DG, Perazella MA. PPIs and kidney disease: from AIN to CKD. J Nephrol. 2016;29(5):611-616. https://doi.org/10.1007/s40620-016-0309-2
5. Kwok CS, Arthur AK, Anibueze CI, Singh S, Cavallazzi R, Loke YK. Risk of Clostridium difficile infection with acid suppressing drugs and antibiotics: meta-analysis. Am J Gastroenterol. 2012;107(7):1011-1019. https://doi.org/10.1038/ajg.2012.108
6. Cheungpasitporn W, Thongprayoon C, Kittanamongkolchai W, et al. Proton pump inhibitors linked to hypomagnesemia: a systematic review and meta-analysis of observational studies. Ren Fail. 2015;37(7):1237-1241. https://doi.org/10.3109/0886022x.2015.1057800
7. Yang YX, Lewis JD, Epstein S, Metz DC. Long-term proton pump inhibitor therapy and risk of hip fracture. JAMA. 2006;296(24):2947-2953. https://doi.org/10.1001/jama.296.24.2947
8. Coursol CJ, Sanzari SE. Impact of stress ulcer prophylaxis algorithm study. Ann Pharmacother. 2005;39(5):810-816. https://doi.org/10.1345/aph.1d129
9. van Vliet EPM, Steyerberg EW, Otten HJ, et al. The effects of guideline implementation for proton pump inhibitor prescription on two pulmonary medicine wards. Aliment Pharmacol Ther. 2009;29(2):213-221. https://doi.org/10.1111/j.1365-2036.2008.03875.x
10. Michal J, Henry T, Street C. Impact of a pharmacist-driven protocol to decrease proton pump inhibitor use in non-intensive care hospitalized adults. Am J Health Syst Pharm. 2016;73(17 Suppl 4):S126-S132. https://doi.org/10.2146/ajhp150519
11. Herzig SJ, Guess JR, Feinbloom DB, et al. Improving appropriateness of acid-suppressive medication use via computerized clinical decision support. J Hosp Med. 2015;10(1):41-45. https://doi.org/10.1002/jhm.2260
12. Agee C, Coulter L, Hudson J. Effects of pharmacy resident led education on resident physician prescribing habits associated with stress ulcer prophylaxis in non-intensive care unit patients. Am J Health Syst Pharm. 2015;72(11 Suppl 1):S48-S52. https://doi.org/10.2146/sp150013
13. Chui D, Young F, Tejani AM, Dillon EC. Impact of academic detailing on proton pump inhibitor prescribing behaviour in a community hospital. Can Pharm J (Ott). 2011;144(2):66-71. https://doi.org/10.3821/1913-701X-144.2.66
14. Hamzat H, Sun H, Ford JC, Macleod J, Soiza RL, Mangoni AA. Inappropriate prescribing of proton pump inhibitors in older patients: effects of an educational strategy. Drugs Aging. 2012;29(8):681-690. https://doi.org/10.1007/bf03262283
15. Liberman JD, Whelan CT. Brief report: Reducing inappropriate usage of stress ulcer prophylaxis among internal medicine residents. A practice-based educational intervention. J Gen Intern Med. 2006;21(5):498-500. https://doi.org/10.1111/j.1525-1497.2006.00435.x
16. Belfield KD, Kuyumjian AG, Teran R, Amadi M, Blatt M, Bicking K. Impact of a collaborative strategy to reduce the inappropriate use of acid suppressive therapy in non-intensive care unit patients. Ann Pharmacother. 2017;51(7):577-583. https://doi.org/10.1177/1060028017698797
17. Del Giorno R, Ceschi A, Pironi M, Zasa A, Greco A, Gabutti L. Multifaceted intervention to curb in-hospital over-prescription of proton pump inhibitors: a longitudinal multicenter quasi-experimental before-and-after study. Eur J Intern Med. 2018;50:52-59. https://doi.org/10.1016/j.ejim.2017.11.002
18. Gupta R, Marshall J, Munoz JC, Kottoor R, Jamal MM, Vega KJ. Decreased acid suppression therapy overuse after education and medication reconciliation. Int J Clin Pract. 2013;67(1):60-65. https://doi.org/10.1111/ijcp.12046
19. Hatch JB, Schulz L, Fish JT. Stress ulcer prophylaxis: reducing non-indicated prescribing after hospital discharge. Ann Pharmacother. 2010;44(10):1565-1571. https://doi.org/10.1345/aph.1p167
20. Khalili H, Dashti-Khavidaki S, Hossein Talasaz AH, Tabeefar H, Hendoiee N. Descriptive analysis of a clinical pharmacy intervention to improve the appropriate use of stress ulcer prophylaxis in a hospital infectious disease ward. J Manag Care Pharm. 2010;16(2):114-121. https://doi.org/10.18553/jmcp.2010.16.2.114
21. Masood U, Sharma A, Bhatti Z, et al. A successful pharmacist-based quality initiative to reduce inappropriate stress ulcer prophylaxis use in an academic medical intensive care unit. Inquiry. 2018;55:46958018759116. https://doi.org/10.1177/0046958018759116
22. McDonald EG, Jones J, Green L, Jayaraman D, Lee TC. Reduction of inappropriate exit prescriptions for proton pump inhibitors: a before-after study using education paired with a web-based quality-improvement tool. J Hosp Med. 2015;10(5):281-286. https://doi.org/10.1002/jhm.2330
23. Tasaka CL, Burg C, VanOsdol SJ, et al. An interprofessional approach to reducing the overutilization of stress ulcer prophylaxis in adult medical and surgical intensive care units. Ann Pharmacother. 2014;48(4):462-469. https://doi.org/10.1177/1060028013517088
24. Zink DA, Pohlman M, Barnes M, Cannon ME. Long-term use of acid suppression started inappropriately during hospitalization. Aliment Pharmacol Ther. 2005;21(10):1203-1209. https://doi.org/10.1111/j.1365-2036.2005.02454.x
25. Pham CQ, Regal RE, Bostwick TR, Knauf KS. Acid suppressive therapy use on an inpatient internal medicine service. Ann Pharmacother. 2006;40(7-8):1261-1266. https://doi.org/10.1345/aph.1g703
26. Schoenfeld AJ, Grady D. Adverse effects associated with proton pump inhibitors [editorial]. JAMA Intern Med. 2016;176(2):172-174. https://doi.org/10.1001/jamainternmed.2015.7927
27. Laine L, Jensen DM. Management of patients with ulcer bleeding. Am J Gastroenterol. 2012;107(3):345-360; quiz 361. https://doi.org/10.1038/ajg.2011.480
1. Savarino V, Marabotto E, Zentilin P, et al. Proton pump inhibitors: use and misuse in the clinical setting. Exp Rev Clin Pharmacol. 2018;11(11):1123-1134. https://doi.org/10.1080/17512433.2018.1531703
2. Nardino RJ, Vender RJ, Herbert PN. Overuse of acid-suppressive therapy in hospitalized patients. Am J Gastroenterol. 2000;95(11):3118-3122. https://doi.org/10.1111/j.1572-0241.2000.03259.x
3. Ahrens D, Behrens G, Himmel W, Kochen MM, Chenot JF. Appropriateness of proton pump inhibitor recommendations at hospital discharge and continuation in primary care. Int J Clin Pract. 2012;66(8):767-773. https://doi.org/10.1111/j.1742-1241.2012.02973.x
4. Moledina DG, Perazella MA. PPIs and kidney disease: from AIN to CKD. J Nephrol. 2016;29(5):611-616. https://doi.org/10.1007/s40620-016-0309-2
5. Kwok CS, Arthur AK, Anibueze CI, Singh S, Cavallazzi R, Loke YK. Risk of Clostridium difficile infection with acid suppressing drugs and antibiotics: meta-analysis. Am J Gastroenterol. 2012;107(7):1011-1019. https://doi.org/10.1038/ajg.2012.108
6. Cheungpasitporn W, Thongprayoon C, Kittanamongkolchai W, et al. Proton pump inhibitors linked to hypomagnesemia: a systematic review and meta-analysis of observational studies. Ren Fail. 2015;37(7):1237-1241. https://doi.org/10.3109/0886022x.2015.1057800
7. Yang YX, Lewis JD, Epstein S, Metz DC. Long-term proton pump inhibitor therapy and risk of hip fracture. JAMA. 2006;296(24):2947-2953. https://doi.org/10.1001/jama.296.24.2947
8. Coursol CJ, Sanzari SE. Impact of stress ulcer prophylaxis algorithm study. Ann Pharmacother. 2005;39(5):810-816. https://doi.org/10.1345/aph.1d129
9. van Vliet EPM, Steyerberg EW, Otten HJ, et al. The effects of guideline implementation for proton pump inhibitor prescription on two pulmonary medicine wards. Aliment Pharmacol Ther. 2009;29(2):213-221. https://doi.org/10.1111/j.1365-2036.2008.03875.x
10. Michal J, Henry T, Street C. Impact of a pharmacist-driven protocol to decrease proton pump inhibitor use in non-intensive care hospitalized adults. Am J Health Syst Pharm. 2016;73(17 Suppl 4):S126-S132. https://doi.org/10.2146/ajhp150519
11. Herzig SJ, Guess JR, Feinbloom DB, et al. Improving appropriateness of acid-suppressive medication use via computerized clinical decision support. J Hosp Med. 2015;10(1):41-45. https://doi.org/10.1002/jhm.2260
12. Agee C, Coulter L, Hudson J. Effects of pharmacy resident led education on resident physician prescribing habits associated with stress ulcer prophylaxis in non-intensive care unit patients. Am J Health Syst Pharm. 2015;72(11 Suppl 1):S48-S52. https://doi.org/10.2146/sp150013
13. Chui D, Young F, Tejani AM, Dillon EC. Impact of academic detailing on proton pump inhibitor prescribing behaviour in a community hospital. Can Pharm J (Ott). 2011;144(2):66-71. https://doi.org/10.3821/1913-701X-144.2.66
14. Hamzat H, Sun H, Ford JC, Macleod J, Soiza RL, Mangoni AA. Inappropriate prescribing of proton pump inhibitors in older patients: effects of an educational strategy. Drugs Aging. 2012;29(8):681-690. https://doi.org/10.1007/bf03262283
15. Liberman JD, Whelan CT. Brief report: Reducing inappropriate usage of stress ulcer prophylaxis among internal medicine residents. A practice-based educational intervention. J Gen Intern Med. 2006;21(5):498-500. https://doi.org/10.1111/j.1525-1497.2006.00435.x
16. Belfield KD, Kuyumjian AG, Teran R, Amadi M, Blatt M, Bicking K. Impact of a collaborative strategy to reduce the inappropriate use of acid suppressive therapy in non-intensive care unit patients. Ann Pharmacother. 2017;51(7):577-583. https://doi.org/10.1177/1060028017698797
17. Del Giorno R, Ceschi A, Pironi M, Zasa A, Greco A, Gabutti L. Multifaceted intervention to curb in-hospital over-prescription of proton pump inhibitors: a longitudinal multicenter quasi-experimental before-and-after study. Eur J Intern Med. 2018;50:52-59. https://doi.org/10.1016/j.ejim.2017.11.002
18. Gupta R, Marshall J, Munoz JC, Kottoor R, Jamal MM, Vega KJ. Decreased acid suppression therapy overuse after education and medication reconciliation. Int J Clin Pract. 2013;67(1):60-65. https://doi.org/10.1111/ijcp.12046
19. Hatch JB, Schulz L, Fish JT. Stress ulcer prophylaxis: reducing non-indicated prescribing after hospital discharge. Ann Pharmacother. 2010;44(10):1565-1571. https://doi.org/10.1345/aph.1p167
20. Khalili H, Dashti-Khavidaki S, Hossein Talasaz AH, Tabeefar H, Hendoiee N. Descriptive analysis of a clinical pharmacy intervention to improve the appropriate use of stress ulcer prophylaxis in a hospital infectious disease ward. J Manag Care Pharm. 2010;16(2):114-121. https://doi.org/10.18553/jmcp.2010.16.2.114
21. Masood U, Sharma A, Bhatti Z, et al. A successful pharmacist-based quality initiative to reduce inappropriate stress ulcer prophylaxis use in an academic medical intensive care unit. Inquiry. 2018;55:46958018759116. https://doi.org/10.1177/0046958018759116
22. McDonald EG, Jones J, Green L, Jayaraman D, Lee TC. Reduction of inappropriate exit prescriptions for proton pump inhibitors: a before-after study using education paired with a web-based quality-improvement tool. J Hosp Med. 2015;10(5):281-286. https://doi.org/10.1002/jhm.2330
23. Tasaka CL, Burg C, VanOsdol SJ, et al. An interprofessional approach to reducing the overutilization of stress ulcer prophylaxis in adult medical and surgical intensive care units. Ann Pharmacother. 2014;48(4):462-469. https://doi.org/10.1177/1060028013517088
24. Zink DA, Pohlman M, Barnes M, Cannon ME. Long-term use of acid suppression started inappropriately during hospitalization. Aliment Pharmacol Ther. 2005;21(10):1203-1209. https://doi.org/10.1111/j.1365-2036.2005.02454.x
25. Pham CQ, Regal RE, Bostwick TR, Knauf KS. Acid suppressive therapy use on an inpatient internal medicine service. Ann Pharmacother. 2006;40(7-8):1261-1266. https://doi.org/10.1345/aph.1g703
26. Schoenfeld AJ, Grady D. Adverse effects associated with proton pump inhibitors [editorial]. JAMA Intern Med. 2016;176(2):172-174. https://doi.org/10.1001/jamainternmed.2015.7927
27. Laine L, Jensen DM. Management of patients with ulcer bleeding. Am J Gastroenterol. 2012;107(3):345-360; quiz 361. https://doi.org/10.1038/ajg.2011.480
© 2021 Society of Hospital Medicine