User login
Predicting is tough, especially about the future

Quinn and Fang, in this issue of the Journal discuss efforts to predict bleeding complications associated with anticoagulant therapy in elderly patients. They note, as others have suggested, that we may fear the risk of severe anticoagulant-associated bleeding more than is warranted based on the data. The level of that fear and the risk of bleeding depend on the specific need for anticoagulant therapy in a given patient and on the risk of serious adverse outcomes from thrombosis that the anticoagulation is supposed to prevent. All prediction models are based on an “average” patient with certain characteristics. But of course none of our patients are average.
The studies Quinn and Fang discuss focus on vitamin K antagonist therapy. There is probably not enough practice-based or trial-based evidence yet to evaluate the risks associated with the new generation of anticoagulants.
All prediction models have limitations. The recent discussion on establishing a risk-based strategy to guide institution of lipid-lowering therapy highlights the challenges inherent in trying to base therapeutic decisions on predictive models. But however imperfect, models are still widely used to predict fracture risk in patients being considered for bone antiresorptive therapy and to predict the need for anticoagulation therapy or further diagnostic testing in patients with potential deep vein thrombosis or atrial fibrillation.
The decision to start anticoagulation in an elderly patient is often informed by the possibility of an easily recognized and feared risk factor for bleeding complications—falling. Falls are certainly important and are a major contributor to subdural hematoma and complicated hip fracture. But there are more common causes of severe bleeding complications that are less easily predicted by functional assessment of the patient. Nonetheless, fall risk can be lessened by prescribing exercise programs such as tai chi to improve balance, limiting the use of drugs associated with falls in the elderly, perhaps correcting hyponatremia, and testing for orthostatic hypotension as part of the physical examination. (Mild compression stockings and medication adjustment may reduce orthostasis.) Some of these interventions are easily accomplished, and probably should be done with all of our elderly and frail patients.
As we build more risk calculators into our electronic medical records, we must continue to consider their limitations as well as their specific utility. To paraphrase Yogi Berra, making predictions is tough, especially about the future.
Quinn and Fang, in this issue of the Journal discuss efforts to predict bleeding complications associated with anticoagulant therapy in elderly patients. They note, as others have suggested, that we may fear the risk of severe anticoagulant-associated bleeding more than is warranted based on the data. The level of that fear and the risk of bleeding depend on the specific need for anticoagulant therapy in a given patient and on the risk of serious adverse outcomes from thrombosis that the anticoagulation is supposed to prevent. All prediction models are based on an “average” patient with certain characteristics. But of course none of our patients are average.
The studies Quinn and Fang discuss focus on vitamin K antagonist therapy. There is probably not enough practice-based or trial-based evidence yet to evaluate the risks associated with the new generation of anticoagulants.
All prediction models have limitations. The recent discussion on establishing a risk-based strategy to guide institution of lipid-lowering therapy highlights the challenges inherent in trying to base therapeutic decisions on predictive models. But however imperfect, models are still widely used to predict fracture risk in patients being considered for bone antiresorptive therapy and to predict the need for anticoagulation therapy or further diagnostic testing in patients with potential deep vein thrombosis or atrial fibrillation.
The decision to start anticoagulation in an elderly patient is often informed by the possibility of an easily recognized and feared risk factor for bleeding complications—falling. Falls are certainly important and are a major contributor to subdural hematoma and complicated hip fracture. But there are more common causes of severe bleeding complications that are less easily predicted by functional assessment of the patient. Nonetheless, fall risk can be lessened by prescribing exercise programs such as tai chi to improve balance, limiting the use of drugs associated with falls in the elderly, perhaps correcting hyponatremia, and testing for orthostatic hypotension as part of the physical examination. (Mild compression stockings and medication adjustment may reduce orthostasis.) Some of these interventions are easily accomplished, and probably should be done with all of our elderly and frail patients.
As we build more risk calculators into our electronic medical records, we must continue to consider their limitations as well as their specific utility. To paraphrase Yogi Berra, making predictions is tough, especially about the future.
Quinn and Fang, in this issue of the Journal discuss efforts to predict bleeding complications associated with anticoagulant therapy in elderly patients. They note, as others have suggested, that we may fear the risk of severe anticoagulant-associated bleeding more than is warranted based on the data. The level of that fear and the risk of bleeding depend on the specific need for anticoagulant therapy in a given patient and on the risk of serious adverse outcomes from thrombosis that the anticoagulation is supposed to prevent. All prediction models are based on an “average” patient with certain characteristics. But of course none of our patients are average.
The studies Quinn and Fang discuss focus on vitamin K antagonist therapy. There is probably not enough practice-based or trial-based evidence yet to evaluate the risks associated with the new generation of anticoagulants.
All prediction models have limitations. The recent discussion on establishing a risk-based strategy to guide institution of lipid-lowering therapy highlights the challenges inherent in trying to base therapeutic decisions on predictive models. But however imperfect, models are still widely used to predict fracture risk in patients being considered for bone antiresorptive therapy and to predict the need for anticoagulation therapy or further diagnostic testing in patients with potential deep vein thrombosis or atrial fibrillation.
The decision to start anticoagulation in an elderly patient is often informed by the possibility of an easily recognized and feared risk factor for bleeding complications—falling. Falls are certainly important and are a major contributor to subdural hematoma and complicated hip fracture. But there are more common causes of severe bleeding complications that are less easily predicted by functional assessment of the patient. Nonetheless, fall risk can be lessened by prescribing exercise programs such as tai chi to improve balance, limiting the use of drugs associated with falls in the elderly, perhaps correcting hyponatremia, and testing for orthostatic hypotension as part of the physical examination. (Mild compression stockings and medication adjustment may reduce orthostasis.) Some of these interventions are easily accomplished, and probably should be done with all of our elderly and frail patients.
As we build more risk calculators into our electronic medical records, we must continue to consider their limitations as well as their specific utility. To paraphrase Yogi Berra, making predictions is tough, especially about the future.

Self-monitoring of blood glucose: Advice for providers and patients
Self-monitoring of blood glucose is a critical part of diabetes management, with many benefits. It promotes personal responsibility and provides opportunities for better control. It allows for detection of blood glucose extremes, thus helping to reduce blood glucose fluctuations. It also helps both the patient and the provider make informed decisions and can help reduce microvascular and macrovascular complications.
Studies have shown that hemoglobin A1c levels are lower if glucose is tested more frequently.1 Most people with type 1 diabetes and many with type 2 diabetes self-monitor their blood glucose levels.
This article discusses who should monitor their blood glucose and how often, types of meters and supplies available, advances in technology, and limitations of current blood glucose meters.
WHETHER AND HOW OFTEN TO MONITOR
In clinical practice, advice about whether patients should monitor their blood glucose levels and how often to do it depends on the type of diabetes therapy, the need to titrate the dose or change the regimen, and the patient’s preferences, dexterity, and visual acuity. The frequency of testing also often depends on financial considerations and insurance coverage.
In patients with type 1 diabetes and insulin-treated type 2 diabetes, the role of glucose self-monitoring is clear. The American Diabetes Association (ADA) recommends that patients receiving multiple insulin injections daily or on an insulin pump measure their blood glucose at least before meals and snacks, occasionally after meals, at bedtime, before exercise, when they suspect their blood glucose level is low, after treating low blood glucose until they are normoglycemic, and before critical tasks such as driving.2
The Diabetes Control and Complications Trial (DCCT)3 and the DCCT/Epidemiology of Diabetes Interventions and Complications (DCCT/EDIC) study4 showed that intensive insulin therapy effectively delays the onset and slows the progression of microvascular and macrovacscular disease. Self-monitoring of blood glucose is an integral part of intensive insulin therapy, allowing for dose adjustments based on immediate blood glucose readings, thereby reducing the risks of hyperglycemia and hypoglycemia.
For patients taking a single daily dose of basal insulin, fasting blood glucose values are often used to titrate the basal insulin dose.3
Patients with type 2 diabetes on oral hypoglycemic agents such as sulfonylureas and meglitinides are at risk of hypoglycemia. Although a review of the literature could find no studies to support recommendations for specific testing frequency for patients taking these medications, it stands to reason that the potential for hypoglycemia would indicate a clear need for regular self-monitoring. Checking the blood glucose once or twice daily, typically fasting, 2 hours after the largest meal or at bedtime, provides useful data points for the patient and the provider. As with patients on insulin, testing before driving also reduces the risk of a motor vehicle accident caused by hypoglycemia.
In any patient who is testing one or two times per day, staggering the testing time on different days can give valuable insight into glucose control at different times of day, including after meals and at night.
In patients on nonintensive regimens and at low risk of hypoglycemia, glucose self-monitoring may be less critical. Nonintensive regimens with a low risk of hypoglycemia include diet and exercise alone and diet and exercise with a medication that is not insulin or an insulin secretagogue. In these cases, self-monitoring is often not seen as clinically useful or cost-effective, and hemoglobin A1c is used as a marker.
Admittedly, few randomized controlled trials have been done in which patients were treated according to identical protocols except for glucose self-monitoring, but outcomes from the published studies support the use of structured self-monitoring of blood glucose for improvement in clinical outcomes and quality of life when self-monitoring is incorporated into a comprehensive management plan.5–9 By providing feedback, self-monitoring encourages patients to actively participate in controlling and treating their disease. It helps them to recognize the impact of blood glucose on their own self-management decisions in the areas of diet, exercise, stress management, and medications. Therefore, the ADA recommends that healthcare providers encourage their patients to perform self-monitoring even if on nonintensive regimens. For these patients, checking even two or three times per week can help them to learn about the factors that affect their blood glucose.2
BLOOD GLUCOSE TARGETS
The ADA2 recommends the following glycemic goals for most nonpregnant adults:
- Fasting and premeal—80–130 mg/dL
- 2-hour postprandial—less than 180 mg/dL
- Bedtime—100–150 mg/dL.
However, diabetes management should be individualized on the basis of age and other comorbidities. For example, geriatric patients who have frequent episodes of hypoglycemia are prone to more harm than benefit from intensifying therapy to achieve these targets. Consequently, they may be candidates for more relaxed goals to avoid episodes of dangerous hypoglycemia.
When discussing blood glucose targets, an important but often overlooked concern is how the patient perceives the results. Providers and patients alike often describe readings as “good” or “bad.” This interpretation can lead to feelings of disappointment and failure in the patient and frustration in the provider. Instead, high blood glucose readings should be viewed as a way to identify opportunities for change. Patients may be more willing to check and even log their blood glucose levels if they see this information as an instrument to be used in the collaborative relationship with their provider.
CHOOSING A BLOOD GLUCOSE METER
Barring any special needs of the patient, meters are often selected on the basis of the patients’ insurance coverage for self-monitoring supplies (test strips and lancets), because of the high cost of test strips when purchased out-of-pocket. Meters themselves are usually relatively inexpensive, since the manufacturers commonly give them away as free samples to providers, who pass them along to patients. They also can often be purchased using coupons at a significant discount.
Without insurance coverage, test strips can cost $0.83 to $1.76 per strip for the most popular brands of meters. For patients without insurance coverage for supplies, the lowest-cost test strips currently available are for the ReliOn Prime Blood Glucose Monitoring System (ie, meter) sold at Walmart. Although ReliOn meters are not given out as samples in providers’ offices, the manufacturer’s suggested retail price is $16.24. More importantly, the suggested retail price for ReliOn Prime test strips is $9.00 for a bottle of 50 strips, or $0.18 per strip.10
For patients with special needs
For patients with special needs, there are meters that can make self-monitoring more convenient. For a patient who has problems with dexterity, grasping small test strips may be difficult. Two options are:
- Accu-Chek Compact Plus, which uses a 17-strip drum loaded into the meter
- Bayer Breeze2, which uses a 10-strip disk.
Both of the above dispense one strip at a time and eliminate the need to handle individual test strips.
Patients with poor visual acuity also face challenges with self-monitoring. Meters with options such as a backlight, a color screen, or a large display can help. Other meters talk, allowing patients to hear settings and blood glucose results. Examples are:
- Prodigy Autocode
- Prodigy Voice
- Embrace.
Other meter options depend on patient preference. Features that can affect patient choice include the ability to flag readings (eg, premeal, postmeal, exercise) and transfer data to other devices, blood sample size, meter size, touchscreen, meter memory and storage, rechargeable vs replaceable batteries, and the time it takes the meter to display the glucose reading.
Meters with advanced functions
For patients who want or need more advanced options, meters are now offering more feedback.
The OneTouch Verio family of meters helps patients spot patterns in their blood glucose levels. In addition, the Verio Flex and Verio Sync meters can sync with the OneTouch Reveal mobile app, which provides reports for the patient to view and send to the healthcare provider.
The Accu-Chek Aviva Expert has a bolus calculation function. Settings such as carbohydrate ratios, insulin sensitivity, targets, and active insulin can be programmed into the meter, which uses this information to give the patient dosing suggestions for rapid-acting insulin when carbohydrate intake is entered or blood glucose levels are checked. Another Accu-Chek meter, the Aviva Connect, can wirelessly transmit blood glucose results to the Accu-Chek Connect mobile app.
For a complete and regularly updated list of meters and their features, we encourage patients and healthcare providers to refer to the ADA’s Diabetes Forecast magazine. The magazine publishes a consumer guide every January that includes a comprehensive list of blood glucose meters. Past issues of the guide are available at www.diabetesforecast.org/past-issues-archive.html.
METER ACCURACY
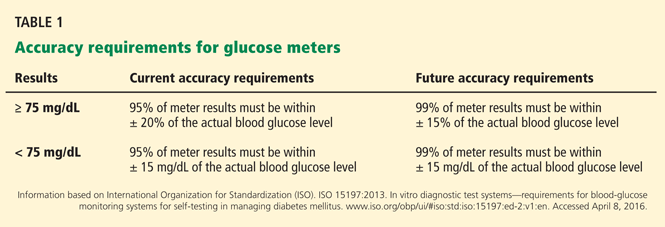
Even though patients and providers use glucose self-monitoring results to make important decisions about diabetes management, the meters have limitations in accuracy. Accuracy comparisons from third-party sources are rare due to the cost of accuracy testing. However, the US Food and Drug Administration (FDA) requires all home glucose meters to meet accuracy standards set by the International Organization for Standardization (ISO). Currently, the FDA uses ISO standard 15197:2003, but ISO has published a revision, ISO standard 15197:2013, with stricter guidelines that have yet to be adopted by the FDA.10,11 Current and future guidelines are shown in Table 1.10
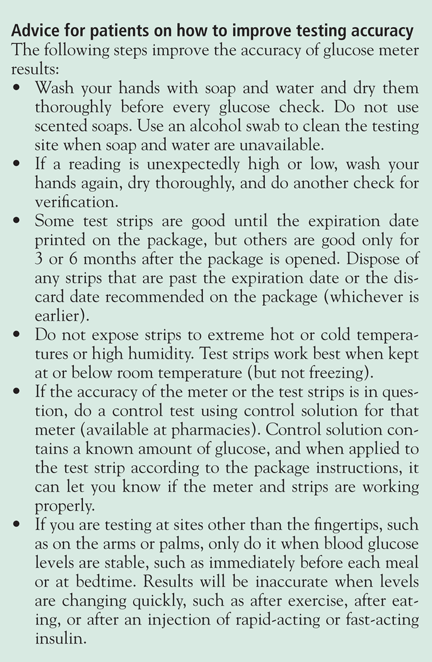
In addition to variations in accuracy that are deemed acceptable by the FDA, there are other more controllable factors that can further affect the accuracy of glucose meter results. Expired test strips, unwashed hands, poor sampling technique, storage of test strips in extreme temperatures or humidity, and a low hematocrit level all can cause inaccurate readings.
If the patient has a low hematocrit, consider recommending a meter proven to have stable performance in the setting of low hematocrit. These meters are highlighted in a 2013 study by Ramljak et al.12
LANCETS, LANCING DEVICES, AND TECHNIQUES
Along with a variety of meters, patients also have an array of lancets and lancing devices from which to choose. Many patients use the brand of lancet device and lancets that come in their meter starter kit, but they can use other brands if desired. For cost-conscious patients, lancets are significantly more affordable than test strips, even for those without insurance coverage. Prices can be as low as $0.03 per lancet for some store-brand 33-gauge lancets. Name-brand lancets are more expensive than store-brand, but at $0.06 to $0.16 per lancet, many patients will even find these to be affordable if they must pay out of pocket.
Special needs may also prompt patients to choose a different lancet device than the one that came with their meter. For patients who have poor dexterity or are afraid to look at needles, the Accu-Chek FastClix lancing device uses drums with six preloaded lancets, eliminating the need to see and handle individual lancets. The FastClix device is included in the starter kits for the Accu-Chek Nano and Accu-Chek Connect meters and can also be ordered separately at pharmacies.
Reducing pain when testing
A common complaint about glucose self-monitoring is that it hurts. Below are some tips for reducing pain when testing:
- Use a new lancet for each blood glucose check.
- Choose a lancet device with a depth gauge and select the lowest setting that allows for a sufficient sample size.
- Lancets come in a variety of sizes, typically from 28 gauge to 33 gauge, so choose a lancet with a smaller gauge (ie, a higher gauge number).
- Poke the side of the fingertip instead of the end or the middle.
- Alternate the fingers instead of repeatedly using the same finger.
- To minimize pain from forceful squeezing of the fingertip to get a sufficient blood sample, start squeezing the palm and push the blood progressively into the fingertip.
- Consider alternate-site testing, especially if you have painful upper-extremity neuropathy.
LOGGING BLOOD GLUCOSE READINGS
Although many meters can automatically transfer their data to mobile devices or computers, patients are still encouraged to log their glucose readings manually. Not only does this give feedback to the provider in the event that the downloading software is not available in that provider’s office, it also allows patients to learn how to identify patterns in their readings and make changes in their diabetes self-management.
In the past, all logging was done on paper forms or in log books, but today’s technology offers other options. Several meters offer downloading software for home use that displays the data in a usable format. Some smartphone apps allow patients to enter glucose readings and other useful diabetes information such as food intake and exercise. Below are examples of smartphone apps that can help patients track glucose levels and much more:
- mySugr (iPhone and Android)
- Glucose Buddy (iPhone and Android)
- OnTrack Diabetes (Android)
- Glucool Diabetes (Android) (also available in a premium version).
- Glooko (iPhone and Android). This app requires purchase of a compatible cable to connect the patient’s phone to the meter, which then allows readings to be transferred directly to the app.
THE ROLE OF THE CERTIFIED DIABETES EDUCATOR
One of the most useful resources available to providers is the assistance of a certified diabetes educator, who can teach a patient the basic operation of a blood glucose meter and educate the patient on all topics discussed in this article and more.
Certified diabetes educators are instrumental in helping patients understand blood glucose targets, the rationale for glucose self-monitoring, logging, pattern management, special features in meters, control testing, and alternate-site testing, and using the results of testing to make meaningful changes in how they self-manage their diabetes. Education should include discussions about topics such as meal planning, exercise, and medications to help patients fully grasp the impact of their daily decisions on their blood glucose control.
- Polonsky WH, Fisher L, Schikman CH, et al. Structured self-monitoring of blood glucose significantly reduces A1C levels in poorly controlled, noninsulin-treated type 2 diabetes: results from the Structured Testing Program study. Diabetes Care 2011; 34:262–267.
- American Diabetes Association (ADA). Standards of medical care in diabetes—2016. Glycemic targets. Diabetes Care 2016; 39(suppl):S39–S46.
- The Diabetes Control and Complications Trial Research Group. The effect of intensive treatment of diabetes on the development and progression of long-term complications in insulin-dependent diabetes mellitus. N Engl J Med 1993; 329:977–986.
- Nathan DM, Cleary PA, Backlund JY, et al; Diabetes Control and Complications Trial/Epidemiology of Diabetes Interventions and Complications (DCCT/EDIC) Study Research Group. Intensive diabetes treatment and cardiovascular disease in patients with type 1 diabetes. N Engl J Med 2005; 353:2643–2653.
- International Diabetes Federation (IDF). IDF guideline on self-monitoring of blood glucose in non-insulin treated type 2 diabetes. www.idf.org/guidelines/self-monitoring. Accessed April 8, 2016.
- Bosi E, Scavini M, Ceriello A, et al; PRISMA Study Group. Intensive structured self-monitoring of blood glucose and glycemic control in noninsulin-treated type 2 diabetes: the PRISMA randomized trial. Diabetes Care 2013; 36:2887–2894.
- Franciosi M, Lucisano G, Pellegrini F, et al; ROSES Study Group. ROSES: role of self-monitoring of blood glucose and intensive education in patients with type 2 diabetes not receiving insulin. A pilot randomized clinical trial. Diabet Med 2011; 28:789–796.
- Durán A, Martín P, Runkle I, et al. Benefits of self-monitoring blood glucose in the management of new-onset type 2 diabetes mellitus: the St Carlos Study, a prospective randomized clinic-based interventional study with parallel groups. J Diabetes 2010; 2:203–211.
- Kempf K, Kruse J, Martin S. ROSSO-in-praxi: a self-monitoring of blood glucose-structured 12-week lifestyle intervention significantly improves glucometabolic control of patients with type 2 diabetes mellitus. Diabetes Technol Ther 2010; 12:547–553.
- Wahowiak L; American Diabetes Association (ADA). Blood glucose meters 2014. www.diabetesforecast.org/2014/Jan/blood-glucose-meters-2014.html. Accessed April 10, 2016.
- International Organization for Standardization (ISO). ISO 15197:2013. In vitro diagnostic test systems—requirements for blood-glucose monitoring systems for self-testing in managing diabetes mellitus. www.iso.org/obp/ui/#iso:std:iso:15197:ed-2:v1:en. Accessed April 8, 2016.
- Ramljak S, Lock JP, Schipper C, et al. Hematocrit interference of blood glucose meters for patient self-measurement. J Diabetes Sci Technol 2013; 7:179–189.
Self-monitoring of blood glucose is a critical part of diabetes management, with many benefits. It promotes personal responsibility and provides opportunities for better control. It allows for detection of blood glucose extremes, thus helping to reduce blood glucose fluctuations. It also helps both the patient and the provider make informed decisions and can help reduce microvascular and macrovascular complications.
Studies have shown that hemoglobin A1c levels are lower if glucose is tested more frequently.1 Most people with type 1 diabetes and many with type 2 diabetes self-monitor their blood glucose levels.
This article discusses who should monitor their blood glucose and how often, types of meters and supplies available, advances in technology, and limitations of current blood glucose meters.
WHETHER AND HOW OFTEN TO MONITOR
In clinical practice, advice about whether patients should monitor their blood glucose levels and how often to do it depends on the type of diabetes therapy, the need to titrate the dose or change the regimen, and the patient’s preferences, dexterity, and visual acuity. The frequency of testing also often depends on financial considerations and insurance coverage.
In patients with type 1 diabetes and insulin-treated type 2 diabetes, the role of glucose self-monitoring is clear. The American Diabetes Association (ADA) recommends that patients receiving multiple insulin injections daily or on an insulin pump measure their blood glucose at least before meals and snacks, occasionally after meals, at bedtime, before exercise, when they suspect their blood glucose level is low, after treating low blood glucose until they are normoglycemic, and before critical tasks such as driving.2
The Diabetes Control and Complications Trial (DCCT)3 and the DCCT/Epidemiology of Diabetes Interventions and Complications (DCCT/EDIC) study4 showed that intensive insulin therapy effectively delays the onset and slows the progression of microvascular and macrovacscular disease. Self-monitoring of blood glucose is an integral part of intensive insulin therapy, allowing for dose adjustments based on immediate blood glucose readings, thereby reducing the risks of hyperglycemia and hypoglycemia.
For patients taking a single daily dose of basal insulin, fasting blood glucose values are often used to titrate the basal insulin dose.3
Patients with type 2 diabetes on oral hypoglycemic agents such as sulfonylureas and meglitinides are at risk of hypoglycemia. Although a review of the literature could find no studies to support recommendations for specific testing frequency for patients taking these medications, it stands to reason that the potential for hypoglycemia would indicate a clear need for regular self-monitoring. Checking the blood glucose once or twice daily, typically fasting, 2 hours after the largest meal or at bedtime, provides useful data points for the patient and the provider. As with patients on insulin, testing before driving also reduces the risk of a motor vehicle accident caused by hypoglycemia.
In any patient who is testing one or two times per day, staggering the testing time on different days can give valuable insight into glucose control at different times of day, including after meals and at night.
In patients on nonintensive regimens and at low risk of hypoglycemia, glucose self-monitoring may be less critical. Nonintensive regimens with a low risk of hypoglycemia include diet and exercise alone and diet and exercise with a medication that is not insulin or an insulin secretagogue. In these cases, self-monitoring is often not seen as clinically useful or cost-effective, and hemoglobin A1c is used as a marker.
Admittedly, few randomized controlled trials have been done in which patients were treated according to identical protocols except for glucose self-monitoring, but outcomes from the published studies support the use of structured self-monitoring of blood glucose for improvement in clinical outcomes and quality of life when self-monitoring is incorporated into a comprehensive management plan.5–9 By providing feedback, self-monitoring encourages patients to actively participate in controlling and treating their disease. It helps them to recognize the impact of blood glucose on their own self-management decisions in the areas of diet, exercise, stress management, and medications. Therefore, the ADA recommends that healthcare providers encourage their patients to perform self-monitoring even if on nonintensive regimens. For these patients, checking even two or three times per week can help them to learn about the factors that affect their blood glucose.2
BLOOD GLUCOSE TARGETS
The ADA2 recommends the following glycemic goals for most nonpregnant adults:
- Fasting and premeal—80–130 mg/dL
- 2-hour postprandial—less than 180 mg/dL
- Bedtime—100–150 mg/dL.
However, diabetes management should be individualized on the basis of age and other comorbidities. For example, geriatric patients who have frequent episodes of hypoglycemia are prone to more harm than benefit from intensifying therapy to achieve these targets. Consequently, they may be candidates for more relaxed goals to avoid episodes of dangerous hypoglycemia.
When discussing blood glucose targets, an important but often overlooked concern is how the patient perceives the results. Providers and patients alike often describe readings as “good” or “bad.” This interpretation can lead to feelings of disappointment and failure in the patient and frustration in the provider. Instead, high blood glucose readings should be viewed as a way to identify opportunities for change. Patients may be more willing to check and even log their blood glucose levels if they see this information as an instrument to be used in the collaborative relationship with their provider.
CHOOSING A BLOOD GLUCOSE METER
Barring any special needs of the patient, meters are often selected on the basis of the patients’ insurance coverage for self-monitoring supplies (test strips and lancets), because of the high cost of test strips when purchased out-of-pocket. Meters themselves are usually relatively inexpensive, since the manufacturers commonly give them away as free samples to providers, who pass them along to patients. They also can often be purchased using coupons at a significant discount.
Without insurance coverage, test strips can cost $0.83 to $1.76 per strip for the most popular brands of meters. For patients without insurance coverage for supplies, the lowest-cost test strips currently available are for the ReliOn Prime Blood Glucose Monitoring System (ie, meter) sold at Walmart. Although ReliOn meters are not given out as samples in providers’ offices, the manufacturer’s suggested retail price is $16.24. More importantly, the suggested retail price for ReliOn Prime test strips is $9.00 for a bottle of 50 strips, or $0.18 per strip.10
For patients with special needs
For patients with special needs, there are meters that can make self-monitoring more convenient. For a patient who has problems with dexterity, grasping small test strips may be difficult. Two options are:
- Accu-Chek Compact Plus, which uses a 17-strip drum loaded into the meter
- Bayer Breeze2, which uses a 10-strip disk.
Both of the above dispense one strip at a time and eliminate the need to handle individual test strips.
Patients with poor visual acuity also face challenges with self-monitoring. Meters with options such as a backlight, a color screen, or a large display can help. Other meters talk, allowing patients to hear settings and blood glucose results. Examples are:
- Prodigy Autocode
- Prodigy Voice
- Embrace.
Other meter options depend on patient preference. Features that can affect patient choice include the ability to flag readings (eg, premeal, postmeal, exercise) and transfer data to other devices, blood sample size, meter size, touchscreen, meter memory and storage, rechargeable vs replaceable batteries, and the time it takes the meter to display the glucose reading.
Meters with advanced functions
For patients who want or need more advanced options, meters are now offering more feedback.
The OneTouch Verio family of meters helps patients spot patterns in their blood glucose levels. In addition, the Verio Flex and Verio Sync meters can sync with the OneTouch Reveal mobile app, which provides reports for the patient to view and send to the healthcare provider.
The Accu-Chek Aviva Expert has a bolus calculation function. Settings such as carbohydrate ratios, insulin sensitivity, targets, and active insulin can be programmed into the meter, which uses this information to give the patient dosing suggestions for rapid-acting insulin when carbohydrate intake is entered or blood glucose levels are checked. Another Accu-Chek meter, the Aviva Connect, can wirelessly transmit blood glucose results to the Accu-Chek Connect mobile app.
For a complete and regularly updated list of meters and their features, we encourage patients and healthcare providers to refer to the ADA’s Diabetes Forecast magazine. The magazine publishes a consumer guide every January that includes a comprehensive list of blood glucose meters. Past issues of the guide are available at www.diabetesforecast.org/past-issues-archive.html.
METER ACCURACY
Even though patients and providers use glucose self-monitoring results to make important decisions about diabetes management, the meters have limitations in accuracy. Accuracy comparisons from third-party sources are rare due to the cost of accuracy testing. However, the US Food and Drug Administration (FDA) requires all home glucose meters to meet accuracy standards set by the International Organization for Standardization (ISO). Currently, the FDA uses ISO standard 15197:2003, but ISO has published a revision, ISO standard 15197:2013, with stricter guidelines that have yet to be adopted by the FDA.10,11 Current and future guidelines are shown in Table 1.10
In addition to variations in accuracy that are deemed acceptable by the FDA, there are other more controllable factors that can further affect the accuracy of glucose meter results. Expired test strips, unwashed hands, poor sampling technique, storage of test strips in extreme temperatures or humidity, and a low hematocrit level all can cause inaccurate readings.
If the patient has a low hematocrit, consider recommending a meter proven to have stable performance in the setting of low hematocrit. These meters are highlighted in a 2013 study by Ramljak et al.12
LANCETS, LANCING DEVICES, AND TECHNIQUES
Along with a variety of meters, patients also have an array of lancets and lancing devices from which to choose. Many patients use the brand of lancet device and lancets that come in their meter starter kit, but they can use other brands if desired. For cost-conscious patients, lancets are significantly more affordable than test strips, even for those without insurance coverage. Prices can be as low as $0.03 per lancet for some store-brand 33-gauge lancets. Name-brand lancets are more expensive than store-brand, but at $0.06 to $0.16 per lancet, many patients will even find these to be affordable if they must pay out of pocket.
Special needs may also prompt patients to choose a different lancet device than the one that came with their meter. For patients who have poor dexterity or are afraid to look at needles, the Accu-Chek FastClix lancing device uses drums with six preloaded lancets, eliminating the need to see and handle individual lancets. The FastClix device is included in the starter kits for the Accu-Chek Nano and Accu-Chek Connect meters and can also be ordered separately at pharmacies.
Reducing pain when testing
A common complaint about glucose self-monitoring is that it hurts. Below are some tips for reducing pain when testing:
- Use a new lancet for each blood glucose check.
- Choose a lancet device with a depth gauge and select the lowest setting that allows for a sufficient sample size.
- Lancets come in a variety of sizes, typically from 28 gauge to 33 gauge, so choose a lancet with a smaller gauge (ie, a higher gauge number).
- Poke the side of the fingertip instead of the end or the middle.
- Alternate the fingers instead of repeatedly using the same finger.
- To minimize pain from forceful squeezing of the fingertip to get a sufficient blood sample, start squeezing the palm and push the blood progressively into the fingertip.
- Consider alternate-site testing, especially if you have painful upper-extremity neuropathy.
LOGGING BLOOD GLUCOSE READINGS
Although many meters can automatically transfer their data to mobile devices or computers, patients are still encouraged to log their glucose readings manually. Not only does this give feedback to the provider in the event that the downloading software is not available in that provider’s office, it also allows patients to learn how to identify patterns in their readings and make changes in their diabetes self-management.
In the past, all logging was done on paper forms or in log books, but today’s technology offers other options. Several meters offer downloading software for home use that displays the data in a usable format. Some smartphone apps allow patients to enter glucose readings and other useful diabetes information such as food intake and exercise. Below are examples of smartphone apps that can help patients track glucose levels and much more:
- mySugr (iPhone and Android)
- Glucose Buddy (iPhone and Android)
- OnTrack Diabetes (Android)
- Glucool Diabetes (Android) (also available in a premium version).
- Glooko (iPhone and Android). This app requires purchase of a compatible cable to connect the patient’s phone to the meter, which then allows readings to be transferred directly to the app.
THE ROLE OF THE CERTIFIED DIABETES EDUCATOR
One of the most useful resources available to providers is the assistance of a certified diabetes educator, who can teach a patient the basic operation of a blood glucose meter and educate the patient on all topics discussed in this article and more.
Certified diabetes educators are instrumental in helping patients understand blood glucose targets, the rationale for glucose self-monitoring, logging, pattern management, special features in meters, control testing, and alternate-site testing, and using the results of testing to make meaningful changes in how they self-manage their diabetes. Education should include discussions about topics such as meal planning, exercise, and medications to help patients fully grasp the impact of their daily decisions on their blood glucose control.
Self-monitoring of blood glucose is a critical part of diabetes management, with many benefits. It promotes personal responsibility and provides opportunities for better control. It allows for detection of blood glucose extremes, thus helping to reduce blood glucose fluctuations. It also helps both the patient and the provider make informed decisions and can help reduce microvascular and macrovascular complications.
Studies have shown that hemoglobin A1c levels are lower if glucose is tested more frequently.1 Most people with type 1 diabetes and many with type 2 diabetes self-monitor their blood glucose levels.
This article discusses who should monitor their blood glucose and how often, types of meters and supplies available, advances in technology, and limitations of current blood glucose meters.
WHETHER AND HOW OFTEN TO MONITOR
In clinical practice, advice about whether patients should monitor their blood glucose levels and how often to do it depends on the type of diabetes therapy, the need to titrate the dose or change the regimen, and the patient’s preferences, dexterity, and visual acuity. The frequency of testing also often depends on financial considerations and insurance coverage.
In patients with type 1 diabetes and insulin-treated type 2 diabetes, the role of glucose self-monitoring is clear. The American Diabetes Association (ADA) recommends that patients receiving multiple insulin injections daily or on an insulin pump measure their blood glucose at least before meals and snacks, occasionally after meals, at bedtime, before exercise, when they suspect their blood glucose level is low, after treating low blood glucose until they are normoglycemic, and before critical tasks such as driving.2
The Diabetes Control and Complications Trial (DCCT)3 and the DCCT/Epidemiology of Diabetes Interventions and Complications (DCCT/EDIC) study4 showed that intensive insulin therapy effectively delays the onset and slows the progression of microvascular and macrovacscular disease. Self-monitoring of blood glucose is an integral part of intensive insulin therapy, allowing for dose adjustments based on immediate blood glucose readings, thereby reducing the risks of hyperglycemia and hypoglycemia.
For patients taking a single daily dose of basal insulin, fasting blood glucose values are often used to titrate the basal insulin dose.3
Patients with type 2 diabetes on oral hypoglycemic agents such as sulfonylureas and meglitinides are at risk of hypoglycemia. Although a review of the literature could find no studies to support recommendations for specific testing frequency for patients taking these medications, it stands to reason that the potential for hypoglycemia would indicate a clear need for regular self-monitoring. Checking the blood glucose once or twice daily, typically fasting, 2 hours after the largest meal or at bedtime, provides useful data points for the patient and the provider. As with patients on insulin, testing before driving also reduces the risk of a motor vehicle accident caused by hypoglycemia.
In any patient who is testing one or two times per day, staggering the testing time on different days can give valuable insight into glucose control at different times of day, including after meals and at night.
In patients on nonintensive regimens and at low risk of hypoglycemia, glucose self-monitoring may be less critical. Nonintensive regimens with a low risk of hypoglycemia include diet and exercise alone and diet and exercise with a medication that is not insulin or an insulin secretagogue. In these cases, self-monitoring is often not seen as clinically useful or cost-effective, and hemoglobin A1c is used as a marker.
Admittedly, few randomized controlled trials have been done in which patients were treated according to identical protocols except for glucose self-monitoring, but outcomes from the published studies support the use of structured self-monitoring of blood glucose for improvement in clinical outcomes and quality of life when self-monitoring is incorporated into a comprehensive management plan.5–9 By providing feedback, self-monitoring encourages patients to actively participate in controlling and treating their disease. It helps them to recognize the impact of blood glucose on their own self-management decisions in the areas of diet, exercise, stress management, and medications. Therefore, the ADA recommends that healthcare providers encourage their patients to perform self-monitoring even if on nonintensive regimens. For these patients, checking even two or three times per week can help them to learn about the factors that affect their blood glucose.2
BLOOD GLUCOSE TARGETS
The ADA2 recommends the following glycemic goals for most nonpregnant adults:
- Fasting and premeal—80–130 mg/dL
- 2-hour postprandial—less than 180 mg/dL
- Bedtime—100–150 mg/dL.
However, diabetes management should be individualized on the basis of age and other comorbidities. For example, geriatric patients who have frequent episodes of hypoglycemia are prone to more harm than benefit from intensifying therapy to achieve these targets. Consequently, they may be candidates for more relaxed goals to avoid episodes of dangerous hypoglycemia.
When discussing blood glucose targets, an important but often overlooked concern is how the patient perceives the results. Providers and patients alike often describe readings as “good” or “bad.” This interpretation can lead to feelings of disappointment and failure in the patient and frustration in the provider. Instead, high blood glucose readings should be viewed as a way to identify opportunities for change. Patients may be more willing to check and even log their blood glucose levels if they see this information as an instrument to be used in the collaborative relationship with their provider.
CHOOSING A BLOOD GLUCOSE METER
Barring any special needs of the patient, meters are often selected on the basis of the patients’ insurance coverage for self-monitoring supplies (test strips and lancets), because of the high cost of test strips when purchased out-of-pocket. Meters themselves are usually relatively inexpensive, since the manufacturers commonly give them away as free samples to providers, who pass them along to patients. They also can often be purchased using coupons at a significant discount.
Without insurance coverage, test strips can cost $0.83 to $1.76 per strip for the most popular brands of meters. For patients without insurance coverage for supplies, the lowest-cost test strips currently available are for the ReliOn Prime Blood Glucose Monitoring System (ie, meter) sold at Walmart. Although ReliOn meters are not given out as samples in providers’ offices, the manufacturer’s suggested retail price is $16.24. More importantly, the suggested retail price for ReliOn Prime test strips is $9.00 for a bottle of 50 strips, or $0.18 per strip.10
For patients with special needs
For patients with special needs, there are meters that can make self-monitoring more convenient. For a patient who has problems with dexterity, grasping small test strips may be difficult. Two options are:
- Accu-Chek Compact Plus, which uses a 17-strip drum loaded into the meter
- Bayer Breeze2, which uses a 10-strip disk.
Both of the above dispense one strip at a time and eliminate the need to handle individual test strips.
Patients with poor visual acuity also face challenges with self-monitoring. Meters with options such as a backlight, a color screen, or a large display can help. Other meters talk, allowing patients to hear settings and blood glucose results. Examples are:
- Prodigy Autocode
- Prodigy Voice
- Embrace.
Other meter options depend on patient preference. Features that can affect patient choice include the ability to flag readings (eg, premeal, postmeal, exercise) and transfer data to other devices, blood sample size, meter size, touchscreen, meter memory and storage, rechargeable vs replaceable batteries, and the time it takes the meter to display the glucose reading.
Meters with advanced functions
For patients who want or need more advanced options, meters are now offering more feedback.
The OneTouch Verio family of meters helps patients spot patterns in their blood glucose levels. In addition, the Verio Flex and Verio Sync meters can sync with the OneTouch Reveal mobile app, which provides reports for the patient to view and send to the healthcare provider.
The Accu-Chek Aviva Expert has a bolus calculation function. Settings such as carbohydrate ratios, insulin sensitivity, targets, and active insulin can be programmed into the meter, which uses this information to give the patient dosing suggestions for rapid-acting insulin when carbohydrate intake is entered or blood glucose levels are checked. Another Accu-Chek meter, the Aviva Connect, can wirelessly transmit blood glucose results to the Accu-Chek Connect mobile app.
For a complete and regularly updated list of meters and their features, we encourage patients and healthcare providers to refer to the ADA’s Diabetes Forecast magazine. The magazine publishes a consumer guide every January that includes a comprehensive list of blood glucose meters. Past issues of the guide are available at www.diabetesforecast.org/past-issues-archive.html.
METER ACCURACY
Even though patients and providers use glucose self-monitoring results to make important decisions about diabetes management, the meters have limitations in accuracy. Accuracy comparisons from third-party sources are rare due to the cost of accuracy testing. However, the US Food and Drug Administration (FDA) requires all home glucose meters to meet accuracy standards set by the International Organization for Standardization (ISO). Currently, the FDA uses ISO standard 15197:2003, but ISO has published a revision, ISO standard 15197:2013, with stricter guidelines that have yet to be adopted by the FDA.10,11 Current and future guidelines are shown in Table 1.10
In addition to variations in accuracy that are deemed acceptable by the FDA, there are other more controllable factors that can further affect the accuracy of glucose meter results. Expired test strips, unwashed hands, poor sampling technique, storage of test strips in extreme temperatures or humidity, and a low hematocrit level all can cause inaccurate readings.
If the patient has a low hematocrit, consider recommending a meter proven to have stable performance in the setting of low hematocrit. These meters are highlighted in a 2013 study by Ramljak et al.12
LANCETS, LANCING DEVICES, AND TECHNIQUES
Along with a variety of meters, patients also have an array of lancets and lancing devices from which to choose. Many patients use the brand of lancet device and lancets that come in their meter starter kit, but they can use other brands if desired. For cost-conscious patients, lancets are significantly more affordable than test strips, even for those without insurance coverage. Prices can be as low as $0.03 per lancet for some store-brand 33-gauge lancets. Name-brand lancets are more expensive than store-brand, but at $0.06 to $0.16 per lancet, many patients will even find these to be affordable if they must pay out of pocket.
Special needs may also prompt patients to choose a different lancet device than the one that came with their meter. For patients who have poor dexterity or are afraid to look at needles, the Accu-Chek FastClix lancing device uses drums with six preloaded lancets, eliminating the need to see and handle individual lancets. The FastClix device is included in the starter kits for the Accu-Chek Nano and Accu-Chek Connect meters and can also be ordered separately at pharmacies.
Reducing pain when testing
A common complaint about glucose self-monitoring is that it hurts. Below are some tips for reducing pain when testing:
- Use a new lancet for each blood glucose check.
- Choose a lancet device with a depth gauge and select the lowest setting that allows for a sufficient sample size.
- Lancets come in a variety of sizes, typically from 28 gauge to 33 gauge, so choose a lancet with a smaller gauge (ie, a higher gauge number).
- Poke the side of the fingertip instead of the end or the middle.
- Alternate the fingers instead of repeatedly using the same finger.
- To minimize pain from forceful squeezing of the fingertip to get a sufficient blood sample, start squeezing the palm and push the blood progressively into the fingertip.
- Consider alternate-site testing, especially if you have painful upper-extremity neuropathy.
LOGGING BLOOD GLUCOSE READINGS
Although many meters can automatically transfer their data to mobile devices or computers, patients are still encouraged to log their glucose readings manually. Not only does this give feedback to the provider in the event that the downloading software is not available in that provider’s office, it also allows patients to learn how to identify patterns in their readings and make changes in their diabetes self-management.
In the past, all logging was done on paper forms or in log books, but today’s technology offers other options. Several meters offer downloading software for home use that displays the data in a usable format. Some smartphone apps allow patients to enter glucose readings and other useful diabetes information such as food intake and exercise. Below are examples of smartphone apps that can help patients track glucose levels and much more:
- mySugr (iPhone and Android)
- Glucose Buddy (iPhone and Android)
- OnTrack Diabetes (Android)
- Glucool Diabetes (Android) (also available in a premium version).
- Glooko (iPhone and Android). This app requires purchase of a compatible cable to connect the patient’s phone to the meter, which then allows readings to be transferred directly to the app.
THE ROLE OF THE CERTIFIED DIABETES EDUCATOR
One of the most useful resources available to providers is the assistance of a certified diabetes educator, who can teach a patient the basic operation of a blood glucose meter and educate the patient on all topics discussed in this article and more.
Certified diabetes educators are instrumental in helping patients understand blood glucose targets, the rationale for glucose self-monitoring, logging, pattern management, special features in meters, control testing, and alternate-site testing, and using the results of testing to make meaningful changes in how they self-manage their diabetes. Education should include discussions about topics such as meal planning, exercise, and medications to help patients fully grasp the impact of their daily decisions on their blood glucose control.
- Polonsky WH, Fisher L, Schikman CH, et al. Structured self-monitoring of blood glucose significantly reduces A1C levels in poorly controlled, noninsulin-treated type 2 diabetes: results from the Structured Testing Program study. Diabetes Care 2011; 34:262–267.
- American Diabetes Association (ADA). Standards of medical care in diabetes—2016. Glycemic targets. Diabetes Care 2016; 39(suppl):S39–S46.
- The Diabetes Control and Complications Trial Research Group. The effect of intensive treatment of diabetes on the development and progression of long-term complications in insulin-dependent diabetes mellitus. N Engl J Med 1993; 329:977–986.
- Nathan DM, Cleary PA, Backlund JY, et al; Diabetes Control and Complications Trial/Epidemiology of Diabetes Interventions and Complications (DCCT/EDIC) Study Research Group. Intensive diabetes treatment and cardiovascular disease in patients with type 1 diabetes. N Engl J Med 2005; 353:2643–2653.
- International Diabetes Federation (IDF). IDF guideline on self-monitoring of blood glucose in non-insulin treated type 2 diabetes. www.idf.org/guidelines/self-monitoring. Accessed April 8, 2016.
- Bosi E, Scavini M, Ceriello A, et al; PRISMA Study Group. Intensive structured self-monitoring of blood glucose and glycemic control in noninsulin-treated type 2 diabetes: the PRISMA randomized trial. Diabetes Care 2013; 36:2887–2894.
- Franciosi M, Lucisano G, Pellegrini F, et al; ROSES Study Group. ROSES: role of self-monitoring of blood glucose and intensive education in patients with type 2 diabetes not receiving insulin. A pilot randomized clinical trial. Diabet Med 2011; 28:789–796.
- Durán A, Martín P, Runkle I, et al. Benefits of self-monitoring blood glucose in the management of new-onset type 2 diabetes mellitus: the St Carlos Study, a prospective randomized clinic-based interventional study with parallel groups. J Diabetes 2010; 2:203–211.
- Kempf K, Kruse J, Martin S. ROSSO-in-praxi: a self-monitoring of blood glucose-structured 12-week lifestyle intervention significantly improves glucometabolic control of patients with type 2 diabetes mellitus. Diabetes Technol Ther 2010; 12:547–553.
- Wahowiak L; American Diabetes Association (ADA). Blood glucose meters 2014. www.diabetesforecast.org/2014/Jan/blood-glucose-meters-2014.html. Accessed April 10, 2016.
- International Organization for Standardization (ISO). ISO 15197:2013. In vitro diagnostic test systems—requirements for blood-glucose monitoring systems for self-testing in managing diabetes mellitus. www.iso.org/obp/ui/#iso:std:iso:15197:ed-2:v1:en. Accessed April 8, 2016.
- Ramljak S, Lock JP, Schipper C, et al. Hematocrit interference of blood glucose meters for patient self-measurement. J Diabetes Sci Technol 2013; 7:179–189.
- Polonsky WH, Fisher L, Schikman CH, et al. Structured self-monitoring of blood glucose significantly reduces A1C levels in poorly controlled, noninsulin-treated type 2 diabetes: results from the Structured Testing Program study. Diabetes Care 2011; 34:262–267.
- American Diabetes Association (ADA). Standards of medical care in diabetes—2016. Glycemic targets. Diabetes Care 2016; 39(suppl):S39–S46.
- The Diabetes Control and Complications Trial Research Group. The effect of intensive treatment of diabetes on the development and progression of long-term complications in insulin-dependent diabetes mellitus. N Engl J Med 1993; 329:977–986.
- Nathan DM, Cleary PA, Backlund JY, et al; Diabetes Control and Complications Trial/Epidemiology of Diabetes Interventions and Complications (DCCT/EDIC) Study Research Group. Intensive diabetes treatment and cardiovascular disease in patients with type 1 diabetes. N Engl J Med 2005; 353:2643–2653.
- International Diabetes Federation (IDF). IDF guideline on self-monitoring of blood glucose in non-insulin treated type 2 diabetes. www.idf.org/guidelines/self-monitoring. Accessed April 8, 2016.
- Bosi E, Scavini M, Ceriello A, et al; PRISMA Study Group. Intensive structured self-monitoring of blood glucose and glycemic control in noninsulin-treated type 2 diabetes: the PRISMA randomized trial. Diabetes Care 2013; 36:2887–2894.
- Franciosi M, Lucisano G, Pellegrini F, et al; ROSES Study Group. ROSES: role of self-monitoring of blood glucose and intensive education in patients with type 2 diabetes not receiving insulin. A pilot randomized clinical trial. Diabet Med 2011; 28:789–796.
- Durán A, Martín P, Runkle I, et al. Benefits of self-monitoring blood glucose in the management of new-onset type 2 diabetes mellitus: the St Carlos Study, a prospective randomized clinic-based interventional study with parallel groups. J Diabetes 2010; 2:203–211.
- Kempf K, Kruse J, Martin S. ROSSO-in-praxi: a self-monitoring of blood glucose-structured 12-week lifestyle intervention significantly improves glucometabolic control of patients with type 2 diabetes mellitus. Diabetes Technol Ther 2010; 12:547–553.
- Wahowiak L; American Diabetes Association (ADA). Blood glucose meters 2014. www.diabetesforecast.org/2014/Jan/blood-glucose-meters-2014.html. Accessed April 10, 2016.
- International Organization for Standardization (ISO). ISO 15197:2013. In vitro diagnostic test systems—requirements for blood-glucose monitoring systems for self-testing in managing diabetes mellitus. www.iso.org/obp/ui/#iso:std:iso:15197:ed-2:v1:en. Accessed April 8, 2016.
- Ramljak S, Lock JP, Schipper C, et al. Hematocrit interference of blood glucose meters for patient self-measurement. J Diabetes Sci Technol 2013; 7:179–189.
KEY POINTS
- Glucose self-monitoring not only yields valuable information on which to base diabetes treatment, it also helps motivate patients and keep them engaged in and adherent to their care.
- The cost of test strips varies widely and can be a burden for some patients.
- Meters come with many different features, which patients may or may not need.
- One of the most useful resources at the disposal of providers is the assistance of a certified diabetes educator.
Using the Common Sense Model in Daily Clinical Practice for Improving Medication Adherence
From Genoa-QoL Healthcare and the University of Michigan College of Pharmacy, Ann Arbor, MI.
Abstract
- Objective: To review the Common Sense Model, a framework that can be used for understanding patients’ behavior, including taking or not taking medications as prescribed.
- Methods: Descriptive report.
- Results: Medication adherence, a critical component of achieving good patient outcomes and reducing medical costs, is dependent upon patient illness beliefs. The Common Sense Model holds that these beliefs can be categorized as illness identity, cause, consequence, control, and timeline. Effective communication is necessary to understand the beliefs that patients hold and help them understand their condition. Good communication also can allay fears and other emotions that can be disruptive to achieving good outcomes.
- Conclusion: Clinicians should seek to understand their patients’ illness beliefs and collaborate with them to achieve desired health outcomes.
Clinical practice is based on scientific evidence, by which medical problems are diagnosed and treatment recommendations are made. However, the role of the patient may not be completely recognized as an integral part of the process of patient care. The impact of failing to adequately recognize the patient perspective is evident in medication nonadherence. Health psychology research can provide clinicians insight into patients’ perceptions and behavior. This paper reviews the Common Sense Model (CSM), a behavioral model that provides a framework that can be used in understanding patients’ behavior. In this paper I will discuss the model and how it can be a possible strategy for improving adherence.
Making the Case for CSM in Daily Practice
It can be difficult to realize that persons seeking medical attention would not take medications as prescribed by a physician. In fact, studies reveal that on average, 16.4% of prescribed medications will not be picked up from the pharmacy [1]. Of those patients who do pick up their medication, approximately 1 out of 4 will not take them as prescribed [2]. Such medication nonadherence leads to poor health outcomes and increased health care costs [3,4]. There are many reasons for medication nonadherence [5], and there is no single solution to improving medication adherence [6]. A Cochrane review of randomized controlled trials evaluating various interventions intended to enhance patient adherence to prescribed medications for medical conditions found them to have limited effectiveness. Interventions assessed included health and medication information, reminder calls, follow-up assessment of medication therapy, social support, and simplification of the treatment regimen [6]. In an exploratory study of patients with chronic health conditions, Kucukarslan et al found patients’ beliefs about their illness and their medication are integral to their health care decisions [7]. Their findings were consistent with the CSM, which is based on Leventhal’s theory of self-regulation.
Self-regulation theory states that rational people will make decisions to reduce their health threat. Patients’ perceptions of their selves and environments drives their behavior. So in the presence of a health threat, a person will seek to eliminate or reduce that threat. However, coping behavior is complex. A person may decide to follow the advice of his clinician, follow some other advice (from family, friends, advertising, etc.), or do nothing. The premise of self-regulation is that people will choose a common sense approach to their health threat [8]. Therefore, clinicians must understand their patients’ viewpoint of themselves and their health condition so they may help guide them toward healthy outcomes.
The Common Sense Model
The CSM is a framework for understanding patient behavior when faced with a health threat. It holds that patients form common sense representations of their illness using information from 5 domains [8]: (1) the identity of the illness (the label the patient gives to the condition and symptoms); (2) the cause of the illness; (3) the consequences of the illness (beliefs about how the illness will impact the patient’s well-being); (4) whether the illness can be controlled or cured; and (5) timeline (beliefs about how long the condition will last). A patient may either act to address the health threat or choose to ignore it. Patient emotions are proposed to have a role on patient behavior along with the 5 dimensions of illness perception.
Illness Identity
Illness identity is the label patients place on the health threat; it is most likely not the same as the signs and symptoms clinicians use. Therefore, the first misconnect between physician and patient may be in describing the illness. Chen et al studied illness identity as perceived by patients with hypertension [9,10]. Illness identity was defined as (1) hypertension-related symptoms, (2) symptoms experienced before and after their diagnosis; and (3) symptoms used to predict high blood pressure. Although hypertension is asymptomatic, patients do perceive symptoms such as headache associated with their hypertension. The researchers found those patients who identified more symptoms were more likely to believe that their symptoms caused the hypertension and were correspondingly less likely to use their medication. For them, when the headache subsides, so does the hypertension.
Physicians should find out how patients assess their health condition and provide them tools for evaluating their response to medication. In the case of hypertension, the physician could have the patient check their blood pressure with and without the headache to demonstrate that hypertension occurs even when the patient is not “symptomatic.” The point is to converse with the patient to learn how they view their condition. Clinicians should resist the “urge” to correct patients. Taking time to help patients better understand their condition is important. A misstep:
Patient: I can tell when my blood pressure is high. I get a pounding headache.
Doctor: High blood pressure is an asymptomatic condition. Your headaches are not caused by your high blood pressure.
Patients may choose to ignore the clinician if they feel strongly about how they define their illness. It is better to listen to the patient and offer steps to learn about their health condition. Here is a better response from the physician:
Doctor: You are telling me that you can tell when your blood pressure is high. So when your head aches your pressure is high, right?
Patient: Yes.
Doctor: Let me tell you more about high blood pressure. High blood pressure is also present without headaches...
Illness Causes
There are multiple causative factors patients may associate with their disease. Causes attributed to disease may be based on patient experiences, input from family and friends, and cultural factors. Causes may include emotional state, stress or worry, overwork, genetic predisposition, or environmental factors (eg, pollution). Jessop and Rutter found patients who perceive their condition as due to uncontrollable factors, such as chance, germs, or pollution, were less likely to take their medication [11]. Similar findings were published by Chen et al [9]. They found psychological factors, environmental risk factors (eg, smoking, diet), and even bad luck or chance associated with less likelihood of taking medications as prescribed. Clinicians should explore patients’ perceptions of causes of a condition. Patients strive to eliminate the perceived cause, thus eliminating the need to take medication. In some cultures, bad luck or chance drives patients’ decisions to not take medication, or they believe in fate and do not accept treatment. Whether they feel they can control their condition by eliminating the cause or have a fatalistic view that the cause of their condition is not within their control, the clinician must work with the patient to reduce the impact of misperceptions or significance of perceived causes.
Illness Consequence
Consequence associated with the health condition is an important factor in patient behavior [12]. Patients must understand the specific threats to their health if a condition is left untreated or uncontrolled. Patients’ view of illness consequence may be formed by their own perceived vulnerability or susceptibility and the perceived seriousness of the condition. For example, patients with hypertension should be informed about the impact of high blood pressure on their bodies and the consequence of disability from stroke, dependency on dialysis from kidney failure, or death. They may not consider themselves susceptible to illness since they “feel healthy” and may decide to delay treatment. Patients with conditions such as asthma or heart failure may believe they are cured when their symptoms abate and therefore believe they have no more need for medication. Such patients need education to understand that they are asymptomatic because they are well controlled with medication.
Illness Control
Patients may feel they can control their health condition by changing their behavior, changing their environment, and/or by taking prescribed medication. As discussed earlier, cause and control both work together to form patient beliefs and actions. Patients will take their medications as prescribed if they believe in the effectiveness of medication to control their condition [11,13–15]. Interestingly, Ross found those who felt they had more control over their illness were more likely not to take their medication as prescribed [12]. These persons are more likely to not want to become “dependent” on medication. Their feeling was that they can make changes in their lives and thereby improve their health condition.
Physicians should invite patients’ thoughts as to what should be done to improve their health condition, and collaborate with the patient on an action plan for change if change is expected to improve/control the health condition. Follow-up to assess the patient’s health status longitudinally is necessary.
In this exchange, the patient feels he can control his hypertension on his own:
Doctor: I recommend that you start taking medication to control your blood pressure. Uncontrolled high blood pressure can lead to many health problems.
Patient: I am not ready to start taking medication.
Doctor: What are your reasons?
Patient: I am under a lot of stress at work. Once I get control of this stress, my blood pressure will go down.
Doctor: Getting control of your stress at work is important. Let me tell you more about high blood pressure.
Patient: Okay.
Doctor: There is no one cause of your high blood pressure. Eliminating your work stress will most likely not reduce your blood pressure....
Timeline
Health conditions can be acute, chronic, or cyclical (ie, seasonal); however, patients may have different perceptions of the duration of their health condition. In Kucukarslan et al, some patients did not believe their hypertension was a lifelong condition because they felt they would be able to cure it [7]. For example, as illustrated above, patients may believe that stress causes their hypertension, and if the stress could be controlled, then their blood pressure would normalize. Conversely, Ross et al found that patients who viewed their hypertension as a long-term condition were more likely to believe their medications were necessary and thus more likely to take their medication as prescribed [12]. A lifelong or chronic health condition is a difficult concept for patients to accept, especially ones who may view themselves as too young to have the condition.
Emotions
After being informed about their health condition, patients may feel emotions that are not apparent to the practitioner. These may include worry, depression, anger, anxiety, or fear. Emotions may impact their decision to take medication [12,14]. Listening for patients’ responses to health information provided by the clinician and letting patients know they have been heard will help allay strong negative emotions [16]. Good communication builds trust between the clinician and patient.
Conclusion
Patients receive medical advice from clinicians that may be inconsistent with their beliefs and understanding of their health condition. Studies of medication nonadherence find many factors contribute to it and no one tool to improve medication adherence exists. However, the consequence of medication nonadherence are great and include include worsening condition, increased comorbid disease, and increased health care costs. Understanding patients’ beliefs about their health condition is an important step toward reducing medication nonadherence. The CSM provides a framework for clinicians to guide patients toward effective decision-making. Listening to the patient explain how they view their condition—how they define it, the causes, consequences, how to control it, and how long it will last or if it will progress—are important to the process of working with the patient manage their condition effectively. Clinicians’ reaction to these perceptions are important, and dismissing them may alienate patients. Effective communication is necessary to understand patients’ perspectives and to help them manage their health condition.
Corresponding author: Suzan N. Kucukarslan, PhD, RPh, [email protected].
Financial disclosures: None.
1. Gadkari AS, McHorney CA. Medication non-fulfillment rates and reasons: a narrative systematic review. Curr Med Res Opin 2010;26:683–785.
2. DiMatteo MR. Variations in patients’ adherence to medical recommendations: a quantitative review of 50 years of research. Med Care 2004;42:200–9.
3. Ho PM, Rumsfeld JS, Masoudi FA, et al. The effect of medication non-adherence on hospitalization and mortality among patients with diabetes mellitus. Arch Intern Med 2006;166;1836–41.
4. Benjamin RM. Medication adherence: Helping patients take their medicines as directed. Pub Health Rep 2012;2–3.
5. Osterberg L, Blaschke T. Adherence to medication. N Engl J Med 2005;353:487–97.
6. Haynes RB, Ackloo E, Sahota N, et al. Interventions for enhancing medication adherence. Cochrane Database Syst Rev 2008;(2):CD000011.
7. Kucukarslan SN, Lewis NJW, Shimp LA, et al. Exploring patient experiences with prescription medicines to identify unmet patient needs: implications for research and practice. Res Social Adm Pharm 2012;8:321–332.
8. Leventhal H, Leventhal EA, Contrada RJ. Self-regulation, health, and behavior: a perceptual-cognitive approach. Psychol Health 1998;13:717–33.
9. Chen S-L, Tsai J-C, Chou K-R. Illness perceptions and adherence to therapeutic regimens among patients with hypertension: A structural model approach. Int J Nurs Stud 2011;48:235–45.
10. Chen S-L, Tsai J-C, Lee W-L. The impact of illness perception on adherence to therapeutic regimens of patients with hypertension in Taiwan. J Clin Nurs 2009;18:2234–44.
11. Jessop DC, Rutter DR. Adherence to asthma medication: the role of illness representations. Psychol Health 2003;18:595–612.
12. Ross S, Walker A, MacLeod M. Patient compliance in hypertension:role of illness perceptions and treatment beliefs. J Hum Hypertension 2004;18:607–13.
13 Searle A, Norman P. Thompson R. Vedhara K. A prospective examination of illness belies and coping in patients with type 2 diabetes. Br J Health Psychol 2007;12:621–38.
14. Zugelj U, Zuparnicic M, Komidar L, et al. Self-reported adherence behavior in adolescent hypertensive patients: the role of illness representation and personality. J Pediatr Psychol 2010;35:1049–60.
15. Horne R, Weinman J. Self-regulation and self-management in asthma: exploring the role of illness perception and treatment beliefs in explaining non-adherence to preventer medication. Psychol Health 2002;17:17–32.
16. Northouse LL, Northouse PG. Health communication: strategies for health professionals. Stamford: Prentice Hall; 1998.
From Genoa-QoL Healthcare and the University of Michigan College of Pharmacy, Ann Arbor, MI.
Abstract
- Objective: To review the Common Sense Model, a framework that can be used for understanding patients’ behavior, including taking or not taking medications as prescribed.
- Methods: Descriptive report.
- Results: Medication adherence, a critical component of achieving good patient outcomes and reducing medical costs, is dependent upon patient illness beliefs. The Common Sense Model holds that these beliefs can be categorized as illness identity, cause, consequence, control, and timeline. Effective communication is necessary to understand the beliefs that patients hold and help them understand their condition. Good communication also can allay fears and other emotions that can be disruptive to achieving good outcomes.
- Conclusion: Clinicians should seek to understand their patients’ illness beliefs and collaborate with them to achieve desired health outcomes.
Clinical practice is based on scientific evidence, by which medical problems are diagnosed and treatment recommendations are made. However, the role of the patient may not be completely recognized as an integral part of the process of patient care. The impact of failing to adequately recognize the patient perspective is evident in medication nonadherence. Health psychology research can provide clinicians insight into patients’ perceptions and behavior. This paper reviews the Common Sense Model (CSM), a behavioral model that provides a framework that can be used in understanding patients’ behavior. In this paper I will discuss the model and how it can be a possible strategy for improving adherence.
Making the Case for CSM in Daily Practice
It can be difficult to realize that persons seeking medical attention would not take medications as prescribed by a physician. In fact, studies reveal that on average, 16.4% of prescribed medications will not be picked up from the pharmacy [1]. Of those patients who do pick up their medication, approximately 1 out of 4 will not take them as prescribed [2]. Such medication nonadherence leads to poor health outcomes and increased health care costs [3,4]. There are many reasons for medication nonadherence [5], and there is no single solution to improving medication adherence [6]. A Cochrane review of randomized controlled trials evaluating various interventions intended to enhance patient adherence to prescribed medications for medical conditions found them to have limited effectiveness. Interventions assessed included health and medication information, reminder calls, follow-up assessment of medication therapy, social support, and simplification of the treatment regimen [6]. In an exploratory study of patients with chronic health conditions, Kucukarslan et al found patients’ beliefs about their illness and their medication are integral to their health care decisions [7]. Their findings were consistent with the CSM, which is based on Leventhal’s theory of self-regulation.
Self-regulation theory states that rational people will make decisions to reduce their health threat. Patients’ perceptions of their selves and environments drives their behavior. So in the presence of a health threat, a person will seek to eliminate or reduce that threat. However, coping behavior is complex. A person may decide to follow the advice of his clinician, follow some other advice (from family, friends, advertising, etc.), or do nothing. The premise of self-regulation is that people will choose a common sense approach to their health threat [8]. Therefore, clinicians must understand their patients’ viewpoint of themselves and their health condition so they may help guide them toward healthy outcomes.
The Common Sense Model
The CSM is a framework for understanding patient behavior when faced with a health threat. It holds that patients form common sense representations of their illness using information from 5 domains [8]: (1) the identity of the illness (the label the patient gives to the condition and symptoms); (2) the cause of the illness; (3) the consequences of the illness (beliefs about how the illness will impact the patient’s well-being); (4) whether the illness can be controlled or cured; and (5) timeline (beliefs about how long the condition will last). A patient may either act to address the health threat or choose to ignore it. Patient emotions are proposed to have a role on patient behavior along with the 5 dimensions of illness perception.
Illness Identity
Illness identity is the label patients place on the health threat; it is most likely not the same as the signs and symptoms clinicians use. Therefore, the first misconnect between physician and patient may be in describing the illness. Chen et al studied illness identity as perceived by patients with hypertension [9,10]. Illness identity was defined as (1) hypertension-related symptoms, (2) symptoms experienced before and after their diagnosis; and (3) symptoms used to predict high blood pressure. Although hypertension is asymptomatic, patients do perceive symptoms such as headache associated with their hypertension. The researchers found those patients who identified more symptoms were more likely to believe that their symptoms caused the hypertension and were correspondingly less likely to use their medication. For them, when the headache subsides, so does the hypertension.
Physicians should find out how patients assess their health condition and provide them tools for evaluating their response to medication. In the case of hypertension, the physician could have the patient check their blood pressure with and without the headache to demonstrate that hypertension occurs even when the patient is not “symptomatic.” The point is to converse with the patient to learn how they view their condition. Clinicians should resist the “urge” to correct patients. Taking time to help patients better understand their condition is important. A misstep:
Patient: I can tell when my blood pressure is high. I get a pounding headache.
Doctor: High blood pressure is an asymptomatic condition. Your headaches are not caused by your high blood pressure.
Patients may choose to ignore the clinician if they feel strongly about how they define their illness. It is better to listen to the patient and offer steps to learn about their health condition. Here is a better response from the physician:
Doctor: You are telling me that you can tell when your blood pressure is high. So when your head aches your pressure is high, right?
Patient: Yes.
Doctor: Let me tell you more about high blood pressure. High blood pressure is also present without headaches...
Illness Causes
There are multiple causative factors patients may associate with their disease. Causes attributed to disease may be based on patient experiences, input from family and friends, and cultural factors. Causes may include emotional state, stress or worry, overwork, genetic predisposition, or environmental factors (eg, pollution). Jessop and Rutter found patients who perceive their condition as due to uncontrollable factors, such as chance, germs, or pollution, were less likely to take their medication [11]. Similar findings were published by Chen et al [9]. They found psychological factors, environmental risk factors (eg, smoking, diet), and even bad luck or chance associated with less likelihood of taking medications as prescribed. Clinicians should explore patients’ perceptions of causes of a condition. Patients strive to eliminate the perceived cause, thus eliminating the need to take medication. In some cultures, bad luck or chance drives patients’ decisions to not take medication, or they believe in fate and do not accept treatment. Whether they feel they can control their condition by eliminating the cause or have a fatalistic view that the cause of their condition is not within their control, the clinician must work with the patient to reduce the impact of misperceptions or significance of perceived causes.
Illness Consequence
Consequence associated with the health condition is an important factor in patient behavior [12]. Patients must understand the specific threats to their health if a condition is left untreated or uncontrolled. Patients’ view of illness consequence may be formed by their own perceived vulnerability or susceptibility and the perceived seriousness of the condition. For example, patients with hypertension should be informed about the impact of high blood pressure on their bodies and the consequence of disability from stroke, dependency on dialysis from kidney failure, or death. They may not consider themselves susceptible to illness since they “feel healthy” and may decide to delay treatment. Patients with conditions such as asthma or heart failure may believe they are cured when their symptoms abate and therefore believe they have no more need for medication. Such patients need education to understand that they are asymptomatic because they are well controlled with medication.
Illness Control
Patients may feel they can control their health condition by changing their behavior, changing their environment, and/or by taking prescribed medication. As discussed earlier, cause and control both work together to form patient beliefs and actions. Patients will take their medications as prescribed if they believe in the effectiveness of medication to control their condition [11,13–15]. Interestingly, Ross found those who felt they had more control over their illness were more likely not to take their medication as prescribed [12]. These persons are more likely to not want to become “dependent” on medication. Their feeling was that they can make changes in their lives and thereby improve their health condition.
Physicians should invite patients’ thoughts as to what should be done to improve their health condition, and collaborate with the patient on an action plan for change if change is expected to improve/control the health condition. Follow-up to assess the patient’s health status longitudinally is necessary.
In this exchange, the patient feels he can control his hypertension on his own:
Doctor: I recommend that you start taking medication to control your blood pressure. Uncontrolled high blood pressure can lead to many health problems.
Patient: I am not ready to start taking medication.
Doctor: What are your reasons?
Patient: I am under a lot of stress at work. Once I get control of this stress, my blood pressure will go down.
Doctor: Getting control of your stress at work is important. Let me tell you more about high blood pressure.
Patient: Okay.
Doctor: There is no one cause of your high blood pressure. Eliminating your work stress will most likely not reduce your blood pressure....
Timeline
Health conditions can be acute, chronic, or cyclical (ie, seasonal); however, patients may have different perceptions of the duration of their health condition. In Kucukarslan et al, some patients did not believe their hypertension was a lifelong condition because they felt they would be able to cure it [7]. For example, as illustrated above, patients may believe that stress causes their hypertension, and if the stress could be controlled, then their blood pressure would normalize. Conversely, Ross et al found that patients who viewed their hypertension as a long-term condition were more likely to believe their medications were necessary and thus more likely to take their medication as prescribed [12]. A lifelong or chronic health condition is a difficult concept for patients to accept, especially ones who may view themselves as too young to have the condition.
Emotions
After being informed about their health condition, patients may feel emotions that are not apparent to the practitioner. These may include worry, depression, anger, anxiety, or fear. Emotions may impact their decision to take medication [12,14]. Listening for patients’ responses to health information provided by the clinician and letting patients know they have been heard will help allay strong negative emotions [16]. Good communication builds trust between the clinician and patient.
Conclusion
Patients receive medical advice from clinicians that may be inconsistent with their beliefs and understanding of their health condition. Studies of medication nonadherence find many factors contribute to it and no one tool to improve medication adherence exists. However, the consequence of medication nonadherence are great and include include worsening condition, increased comorbid disease, and increased health care costs. Understanding patients’ beliefs about their health condition is an important step toward reducing medication nonadherence. The CSM provides a framework for clinicians to guide patients toward effective decision-making. Listening to the patient explain how they view their condition—how they define it, the causes, consequences, how to control it, and how long it will last or if it will progress—are important to the process of working with the patient manage their condition effectively. Clinicians’ reaction to these perceptions are important, and dismissing them may alienate patients. Effective communication is necessary to understand patients’ perspectives and to help them manage their health condition.
Corresponding author: Suzan N. Kucukarslan, PhD, RPh, [email protected].
Financial disclosures: None.
From Genoa-QoL Healthcare and the University of Michigan College of Pharmacy, Ann Arbor, MI.
Abstract
- Objective: To review the Common Sense Model, a framework that can be used for understanding patients’ behavior, including taking or not taking medications as prescribed.
- Methods: Descriptive report.
- Results: Medication adherence, a critical component of achieving good patient outcomes and reducing medical costs, is dependent upon patient illness beliefs. The Common Sense Model holds that these beliefs can be categorized as illness identity, cause, consequence, control, and timeline. Effective communication is necessary to understand the beliefs that patients hold and help them understand their condition. Good communication also can allay fears and other emotions that can be disruptive to achieving good outcomes.
- Conclusion: Clinicians should seek to understand their patients’ illness beliefs and collaborate with them to achieve desired health outcomes.
Clinical practice is based on scientific evidence, by which medical problems are diagnosed and treatment recommendations are made. However, the role of the patient may not be completely recognized as an integral part of the process of patient care. The impact of failing to adequately recognize the patient perspective is evident in medication nonadherence. Health psychology research can provide clinicians insight into patients’ perceptions and behavior. This paper reviews the Common Sense Model (CSM), a behavioral model that provides a framework that can be used in understanding patients’ behavior. In this paper I will discuss the model and how it can be a possible strategy for improving adherence.
Making the Case for CSM in Daily Practice
It can be difficult to realize that persons seeking medical attention would not take medications as prescribed by a physician. In fact, studies reveal that on average, 16.4% of prescribed medications will not be picked up from the pharmacy [1]. Of those patients who do pick up their medication, approximately 1 out of 4 will not take them as prescribed [2]. Such medication nonadherence leads to poor health outcomes and increased health care costs [3,4]. There are many reasons for medication nonadherence [5], and there is no single solution to improving medication adherence [6]. A Cochrane review of randomized controlled trials evaluating various interventions intended to enhance patient adherence to prescribed medications for medical conditions found them to have limited effectiveness. Interventions assessed included health and medication information, reminder calls, follow-up assessment of medication therapy, social support, and simplification of the treatment regimen [6]. In an exploratory study of patients with chronic health conditions, Kucukarslan et al found patients’ beliefs about their illness and their medication are integral to their health care decisions [7]. Their findings were consistent with the CSM, which is based on Leventhal’s theory of self-regulation.
Self-regulation theory states that rational people will make decisions to reduce their health threat. Patients’ perceptions of their selves and environments drives their behavior. So in the presence of a health threat, a person will seek to eliminate or reduce that threat. However, coping behavior is complex. A person may decide to follow the advice of his clinician, follow some other advice (from family, friends, advertising, etc.), or do nothing. The premise of self-regulation is that people will choose a common sense approach to their health threat [8]. Therefore, clinicians must understand their patients’ viewpoint of themselves and their health condition so they may help guide them toward healthy outcomes.
The Common Sense Model
The CSM is a framework for understanding patient behavior when faced with a health threat. It holds that patients form common sense representations of their illness using information from 5 domains [8]: (1) the identity of the illness (the label the patient gives to the condition and symptoms); (2) the cause of the illness; (3) the consequences of the illness (beliefs about how the illness will impact the patient’s well-being); (4) whether the illness can be controlled or cured; and (5) timeline (beliefs about how long the condition will last). A patient may either act to address the health threat or choose to ignore it. Patient emotions are proposed to have a role on patient behavior along with the 5 dimensions of illness perception.
Illness Identity
Illness identity is the label patients place on the health threat; it is most likely not the same as the signs and symptoms clinicians use. Therefore, the first misconnect between physician and patient may be in describing the illness. Chen et al studied illness identity as perceived by patients with hypertension [9,10]. Illness identity was defined as (1) hypertension-related symptoms, (2) symptoms experienced before and after their diagnosis; and (3) symptoms used to predict high blood pressure. Although hypertension is asymptomatic, patients do perceive symptoms such as headache associated with their hypertension. The researchers found those patients who identified more symptoms were more likely to believe that their symptoms caused the hypertension and were correspondingly less likely to use their medication. For them, when the headache subsides, so does the hypertension.
Physicians should find out how patients assess their health condition and provide them tools for evaluating their response to medication. In the case of hypertension, the physician could have the patient check their blood pressure with and without the headache to demonstrate that hypertension occurs even when the patient is not “symptomatic.” The point is to converse with the patient to learn how they view their condition. Clinicians should resist the “urge” to correct patients. Taking time to help patients better understand their condition is important. A misstep:
Patient: I can tell when my blood pressure is high. I get a pounding headache.
Doctor: High blood pressure is an asymptomatic condition. Your headaches are not caused by your high blood pressure.
Patients may choose to ignore the clinician if they feel strongly about how they define their illness. It is better to listen to the patient and offer steps to learn about their health condition. Here is a better response from the physician:
Doctor: You are telling me that you can tell when your blood pressure is high. So when your head aches your pressure is high, right?
Patient: Yes.
Doctor: Let me tell you more about high blood pressure. High blood pressure is also present without headaches...
Illness Causes
There are multiple causative factors patients may associate with their disease. Causes attributed to disease may be based on patient experiences, input from family and friends, and cultural factors. Causes may include emotional state, stress or worry, overwork, genetic predisposition, or environmental factors (eg, pollution). Jessop and Rutter found patients who perceive their condition as due to uncontrollable factors, such as chance, germs, or pollution, were less likely to take their medication [11]. Similar findings were published by Chen et al [9]. They found psychological factors, environmental risk factors (eg, smoking, diet), and even bad luck or chance associated with less likelihood of taking medications as prescribed. Clinicians should explore patients’ perceptions of causes of a condition. Patients strive to eliminate the perceived cause, thus eliminating the need to take medication. In some cultures, bad luck or chance drives patients’ decisions to not take medication, or they believe in fate and do not accept treatment. Whether they feel they can control their condition by eliminating the cause or have a fatalistic view that the cause of their condition is not within their control, the clinician must work with the patient to reduce the impact of misperceptions or significance of perceived causes.
Illness Consequence
Consequence associated with the health condition is an important factor in patient behavior [12]. Patients must understand the specific threats to their health if a condition is left untreated or uncontrolled. Patients’ view of illness consequence may be formed by their own perceived vulnerability or susceptibility and the perceived seriousness of the condition. For example, patients with hypertension should be informed about the impact of high blood pressure on their bodies and the consequence of disability from stroke, dependency on dialysis from kidney failure, or death. They may not consider themselves susceptible to illness since they “feel healthy” and may decide to delay treatment. Patients with conditions such as asthma or heart failure may believe they are cured when their symptoms abate and therefore believe they have no more need for medication. Such patients need education to understand that they are asymptomatic because they are well controlled with medication.
Illness Control
Patients may feel they can control their health condition by changing their behavior, changing their environment, and/or by taking prescribed medication. As discussed earlier, cause and control both work together to form patient beliefs and actions. Patients will take their medications as prescribed if they believe in the effectiveness of medication to control their condition [11,13–15]. Interestingly, Ross found those who felt they had more control over their illness were more likely not to take their medication as prescribed [12]. These persons are more likely to not want to become “dependent” on medication. Their feeling was that they can make changes in their lives and thereby improve their health condition.
Physicians should invite patients’ thoughts as to what should be done to improve their health condition, and collaborate with the patient on an action plan for change if change is expected to improve/control the health condition. Follow-up to assess the patient’s health status longitudinally is necessary.
In this exchange, the patient feels he can control his hypertension on his own:
Doctor: I recommend that you start taking medication to control your blood pressure. Uncontrolled high blood pressure can lead to many health problems.
Patient: I am not ready to start taking medication.
Doctor: What are your reasons?
Patient: I am under a lot of stress at work. Once I get control of this stress, my blood pressure will go down.
Doctor: Getting control of your stress at work is important. Let me tell you more about high blood pressure.
Patient: Okay.
Doctor: There is no one cause of your high blood pressure. Eliminating your work stress will most likely not reduce your blood pressure....
Timeline
Health conditions can be acute, chronic, or cyclical (ie, seasonal); however, patients may have different perceptions of the duration of their health condition. In Kucukarslan et al, some patients did not believe their hypertension was a lifelong condition because they felt they would be able to cure it [7]. For example, as illustrated above, patients may believe that stress causes their hypertension, and if the stress could be controlled, then their blood pressure would normalize. Conversely, Ross et al found that patients who viewed their hypertension as a long-term condition were more likely to believe their medications were necessary and thus more likely to take their medication as prescribed [12]. A lifelong or chronic health condition is a difficult concept for patients to accept, especially ones who may view themselves as too young to have the condition.
Emotions
After being informed about their health condition, patients may feel emotions that are not apparent to the practitioner. These may include worry, depression, anger, anxiety, or fear. Emotions may impact their decision to take medication [12,14]. Listening for patients’ responses to health information provided by the clinician and letting patients know they have been heard will help allay strong negative emotions [16]. Good communication builds trust between the clinician and patient.
Conclusion
Patients receive medical advice from clinicians that may be inconsistent with their beliefs and understanding of their health condition. Studies of medication nonadherence find many factors contribute to it and no one tool to improve medication adherence exists. However, the consequence of medication nonadherence are great and include include worsening condition, increased comorbid disease, and increased health care costs. Understanding patients’ beliefs about their health condition is an important step toward reducing medication nonadherence. The CSM provides a framework for clinicians to guide patients toward effective decision-making. Listening to the patient explain how they view their condition—how they define it, the causes, consequences, how to control it, and how long it will last or if it will progress—are important to the process of working with the patient manage their condition effectively. Clinicians’ reaction to these perceptions are important, and dismissing them may alienate patients. Effective communication is necessary to understand patients’ perspectives and to help them manage their health condition.
Corresponding author: Suzan N. Kucukarslan, PhD, RPh, [email protected].
Financial disclosures: None.
1. Gadkari AS, McHorney CA. Medication non-fulfillment rates and reasons: a narrative systematic review. Curr Med Res Opin 2010;26:683–785.
2. DiMatteo MR. Variations in patients’ adherence to medical recommendations: a quantitative review of 50 years of research. Med Care 2004;42:200–9.
3. Ho PM, Rumsfeld JS, Masoudi FA, et al. The effect of medication non-adherence on hospitalization and mortality among patients with diabetes mellitus. Arch Intern Med 2006;166;1836–41.
4. Benjamin RM. Medication adherence: Helping patients take their medicines as directed. Pub Health Rep 2012;2–3.
5. Osterberg L, Blaschke T. Adherence to medication. N Engl J Med 2005;353:487–97.
6. Haynes RB, Ackloo E, Sahota N, et al. Interventions for enhancing medication adherence. Cochrane Database Syst Rev 2008;(2):CD000011.
7. Kucukarslan SN, Lewis NJW, Shimp LA, et al. Exploring patient experiences with prescription medicines to identify unmet patient needs: implications for research and practice. Res Social Adm Pharm 2012;8:321–332.
8. Leventhal H, Leventhal EA, Contrada RJ. Self-regulation, health, and behavior: a perceptual-cognitive approach. Psychol Health 1998;13:717–33.
9. Chen S-L, Tsai J-C, Chou K-R. Illness perceptions and adherence to therapeutic regimens among patients with hypertension: A structural model approach. Int J Nurs Stud 2011;48:235–45.
10. Chen S-L, Tsai J-C, Lee W-L. The impact of illness perception on adherence to therapeutic regimens of patients with hypertension in Taiwan. J Clin Nurs 2009;18:2234–44.
11. Jessop DC, Rutter DR. Adherence to asthma medication: the role of illness representations. Psychol Health 2003;18:595–612.
12. Ross S, Walker A, MacLeod M. Patient compliance in hypertension:role of illness perceptions and treatment beliefs. J Hum Hypertension 2004;18:607–13.
13 Searle A, Norman P. Thompson R. Vedhara K. A prospective examination of illness belies and coping in patients with type 2 diabetes. Br J Health Psychol 2007;12:621–38.
14. Zugelj U, Zuparnicic M, Komidar L, et al. Self-reported adherence behavior in adolescent hypertensive patients: the role of illness representation and personality. J Pediatr Psychol 2010;35:1049–60.
15. Horne R, Weinman J. Self-regulation and self-management in asthma: exploring the role of illness perception and treatment beliefs in explaining non-adherence to preventer medication. Psychol Health 2002;17:17–32.
16. Northouse LL, Northouse PG. Health communication: strategies for health professionals. Stamford: Prentice Hall; 1998.
1. Gadkari AS, McHorney CA. Medication non-fulfillment rates and reasons: a narrative systematic review. Curr Med Res Opin 2010;26:683–785.
2. DiMatteo MR. Variations in patients’ adherence to medical recommendations: a quantitative review of 50 years of research. Med Care 2004;42:200–9.
3. Ho PM, Rumsfeld JS, Masoudi FA, et al. The effect of medication non-adherence on hospitalization and mortality among patients with diabetes mellitus. Arch Intern Med 2006;166;1836–41.
4. Benjamin RM. Medication adherence: Helping patients take their medicines as directed. Pub Health Rep 2012;2–3.
5. Osterberg L, Blaschke T. Adherence to medication. N Engl J Med 2005;353:487–97.
6. Haynes RB, Ackloo E, Sahota N, et al. Interventions for enhancing medication adherence. Cochrane Database Syst Rev 2008;(2):CD000011.
7. Kucukarslan SN, Lewis NJW, Shimp LA, et al. Exploring patient experiences with prescription medicines to identify unmet patient needs: implications for research and practice. Res Social Adm Pharm 2012;8:321–332.
8. Leventhal H, Leventhal EA, Contrada RJ. Self-regulation, health, and behavior: a perceptual-cognitive approach. Psychol Health 1998;13:717–33.
9. Chen S-L, Tsai J-C, Chou K-R. Illness perceptions and adherence to therapeutic regimens among patients with hypertension: A structural model approach. Int J Nurs Stud 2011;48:235–45.
10. Chen S-L, Tsai J-C, Lee W-L. The impact of illness perception on adherence to therapeutic regimens of patients with hypertension in Taiwan. J Clin Nurs 2009;18:2234–44.
11. Jessop DC, Rutter DR. Adherence to asthma medication: the role of illness representations. Psychol Health 2003;18:595–612.
12. Ross S, Walker A, MacLeod M. Patient compliance in hypertension:role of illness perceptions and treatment beliefs. J Hum Hypertension 2004;18:607–13.
13 Searle A, Norman P. Thompson R. Vedhara K. A prospective examination of illness belies and coping in patients with type 2 diabetes. Br J Health Psychol 2007;12:621–38.
14. Zugelj U, Zuparnicic M, Komidar L, et al. Self-reported adherence behavior in adolescent hypertensive patients: the role of illness representation and personality. J Pediatr Psychol 2010;35:1049–60.
15. Horne R, Weinman J. Self-regulation and self-management in asthma: exploring the role of illness perception and treatment beliefs in explaining non-adherence to preventer medication. Psychol Health 2002;17:17–32.
16. Northouse LL, Northouse PG. Health communication: strategies for health professionals. Stamford: Prentice Hall; 1998.
Group Visits for Discussing Advance Care Planning
Study Overview
Objective. To describe the feasibility of a primary care–based group visit model focused on advance care planning.
Design. Qualitative study.
Setting and participants. Participants were patients attending the Senior Clinic, a patient-centered medical home at the University of Colorado Hospital in Aurora, CO. Patients had to be aged 65, English speakers, and receiving primary care at the Clinic. Participants could be referred by their primary care clinician, a partner or friend, or self-refer in response to flyers. Clinicians were not asked to prioritize patients with poor health status or known end-of-life needs.
Intervention. Groups of patients met for 2 sessions (1 month apart), each 2 hours in length, facilitated by a geriatrician and a social worker. About 1 hour was spent on discussion of advance care planning concepts, including sharing experiences and considering values. Other time in the session was for introductions/rapport building, individual goal setting, and optional completion or directives and/or individual clinical visits. Facilitators were supported by a Facilitator’s Communication Guide and used educational materials and handouts with the group.
Main outcome measures. Researchers used the Reach, Effectiveness, Adoption, Implementation, and Maintenance (RE-AIM) framework to evaluate the project.
Main results. Patients were referred by 10 out of 11 clinicians. Of 80 patients approached, 32 participated in 5 group visit cohorts (40% participation rate) and 27 participated in both sessions (84% retention rate). Mean age was 79 years; 59% of participants were female and 72% white. Most evaluated the group visit as better than usual clinic visits for discussing advance care planning. Patients reported increases in detailed advance care planning conversations after participating (19% to 41%, P = 0.02). Patients were willing to share personal values and challenges related to advance care planning and they initiated discussions about a broad range of relevant topics.
Conclusion. A group visit to facilitate discussions about advance care planning and increase patient engagement is feasible. This model warrants further evaluation for effectiveness in improving advance care planning outcomes for patients, clinicians, and the system.
Commentary
An understanding of patients’ care goals is an essential element of high-quality care, allowing clinicians to align the care provided with what is most important to the patient [1]. Existing evidence does not support the commonly held belief that communication about end-of-life issues increases patient distress [1]. Early discussions about goals of care are associated with better quality of life, reduced use of nonbeneficial medical care near death, enhanced goal-consistent care, positive family outcomes, and reduced costs; however, significant barriers to having advance care planning discussions exist [2], including communication issues and lack of appropriate counseling by clinicians in primary care. Clinicians cite limited time and lack of clinic-based support as factors that impede discussions with patients about advance care planning.
New models are being developed in order to facilitate the process. Group medical visits have been recognized as a useful and effective strategy for approaching patients [1]. The current study describes what the authorssay is the first advance care planning group visit, which they named the “Conversation Group Medical Visit” (CGMV). Its aim is to engage patients in a discussion of key advance care planning concepts and support patient-initiated advance care planning actions, such as choosing surrogate decision makers, deciding on preferences during serious illness, discussing preferences with decision makers and health care providers, and documenting advance directives in the electronic health record [3].
As part of the group medical visits, participants receive an agenda, a personal copy of their EHR highlighting current advance care planning documentation, if any, and a blank medical durable power of attorney form. Facilitators use educational materials including videos from the PREPARE website (prepareforyourcare.org) that demonstrate a family’s conversation, advance directives, and various degrees of flexibility in the decision-making role. A Conversation Starter Kit is also used, which prompts individuals to think about their values and guides conversations about preferences.
Researcher used the RE-AIM framework [4] to evaluate the implementation of this group medical visit model. This framework looks at Reach (if older adults would participate in the medical group visits), Effectiveness (related to participant’s engagement in the conversations), the Adoption of the model by health providers (clinician referral patterns), Implementation (related to the attendance of patients at both clinical and group visits and aspects of planning discussed), and Maintenance (not assessed in this study).
There was a 40% participation rate. Reasons given for declining to participate were having participated in past advance care planning conversation or having an existing advance directive (30%), lack of interest (13%), illness (3.3%), lack of transportation (3.3%), and other/unknown (50%). Regarding effectiveness, the majority of patients rated the group visit as better than usual clinic visits for talking about advance care planning. Participants reported that they received useful information and felt comfortable talking about advance care planning in the group. In addition, participants reported finding it helpful to talk with others about advance care planning (92%). Participants also reported an overall increase (19% to 41%) in advance care planning conversations with family members after participating in the group visit (P =0.02). Participants said these conversations included enough details that they felt confident that their family members knew their wishes. Thus, enrollment in a CGMV led to improvements in conversation not only between patient and health care provider but also between family members.
Several themes were identified during discussions. Patients shared personal values and challenges related to advance care planning. Also, the facilitated discussions introduced key advance care planning concepts and encouraged patients to share related experiences, questions, successes, and challenges in regards to these topics. An interesting finding was that patients in groups of 4 or 5 seemed less engaged in the discussion than those in groups of 7 to 9 patients.
Applications for Clinical Practice
This novel strategy to faciliate discussions about advance care planning showed promising results and appears feasible, but further study is needed to evaluate the model. It may prove useful as a new model of advance care planning in primary care. Further longitudinal research is encouraged.
—Paloma Cesar de Sales, BS, RN, MS
1. Bernacki RE, Block SD; American College of Physicians High Value Care Task Force. Communication about serious illness care goals: a review and synthesis of best practices. JAMA Intern Med 2014;174:1994–2003.
2. Lum HD, Sudore RL, Bekelman DB. Advance care planning in the elderly. Med Clin North Am 2015;99:391–403.
3. Fried TR, Bullock K, Iannone L, O’Leary JR. Understanding advance care planning as a process of health behavior change. J Am Geriatr Soc 2009;57:1547–55.
4. Glasgow RE, Vogt TM, Boles SM. Evaluating the public health impact of health promotion interventions: the RE-AIM framework. Am J Public Health 1999;89:1322–7.
Study Overview
Objective. To describe the feasibility of a primary care–based group visit model focused on advance care planning.
Design. Qualitative study.
Setting and participants. Participants were patients attending the Senior Clinic, a patient-centered medical home at the University of Colorado Hospital in Aurora, CO. Patients had to be aged 65, English speakers, and receiving primary care at the Clinic. Participants could be referred by their primary care clinician, a partner or friend, or self-refer in response to flyers. Clinicians were not asked to prioritize patients with poor health status or known end-of-life needs.
Intervention. Groups of patients met for 2 sessions (1 month apart), each 2 hours in length, facilitated by a geriatrician and a social worker. About 1 hour was spent on discussion of advance care planning concepts, including sharing experiences and considering values. Other time in the session was for introductions/rapport building, individual goal setting, and optional completion or directives and/or individual clinical visits. Facilitators were supported by a Facilitator’s Communication Guide and used educational materials and handouts with the group.
Main outcome measures. Researchers used the Reach, Effectiveness, Adoption, Implementation, and Maintenance (RE-AIM) framework to evaluate the project.
Main results. Patients were referred by 10 out of 11 clinicians. Of 80 patients approached, 32 participated in 5 group visit cohorts (40% participation rate) and 27 participated in both sessions (84% retention rate). Mean age was 79 years; 59% of participants were female and 72% white. Most evaluated the group visit as better than usual clinic visits for discussing advance care planning. Patients reported increases in detailed advance care planning conversations after participating (19% to 41%, P = 0.02). Patients were willing to share personal values and challenges related to advance care planning and they initiated discussions about a broad range of relevant topics.
Conclusion. A group visit to facilitate discussions about advance care planning and increase patient engagement is feasible. This model warrants further evaluation for effectiveness in improving advance care planning outcomes for patients, clinicians, and the system.
Commentary
An understanding of patients’ care goals is an essential element of high-quality care, allowing clinicians to align the care provided with what is most important to the patient [1]. Existing evidence does not support the commonly held belief that communication about end-of-life issues increases patient distress [1]. Early discussions about goals of care are associated with better quality of life, reduced use of nonbeneficial medical care near death, enhanced goal-consistent care, positive family outcomes, and reduced costs; however, significant barriers to having advance care planning discussions exist [2], including communication issues and lack of appropriate counseling by clinicians in primary care. Clinicians cite limited time and lack of clinic-based support as factors that impede discussions with patients about advance care planning.
New models are being developed in order to facilitate the process. Group medical visits have been recognized as a useful and effective strategy for approaching patients [1]. The current study describes what the authorssay is the first advance care planning group visit, which they named the “Conversation Group Medical Visit” (CGMV). Its aim is to engage patients in a discussion of key advance care planning concepts and support patient-initiated advance care planning actions, such as choosing surrogate decision makers, deciding on preferences during serious illness, discussing preferences with decision makers and health care providers, and documenting advance directives in the electronic health record [3].
As part of the group medical visits, participants receive an agenda, a personal copy of their EHR highlighting current advance care planning documentation, if any, and a blank medical durable power of attorney form. Facilitators use educational materials including videos from the PREPARE website (prepareforyourcare.org) that demonstrate a family’s conversation, advance directives, and various degrees of flexibility in the decision-making role. A Conversation Starter Kit is also used, which prompts individuals to think about their values and guides conversations about preferences.
Researcher used the RE-AIM framework [4] to evaluate the implementation of this group medical visit model. This framework looks at Reach (if older adults would participate in the medical group visits), Effectiveness (related to participant’s engagement in the conversations), the Adoption of the model by health providers (clinician referral patterns), Implementation (related to the attendance of patients at both clinical and group visits and aspects of planning discussed), and Maintenance (not assessed in this study).
There was a 40% participation rate. Reasons given for declining to participate were having participated in past advance care planning conversation or having an existing advance directive (30%), lack of interest (13%), illness (3.3%), lack of transportation (3.3%), and other/unknown (50%). Regarding effectiveness, the majority of patients rated the group visit as better than usual clinic visits for talking about advance care planning. Participants reported that they received useful information and felt comfortable talking about advance care planning in the group. In addition, participants reported finding it helpful to talk with others about advance care planning (92%). Participants also reported an overall increase (19% to 41%) in advance care planning conversations with family members after participating in the group visit (P =0.02). Participants said these conversations included enough details that they felt confident that their family members knew their wishes. Thus, enrollment in a CGMV led to improvements in conversation not only between patient and health care provider but also between family members.
Several themes were identified during discussions. Patients shared personal values and challenges related to advance care planning. Also, the facilitated discussions introduced key advance care planning concepts and encouraged patients to share related experiences, questions, successes, and challenges in regards to these topics. An interesting finding was that patients in groups of 4 or 5 seemed less engaged in the discussion than those in groups of 7 to 9 patients.
Applications for Clinical Practice
This novel strategy to faciliate discussions about advance care planning showed promising results and appears feasible, but further study is needed to evaluate the model. It may prove useful as a new model of advance care planning in primary care. Further longitudinal research is encouraged.
—Paloma Cesar de Sales, BS, RN, MS
Study Overview
Objective. To describe the feasibility of a primary care–based group visit model focused on advance care planning.
Design. Qualitative study.
Setting and participants. Participants were patients attending the Senior Clinic, a patient-centered medical home at the University of Colorado Hospital in Aurora, CO. Patients had to be aged 65, English speakers, and receiving primary care at the Clinic. Participants could be referred by their primary care clinician, a partner or friend, or self-refer in response to flyers. Clinicians were not asked to prioritize patients with poor health status or known end-of-life needs.
Intervention. Groups of patients met for 2 sessions (1 month apart), each 2 hours in length, facilitated by a geriatrician and a social worker. About 1 hour was spent on discussion of advance care planning concepts, including sharing experiences and considering values. Other time in the session was for introductions/rapport building, individual goal setting, and optional completion or directives and/or individual clinical visits. Facilitators were supported by a Facilitator’s Communication Guide and used educational materials and handouts with the group.
Main outcome measures. Researchers used the Reach, Effectiveness, Adoption, Implementation, and Maintenance (RE-AIM) framework to evaluate the project.
Main results. Patients were referred by 10 out of 11 clinicians. Of 80 patients approached, 32 participated in 5 group visit cohorts (40% participation rate) and 27 participated in both sessions (84% retention rate). Mean age was 79 years; 59% of participants were female and 72% white. Most evaluated the group visit as better than usual clinic visits for discussing advance care planning. Patients reported increases in detailed advance care planning conversations after participating (19% to 41%, P = 0.02). Patients were willing to share personal values and challenges related to advance care planning and they initiated discussions about a broad range of relevant topics.
Conclusion. A group visit to facilitate discussions about advance care planning and increase patient engagement is feasible. This model warrants further evaluation for effectiveness in improving advance care planning outcomes for patients, clinicians, and the system.
Commentary
An understanding of patients’ care goals is an essential element of high-quality care, allowing clinicians to align the care provided with what is most important to the patient [1]. Existing evidence does not support the commonly held belief that communication about end-of-life issues increases patient distress [1]. Early discussions about goals of care are associated with better quality of life, reduced use of nonbeneficial medical care near death, enhanced goal-consistent care, positive family outcomes, and reduced costs; however, significant barriers to having advance care planning discussions exist [2], including communication issues and lack of appropriate counseling by clinicians in primary care. Clinicians cite limited time and lack of clinic-based support as factors that impede discussions with patients about advance care planning.
New models are being developed in order to facilitate the process. Group medical visits have been recognized as a useful and effective strategy for approaching patients [1]. The current study describes what the authorssay is the first advance care planning group visit, which they named the “Conversation Group Medical Visit” (CGMV). Its aim is to engage patients in a discussion of key advance care planning concepts and support patient-initiated advance care planning actions, such as choosing surrogate decision makers, deciding on preferences during serious illness, discussing preferences with decision makers and health care providers, and documenting advance directives in the electronic health record [3].
As part of the group medical visits, participants receive an agenda, a personal copy of their EHR highlighting current advance care planning documentation, if any, and a blank medical durable power of attorney form. Facilitators use educational materials including videos from the PREPARE website (prepareforyourcare.org) that demonstrate a family’s conversation, advance directives, and various degrees of flexibility in the decision-making role. A Conversation Starter Kit is also used, which prompts individuals to think about their values and guides conversations about preferences.
Researcher used the RE-AIM framework [4] to evaluate the implementation of this group medical visit model. This framework looks at Reach (if older adults would participate in the medical group visits), Effectiveness (related to participant’s engagement in the conversations), the Adoption of the model by health providers (clinician referral patterns), Implementation (related to the attendance of patients at both clinical and group visits and aspects of planning discussed), and Maintenance (not assessed in this study).
There was a 40% participation rate. Reasons given for declining to participate were having participated in past advance care planning conversation or having an existing advance directive (30%), lack of interest (13%), illness (3.3%), lack of transportation (3.3%), and other/unknown (50%). Regarding effectiveness, the majority of patients rated the group visit as better than usual clinic visits for talking about advance care planning. Participants reported that they received useful information and felt comfortable talking about advance care planning in the group. In addition, participants reported finding it helpful to talk with others about advance care planning (92%). Participants also reported an overall increase (19% to 41%) in advance care planning conversations with family members after participating in the group visit (P =0.02). Participants said these conversations included enough details that they felt confident that their family members knew their wishes. Thus, enrollment in a CGMV led to improvements in conversation not only between patient and health care provider but also between family members.
Several themes were identified during discussions. Patients shared personal values and challenges related to advance care planning. Also, the facilitated discussions introduced key advance care planning concepts and encouraged patients to share related experiences, questions, successes, and challenges in regards to these topics. An interesting finding was that patients in groups of 4 or 5 seemed less engaged in the discussion than those in groups of 7 to 9 patients.
Applications for Clinical Practice
This novel strategy to faciliate discussions about advance care planning showed promising results and appears feasible, but further study is needed to evaluate the model. It may prove useful as a new model of advance care planning in primary care. Further longitudinal research is encouraged.
—Paloma Cesar de Sales, BS, RN, MS
1. Bernacki RE, Block SD; American College of Physicians High Value Care Task Force. Communication about serious illness care goals: a review and synthesis of best practices. JAMA Intern Med 2014;174:1994–2003.
2. Lum HD, Sudore RL, Bekelman DB. Advance care planning in the elderly. Med Clin North Am 2015;99:391–403.
3. Fried TR, Bullock K, Iannone L, O’Leary JR. Understanding advance care planning as a process of health behavior change. J Am Geriatr Soc 2009;57:1547–55.
4. Glasgow RE, Vogt TM, Boles SM. Evaluating the public health impact of health promotion interventions: the RE-AIM framework. Am J Public Health 1999;89:1322–7.
1. Bernacki RE, Block SD; American College of Physicians High Value Care Task Force. Communication about serious illness care goals: a review and synthesis of best practices. JAMA Intern Med 2014;174:1994–2003.
2. Lum HD, Sudore RL, Bekelman DB. Advance care planning in the elderly. Med Clin North Am 2015;99:391–403.
3. Fried TR, Bullock K, Iannone L, O’Leary JR. Understanding advance care planning as a process of health behavior change. J Am Geriatr Soc 2009;57:1547–55.
4. Glasgow RE, Vogt TM, Boles SM. Evaluating the public health impact of health promotion interventions: the RE-AIM framework. Am J Public Health 1999;89:1322–7.
Managing diabetes in hospitalized patients with chronic kidney disease
Managing glycemic control in hospitalized patients with chronic kidney disease (CKD) and diabetes mellitus is a challenge, with no published guidelines. In this setting, avoiding hypoglycemia takes precedence over meeting strict blood glucose targets. Optimal management is essential to reduce hypoglycemia and the risk of death from cardiovascular disease.1
This article reviews the evidence to guide diabetes management in hospitalized patients with CKD, focusing on blood glucose monitoring, insulin dosing, and concerns about other diabetic agents.
FOCUS ON AVOIDING HYPOGLYCEMIA
CKD is common, estimated to affect more than 50 million people worldwide.2 Diabetes mellitus is the primary cause of kidney failure in 45% of dialysis patients with CKD.
Tight control comes with a cost
Hyperglycemia in hospitalized patients is associated with a higher risk of death, a higher risk of infections, and a longer hospital stay.3,4 In 2001, Van den Berghe et al5 found that intensive insulin therapy reduced the mortality rate in critically ill patients in the surgical intensive care unit. But subsequent studies6,7 found that intensive insulin therapy to achieve tight glycemic control increased rates of morbidity and mortality without adding clinical benefit.
Randomized clinical trials in outpatients have shown that tight control of blood glucose levels reduces microvascular and macrovascular complications in patients with type 1 diabetes.8–10 In the Diabetes Control and Complications Trial,9 compared with conventional therapy, intensive insulin therapy reduced the incidence of retinopathy progression (4.7 vs 1.2 cases per 100 patient-years, number needed to treat [NNT] = 3 for 10 years) and clinical neuropathy (9.8 vs 3.1 per 100 patient-years, NNT = 1.5 for 10 years). The long-term likelihood of a cardiovascular event was also significantly lower in the intensive treatment group (0.38 vs 0.80 events per 100 patient-years).9
Similarly, in the Epidemiology of Diabetes Interventions and Complications follow-up study, the intensive therapy group had fewer cardiovascular deaths.11 On the other hand, the risk of severe hypoglycemia and subsequent coma or seizure was significantly higher in the intensive therapy group than in the conventional therapy group (16.3 vs 5.4 per 100 patient-years).8
CKD increases hypoglycemia risk
Moen et al12 found that the incidence of hypoglycemia was significantly higher in patients with CKD (estimated glomerular filtration rate [GFR] < 60 mL/min) with or without diabetes, and that patients with both conditions were at greatest risk (Figure 1). Multiple factors contribute to the increased risk of hypoglycemia: patients with advanced CKD tend to have poor nutrition, resulting in reduced glycogen stores, and a smaller renal mass reduces renal gluconeogenesis and decreases the elimination of insulin and oral antidiabetic agents.
After the onset of diabetic nephropathy, progression of renal complications and overall life expectancy are influenced by earlier glycemic control.8 Development of diabetic nephropathy is commonly accompanied by changes in metabolic control, particularly an increased risk of hypoglycemia.13 In addition, episodes of severe hypoglycemia constitute an independent cardiovascular risk factor.14
Aggressive glycemic control in hospitalized patients, particularly those with advanced CKD, is associated with a risk of hypoglycemia without overall improvement in outcomes.15 Elderly patients with type 2 diabetes are similar to patients with CKD in that they have a reduced GFR and are thus more sensitive to insulin. In both groups, intensifying glycemic control, especially in the hospital, is associated with more frequent episodes of severe hypoglycemia.16 The focus should be not only on maintaining optimal blood glucose concentration, but also on preventing hypoglycemia.
‘Burnt-out’ diabetes
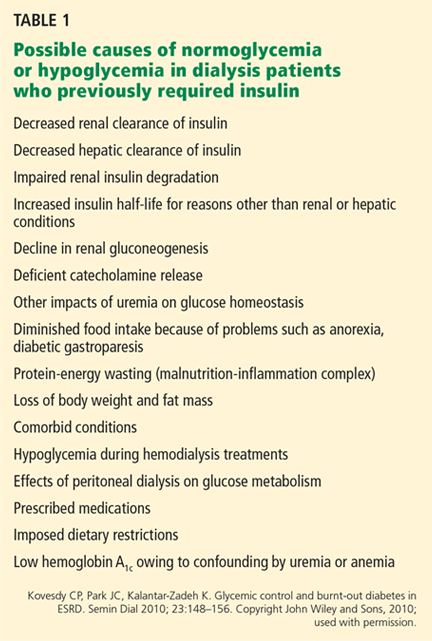
Paradoxically, patients with end-stage renal disease and type 2 diabetes often experience altered glucose homeostasis with markedly improved glycemic control. They may attain normoglycemia and normalization of hemoglobin A1c, a condition known as “burnt-out” diabetes. Its precise mechanism is not understood and its significance remains unclear (Table 1).17
HEMOGLOBIN A1c CAN BE FALSELY HIGH OR FALSELY LOW
Hemoglobin A1c measurement is used to diagnose diabetes and to assess long-term glycemic control. It is a measure of the fraction of hemoglobin that has been glycated by exposure to glucose. Because the average lifespan of a red cell is 120 days, the hemoglobin A1c value reflects the mean blood glucose concentration over the preceding 3 months.
But hemoglobin A1c measurement has limitations: any condition that alters the lifespan of erythrocytes leads to higher or lower hemoglobin A1c levels. Hemoglobin A1c levels are also affected by kidney dysfunction, hemolysis, and acidosis.18
Falsely high hemoglobin A1c levels are associated with conditions that prolong the lifespan of erythrocytes, such as asplenia. Iron deficiency also increases the average age of circulating red cells because of reduced red cell production. For patients in whom blood glucose measurements do not correlate with hemoglobin A1c measurements, iron deficiency anemia should be considered before altering a treatment regimen.
Falsely low hemoglobin A1c levels are associated with conditions of more rapid erythrocyte turnover, such as autoimmune hemolytic anemia, hereditary spherocytosis, and acute blood loss anemia. In patients with CKD, recombinant erythropoietin treatment lowers hemoglobin A1c levels by increasing the number of immature red cells, which are less likely to glycosylate.19
Morgan et al20 compared the association between hemoglobin A1c and blood glucose levels in diabetic patients with moderate to severe CKD not requiring dialysis and in diabetic patients with normal renal function and found no difference between these two groups, suggesting that hemoglobin A1c is reliable in this setting. But study results conflict for patients on dialysis, making the usefulness of hemoglobin A1c testing for those patients less clear. In one study, hemoglobin A1c testing underestimated glycemic control,20 but other studies found that glycemic control was overestimated.21,22
Alternatives to hemoglobin A1c
Other measures of long-term glycemic control such as fructosamine and glycated albumin levels are sometimes used in conditions in which hemoglobin A1c may not be reliable.
Albumin also undergoes glycation when exposed to glucose. Glycated albumin appears to be a better measure of glycemic control in patients with CKD and diabetes than serum fructosamine,23 which has failed to show a significant correlation with blood glucose levels in patients with CKD.24 However, because serum albumin has a short half-life, glycated albumin reflects glycemic control in only the approximately 1 to 2 weeks before sampling,25 so monthly monitoring is required.
Glycated albumin levels may be reduced due to increased albumin turnover in patients with nephrotic-range proteinuria and in diabetic patients on peritoneal dialysis. Several issues remain unclear, such as the appropriate target level of glycated albumin and at what stage of CKD it should replace hemoglobin A1c testing. If an improved assay that is unaffected by changes in serum albumin becomes available, it may be appropriate to use glycated albumin measurements to assess long-term glycemic control for patients with CKD.
In general, therapeutic decisions to achieve optimum glycemic control in patients with diabetes and CKD should be based on hemoglobin A1c testing, multiple glucose measurements, and patient symptoms of hypoglycemia or hyperglycemia. The best measure for assessing glycemic control in hospitalized patients with CKD remains multiple blood glucose testing daily.
INSULIN THERAPY PREFERRED
Although several studies have evaluated inpatient glycemic control,26–29 no guidelines have been published for hospitalized patients with diabetes and CKD. Insulin therapy is preferred for achieving glycemic control in acutely ill or hospitalized patients with diabetes. Oral hypoglycemic agents should be discontinued.
Regardless of the form of insulin chosen to treat diabetes, caution is needed for patients with kidney disease. During hospitalization, clinical changes are expected owing to illness and differences in caloric intake and physical activity, resulting in altered insulin sensitivity. Insulin-treated hospitalized patients require individualized care, including multiple daily blood glucose tests and insulin therapy modifications for ideal glycemic control.
For surgical or medical intensive care patients on insulin therapy, the target blood glucose level before meals should be 140 mg/dL, and the target random level should be less than 180 mg/dL.15,26–29
Basal-bolus insulin
Sliding-scale therapy should be avoided as the only method for glycemic control. Instead, scheduled subcutaneous basal insulin once or twice daily combined with rapid- or short-acting insulin with meals is recommended.
Basal-bolus insulin therapy, one of the most advanced and flexible insulin replacement therapies, mimics endogenous insulin release and offers great advantages in diabetes care. Using mealtime bolus insulin permits variation in the amount of food eaten; more insulin can be taken with a larger meal and less with smaller meals. A bolus approach offers the flexibility of administering rapid-acting insulin immediately after meals when oral intake is variable.
Individualize insulin therapy
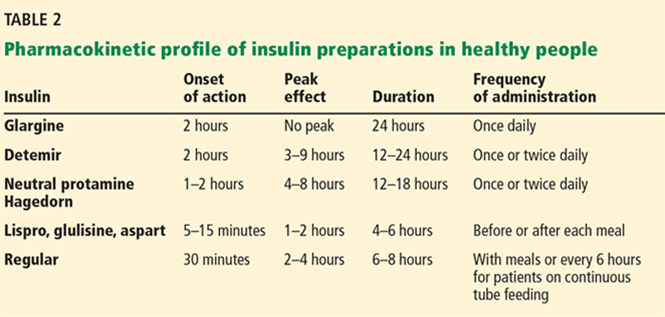
Optimizing glycemic control requires an understanding of the altered pharmacokinetics and pharmacodynamics of insulin in patients with diabetic nephropathy. Table 2 shows the pharmacokinetic profiles of insulin preparations in healthy people. Analogue insulins, which are manufactured by recombinant DNA technology, have conformational changes in the insulin molecule that alter their pharmacokinetics and pharmacodynamics. The rapid-acting analogue insulins are absorbed quickly, making them suitable for postprandial glucose control.
Changes in GFR are associated with altered pharmacokinetics and pharmacodynamics of insulin,30,31 but unlike for oral antidiabetic agents, these properties are not well characterized for insulin preparations in patients with renal insufficiency.13,32–36
CKD may reduce insulin clearance. Rave et al32 reported that the clearance of regular human insulin was reduced by 30% to 40% in patients with type 1 diabetes and a mean estimated GFR of 54 mL/min. They found that the metabolic activity of insulin lispro was more robust than that of short-acting regular human insulin in patients with diabetic nephropathy. In another study, patients with diabetes treated with insulin aspart did not show any significant change in the required insulin dosage in relation to the renal filtration rate.34 Biesenbach et al33 found a 38% reduction in insulin requirements in patients with type 1 diabetes as estimated GFR decreased from 80 mL/min to 10 mL/min. Further studies are required to better understand the safety of insulin in treating hospitalized patients with diabetes and renal insufficiency.
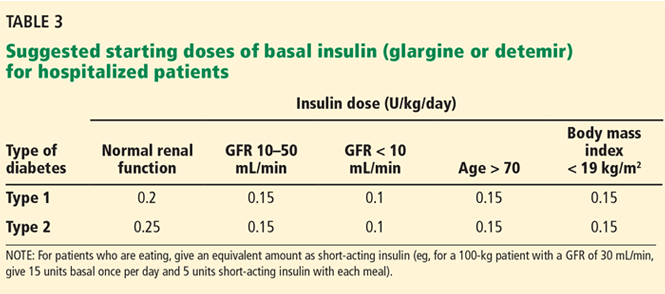
Few studies have compared the pharmacodynamics of long-acting insulins in relation to declining renal function. The long-acting analogue insulins have less of a peak than human insulin and thus better mimic endogenous insulin secretion. For insulin detemir, Lindholm and Jacobsen found no significant differences in the pharmacokinetics related to the stages of CKD.35 When using the long-acting insulins glargine or detemir, one should consider giving much lower doses (half the initial starting dosage) and titrating the dosage until target fasting glucose concentrations are reached to prevent hypoglycemia.
Table 3 summarizes recommended insulin dosage adjustments in CKD based on the literature and our clinical experience.
Considerations for dialysis patients
Subcutaneously administered insulin is eliminated renally, unlike endogenous insulin, which undergoes first-pass metabolism in the liver.13,37 As renal function declines, insulin clearance decreases and the insulin dosage must be reduced to prevent hypoglycemia.
Patients on hemodialysis or peritoneal dialysis pose a challenge for insulin dosing. Hemodialysis improves insulin sensitivity but also increases insulin clearance, making it difficult to determine insulin requirements. Sobngwi et al38 conducted a study in diabetic patients with end-stage renal disease on hemodialysis, using a 24-hour euglycemic clamp. They found that exogenous basal insulin requirements were 25% lower on the day after hemodialysis compared with the day before, but premeal insulin requirements stayed the same.
Peritoneal dialysis exposes patients to a high glucose load via the peritoneum, which can worsen insulin resistance. Intraperitoneal administration of insulin during peritoneal dialysis provides a more physiologic effect than subcutaneous administration: it prevents fluctuations of blood glucose and the formation of insulin antibodies. But insulin requirements are higher owing to a dilutional effect and to insulin binding to the plastic surface of the dialysis fluid reservoir.39
GLYCEMIC CONTROL FOR PROCEDURES
No guidelines have been established regarding the optimal blood glucose range for diabetic patients with CKD undergoing diagnostic or surgical procedures. Given the risk of hypoglycemia in such settings, less-stringent targets are reasonable, ie, premeal blood glucose levels of 140 mg/dL and random blood glucose levels of less than 180 mg/dL.
Before surgery, consideration should be given to the type of diabetes, surgical procedure, and metabolic control. Patients on insulin detemir or glargine as part of a basal-bolus regimen with rapid-acting insulin may safely be given the full dose of their basal insulin the night before or the morning of their procedure. However, patients on neutral protamine Hagedorn (NPH) insulin as a part of their basal-bolus regimen should receive half of their usual dose due to a difference in pharmacokinetic profile compared with insulin glargine or detemir.
In insulin-treated patients undergoing prolonged procedures (eg, coronary artery bypass grafting, transplant):
- Discontinue subcutaneous insulin and start an intravenous insulin infusion, titrated to maintain a blood glucose range of 140 to 180 mg/dL
- Subcutaneous insulin management may be acceptable for patients undergoing shorter outpatient procedures
- Supplemental subcutaneous doses of short- or rapid-acting insulin preparations can be given for blood glucose elevation greater than 180 mg/dL.
AVOID ORAL AGENTS AND NONINSULIN INJECTABLES
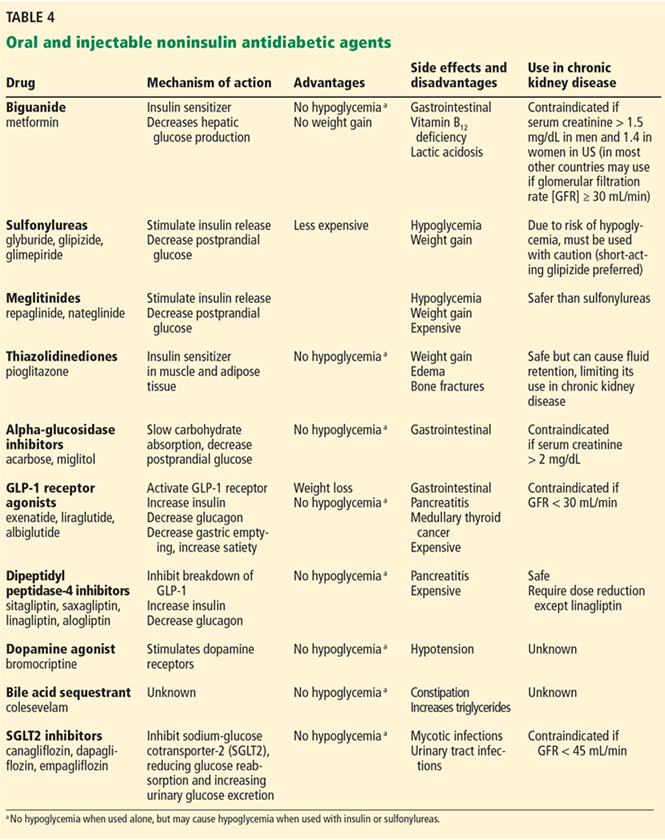
Oral antidiabetic agents and noninsulin injectables (Table 4) should generally be avoided in hospitalized patients, especially for those with decompensated heart failure, renal insufficiency, hypoperfusion, or chronic pulmonary disease, or for those given intravenous contrast. Most oral medications used to treat diabetes are affected by reduced kidney function, resulting in prolonged drug exposure and increased risk of hypoglycemia in patients with moderate to severe CKD (stages 3–5).
Metformin, a biguanide, is contraindicated in patients with high serum creatinine levels (> 1.5 mg/dL in men, > 1.4 mg/dL in women) because of the theoretical risk of lactic acidosis.40
Sulfonylurea clearance depends on kidney function.41 Severe prolonged episodes of hypoglycemia have been reported in dialysis patients taking these drugs, except with glipizide, which carries a lower risk.41,42
Repaglinide, a nonsulfonylurea insulin secretagogue, can be used in CKD stages 3 to 4 without any dosage adjustment.43
Thiazolidinediones have been reported to slow the progression of diabetic kidney disease independent of glycemic control.44 Adverse effects include fluid retention, edema, and congestive heart failure. Thiazolidinediones should not be used in patients with New York Heart Association class 3 or 4 heart failure,45 and so should not be prescribed in the hospital except for patients who are clinically stable or ready for discharge.
Quick-release bromocriptine, a dopamine receptor agonist, has been shown to be effective in lowering fasting plasma glucose levels and hemoglobin A1c, and improving glucose tolerance in obese patients with type 2 diabetes, although its usefulness in hospitalized patients with diabetes is not known.46,47
Dipeptidyl peptidase inhibitors. Sitagliptin and saxagliptin have been shown to be safe and effective in hospitalized patients with type 2 diabetes.48 However, except for linagliptin, dose reduction is recommended in patients with CKD stage 3 and higher.49–52
GLP-1 receptor agonists. Drugs of this class are potent agents for the reduction of glucose in the outpatient setting but are relatively contraindicated if the GFR is less than 30 mL/min, and they are currently not used in the hospital.
BLOOD GLUCOSE MONITORING IN HOSPITALIZED PATIENTS
Bedside blood glucose monitoring is recommended for all hospitalized patients with known diabetes with or without CKD, those with newly recognized hyperglycemia, and those who receive therapy associated with high risk for hyperglycemia, such as glucocorticoid therapy and enteral and parenteral nutrition. For patients on scheduled diets, fingerstick blood glucose monitoring is recommended before meals and at bedtime. In patients with no oral intake or on continuous enteral or parenteral nutrition, blood glucose monitoring every 4 to 6 hours is recommended. More frequent monitoring (eg, adding a 3:00 am check) may be prudent in patients with CKD.
Continuous glucose monitoring systems use a sensor inserted under the skin and transmit information via radio to a wireless monitor. Such systems are more expensive than conventional glucose monitoring but may enable better glucose control by providing real-time glucose measurements, with levels displayed at 5-minute or 1-minute intervals. Marshall et al53 confirmed this technology’s accuracy and precision in uremic patients on dialysis.
Considerations for peritoneal dialysis
For patients on peritoneal dialysis, glucose in the dialysate exacerbates hyperglycemia. Dialysis solutions with the glucose polymer icodextrin as the osmotic agent instead of glucose have been suggested to reduce glucose exposure.
Glucose monitoring systems measure interstitial fluid glucose by the glucose oxidase reaction and therefore are not affected by icodextrin. However, icodextrin is converted to maltose, a disaccharide composed of two glucose molecules, which can cause spuriously high readings in devices that use test strips containing the enzymes glucose dehydrogenase pyrroloquinoline quinone or glucose dye oxidoreductase. Spurious hyperglycemia may lead to giving too much insulin, in turn leading to symptomatic hypoglycemia.
Clinicians caring for patients receiving icodextrin should ensure that the glucose monitoring system uses only test strips that contain glucose oxidase, glucose dehydrogenase-nicotinamide adenine dinucleotide, or glucose dehydrogenase-flavin adenine dinucleotide, which are not affected by icodextrin.54
IMPROVING QUALITY
Hospitalized patients face many barriers to optimal glycemic control. Less experienced practitioners tend to have insufficient knowledge of insulin preparations and appropriate insulin dosing. Also, diabetes is often listed as a secondary diagnosis and so may be overlooked by the inpatient care team.
Educational programs should be instituted to overcome these barriers and improve knowledge related to inpatient diabetes care. When necessary, the appropriate use of consultants is important in hospitalized settings to improve quality and make hospital care more efficient and cost-effective.
No national benchmarks currently exist for inpatient diabetes care, and they need to be developed to ensure best practices. Physicians should take the initiative to remedy this by collaborating with other healthcare providers, such as dedicated diabetes educators, nursing staff, pharmacists, registered dietitians, and physicians with expertise in diabetes management, with the aim of achieving optimum glycemic control and minimizing hypoglycemia.
- Go AS, Chertow GM, Fan D, McCulloch CE, Hsu CY. Chronic kidney disease and the risks of death, cardiovascular events, and hospitalization. N Engl J Med 2004; 351:1296–1305.
- Newman DJ, Mattock MB, Dawnay AB, et al. Systematic review on urine albumin testing for early detection of diabetic complications. Health Technol Assess 2005; 9:iii–vi, xiii–163.
- Umpierrez GE, Isaacs SD, Bazargan N, You X, Thaler LM, Kitabchi AE. Hyperglycemia: an independent marker of in-hospital mortality in patients with undiagnosed diabetes. J Clin Endocrinol Metab 2002; 87:978–982.
- Golden SH, Peart-Vigilance C, Kao WH, Brancati FL. Perioperative glycemic control and the risk of infectious complications in a cohort of adults with diabetes. Diabetes Care 1999; 22:1408–1414.
- Van den Berghe G, Wouters P, Weekers F, et al. Intensive insulin therapy in critically ill patients. N Engl J Med 2001; 345:1359–1367.
- NICE-SUGAR Study Investigators; Finfer S, Chittock DR, Su SY, et al. Intensive versus conventional glucose control in critically ill patients. N Engl J Med 2009; 360:1283–1297.
- Brunkhorst FM, Engel C, Bloos F, et al; German Competence Network Sepsis (SepNet). Intensive insulin therapy and pentastarch resuscitation in severe sepsis. N Engl J Med 2008; 358:125–139.
- The effect of intensive treatment of diabetes on the development and progression of long-term complications in insulin-dependent diabetes mellitus. The Diabetes Control and Complications Trial Research Group. N Engl J Med 1993; 329:977–986.
- Effect of intensive diabetes management on macrovascular events and risk factors in the Diabetes Control and Complications Trial. Am J Cardiol 1995; 75:894–903.
- Nathan DM, Lachin J, Cleary P, et al; Diabetes Control and Complications Trial; Epidemiology of Diabetes Interventions and Complications Research Group. Intensive diabetes therapy and carotid intima-media thickness in type 1 diabetes mellitus. N Engl J Med 2003; 348:2294–2303.
- Writing Group for the DCCT/EDIC Research Group; Orchard TJ, Nathan DM, Zinman B, et al. Association between 7 years of intensive treatment of type 1 diabetes and long-term mortality. JAMA 2015; 313:45–53.
- Moen MF, Zhan M, Hsu VD, et al. Frequency of hypoglycemia and its significance in chronic kidney disease. Clin J Am Soc Nephrol 2009; 4:1121–1127.
- Iglesias P, Díez J. Insulin therapy in renal disease. Diabetes Obes Metab 2008; 10:811–823.
- Zoungas S, Patel A, Chalmers J, et al; ADVANCE Collaborative Group. Severe hypoglycemia and risks of vascular events and death. N Engl J Med 2010; 363:1410–1418.
- Moghissi ES, Korytkowski MT, DiNardo M, et al; American Association of Clinical Endocrinologists; American Diabetes Association. American Association of Clinical Endocrinologists and American Diabetes Association consensus statement on inpatient glycemic control. Diabetes Care 2009; 32:1119–1131.
- Action to Control Cardiovascular Risk in Diabetes Study Group; Gerstein HC, Miller ME, Byington RP, et al. Effects of intensive glucose lowering in type 2 diabetes. N Engl J Med 2008; 358:2545–2559.
- Kovesdy CP, Park JC, Kalantar-Zadeh K. Glycemic control and burnt-out diabetes in ESRD. Semin Dial 2010; 23:148–156.
- De Marchi S, Cecchin E, Camurri C, et al. Origin of glycosylated hemoglobin A1 in chronic renal failure. Int J Artif Organs 1983; 6:77–82.
- Brown JN, Kemp DW, Brice KR. Class effect of erythropoietin therapy on hemoglobin A(1c) in a patient with diabetes mellitus and chronic kidney disease not undergoing hemodialysis. Pharmacotherapy 2009; 29:468–472.
- Morgan L, Marenah CB, Jeffcoate WJ, Morgan AG. Glycated proteins as indices of glycemic control in diabetic patients with chronic renal failure. Diabet Med 1996; 13:514–519.
- Peacock TP, Shihabi ZK, Bleyer AJ, et al. Comparison of glycated albumin and hemoglobin A(1c) levels in diabetic subjects on hemodialysis. Kidney Int 2008; 73:1062–1068.
- Joy MS, Cefalu WT, Hogan SL, Nachman PH. Long-term glycemic control measurements in diabetic patients receiving hemodialysis. Am J Kidney Dis 2002; 39:297–307.
- Inaba M, Okuno S, Kumeda Y, et al; Osaka CKD Expert Research Group. Glycated albumin is a better glycemic indicator than glycated hemoglobin values in hemodialysis patients with diabetes: effect of anemia and erythropoietin injection. J Am Soc Nephrol 2007; 18:896–903.
- Mittman N, Desiraju B, Fazil I, et al. Serum fructosamine versus glycosylated hemoglobin as an index of glycemic control, hospitalization, and infection in diabetic hemodialysis patients. Kidney Int 2010; 78(suppl 117):S41–S45.
- Alskar O, Korelli J, Duffull SB. A pharmacokinetic model for the glycation of albumin. J Pharmacokinet Pharmacodyn 2012; 39:273–282.
- Qaseem A, Humphrey LL, Chou R, Snow V, Shekelle P; Clinical Guidelines Committee of the American College of Physicians. Use of intensive insulin therapy for the management of glycemic control in hospitalized patients: a clinical practice guideline from the American College of Physicians. Ann Intern Med 2011; 154:260–267.
- Murad MH, Coburn JA, Coto-Yglesias F, et al. Glycemic control in non-critically ill hospitalized patients: a systematic review and meta-analysis. J Clin Endocrinol Metab 2012; 97:49–58.
- Bogun M, Inzucchi SE. Inpatient management of diabetes and hyperglycemia. Clin Ther 2013; 35:724–733.
- Miller DB. Glycemic targets in hospital and barriers to attaining them. Can J Diabetes 2014; 38:74–78.
- Eidemak I, Feldt-Rasmussen B, Kanstrup IL, Nielsen SL, Schmitz O, Strandgaard S. Insulin resistance and hyperinsulinaemia in mild to moderate progressive chronic renal failure and its association with aerobic work capacity. Diabetologia 1995; 38:565–572.
- Svensson M, Yu Z, Eriksson J. A small reduction in glomerular filtration is accompanied by insulin resistance in type I diabetes patients with diabetic nephropathy. Eur J Clin Invest 2002; 32:100–109.
- Rave K, Heise T, Pfutzner A, Heinemann L, Sawicki P. Impact of diabetic nephropathy on pharmacodynamics and pharmacokinetic properties of insulin in type I diabetic patients. Diabetes Care 2001; 24:886–890.
- Biesenbach G, Raml A, Schmekal B, Eichbauer-Sturm G. Decreased insulin requirement in relation to GFR in nephropathic type 1 and insulin-treated type 2 diabetic patients. Diabet Med 2003; 20:642–645.
- Holmes G, Galitz L, Hu P, Lyness W. Pharmacokinetics of insulin aspart in obesity, renal impairment, or hepatic impairment. Br J Clin Pharmacol 2005; 60:469–476.
- Lindholm A, Jacobsen LV. Clinical pharmacokinetics and pharmacodynamics of insulin aspart. Clin Pharmacokinet 2001; 40:641–659.
- Bolli GB, Hahn AD, Schmidt R, et al. Plasma exposure to insulin glargine and its metabolites M1 and M2 after subcutaneous injection of therapeutic and supratherapeutic doses of glargine in subjects with type 1 diabetes. Diabetes Care 2012; 35:2626–2630.
- Nielsen S. Time course and kinetics of proximal tubular processing of insulin. Am J Physiol 1992; 262:F813–F822.
- Sobngwi E, Enoru S, Ashuntantang G, et al. Day-to-day variation of insulin requirements of patients with type 2 diabetes and end-stage renal disease undergoing maintenance hemodialysis. Diabetes Care 2010; 33:1409–1412.
- Quellhorst E. Insulin therapy during peritoneal dialysis: pros and cons of various forms of administration. J Am Soc Nephrol 2002; 13(suppl 1):S92–S96.
- Davidson MB, Peters AL. An overview of metformin in the treatment of type 2 diabetes mellitus. Am J Med 1997; 102:99–110.
- Ahmed Z, Simon B, Choudhury D. Management of diabetes in patients with chronic kidney disease. Postgrad Med 2009; 121:52–60.
- Charpentier G, Riveline JP, Varroud-Vial M. Management of drugs affecting blood glucose in diabetic patients with renal failure. Diabetes Metab 2000; 26(suppl 4):73–85.
- Hasslacher C; Multinational Repaglinide Renal Study Group. Safety and efficacy of repaglinide in type 2 diabetic patients with and without impaired renal function. Diabetes Care 2003; 26:886–891.
- Iglesias P, Dies JJ. Peroxisome proliferator-activated receptor gamma agonists in renal disease. Eur J Endocrinol 2006; 154:613–621.
- Hollenberg NK. Considerations for management of fluid dynamic issues associated with thiazolidinediones. Am J Med 2003; 115(suppl. 8A) 111S–115S.
- Kamath V, Jones CN, Yip JC, et al. Effects of a quick-release form of bromocriptine (Ergoset) on fasting and postprandial plasma glucose, insulin, lipid, and lipoprotein concentrations in obese nondiabetic hyperinsulinemic women. Diabetes Care 1997; 20:1697–1701.
- Pijl H, Ohashi S, Matsuda M, et al. Bromocriptine: a novel approach to the treatment of type 2 diabetes. Diabetes Care 2000; 23:1154–1161.
- Umpierrez GE, Gianchandani R, Smiley D, et al. Safety and efficacy of sitagliptin therapy for the inpatient management of general medicine and surgery patients with type 2 diabetes: a pilot, randomized, controlled study. Diabetes Care 2013; 36:3430–3435.
- Chan JC, Scott R, Arjona Ferreira JC, et al. Safety and efficacy of sitagliptin in patients with type 2 diabetes and chronic renal insufficiency. Diabetes Obes Metab 2008; 10:545–555.
- Bergman AJ, Cote J, Yi B, et al. Effect of renal insufficiency on the pharmacokinetics of sitagliptin, a dipeptidyl peptidase-4 inhibitor. Diabetes Care 2007; 30:1862–1864.
- Onglyza package insert. www.azpicentral.com/onglyza/pi_onglyza.pdf. Accessed March 8, 2016.
- Gallwitz B. Safety and efficacy of linagliptin in type 2 diabetes patients with common renal and cardiovascular risk factors. Ther Adv Endocrinol Metab 2013; 4:95–105.
- Marshall J, Jennings P, Scott A, Fluck RJ, McIntyre CW. Glycemic control in diabetic CAPD patients assessed by continuous glucose monitoring system (CGMS). Kidney Int 2003; 64:1480–1486.
- Schleis TG. Interference of maltose, icodextrin, galactose, or xylose with some blood glucose monitoring systems. Pharmacotherapy 2007; 27:1313–1321.
Managing glycemic control in hospitalized patients with chronic kidney disease (CKD) and diabetes mellitus is a challenge, with no published guidelines. In this setting, avoiding hypoglycemia takes precedence over meeting strict blood glucose targets. Optimal management is essential to reduce hypoglycemia and the risk of death from cardiovascular disease.1
This article reviews the evidence to guide diabetes management in hospitalized patients with CKD, focusing on blood glucose monitoring, insulin dosing, and concerns about other diabetic agents.
FOCUS ON AVOIDING HYPOGLYCEMIA
CKD is common, estimated to affect more than 50 million people worldwide.2 Diabetes mellitus is the primary cause of kidney failure in 45% of dialysis patients with CKD.
Tight control comes with a cost
Hyperglycemia in hospitalized patients is associated with a higher risk of death, a higher risk of infections, and a longer hospital stay.3,4 In 2001, Van den Berghe et al5 found that intensive insulin therapy reduced the mortality rate in critically ill patients in the surgical intensive care unit. But subsequent studies6,7 found that intensive insulin therapy to achieve tight glycemic control increased rates of morbidity and mortality without adding clinical benefit.
Randomized clinical trials in outpatients have shown that tight control of blood glucose levels reduces microvascular and macrovascular complications in patients with type 1 diabetes.8–10 In the Diabetes Control and Complications Trial,9 compared with conventional therapy, intensive insulin therapy reduced the incidence of retinopathy progression (4.7 vs 1.2 cases per 100 patient-years, number needed to treat [NNT] = 3 for 10 years) and clinical neuropathy (9.8 vs 3.1 per 100 patient-years, NNT = 1.5 for 10 years). The long-term likelihood of a cardiovascular event was also significantly lower in the intensive treatment group (0.38 vs 0.80 events per 100 patient-years).9
Similarly, in the Epidemiology of Diabetes Interventions and Complications follow-up study, the intensive therapy group had fewer cardiovascular deaths.11 On the other hand, the risk of severe hypoglycemia and subsequent coma or seizure was significantly higher in the intensive therapy group than in the conventional therapy group (16.3 vs 5.4 per 100 patient-years).8
CKD increases hypoglycemia risk
Moen et al12 found that the incidence of hypoglycemia was significantly higher in patients with CKD (estimated glomerular filtration rate [GFR] < 60 mL/min) with or without diabetes, and that patients with both conditions were at greatest risk (Figure 1). Multiple factors contribute to the increased risk of hypoglycemia: patients with advanced CKD tend to have poor nutrition, resulting in reduced glycogen stores, and a smaller renal mass reduces renal gluconeogenesis and decreases the elimination of insulin and oral antidiabetic agents.
After the onset of diabetic nephropathy, progression of renal complications and overall life expectancy are influenced by earlier glycemic control.8 Development of diabetic nephropathy is commonly accompanied by changes in metabolic control, particularly an increased risk of hypoglycemia.13 In addition, episodes of severe hypoglycemia constitute an independent cardiovascular risk factor.14
Aggressive glycemic control in hospitalized patients, particularly those with advanced CKD, is associated with a risk of hypoglycemia without overall improvement in outcomes.15 Elderly patients with type 2 diabetes are similar to patients with CKD in that they have a reduced GFR and are thus more sensitive to insulin. In both groups, intensifying glycemic control, especially in the hospital, is associated with more frequent episodes of severe hypoglycemia.16 The focus should be not only on maintaining optimal blood glucose concentration, but also on preventing hypoglycemia.
‘Burnt-out’ diabetes
Paradoxically, patients with end-stage renal disease and type 2 diabetes often experience altered glucose homeostasis with markedly improved glycemic control. They may attain normoglycemia and normalization of hemoglobin A1c, a condition known as “burnt-out” diabetes. Its precise mechanism is not understood and its significance remains unclear (Table 1).17
HEMOGLOBIN A1c CAN BE FALSELY HIGH OR FALSELY LOW
Hemoglobin A1c measurement is used to diagnose diabetes and to assess long-term glycemic control. It is a measure of the fraction of hemoglobin that has been glycated by exposure to glucose. Because the average lifespan of a red cell is 120 days, the hemoglobin A1c value reflects the mean blood glucose concentration over the preceding 3 months.
But hemoglobin A1c measurement has limitations: any condition that alters the lifespan of erythrocytes leads to higher or lower hemoglobin A1c levels. Hemoglobin A1c levels are also affected by kidney dysfunction, hemolysis, and acidosis.18
Falsely high hemoglobin A1c levels are associated with conditions that prolong the lifespan of erythrocytes, such as asplenia. Iron deficiency also increases the average age of circulating red cells because of reduced red cell production. For patients in whom blood glucose measurements do not correlate with hemoglobin A1c measurements, iron deficiency anemia should be considered before altering a treatment regimen.
Falsely low hemoglobin A1c levels are associated with conditions of more rapid erythrocyte turnover, such as autoimmune hemolytic anemia, hereditary spherocytosis, and acute blood loss anemia. In patients with CKD, recombinant erythropoietin treatment lowers hemoglobin A1c levels by increasing the number of immature red cells, which are less likely to glycosylate.19
Morgan et al20 compared the association between hemoglobin A1c and blood glucose levels in diabetic patients with moderate to severe CKD not requiring dialysis and in diabetic patients with normal renal function and found no difference between these two groups, suggesting that hemoglobin A1c is reliable in this setting. But study results conflict for patients on dialysis, making the usefulness of hemoglobin A1c testing for those patients less clear. In one study, hemoglobin A1c testing underestimated glycemic control,20 but other studies found that glycemic control was overestimated.21,22
Alternatives to hemoglobin A1c
Other measures of long-term glycemic control such as fructosamine and glycated albumin levels are sometimes used in conditions in which hemoglobin A1c may not be reliable.
Albumin also undergoes glycation when exposed to glucose. Glycated albumin appears to be a better measure of glycemic control in patients with CKD and diabetes than serum fructosamine,23 which has failed to show a significant correlation with blood glucose levels in patients with CKD.24 However, because serum albumin has a short half-life, glycated albumin reflects glycemic control in only the approximately 1 to 2 weeks before sampling,25 so monthly monitoring is required.
Glycated albumin levels may be reduced due to increased albumin turnover in patients with nephrotic-range proteinuria and in diabetic patients on peritoneal dialysis. Several issues remain unclear, such as the appropriate target level of glycated albumin and at what stage of CKD it should replace hemoglobin A1c testing. If an improved assay that is unaffected by changes in serum albumin becomes available, it may be appropriate to use glycated albumin measurements to assess long-term glycemic control for patients with CKD.
In general, therapeutic decisions to achieve optimum glycemic control in patients with diabetes and CKD should be based on hemoglobin A1c testing, multiple glucose measurements, and patient symptoms of hypoglycemia or hyperglycemia. The best measure for assessing glycemic control in hospitalized patients with CKD remains multiple blood glucose testing daily.
INSULIN THERAPY PREFERRED
Although several studies have evaluated inpatient glycemic control,26–29 no guidelines have been published for hospitalized patients with diabetes and CKD. Insulin therapy is preferred for achieving glycemic control in acutely ill or hospitalized patients with diabetes. Oral hypoglycemic agents should be discontinued.
Regardless of the form of insulin chosen to treat diabetes, caution is needed for patients with kidney disease. During hospitalization, clinical changes are expected owing to illness and differences in caloric intake and physical activity, resulting in altered insulin sensitivity. Insulin-treated hospitalized patients require individualized care, including multiple daily blood glucose tests and insulin therapy modifications for ideal glycemic control.
For surgical or medical intensive care patients on insulin therapy, the target blood glucose level before meals should be 140 mg/dL, and the target random level should be less than 180 mg/dL.15,26–29
Basal-bolus insulin
Sliding-scale therapy should be avoided as the only method for glycemic control. Instead, scheduled subcutaneous basal insulin once or twice daily combined with rapid- or short-acting insulin with meals is recommended.
Basal-bolus insulin therapy, one of the most advanced and flexible insulin replacement therapies, mimics endogenous insulin release and offers great advantages in diabetes care. Using mealtime bolus insulin permits variation in the amount of food eaten; more insulin can be taken with a larger meal and less with smaller meals. A bolus approach offers the flexibility of administering rapid-acting insulin immediately after meals when oral intake is variable.
Individualize insulin therapy
Optimizing glycemic control requires an understanding of the altered pharmacokinetics and pharmacodynamics of insulin in patients with diabetic nephropathy. Table 2 shows the pharmacokinetic profiles of insulin preparations in healthy people. Analogue insulins, which are manufactured by recombinant DNA technology, have conformational changes in the insulin molecule that alter their pharmacokinetics and pharmacodynamics. The rapid-acting analogue insulins are absorbed quickly, making them suitable for postprandial glucose control.
Changes in GFR are associated with altered pharmacokinetics and pharmacodynamics of insulin,30,31 but unlike for oral antidiabetic agents, these properties are not well characterized for insulin preparations in patients with renal insufficiency.13,32–36
CKD may reduce insulin clearance. Rave et al32 reported that the clearance of regular human insulin was reduced by 30% to 40% in patients with type 1 diabetes and a mean estimated GFR of 54 mL/min. They found that the metabolic activity of insulin lispro was more robust than that of short-acting regular human insulin in patients with diabetic nephropathy. In another study, patients with diabetes treated with insulin aspart did not show any significant change in the required insulin dosage in relation to the renal filtration rate.34 Biesenbach et al33 found a 38% reduction in insulin requirements in patients with type 1 diabetes as estimated GFR decreased from 80 mL/min to 10 mL/min. Further studies are required to better understand the safety of insulin in treating hospitalized patients with diabetes and renal insufficiency.
Few studies have compared the pharmacodynamics of long-acting insulins in relation to declining renal function. The long-acting analogue insulins have less of a peak than human insulin and thus better mimic endogenous insulin secretion. For insulin detemir, Lindholm and Jacobsen found no significant differences in the pharmacokinetics related to the stages of CKD.35 When using the long-acting insulins glargine or detemir, one should consider giving much lower doses (half the initial starting dosage) and titrating the dosage until target fasting glucose concentrations are reached to prevent hypoglycemia.
Table 3 summarizes recommended insulin dosage adjustments in CKD based on the literature and our clinical experience.
Considerations for dialysis patients
Subcutaneously administered insulin is eliminated renally, unlike endogenous insulin, which undergoes first-pass metabolism in the liver.13,37 As renal function declines, insulin clearance decreases and the insulin dosage must be reduced to prevent hypoglycemia.
Patients on hemodialysis or peritoneal dialysis pose a challenge for insulin dosing. Hemodialysis improves insulin sensitivity but also increases insulin clearance, making it difficult to determine insulin requirements. Sobngwi et al38 conducted a study in diabetic patients with end-stage renal disease on hemodialysis, using a 24-hour euglycemic clamp. They found that exogenous basal insulin requirements were 25% lower on the day after hemodialysis compared with the day before, but premeal insulin requirements stayed the same.
Peritoneal dialysis exposes patients to a high glucose load via the peritoneum, which can worsen insulin resistance. Intraperitoneal administration of insulin during peritoneal dialysis provides a more physiologic effect than subcutaneous administration: it prevents fluctuations of blood glucose and the formation of insulin antibodies. But insulin requirements are higher owing to a dilutional effect and to insulin binding to the plastic surface of the dialysis fluid reservoir.39
GLYCEMIC CONTROL FOR PROCEDURES
No guidelines have been established regarding the optimal blood glucose range for diabetic patients with CKD undergoing diagnostic or surgical procedures. Given the risk of hypoglycemia in such settings, less-stringent targets are reasonable, ie, premeal blood glucose levels of 140 mg/dL and random blood glucose levels of less than 180 mg/dL.
Before surgery, consideration should be given to the type of diabetes, surgical procedure, and metabolic control. Patients on insulin detemir or glargine as part of a basal-bolus regimen with rapid-acting insulin may safely be given the full dose of their basal insulin the night before or the morning of their procedure. However, patients on neutral protamine Hagedorn (NPH) insulin as a part of their basal-bolus regimen should receive half of their usual dose due to a difference in pharmacokinetic profile compared with insulin glargine or detemir.
In insulin-treated patients undergoing prolonged procedures (eg, coronary artery bypass grafting, transplant):
- Discontinue subcutaneous insulin and start an intravenous insulin infusion, titrated to maintain a blood glucose range of 140 to 180 mg/dL
- Subcutaneous insulin management may be acceptable for patients undergoing shorter outpatient procedures
- Supplemental subcutaneous doses of short- or rapid-acting insulin preparations can be given for blood glucose elevation greater than 180 mg/dL.
AVOID ORAL AGENTS AND NONINSULIN INJECTABLES
Oral antidiabetic agents and noninsulin injectables (Table 4) should generally be avoided in hospitalized patients, especially for those with decompensated heart failure, renal insufficiency, hypoperfusion, or chronic pulmonary disease, or for those given intravenous contrast. Most oral medications used to treat diabetes are affected by reduced kidney function, resulting in prolonged drug exposure and increased risk of hypoglycemia in patients with moderate to severe CKD (stages 3–5).
Metformin, a biguanide, is contraindicated in patients with high serum creatinine levels (> 1.5 mg/dL in men, > 1.4 mg/dL in women) because of the theoretical risk of lactic acidosis.40
Sulfonylurea clearance depends on kidney function.41 Severe prolonged episodes of hypoglycemia have been reported in dialysis patients taking these drugs, except with glipizide, which carries a lower risk.41,42
Repaglinide, a nonsulfonylurea insulin secretagogue, can be used in CKD stages 3 to 4 without any dosage adjustment.43
Thiazolidinediones have been reported to slow the progression of diabetic kidney disease independent of glycemic control.44 Adverse effects include fluid retention, edema, and congestive heart failure. Thiazolidinediones should not be used in patients with New York Heart Association class 3 or 4 heart failure,45 and so should not be prescribed in the hospital except for patients who are clinically stable or ready for discharge.
Quick-release bromocriptine, a dopamine receptor agonist, has been shown to be effective in lowering fasting plasma glucose levels and hemoglobin A1c, and improving glucose tolerance in obese patients with type 2 diabetes, although its usefulness in hospitalized patients with diabetes is not known.46,47
Dipeptidyl peptidase inhibitors. Sitagliptin and saxagliptin have been shown to be safe and effective in hospitalized patients with type 2 diabetes.48 However, except for linagliptin, dose reduction is recommended in patients with CKD stage 3 and higher.49–52
GLP-1 receptor agonists. Drugs of this class are potent agents for the reduction of glucose in the outpatient setting but are relatively contraindicated if the GFR is less than 30 mL/min, and they are currently not used in the hospital.
BLOOD GLUCOSE MONITORING IN HOSPITALIZED PATIENTS
Bedside blood glucose monitoring is recommended for all hospitalized patients with known diabetes with or without CKD, those with newly recognized hyperglycemia, and those who receive therapy associated with high risk for hyperglycemia, such as glucocorticoid therapy and enteral and parenteral nutrition. For patients on scheduled diets, fingerstick blood glucose monitoring is recommended before meals and at bedtime. In patients with no oral intake or on continuous enteral or parenteral nutrition, blood glucose monitoring every 4 to 6 hours is recommended. More frequent monitoring (eg, adding a 3:00 am check) may be prudent in patients with CKD.
Continuous glucose monitoring systems use a sensor inserted under the skin and transmit information via radio to a wireless monitor. Such systems are more expensive than conventional glucose monitoring but may enable better glucose control by providing real-time glucose measurements, with levels displayed at 5-minute or 1-minute intervals. Marshall et al53 confirmed this technology’s accuracy and precision in uremic patients on dialysis.
Considerations for peritoneal dialysis
For patients on peritoneal dialysis, glucose in the dialysate exacerbates hyperglycemia. Dialysis solutions with the glucose polymer icodextrin as the osmotic agent instead of glucose have been suggested to reduce glucose exposure.
Glucose monitoring systems measure interstitial fluid glucose by the glucose oxidase reaction and therefore are not affected by icodextrin. However, icodextrin is converted to maltose, a disaccharide composed of two glucose molecules, which can cause spuriously high readings in devices that use test strips containing the enzymes glucose dehydrogenase pyrroloquinoline quinone or glucose dye oxidoreductase. Spurious hyperglycemia may lead to giving too much insulin, in turn leading to symptomatic hypoglycemia.
Clinicians caring for patients receiving icodextrin should ensure that the glucose monitoring system uses only test strips that contain glucose oxidase, glucose dehydrogenase-nicotinamide adenine dinucleotide, or glucose dehydrogenase-flavin adenine dinucleotide, which are not affected by icodextrin.54
IMPROVING QUALITY
Hospitalized patients face many barriers to optimal glycemic control. Less experienced practitioners tend to have insufficient knowledge of insulin preparations and appropriate insulin dosing. Also, diabetes is often listed as a secondary diagnosis and so may be overlooked by the inpatient care team.
Educational programs should be instituted to overcome these barriers and improve knowledge related to inpatient diabetes care. When necessary, the appropriate use of consultants is important in hospitalized settings to improve quality and make hospital care more efficient and cost-effective.
No national benchmarks currently exist for inpatient diabetes care, and they need to be developed to ensure best practices. Physicians should take the initiative to remedy this by collaborating with other healthcare providers, such as dedicated diabetes educators, nursing staff, pharmacists, registered dietitians, and physicians with expertise in diabetes management, with the aim of achieving optimum glycemic control and minimizing hypoglycemia.
Managing glycemic control in hospitalized patients with chronic kidney disease (CKD) and diabetes mellitus is a challenge, with no published guidelines. In this setting, avoiding hypoglycemia takes precedence over meeting strict blood glucose targets. Optimal management is essential to reduce hypoglycemia and the risk of death from cardiovascular disease.1
This article reviews the evidence to guide diabetes management in hospitalized patients with CKD, focusing on blood glucose monitoring, insulin dosing, and concerns about other diabetic agents.
FOCUS ON AVOIDING HYPOGLYCEMIA
CKD is common, estimated to affect more than 50 million people worldwide.2 Diabetes mellitus is the primary cause of kidney failure in 45% of dialysis patients with CKD.
Tight control comes with a cost
Hyperglycemia in hospitalized patients is associated with a higher risk of death, a higher risk of infections, and a longer hospital stay.3,4 In 2001, Van den Berghe et al5 found that intensive insulin therapy reduced the mortality rate in critically ill patients in the surgical intensive care unit. But subsequent studies6,7 found that intensive insulin therapy to achieve tight glycemic control increased rates of morbidity and mortality without adding clinical benefit.
Randomized clinical trials in outpatients have shown that tight control of blood glucose levels reduces microvascular and macrovascular complications in patients with type 1 diabetes.8–10 In the Diabetes Control and Complications Trial,9 compared with conventional therapy, intensive insulin therapy reduced the incidence of retinopathy progression (4.7 vs 1.2 cases per 100 patient-years, number needed to treat [NNT] = 3 for 10 years) and clinical neuropathy (9.8 vs 3.1 per 100 patient-years, NNT = 1.5 for 10 years). The long-term likelihood of a cardiovascular event was also significantly lower in the intensive treatment group (0.38 vs 0.80 events per 100 patient-years).9
Similarly, in the Epidemiology of Diabetes Interventions and Complications follow-up study, the intensive therapy group had fewer cardiovascular deaths.11 On the other hand, the risk of severe hypoglycemia and subsequent coma or seizure was significantly higher in the intensive therapy group than in the conventional therapy group (16.3 vs 5.4 per 100 patient-years).8
CKD increases hypoglycemia risk
Moen et al12 found that the incidence of hypoglycemia was significantly higher in patients with CKD (estimated glomerular filtration rate [GFR] < 60 mL/min) with or without diabetes, and that patients with both conditions were at greatest risk (Figure 1). Multiple factors contribute to the increased risk of hypoglycemia: patients with advanced CKD tend to have poor nutrition, resulting in reduced glycogen stores, and a smaller renal mass reduces renal gluconeogenesis and decreases the elimination of insulin and oral antidiabetic agents.
After the onset of diabetic nephropathy, progression of renal complications and overall life expectancy are influenced by earlier glycemic control.8 Development of diabetic nephropathy is commonly accompanied by changes in metabolic control, particularly an increased risk of hypoglycemia.13 In addition, episodes of severe hypoglycemia constitute an independent cardiovascular risk factor.14
Aggressive glycemic control in hospitalized patients, particularly those with advanced CKD, is associated with a risk of hypoglycemia without overall improvement in outcomes.15 Elderly patients with type 2 diabetes are similar to patients with CKD in that they have a reduced GFR and are thus more sensitive to insulin. In both groups, intensifying glycemic control, especially in the hospital, is associated with more frequent episodes of severe hypoglycemia.16 The focus should be not only on maintaining optimal blood glucose concentration, but also on preventing hypoglycemia.
‘Burnt-out’ diabetes
Paradoxically, patients with end-stage renal disease and type 2 diabetes often experience altered glucose homeostasis with markedly improved glycemic control. They may attain normoglycemia and normalization of hemoglobin A1c, a condition known as “burnt-out” diabetes. Its precise mechanism is not understood and its significance remains unclear (Table 1).17
HEMOGLOBIN A1c CAN BE FALSELY HIGH OR FALSELY LOW
Hemoglobin A1c measurement is used to diagnose diabetes and to assess long-term glycemic control. It is a measure of the fraction of hemoglobin that has been glycated by exposure to glucose. Because the average lifespan of a red cell is 120 days, the hemoglobin A1c value reflects the mean blood glucose concentration over the preceding 3 months.
But hemoglobin A1c measurement has limitations: any condition that alters the lifespan of erythrocytes leads to higher or lower hemoglobin A1c levels. Hemoglobin A1c levels are also affected by kidney dysfunction, hemolysis, and acidosis.18
Falsely high hemoglobin A1c levels are associated with conditions that prolong the lifespan of erythrocytes, such as asplenia. Iron deficiency also increases the average age of circulating red cells because of reduced red cell production. For patients in whom blood glucose measurements do not correlate with hemoglobin A1c measurements, iron deficiency anemia should be considered before altering a treatment regimen.
Falsely low hemoglobin A1c levels are associated with conditions of more rapid erythrocyte turnover, such as autoimmune hemolytic anemia, hereditary spherocytosis, and acute blood loss anemia. In patients with CKD, recombinant erythropoietin treatment lowers hemoglobin A1c levels by increasing the number of immature red cells, which are less likely to glycosylate.19
Morgan et al20 compared the association between hemoglobin A1c and blood glucose levels in diabetic patients with moderate to severe CKD not requiring dialysis and in diabetic patients with normal renal function and found no difference between these two groups, suggesting that hemoglobin A1c is reliable in this setting. But study results conflict for patients on dialysis, making the usefulness of hemoglobin A1c testing for those patients less clear. In one study, hemoglobin A1c testing underestimated glycemic control,20 but other studies found that glycemic control was overestimated.21,22
Alternatives to hemoglobin A1c
Other measures of long-term glycemic control such as fructosamine and glycated albumin levels are sometimes used in conditions in which hemoglobin A1c may not be reliable.
Albumin also undergoes glycation when exposed to glucose. Glycated albumin appears to be a better measure of glycemic control in patients with CKD and diabetes than serum fructosamine,23 which has failed to show a significant correlation with blood glucose levels in patients with CKD.24 However, because serum albumin has a short half-life, glycated albumin reflects glycemic control in only the approximately 1 to 2 weeks before sampling,25 so monthly monitoring is required.
Glycated albumin levels may be reduced due to increased albumin turnover in patients with nephrotic-range proteinuria and in diabetic patients on peritoneal dialysis. Several issues remain unclear, such as the appropriate target level of glycated albumin and at what stage of CKD it should replace hemoglobin A1c testing. If an improved assay that is unaffected by changes in serum albumin becomes available, it may be appropriate to use glycated albumin measurements to assess long-term glycemic control for patients with CKD.
In general, therapeutic decisions to achieve optimum glycemic control in patients with diabetes and CKD should be based on hemoglobin A1c testing, multiple glucose measurements, and patient symptoms of hypoglycemia or hyperglycemia. The best measure for assessing glycemic control in hospitalized patients with CKD remains multiple blood glucose testing daily.
INSULIN THERAPY PREFERRED
Although several studies have evaluated inpatient glycemic control,26–29 no guidelines have been published for hospitalized patients with diabetes and CKD. Insulin therapy is preferred for achieving glycemic control in acutely ill or hospitalized patients with diabetes. Oral hypoglycemic agents should be discontinued.
Regardless of the form of insulin chosen to treat diabetes, caution is needed for patients with kidney disease. During hospitalization, clinical changes are expected owing to illness and differences in caloric intake and physical activity, resulting in altered insulin sensitivity. Insulin-treated hospitalized patients require individualized care, including multiple daily blood glucose tests and insulin therapy modifications for ideal glycemic control.
For surgical or medical intensive care patients on insulin therapy, the target blood glucose level before meals should be 140 mg/dL, and the target random level should be less than 180 mg/dL.15,26–29
Basal-bolus insulin
Sliding-scale therapy should be avoided as the only method for glycemic control. Instead, scheduled subcutaneous basal insulin once or twice daily combined with rapid- or short-acting insulin with meals is recommended.
Basal-bolus insulin therapy, one of the most advanced and flexible insulin replacement therapies, mimics endogenous insulin release and offers great advantages in diabetes care. Using mealtime bolus insulin permits variation in the amount of food eaten; more insulin can be taken with a larger meal and less with smaller meals. A bolus approach offers the flexibility of administering rapid-acting insulin immediately after meals when oral intake is variable.
Individualize insulin therapy
Optimizing glycemic control requires an understanding of the altered pharmacokinetics and pharmacodynamics of insulin in patients with diabetic nephropathy. Table 2 shows the pharmacokinetic profiles of insulin preparations in healthy people. Analogue insulins, which are manufactured by recombinant DNA technology, have conformational changes in the insulin molecule that alter their pharmacokinetics and pharmacodynamics. The rapid-acting analogue insulins are absorbed quickly, making them suitable for postprandial glucose control.
Changes in GFR are associated with altered pharmacokinetics and pharmacodynamics of insulin,30,31 but unlike for oral antidiabetic agents, these properties are not well characterized for insulin preparations in patients with renal insufficiency.13,32–36
CKD may reduce insulin clearance. Rave et al32 reported that the clearance of regular human insulin was reduced by 30% to 40% in patients with type 1 diabetes and a mean estimated GFR of 54 mL/min. They found that the metabolic activity of insulin lispro was more robust than that of short-acting regular human insulin in patients with diabetic nephropathy. In another study, patients with diabetes treated with insulin aspart did not show any significant change in the required insulin dosage in relation to the renal filtration rate.34 Biesenbach et al33 found a 38% reduction in insulin requirements in patients with type 1 diabetes as estimated GFR decreased from 80 mL/min to 10 mL/min. Further studies are required to better understand the safety of insulin in treating hospitalized patients with diabetes and renal insufficiency.
Few studies have compared the pharmacodynamics of long-acting insulins in relation to declining renal function. The long-acting analogue insulins have less of a peak than human insulin and thus better mimic endogenous insulin secretion. For insulin detemir, Lindholm and Jacobsen found no significant differences in the pharmacokinetics related to the stages of CKD.35 When using the long-acting insulins glargine or detemir, one should consider giving much lower doses (half the initial starting dosage) and titrating the dosage until target fasting glucose concentrations are reached to prevent hypoglycemia.
Table 3 summarizes recommended insulin dosage adjustments in CKD based on the literature and our clinical experience.
Considerations for dialysis patients
Subcutaneously administered insulin is eliminated renally, unlike endogenous insulin, which undergoes first-pass metabolism in the liver.13,37 As renal function declines, insulin clearance decreases and the insulin dosage must be reduced to prevent hypoglycemia.
Patients on hemodialysis or peritoneal dialysis pose a challenge for insulin dosing. Hemodialysis improves insulin sensitivity but also increases insulin clearance, making it difficult to determine insulin requirements. Sobngwi et al38 conducted a study in diabetic patients with end-stage renal disease on hemodialysis, using a 24-hour euglycemic clamp. They found that exogenous basal insulin requirements were 25% lower on the day after hemodialysis compared with the day before, but premeal insulin requirements stayed the same.
Peritoneal dialysis exposes patients to a high glucose load via the peritoneum, which can worsen insulin resistance. Intraperitoneal administration of insulin during peritoneal dialysis provides a more physiologic effect than subcutaneous administration: it prevents fluctuations of blood glucose and the formation of insulin antibodies. But insulin requirements are higher owing to a dilutional effect and to insulin binding to the plastic surface of the dialysis fluid reservoir.39
GLYCEMIC CONTROL FOR PROCEDURES
No guidelines have been established regarding the optimal blood glucose range for diabetic patients with CKD undergoing diagnostic or surgical procedures. Given the risk of hypoglycemia in such settings, less-stringent targets are reasonable, ie, premeal blood glucose levels of 140 mg/dL and random blood glucose levels of less than 180 mg/dL.
Before surgery, consideration should be given to the type of diabetes, surgical procedure, and metabolic control. Patients on insulin detemir or glargine as part of a basal-bolus regimen with rapid-acting insulin may safely be given the full dose of their basal insulin the night before or the morning of their procedure. However, patients on neutral protamine Hagedorn (NPH) insulin as a part of their basal-bolus regimen should receive half of their usual dose due to a difference in pharmacokinetic profile compared with insulin glargine or detemir.
In insulin-treated patients undergoing prolonged procedures (eg, coronary artery bypass grafting, transplant):
- Discontinue subcutaneous insulin and start an intravenous insulin infusion, titrated to maintain a blood glucose range of 140 to 180 mg/dL
- Subcutaneous insulin management may be acceptable for patients undergoing shorter outpatient procedures
- Supplemental subcutaneous doses of short- or rapid-acting insulin preparations can be given for blood glucose elevation greater than 180 mg/dL.
AVOID ORAL AGENTS AND NONINSULIN INJECTABLES
Oral antidiabetic agents and noninsulin injectables (Table 4) should generally be avoided in hospitalized patients, especially for those with decompensated heart failure, renal insufficiency, hypoperfusion, or chronic pulmonary disease, or for those given intravenous contrast. Most oral medications used to treat diabetes are affected by reduced kidney function, resulting in prolonged drug exposure and increased risk of hypoglycemia in patients with moderate to severe CKD (stages 3–5).
Metformin, a biguanide, is contraindicated in patients with high serum creatinine levels (> 1.5 mg/dL in men, > 1.4 mg/dL in women) because of the theoretical risk of lactic acidosis.40
Sulfonylurea clearance depends on kidney function.41 Severe prolonged episodes of hypoglycemia have been reported in dialysis patients taking these drugs, except with glipizide, which carries a lower risk.41,42
Repaglinide, a nonsulfonylurea insulin secretagogue, can be used in CKD stages 3 to 4 without any dosage adjustment.43
Thiazolidinediones have been reported to slow the progression of diabetic kidney disease independent of glycemic control.44 Adverse effects include fluid retention, edema, and congestive heart failure. Thiazolidinediones should not be used in patients with New York Heart Association class 3 or 4 heart failure,45 and so should not be prescribed in the hospital except for patients who are clinically stable or ready for discharge.
Quick-release bromocriptine, a dopamine receptor agonist, has been shown to be effective in lowering fasting plasma glucose levels and hemoglobin A1c, and improving glucose tolerance in obese patients with type 2 diabetes, although its usefulness in hospitalized patients with diabetes is not known.46,47
Dipeptidyl peptidase inhibitors. Sitagliptin and saxagliptin have been shown to be safe and effective in hospitalized patients with type 2 diabetes.48 However, except for linagliptin, dose reduction is recommended in patients with CKD stage 3 and higher.49–52
GLP-1 receptor agonists. Drugs of this class are potent agents for the reduction of glucose in the outpatient setting but are relatively contraindicated if the GFR is less than 30 mL/min, and they are currently not used in the hospital.
BLOOD GLUCOSE MONITORING IN HOSPITALIZED PATIENTS
Bedside blood glucose monitoring is recommended for all hospitalized patients with known diabetes with or without CKD, those with newly recognized hyperglycemia, and those who receive therapy associated with high risk for hyperglycemia, such as glucocorticoid therapy and enteral and parenteral nutrition. For patients on scheduled diets, fingerstick blood glucose monitoring is recommended before meals and at bedtime. In patients with no oral intake or on continuous enteral or parenteral nutrition, blood glucose monitoring every 4 to 6 hours is recommended. More frequent monitoring (eg, adding a 3:00 am check) may be prudent in patients with CKD.
Continuous glucose monitoring systems use a sensor inserted under the skin and transmit information via radio to a wireless monitor. Such systems are more expensive than conventional glucose monitoring but may enable better glucose control by providing real-time glucose measurements, with levels displayed at 5-minute or 1-minute intervals. Marshall et al53 confirmed this technology’s accuracy and precision in uremic patients on dialysis.
Considerations for peritoneal dialysis
For patients on peritoneal dialysis, glucose in the dialysate exacerbates hyperglycemia. Dialysis solutions with the glucose polymer icodextrin as the osmotic agent instead of glucose have been suggested to reduce glucose exposure.
Glucose monitoring systems measure interstitial fluid glucose by the glucose oxidase reaction and therefore are not affected by icodextrin. However, icodextrin is converted to maltose, a disaccharide composed of two glucose molecules, which can cause spuriously high readings in devices that use test strips containing the enzymes glucose dehydrogenase pyrroloquinoline quinone or glucose dye oxidoreductase. Spurious hyperglycemia may lead to giving too much insulin, in turn leading to symptomatic hypoglycemia.
Clinicians caring for patients receiving icodextrin should ensure that the glucose monitoring system uses only test strips that contain glucose oxidase, glucose dehydrogenase-nicotinamide adenine dinucleotide, or glucose dehydrogenase-flavin adenine dinucleotide, which are not affected by icodextrin.54
IMPROVING QUALITY
Hospitalized patients face many barriers to optimal glycemic control. Less experienced practitioners tend to have insufficient knowledge of insulin preparations and appropriate insulin dosing. Also, diabetes is often listed as a secondary diagnosis and so may be overlooked by the inpatient care team.
Educational programs should be instituted to overcome these barriers and improve knowledge related to inpatient diabetes care. When necessary, the appropriate use of consultants is important in hospitalized settings to improve quality and make hospital care more efficient and cost-effective.
No national benchmarks currently exist for inpatient diabetes care, and they need to be developed to ensure best practices. Physicians should take the initiative to remedy this by collaborating with other healthcare providers, such as dedicated diabetes educators, nursing staff, pharmacists, registered dietitians, and physicians with expertise in diabetes management, with the aim of achieving optimum glycemic control and minimizing hypoglycemia.
- Go AS, Chertow GM, Fan D, McCulloch CE, Hsu CY. Chronic kidney disease and the risks of death, cardiovascular events, and hospitalization. N Engl J Med 2004; 351:1296–1305.
- Newman DJ, Mattock MB, Dawnay AB, et al. Systematic review on urine albumin testing for early detection of diabetic complications. Health Technol Assess 2005; 9:iii–vi, xiii–163.
- Umpierrez GE, Isaacs SD, Bazargan N, You X, Thaler LM, Kitabchi AE. Hyperglycemia: an independent marker of in-hospital mortality in patients with undiagnosed diabetes. J Clin Endocrinol Metab 2002; 87:978–982.
- Golden SH, Peart-Vigilance C, Kao WH, Brancati FL. Perioperative glycemic control and the risk of infectious complications in a cohort of adults with diabetes. Diabetes Care 1999; 22:1408–1414.
- Van den Berghe G, Wouters P, Weekers F, et al. Intensive insulin therapy in critically ill patients. N Engl J Med 2001; 345:1359–1367.
- NICE-SUGAR Study Investigators; Finfer S, Chittock DR, Su SY, et al. Intensive versus conventional glucose control in critically ill patients. N Engl J Med 2009; 360:1283–1297.
- Brunkhorst FM, Engel C, Bloos F, et al; German Competence Network Sepsis (SepNet). Intensive insulin therapy and pentastarch resuscitation in severe sepsis. N Engl J Med 2008; 358:125–139.
- The effect of intensive treatment of diabetes on the development and progression of long-term complications in insulin-dependent diabetes mellitus. The Diabetes Control and Complications Trial Research Group. N Engl J Med 1993; 329:977–986.
- Effect of intensive diabetes management on macrovascular events and risk factors in the Diabetes Control and Complications Trial. Am J Cardiol 1995; 75:894–903.
- Nathan DM, Lachin J, Cleary P, et al; Diabetes Control and Complications Trial; Epidemiology of Diabetes Interventions and Complications Research Group. Intensive diabetes therapy and carotid intima-media thickness in type 1 diabetes mellitus. N Engl J Med 2003; 348:2294–2303.
- Writing Group for the DCCT/EDIC Research Group; Orchard TJ, Nathan DM, Zinman B, et al. Association between 7 years of intensive treatment of type 1 diabetes and long-term mortality. JAMA 2015; 313:45–53.
- Moen MF, Zhan M, Hsu VD, et al. Frequency of hypoglycemia and its significance in chronic kidney disease. Clin J Am Soc Nephrol 2009; 4:1121–1127.
- Iglesias P, Díez J. Insulin therapy in renal disease. Diabetes Obes Metab 2008; 10:811–823.
- Zoungas S, Patel A, Chalmers J, et al; ADVANCE Collaborative Group. Severe hypoglycemia and risks of vascular events and death. N Engl J Med 2010; 363:1410–1418.
- Moghissi ES, Korytkowski MT, DiNardo M, et al; American Association of Clinical Endocrinologists; American Diabetes Association. American Association of Clinical Endocrinologists and American Diabetes Association consensus statement on inpatient glycemic control. Diabetes Care 2009; 32:1119–1131.
- Action to Control Cardiovascular Risk in Diabetes Study Group; Gerstein HC, Miller ME, Byington RP, et al. Effects of intensive glucose lowering in type 2 diabetes. N Engl J Med 2008; 358:2545–2559.
- Kovesdy CP, Park JC, Kalantar-Zadeh K. Glycemic control and burnt-out diabetes in ESRD. Semin Dial 2010; 23:148–156.
- De Marchi S, Cecchin E, Camurri C, et al. Origin of glycosylated hemoglobin A1 in chronic renal failure. Int J Artif Organs 1983; 6:77–82.
- Brown JN, Kemp DW, Brice KR. Class effect of erythropoietin therapy on hemoglobin A(1c) in a patient with diabetes mellitus and chronic kidney disease not undergoing hemodialysis. Pharmacotherapy 2009; 29:468–472.
- Morgan L, Marenah CB, Jeffcoate WJ, Morgan AG. Glycated proteins as indices of glycemic control in diabetic patients with chronic renal failure. Diabet Med 1996; 13:514–519.
- Peacock TP, Shihabi ZK, Bleyer AJ, et al. Comparison of glycated albumin and hemoglobin A(1c) levels in diabetic subjects on hemodialysis. Kidney Int 2008; 73:1062–1068.
- Joy MS, Cefalu WT, Hogan SL, Nachman PH. Long-term glycemic control measurements in diabetic patients receiving hemodialysis. Am J Kidney Dis 2002; 39:297–307.
- Inaba M, Okuno S, Kumeda Y, et al; Osaka CKD Expert Research Group. Glycated albumin is a better glycemic indicator than glycated hemoglobin values in hemodialysis patients with diabetes: effect of anemia and erythropoietin injection. J Am Soc Nephrol 2007; 18:896–903.
- Mittman N, Desiraju B, Fazil I, et al. Serum fructosamine versus glycosylated hemoglobin as an index of glycemic control, hospitalization, and infection in diabetic hemodialysis patients. Kidney Int 2010; 78(suppl 117):S41–S45.
- Alskar O, Korelli J, Duffull SB. A pharmacokinetic model for the glycation of albumin. J Pharmacokinet Pharmacodyn 2012; 39:273–282.
- Qaseem A, Humphrey LL, Chou R, Snow V, Shekelle P; Clinical Guidelines Committee of the American College of Physicians. Use of intensive insulin therapy for the management of glycemic control in hospitalized patients: a clinical practice guideline from the American College of Physicians. Ann Intern Med 2011; 154:260–267.
- Murad MH, Coburn JA, Coto-Yglesias F, et al. Glycemic control in non-critically ill hospitalized patients: a systematic review and meta-analysis. J Clin Endocrinol Metab 2012; 97:49–58.
- Bogun M, Inzucchi SE. Inpatient management of diabetes and hyperglycemia. Clin Ther 2013; 35:724–733.
- Miller DB. Glycemic targets in hospital and barriers to attaining them. Can J Diabetes 2014; 38:74–78.
- Eidemak I, Feldt-Rasmussen B, Kanstrup IL, Nielsen SL, Schmitz O, Strandgaard S. Insulin resistance and hyperinsulinaemia in mild to moderate progressive chronic renal failure and its association with aerobic work capacity. Diabetologia 1995; 38:565–572.
- Svensson M, Yu Z, Eriksson J. A small reduction in glomerular filtration is accompanied by insulin resistance in type I diabetes patients with diabetic nephropathy. Eur J Clin Invest 2002; 32:100–109.
- Rave K, Heise T, Pfutzner A, Heinemann L, Sawicki P. Impact of diabetic nephropathy on pharmacodynamics and pharmacokinetic properties of insulin in type I diabetic patients. Diabetes Care 2001; 24:886–890.
- Biesenbach G, Raml A, Schmekal B, Eichbauer-Sturm G. Decreased insulin requirement in relation to GFR in nephropathic type 1 and insulin-treated type 2 diabetic patients. Diabet Med 2003; 20:642–645.
- Holmes G, Galitz L, Hu P, Lyness W. Pharmacokinetics of insulin aspart in obesity, renal impairment, or hepatic impairment. Br J Clin Pharmacol 2005; 60:469–476.
- Lindholm A, Jacobsen LV. Clinical pharmacokinetics and pharmacodynamics of insulin aspart. Clin Pharmacokinet 2001; 40:641–659.
- Bolli GB, Hahn AD, Schmidt R, et al. Plasma exposure to insulin glargine and its metabolites M1 and M2 after subcutaneous injection of therapeutic and supratherapeutic doses of glargine in subjects with type 1 diabetes. Diabetes Care 2012; 35:2626–2630.
- Nielsen S. Time course and kinetics of proximal tubular processing of insulin. Am J Physiol 1992; 262:F813–F822.
- Sobngwi E, Enoru S, Ashuntantang G, et al. Day-to-day variation of insulin requirements of patients with type 2 diabetes and end-stage renal disease undergoing maintenance hemodialysis. Diabetes Care 2010; 33:1409–1412.
- Quellhorst E. Insulin therapy during peritoneal dialysis: pros and cons of various forms of administration. J Am Soc Nephrol 2002; 13(suppl 1):S92–S96.
- Davidson MB, Peters AL. An overview of metformin in the treatment of type 2 diabetes mellitus. Am J Med 1997; 102:99–110.
- Ahmed Z, Simon B, Choudhury D. Management of diabetes in patients with chronic kidney disease. Postgrad Med 2009; 121:52–60.
- Charpentier G, Riveline JP, Varroud-Vial M. Management of drugs affecting blood glucose in diabetic patients with renal failure. Diabetes Metab 2000; 26(suppl 4):73–85.
- Hasslacher C; Multinational Repaglinide Renal Study Group. Safety and efficacy of repaglinide in type 2 diabetic patients with and without impaired renal function. Diabetes Care 2003; 26:886–891.
- Iglesias P, Dies JJ. Peroxisome proliferator-activated receptor gamma agonists in renal disease. Eur J Endocrinol 2006; 154:613–621.
- Hollenberg NK. Considerations for management of fluid dynamic issues associated with thiazolidinediones. Am J Med 2003; 115(suppl. 8A) 111S–115S.
- Kamath V, Jones CN, Yip JC, et al. Effects of a quick-release form of bromocriptine (Ergoset) on fasting and postprandial plasma glucose, insulin, lipid, and lipoprotein concentrations in obese nondiabetic hyperinsulinemic women. Diabetes Care 1997; 20:1697–1701.
- Pijl H, Ohashi S, Matsuda M, et al. Bromocriptine: a novel approach to the treatment of type 2 diabetes. Diabetes Care 2000; 23:1154–1161.
- Umpierrez GE, Gianchandani R, Smiley D, et al. Safety and efficacy of sitagliptin therapy for the inpatient management of general medicine and surgery patients with type 2 diabetes: a pilot, randomized, controlled study. Diabetes Care 2013; 36:3430–3435.
- Chan JC, Scott R, Arjona Ferreira JC, et al. Safety and efficacy of sitagliptin in patients with type 2 diabetes and chronic renal insufficiency. Diabetes Obes Metab 2008; 10:545–555.
- Bergman AJ, Cote J, Yi B, et al. Effect of renal insufficiency on the pharmacokinetics of sitagliptin, a dipeptidyl peptidase-4 inhibitor. Diabetes Care 2007; 30:1862–1864.
- Onglyza package insert. www.azpicentral.com/onglyza/pi_onglyza.pdf. Accessed March 8, 2016.
- Gallwitz B. Safety and efficacy of linagliptin in type 2 diabetes patients with common renal and cardiovascular risk factors. Ther Adv Endocrinol Metab 2013; 4:95–105.
- Marshall J, Jennings P, Scott A, Fluck RJ, McIntyre CW. Glycemic control in diabetic CAPD patients assessed by continuous glucose monitoring system (CGMS). Kidney Int 2003; 64:1480–1486.
- Schleis TG. Interference of maltose, icodextrin, galactose, or xylose with some blood glucose monitoring systems. Pharmacotherapy 2007; 27:1313–1321.
- Go AS, Chertow GM, Fan D, McCulloch CE, Hsu CY. Chronic kidney disease and the risks of death, cardiovascular events, and hospitalization. N Engl J Med 2004; 351:1296–1305.
- Newman DJ, Mattock MB, Dawnay AB, et al. Systematic review on urine albumin testing for early detection of diabetic complications. Health Technol Assess 2005; 9:iii–vi, xiii–163.
- Umpierrez GE, Isaacs SD, Bazargan N, You X, Thaler LM, Kitabchi AE. Hyperglycemia: an independent marker of in-hospital mortality in patients with undiagnosed diabetes. J Clin Endocrinol Metab 2002; 87:978–982.
- Golden SH, Peart-Vigilance C, Kao WH, Brancati FL. Perioperative glycemic control and the risk of infectious complications in a cohort of adults with diabetes. Diabetes Care 1999; 22:1408–1414.
- Van den Berghe G, Wouters P, Weekers F, et al. Intensive insulin therapy in critically ill patients. N Engl J Med 2001; 345:1359–1367.
- NICE-SUGAR Study Investigators; Finfer S, Chittock DR, Su SY, et al. Intensive versus conventional glucose control in critically ill patients. N Engl J Med 2009; 360:1283–1297.
- Brunkhorst FM, Engel C, Bloos F, et al; German Competence Network Sepsis (SepNet). Intensive insulin therapy and pentastarch resuscitation in severe sepsis. N Engl J Med 2008; 358:125–139.
- The effect of intensive treatment of diabetes on the development and progression of long-term complications in insulin-dependent diabetes mellitus. The Diabetes Control and Complications Trial Research Group. N Engl J Med 1993; 329:977–986.
- Effect of intensive diabetes management on macrovascular events and risk factors in the Diabetes Control and Complications Trial. Am J Cardiol 1995; 75:894–903.
- Nathan DM, Lachin J, Cleary P, et al; Diabetes Control and Complications Trial; Epidemiology of Diabetes Interventions and Complications Research Group. Intensive diabetes therapy and carotid intima-media thickness in type 1 diabetes mellitus. N Engl J Med 2003; 348:2294–2303.
- Writing Group for the DCCT/EDIC Research Group; Orchard TJ, Nathan DM, Zinman B, et al. Association between 7 years of intensive treatment of type 1 diabetes and long-term mortality. JAMA 2015; 313:45–53.
- Moen MF, Zhan M, Hsu VD, et al. Frequency of hypoglycemia and its significance in chronic kidney disease. Clin J Am Soc Nephrol 2009; 4:1121–1127.
- Iglesias P, Díez J. Insulin therapy in renal disease. Diabetes Obes Metab 2008; 10:811–823.
- Zoungas S, Patel A, Chalmers J, et al; ADVANCE Collaborative Group. Severe hypoglycemia and risks of vascular events and death. N Engl J Med 2010; 363:1410–1418.
- Moghissi ES, Korytkowski MT, DiNardo M, et al; American Association of Clinical Endocrinologists; American Diabetes Association. American Association of Clinical Endocrinologists and American Diabetes Association consensus statement on inpatient glycemic control. Diabetes Care 2009; 32:1119–1131.
- Action to Control Cardiovascular Risk in Diabetes Study Group; Gerstein HC, Miller ME, Byington RP, et al. Effects of intensive glucose lowering in type 2 diabetes. N Engl J Med 2008; 358:2545–2559.
- Kovesdy CP, Park JC, Kalantar-Zadeh K. Glycemic control and burnt-out diabetes in ESRD. Semin Dial 2010; 23:148–156.
- De Marchi S, Cecchin E, Camurri C, et al. Origin of glycosylated hemoglobin A1 in chronic renal failure. Int J Artif Organs 1983; 6:77–82.
- Brown JN, Kemp DW, Brice KR. Class effect of erythropoietin therapy on hemoglobin A(1c) in a patient with diabetes mellitus and chronic kidney disease not undergoing hemodialysis. Pharmacotherapy 2009; 29:468–472.
- Morgan L, Marenah CB, Jeffcoate WJ, Morgan AG. Glycated proteins as indices of glycemic control in diabetic patients with chronic renal failure. Diabet Med 1996; 13:514–519.
- Peacock TP, Shihabi ZK, Bleyer AJ, et al. Comparison of glycated albumin and hemoglobin A(1c) levels in diabetic subjects on hemodialysis. Kidney Int 2008; 73:1062–1068.
- Joy MS, Cefalu WT, Hogan SL, Nachman PH. Long-term glycemic control measurements in diabetic patients receiving hemodialysis. Am J Kidney Dis 2002; 39:297–307.
- Inaba M, Okuno S, Kumeda Y, et al; Osaka CKD Expert Research Group. Glycated albumin is a better glycemic indicator than glycated hemoglobin values in hemodialysis patients with diabetes: effect of anemia and erythropoietin injection. J Am Soc Nephrol 2007; 18:896–903.
- Mittman N, Desiraju B, Fazil I, et al. Serum fructosamine versus glycosylated hemoglobin as an index of glycemic control, hospitalization, and infection in diabetic hemodialysis patients. Kidney Int 2010; 78(suppl 117):S41–S45.
- Alskar O, Korelli J, Duffull SB. A pharmacokinetic model for the glycation of albumin. J Pharmacokinet Pharmacodyn 2012; 39:273–282.
- Qaseem A, Humphrey LL, Chou R, Snow V, Shekelle P; Clinical Guidelines Committee of the American College of Physicians. Use of intensive insulin therapy for the management of glycemic control in hospitalized patients: a clinical practice guideline from the American College of Physicians. Ann Intern Med 2011; 154:260–267.
- Murad MH, Coburn JA, Coto-Yglesias F, et al. Glycemic control in non-critically ill hospitalized patients: a systematic review and meta-analysis. J Clin Endocrinol Metab 2012; 97:49–58.
- Bogun M, Inzucchi SE. Inpatient management of diabetes and hyperglycemia. Clin Ther 2013; 35:724–733.
- Miller DB. Glycemic targets in hospital and barriers to attaining them. Can J Diabetes 2014; 38:74–78.
- Eidemak I, Feldt-Rasmussen B, Kanstrup IL, Nielsen SL, Schmitz O, Strandgaard S. Insulin resistance and hyperinsulinaemia in mild to moderate progressive chronic renal failure and its association with aerobic work capacity. Diabetologia 1995; 38:565–572.
- Svensson M, Yu Z, Eriksson J. A small reduction in glomerular filtration is accompanied by insulin resistance in type I diabetes patients with diabetic nephropathy. Eur J Clin Invest 2002; 32:100–109.
- Rave K, Heise T, Pfutzner A, Heinemann L, Sawicki P. Impact of diabetic nephropathy on pharmacodynamics and pharmacokinetic properties of insulin in type I diabetic patients. Diabetes Care 2001; 24:886–890.
- Biesenbach G, Raml A, Schmekal B, Eichbauer-Sturm G. Decreased insulin requirement in relation to GFR in nephropathic type 1 and insulin-treated type 2 diabetic patients. Diabet Med 2003; 20:642–645.
- Holmes G, Galitz L, Hu P, Lyness W. Pharmacokinetics of insulin aspart in obesity, renal impairment, or hepatic impairment. Br J Clin Pharmacol 2005; 60:469–476.
- Lindholm A, Jacobsen LV. Clinical pharmacokinetics and pharmacodynamics of insulin aspart. Clin Pharmacokinet 2001; 40:641–659.
- Bolli GB, Hahn AD, Schmidt R, et al. Plasma exposure to insulin glargine and its metabolites M1 and M2 after subcutaneous injection of therapeutic and supratherapeutic doses of glargine in subjects with type 1 diabetes. Diabetes Care 2012; 35:2626–2630.
- Nielsen S. Time course and kinetics of proximal tubular processing of insulin. Am J Physiol 1992; 262:F813–F822.
- Sobngwi E, Enoru S, Ashuntantang G, et al. Day-to-day variation of insulin requirements of patients with type 2 diabetes and end-stage renal disease undergoing maintenance hemodialysis. Diabetes Care 2010; 33:1409–1412.
- Quellhorst E. Insulin therapy during peritoneal dialysis: pros and cons of various forms of administration. J Am Soc Nephrol 2002; 13(suppl 1):S92–S96.
- Davidson MB, Peters AL. An overview of metformin in the treatment of type 2 diabetes mellitus. Am J Med 1997; 102:99–110.
- Ahmed Z, Simon B, Choudhury D. Management of diabetes in patients with chronic kidney disease. Postgrad Med 2009; 121:52–60.
- Charpentier G, Riveline JP, Varroud-Vial M. Management of drugs affecting blood glucose in diabetic patients with renal failure. Diabetes Metab 2000; 26(suppl 4):73–85.
- Hasslacher C; Multinational Repaglinide Renal Study Group. Safety and efficacy of repaglinide in type 2 diabetic patients with and without impaired renal function. Diabetes Care 2003; 26:886–891.
- Iglesias P, Dies JJ. Peroxisome proliferator-activated receptor gamma agonists in renal disease. Eur J Endocrinol 2006; 154:613–621.
- Hollenberg NK. Considerations for management of fluid dynamic issues associated with thiazolidinediones. Am J Med 2003; 115(suppl. 8A) 111S–115S.
- Kamath V, Jones CN, Yip JC, et al. Effects of a quick-release form of bromocriptine (Ergoset) on fasting and postprandial plasma glucose, insulin, lipid, and lipoprotein concentrations in obese nondiabetic hyperinsulinemic women. Diabetes Care 1997; 20:1697–1701.
- Pijl H, Ohashi S, Matsuda M, et al. Bromocriptine: a novel approach to the treatment of type 2 diabetes. Diabetes Care 2000; 23:1154–1161.
- Umpierrez GE, Gianchandani R, Smiley D, et al. Safety and efficacy of sitagliptin therapy for the inpatient management of general medicine and surgery patients with type 2 diabetes: a pilot, randomized, controlled study. Diabetes Care 2013; 36:3430–3435.
- Chan JC, Scott R, Arjona Ferreira JC, et al. Safety and efficacy of sitagliptin in patients with type 2 diabetes and chronic renal insufficiency. Diabetes Obes Metab 2008; 10:545–555.
- Bergman AJ, Cote J, Yi B, et al. Effect of renal insufficiency on the pharmacokinetics of sitagliptin, a dipeptidyl peptidase-4 inhibitor. Diabetes Care 2007; 30:1862–1864.
- Onglyza package insert. www.azpicentral.com/onglyza/pi_onglyza.pdf. Accessed March 8, 2016.
- Gallwitz B. Safety and efficacy of linagliptin in type 2 diabetes patients with common renal and cardiovascular risk factors. Ther Adv Endocrinol Metab 2013; 4:95–105.
- Marshall J, Jennings P, Scott A, Fluck RJ, McIntyre CW. Glycemic control in diabetic CAPD patients assessed by continuous glucose monitoring system (CGMS). Kidney Int 2003; 64:1480–1486.
- Schleis TG. Interference of maltose, icodextrin, galactose, or xylose with some blood glucose monitoring systems. Pharmacotherapy 2007; 27:1313–1321.
KEY POINTS
- Hemoglobin A1c values are often unreliable in patients with end-stage renal disease; close monitoring by fingerstick testing or a continuous monitoring system is recommended during hospitalization.
- Insulin is the preferred treatment for hospitalized patients with diabetes; oral antidiabetic agents should be avoided.
- Blood glucose targets for hospitalized patients with diabetes or stress hyperglycemia should be less than 140 mg/dL before meals, and random values should be less than 180 mg/dL.
- A basal-bolus insulin approach is flexible and mimics endogenous insulin release.
- Many insulin-treated patients with type 2 diabetes and CKD stop needing insulin as kidney disease progresses.
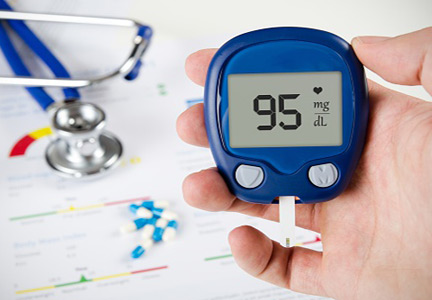
Drugs that may harm bone: Mitigating the risk
Drug-induced osteoporosis is common, and the list of drugs that can harm bone continues to grow. As part of routine health maintenance, practitioners should recognize the drugs that increase bone loss and take measures to mitigate these effects to help avoid osteopenia and osteoporosis.
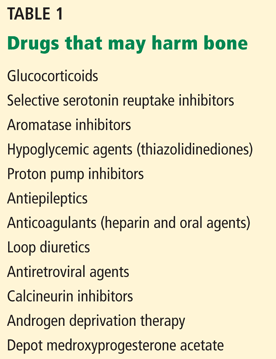
Osteoporosis, a silent systemic disease defined by low bone mineral density and changes in skeletal microstructure, leads to a higher risk of fragility fractures. Some of the risk factors are well described, but less well known is the role of pharmacologic therapy. The implicated drugs (Table 1) have important therapeutic roles, so the benefits of using them must be weighed against their risks, including their potential effects on bone.
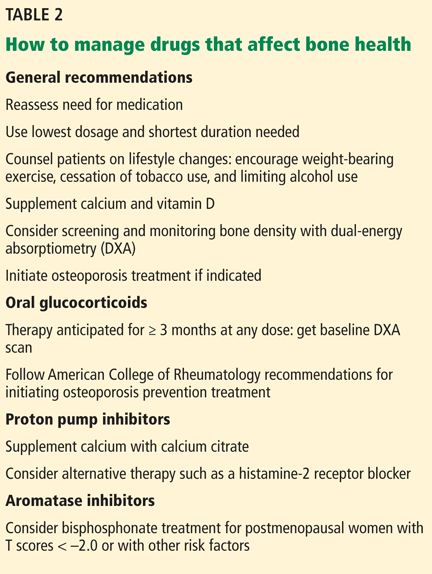
This review focuses on a few drugs known to increase fracture risk, their mechanisms of bone loss, and management considerations (Table 2).
GLUCOCORTICOIDS
Glucocorticoids are used to treat many medical conditions, including allergic, rheumatic, and other inflammatory diseases, and as immunosuppressive therapy after solid organ and bone marrow transplant. They are the most common cause of drug-induced bone loss and related secondary osteoporosis.
Multiple effects on bone
Glucocorticoids both increase bone resorption and decrease bone formation by a variety of mechanisms.1 They reduce intestinal calcium absorption, increase urinary excretion of calcium, and enhance osteocyte apoptosis, leading to deterioration of the bone microarchitecture and bone mineral density.2 They also affect sex hormones, decreasing testosterone production in men and estrogen in women, leading to increased bone resorption, altered bone architecture, and poorer bone quality.3,4 The bone loss is greater in trabecular bone (eg, the femoral neck and vertebral bodies) than in cortical bone (eg, the forearm).5
Glucocorticoids have other systemic effects that increase fracture risk. For example, they cause muscle weakness and atrophy, increasing the risk of falls.4 Additionally, many of the inflammatory conditions for which they are prescribed (eg, rheumatoid arthritis) also increase the risk of osteoporosis by means of proinflammatory cytokine production, which may contribute to systemic and local effects on bone.4,6
Bone mineral density declines quickly
Bone mineral density declines within the first 3 months after starting oral glucocorticoids, with the rate of bone loss peaking at 6 months. Up to 12% of bone mass is lost in the first year. In subsequent years of continued use, bone loss progresses at a slower, steadier rate, averaging 2% to 3% annually.5,7,8
Oral therapy increases fracture risk
Kanis et al9 performed a meta-analysis of seven prospective cohort studies in 40,000 patients and found that the current or previous use of an oral glucocorticoid increased the risk of fragility fractures, and that men and women were affected about equally.9
Van Staa et al10,11 reported that daily doses of glucocorticoids equivalent to more than 2.5 mg of prednisone were associated with an increased risk of vertebral and hip fractures; fracture risk was related mainly to daily dosage rather than cumulative dose.
Van Staa et al,12 in a retrospective cohort study, compared nearly 250,000 adult users of oral glucocorticoids from general medical practice settings with the same number of controls matched for sex, age, and medical practice. The relative risks for fractures and 95% confidence intervals (CIs) during oral glucocorticoid treatment were as follows:
- Forearm fracture 1.09 (1.01–1.17)
- Nonvertebral fracture 1.33 (1.29–1.38)
- Hip fracture 1.61 (1.47–1.76)
- Vertebral fracture 2.60 (2.31–2.92).
The risk was dose-dependent. For a low daily dose (< 2.5 mg/day of prednisolone), the relative risks were:
- Hip fracture 0.99 (0.82–1.20)
- Vertebral fracture 1.55 (1.20–2.01) .
For a medium daily dose (2.5–7.5 mg/day), the relative risks were:
- Hip fracture 1.77 (1.55–2.02)
- Vertebral fracture 2.59 (2.16–3.10) .
For a high daily dose (> 7.5 mg/day), the relative risks were:
- Hip fracture 2.27 (1.94–2.66)
- Vertebral fracture 5.18 (4.25–6.31).
Fracture risk rapidly declined toward baseline after the patients stopped taking oral glucocorticoids but did not return to baseline levels. The lessening of excess fracture risk occurred mainly within the first year after stopping therapy.
Other studies5,9,13 have suggested that the increased fracture risk is mostly independent of bone mineral density, and that other mechanisms are at play. One study14 found that oral glucocorticoid users with a prevalent vertebral fracture actually had higher bone mineral density than patients with a fracture not taking glucocorticoids, although this finding was not confirmed in a subsequent study.15
Inhaled glucocorticoids have less effect on bone
Inhaled glucocorticoids are commonly used to treat chronic obstructive pulmonary disease and asthma. They do not have the same systemic bioavailability as oral glucocorticoids, so the risk of adverse effects is lower.
Data are inconsistent among several studies that evaluated the relationship between inhaled glucocorticoids, bone mineral density, osteoporosis, and fragility fracture. The inconsistencies may be due to heterogeneity of the study populations, self-reporting of fractures, and different methods of assessing chronic obstructive pulmonary disease severity.16
A Cochrane review17 in 2002 evaluated seven randomized controlled trials that compared the use of inhaled glucocorticoids vs placebo in nearly 2,000 patients with mild asthma or chronic obstructive pulmonary disease and found no evidence for decreased bone mineral density, increased bone turnover, or increased vertebral fracture incidence in the glucocorticoid users at 2 to 3 years of follow-up (odds ratio for fracture 1.87, 95% CI 0.5–7.0).
The Evaluation of Obstructive Lung Disease and Osteoporosis study,16 a multicenter Italian observational epidemiologic study, reported that patients taking the highest daily doses of inhaled glucocorticoids (> 1,500 μg of beclomethasone or its equivalent) had a significantly higher risk of vertebral fracture (odds ratio 1.4, 95% CI 1.04–1.89).16
A meta-analysis18 of five case-control studies (43,783 cases and 259,936 controls) identified a possible dose-dependent relationship, with a relative risk for nonvertebral fracture of 1.12 (95% CI 1.0–1.26) for each 1,000-μg increase in beclomethasone-equivalent inhaled glucocorticoid per day.
In summary, the effects of inhaled glucocorticoids in adults are uncertain, although trends toward increased fracture risk and decreased bone mineral density are evident with chronic therapy at moderate to high dosages. The risks and benefits of treatment should be carefully considered in patients with osteoporosis and baseline elevated fracture risk.19
Managing the risk of glucocorticoid-induced osteoporosis
In 2010, the American College of Rheumatology published recommendations for preventing and treating glucocorticoid-induced osteoporosis, which were endorsed by the American Society for Bone and Mineral Research.20 To lessen the risk of osteoporosis, the recommendations are as follows:
Limit exposure. Patients receiving glucocorticoids should be given the smallest dosage for the shortest duration possible.
Advise lifestyle changes. Patients should be counseled to limit their alcohol intake to no more than two drinks per day, to quit smoking, to engage in weight-bearing exercise, and to ingest enough calcium (1,200–1,500 mg/day, through diet and supplements) and vitamin D.
Monitor bone mineral density. Patients starting glucocorticoids at any dosage for an expected duration of at least 3 months should have their bone mineral density measured at baseline. The frequency of subsequent measurements should be based on the presence of other risk factors for fracture, results of previous bone density testing, glucocorticoid dosage, whether therapy for bone health has been initiated, and the rate of change in bone mineral density. If warranted and if the results would lead to a change in management, patients can undergo dual-energy x-ray absorptiometry more often than usual, ie, more often than every 2 years. Prevalent and incident fragility fractures, height measurements, fall risk assessments, laboratory measurements of 25-hydroxyvitamin D, and consideration of vertebral fracture assessment or other imaging of the spine, as necessary, should be part of counseling and monitoring.
Osteoporosis treatment. For patients who will be taking glucocorticoids for at least 3 months, alendronate, risedronate, zoledronic acid, or teriparatide can be initiated to prevent or treat osteoporosis in the following groups:
- Postmenopausal women and men over age 50 if the daily glucocorticoid dosage is at least 7.5 mg/day or if the World Health Organization Fracture Risk Assessment Tool (FRAX) score is more than 10% (the threshold for medium fracture risk)
- Premenopausal women and men younger than 50 if they have a history of fragility fracture, the FRAX score is more than 20% (the threshold for high fracture risk), or the T score is less than –2.5.
Certain clinical factors can also put a patient into a higher-risk category. These include current tobacco use, low body mass index, parental history of hip fracture, consuming more than three alcoholic drinks daily, higher daily or cumulative glucocorticoid dosage, intravenous pulse glucocorticoid usage, or a decline in central bone mineral density that exceeds the least significant change according to the scanner used.20
The FRAX tool accounts for bone density only at the femoral neck, and while useful, it cannot replace clinical judgment in stratifying risk. Moreover, it does not apply to premenopausal women or men under age 40.
The long-term risks of medications to treat glucocorticoid-induced osteoporosis are not well defined for premenopausal women (or their unborn children) or in men younger than 40, so treatment is recommended in those groups only for those with prevalent fragility fractures who are clearly at higher risk of additional fractures.20
PROTON PUMP INHIBITORS
Proton pump inhibitors are available by prescription and over the counter for gastric acid-related conditions. Concerns have been raised that these highly effective drugs are overused.21 Several of their adverse effects are self-limited and minor, but long-term use may entail serious risks, including propensity to bone fracture.22
Low acid leads to poor calcium absorption
Why fracture risk increases with proton pump inhibitors is controversial and may relate to their desired effect of suppressing gastric acid production: calcium salts, including carbonate and chloride, are poorly soluble and require an acidic environment to increase calcium ionization and thus absorption.23 For this reason, if patients taking a proton pump inhibitor take a calcium supplement, it should be calcium citrate, which unlike calcium carbonate does not require an acid environment for absorption.
Higher risk in older patients, with longer use, and with higher dosage
Since the first reports on proton pump inhibitors and fracture risk were published in 2006,24,25 a number of studies have reported this association, including several systematic reviews.
In 2011, the US Food and Drug Administration (FDA) updated a 2010 safety communication based on seven epidemiologic studies reporting an increased risk of fractures of the spine, hip, and wrist with proton pump inhibitors.24–31 Time of exposure to a proton pump inhibitor in these studies varied from 1 to 12 years. Fracture risk was higher in older patients,26 with higher doses,24,29 and with longer duration of drug use.24,27 On the other hand, one study that included only patients without other major fracture risk factors failed to find an association between the use of proton pump inhibitors and fractures.28
Is evidence sufficient for changing use?
The FDA report included a disclaimer that they had no access to study data or protocols and so could not verify the findings.26 Moreover, the studies used claims data from computerized databases to evaluate the risk of fractures in patients treated with proton pump inhibitors compared with those not using these drugs.24–31 Information was often incomplete regarding potentially important factors (eg, falls, family history of osteoporosis, calcium and vitamin D intake, smoking, alcohol use, reason for medication use), as well as the timing of drug use related to the onset or worsening of osteoporosis.26
Although 34 published studies evaluated the association of fracture risk and proton pump inhibitors, Leontiadis and Moayyedi32 argued that insufficient evidence exists to change our prescribing habits for these drugs based on fracture risk, as the studies varied considerably in their designs and results, a clear dose-response relationship is lacking, and the modest association is likely related to multiple confounders.
Bottom line: Use with caution
Although the increased fracture risk associated with proton pump inhibitors is likely multifactorial and is not fully delineated, it appears to be real. These drugs should be used only if there is a clear indication for them and if their benefits likely outweigh their risks. The lowest effective dose should be used, and the need for continuing use should be frequently reassessed.
SELECTIVE SEROTONIN REUPTAKE INHIBITORS
Depression affects 1 in 10 people in the United States, is especially common in the elderly, and leads to significant morbidity and reduced quality of life.33 Selective serotonin reuptake inhibitors (SSRIs) are often prescribed and are generally considered first-line agents for treating depression.
Complex bone effects
SSRIs antagonize the serotonin transporter, which normally assists serotonin uptake from the extracellular space. The serotonin transporter is found in all main types of bone cells, including osteoclasts, osteoblasts, and osteocytes.33 Serotonin is made by different genes in the brain than in the periphery, causing opposing effects on bone biology: when generated peripherally, it acts as a hormone to inhibit bone formation, while when generated in the brain, it acts as a neurotransmitter to create a major and positive effect on bone mass accrual by enhancing bone formation and limiting bone resorption.34,35
Potential confounders complicate the effect of SSRIs on bone health, as depression itself may be a risk factor for fracture. Patients with depression tend to have increased inflammation and cortisol, decreased gonadal steroids, more behavioral risk factors such as tobacco and increased alcohol use, and less physical activity, all of which can contribute to low bone density and risk of falls and fractures.33
Daily use of SSRIs increases fracture risk
A 2012 meta-analysis36 of 12 studies (seven case-control and five cohort), showed that SSRI users had a higher overall risk of fracture (adjusted odds ratio 1.69, 95% CI 1.51–1.90). By anatomic site, pooled odds ratios and 95% CIs were:
- Vertebral fractures 1.34 (1.13–1.59)
- Wrist or forearm fractures 1.51 (1.26–1.82)
- Hip or femur fractures 2.06 (1.84–2.30).
A 2013 meta-analysis37 of 34 studies with more than 1 million patients found that the random-effects pooled relative risk of all fracture types in users of antidepressants (including but not limited to SSRIs) was 1.39 (95% CI 1.32–1.47) compared with nonusers. Relative risks and 95% CIs in antidepressant users were:
- Vertebral fractures 1.38 (1.19–1.61)
- Nonvertebral fractures 1.42 (1.34–1.51)
- Hip fractures 1.47 (1.36–1.58).
A population-based, prospective cohort study38 of 5,008 community-dwelling adults age 50 and older, followed for 5 years, found that the daily use of SSRIs was associated with a twofold increased risk of clinical fragility fractures (defined as minimal trauma fractures that were clinically reported and radiographically confirmed) after adjusting for potential covariates. Daily SSRI use was also associated with an increased risk of falling (odds ratio 2.2, 95% CI 1.4–3.5), lower bone mineral density at the hip, and a trend toward lower bone mineral density at the spine. These effects were dose-dependent and were similar for those who reported taking SSRIs at baseline and at 5 years.
Bottom line: Counsel bone health
Although no guidelines exist for preventing or treating SSRI-induced bone loss, providers should discuss with patients the potential effect of these medications on bone health, taking into account patient age, severity of depression, sex, duration of use, length of SSRI treatment, and other clinical risk factors for osteoporosis.34 Given the widespread use of these medications for treating depression, more study into this association is needed to further guide providers.
ANTIEPILEPTIC DRUGS
Antiepileptic drugs are used to treat not only seizure disorders but also migraine headaches, neuropathy, and psychiatric and pain disorders. Many studies have linked their use to an increased risk of fractures.
The mechanism of this effect remains controversial. Early studies reported that inducers of cytochrome P450 enzymes (eg, phenobarbital, phenytoin) lead to increased vitamin D degradation, causing osteomalacia.39 Another study suggested that changes in calcium metabolism and reduced bone mineral density occur without vitamin D deficiency and that drugs such as valproate that do not induce cytochrome P450 enzymes may also affect bone health.40 Other bone effects may include direct inhibition of intestinal calcium absorption (seen in animal studies) and the induction of a high remodeling state leading to osteomalacia.41,42
Epilepsy itself increases risk of fractures
Patients with seizure disorders may also have an increased risk of fractures because of falls, trauma, impaired balance, use of glucocorticoids and benzodiazepines, and comorbid conditions (eg, mental retardation, cerebral palsy, and brain neoplasm).43
A 2005 meta-analysis43 of 11 studies of epilepsy and fracture risk and 12 studies of epilepsy and bone mineral density found that the risks of fractures were increased. The following relative risks and 95% CIs were noted:
- Any fracture 2.2 (1.9–2.5), in five studies
- Forearm 1.7 (1.2–2.3), in six studies
- Hip 5.3 (3.2–8.8), six studies
- Spine 6.2 (2.5–15.5), in three studies.
A large proportion of fractures (35%) seemed related to seizures.
Certain drugs increase risk
A large 2004 population-based, case-control, study44 (124,655 fracture cases and 373,962 controls) found an association between the use of antiepileptic drugs and increased fracture risk. After adjusting for current or prior use of glucocorticoids, prior fracture, social variables, comorbid conditions, and epilepsy diagnosis, excess fracture risk was found to be associated with the following drugs (odds ratios and 95% CIs):
- Oxcarbazepine 1.14 (1.03–1.26)
- Valproate 1.15 (1.05–1.26)
- Carbamazepine 1.18 (1.10-1.26)
- Phenobarbital 1.79 (1.64–1.95).
The risk was higher with higher doses. Fracture risk was higher with cytochrome P450 enzyme-inducing drugs (carbamazepine, oxcarbazepine, phenobarbital, phenytoin, and primidone; odds ratio 1.38, 95% CI 1.31–1.45) than for noninducing drugs (clonazepam, ethosuximide, lamotrigine, tiagabine, topiramate, valproate, and vigabatrin; odds ratio 1.19, 95% CI 1.11–1.27). No significant increased risk of fracture was found with use of phenytoin, tiagabine, topiramate, ethosuximide, lamotrigine, vigabatrin, or primidone after adjusting for confounders.
Bottom line: Monitor bone health
With antiepileptic drugs, the benefit of preventing seizures outweighs the risks of fractures. Patients on long-term antiepileptic drug therapy should be monitored for bone mineral density and vitamin D levels and receive counseling on lifestyle measures including tobacco cessation, alcohol moderation, and fall prevention.45 As there are no evidence-based guidelines for bone health in patients on antiepileptic drugs, management should be based on current guidelines for treating osteoporosis.
AROMATASE INHIBITORS
Breast cancer is the most common cancer in women and is the second-leading cause of cancer-associated deaths in women after lung cancer. Aromatase inhibitors, such as anastrozole, letrozole, and exemestane, are the standard of care in adjuvant treatment for hormone-receptor-positive breast cancer, leading to longer disease-free survival.
However, aromatase inhibitors increase bone loss and fracture risk, and only partial recovery of bone mineral density occurs after treatment is stopped. The drugs deter the aromatization of androgens and their conversion to estrogens in peripheral tissue, leading to reduced estrogen levels and resulting bone loss.46 Anastrozole and letrozole have been found to reduce bone mineral density, increase bone turnover, and increase the relative risk for nonvertebral and vertebral fractures in postmenopausal women by 40% compared with tamoxifen.47,48
Base osteoporosis treatment on risk
Several groups have issued guidelines for preventing and treating bone loss in postmenopausal women being treated with an aromatase inhibitor. When initiating treatment, women should be counseled about modifiable risk factors, exercise, and calcium and vitamin D supplementation.
Baseline bone mineral testing should also be obtained when starting treatment. Hadji et al,49 in a review article, recommend starting bone-directed therapy if the patient’s T score is less than –2.0 (using the lowest score from three sites) or if she has any of at least two of the following fracture risk factors:
- T score less than –1.5
- Age over 65
- Family history of hip fracture
- Personal history of fragility fracture after age 50
- Low body mass index (< 20 kg/m2)
- Current or prior history of tobacco use
- Oral glucocorticoid use for longer than 6 months.
Patients with a T score at or above –2.0 and no risk factors should have bone mineral density reassessed after 1 to 2 years. Antiresorptive therapy with intravenous zoledronic acid and evaluation for other secondary causes of bone loss should be initiated for either:
- An annual decrease of at least 10% or
- An annual decrease of at least 4% in patients with osteopenia at baseline.49
In 2003, the American Society of Clinical Oncology updated its recommendations on the role of bisphosphonates and bone health in women with breast cancer.50 They recommend the following:
- If the T score is –2.5 or less, prescribe a bisphosphonate (alendronate, risedronate, or zoledronic acid)
- If the T score is –1.0 to –2.5, tailor treatment individually and monitor bone mineral density annually
- If the T score is greater than –1.0, monitor bone mineral density annually.
All patients should receive lifestyle counseling, calcium and vitamin D supplementation, and monitoring of additional risk factors for osteoporosis as appropriate.50
- Canalis E, Delany AM. Mechanisms of glucocorticoid action in bone. Ann N Y Acad Sci 2002; 966:73–81.
- Manolagas SC. Corticosteroids and fractures: a close encounter of the third cell kind. J Bone Miner Res 2000; 15:1001–1005.
- Papaioannou A, Ferko NC, Adachi JD. Corticosteroids and the skeletal system. In: Lin AN, Paget SA, eds. Principles of corticosteroid therapy. New York, NY: Arnold Publishers; 2002:69–86.
- Van Staa TP. The pathogenesis, epidemiology, and management of glucocorticoid-induced osteoporosis. Calcif Tissue Int 2006; 79:129–137.
- Van Staa TP, Leufkens HG, Cooper C. The epidemiology of corticosteroid-induced osteoporosis: a meta-analysis. Osteoporosis Int 2002; 13:777–787.
- Clowes JA, Riggs BL, Khosla S. The role of the immune system in the pathophysiology of osteoporosis. Immunol Rev 2005; 208:207–227.
- LoCascio V, Bonucci E, Imbimbo B, et al. Bone loss in response to long-term glucocorticoid therapy. Bone Miner 1990; 8:39–51.
- Lane NE, Lukert B. The science and therapy of glucocorticoid-induced bone loss. Endocrinol Metab Clin North Am 1998; 27:465–483.
- Kanis JA, Johansson H, Oden A, et al. A meta-analysis of prior corticosteroid use and fracture risk. J Bone Miner Res 2004; 19:893–899.
- Van Staa TP, Geusens P, Pols HA, de Laet C, Leufkens HG, Cooper C. A simple score for estimating the long-term risk of fracture in patients using oral glucocorticoids. QJM 2005; 98:191–198.
- Van Staa TP, Leufkens HG, Abenhaim L, Zhang B, Cooper C. Oral corticosteroids and fracture risk: relationship to daily and cumulative doses. Rheumatology (Oxford) 2000; 39:1383–1389.
- Van Staa TP, Leufkens HG, Abenhaim L, Zhang B, Cooper C. Use of corticosteroids and risk of fractures. J Bone Miner Res 2000; 15:993–1000.
- Van Staa TP, Laan RF, Barton IP, Cohen S, Reid DM, Cooper C. Bone density threshold and other predictors of vertebral fracture in patients receiving oral glucocorticoid therapy. Arthritis Rheum 2003; 48:3224–3229.
- Luengo M, Picado C, Del Rio L, Guanabens N, Montserrat JM, Setoain J. Vertebral fractures in steroid dependent asthma and involutional osteoporosis: a comparative study. Thorax 1991; 46:803–806.
- Selby PL, Halsey JP, Adams KRH, et al. Corticosteroids do not alter the threshold for vertebral fracture. J Bone Miner Res 2000; 15:952–956.
- Gonnelli S, Caffarelli C, Maggi S, et al. Effect of inhaled glucocorticoids and beta(2) agonists on vertebral fracture risk in COPD patients: the EOLO study. Calcif Tissue Int 2010; 87:137–143.
- Jones A, Fay JK, Burr M, Stone M, Hood K, Roberts G. Inhaled corticosteroid effects on bone metabolism in asthma and mild chronic obstructive pulmonary disease. Cochrane Database Syst Rev 2002; 1:CD003537.
- Weatherall M, James K, Clay J, et al. Dose-response relationship for risk of non-vertebral fracture with inhaled corticosteroids. Clin Exp Allergy 2008; 38:1451–1458
- Buehring B, Viswanathan R, Binkley N, Busse W. Glucocorticoid-induced osteoporosis: an update on effects and management. J Allergy Clin Immunol 2013; 132:1019–1030.
- Grossman JM, Gordon R, Ranganath VK, et al. American College of Rheumatology 2010 recommendations for the prevention and treatment of glucocorticoid-induced osteoporosis. Arthritis Care Res (Hoboken) 2010; 62:1515–1526.
- Naunton M, Peterson GM, Bleasel MD. Overuse of proton pump inhibitors. J Clin Pharm Ther 2000; 25:333–340.
- Wilhelm SM, Rjater RG, Kale-Pradhan PB. Perils and pitfalls of long-term effects of proton pump inhibitors. Expert Rev Clin Pharmacol 2013; 6:443–451.
- Sheikh MS, Santa Ana CA, Nicar MJ, Schiller LR, Fordtran JS. Gastrointestinal absorption of calcium from milk and calcium salts. N Engl J Med 1987; 317:532–536.
- Yang YX, Lewis JD, Epstein S, Metz DC. Long-term proton pump inhibitor therapy and risk of hip fracture. JAMA 2006; 296:2947–2953.
- Vestergaard P, Rejnmark L, Mosekilde L. Proton pump inhibitors, histamine H2 receptor antagonists, and other antacid medications and the risk of fracture. Calcif Tissue Int 2006; 79:76–83.
- Food and Drug Administration (FDA). FDA drug safety communication: possible increased risk of fractures of the hip, wrist, and spine with the use of proton pump inhibitors. www.fda.gov/Drugs/DrugSafety/PostmarketDrugSafetyInformationforPatientsandProviders/ucm213206.htm. Accessed March 7, 2016.
- Targownik LE, Lix LM, Metge CJ, Prior HJ, Leung S, Leslie WD. Use of proton pump inhibitors and risk of osteoporosis-related fractures. CMAJ 2008; 179:319–326.
- Kaye JA, Jick H. Proton pump inhibitor use and risk of hip fractures in patients without major risk factors. Pharmacotherapy 2008; 28:951–959.
- Corley DA, Kubo A, Zhao W, Quesenberry C. Proton pump inhibitors and histamine-2 receptor antagonists are associated with hip fractures among at-risk patients. Gastroenterology 2010; 139:93–101.
- Gray SL, LaCroix AZ, Larson J, et al. Proton pump inhibitor use, hip fracture, and change in bone mineral density in postmenopausal women: results from the Women’s Health Initiative. Arch Intern Med 2010; 170:765–771.
- Yu EW, Blackwell T, Ensrud KE, et al. Acid-suppressive medications and risk of bone loss and fracture in older adults. Calcif Tissue Int 2008; 83:251–259.
- Leontiadis GI, Moayyedi P. Proton pump inhibitors and risk of bone fractures. Curr Treat Options Gastroenterol 2014; 12:414–423.
- Chen F, Hahn TJ, Weintraub NT. Do SSRIs play a role in decreasing bone mineral density? J Am Med Dir Assoc 2012; 13:413–417.
- Bruyere O, Reginster JY. Osteoporosis in patients taking selective serotonin reuptake inhibitors: a focus on fracture outcome. Endocrine 2015; 48:65–68.
- Ducy P, Karsenty G. The two faces of serotonin in bone biology. J Cell Biol 2010; 191:7–13.
- Eom CS, Lee HK, Ye S, Park SM, Cho KH. Use of selective serotonin reuptake inhibitors and risk of fracture: a systematic review and meta-analysis. J Bone Miner Res 2012; 27:1186–1195.
- Rabenda V, Nicolet D, Beaudart C, Bruyere O, Reginster JY. Relationship between use of antidepressants and risk of fractures: a meta-analysis. Osteoporosis Int 2013; 24:121–137.
- Richards JB, Papaioannou A, Adachi JD, et al; Canadian Multicentre Osteoporosis Study Research Group. Effect of selective serotonin reuptake inhibitors on the risk of fracture. Arch Intern Med 2007; 22;167:188–194.
- Hahn TJ, Hendin BA, Scharp CR, Boisseau VC, Haddad JG Jr. Serum 25-hydroxycalciferol levels and bone mass in children on chronic anticonvulsant therapy. N Engl J Med 1975; 292:550–554.
- Weinstein RS, Bryce GF, Sappington LJ, King DW, Gallagher BB. Decreased serum ionized calcium and normal vitamin D metabolite levels with anticonvulsant drug treatment. J Clin Endocrinol Metab 1984; 58:1003–1009.
- Koch HU, Kraft D, von Herrath D, Schaefer K. Influence of diphenylhydantoin and phenobarbital on intestinal calcium transport in the rat. Epilepsia 1972; 13:829–834.
- Shane E. Osteoporosis associated with illness and medications. In: Marcus R, Feldman D, Kelsey J, editors. Osteoporosis. San Diego, CA: Academic Press; 1996.
- Vestergaard P. Epilepsy, osteoporosis and fracture risk—a meta-analysis. Acta Neurol Scand 2005; 112:277–286.
- Vestergaard P, Rejnmark L, Mosekilde L. Fracture risk associated with use of antiepileptic drugs. Epilepsia 2004; 45:1330–1337.
- Petty SJ, O’Brien TJ, Wark JD. Anti-epileptic medication and bone health. Osteoporos Int 2007; 18:129–142.
- Mazziotti G, Canalis E, Giustina A. Drug-induced osteoporosis: mechanisms and clinical implications. Am J Med 2010; 123:877–884.
- Rabaglio M, Sun Z, Price KN, et al; BIG 1-98 Collaborative and International Breast Cancer Study Groups. Bone fractures among postmenopausal patients with endocrine-responsive early breast cancer treated with 5 years of letrozole or tamoxifen in the BIG 1-98 trial. Ann Oncol 2009; 20:1489–1498.
- Khan MN, Khan AA. Cancer treatment-related bone loss: a review and synthesis of the literature. Curr Oncol 2008; 15:S30–S40.
- Hadji P, Aapro MS, Body JJ, et al. Management of aromatase inhibitor-associated bone loss in postmenopausal women with breast cancer: practical guidance for prevention and treatment. Ann Oncol 2011; 22:2546–2555.
- Hillner BE, Ingle JN, Chlebowski RT, et al; American Society of Clinical Oncology. American Society of Clinical Oncology 2003 update on the role of bisphosphonates and bone health issues in breast cancer. J Clin Oncol 2003; 21:4042–4057.
Drug-induced osteoporosis is common, and the list of drugs that can harm bone continues to grow. As part of routine health maintenance, practitioners should recognize the drugs that increase bone loss and take measures to mitigate these effects to help avoid osteopenia and osteoporosis.
Osteoporosis, a silent systemic disease defined by low bone mineral density and changes in skeletal microstructure, leads to a higher risk of fragility fractures. Some of the risk factors are well described, but less well known is the role of pharmacologic therapy. The implicated drugs (Table 1) have important therapeutic roles, so the benefits of using them must be weighed against their risks, including their potential effects on bone.
This review focuses on a few drugs known to increase fracture risk, their mechanisms of bone loss, and management considerations (Table 2).
GLUCOCORTICOIDS
Glucocorticoids are used to treat many medical conditions, including allergic, rheumatic, and other inflammatory diseases, and as immunosuppressive therapy after solid organ and bone marrow transplant. They are the most common cause of drug-induced bone loss and related secondary osteoporosis.
Multiple effects on bone
Glucocorticoids both increase bone resorption and decrease bone formation by a variety of mechanisms.1 They reduce intestinal calcium absorption, increase urinary excretion of calcium, and enhance osteocyte apoptosis, leading to deterioration of the bone microarchitecture and bone mineral density.2 They also affect sex hormones, decreasing testosterone production in men and estrogen in women, leading to increased bone resorption, altered bone architecture, and poorer bone quality.3,4 The bone loss is greater in trabecular bone (eg, the femoral neck and vertebral bodies) than in cortical bone (eg, the forearm).5
Glucocorticoids have other systemic effects that increase fracture risk. For example, they cause muscle weakness and atrophy, increasing the risk of falls.4 Additionally, many of the inflammatory conditions for which they are prescribed (eg, rheumatoid arthritis) also increase the risk of osteoporosis by means of proinflammatory cytokine production, which may contribute to systemic and local effects on bone.4,6
Bone mineral density declines quickly
Bone mineral density declines within the first 3 months after starting oral glucocorticoids, with the rate of bone loss peaking at 6 months. Up to 12% of bone mass is lost in the first year. In subsequent years of continued use, bone loss progresses at a slower, steadier rate, averaging 2% to 3% annually.5,7,8
Oral therapy increases fracture risk
Kanis et al9 performed a meta-analysis of seven prospective cohort studies in 40,000 patients and found that the current or previous use of an oral glucocorticoid increased the risk of fragility fractures, and that men and women were affected about equally.9
Van Staa et al10,11 reported that daily doses of glucocorticoids equivalent to more than 2.5 mg of prednisone were associated with an increased risk of vertebral and hip fractures; fracture risk was related mainly to daily dosage rather than cumulative dose.
Van Staa et al,12 in a retrospective cohort study, compared nearly 250,000 adult users of oral glucocorticoids from general medical practice settings with the same number of controls matched for sex, age, and medical practice. The relative risks for fractures and 95% confidence intervals (CIs) during oral glucocorticoid treatment were as follows:
- Forearm fracture 1.09 (1.01–1.17)
- Nonvertebral fracture 1.33 (1.29–1.38)
- Hip fracture 1.61 (1.47–1.76)
- Vertebral fracture 2.60 (2.31–2.92).
The risk was dose-dependent. For a low daily dose (< 2.5 mg/day of prednisolone), the relative risks were:
- Hip fracture 0.99 (0.82–1.20)
- Vertebral fracture 1.55 (1.20–2.01) .
For a medium daily dose (2.5–7.5 mg/day), the relative risks were:
- Hip fracture 1.77 (1.55–2.02)
- Vertebral fracture 2.59 (2.16–3.10) .
For a high daily dose (> 7.5 mg/day), the relative risks were:
- Hip fracture 2.27 (1.94–2.66)
- Vertebral fracture 5.18 (4.25–6.31).
Fracture risk rapidly declined toward baseline after the patients stopped taking oral glucocorticoids but did not return to baseline levels. The lessening of excess fracture risk occurred mainly within the first year after stopping therapy.
Other studies5,9,13 have suggested that the increased fracture risk is mostly independent of bone mineral density, and that other mechanisms are at play. One study14 found that oral glucocorticoid users with a prevalent vertebral fracture actually had higher bone mineral density than patients with a fracture not taking glucocorticoids, although this finding was not confirmed in a subsequent study.15
Inhaled glucocorticoids have less effect on bone
Inhaled glucocorticoids are commonly used to treat chronic obstructive pulmonary disease and asthma. They do not have the same systemic bioavailability as oral glucocorticoids, so the risk of adverse effects is lower.
Data are inconsistent among several studies that evaluated the relationship between inhaled glucocorticoids, bone mineral density, osteoporosis, and fragility fracture. The inconsistencies may be due to heterogeneity of the study populations, self-reporting of fractures, and different methods of assessing chronic obstructive pulmonary disease severity.16
A Cochrane review17 in 2002 evaluated seven randomized controlled trials that compared the use of inhaled glucocorticoids vs placebo in nearly 2,000 patients with mild asthma or chronic obstructive pulmonary disease and found no evidence for decreased bone mineral density, increased bone turnover, or increased vertebral fracture incidence in the glucocorticoid users at 2 to 3 years of follow-up (odds ratio for fracture 1.87, 95% CI 0.5–7.0).
The Evaluation of Obstructive Lung Disease and Osteoporosis study,16 a multicenter Italian observational epidemiologic study, reported that patients taking the highest daily doses of inhaled glucocorticoids (> 1,500 μg of beclomethasone or its equivalent) had a significantly higher risk of vertebral fracture (odds ratio 1.4, 95% CI 1.04–1.89).16
A meta-analysis18 of five case-control studies (43,783 cases and 259,936 controls) identified a possible dose-dependent relationship, with a relative risk for nonvertebral fracture of 1.12 (95% CI 1.0–1.26) for each 1,000-μg increase in beclomethasone-equivalent inhaled glucocorticoid per day.
In summary, the effects of inhaled glucocorticoids in adults are uncertain, although trends toward increased fracture risk and decreased bone mineral density are evident with chronic therapy at moderate to high dosages. The risks and benefits of treatment should be carefully considered in patients with osteoporosis and baseline elevated fracture risk.19
Managing the risk of glucocorticoid-induced osteoporosis
In 2010, the American College of Rheumatology published recommendations for preventing and treating glucocorticoid-induced osteoporosis, which were endorsed by the American Society for Bone and Mineral Research.20 To lessen the risk of osteoporosis, the recommendations are as follows:
Limit exposure. Patients receiving glucocorticoids should be given the smallest dosage for the shortest duration possible.
Advise lifestyle changes. Patients should be counseled to limit their alcohol intake to no more than two drinks per day, to quit smoking, to engage in weight-bearing exercise, and to ingest enough calcium (1,200–1,500 mg/day, through diet and supplements) and vitamin D.
Monitor bone mineral density. Patients starting glucocorticoids at any dosage for an expected duration of at least 3 months should have their bone mineral density measured at baseline. The frequency of subsequent measurements should be based on the presence of other risk factors for fracture, results of previous bone density testing, glucocorticoid dosage, whether therapy for bone health has been initiated, and the rate of change in bone mineral density. If warranted and if the results would lead to a change in management, patients can undergo dual-energy x-ray absorptiometry more often than usual, ie, more often than every 2 years. Prevalent and incident fragility fractures, height measurements, fall risk assessments, laboratory measurements of 25-hydroxyvitamin D, and consideration of vertebral fracture assessment or other imaging of the spine, as necessary, should be part of counseling and monitoring.
Osteoporosis treatment. For patients who will be taking glucocorticoids for at least 3 months, alendronate, risedronate, zoledronic acid, or teriparatide can be initiated to prevent or treat osteoporosis in the following groups:
- Postmenopausal women and men over age 50 if the daily glucocorticoid dosage is at least 7.5 mg/day or if the World Health Organization Fracture Risk Assessment Tool (FRAX) score is more than 10% (the threshold for medium fracture risk)
- Premenopausal women and men younger than 50 if they have a history of fragility fracture, the FRAX score is more than 20% (the threshold for high fracture risk), or the T score is less than –2.5.
Certain clinical factors can also put a patient into a higher-risk category. These include current tobacco use, low body mass index, parental history of hip fracture, consuming more than three alcoholic drinks daily, higher daily or cumulative glucocorticoid dosage, intravenous pulse glucocorticoid usage, or a decline in central bone mineral density that exceeds the least significant change according to the scanner used.20
The FRAX tool accounts for bone density only at the femoral neck, and while useful, it cannot replace clinical judgment in stratifying risk. Moreover, it does not apply to premenopausal women or men under age 40.
The long-term risks of medications to treat glucocorticoid-induced osteoporosis are not well defined for premenopausal women (or their unborn children) or in men younger than 40, so treatment is recommended in those groups only for those with prevalent fragility fractures who are clearly at higher risk of additional fractures.20
PROTON PUMP INHIBITORS
Proton pump inhibitors are available by prescription and over the counter for gastric acid-related conditions. Concerns have been raised that these highly effective drugs are overused.21 Several of their adverse effects are self-limited and minor, but long-term use may entail serious risks, including propensity to bone fracture.22
Low acid leads to poor calcium absorption
Why fracture risk increases with proton pump inhibitors is controversial and may relate to their desired effect of suppressing gastric acid production: calcium salts, including carbonate and chloride, are poorly soluble and require an acidic environment to increase calcium ionization and thus absorption.23 For this reason, if patients taking a proton pump inhibitor take a calcium supplement, it should be calcium citrate, which unlike calcium carbonate does not require an acid environment for absorption.
Higher risk in older patients, with longer use, and with higher dosage
Since the first reports on proton pump inhibitors and fracture risk were published in 2006,24,25 a number of studies have reported this association, including several systematic reviews.
In 2011, the US Food and Drug Administration (FDA) updated a 2010 safety communication based on seven epidemiologic studies reporting an increased risk of fractures of the spine, hip, and wrist with proton pump inhibitors.24–31 Time of exposure to a proton pump inhibitor in these studies varied from 1 to 12 years. Fracture risk was higher in older patients,26 with higher doses,24,29 and with longer duration of drug use.24,27 On the other hand, one study that included only patients without other major fracture risk factors failed to find an association between the use of proton pump inhibitors and fractures.28
Is evidence sufficient for changing use?
The FDA report included a disclaimer that they had no access to study data or protocols and so could not verify the findings.26 Moreover, the studies used claims data from computerized databases to evaluate the risk of fractures in patients treated with proton pump inhibitors compared with those not using these drugs.24–31 Information was often incomplete regarding potentially important factors (eg, falls, family history of osteoporosis, calcium and vitamin D intake, smoking, alcohol use, reason for medication use), as well as the timing of drug use related to the onset or worsening of osteoporosis.26
Although 34 published studies evaluated the association of fracture risk and proton pump inhibitors, Leontiadis and Moayyedi32 argued that insufficient evidence exists to change our prescribing habits for these drugs based on fracture risk, as the studies varied considerably in their designs and results, a clear dose-response relationship is lacking, and the modest association is likely related to multiple confounders.
Bottom line: Use with caution
Although the increased fracture risk associated with proton pump inhibitors is likely multifactorial and is not fully delineated, it appears to be real. These drugs should be used only if there is a clear indication for them and if their benefits likely outweigh their risks. The lowest effective dose should be used, and the need for continuing use should be frequently reassessed.
SELECTIVE SEROTONIN REUPTAKE INHIBITORS
Depression affects 1 in 10 people in the United States, is especially common in the elderly, and leads to significant morbidity and reduced quality of life.33 Selective serotonin reuptake inhibitors (SSRIs) are often prescribed and are generally considered first-line agents for treating depression.
Complex bone effects
SSRIs antagonize the serotonin transporter, which normally assists serotonin uptake from the extracellular space. The serotonin transporter is found in all main types of bone cells, including osteoclasts, osteoblasts, and osteocytes.33 Serotonin is made by different genes in the brain than in the periphery, causing opposing effects on bone biology: when generated peripherally, it acts as a hormone to inhibit bone formation, while when generated in the brain, it acts as a neurotransmitter to create a major and positive effect on bone mass accrual by enhancing bone formation and limiting bone resorption.34,35
Potential confounders complicate the effect of SSRIs on bone health, as depression itself may be a risk factor for fracture. Patients with depression tend to have increased inflammation and cortisol, decreased gonadal steroids, more behavioral risk factors such as tobacco and increased alcohol use, and less physical activity, all of which can contribute to low bone density and risk of falls and fractures.33
Daily use of SSRIs increases fracture risk
A 2012 meta-analysis36 of 12 studies (seven case-control and five cohort), showed that SSRI users had a higher overall risk of fracture (adjusted odds ratio 1.69, 95% CI 1.51–1.90). By anatomic site, pooled odds ratios and 95% CIs were:
- Vertebral fractures 1.34 (1.13–1.59)
- Wrist or forearm fractures 1.51 (1.26–1.82)
- Hip or femur fractures 2.06 (1.84–2.30).
A 2013 meta-analysis37 of 34 studies with more than 1 million patients found that the random-effects pooled relative risk of all fracture types in users of antidepressants (including but not limited to SSRIs) was 1.39 (95% CI 1.32–1.47) compared with nonusers. Relative risks and 95% CIs in antidepressant users were:
- Vertebral fractures 1.38 (1.19–1.61)
- Nonvertebral fractures 1.42 (1.34–1.51)
- Hip fractures 1.47 (1.36–1.58).
A population-based, prospective cohort study38 of 5,008 community-dwelling adults age 50 and older, followed for 5 years, found that the daily use of SSRIs was associated with a twofold increased risk of clinical fragility fractures (defined as minimal trauma fractures that were clinically reported and radiographically confirmed) after adjusting for potential covariates. Daily SSRI use was also associated with an increased risk of falling (odds ratio 2.2, 95% CI 1.4–3.5), lower bone mineral density at the hip, and a trend toward lower bone mineral density at the spine. These effects were dose-dependent and were similar for those who reported taking SSRIs at baseline and at 5 years.
Bottom line: Counsel bone health
Although no guidelines exist for preventing or treating SSRI-induced bone loss, providers should discuss with patients the potential effect of these medications on bone health, taking into account patient age, severity of depression, sex, duration of use, length of SSRI treatment, and other clinical risk factors for osteoporosis.34 Given the widespread use of these medications for treating depression, more study into this association is needed to further guide providers.
ANTIEPILEPTIC DRUGS
Antiepileptic drugs are used to treat not only seizure disorders but also migraine headaches, neuropathy, and psychiatric and pain disorders. Many studies have linked their use to an increased risk of fractures.
The mechanism of this effect remains controversial. Early studies reported that inducers of cytochrome P450 enzymes (eg, phenobarbital, phenytoin) lead to increased vitamin D degradation, causing osteomalacia.39 Another study suggested that changes in calcium metabolism and reduced bone mineral density occur without vitamin D deficiency and that drugs such as valproate that do not induce cytochrome P450 enzymes may also affect bone health.40 Other bone effects may include direct inhibition of intestinal calcium absorption (seen in animal studies) and the induction of a high remodeling state leading to osteomalacia.41,42
Epilepsy itself increases risk of fractures
Patients with seizure disorders may also have an increased risk of fractures because of falls, trauma, impaired balance, use of glucocorticoids and benzodiazepines, and comorbid conditions (eg, mental retardation, cerebral palsy, and brain neoplasm).43
A 2005 meta-analysis43 of 11 studies of epilepsy and fracture risk and 12 studies of epilepsy and bone mineral density found that the risks of fractures were increased. The following relative risks and 95% CIs were noted:
- Any fracture 2.2 (1.9–2.5), in five studies
- Forearm 1.7 (1.2–2.3), in six studies
- Hip 5.3 (3.2–8.8), six studies
- Spine 6.2 (2.5–15.5), in three studies.
A large proportion of fractures (35%) seemed related to seizures.
Certain drugs increase risk
A large 2004 population-based, case-control, study44 (124,655 fracture cases and 373,962 controls) found an association between the use of antiepileptic drugs and increased fracture risk. After adjusting for current or prior use of glucocorticoids, prior fracture, social variables, comorbid conditions, and epilepsy diagnosis, excess fracture risk was found to be associated with the following drugs (odds ratios and 95% CIs):
- Oxcarbazepine 1.14 (1.03–1.26)
- Valproate 1.15 (1.05–1.26)
- Carbamazepine 1.18 (1.10-1.26)
- Phenobarbital 1.79 (1.64–1.95).
The risk was higher with higher doses. Fracture risk was higher with cytochrome P450 enzyme-inducing drugs (carbamazepine, oxcarbazepine, phenobarbital, phenytoin, and primidone; odds ratio 1.38, 95% CI 1.31–1.45) than for noninducing drugs (clonazepam, ethosuximide, lamotrigine, tiagabine, topiramate, valproate, and vigabatrin; odds ratio 1.19, 95% CI 1.11–1.27). No significant increased risk of fracture was found with use of phenytoin, tiagabine, topiramate, ethosuximide, lamotrigine, vigabatrin, or primidone after adjusting for confounders.
Bottom line: Monitor bone health
With antiepileptic drugs, the benefit of preventing seizures outweighs the risks of fractures. Patients on long-term antiepileptic drug therapy should be monitored for bone mineral density and vitamin D levels and receive counseling on lifestyle measures including tobacco cessation, alcohol moderation, and fall prevention.45 As there are no evidence-based guidelines for bone health in patients on antiepileptic drugs, management should be based on current guidelines for treating osteoporosis.
AROMATASE INHIBITORS
Breast cancer is the most common cancer in women and is the second-leading cause of cancer-associated deaths in women after lung cancer. Aromatase inhibitors, such as anastrozole, letrozole, and exemestane, are the standard of care in adjuvant treatment for hormone-receptor-positive breast cancer, leading to longer disease-free survival.
However, aromatase inhibitors increase bone loss and fracture risk, and only partial recovery of bone mineral density occurs after treatment is stopped. The drugs deter the aromatization of androgens and their conversion to estrogens in peripheral tissue, leading to reduced estrogen levels and resulting bone loss.46 Anastrozole and letrozole have been found to reduce bone mineral density, increase bone turnover, and increase the relative risk for nonvertebral and vertebral fractures in postmenopausal women by 40% compared with tamoxifen.47,48
Base osteoporosis treatment on risk
Several groups have issued guidelines for preventing and treating bone loss in postmenopausal women being treated with an aromatase inhibitor. When initiating treatment, women should be counseled about modifiable risk factors, exercise, and calcium and vitamin D supplementation.
Baseline bone mineral testing should also be obtained when starting treatment. Hadji et al,49 in a review article, recommend starting bone-directed therapy if the patient’s T score is less than –2.0 (using the lowest score from three sites) or if she has any of at least two of the following fracture risk factors:
- T score less than –1.5
- Age over 65
- Family history of hip fracture
- Personal history of fragility fracture after age 50
- Low body mass index (< 20 kg/m2)
- Current or prior history of tobacco use
- Oral glucocorticoid use for longer than 6 months.
Patients with a T score at or above –2.0 and no risk factors should have bone mineral density reassessed after 1 to 2 years. Antiresorptive therapy with intravenous zoledronic acid and evaluation for other secondary causes of bone loss should be initiated for either:
- An annual decrease of at least 10% or
- An annual decrease of at least 4% in patients with osteopenia at baseline.49
In 2003, the American Society of Clinical Oncology updated its recommendations on the role of bisphosphonates and bone health in women with breast cancer.50 They recommend the following:
- If the T score is –2.5 or less, prescribe a bisphosphonate (alendronate, risedronate, or zoledronic acid)
- If the T score is –1.0 to –2.5, tailor treatment individually and monitor bone mineral density annually
- If the T score is greater than –1.0, monitor bone mineral density annually.
All patients should receive lifestyle counseling, calcium and vitamin D supplementation, and monitoring of additional risk factors for osteoporosis as appropriate.50
Drug-induced osteoporosis is common, and the list of drugs that can harm bone continues to grow. As part of routine health maintenance, practitioners should recognize the drugs that increase bone loss and take measures to mitigate these effects to help avoid osteopenia and osteoporosis.
Osteoporosis, a silent systemic disease defined by low bone mineral density and changes in skeletal microstructure, leads to a higher risk of fragility fractures. Some of the risk factors are well described, but less well known is the role of pharmacologic therapy. The implicated drugs (Table 1) have important therapeutic roles, so the benefits of using them must be weighed against their risks, including their potential effects on bone.
This review focuses on a few drugs known to increase fracture risk, their mechanisms of bone loss, and management considerations (Table 2).
GLUCOCORTICOIDS
Glucocorticoids are used to treat many medical conditions, including allergic, rheumatic, and other inflammatory diseases, and as immunosuppressive therapy after solid organ and bone marrow transplant. They are the most common cause of drug-induced bone loss and related secondary osteoporosis.
Multiple effects on bone
Glucocorticoids both increase bone resorption and decrease bone formation by a variety of mechanisms.1 They reduce intestinal calcium absorption, increase urinary excretion of calcium, and enhance osteocyte apoptosis, leading to deterioration of the bone microarchitecture and bone mineral density.2 They also affect sex hormones, decreasing testosterone production in men and estrogen in women, leading to increased bone resorption, altered bone architecture, and poorer bone quality.3,4 The bone loss is greater in trabecular bone (eg, the femoral neck and vertebral bodies) than in cortical bone (eg, the forearm).5
Glucocorticoids have other systemic effects that increase fracture risk. For example, they cause muscle weakness and atrophy, increasing the risk of falls.4 Additionally, many of the inflammatory conditions for which they are prescribed (eg, rheumatoid arthritis) also increase the risk of osteoporosis by means of proinflammatory cytokine production, which may contribute to systemic and local effects on bone.4,6
Bone mineral density declines quickly
Bone mineral density declines within the first 3 months after starting oral glucocorticoids, with the rate of bone loss peaking at 6 months. Up to 12% of bone mass is lost in the first year. In subsequent years of continued use, bone loss progresses at a slower, steadier rate, averaging 2% to 3% annually.5,7,8
Oral therapy increases fracture risk
Kanis et al9 performed a meta-analysis of seven prospective cohort studies in 40,000 patients and found that the current or previous use of an oral glucocorticoid increased the risk of fragility fractures, and that men and women were affected about equally.9
Van Staa et al10,11 reported that daily doses of glucocorticoids equivalent to more than 2.5 mg of prednisone were associated with an increased risk of vertebral and hip fractures; fracture risk was related mainly to daily dosage rather than cumulative dose.
Van Staa et al,12 in a retrospective cohort study, compared nearly 250,000 adult users of oral glucocorticoids from general medical practice settings with the same number of controls matched for sex, age, and medical practice. The relative risks for fractures and 95% confidence intervals (CIs) during oral glucocorticoid treatment were as follows:
- Forearm fracture 1.09 (1.01–1.17)
- Nonvertebral fracture 1.33 (1.29–1.38)
- Hip fracture 1.61 (1.47–1.76)
- Vertebral fracture 2.60 (2.31–2.92).
The risk was dose-dependent. For a low daily dose (< 2.5 mg/day of prednisolone), the relative risks were:
- Hip fracture 0.99 (0.82–1.20)
- Vertebral fracture 1.55 (1.20–2.01) .
For a medium daily dose (2.5–7.5 mg/day), the relative risks were:
- Hip fracture 1.77 (1.55–2.02)
- Vertebral fracture 2.59 (2.16–3.10) .
For a high daily dose (> 7.5 mg/day), the relative risks were:
- Hip fracture 2.27 (1.94–2.66)
- Vertebral fracture 5.18 (4.25–6.31).
Fracture risk rapidly declined toward baseline after the patients stopped taking oral glucocorticoids but did not return to baseline levels. The lessening of excess fracture risk occurred mainly within the first year after stopping therapy.
Other studies5,9,13 have suggested that the increased fracture risk is mostly independent of bone mineral density, and that other mechanisms are at play. One study14 found that oral glucocorticoid users with a prevalent vertebral fracture actually had higher bone mineral density than patients with a fracture not taking glucocorticoids, although this finding was not confirmed in a subsequent study.15
Inhaled glucocorticoids have less effect on bone
Inhaled glucocorticoids are commonly used to treat chronic obstructive pulmonary disease and asthma. They do not have the same systemic bioavailability as oral glucocorticoids, so the risk of adverse effects is lower.
Data are inconsistent among several studies that evaluated the relationship between inhaled glucocorticoids, bone mineral density, osteoporosis, and fragility fracture. The inconsistencies may be due to heterogeneity of the study populations, self-reporting of fractures, and different methods of assessing chronic obstructive pulmonary disease severity.16
A Cochrane review17 in 2002 evaluated seven randomized controlled trials that compared the use of inhaled glucocorticoids vs placebo in nearly 2,000 patients with mild asthma or chronic obstructive pulmonary disease and found no evidence for decreased bone mineral density, increased bone turnover, or increased vertebral fracture incidence in the glucocorticoid users at 2 to 3 years of follow-up (odds ratio for fracture 1.87, 95% CI 0.5–7.0).
The Evaluation of Obstructive Lung Disease and Osteoporosis study,16 a multicenter Italian observational epidemiologic study, reported that patients taking the highest daily doses of inhaled glucocorticoids (> 1,500 μg of beclomethasone or its equivalent) had a significantly higher risk of vertebral fracture (odds ratio 1.4, 95% CI 1.04–1.89).16
A meta-analysis18 of five case-control studies (43,783 cases and 259,936 controls) identified a possible dose-dependent relationship, with a relative risk for nonvertebral fracture of 1.12 (95% CI 1.0–1.26) for each 1,000-μg increase in beclomethasone-equivalent inhaled glucocorticoid per day.
In summary, the effects of inhaled glucocorticoids in adults are uncertain, although trends toward increased fracture risk and decreased bone mineral density are evident with chronic therapy at moderate to high dosages. The risks and benefits of treatment should be carefully considered in patients with osteoporosis and baseline elevated fracture risk.19
Managing the risk of glucocorticoid-induced osteoporosis
In 2010, the American College of Rheumatology published recommendations for preventing and treating glucocorticoid-induced osteoporosis, which were endorsed by the American Society for Bone and Mineral Research.20 To lessen the risk of osteoporosis, the recommendations are as follows:
Limit exposure. Patients receiving glucocorticoids should be given the smallest dosage for the shortest duration possible.
Advise lifestyle changes. Patients should be counseled to limit their alcohol intake to no more than two drinks per day, to quit smoking, to engage in weight-bearing exercise, and to ingest enough calcium (1,200–1,500 mg/day, through diet and supplements) and vitamin D.
Monitor bone mineral density. Patients starting glucocorticoids at any dosage for an expected duration of at least 3 months should have their bone mineral density measured at baseline. The frequency of subsequent measurements should be based on the presence of other risk factors for fracture, results of previous bone density testing, glucocorticoid dosage, whether therapy for bone health has been initiated, and the rate of change in bone mineral density. If warranted and if the results would lead to a change in management, patients can undergo dual-energy x-ray absorptiometry more often than usual, ie, more often than every 2 years. Prevalent and incident fragility fractures, height measurements, fall risk assessments, laboratory measurements of 25-hydroxyvitamin D, and consideration of vertebral fracture assessment or other imaging of the spine, as necessary, should be part of counseling and monitoring.
Osteoporosis treatment. For patients who will be taking glucocorticoids for at least 3 months, alendronate, risedronate, zoledronic acid, or teriparatide can be initiated to prevent or treat osteoporosis in the following groups:
- Postmenopausal women and men over age 50 if the daily glucocorticoid dosage is at least 7.5 mg/day or if the World Health Organization Fracture Risk Assessment Tool (FRAX) score is more than 10% (the threshold for medium fracture risk)
- Premenopausal women and men younger than 50 if they have a history of fragility fracture, the FRAX score is more than 20% (the threshold for high fracture risk), or the T score is less than –2.5.
Certain clinical factors can also put a patient into a higher-risk category. These include current tobacco use, low body mass index, parental history of hip fracture, consuming more than three alcoholic drinks daily, higher daily or cumulative glucocorticoid dosage, intravenous pulse glucocorticoid usage, or a decline in central bone mineral density that exceeds the least significant change according to the scanner used.20
The FRAX tool accounts for bone density only at the femoral neck, and while useful, it cannot replace clinical judgment in stratifying risk. Moreover, it does not apply to premenopausal women or men under age 40.
The long-term risks of medications to treat glucocorticoid-induced osteoporosis are not well defined for premenopausal women (or their unborn children) or in men younger than 40, so treatment is recommended in those groups only for those with prevalent fragility fractures who are clearly at higher risk of additional fractures.20
PROTON PUMP INHIBITORS
Proton pump inhibitors are available by prescription and over the counter for gastric acid-related conditions. Concerns have been raised that these highly effective drugs are overused.21 Several of their adverse effects are self-limited and minor, but long-term use may entail serious risks, including propensity to bone fracture.22
Low acid leads to poor calcium absorption
Why fracture risk increases with proton pump inhibitors is controversial and may relate to their desired effect of suppressing gastric acid production: calcium salts, including carbonate and chloride, are poorly soluble and require an acidic environment to increase calcium ionization and thus absorption.23 For this reason, if patients taking a proton pump inhibitor take a calcium supplement, it should be calcium citrate, which unlike calcium carbonate does not require an acid environment for absorption.
Higher risk in older patients, with longer use, and with higher dosage
Since the first reports on proton pump inhibitors and fracture risk were published in 2006,24,25 a number of studies have reported this association, including several systematic reviews.
In 2011, the US Food and Drug Administration (FDA) updated a 2010 safety communication based on seven epidemiologic studies reporting an increased risk of fractures of the spine, hip, and wrist with proton pump inhibitors.24–31 Time of exposure to a proton pump inhibitor in these studies varied from 1 to 12 years. Fracture risk was higher in older patients,26 with higher doses,24,29 and with longer duration of drug use.24,27 On the other hand, one study that included only patients without other major fracture risk factors failed to find an association between the use of proton pump inhibitors and fractures.28
Is evidence sufficient for changing use?
The FDA report included a disclaimer that they had no access to study data or protocols and so could not verify the findings.26 Moreover, the studies used claims data from computerized databases to evaluate the risk of fractures in patients treated with proton pump inhibitors compared with those not using these drugs.24–31 Information was often incomplete regarding potentially important factors (eg, falls, family history of osteoporosis, calcium and vitamin D intake, smoking, alcohol use, reason for medication use), as well as the timing of drug use related to the onset or worsening of osteoporosis.26
Although 34 published studies evaluated the association of fracture risk and proton pump inhibitors, Leontiadis and Moayyedi32 argued that insufficient evidence exists to change our prescribing habits for these drugs based on fracture risk, as the studies varied considerably in their designs and results, a clear dose-response relationship is lacking, and the modest association is likely related to multiple confounders.
Bottom line: Use with caution
Although the increased fracture risk associated with proton pump inhibitors is likely multifactorial and is not fully delineated, it appears to be real. These drugs should be used only if there is a clear indication for them and if their benefits likely outweigh their risks. The lowest effective dose should be used, and the need for continuing use should be frequently reassessed.
SELECTIVE SEROTONIN REUPTAKE INHIBITORS
Depression affects 1 in 10 people in the United States, is especially common in the elderly, and leads to significant morbidity and reduced quality of life.33 Selective serotonin reuptake inhibitors (SSRIs) are often prescribed and are generally considered first-line agents for treating depression.
Complex bone effects
SSRIs antagonize the serotonin transporter, which normally assists serotonin uptake from the extracellular space. The serotonin transporter is found in all main types of bone cells, including osteoclasts, osteoblasts, and osteocytes.33 Serotonin is made by different genes in the brain than in the periphery, causing opposing effects on bone biology: when generated peripherally, it acts as a hormone to inhibit bone formation, while when generated in the brain, it acts as a neurotransmitter to create a major and positive effect on bone mass accrual by enhancing bone formation and limiting bone resorption.34,35
Potential confounders complicate the effect of SSRIs on bone health, as depression itself may be a risk factor for fracture. Patients with depression tend to have increased inflammation and cortisol, decreased gonadal steroids, more behavioral risk factors such as tobacco and increased alcohol use, and less physical activity, all of which can contribute to low bone density and risk of falls and fractures.33
Daily use of SSRIs increases fracture risk
A 2012 meta-analysis36 of 12 studies (seven case-control and five cohort), showed that SSRI users had a higher overall risk of fracture (adjusted odds ratio 1.69, 95% CI 1.51–1.90). By anatomic site, pooled odds ratios and 95% CIs were:
- Vertebral fractures 1.34 (1.13–1.59)
- Wrist or forearm fractures 1.51 (1.26–1.82)
- Hip or femur fractures 2.06 (1.84–2.30).
A 2013 meta-analysis37 of 34 studies with more than 1 million patients found that the random-effects pooled relative risk of all fracture types in users of antidepressants (including but not limited to SSRIs) was 1.39 (95% CI 1.32–1.47) compared with nonusers. Relative risks and 95% CIs in antidepressant users were:
- Vertebral fractures 1.38 (1.19–1.61)
- Nonvertebral fractures 1.42 (1.34–1.51)
- Hip fractures 1.47 (1.36–1.58).
A population-based, prospective cohort study38 of 5,008 community-dwelling adults age 50 and older, followed for 5 years, found that the daily use of SSRIs was associated with a twofold increased risk of clinical fragility fractures (defined as minimal trauma fractures that were clinically reported and radiographically confirmed) after adjusting for potential covariates. Daily SSRI use was also associated with an increased risk of falling (odds ratio 2.2, 95% CI 1.4–3.5), lower bone mineral density at the hip, and a trend toward lower bone mineral density at the spine. These effects were dose-dependent and were similar for those who reported taking SSRIs at baseline and at 5 years.
Bottom line: Counsel bone health
Although no guidelines exist for preventing or treating SSRI-induced bone loss, providers should discuss with patients the potential effect of these medications on bone health, taking into account patient age, severity of depression, sex, duration of use, length of SSRI treatment, and other clinical risk factors for osteoporosis.34 Given the widespread use of these medications for treating depression, more study into this association is needed to further guide providers.
ANTIEPILEPTIC DRUGS
Antiepileptic drugs are used to treat not only seizure disorders but also migraine headaches, neuropathy, and psychiatric and pain disorders. Many studies have linked their use to an increased risk of fractures.
The mechanism of this effect remains controversial. Early studies reported that inducers of cytochrome P450 enzymes (eg, phenobarbital, phenytoin) lead to increased vitamin D degradation, causing osteomalacia.39 Another study suggested that changes in calcium metabolism and reduced bone mineral density occur without vitamin D deficiency and that drugs such as valproate that do not induce cytochrome P450 enzymes may also affect bone health.40 Other bone effects may include direct inhibition of intestinal calcium absorption (seen in animal studies) and the induction of a high remodeling state leading to osteomalacia.41,42
Epilepsy itself increases risk of fractures
Patients with seizure disorders may also have an increased risk of fractures because of falls, trauma, impaired balance, use of glucocorticoids and benzodiazepines, and comorbid conditions (eg, mental retardation, cerebral palsy, and brain neoplasm).43
A 2005 meta-analysis43 of 11 studies of epilepsy and fracture risk and 12 studies of epilepsy and bone mineral density found that the risks of fractures were increased. The following relative risks and 95% CIs were noted:
- Any fracture 2.2 (1.9–2.5), in five studies
- Forearm 1.7 (1.2–2.3), in six studies
- Hip 5.3 (3.2–8.8), six studies
- Spine 6.2 (2.5–15.5), in three studies.
A large proportion of fractures (35%) seemed related to seizures.
Certain drugs increase risk
A large 2004 population-based, case-control, study44 (124,655 fracture cases and 373,962 controls) found an association between the use of antiepileptic drugs and increased fracture risk. After adjusting for current or prior use of glucocorticoids, prior fracture, social variables, comorbid conditions, and epilepsy diagnosis, excess fracture risk was found to be associated with the following drugs (odds ratios and 95% CIs):
- Oxcarbazepine 1.14 (1.03–1.26)
- Valproate 1.15 (1.05–1.26)
- Carbamazepine 1.18 (1.10-1.26)
- Phenobarbital 1.79 (1.64–1.95).
The risk was higher with higher doses. Fracture risk was higher with cytochrome P450 enzyme-inducing drugs (carbamazepine, oxcarbazepine, phenobarbital, phenytoin, and primidone; odds ratio 1.38, 95% CI 1.31–1.45) than for noninducing drugs (clonazepam, ethosuximide, lamotrigine, tiagabine, topiramate, valproate, and vigabatrin; odds ratio 1.19, 95% CI 1.11–1.27). No significant increased risk of fracture was found with use of phenytoin, tiagabine, topiramate, ethosuximide, lamotrigine, vigabatrin, or primidone after adjusting for confounders.
Bottom line: Monitor bone health
With antiepileptic drugs, the benefit of preventing seizures outweighs the risks of fractures. Patients on long-term antiepileptic drug therapy should be monitored for bone mineral density and vitamin D levels and receive counseling on lifestyle measures including tobacco cessation, alcohol moderation, and fall prevention.45 As there are no evidence-based guidelines for bone health in patients on antiepileptic drugs, management should be based on current guidelines for treating osteoporosis.
AROMATASE INHIBITORS
Breast cancer is the most common cancer in women and is the second-leading cause of cancer-associated deaths in women after lung cancer. Aromatase inhibitors, such as anastrozole, letrozole, and exemestane, are the standard of care in adjuvant treatment for hormone-receptor-positive breast cancer, leading to longer disease-free survival.
However, aromatase inhibitors increase bone loss and fracture risk, and only partial recovery of bone mineral density occurs after treatment is stopped. The drugs deter the aromatization of androgens and their conversion to estrogens in peripheral tissue, leading to reduced estrogen levels and resulting bone loss.46 Anastrozole and letrozole have been found to reduce bone mineral density, increase bone turnover, and increase the relative risk for nonvertebral and vertebral fractures in postmenopausal women by 40% compared with tamoxifen.47,48
Base osteoporosis treatment on risk
Several groups have issued guidelines for preventing and treating bone loss in postmenopausal women being treated with an aromatase inhibitor. When initiating treatment, women should be counseled about modifiable risk factors, exercise, and calcium and vitamin D supplementation.
Baseline bone mineral testing should also be obtained when starting treatment. Hadji et al,49 in a review article, recommend starting bone-directed therapy if the patient’s T score is less than –2.0 (using the lowest score from three sites) or if she has any of at least two of the following fracture risk factors:
- T score less than –1.5
- Age over 65
- Family history of hip fracture
- Personal history of fragility fracture after age 50
- Low body mass index (< 20 kg/m2)
- Current or prior history of tobacco use
- Oral glucocorticoid use for longer than 6 months.
Patients with a T score at or above –2.0 and no risk factors should have bone mineral density reassessed after 1 to 2 years. Antiresorptive therapy with intravenous zoledronic acid and evaluation for other secondary causes of bone loss should be initiated for either:
- An annual decrease of at least 10% or
- An annual decrease of at least 4% in patients with osteopenia at baseline.49
In 2003, the American Society of Clinical Oncology updated its recommendations on the role of bisphosphonates and bone health in women with breast cancer.50 They recommend the following:
- If the T score is –2.5 or less, prescribe a bisphosphonate (alendronate, risedronate, or zoledronic acid)
- If the T score is –1.0 to –2.5, tailor treatment individually and monitor bone mineral density annually
- If the T score is greater than –1.0, monitor bone mineral density annually.
All patients should receive lifestyle counseling, calcium and vitamin D supplementation, and monitoring of additional risk factors for osteoporosis as appropriate.50
- Canalis E, Delany AM. Mechanisms of glucocorticoid action in bone. Ann N Y Acad Sci 2002; 966:73–81.
- Manolagas SC. Corticosteroids and fractures: a close encounter of the third cell kind. J Bone Miner Res 2000; 15:1001–1005.
- Papaioannou A, Ferko NC, Adachi JD. Corticosteroids and the skeletal system. In: Lin AN, Paget SA, eds. Principles of corticosteroid therapy. New York, NY: Arnold Publishers; 2002:69–86.
- Van Staa TP. The pathogenesis, epidemiology, and management of glucocorticoid-induced osteoporosis. Calcif Tissue Int 2006; 79:129–137.
- Van Staa TP, Leufkens HG, Cooper C. The epidemiology of corticosteroid-induced osteoporosis: a meta-analysis. Osteoporosis Int 2002; 13:777–787.
- Clowes JA, Riggs BL, Khosla S. The role of the immune system in the pathophysiology of osteoporosis. Immunol Rev 2005; 208:207–227.
- LoCascio V, Bonucci E, Imbimbo B, et al. Bone loss in response to long-term glucocorticoid therapy. Bone Miner 1990; 8:39–51.
- Lane NE, Lukert B. The science and therapy of glucocorticoid-induced bone loss. Endocrinol Metab Clin North Am 1998; 27:465–483.
- Kanis JA, Johansson H, Oden A, et al. A meta-analysis of prior corticosteroid use and fracture risk. J Bone Miner Res 2004; 19:893–899.
- Van Staa TP, Geusens P, Pols HA, de Laet C, Leufkens HG, Cooper C. A simple score for estimating the long-term risk of fracture in patients using oral glucocorticoids. QJM 2005; 98:191–198.
- Van Staa TP, Leufkens HG, Abenhaim L, Zhang B, Cooper C. Oral corticosteroids and fracture risk: relationship to daily and cumulative doses. Rheumatology (Oxford) 2000; 39:1383–1389.
- Van Staa TP, Leufkens HG, Abenhaim L, Zhang B, Cooper C. Use of corticosteroids and risk of fractures. J Bone Miner Res 2000; 15:993–1000.
- Van Staa TP, Laan RF, Barton IP, Cohen S, Reid DM, Cooper C. Bone density threshold and other predictors of vertebral fracture in patients receiving oral glucocorticoid therapy. Arthritis Rheum 2003; 48:3224–3229.
- Luengo M, Picado C, Del Rio L, Guanabens N, Montserrat JM, Setoain J. Vertebral fractures in steroid dependent asthma and involutional osteoporosis: a comparative study. Thorax 1991; 46:803–806.
- Selby PL, Halsey JP, Adams KRH, et al. Corticosteroids do not alter the threshold for vertebral fracture. J Bone Miner Res 2000; 15:952–956.
- Gonnelli S, Caffarelli C, Maggi S, et al. Effect of inhaled glucocorticoids and beta(2) agonists on vertebral fracture risk in COPD patients: the EOLO study. Calcif Tissue Int 2010; 87:137–143.
- Jones A, Fay JK, Burr M, Stone M, Hood K, Roberts G. Inhaled corticosteroid effects on bone metabolism in asthma and mild chronic obstructive pulmonary disease. Cochrane Database Syst Rev 2002; 1:CD003537.
- Weatherall M, James K, Clay J, et al. Dose-response relationship for risk of non-vertebral fracture with inhaled corticosteroids. Clin Exp Allergy 2008; 38:1451–1458
- Buehring B, Viswanathan R, Binkley N, Busse W. Glucocorticoid-induced osteoporosis: an update on effects and management. J Allergy Clin Immunol 2013; 132:1019–1030.
- Grossman JM, Gordon R, Ranganath VK, et al. American College of Rheumatology 2010 recommendations for the prevention and treatment of glucocorticoid-induced osteoporosis. Arthritis Care Res (Hoboken) 2010; 62:1515–1526.
- Naunton M, Peterson GM, Bleasel MD. Overuse of proton pump inhibitors. J Clin Pharm Ther 2000; 25:333–340.
- Wilhelm SM, Rjater RG, Kale-Pradhan PB. Perils and pitfalls of long-term effects of proton pump inhibitors. Expert Rev Clin Pharmacol 2013; 6:443–451.
- Sheikh MS, Santa Ana CA, Nicar MJ, Schiller LR, Fordtran JS. Gastrointestinal absorption of calcium from milk and calcium salts. N Engl J Med 1987; 317:532–536.
- Yang YX, Lewis JD, Epstein S, Metz DC. Long-term proton pump inhibitor therapy and risk of hip fracture. JAMA 2006; 296:2947–2953.
- Vestergaard P, Rejnmark L, Mosekilde L. Proton pump inhibitors, histamine H2 receptor antagonists, and other antacid medications and the risk of fracture. Calcif Tissue Int 2006; 79:76–83.
- Food and Drug Administration (FDA). FDA drug safety communication: possible increased risk of fractures of the hip, wrist, and spine with the use of proton pump inhibitors. www.fda.gov/Drugs/DrugSafety/PostmarketDrugSafetyInformationforPatientsandProviders/ucm213206.htm. Accessed March 7, 2016.
- Targownik LE, Lix LM, Metge CJ, Prior HJ, Leung S, Leslie WD. Use of proton pump inhibitors and risk of osteoporosis-related fractures. CMAJ 2008; 179:319–326.
- Kaye JA, Jick H. Proton pump inhibitor use and risk of hip fractures in patients without major risk factors. Pharmacotherapy 2008; 28:951–959.
- Corley DA, Kubo A, Zhao W, Quesenberry C. Proton pump inhibitors and histamine-2 receptor antagonists are associated with hip fractures among at-risk patients. Gastroenterology 2010; 139:93–101.
- Gray SL, LaCroix AZ, Larson J, et al. Proton pump inhibitor use, hip fracture, and change in bone mineral density in postmenopausal women: results from the Women’s Health Initiative. Arch Intern Med 2010; 170:765–771.
- Yu EW, Blackwell T, Ensrud KE, et al. Acid-suppressive medications and risk of bone loss and fracture in older adults. Calcif Tissue Int 2008; 83:251–259.
- Leontiadis GI, Moayyedi P. Proton pump inhibitors and risk of bone fractures. Curr Treat Options Gastroenterol 2014; 12:414–423.
- Chen F, Hahn TJ, Weintraub NT. Do SSRIs play a role in decreasing bone mineral density? J Am Med Dir Assoc 2012; 13:413–417.
- Bruyere O, Reginster JY. Osteoporosis in patients taking selective serotonin reuptake inhibitors: a focus on fracture outcome. Endocrine 2015; 48:65–68.
- Ducy P, Karsenty G. The two faces of serotonin in bone biology. J Cell Biol 2010; 191:7–13.
- Eom CS, Lee HK, Ye S, Park SM, Cho KH. Use of selective serotonin reuptake inhibitors and risk of fracture: a systematic review and meta-analysis. J Bone Miner Res 2012; 27:1186–1195.
- Rabenda V, Nicolet D, Beaudart C, Bruyere O, Reginster JY. Relationship between use of antidepressants and risk of fractures: a meta-analysis. Osteoporosis Int 2013; 24:121–137.
- Richards JB, Papaioannou A, Adachi JD, et al; Canadian Multicentre Osteoporosis Study Research Group. Effect of selective serotonin reuptake inhibitors on the risk of fracture. Arch Intern Med 2007; 22;167:188–194.
- Hahn TJ, Hendin BA, Scharp CR, Boisseau VC, Haddad JG Jr. Serum 25-hydroxycalciferol levels and bone mass in children on chronic anticonvulsant therapy. N Engl J Med 1975; 292:550–554.
- Weinstein RS, Bryce GF, Sappington LJ, King DW, Gallagher BB. Decreased serum ionized calcium and normal vitamin D metabolite levels with anticonvulsant drug treatment. J Clin Endocrinol Metab 1984; 58:1003–1009.
- Koch HU, Kraft D, von Herrath D, Schaefer K. Influence of diphenylhydantoin and phenobarbital on intestinal calcium transport in the rat. Epilepsia 1972; 13:829–834.
- Shane E. Osteoporosis associated with illness and medications. In: Marcus R, Feldman D, Kelsey J, editors. Osteoporosis. San Diego, CA: Academic Press; 1996.
- Vestergaard P. Epilepsy, osteoporosis and fracture risk—a meta-analysis. Acta Neurol Scand 2005; 112:277–286.
- Vestergaard P, Rejnmark L, Mosekilde L. Fracture risk associated with use of antiepileptic drugs. Epilepsia 2004; 45:1330–1337.
- Petty SJ, O’Brien TJ, Wark JD. Anti-epileptic medication and bone health. Osteoporos Int 2007; 18:129–142.
- Mazziotti G, Canalis E, Giustina A. Drug-induced osteoporosis: mechanisms and clinical implications. Am J Med 2010; 123:877–884.
- Rabaglio M, Sun Z, Price KN, et al; BIG 1-98 Collaborative and International Breast Cancer Study Groups. Bone fractures among postmenopausal patients with endocrine-responsive early breast cancer treated with 5 years of letrozole or tamoxifen in the BIG 1-98 trial. Ann Oncol 2009; 20:1489–1498.
- Khan MN, Khan AA. Cancer treatment-related bone loss: a review and synthesis of the literature. Curr Oncol 2008; 15:S30–S40.
- Hadji P, Aapro MS, Body JJ, et al. Management of aromatase inhibitor-associated bone loss in postmenopausal women with breast cancer: practical guidance for prevention and treatment. Ann Oncol 2011; 22:2546–2555.
- Hillner BE, Ingle JN, Chlebowski RT, et al; American Society of Clinical Oncology. American Society of Clinical Oncology 2003 update on the role of bisphosphonates and bone health issues in breast cancer. J Clin Oncol 2003; 21:4042–4057.
- Canalis E, Delany AM. Mechanisms of glucocorticoid action in bone. Ann N Y Acad Sci 2002; 966:73–81.
- Manolagas SC. Corticosteroids and fractures: a close encounter of the third cell kind. J Bone Miner Res 2000; 15:1001–1005.
- Papaioannou A, Ferko NC, Adachi JD. Corticosteroids and the skeletal system. In: Lin AN, Paget SA, eds. Principles of corticosteroid therapy. New York, NY: Arnold Publishers; 2002:69–86.
- Van Staa TP. The pathogenesis, epidemiology, and management of glucocorticoid-induced osteoporosis. Calcif Tissue Int 2006; 79:129–137.
- Van Staa TP, Leufkens HG, Cooper C. The epidemiology of corticosteroid-induced osteoporosis: a meta-analysis. Osteoporosis Int 2002; 13:777–787.
- Clowes JA, Riggs BL, Khosla S. The role of the immune system in the pathophysiology of osteoporosis. Immunol Rev 2005; 208:207–227.
- LoCascio V, Bonucci E, Imbimbo B, et al. Bone loss in response to long-term glucocorticoid therapy. Bone Miner 1990; 8:39–51.
- Lane NE, Lukert B. The science and therapy of glucocorticoid-induced bone loss. Endocrinol Metab Clin North Am 1998; 27:465–483.
- Kanis JA, Johansson H, Oden A, et al. A meta-analysis of prior corticosteroid use and fracture risk. J Bone Miner Res 2004; 19:893–899.
- Van Staa TP, Geusens P, Pols HA, de Laet C, Leufkens HG, Cooper C. A simple score for estimating the long-term risk of fracture in patients using oral glucocorticoids. QJM 2005; 98:191–198.
- Van Staa TP, Leufkens HG, Abenhaim L, Zhang B, Cooper C. Oral corticosteroids and fracture risk: relationship to daily and cumulative doses. Rheumatology (Oxford) 2000; 39:1383–1389.
- Van Staa TP, Leufkens HG, Abenhaim L, Zhang B, Cooper C. Use of corticosteroids and risk of fractures. J Bone Miner Res 2000; 15:993–1000.
- Van Staa TP, Laan RF, Barton IP, Cohen S, Reid DM, Cooper C. Bone density threshold and other predictors of vertebral fracture in patients receiving oral glucocorticoid therapy. Arthritis Rheum 2003; 48:3224–3229.
- Luengo M, Picado C, Del Rio L, Guanabens N, Montserrat JM, Setoain J. Vertebral fractures in steroid dependent asthma and involutional osteoporosis: a comparative study. Thorax 1991; 46:803–806.
- Selby PL, Halsey JP, Adams KRH, et al. Corticosteroids do not alter the threshold for vertebral fracture. J Bone Miner Res 2000; 15:952–956.
- Gonnelli S, Caffarelli C, Maggi S, et al. Effect of inhaled glucocorticoids and beta(2) agonists on vertebral fracture risk in COPD patients: the EOLO study. Calcif Tissue Int 2010; 87:137–143.
- Jones A, Fay JK, Burr M, Stone M, Hood K, Roberts G. Inhaled corticosteroid effects on bone metabolism in asthma and mild chronic obstructive pulmonary disease. Cochrane Database Syst Rev 2002; 1:CD003537.
- Weatherall M, James K, Clay J, et al. Dose-response relationship for risk of non-vertebral fracture with inhaled corticosteroids. Clin Exp Allergy 2008; 38:1451–1458
- Buehring B, Viswanathan R, Binkley N, Busse W. Glucocorticoid-induced osteoporosis: an update on effects and management. J Allergy Clin Immunol 2013; 132:1019–1030.
- Grossman JM, Gordon R, Ranganath VK, et al. American College of Rheumatology 2010 recommendations for the prevention and treatment of glucocorticoid-induced osteoporosis. Arthritis Care Res (Hoboken) 2010; 62:1515–1526.
- Naunton M, Peterson GM, Bleasel MD. Overuse of proton pump inhibitors. J Clin Pharm Ther 2000; 25:333–340.
- Wilhelm SM, Rjater RG, Kale-Pradhan PB. Perils and pitfalls of long-term effects of proton pump inhibitors. Expert Rev Clin Pharmacol 2013; 6:443–451.
- Sheikh MS, Santa Ana CA, Nicar MJ, Schiller LR, Fordtran JS. Gastrointestinal absorption of calcium from milk and calcium salts. N Engl J Med 1987; 317:532–536.
- Yang YX, Lewis JD, Epstein S, Metz DC. Long-term proton pump inhibitor therapy and risk of hip fracture. JAMA 2006; 296:2947–2953.
- Vestergaard P, Rejnmark L, Mosekilde L. Proton pump inhibitors, histamine H2 receptor antagonists, and other antacid medications and the risk of fracture. Calcif Tissue Int 2006; 79:76–83.
- Food and Drug Administration (FDA). FDA drug safety communication: possible increased risk of fractures of the hip, wrist, and spine with the use of proton pump inhibitors. www.fda.gov/Drugs/DrugSafety/PostmarketDrugSafetyInformationforPatientsandProviders/ucm213206.htm. Accessed March 7, 2016.
- Targownik LE, Lix LM, Metge CJ, Prior HJ, Leung S, Leslie WD. Use of proton pump inhibitors and risk of osteoporosis-related fractures. CMAJ 2008; 179:319–326.
- Kaye JA, Jick H. Proton pump inhibitor use and risk of hip fractures in patients without major risk factors. Pharmacotherapy 2008; 28:951–959.
- Corley DA, Kubo A, Zhao W, Quesenberry C. Proton pump inhibitors and histamine-2 receptor antagonists are associated with hip fractures among at-risk patients. Gastroenterology 2010; 139:93–101.
- Gray SL, LaCroix AZ, Larson J, et al. Proton pump inhibitor use, hip fracture, and change in bone mineral density in postmenopausal women: results from the Women’s Health Initiative. Arch Intern Med 2010; 170:765–771.
- Yu EW, Blackwell T, Ensrud KE, et al. Acid-suppressive medications and risk of bone loss and fracture in older adults. Calcif Tissue Int 2008; 83:251–259.
- Leontiadis GI, Moayyedi P. Proton pump inhibitors and risk of bone fractures. Curr Treat Options Gastroenterol 2014; 12:414–423.
- Chen F, Hahn TJ, Weintraub NT. Do SSRIs play a role in decreasing bone mineral density? J Am Med Dir Assoc 2012; 13:413–417.
- Bruyere O, Reginster JY. Osteoporosis in patients taking selective serotonin reuptake inhibitors: a focus on fracture outcome. Endocrine 2015; 48:65–68.
- Ducy P, Karsenty G. The two faces of serotonin in bone biology. J Cell Biol 2010; 191:7–13.
- Eom CS, Lee HK, Ye S, Park SM, Cho KH. Use of selective serotonin reuptake inhibitors and risk of fracture: a systematic review and meta-analysis. J Bone Miner Res 2012; 27:1186–1195.
- Rabenda V, Nicolet D, Beaudart C, Bruyere O, Reginster JY. Relationship between use of antidepressants and risk of fractures: a meta-analysis. Osteoporosis Int 2013; 24:121–137.
- Richards JB, Papaioannou A, Adachi JD, et al; Canadian Multicentre Osteoporosis Study Research Group. Effect of selective serotonin reuptake inhibitors on the risk of fracture. Arch Intern Med 2007; 22;167:188–194.
- Hahn TJ, Hendin BA, Scharp CR, Boisseau VC, Haddad JG Jr. Serum 25-hydroxycalciferol levels and bone mass in children on chronic anticonvulsant therapy. N Engl J Med 1975; 292:550–554.
- Weinstein RS, Bryce GF, Sappington LJ, King DW, Gallagher BB. Decreased serum ionized calcium and normal vitamin D metabolite levels with anticonvulsant drug treatment. J Clin Endocrinol Metab 1984; 58:1003–1009.
- Koch HU, Kraft D, von Herrath D, Schaefer K. Influence of diphenylhydantoin and phenobarbital on intestinal calcium transport in the rat. Epilepsia 1972; 13:829–834.
- Shane E. Osteoporosis associated with illness and medications. In: Marcus R, Feldman D, Kelsey J, editors. Osteoporosis. San Diego, CA: Academic Press; 1996.
- Vestergaard P. Epilepsy, osteoporosis and fracture risk—a meta-analysis. Acta Neurol Scand 2005; 112:277–286.
- Vestergaard P, Rejnmark L, Mosekilde L. Fracture risk associated with use of antiepileptic drugs. Epilepsia 2004; 45:1330–1337.
- Petty SJ, O’Brien TJ, Wark JD. Anti-epileptic medication and bone health. Osteoporos Int 2007; 18:129–142.
- Mazziotti G, Canalis E, Giustina A. Drug-induced osteoporosis: mechanisms and clinical implications. Am J Med 2010; 123:877–884.
- Rabaglio M, Sun Z, Price KN, et al; BIG 1-98 Collaborative and International Breast Cancer Study Groups. Bone fractures among postmenopausal patients with endocrine-responsive early breast cancer treated with 5 years of letrozole or tamoxifen in the BIG 1-98 trial. Ann Oncol 2009; 20:1489–1498.
- Khan MN, Khan AA. Cancer treatment-related bone loss: a review and synthesis of the literature. Curr Oncol 2008; 15:S30–S40.
- Hadji P, Aapro MS, Body JJ, et al. Management of aromatase inhibitor-associated bone loss in postmenopausal women with breast cancer: practical guidance for prevention and treatment. Ann Oncol 2011; 22:2546–2555.
- Hillner BE, Ingle JN, Chlebowski RT, et al; American Society of Clinical Oncology. American Society of Clinical Oncology 2003 update on the role of bisphosphonates and bone health issues in breast cancer. J Clin Oncol 2003; 21:4042–4057.
KEY POINTS
- Professional society guidelines advise initiating treatment for bone loss in patients starting glucocorticoid therapy expected to last at least 3 months and for women taking an aromatase inhibitor.
- If patients taking a proton pump inhibitor take a calcium supplement, they should take calcium citrate.
- Daily SSRI use nearly doubles the risk of hip fracture in people over age 50.
- Many drugs for epilepsy are associated with increased fracture risk, but so are seizures (which may confound the issue).

Phrenic nerve paralysis induced by brachial plexus block
A 72-year-old man underwent elective ambulatory arthroscopic repair of the right shoulder rotator cuff. To manage postoperative pain, a supraclavicular catheter was placed for brachial plexus block, and he was sent home with a ropivacaine infusion pump.
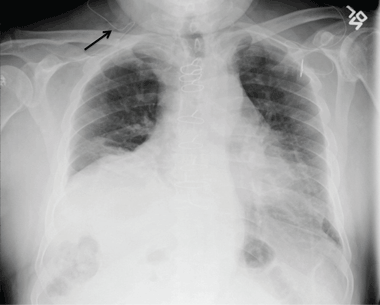
The next day, he presented to the emergency department with right-sided chest pain and mild shortness of breath. He had normal vital signs and adequate oxygen saturation on room air. On physical examination, breath sounds were decreased at the right lung base, and chest radiography (Figure 1) revealed an isolated elevated right hemidiaphragm, a clear indication of phrenic nerve paralysis from local infiltration of the infusion.
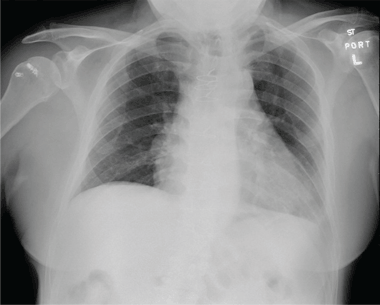
The ropivacaine infusion was stopped, and the supraclavicular catheter was removed under anesthesia. He was admitted to the hospital for observation, and over the course of 8 to 12 hours his shortness of breath resolved, and his findings on lung examination normalized. Repeat chest radiography 24 hours after his emergency room presentation showed regular positioning of his diaphragm (Figure 2).
RECOGNIZING AND MANAGING PHRENIC NERVE PARALYSIS
The scenario described here illustrates the importance of recognizing symptomatic phrenic nerve paralysis as a result of local infiltration of anesthetic from supraclavicular brachial plexus block. Regional anesthesia is commonly used for perioperative analgesia for minor shoulder surgeries. Because these blocks anesthetize the trunks formed by the C5–T1 nerve roots, infiltration of the anesthetic agent to the proximal nerve roots resulting in phrenic nerve paralysis is a common complication.
Although phrenic nerve paralysis has been reported to some degree in nearly all patients, reports of significant shortness of breath and radiographic evidence of hemidiaphragm are few.1–4 When it occurs, the analgesic regimen must be changed from regional anesthesia to oral or parenteral pain medications. Resolution of symptoms and radiographic abnormalities usually occurs spontaneously.
When available, an ultrasonographically guided approach for supraclavicular brachial plexus blocks is preferred over a blind approach and is associated with a higher success rate and a lower rate of complications.5,6
A potentially life-threatening complication of brachial plexus block is pneumothorax.
Contraindications to brachial plexus block include severe lung disease and previous surgery or interventions with the potential for phrenic nerve injury that could result in bilateral paralysis of the diaphragm. Ultimately, preprocedural chest radiography in selected patients at high risk should be considered to mitigate this risk.
- Tran QH, Clemente A, Doan J, Finlayson RJ. Brachial plexus blocks: a review of approaches and techniques. Can J Anaesth 2007; 54:662–674.
- Mian A, Chaudhry I, Huang R, Rizk E, Tubbs RS, Loukas M. Brachial plexus anesthesia: a review of the relevant anatomy, complications, and anatomical variations. Clin Anat 2014; 27:210–221.
- Knoblanche GE. The incidence and aetiology of phrenic nerve blockade associated with supraclavicular brachial plexus block. Anaesth Intensive Care 1979; 7:346–349.
- Urmey WF, Talts KH, Sharrock NE. One hundred percent incidence of hemidiaphragmatic paresis associated with interscalene brachial plexus anesthesia as diagnosed by ultrasonography. Anesth Analg 1991; 72:498–503.
- Gelfand HJ, Ouanes JP, Lesley MR, et al. Analgesic efficacy of ultrasound-guided regional anesthesia: a meta-analysis. J Clin Anesth 2011; 23:90–96.
- Sandhu NS, Capan LM. Ultrasound-guided infraclavicular brachial plexus block. Br J Anaesth 2002; 89:254–259.
A 72-year-old man underwent elective ambulatory arthroscopic repair of the right shoulder rotator cuff. To manage postoperative pain, a supraclavicular catheter was placed for brachial plexus block, and he was sent home with a ropivacaine infusion pump.
The next day, he presented to the emergency department with right-sided chest pain and mild shortness of breath. He had normal vital signs and adequate oxygen saturation on room air. On physical examination, breath sounds were decreased at the right lung base, and chest radiography (Figure 1) revealed an isolated elevated right hemidiaphragm, a clear indication of phrenic nerve paralysis from local infiltration of the infusion.
The ropivacaine infusion was stopped, and the supraclavicular catheter was removed under anesthesia. He was admitted to the hospital for observation, and over the course of 8 to 12 hours his shortness of breath resolved, and his findings on lung examination normalized. Repeat chest radiography 24 hours after his emergency room presentation showed regular positioning of his diaphragm (Figure 2).
RECOGNIZING AND MANAGING PHRENIC NERVE PARALYSIS
The scenario described here illustrates the importance of recognizing symptomatic phrenic nerve paralysis as a result of local infiltration of anesthetic from supraclavicular brachial plexus block. Regional anesthesia is commonly used for perioperative analgesia for minor shoulder surgeries. Because these blocks anesthetize the trunks formed by the C5–T1 nerve roots, infiltration of the anesthetic agent to the proximal nerve roots resulting in phrenic nerve paralysis is a common complication.
Although phrenic nerve paralysis has been reported to some degree in nearly all patients, reports of significant shortness of breath and radiographic evidence of hemidiaphragm are few.1–4 When it occurs, the analgesic regimen must be changed from regional anesthesia to oral or parenteral pain medications. Resolution of symptoms and radiographic abnormalities usually occurs spontaneously.
When available, an ultrasonographically guided approach for supraclavicular brachial plexus blocks is preferred over a blind approach and is associated with a higher success rate and a lower rate of complications.5,6
A potentially life-threatening complication of brachial plexus block is pneumothorax.
Contraindications to brachial plexus block include severe lung disease and previous surgery or interventions with the potential for phrenic nerve injury that could result in bilateral paralysis of the diaphragm. Ultimately, preprocedural chest radiography in selected patients at high risk should be considered to mitigate this risk.
A 72-year-old man underwent elective ambulatory arthroscopic repair of the right shoulder rotator cuff. To manage postoperative pain, a supraclavicular catheter was placed for brachial plexus block, and he was sent home with a ropivacaine infusion pump.
The next day, he presented to the emergency department with right-sided chest pain and mild shortness of breath. He had normal vital signs and adequate oxygen saturation on room air. On physical examination, breath sounds were decreased at the right lung base, and chest radiography (Figure 1) revealed an isolated elevated right hemidiaphragm, a clear indication of phrenic nerve paralysis from local infiltration of the infusion.
The ropivacaine infusion was stopped, and the supraclavicular catheter was removed under anesthesia. He was admitted to the hospital for observation, and over the course of 8 to 12 hours his shortness of breath resolved, and his findings on lung examination normalized. Repeat chest radiography 24 hours after his emergency room presentation showed regular positioning of his diaphragm (Figure 2).
RECOGNIZING AND MANAGING PHRENIC NERVE PARALYSIS
The scenario described here illustrates the importance of recognizing symptomatic phrenic nerve paralysis as a result of local infiltration of anesthetic from supraclavicular brachial plexus block. Regional anesthesia is commonly used for perioperative analgesia for minor shoulder surgeries. Because these blocks anesthetize the trunks formed by the C5–T1 nerve roots, infiltration of the anesthetic agent to the proximal nerve roots resulting in phrenic nerve paralysis is a common complication.
Although phrenic nerve paralysis has been reported to some degree in nearly all patients, reports of significant shortness of breath and radiographic evidence of hemidiaphragm are few.1–4 When it occurs, the analgesic regimen must be changed from regional anesthesia to oral or parenteral pain medications. Resolution of symptoms and radiographic abnormalities usually occurs spontaneously.
When available, an ultrasonographically guided approach for supraclavicular brachial plexus blocks is preferred over a blind approach and is associated with a higher success rate and a lower rate of complications.5,6
A potentially life-threatening complication of brachial plexus block is pneumothorax.
Contraindications to brachial plexus block include severe lung disease and previous surgery or interventions with the potential for phrenic nerve injury that could result in bilateral paralysis of the diaphragm. Ultimately, preprocedural chest radiography in selected patients at high risk should be considered to mitigate this risk.
- Tran QH, Clemente A, Doan J, Finlayson RJ. Brachial plexus blocks: a review of approaches and techniques. Can J Anaesth 2007; 54:662–674.
- Mian A, Chaudhry I, Huang R, Rizk E, Tubbs RS, Loukas M. Brachial plexus anesthesia: a review of the relevant anatomy, complications, and anatomical variations. Clin Anat 2014; 27:210–221.
- Knoblanche GE. The incidence and aetiology of phrenic nerve blockade associated with supraclavicular brachial plexus block. Anaesth Intensive Care 1979; 7:346–349.
- Urmey WF, Talts KH, Sharrock NE. One hundred percent incidence of hemidiaphragmatic paresis associated with interscalene brachial plexus anesthesia as diagnosed by ultrasonography. Anesth Analg 1991; 72:498–503.
- Gelfand HJ, Ouanes JP, Lesley MR, et al. Analgesic efficacy of ultrasound-guided regional anesthesia: a meta-analysis. J Clin Anesth 2011; 23:90–96.
- Sandhu NS, Capan LM. Ultrasound-guided infraclavicular brachial plexus block. Br J Anaesth 2002; 89:254–259.
- Tran QH, Clemente A, Doan J, Finlayson RJ. Brachial plexus blocks: a review of approaches and techniques. Can J Anaesth 2007; 54:662–674.
- Mian A, Chaudhry I, Huang R, Rizk E, Tubbs RS, Loukas M. Brachial plexus anesthesia: a review of the relevant anatomy, complications, and anatomical variations. Clin Anat 2014; 27:210–221.
- Knoblanche GE. The incidence and aetiology of phrenic nerve blockade associated with supraclavicular brachial plexus block. Anaesth Intensive Care 1979; 7:346–349.
- Urmey WF, Talts KH, Sharrock NE. One hundred percent incidence of hemidiaphragmatic paresis associated with interscalene brachial plexus anesthesia as diagnosed by ultrasonography. Anesth Analg 1991; 72:498–503.
- Gelfand HJ, Ouanes JP, Lesley MR, et al. Analgesic efficacy of ultrasound-guided regional anesthesia: a meta-analysis. J Clin Anesth 2011; 23:90–96.
- Sandhu NS, Capan LM. Ultrasound-guided infraclavicular brachial plexus block. Br J Anaesth 2002; 89:254–259.
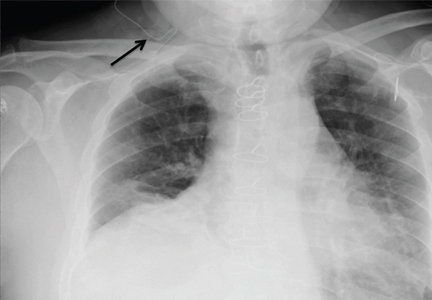
Can patients with infectious endocarditis be safely anticoagulated?
Managing anticoagulation in patients with infectious endocarditis requires an individualized approach, using a careful risk-benefit assessment on a case-by-case basis. There is a dearth of high-quality evidence; consequently, the recommendations also vary according to the clinical situation.
Newly diagnosed native valve infectious endocarditis in itself is not an indication for anticoagulation.1–3 The question of whether to anticoagulate arises in patients who have a preexisting or coexisting indication for anticoagulation such as atrial fibrillation, deep vein thrombosis, pulmonary embolism, or a mechanical prosthetic heart valve. The question becomes yet more complex in patients with cerebrovascular complications and a coexistent strong indication for anticoagulation, creating what is often a very thorny dilemma.
Based on a review of available evidence, recommendations for anticoagulation in patients with infectious endocarditis are summarized below.
AVAILABLE EVIDENCE IS SCARCE AND MIXED
Earlier observational studies suggested a significant risk of cerebral hemorrhage with anticoagulation in patients with native valve endocarditis, although none of these studies were recent (some of them took place in the 1940s), and none are methodologically compelling.4–8 Consequently, some experts have expressed skepticism regarding their findings, particularly in recent years.
In part, this skepticism arises from studies that showed a lower incidence of cerebrovascular complications and smaller vegetation size in patients with prosthetic valve infectious endocarditis, studies in which many of the patients received anticoagulation therapy.9,10 The mechanism responsible for this effect is theorized to be that the vegetation is an amalgam of destroyed cells, platelets, and fibrin, with anticoagulation preventing this aggregation from further growth and propagation.
How great is the benefit or the potential harm?
Some experts argue that the incidence of ischemic stroke with hemorrhagic transformation in patients with infectious endocarditis receiving anticoagulation is overestimated. According to this view, the beneficial effects of anticoagulation at least counterbalance the potential harmful effects.
In addition to the studies cited above, recent studies have shown that patients on anticoagulation tend to have smaller vegetations and fewer cerebrovascular complications.11–13 Snygg-Martin et al11 and Rasmussen et al12 found not only that cerebrovascular complications were less common in patients already on anticoagulation at the time infectious endocarditis was diagnosed, but also that no increase in the rate of hemorrhagic lesions was reported.
These were all nonrandomized studies, and most of the patients in them had native valve infectious endocarditis diagnosed at an early stage. Importantly, these studies found that the beneficial effects of anticoagulation were only present if the patient was receiving warfarin before infectious endocarditis was diagnosed and antibiotic therapy was initiated. No benefits from anticoagulation were demonstrated once antimicrobial therapy was begun.
Similarly, Anavekar et al14 showed that embolic events occurred significantly less often in those who were currently on continuous daily antiplatelet therapy, suggesting that receiving antiplatelet agents at baseline protects against cardioembolic events in patients who develop infective endocarditis. However, the only randomized trial examining the initiation of antiplatelet therapy in patients diagnosed with infectious endocarditis receiving antibiotic treatment showed that adding aspirin did not reduce the risk of embolic events and was associated with a trend toward increased risk of bleeding.15
A recent large cohort study suggested that infectious endocarditis patients who receive anticoagulation therapy may have a higher incidence of cerebrovascular complications (hazard ratio 1.31, 95% confidence interval 1.00–1.72, P = .048), with a particular association of anticoagulation therapy with intracranial bleeding (hazard ratio 2.71, 95% confidence interval 1.54–4.76, P = .001).16
Another provocative link supported by the same study was a higher incidence of hemorrhagic complications with anticoagulation in patients with infectious endocarditis caused by Staphylococcus aureus, an association also suggested by older data from Tornos et al,8 but not seen in a study by Rasmussen et al.12
Continuing anticoagulation is an individualized decision
The benefit or harm of anticoagulation in patients with infectious endocarditis may be determined at least in part by a complex mix of factors including the valve involved (embolic events are more common with mitral valve vegetations than with aortic valve vegetations), vegetation size (higher risk if > 1 cm), mobility of vegetations, and perhaps the virulence of the causative organism.16,17 The fact that antimicrobial therapy obviates any beneficial effect of anticoagulation speaks strongly against starting anticoagulation therapy in infectious endocarditis patients with the sole purpose of reducing stroke risk.
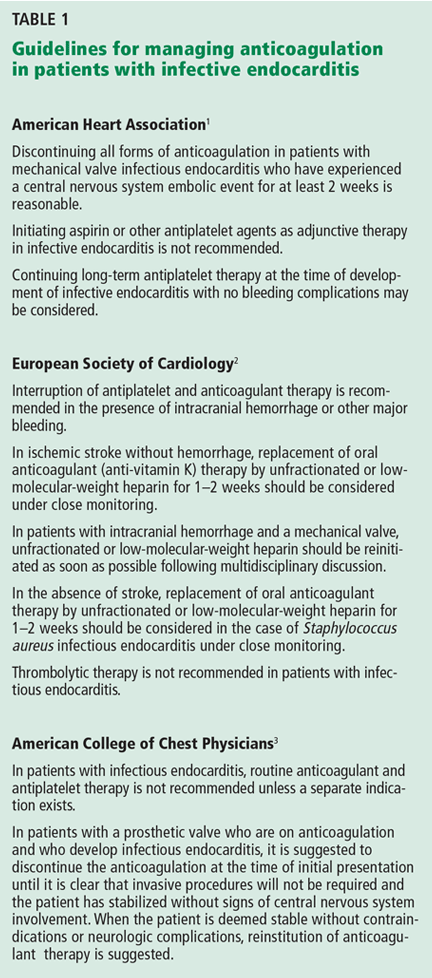
Without large randomized trials to better delineate the risks and benefits of continuing preexisting anticoagulation in all patients with infectious endocarditis, patients already receiving anticoagulants need a careful, individualized risk-benefit assessment. Current guidelines agree that newly diagnosed infectious endocarditis per se is not an indication for anticoagulation or aspirin therapy (Table 1).1–3
TAKE-HOME POINTS
- Starting antiplatelet and anticoagulation therapy for the sole purpose of stroke prevention is not recommended in patients with newly diagnosed infectious endocarditis.
- In most cases, anticoagulation and antiplatelet therapy should be temporarily discontinued in patients with infectious endocarditis and stroke or suspected stroke.
- Patients need careful assessment on a case-by-case basis, and the presence of risk factors predisposing patients to cerebrovascular complications (eg, large or very mobile vegetations, causative pathogens such as S aureus or Candida spp) may prompt temporary suspension of anticoagulation and antiplatelet therapy.
- If there is a clear preexisting or coexisting indication for these agents and surgery is not anticipated, consider continuing antiplatelet and anticoagulant therapy in patients with infectious endocarditis, provided they lack the risk factors described above and stroke has been excluded.
- If there is a clear preexisting or coexisting indication for these agents and surgery is being considered, consider using a short-acting anticoagulant such as intravenous or low-molecular weight heparin as a bridge to surgery.
- Baddour LM, Wilson WR, Bayer AS, et al. Infective endocarditis in adults: diagnosis, antimicrobial therapy, and management of complications: a scientific statement for healthcare professionals from the American Heart Association. Circulation 2015; 132:1435–1486.
- Habib G, Lancellotti P, Antunes MJ, et al. 2015 ESC guidelines for the management of infective endocarditis. Rev Esp Cardiol (Engl Ed) 2016; 69:69.
- Whitlock RP, Sun JC, Fremes SE, Rubens FD, Teoh KH. Antithrombotic and thrombolytic therapy for valvular disease: Antithrombotic Therapy and Prevention of Thrombosis, 9th ed: American College of Chest Physicians evidence-based clinical practice guidelines. Chest 2012; 141:e576S–e600S.
- Delahaye JP, Poncet P, Malquarti V, Beaune J, Garé JP, Mann JM. Cerebrovascular accidents in infective endocarditis: role of anticoagulation. Eur Heart J 1990; 11:1074–1078.
- Loewe L. The combined use of anti-infectives and anticoagulants in the treatment of subacute bacterial endocarditis. Bull N Y Acad Med 1945; 21:59–86.
- Priest WS, Smith JM, McGee GC. The effect of anticoagulants on the penicillin therapy and the pathologic lesions of subacute bacterial endocarditis. N Engl J Med 1946; 235:699–706.
- Pruitt AA, Rubin RH, Karchmer AW, Duncan GW. Neurologic complications of bacterial endocarditis. Medicine 1978; 57:329–343.
- Tornos P, Almirante B, Mirabet S, Permanyer G, Pahissa A, Soler-Soler J. Infective endocarditis due to Staphylococcus aureus: deleterious effect of anticoagulant therapy. Arch Intern Med 1999; 159:473–475.
- Wilson WR, Geraci JE, Danielson GK, et al. Anticoagulant therapy and central nervous system complications in patients with prosthetic valve endocarditis. Circulation 1978; 57:1004–1007.
- Schulz R, Werner GS, Fuchs JB, et al. Clinical outcome and echocardiographic findings of native and prosthetic valve endocarditis in the 1990’s. Eur Heart J 1996; 17:281–288.
- Snygg-Martin U, Rasmussen RV, Hassager C, Bruun NE, Andersson R, Olaison L. Warfarin therapy and incidence of cerebrovascular complications in left-sided native valve endocarditis. Eur J Clin Microbiol Infect Dis 2011; 30:151–157.
- Rasmussen RV, Snygg-Martin U, Olaison L, et al. Major cerebral events in Staphylococcus aureus infective endocarditis: is anticoagulant therapy safe? Cardiology 2009; 114:284–291.
- Yau JW, Lee P, Wilson A, Jenkins AJ. Prosthetic valve endocarditis: what is the evidence for anticoagulant therapy? Intern Med J 2011; 41:795–797.
- Anavekar NS, Tleyjeh IM, Mirzoyev Z, et al. Impact of prior antiplatelet therapy on risk of embolism in infective endocarditis. Clin Infect Dis 2007; 44:1180–1186.
- Chan KL, Dumesnil JG, Cujec B, et al. A randomized trial of aspirin on the risk of embolic events in patients with infective endocarditis. J Am Coll Cardiol 2003; 42:775–780.
- Garcia-Cabrera E, Fernández-Hidalgo N, Almirante B, et al. Neurological complications of infective endocarditis: risk factors, outcome, and impact of cardiac surgery: a multicenter observational study. Circulation 2013; 127:2272–2284.
- Thuny F, Di Salvo G, Belliard O, et al. Risk of embolism and death in infective endocarditis: prognostic value of echocardiography: a prospective multicenter study. Circulation 2005; 112:69–75.
Managing anticoagulation in patients with infectious endocarditis requires an individualized approach, using a careful risk-benefit assessment on a case-by-case basis. There is a dearth of high-quality evidence; consequently, the recommendations also vary according to the clinical situation.
Newly diagnosed native valve infectious endocarditis in itself is not an indication for anticoagulation.1–3 The question of whether to anticoagulate arises in patients who have a preexisting or coexisting indication for anticoagulation such as atrial fibrillation, deep vein thrombosis, pulmonary embolism, or a mechanical prosthetic heart valve. The question becomes yet more complex in patients with cerebrovascular complications and a coexistent strong indication for anticoagulation, creating what is often a very thorny dilemma.
Based on a review of available evidence, recommendations for anticoagulation in patients with infectious endocarditis are summarized below.
AVAILABLE EVIDENCE IS SCARCE AND MIXED
Earlier observational studies suggested a significant risk of cerebral hemorrhage with anticoagulation in patients with native valve endocarditis, although none of these studies were recent (some of them took place in the 1940s), and none are methodologically compelling.4–8 Consequently, some experts have expressed skepticism regarding their findings, particularly in recent years.
In part, this skepticism arises from studies that showed a lower incidence of cerebrovascular complications and smaller vegetation size in patients with prosthetic valve infectious endocarditis, studies in which many of the patients received anticoagulation therapy.9,10 The mechanism responsible for this effect is theorized to be that the vegetation is an amalgam of destroyed cells, platelets, and fibrin, with anticoagulation preventing this aggregation from further growth and propagation.
How great is the benefit or the potential harm?
Some experts argue that the incidence of ischemic stroke with hemorrhagic transformation in patients with infectious endocarditis receiving anticoagulation is overestimated. According to this view, the beneficial effects of anticoagulation at least counterbalance the potential harmful effects.
In addition to the studies cited above, recent studies have shown that patients on anticoagulation tend to have smaller vegetations and fewer cerebrovascular complications.11–13 Snygg-Martin et al11 and Rasmussen et al12 found not only that cerebrovascular complications were less common in patients already on anticoagulation at the time infectious endocarditis was diagnosed, but also that no increase in the rate of hemorrhagic lesions was reported.
These were all nonrandomized studies, and most of the patients in them had native valve infectious endocarditis diagnosed at an early stage. Importantly, these studies found that the beneficial effects of anticoagulation were only present if the patient was receiving warfarin before infectious endocarditis was diagnosed and antibiotic therapy was initiated. No benefits from anticoagulation were demonstrated once antimicrobial therapy was begun.
Similarly, Anavekar et al14 showed that embolic events occurred significantly less often in those who were currently on continuous daily antiplatelet therapy, suggesting that receiving antiplatelet agents at baseline protects against cardioembolic events in patients who develop infective endocarditis. However, the only randomized trial examining the initiation of antiplatelet therapy in patients diagnosed with infectious endocarditis receiving antibiotic treatment showed that adding aspirin did not reduce the risk of embolic events and was associated with a trend toward increased risk of bleeding.15
A recent large cohort study suggested that infectious endocarditis patients who receive anticoagulation therapy may have a higher incidence of cerebrovascular complications (hazard ratio 1.31, 95% confidence interval 1.00–1.72, P = .048), with a particular association of anticoagulation therapy with intracranial bleeding (hazard ratio 2.71, 95% confidence interval 1.54–4.76, P = .001).16
Another provocative link supported by the same study was a higher incidence of hemorrhagic complications with anticoagulation in patients with infectious endocarditis caused by Staphylococcus aureus, an association also suggested by older data from Tornos et al,8 but not seen in a study by Rasmussen et al.12
Continuing anticoagulation is an individualized decision
The benefit or harm of anticoagulation in patients with infectious endocarditis may be determined at least in part by a complex mix of factors including the valve involved (embolic events are more common with mitral valve vegetations than with aortic valve vegetations), vegetation size (higher risk if > 1 cm), mobility of vegetations, and perhaps the virulence of the causative organism.16,17 The fact that antimicrobial therapy obviates any beneficial effect of anticoagulation speaks strongly against starting anticoagulation therapy in infectious endocarditis patients with the sole purpose of reducing stroke risk.
Without large randomized trials to better delineate the risks and benefits of continuing preexisting anticoagulation in all patients with infectious endocarditis, patients already receiving anticoagulants need a careful, individualized risk-benefit assessment. Current guidelines agree that newly diagnosed infectious endocarditis per se is not an indication for anticoagulation or aspirin therapy (Table 1).1–3
TAKE-HOME POINTS
- Starting antiplatelet and anticoagulation therapy for the sole purpose of stroke prevention is not recommended in patients with newly diagnosed infectious endocarditis.
- In most cases, anticoagulation and antiplatelet therapy should be temporarily discontinued in patients with infectious endocarditis and stroke or suspected stroke.
- Patients need careful assessment on a case-by-case basis, and the presence of risk factors predisposing patients to cerebrovascular complications (eg, large or very mobile vegetations, causative pathogens such as S aureus or Candida spp) may prompt temporary suspension of anticoagulation and antiplatelet therapy.
- If there is a clear preexisting or coexisting indication for these agents and surgery is not anticipated, consider continuing antiplatelet and anticoagulant therapy in patients with infectious endocarditis, provided they lack the risk factors described above and stroke has been excluded.
- If there is a clear preexisting or coexisting indication for these agents and surgery is being considered, consider using a short-acting anticoagulant such as intravenous or low-molecular weight heparin as a bridge to surgery.
Managing anticoagulation in patients with infectious endocarditis requires an individualized approach, using a careful risk-benefit assessment on a case-by-case basis. There is a dearth of high-quality evidence; consequently, the recommendations also vary according to the clinical situation.
Newly diagnosed native valve infectious endocarditis in itself is not an indication for anticoagulation.1–3 The question of whether to anticoagulate arises in patients who have a preexisting or coexisting indication for anticoagulation such as atrial fibrillation, deep vein thrombosis, pulmonary embolism, or a mechanical prosthetic heart valve. The question becomes yet more complex in patients with cerebrovascular complications and a coexistent strong indication for anticoagulation, creating what is often a very thorny dilemma.
Based on a review of available evidence, recommendations for anticoagulation in patients with infectious endocarditis are summarized below.
AVAILABLE EVIDENCE IS SCARCE AND MIXED
Earlier observational studies suggested a significant risk of cerebral hemorrhage with anticoagulation in patients with native valve endocarditis, although none of these studies were recent (some of them took place in the 1940s), and none are methodologically compelling.4–8 Consequently, some experts have expressed skepticism regarding their findings, particularly in recent years.
In part, this skepticism arises from studies that showed a lower incidence of cerebrovascular complications and smaller vegetation size in patients with prosthetic valve infectious endocarditis, studies in which many of the patients received anticoagulation therapy.9,10 The mechanism responsible for this effect is theorized to be that the vegetation is an amalgam of destroyed cells, platelets, and fibrin, with anticoagulation preventing this aggregation from further growth and propagation.
How great is the benefit or the potential harm?
Some experts argue that the incidence of ischemic stroke with hemorrhagic transformation in patients with infectious endocarditis receiving anticoagulation is overestimated. According to this view, the beneficial effects of anticoagulation at least counterbalance the potential harmful effects.
In addition to the studies cited above, recent studies have shown that patients on anticoagulation tend to have smaller vegetations and fewer cerebrovascular complications.11–13 Snygg-Martin et al11 and Rasmussen et al12 found not only that cerebrovascular complications were less common in patients already on anticoagulation at the time infectious endocarditis was diagnosed, but also that no increase in the rate of hemorrhagic lesions was reported.
These were all nonrandomized studies, and most of the patients in them had native valve infectious endocarditis diagnosed at an early stage. Importantly, these studies found that the beneficial effects of anticoagulation were only present if the patient was receiving warfarin before infectious endocarditis was diagnosed and antibiotic therapy was initiated. No benefits from anticoagulation were demonstrated once antimicrobial therapy was begun.
Similarly, Anavekar et al14 showed that embolic events occurred significantly less often in those who were currently on continuous daily antiplatelet therapy, suggesting that receiving antiplatelet agents at baseline protects against cardioembolic events in patients who develop infective endocarditis. However, the only randomized trial examining the initiation of antiplatelet therapy in patients diagnosed with infectious endocarditis receiving antibiotic treatment showed that adding aspirin did not reduce the risk of embolic events and was associated with a trend toward increased risk of bleeding.15
A recent large cohort study suggested that infectious endocarditis patients who receive anticoagulation therapy may have a higher incidence of cerebrovascular complications (hazard ratio 1.31, 95% confidence interval 1.00–1.72, P = .048), with a particular association of anticoagulation therapy with intracranial bleeding (hazard ratio 2.71, 95% confidence interval 1.54–4.76, P = .001).16
Another provocative link supported by the same study was a higher incidence of hemorrhagic complications with anticoagulation in patients with infectious endocarditis caused by Staphylococcus aureus, an association also suggested by older data from Tornos et al,8 but not seen in a study by Rasmussen et al.12
Continuing anticoagulation is an individualized decision
The benefit or harm of anticoagulation in patients with infectious endocarditis may be determined at least in part by a complex mix of factors including the valve involved (embolic events are more common with mitral valve vegetations than with aortic valve vegetations), vegetation size (higher risk if > 1 cm), mobility of vegetations, and perhaps the virulence of the causative organism.16,17 The fact that antimicrobial therapy obviates any beneficial effect of anticoagulation speaks strongly against starting anticoagulation therapy in infectious endocarditis patients with the sole purpose of reducing stroke risk.
Without large randomized trials to better delineate the risks and benefits of continuing preexisting anticoagulation in all patients with infectious endocarditis, patients already receiving anticoagulants need a careful, individualized risk-benefit assessment. Current guidelines agree that newly diagnosed infectious endocarditis per se is not an indication for anticoagulation or aspirin therapy (Table 1).1–3
TAKE-HOME POINTS
- Starting antiplatelet and anticoagulation therapy for the sole purpose of stroke prevention is not recommended in patients with newly diagnosed infectious endocarditis.
- In most cases, anticoagulation and antiplatelet therapy should be temporarily discontinued in patients with infectious endocarditis and stroke or suspected stroke.
- Patients need careful assessment on a case-by-case basis, and the presence of risk factors predisposing patients to cerebrovascular complications (eg, large or very mobile vegetations, causative pathogens such as S aureus or Candida spp) may prompt temporary suspension of anticoagulation and antiplatelet therapy.
- If there is a clear preexisting or coexisting indication for these agents and surgery is not anticipated, consider continuing antiplatelet and anticoagulant therapy in patients with infectious endocarditis, provided they lack the risk factors described above and stroke has been excluded.
- If there is a clear preexisting or coexisting indication for these agents and surgery is being considered, consider using a short-acting anticoagulant such as intravenous or low-molecular weight heparin as a bridge to surgery.
- Baddour LM, Wilson WR, Bayer AS, et al. Infective endocarditis in adults: diagnosis, antimicrobial therapy, and management of complications: a scientific statement for healthcare professionals from the American Heart Association. Circulation 2015; 132:1435–1486.
- Habib G, Lancellotti P, Antunes MJ, et al. 2015 ESC guidelines for the management of infective endocarditis. Rev Esp Cardiol (Engl Ed) 2016; 69:69.
- Whitlock RP, Sun JC, Fremes SE, Rubens FD, Teoh KH. Antithrombotic and thrombolytic therapy for valvular disease: Antithrombotic Therapy and Prevention of Thrombosis, 9th ed: American College of Chest Physicians evidence-based clinical practice guidelines. Chest 2012; 141:e576S–e600S.
- Delahaye JP, Poncet P, Malquarti V, Beaune J, Garé JP, Mann JM. Cerebrovascular accidents in infective endocarditis: role of anticoagulation. Eur Heart J 1990; 11:1074–1078.
- Loewe L. The combined use of anti-infectives and anticoagulants in the treatment of subacute bacterial endocarditis. Bull N Y Acad Med 1945; 21:59–86.
- Priest WS, Smith JM, McGee GC. The effect of anticoagulants on the penicillin therapy and the pathologic lesions of subacute bacterial endocarditis. N Engl J Med 1946; 235:699–706.
- Pruitt AA, Rubin RH, Karchmer AW, Duncan GW. Neurologic complications of bacterial endocarditis. Medicine 1978; 57:329–343.
- Tornos P, Almirante B, Mirabet S, Permanyer G, Pahissa A, Soler-Soler J. Infective endocarditis due to Staphylococcus aureus: deleterious effect of anticoagulant therapy. Arch Intern Med 1999; 159:473–475.
- Wilson WR, Geraci JE, Danielson GK, et al. Anticoagulant therapy and central nervous system complications in patients with prosthetic valve endocarditis. Circulation 1978; 57:1004–1007.
- Schulz R, Werner GS, Fuchs JB, et al. Clinical outcome and echocardiographic findings of native and prosthetic valve endocarditis in the 1990’s. Eur Heart J 1996; 17:281–288.
- Snygg-Martin U, Rasmussen RV, Hassager C, Bruun NE, Andersson R, Olaison L. Warfarin therapy and incidence of cerebrovascular complications in left-sided native valve endocarditis. Eur J Clin Microbiol Infect Dis 2011; 30:151–157.
- Rasmussen RV, Snygg-Martin U, Olaison L, et al. Major cerebral events in Staphylococcus aureus infective endocarditis: is anticoagulant therapy safe? Cardiology 2009; 114:284–291.
- Yau JW, Lee P, Wilson A, Jenkins AJ. Prosthetic valve endocarditis: what is the evidence for anticoagulant therapy? Intern Med J 2011; 41:795–797.
- Anavekar NS, Tleyjeh IM, Mirzoyev Z, et al. Impact of prior antiplatelet therapy on risk of embolism in infective endocarditis. Clin Infect Dis 2007; 44:1180–1186.
- Chan KL, Dumesnil JG, Cujec B, et al. A randomized trial of aspirin on the risk of embolic events in patients with infective endocarditis. J Am Coll Cardiol 2003; 42:775–780.
- Garcia-Cabrera E, Fernández-Hidalgo N, Almirante B, et al. Neurological complications of infective endocarditis: risk factors, outcome, and impact of cardiac surgery: a multicenter observational study. Circulation 2013; 127:2272–2284.
- Thuny F, Di Salvo G, Belliard O, et al. Risk of embolism and death in infective endocarditis: prognostic value of echocardiography: a prospective multicenter study. Circulation 2005; 112:69–75.
- Baddour LM, Wilson WR, Bayer AS, et al. Infective endocarditis in adults: diagnosis, antimicrobial therapy, and management of complications: a scientific statement for healthcare professionals from the American Heart Association. Circulation 2015; 132:1435–1486.
- Habib G, Lancellotti P, Antunes MJ, et al. 2015 ESC guidelines for the management of infective endocarditis. Rev Esp Cardiol (Engl Ed) 2016; 69:69.
- Whitlock RP, Sun JC, Fremes SE, Rubens FD, Teoh KH. Antithrombotic and thrombolytic therapy for valvular disease: Antithrombotic Therapy and Prevention of Thrombosis, 9th ed: American College of Chest Physicians evidence-based clinical practice guidelines. Chest 2012; 141:e576S–e600S.
- Delahaye JP, Poncet P, Malquarti V, Beaune J, Garé JP, Mann JM. Cerebrovascular accidents in infective endocarditis: role of anticoagulation. Eur Heart J 1990; 11:1074–1078.
- Loewe L. The combined use of anti-infectives and anticoagulants in the treatment of subacute bacterial endocarditis. Bull N Y Acad Med 1945; 21:59–86.
- Priest WS, Smith JM, McGee GC. The effect of anticoagulants on the penicillin therapy and the pathologic lesions of subacute bacterial endocarditis. N Engl J Med 1946; 235:699–706.
- Pruitt AA, Rubin RH, Karchmer AW, Duncan GW. Neurologic complications of bacterial endocarditis. Medicine 1978; 57:329–343.
- Tornos P, Almirante B, Mirabet S, Permanyer G, Pahissa A, Soler-Soler J. Infective endocarditis due to Staphylococcus aureus: deleterious effect of anticoagulant therapy. Arch Intern Med 1999; 159:473–475.
- Wilson WR, Geraci JE, Danielson GK, et al. Anticoagulant therapy and central nervous system complications in patients with prosthetic valve endocarditis. Circulation 1978; 57:1004–1007.
- Schulz R, Werner GS, Fuchs JB, et al. Clinical outcome and echocardiographic findings of native and prosthetic valve endocarditis in the 1990’s. Eur Heart J 1996; 17:281–288.
- Snygg-Martin U, Rasmussen RV, Hassager C, Bruun NE, Andersson R, Olaison L. Warfarin therapy and incidence of cerebrovascular complications in left-sided native valve endocarditis. Eur J Clin Microbiol Infect Dis 2011; 30:151–157.
- Rasmussen RV, Snygg-Martin U, Olaison L, et al. Major cerebral events in Staphylococcus aureus infective endocarditis: is anticoagulant therapy safe? Cardiology 2009; 114:284–291.
- Yau JW, Lee P, Wilson A, Jenkins AJ. Prosthetic valve endocarditis: what is the evidence for anticoagulant therapy? Intern Med J 2011; 41:795–797.
- Anavekar NS, Tleyjeh IM, Mirzoyev Z, et al. Impact of prior antiplatelet therapy on risk of embolism in infective endocarditis. Clin Infect Dis 2007; 44:1180–1186.
- Chan KL, Dumesnil JG, Cujec B, et al. A randomized trial of aspirin on the risk of embolic events in patients with infective endocarditis. J Am Coll Cardiol 2003; 42:775–780.
- Garcia-Cabrera E, Fernández-Hidalgo N, Almirante B, et al. Neurological complications of infective endocarditis: risk factors, outcome, and impact of cardiac surgery: a multicenter observational study. Circulation 2013; 127:2272–2284.
- Thuny F, Di Salvo G, Belliard O, et al. Risk of embolism and death in infective endocarditis: prognostic value of echocardiography: a prospective multicenter study. Circulation 2005; 112:69–75.

The PARADIGM-HF trial
To the Editor: Two considerations concerning the interpretation of the Prospective Comparison of ARNI with ACEI to Determine Impact on Global Mortality and Morbidity in Heart Failure (PARADIGM-HF) trial are not addressed in the article by Sabe et al regarding a new class of drugs for systolic heart failure.1 First of all, the PARADIGM-HF trial compared the maximal dose of sacubitril with a less-than-maximal dose of enalapril. Secondly, sacubitril lowered blood pressure more than enalapril.
The angiotensin receptor blocker dose in sacubitril 200 mg is equivalent to valsartan 160 mg.2 Accordingly, the angiotensin receptor blocker in sacubitril 200 mg twice daily is equivalent to the maximal dosage of valsartan approved by the US Food and Drug Administration. The dosage of enalapril in the PARADIGM-HF trial was 10 mg twice daily. While the target enalapril dosage for heart failure is 10 to 20 mg twice daily,3 the dosage of enalapril in PARADIGM-HF was half the maximal approved dosage.
In the PARADIGM-HF trial, sacubitril 200 mg twice daily reduced the incidence of cardiovascular death by 19% compared with enalapril 10 mg twice daily (the rates were 16.5% vs 13.3%, respectively).2 That sacubitril lowered mean systolic blood pressure 3.2 ± 0.4 mm Hg more than enalapril2,4 may account for much of this benefit.
A 2002 study by Lewington et al5 found that a 2-mm Hg decrease in systolic blood pressure reduces the risk of cardiovascular death by 7% in middle-aged adults. Granted, this study did not involve heart failure patients, but if its results are remotely applicable, a 3.2-mm Hg reduction in systolic blood pressure might be expected to reduce the rate of cardiovascular deaths by 10% to 11%.
Would sacubitril be superior to enalapril if the maximal dose of enalapril were compared to the maximal dose of sacubitril? Would sacubitril be superior to enalapril if blood pressure were lowered comparably between the two groups? These are relevant questions that the PARADIGM-HF trial fails to answer.
- Sabe MA, Jacob MS, Taylor DO. A new class of drugs for systolic heart failure: the PARADIGM-HF study. Cleve Clin J Med 2015; 82:693–701.
- McMurray JJV, Packer M, Desai AS, et al; PARADIGM-HF Investigators and Committees. Angiotensin-neprilysin inhibition versus enalapril in heart failure. N Engl J Med 2014; 371:993–1004.
- Hunt SA; American College of Cardiology; American Heart Association Task Force on Practice Guidelines (Writing Committee to Update the 2001 Guidelines for the Evaluation and Management of Heart Failure). ACC/AHA 2005 guideline update for the diagnosis and management of chronic heart failure in the adult: a report of the American College of Cardiology/American Heart Association Task Force on Practice Guidelines (Writing Committee to Update the 2001 Guidelines for the Evaluation and Management of Heart Failure). J Am Coll Cardiol 2005; 46:e1–e82.
- Jessup J. Neprilysin inhibition—a novel therapy for heart failure. N Engl J Med 2014; 371:1062–1064.
- Lewington S, Clarke R, Qizilbash N, Peto R, Collins R; Prospective Studies Collaboration. Age-specific relevance of usual blood pressure to vascular mortality: a meta-analysis of individual data for one million adults in 61 prospective studies. Lancet 2002; 360:1903–1913.
To the Editor: Two considerations concerning the interpretation of the Prospective Comparison of ARNI with ACEI to Determine Impact on Global Mortality and Morbidity in Heart Failure (PARADIGM-HF) trial are not addressed in the article by Sabe et al regarding a new class of drugs for systolic heart failure.1 First of all, the PARADIGM-HF trial compared the maximal dose of sacubitril with a less-than-maximal dose of enalapril. Secondly, sacubitril lowered blood pressure more than enalapril.
The angiotensin receptor blocker dose in sacubitril 200 mg is equivalent to valsartan 160 mg.2 Accordingly, the angiotensin receptor blocker in sacubitril 200 mg twice daily is equivalent to the maximal dosage of valsartan approved by the US Food and Drug Administration. The dosage of enalapril in the PARADIGM-HF trial was 10 mg twice daily. While the target enalapril dosage for heart failure is 10 to 20 mg twice daily,3 the dosage of enalapril in PARADIGM-HF was half the maximal approved dosage.
In the PARADIGM-HF trial, sacubitril 200 mg twice daily reduced the incidence of cardiovascular death by 19% compared with enalapril 10 mg twice daily (the rates were 16.5% vs 13.3%, respectively).2 That sacubitril lowered mean systolic blood pressure 3.2 ± 0.4 mm Hg more than enalapril2,4 may account for much of this benefit.
A 2002 study by Lewington et al5 found that a 2-mm Hg decrease in systolic blood pressure reduces the risk of cardiovascular death by 7% in middle-aged adults. Granted, this study did not involve heart failure patients, but if its results are remotely applicable, a 3.2-mm Hg reduction in systolic blood pressure might be expected to reduce the rate of cardiovascular deaths by 10% to 11%.
Would sacubitril be superior to enalapril if the maximal dose of enalapril were compared to the maximal dose of sacubitril? Would sacubitril be superior to enalapril if blood pressure were lowered comparably between the two groups? These are relevant questions that the PARADIGM-HF trial fails to answer.
To the Editor: Two considerations concerning the interpretation of the Prospective Comparison of ARNI with ACEI to Determine Impact on Global Mortality and Morbidity in Heart Failure (PARADIGM-HF) trial are not addressed in the article by Sabe et al regarding a new class of drugs for systolic heart failure.1 First of all, the PARADIGM-HF trial compared the maximal dose of sacubitril with a less-than-maximal dose of enalapril. Secondly, sacubitril lowered blood pressure more than enalapril.
The angiotensin receptor blocker dose in sacubitril 200 mg is equivalent to valsartan 160 mg.2 Accordingly, the angiotensin receptor blocker in sacubitril 200 mg twice daily is equivalent to the maximal dosage of valsartan approved by the US Food and Drug Administration. The dosage of enalapril in the PARADIGM-HF trial was 10 mg twice daily. While the target enalapril dosage for heart failure is 10 to 20 mg twice daily,3 the dosage of enalapril in PARADIGM-HF was half the maximal approved dosage.
In the PARADIGM-HF trial, sacubitril 200 mg twice daily reduced the incidence of cardiovascular death by 19% compared with enalapril 10 mg twice daily (the rates were 16.5% vs 13.3%, respectively).2 That sacubitril lowered mean systolic blood pressure 3.2 ± 0.4 mm Hg more than enalapril2,4 may account for much of this benefit.
A 2002 study by Lewington et al5 found that a 2-mm Hg decrease in systolic blood pressure reduces the risk of cardiovascular death by 7% in middle-aged adults. Granted, this study did not involve heart failure patients, but if its results are remotely applicable, a 3.2-mm Hg reduction in systolic blood pressure might be expected to reduce the rate of cardiovascular deaths by 10% to 11%.
Would sacubitril be superior to enalapril if the maximal dose of enalapril were compared to the maximal dose of sacubitril? Would sacubitril be superior to enalapril if blood pressure were lowered comparably between the two groups? These are relevant questions that the PARADIGM-HF trial fails to answer.
- Sabe MA, Jacob MS, Taylor DO. A new class of drugs for systolic heart failure: the PARADIGM-HF study. Cleve Clin J Med 2015; 82:693–701.
- McMurray JJV, Packer M, Desai AS, et al; PARADIGM-HF Investigators and Committees. Angiotensin-neprilysin inhibition versus enalapril in heart failure. N Engl J Med 2014; 371:993–1004.
- Hunt SA; American College of Cardiology; American Heart Association Task Force on Practice Guidelines (Writing Committee to Update the 2001 Guidelines for the Evaluation and Management of Heart Failure). ACC/AHA 2005 guideline update for the diagnosis and management of chronic heart failure in the adult: a report of the American College of Cardiology/American Heart Association Task Force on Practice Guidelines (Writing Committee to Update the 2001 Guidelines for the Evaluation and Management of Heart Failure). J Am Coll Cardiol 2005; 46:e1–e82.
- Jessup J. Neprilysin inhibition—a novel therapy for heart failure. N Engl J Med 2014; 371:1062–1064.
- Lewington S, Clarke R, Qizilbash N, Peto R, Collins R; Prospective Studies Collaboration. Age-specific relevance of usual blood pressure to vascular mortality: a meta-analysis of individual data for one million adults in 61 prospective studies. Lancet 2002; 360:1903–1913.
- Sabe MA, Jacob MS, Taylor DO. A new class of drugs for systolic heart failure: the PARADIGM-HF study. Cleve Clin J Med 2015; 82:693–701.
- McMurray JJV, Packer M, Desai AS, et al; PARADIGM-HF Investigators and Committees. Angiotensin-neprilysin inhibition versus enalapril in heart failure. N Engl J Med 2014; 371:993–1004.
- Hunt SA; American College of Cardiology; American Heart Association Task Force on Practice Guidelines (Writing Committee to Update the 2001 Guidelines for the Evaluation and Management of Heart Failure). ACC/AHA 2005 guideline update for the diagnosis and management of chronic heart failure in the adult: a report of the American College of Cardiology/American Heart Association Task Force on Practice Guidelines (Writing Committee to Update the 2001 Guidelines for the Evaluation and Management of Heart Failure). J Am Coll Cardiol 2005; 46:e1–e82.
- Jessup J. Neprilysin inhibition—a novel therapy for heart failure. N Engl J Med 2014; 371:1062–1064.
- Lewington S, Clarke R, Qizilbash N, Peto R, Collins R; Prospective Studies Collaboration. Age-specific relevance of usual blood pressure to vascular mortality: a meta-analysis of individual data for one million adults in 61 prospective studies. Lancet 2002; 360:1903–1913.
In reply: The PARADIGM-HF trial
In Reply: We thank Dr. Blankfield for raising these two important points. Although the findings of the PARADIGM-HF study are compelling, the design and results of this trial have incited many questions.
To address his first point, about the differential dosages of the two drugs, we agree, and we did mention in our review that one concern about the results of PARADIGM-HF is the unequal dosages of valsartan and enalapril in the two different arms. We mentioned that this dosage of enalapril was chosen based on its survival benefit in previous trials. However, this still raises the question of whether the benefit seen in the sacubitril-valsartan group was due to greater inhibition of the renin-angiotensin-aldosterone system rather than to the new drug.
To address his second point, the decrease in blood pressure in the sacubitril-valsartan arm was significant, and the patients taking this drug were more likely to have symptomatic hypotension, which may contribute to patient intolerance and difficulty initiating treatment with this drug. Dr. Blankfield brings up an interesting point regarding reduction of blood pressure driving the decrease of events in the sacubitril-valsartan group. In the original trial results section, the authors mentioned that when the difference in blood pressure between the two groups was examined as a time-dependent covariate, it was not a significant predictor of the benefit of sacubitril-valsartan.1
Furthermore, although higher blood pressure is associated with worse cardiovascular outcomes in the general population, higher blood pressure has been shown to be protective in heart failure patients.2 Several studies have shown that the relationship between blood pressure and the mortality rate in patients with heart failure is paradoxical and complex.2–4 Lee et al3 found that this relationship was U-shaped, with increased mortality risk in those with high and low blood pressures (< 120 mm Hg). Ather et al4 also showed that the relationship was U-shaped in patients with a mild to moderate reduction in left ventricular ejection fraction, but linear in those with severely reduced ejection fraction. This study also found that a decrease in systolic blood pressure below 110 mm Hg was associated with increased mortality risk.
The findings of PARADIGM-HF have sparked much conversation and implementation of practice change in the treatment of heart failure patients, and we await additional data on the use and limitations of sacubitril-valsartan in this group of patients.
- McMurray JJV, Packer M, Desai AS, et al. Angiotensin-neprilysin inhibition versus enalapril in heart failure. N Engl J Med 2014; 371:993–1004.
- Raphael CE, Whinnett ZI, Davies JE, et al. Quantifying the paradoxical effect of higher systolic blood pressure on mortality in chronic heart failure. Heart 2009; 95:56–62.
- Lee DS, Ghosh N, Floras JS, et al. Association of blood pressure at hospital discharge with mortality in patients diagnosed with heart failure. Circ Heart Fail 2009; 2:616-623.
- Ather S, Chan W, Chillar A, et al. Association of systolic blood pressure with mortality in patients with heart failure with reduced ejection fraction: a complex relationship. Am Heart J 2011; 161:567–573.
In Reply: We thank Dr. Blankfield for raising these two important points. Although the findings of the PARADIGM-HF study are compelling, the design and results of this trial have incited many questions.
To address his first point, about the differential dosages of the two drugs, we agree, and we did mention in our review that one concern about the results of PARADIGM-HF is the unequal dosages of valsartan and enalapril in the two different arms. We mentioned that this dosage of enalapril was chosen based on its survival benefit in previous trials. However, this still raises the question of whether the benefit seen in the sacubitril-valsartan group was due to greater inhibition of the renin-angiotensin-aldosterone system rather than to the new drug.
To address his second point, the decrease in blood pressure in the sacubitril-valsartan arm was significant, and the patients taking this drug were more likely to have symptomatic hypotension, which may contribute to patient intolerance and difficulty initiating treatment with this drug. Dr. Blankfield brings up an interesting point regarding reduction of blood pressure driving the decrease of events in the sacubitril-valsartan group. In the original trial results section, the authors mentioned that when the difference in blood pressure between the two groups was examined as a time-dependent covariate, it was not a significant predictor of the benefit of sacubitril-valsartan.1
Furthermore, although higher blood pressure is associated with worse cardiovascular outcomes in the general population, higher blood pressure has been shown to be protective in heart failure patients.2 Several studies have shown that the relationship between blood pressure and the mortality rate in patients with heart failure is paradoxical and complex.2–4 Lee et al3 found that this relationship was U-shaped, with increased mortality risk in those with high and low blood pressures (< 120 mm Hg). Ather et al4 also showed that the relationship was U-shaped in patients with a mild to moderate reduction in left ventricular ejection fraction, but linear in those with severely reduced ejection fraction. This study also found that a decrease in systolic blood pressure below 110 mm Hg was associated with increased mortality risk.
The findings of PARADIGM-HF have sparked much conversation and implementation of practice change in the treatment of heart failure patients, and we await additional data on the use and limitations of sacubitril-valsartan in this group of patients.
In Reply: We thank Dr. Blankfield for raising these two important points. Although the findings of the PARADIGM-HF study are compelling, the design and results of this trial have incited many questions.
To address his first point, about the differential dosages of the two drugs, we agree, and we did mention in our review that one concern about the results of PARADIGM-HF is the unequal dosages of valsartan and enalapril in the two different arms. We mentioned that this dosage of enalapril was chosen based on its survival benefit in previous trials. However, this still raises the question of whether the benefit seen in the sacubitril-valsartan group was due to greater inhibition of the renin-angiotensin-aldosterone system rather than to the new drug.
To address his second point, the decrease in blood pressure in the sacubitril-valsartan arm was significant, and the patients taking this drug were more likely to have symptomatic hypotension, which may contribute to patient intolerance and difficulty initiating treatment with this drug. Dr. Blankfield brings up an interesting point regarding reduction of blood pressure driving the decrease of events in the sacubitril-valsartan group. In the original trial results section, the authors mentioned that when the difference in blood pressure between the two groups was examined as a time-dependent covariate, it was not a significant predictor of the benefit of sacubitril-valsartan.1
Furthermore, although higher blood pressure is associated with worse cardiovascular outcomes in the general population, higher blood pressure has been shown to be protective in heart failure patients.2 Several studies have shown that the relationship between blood pressure and the mortality rate in patients with heart failure is paradoxical and complex.2–4 Lee et al3 found that this relationship was U-shaped, with increased mortality risk in those with high and low blood pressures (< 120 mm Hg). Ather et al4 also showed that the relationship was U-shaped in patients with a mild to moderate reduction in left ventricular ejection fraction, but linear in those with severely reduced ejection fraction. This study also found that a decrease in systolic blood pressure below 110 mm Hg was associated with increased mortality risk.
The findings of PARADIGM-HF have sparked much conversation and implementation of practice change in the treatment of heart failure patients, and we await additional data on the use and limitations of sacubitril-valsartan in this group of patients.
- McMurray JJV, Packer M, Desai AS, et al. Angiotensin-neprilysin inhibition versus enalapril in heart failure. N Engl J Med 2014; 371:993–1004.
- Raphael CE, Whinnett ZI, Davies JE, et al. Quantifying the paradoxical effect of higher systolic blood pressure on mortality in chronic heart failure. Heart 2009; 95:56–62.
- Lee DS, Ghosh N, Floras JS, et al. Association of blood pressure at hospital discharge with mortality in patients diagnosed with heart failure. Circ Heart Fail 2009; 2:616-623.
- Ather S, Chan W, Chillar A, et al. Association of systolic blood pressure with mortality in patients with heart failure with reduced ejection fraction: a complex relationship. Am Heart J 2011; 161:567–573.
- McMurray JJV, Packer M, Desai AS, et al. Angiotensin-neprilysin inhibition versus enalapril in heart failure. N Engl J Med 2014; 371:993–1004.
- Raphael CE, Whinnett ZI, Davies JE, et al. Quantifying the paradoxical effect of higher systolic blood pressure on mortality in chronic heart failure. Heart 2009; 95:56–62.
- Lee DS, Ghosh N, Floras JS, et al. Association of blood pressure at hospital discharge with mortality in patients diagnosed with heart failure. Circ Heart Fail 2009; 2:616-623.
- Ather S, Chan W, Chillar A, et al. Association of systolic blood pressure with mortality in patients with heart failure with reduced ejection fraction: a complex relationship. Am Heart J 2011; 161:567–573.