User login
Plant-based or animal-based diet: Which is better?
This transcript has been edited for clarity.
Dr. Jain: I’m Akshay Jain, an endocrinologist in Vancouver. This is Dr. Christopher Gardner, a nutritional scientist at Stanford. He is the author of many publications, including the widely cited SWAP-MEAT study. He was also a presenter at the American Diabetes Association conference in San Diego in 2023.
We’ll be talking about his work and the presentation that he did classifying different kinds of diets as well as the pluses and minuses of a plant-based diet versus an animal-based diet. Welcome, Dr Gardner.
Dr. Gardner: Glad to be here.
Dr. Jain: Let’s get right into this. There’s obviously been a large amount of talk, both in the lay media and in the scientific literature, on plant-based diets versus animal-based diets.
Dr. Gardner: I think this is one of those false dichotomies. It’s really not all one or all the other. Two of my favorite sayings are “with what” and “instead of what.” You may be thinking, I’m really going to go for animal based. I know it’s low carb. I have diabetes. I know animal foods have few carbs in them.
That’s true. But think of some of the more and the less healthy animal foods. Yogurt is a great choice for an animal food. Fish is a great choice for an animal food with omega-3s. Chicken McNuggets, not so much.
Then, you switch to the plant side and say: “I’ve heard all these people talking about a whole-food, plant-based diet. That sounds great. I’m thinking broccoli and chickpeas.”
I know there’s somebody out there saying: “I just had a Coke. Isn’t that plant based? I just had a pastry. Isn’t that full of plants?” It doesn’t really take much to think about this, but it’s not as dichotomous as animal versus plant.
Dr. Jain: There is, obviously, a good understanding regarding what actually constitutes the diet. Initially, people were saying that animal-based diets are really bad from a cardiovascular perspective. But now, some studies are suggesting that it may not be true. What’s your take on that?
Dr. Gardner: Again, if you think “with what” or “instead of what,” microbiome is a super-hot topic. That’s really fiber and fermented food, which are only plants. Saturated fat, despite all the controversy, raises your blood cholesterol. It’s more prevalent in animal foods than in plant foods.
Are there any great nutrients in animal foods? Sure. There’s calcium in dairy products for osteoporosis. There’s iron. Actually, people can get too much iron, which can be a pro-oxidant in levels that are too high.
The American Heart Association, in particular, which I’m very involved with, came out with new guidelines in 2021. It was very plant focused. The top of the list was vegetables, fruits, whole grains, and protein. When it came to protein, it was mostly from lentils, beans, and grains.
Dr. Jain: That’s good to know. Let’s talk about protein. We often hear about how somebody on a plant-based diet only can never have all the essential amino acids and the amount of protein that one needs. Whether it’s for general everyday individuals or even more so for athletes or bodybuilders, you cannot get enough good-quality protein from a plant-based diet.
Is there any truth to that? If not, what would you suggest for everyday individuals on a plant-based diet?
Dr. Gardner: This one drives me nuts. Please stop obsessing about protein. This isn’t a very scientific answer, but go watch the documentary Game Changers, which is all about vegan athletes. There are some pretty hokey things in that film that are very unscientific.
Let’s go back to basics, since we only have a couple of minutes together. It is a myth that plants don’t have all the amino acids, including all nine essential amino acids. I have several YouTube rants about this if anybody wants to search “Gardner Stanford protein.” All plant foods have all nine essential amino acids and all 20 amino acids.
There is a modest difference. Grains tend to be a little low in lysine, and beans tend to be a little low in methionine. Part of this has to do with how much of a difference is a little low. If you go to protein requirements that were written up in 2005 by the Institute of Medicine, you’ll see that the estimated average requirement for adults is 0.66 g/kg of body weight.
If we recommended the estimated average requirement for everyone, and everyone got it, by definition, half the population would be deficient. We have recommended daily allowances. The recommended daily allowances include two standard deviations above the estimated average requirement. Why would we do that? It’s a population approach.
If that’s the goal and everybody got it, you’d actually still have the tail of the normal distribution that would be deficient, which would be about 2.5%. The flip side of that argument is how many would exceed their requirement? That’s 97.5% of the population who would exceed their requirement if they got the recommended daily allowance.
The recommended daily allowance translates to about 45 g of protein per day for women and about 55 g of protein per day for men. Today, men and women in the United States get 80 g, 90 g, and 100 g of protein per day. What I hear them say is: “I’m not sure if I need the recommended daily allowance. I feel like I’m extra special or I’m above the curve and I want to make sure I’m getting enough.”
The recommended daily allowance already has a safety buffer in it. It was designed that way.
Let’s flip to athletes just for a second. Athletes want to be more muscular and make sure they’re supporting their activity. Americans get 1.2-1.5 g of protein per kg of body weight per day, which is almost double.
Athletes don’t eat as many calories as the average American does. If they’re working out to be muscular, they’re not eating 2,000 or 2,500 calories per day. I have a Rose Bowl football player teaching assistant from a Human Nutrition class at Stanford. He logged what he was eating for his football workouts. He was eating 5,000 calories per day. He was getting 250 g of protein per day, without any supplements or shakes.
I really do think this whole protein thing is a myth. As long as you get a reasonable amount of variety in your diet, there is no problem meeting your protein needs. Vegetarians? Absolutely no problem because they’re getting dairy and some eggs and things. Even vegans are likely fine. They would have to pay a little more attention to this, but I know many very strong, healthy vegans.
Dr. Jain: This is so helpful, Dr Gardner. I know that many clinicians, including myself, will find this very helpful, including when we talk to our patients and counsel them on their requirements. Thanks for sharing that.
Final question for you. We know people who are on either side of the extreme: either completely plant based or completely animal based. For a majority of us that have some kind of a happy medium, what would your suggestions be as far as the macronutrient distribution that you would recommend from a mixed animal- and plant-based diet? What would be the ideal recommendations here?
Dr. Gardner: We did a huge weight loss study with people with prediabetes. It was as low in carbs as people could go and as low in fat as people could go. That didn’t end up being the ketogenic level or the low-fat, vegan level. That ended up being much more moderate.
We found that people were successful either on low carb or low fat. Interestingly, on both diets, protein was very similar. Let’s not get into that since we just did a lot of protein. The key was a healthy low carb or a healthy low fat. I actually think we have a lot of wiggle room there. Let me build on what you said just a moment ago.
I really don’t think you need to be vegan to be healthy. We prefer the term whole food, plant based. If you’re getting 70% or 80% of your food from plants, you’re fine. If you really want to get the last 5%, 10%, or 15% all from plants, the additional benefit is not going to be large. You might want to do that for the environment or animal rights and welfare, but from a health perspective, a whole-food, plant-based diet leaves room for some yogurt, fish, and maybe some eggs for breakfast instead of those silly high-carb breakfasts that most Americans eat.
I will say that animal foods have no fiber. Given what a hot topic the microbiome is these days, the higher and higher you get in animal food, it’s going to be really hard to get antioxidants, most of which are in plants, and very hard to get enough fiber, which is good for the microbiome.
That’s why I tend to follow along the lines of a whole-food, plant-based diet that leaves some room for meat and animal-sourced foods, which you could leave out and be fine. I wouldn’t go in the opposite direction to the all-animal side.
Dr. Jain: That was awesome. Thank you so much, Dr Gardner. Final pearl of wisdom here. When clinicians like us see patients with diabetes, what should be the final take-home message that we can counsel our patients about?
Dr. Gardner: That’s a great question. I don’t think it’s really so much animal or plants; it’s actually type of carbohydrate. There’s a great paper out of JAMA in 2019 or 2020 by Shan and colleagues. They looked at the proportion of calories from proteins, carbs, and fats over about 20 years, and they looked at the subtypes.
Very interestingly, protein from animal foods is about 10% of calories; from plants, about 5%; mono-, poly-, and saturated fats are all about 10% of calories; and high-quality carbohydrates are about 10% of calories. What’s left is 40% of calories from crappy carbohydrates. We eat so many calories from added sugars and refined grains, and those are plant-based. Added sugars and refined grains are plant-based.
In terms of a lower-carbohydrate diet, there is an immense amount of room for cutting back on that 40%. What would you do with that? Would you eat more animal food? Would you eat more plant food? This is where I think we have a large amount of wiggle room. If the patients could get rid of all or most of that 40%, they could pick some eggs, yogurt, fish, and some high-fat foods. They could pick avocados, nuts, seeds, and olive oil or they could have more broccoli, chickpeas, tempeh, and tofu.
There really is a large amount of wiggle room. The key – can we please get rid of the elephant in the room, which is plant food – is all that added sugar and refined grain.
Dr. Jain is an endocrinologist and clinical instructor University of British Columbia, Vancouver. Dr. Gardner is a professor of medicine at Stanford (Calif.) University. Dr. Jain reported numerous conflicts of interest with various companies; Dr. Gardner reported receiving research funding from Beyond Meat.
A version of this article first appeared on Medscape.com.
Semaglutide use surges in U.S. adults with type 2 diabetes
according to a retrospective analysis of insurance claims data from more than 1 million individuals.
By January–March 2022, 56.6% of U.S. adults with type 2 diabetes prescribed an incretin-based treatment were taking a GLP-1 agonist and 38.7% were taking a DPP-4 inhibitor, Elisabetta Patorno, MD, and colleagues reported in an abstract released in advance of the annual meeting of the European Association for the Study of Diabetes.
These usage rates sharply diverged from the earliest period the researchers examined – 4 years earlier in January–March 2018 – when DPP-4 inhibitors were used by 62.4% of adults with type 2 diabetes on any incretin-based regimen and 37.6% were taking a GLP-1 agonist.
This shift was largely driven by accumulating evidence for clinically meaningful weight loss with GLP-1 agonists, especially semaglutide when used for people with type 2 diabetes as Ozempic (Novo Nordisk) or for treating people with obesity as Wegovy (Novo Nordisk).
Market share of GLP-1 agonists ‘likely to expand’ further
“The importance of the DPP-4 inhibitor class will further decrease when effective alternatives such as GLP-1 agonists and sodium-glucose cotransporter 2 inhibitors can be used,” said Alexander Kutz, MD, a coauthor of the report, in a statement released by EASD.
“The market share of GLP-1 agonists is likely to expand in patients with type 2 diabetes,” especially those who also have obesity, said Dr. Kutz, who like Dr. Patorno is a pharmacoepidemiologist at Brigham and Women’s Hospital in Boston.
Incretin-based agents currently account for roughly a third of all medications prescribed to people with type 2 diabetes, the authors said. GLP-1 is an incretin hormone, and receptor agonists mimic its action. The DPP-4 enzyme inactivates incretin hormones, and so inhibiting the enzyme boosts incretin activity.
The obesity-driven shift in positioning of agents for people with type 2 diabetes will likely extend to tirzepatide (Mounjaro), which acts as both a GLP-1 agonist and has agonist activity on the receptor for another incretin, glucose-dependent insulinotropic polypeptide. The Food and Drug Administration approved tirzepatide for type 2 diabetes in May 2022, too late for inclusion in the data the researchers reviewed. Plus, tirzepatide prescribing may lag for a few years as clinicians gain experience, and some might await results from the cardiovascular outcomes trial SURPASS-CVOT , said Dr. Kutz. SURPASS-CVOT has enrolled more than 13,000 adults with type 2 diabetes and is currently scheduled to finish by October 2024.
Injected semaglutide had the biggest gain
The study by Dr. Patorno and colleagues included 1,065,592 U.S. adults with type 2 diabetes taking an incretin-based medication in the Clinformatics Data Mart database maintained by Optum on claims it processed on behalf of various U.S. commercial insurers, including insurers that service certain Medicare beneficiaries.
The claims data had granularity for specific agents in the GLP-1 agonist class. Injected semaglutide, given once weekly, spiked from no use early in 2018 to a third of GLP-1 agonist use by the start of 2022.
However, use of liraglutide (Victoza, Novo Nordisk), a daily subcutaneous injection, dropped from a 44.2% share in early 2018 to 10.0% in early 2022. Dulaglutide (Trulicity, Lilly), a weekly injection, showed a small increase, from a 35.2% share in 2018 to 42.1% in 2022, and oral semaglutide (Rybelsus, Novo Nordisk) jumped from no use in 2018 to a 7.7% share in 2022. Among the DPP-4 inhibitors, sitagliptin (Januvia, Merck) was most commonly used, followed by linagliptin (Tradjenta, Boehringer Ingelheim) and saxagliptin (Onglyza, AstraZeneca). Use of all three DPP-4 inhibitors fell from 2018 to 2022.
Additional analyses showed that, compared with people starting a DPP-4 inhibitor during the period examined, those who started a GLP-1 agonist were 54%-64% more likely to have obesity and 18%-46% more likely to receive care from an endocrinologist. Those starting a GLP-1 agonist were also significantly less likely to have chronic kidney disease or dementia.
Although Dr. Kutz and Dr. Patorno foresee continued increases in the use of agents that act as GLP-1 agonists in U.S. adults with type 2 diabetes, they also stressed the ongoing role for sitagliptin and other DPP-4 inhibitors.
This class “may still be preferred in older and multimorbid patients at higher risk for frailty,” such as patients who live in nursing homes, they said in the EASD statement.
The study received no commercial funding. Dr. Patorno reported no relevant financial relationships. Dr. Kutz reported receiving an educational grant from Novo Nordisk, the company that markets semaglutide and liraglutide.
A version of this article appeared on Medscape.com.
FROM EASD 2023
Pregnancy risks elevated in women with chronic pancreatitis
TOPLINE:
METHODOLOGY:
- A retrospective analysis of hospital discharge records from the National Inpatient Sample database between 2009 and 2019 was conducted.
- The sample included 3,094 pregnancies with chronic pancreatitis and roughly 40.8 million pregnancies without this condition.
- The study focused on primary maternal outcomes and primary perinatal outcomes in pregnancies affected by chronic pancreatitis after accounting for relevant covariates.
TAKEAWAY:
- Chronic pancreatitis pregnancies had elevated rates of gestational diabetes (adjusted odds ratio, 1.63), gestational hypertensive complications (aOR, 2.48), preterm labor (aOR, 3.10), and small size for gestational age (aOR, 2.40).
- Women with chronic pancreatitis and a history of renal failure were more prone to gestational hypertensive complications (aOR, 20.09).
- Women with alcohol-induced chronic pancreatitis had a 17-fold higher risk for fetal death (aOR, 17.15).
- Pregnancies with chronic pancreatitis were associated with longer hospital stays and higher hospital costs.
IN PRACTICE:
“Our study provides novel insights into the impact of chronic pancreatitis on maternal and fetal health. The implications of our findings are critical for health care professionals, particularly those involved in preconception counseling. Pregnant women with chronic pancreatitis should be under the care of a multidisciplinary team of health care providers,” the authors advise.
SOURCE:
The study was led by Chengu Niu, MD, with Rochester General Hospital, Rochester, N.Y. It was published online July 18 in Digestive and Liver Disease. The study had no specific funding.
LIMITATIONS:
The authors note potential inaccuracies because of coding in the National Inpatient Sample database, a lack of detailed information regarding medication use, and a lack of follow-up clinical information. The findings are specific to the United States and may not be applicable to other countries.
DISCLOSURES:
The authors have no relevant disclosures.
A version of this article appeared on Medscape.com.
Statins post PCI: Moderate intensity plus ezetimibe may be preferable
, suggests a “real-world” cohort study that is consistent with trial evidence.
In the observational study with more than 273,000 patients who received percutaneous coronary intervention (PCI) with drug-eluting stents (DES), risk for a broad composite clinical primary endpoint fell by one-fourth (P < .001) among those put on the two-drug regimen with a moderate-intensity statin, compared with those getting a high-intensity statin alone.
The dual-agent approach was also associated with a 15% drop in statin discontinuation and a 20% reduced risk for new-onset diabetes requiring medication (P < .001 for both benefits), reported investigators in the Journal of the American College of Cardiology.
The study’s primary endpoint – a composite of cardiovascular (CV) death, myocardial infarction (MI), coronary revascularization, heart failure (HF) hospitalization, or nonfatal stroke at 3 years – replicated that of the randomized RACING trial conducted by many of the same researchers and published about a year ago in The Lancet.
RACING demonstrated that ezetimibe plus a moderate-intensity statin could be as effective as a high-intensity statin in patients with CV disease, “but have fewer side effects and better compliance,” Myeong-Ki Hong, MD, PhD, Severance Hospital, Yonsei University, Seoul, South Korea, said in an interview.
Dr. Hong is senior author on the current observational study based on the CONNECT-DES registry, which compared rosuvastatin 10 mg/day plus ezetimibe 10 mg/day – used in RACING – with rosuvastatin 20 mg/day in a nationwide cohort of 72,050 patients.
“As we know, populations who are enrolled in randomized studies do not sufficiently represent real patients in practice,” he observed, “so we wanted to evaluate the generalizability of the RACING results in daily clinical practice.”
Deepak L. Bhatt, MD, said he likes studies that look at whether clinical trial results “play out in the real world,” as this one did. “They have largely replicated the results of the RACING trial,” suggesting the approach using a moderate-intensity statin “is the way to go,” Dr. Bhatt of Mount Sinai Health System, New York, who was not affiliated with the current report, said in an interview. “In fact, the moderate-intensity combination regimen was actually better in this study.”
He said the observed reduction in new-onset diabetes with the moderate-intensity statin approach is also important. “There is a link between high-dose statins and diabetes. So, if given the choice, if you can get the benefits from a cardiovascular perspective with a lower risk of diabetes, it makes sense to use the combination therapy.”
Dr. Bhatt said he had been using high-intensity statin monotherapy in his high-risk patients, but RACING made him reconsider the value of moderate-dose statin combination therapy. “Going with lower doses of two drugs instead of high doses of one drug minimizes side effects and, in some cases, can even enhance efficacy – so this is not an unreasonable paradigm.”
In the current cohort study of patients prescribed rosuvastatin after DES implantation, 10,794 received rosuvastatin 10 mg/day plus ezetimibe 10 mg/day, and 61,256 were put on rosuvastatin 20 mg/day.
Hazard ratio risk reductions with the dual-agent lipid-lowering therapy approach, compared with high-intensity statin monotherapy, were more favorable for the primary composite clinical endpoint and important secondary events:
- HR, 0.75; 95% confidence interval, 0.70-0.79; P < .001) for CV death, MI, coronary artery revascularization, HF, or stroke at 3 years.
- HR, 0.85; 95% CI, 0.78-0.94; P = .001) for statin discontinuation.
- HR, 0.80; 95% CI, 0.72-0.88; P < .001) for new-onset diabetes requiring medication.
But HRs for rhabdomyolysis, cholecystectomy, or a new cancer diagnosis did not indicate significant differences between the two groups.
“Now that there is evidence to support the favorable clinical outcomes of combination lipid-lowering therapy with moderate-intensity statin plus ezetimibe” for secondary prevention from both RACING and a study reflecting daily clinical practice, Dr. Hong said, “physicians may feel more comfortable with this approach.”
The registry analysis “is remarkable not only for validating the results of the RACING trial in routine clinical practice in a high-risk secondary prevention population, but also for its innovative methodology,” states an accompanying editorial by Ori Ben-Yehuda, MD, Sulpizio Cardiovascular Center, University of California, San Diego.
Use of such a large single-payer database in their study “affords even greater external validity to the findings, complementing the internal validity of the randomized RACING trial,” Dr. Ben-Yehuda writes.
The rationale for combination therapy is strong, but additional data would be helpful, particularly for informing guidelines, he continues. “A pragmatic trial randomizing a broad racial and ethnic group of patients to low-dose statin,” such as a starting dose of 10 mg/day atorvastatin or 5 mg/day rosuvastatin “plus ezetimibe vs. high-intensity statin alone would provide much needed data to help guide lipid-lowering therapy for millions of patients and hopefully increase persistence on therapy.”
The study was supported by the Cardiovascular Research Center, Seoul, South Korea. Dr. Hong and Dr. Ben-Yehuda have disclosed no relevant financial relationships. Dr. Bhatt has previously disclosed grants and/or personal fees from many companies; personal fees from WebMD and other publications or organizations; and having other relationships with Medscape Cardiology and other publications or organizations.
A version of this article appeared on Medscape.com.
FROM JACC
New guidelines on diabetes-related laboratory testing
The document, titled, “Guidelines and recommendations for laboratory analysis in the diagnosis and management of diabetes mellitus,” is primarily aimed at both laboratory professionals and clinicians involved in diabetes care.
The guidance is focused “on the practical aspects of care in order to assist with decisions regarding the use or interpretation of laboratory tests while screening, diagnosing, or monitoring patients with diabetes,” wrote David B. Sacks, MBChB, chief of the clinical chemistry service at the National Institutes of Health (NIH), Bethesda, Md., and coauthors. It was published online in both Clinical Chemistry and Diabetes Care, including the guidelines and executive summary.
Coauthor M. Sue Kirkman, MD, of the University of North Carolina, Chapel Hill, said in an interview: “One objective of the guidelines is to increase clinicians’ understanding of the strengths and limitations of tests done in a laboratory and also at the point of care, or in daily life, by people with diabetes.”
The evidence-based recommendations, an update of prior versions published in 2011 and 2002, are meant as a supplement to the ADA Standards of Care in Diabetes and do not address aspects of clinical management, she stressed.
Addition of advice on CGM
A significant addition since 2011 is detailed information regarding the use of real-time continuous glucose monitoring (CGM), with a “strong” recommendation based on a “high” level of evidence for use in teens and adults with type 1 diabetes who meet certain criteria, and lower-grade advice to use real-time or intermittently scanned CGM in other populations, including children with diabetes, pregnant women with type 1 diabetes, and adults with type 2 diabetes taking insulin.
The document also reminds clinicians to consider test limitations, Dr. Kirkman pointed out.
“We do a lot of testing in screening, diagnosis, and monitoring of diabetes and its complications, yet for many clinicians we think that any result we get – or that a patient gets from home testing – is perfect. We often don’t think about the accuracy or precision of some tests, things that might interfere with the result, intra-individual variation of the test, or how one test may compare to a test of higher accuracy,” she said.
One example is a recommendation to collect blood samples for glucose analysis in tubes containing a rapidly effective inhibitor of glycolysis such as a granulated citrate buffer. If unavailable, the sample tube should be placed immediately into an ice water slurry and centrifuged within 15-30 minutes to remove the cells.
Without those measures, “red cells in blood sitting in the test tube continue to break down glucose, so the concentration of glucose will start to fall very soon. ... How the specimen is handled makes a huge difference in the result,” Dr. Kirkman emphasized.
Another is the recommendation of a confirmatory test when diagnosing diabetes, regardless of the initial test used (A1c, fasting glucose, or oral glucose tolerance test). “There is large intra-individual variation of fasting glucose and even larger for 2-hour glucose on the oral glucose tolerance test. ... This means if you do the test one week and then repeat it the next day or a week later, the results will be quite different. This is a reason why confirmation of an abnormal test is important. Yet many times this isn’t done,” she noted.
Other “strong” recommendations based on “high” evidence levels include:
- Fasting glucose should be measured in venous plasma when used to establish the diagnosis of diabetes, with a diagnostic cutoff of > 7.0 mmol/L (> 126 mg/dL) for diabetes.
- Frequent blood glucose monitoring is recommended for all people with diabetes treated with intensive insulin regimens (with multiple daily injections or insulin pump therapy) and who are not using CGM.
- Routine use of blood glucose monitoring is not recommended for people with type 2 diabetes who are treated with diet and/or oral agents alone.
- Treatment goals should be based on ADA recommendations, i.e., A1c < 7% (< 53 mmol/mol) if it can be achieved without significant hypoglycemia or other adverse treatment effects, with higher targets for special populations.
- Annual testing for albuminuria should begin in pubertal or postpubertal individuals 5 years after diagnosis of type 1 diabetes and at time of diagnosis of type 2 diabetes, regardless of treatment.
- Urine albumin should be measured annually in adults with diabetes using morning spot urine albumin-to-creatinine ratio.
Other guidance in the document pertains to use of ketone testing, genetic markers, autoimmune markers, and C-peptide.
According to Dr. Sacks, “It’s important to measure accurately, but it’s also very important to communicate the relevance to clinicians and to listen to them and share information. ... Patient care is a team effort.”
Dr. Sachs has reported receiving funding from the NIH. Dr. Kirkman has reported no relevant financial relationships.
A version of this article first appeared on Medscape.com.
FROM CLINICAL CHEMISTRY AND DIABETES CARE
Vegetarian diets can improve high-risk cardiovascular disease
, a meta-analysis of randomized controlled trials shows.

“To the best of our knowledge, this meta-analysis is the first that generates evidence from randomized controlled trials to assess the association of vegetarian diets with outcomes in people affected by cardiovascular diseases,” report the authors. The study was published online in JAMA Network Open.
“The greatest improvements in hemoglobin A1c and low-density lipoprotein cholesterol (LDL-C) were observed in individuals with type 2 diabetes and people at high risk of cardiovascular disease, highlighting the potential protective and synergistic effects of vegetarian diets for the primary prevention of cardiovascular disease,” they say.
Poor diet is well-established as increasing the morbidity and mortality associated with cardiovascular disease; however, although data has linked vegetarian diets to cardiovascular disease prevention in the general population, research on the effectiveness of such diets in people at high risk of cardiovascular disease is lacking.
“To the best of our knowledge, no meta-analysis of randomized controlled trials has been conducted to investigate the association of vegetarian diets with outcomes among people with CVD – indeed, research here has primarily focused on observational studies,” writes Tian Wang, RD, and colleagues at the University of Sydney.
Greater decreases in LDL-C, A1c, and body weight with vegetarian diets
For the meta-analysis, researchers identified 20 randomized controlled trials involving vegetarian diets that included 1,878 adults with or at a high risk of cardiovascular disease and included measurements of LDL-C, A1c, or systolic blood pressure.
The studies were conducted in the United States, Asia, Europe, and New Zealand between 1990 and 2021. Sample sizes ranged from 12 to 291 participants.
The mean range age of participants was 28-64 years. Studies included patients with cardiovascular disease (four studies), diabetes (seven studies), and those with at least two cardiovascular risk factors (nine studies).
The mean duration of the dietary intervention was 25.4 weeks (range 2-24 months). The most commonly prescribed diets were vegan (plant-based foods only), lacto-ovo-vegetarian (excluded meat, poultry, seafood, and dairy products, but allowed eggs), and lacto-vegetarian (same as previous but allowed dairy products).
Overall, those who consumed a vegetarian diet for an average of 6 months, versus comparison diets, had significantly greater decreases in LDL-C (6.6 mg/dL beyond the reduction achieved with standard therapy); A1c (0.24%); and body weight (3.4 kg), but the reduction in systolic blood pressure (0.1 mmHg) was not significantly greater.
Assessment of the overall certainty of evidence evaluated using the Grading of Recommendations, Assessment, Development, and Evaluation (GRADE) tool showed a moderate level of evidence for reductions in LDL-C and A1c with the vegetarian diet.
Lacto-ovo vegetarian diets were associated with the greatest reduction in LDL-C (14.1 mg/dL); however, four out of the five trials restricted energy intake.
Of note, vegetarian diets were most effective for achieving glycemic control among people with type 2 diabetes and leading to improvements in weight among those at high risk of cardiovascular disease as well as those with type 2 diabetes.
The effects “suggest that vegetarian diets might have a synergistic [or at least nonantagonistic] use in potentiating the effects of optimal drug therapy in the prevention and treatment of a range of cardiometabolic diseases,” the authors write.
Although previous studies have shown similar improvements associated with a vegetarian diet, most studies did not stratify populations based on disease status, type of vegetarian diet, or comparison diet, the authors note.
The lack of improvement in systolic blood pressure is consistent with previous meta-analyses of vegetarian diets in general and suggests that salt intake may be the more important factor for those measures.
“[The meta-analysis] suggests that diet quality plays a major role in lowering blood pressure independent of animal food consumption, as the DASH [Dietary Approaches to Stop Hypertension] ... trial demonstrated,” the authors note.
Decreases in medication dose with vegetarian diet
Although most patients were taking medications to manage hypertension, hyperglycemia, and/or dyslipidemia at trial enrollment in as many as eight of the studies, the vegetarian diet intervention resulted in a decrease in medication dose.
In fact, medication use could obscure the favorable effects of vegetarian diets, which could have a larger effect size, the authors speculate.
“This hypothesis is supported by two randomized controlled trials in our meta-analysis that required patients not to take medication that could influence cardiometabolic outcomes, [and] these studies significantly improved systolic blood pressure and LDL-C,” they write.
Not all vegetarian diets are healthy
Although there are numerous variations in vegetarian diets, ranging from vegan diets that eliminate all animal food to pesco-vegetarian diets that allow fish or seafood, most that are well-balanced can provide health benefits including lower saturated fat, L-carnitine, and choline (precursors of the atherogenic TMAO), and other benefits that might explain the improvements seen in the meta-analysis.
The diets may also be high in dietary fiber, mono- and polyunsaturated fatty acids, potassium, magnesium, and phytochemical, and have lower glycemic index scores.
Of note, 12 studies in the meta-analysis emphasized low-fat content, which the authors speculate may have contributed to the improvements observed in LDC-C.
Specifically, lacto-ovo vegetarian diets were associated with the greatest reduction in LDL-C (–14.1 mg/dL); however, four out of five of the trials restricted energy intake, which could have also played a role in improvements.
Importantly, not all vegetarian diets are healthy, and the authors caution about some that allow, for instance, deep-fried foods rich in trans-fatty acids and salt, such as tempura vegetables, potentially increasing the risk of type 2 diabetes and coronary heart disease.
They note that “more than one-third of the studies included in our meta-analysis did not emphasize the importance of consuming minimally processed plant-based whole foods.”
Overall, however, the fact that the greatest improvements in A1c and LDL-C were seen in patients with type 2 diabetes and those at high risk of CVD “highlight[s] the potential protective and synergistic effects of vegetarian diets for the primary prevention of CVD.”
A version of this article first appeared on Medscape.com.
, a meta-analysis of randomized controlled trials shows.
“To the best of our knowledge, this meta-analysis is the first that generates evidence from randomized controlled trials to assess the association of vegetarian diets with outcomes in people affected by cardiovascular diseases,” report the authors. The study was published online in JAMA Network Open.
“The greatest improvements in hemoglobin A1c and low-density lipoprotein cholesterol (LDL-C) were observed in individuals with type 2 diabetes and people at high risk of cardiovascular disease, highlighting the potential protective and synergistic effects of vegetarian diets for the primary prevention of cardiovascular disease,” they say.
Poor diet is well-established as increasing the morbidity and mortality associated with cardiovascular disease; however, although data has linked vegetarian diets to cardiovascular disease prevention in the general population, research on the effectiveness of such diets in people at high risk of cardiovascular disease is lacking.
“To the best of our knowledge, no meta-analysis of randomized controlled trials has been conducted to investigate the association of vegetarian diets with outcomes among people with CVD – indeed, research here has primarily focused on observational studies,” writes Tian Wang, RD, and colleagues at the University of Sydney.
Greater decreases in LDL-C, A1c, and body weight with vegetarian diets
For the meta-analysis, researchers identified 20 randomized controlled trials involving vegetarian diets that included 1,878 adults with or at a high risk of cardiovascular disease and included measurements of LDL-C, A1c, or systolic blood pressure.
The studies were conducted in the United States, Asia, Europe, and New Zealand between 1990 and 2021. Sample sizes ranged from 12 to 291 participants.
The mean range age of participants was 28-64 years. Studies included patients with cardiovascular disease (four studies), diabetes (seven studies), and those with at least two cardiovascular risk factors (nine studies).
The mean duration of the dietary intervention was 25.4 weeks (range 2-24 months). The most commonly prescribed diets were vegan (plant-based foods only), lacto-ovo-vegetarian (excluded meat, poultry, seafood, and dairy products, but allowed eggs), and lacto-vegetarian (same as previous but allowed dairy products).
Overall, those who consumed a vegetarian diet for an average of 6 months, versus comparison diets, had significantly greater decreases in LDL-C (6.6 mg/dL beyond the reduction achieved with standard therapy); A1c (0.24%); and body weight (3.4 kg), but the reduction in systolic blood pressure (0.1 mmHg) was not significantly greater.
Assessment of the overall certainty of evidence evaluated using the Grading of Recommendations, Assessment, Development, and Evaluation (GRADE) tool showed a moderate level of evidence for reductions in LDL-C and A1c with the vegetarian diet.
Lacto-ovo vegetarian diets were associated with the greatest reduction in LDL-C (14.1 mg/dL); however, four out of the five trials restricted energy intake.
Of note, vegetarian diets were most effective for achieving glycemic control among people with type 2 diabetes and leading to improvements in weight among those at high risk of cardiovascular disease as well as those with type 2 diabetes.
The effects “suggest that vegetarian diets might have a synergistic [or at least nonantagonistic] use in potentiating the effects of optimal drug therapy in the prevention and treatment of a range of cardiometabolic diseases,” the authors write.
Although previous studies have shown similar improvements associated with a vegetarian diet, most studies did not stratify populations based on disease status, type of vegetarian diet, or comparison diet, the authors note.
The lack of improvement in systolic blood pressure is consistent with previous meta-analyses of vegetarian diets in general and suggests that salt intake may be the more important factor for those measures.
“[The meta-analysis] suggests that diet quality plays a major role in lowering blood pressure independent of animal food consumption, as the DASH [Dietary Approaches to Stop Hypertension] ... trial demonstrated,” the authors note.
Decreases in medication dose with vegetarian diet
Although most patients were taking medications to manage hypertension, hyperglycemia, and/or dyslipidemia at trial enrollment in as many as eight of the studies, the vegetarian diet intervention resulted in a decrease in medication dose.
In fact, medication use could obscure the favorable effects of vegetarian diets, which could have a larger effect size, the authors speculate.
“This hypothesis is supported by two randomized controlled trials in our meta-analysis that required patients not to take medication that could influence cardiometabolic outcomes, [and] these studies significantly improved systolic blood pressure and LDL-C,” they write.
Not all vegetarian diets are healthy
Although there are numerous variations in vegetarian diets, ranging from vegan diets that eliminate all animal food to pesco-vegetarian diets that allow fish or seafood, most that are well-balanced can provide health benefits including lower saturated fat, L-carnitine, and choline (precursors of the atherogenic TMAO), and other benefits that might explain the improvements seen in the meta-analysis.
The diets may also be high in dietary fiber, mono- and polyunsaturated fatty acids, potassium, magnesium, and phytochemical, and have lower glycemic index scores.
Of note, 12 studies in the meta-analysis emphasized low-fat content, which the authors speculate may have contributed to the improvements observed in LDC-C.
Specifically, lacto-ovo vegetarian diets were associated with the greatest reduction in LDL-C (–14.1 mg/dL); however, four out of five of the trials restricted energy intake, which could have also played a role in improvements.
Importantly, not all vegetarian diets are healthy, and the authors caution about some that allow, for instance, deep-fried foods rich in trans-fatty acids and salt, such as tempura vegetables, potentially increasing the risk of type 2 diabetes and coronary heart disease.
They note that “more than one-third of the studies included in our meta-analysis did not emphasize the importance of consuming minimally processed plant-based whole foods.”
Overall, however, the fact that the greatest improvements in A1c and LDL-C were seen in patients with type 2 diabetes and those at high risk of CVD “highlight[s] the potential protective and synergistic effects of vegetarian diets for the primary prevention of CVD.”
A version of this article first appeared on Medscape.com.
FROM JAMA NETWORK OPEN
SGLT2 inhibitors linked with fewer gout flares in diabetes
TOPLINE:
compared with matched patients treated with a dipeptidyl peptidase–4 (DPP-4) inhibitor.
METHODOLOGY:
- The study used observational data collected from the entire population of British Columbia that included 15,067 adults with both gout and type 2 diabetes in 2014-2020.
- The group included 8,318 patients who initiated an SGLT2 inhibitor and 6,749 patients who initiated a DPP-4 inhibitor during the study period after at least 1 year of continuous enrollment.
- Using propensity-score matching, 4,075 matched pairs were identified, where one person initiated an SGLT2 inhibitor and the other started a DPP-4 inhibitor.
- Primary outcome was recurrent gout flare counts during follow-up that required an ED visit, hospital admission, or an outpatient visit for a gout flare coupled with appropriate treatment, tallied from the first day of drug receipt until June 30, 2022, with an average follow-up of 1.6 years.
- Secondary endpoints included the incidence of myocardial infarction and stroke.
TAKEAWAY:
- Total gout-flare rates after SGLT2 inhibitor initiation were 52.4/1000 person-years and after DPP-4 inhibitor initiation were 79.7/1,000 person-years, an adjusted rate ratio of 0.66, a reduction significantly linked with SGLT2 inhibitor use.
- For flares that required an ED visit or hospitalization, initiation of an SGLT2 inhibitor was linked with a significant, reduced aRR of 0.52, compared with DPP-4 inhibitor initiation.
- The flare-rate reduction linked with SGLT2 inhibitor use was consistent regardless of sex, age, baseline diuretic use, prior treatment with a urate-lowering agent, and baseline gout intensity.
- SGLT2 inhibitor initiation was also significantly linked with an adjusted reduced hazard ratio of 0.69 in the incidence of myocardial infarction, compared with DPP-4 inhibitor initiation, but stroke incidence was not significantly different between the groups.
IN PRACTICE:
These findings suggest that SGLT2 inhibitors could have a much-needed ability to simultaneously reduce the burden of recurrent gout flares and coronary sequelae in patients with gout and type 2 diabetes, indicating that “SGLT2 inhibitors may offer distinct benefits,” making the drug class “a particularly attractive addition to current urate-lowering therapies,” the researchers write.
SOURCE:
The study was primarily conducted by researchers at Massachusetts General Hospital in Boston. The study was published online July 24 in Annals of Internal Medicine.
LIMITATIONS:
The data used in the study did not include gout flares that did not require medical attention and did not include laboratory findings for study participants. Because the data were observational the findings may be susceptible to unmeasured confounding.
DISCLOSURES:
The study received no commercial funding. One author has reported receiving consulting fees from ANI and LG Chem.
A version of this article first appeared on Medscape.com.
FROM ANNALS OF INTERNAL MEDICINE
Intermittent fasting vs. calorie counting for weight loss
BOSTON –
For the study, 57 overweight and obese participants with type 2 diabetes were randomly assigned to three different groups: The first group ate between noon and 8 p.m., the second was asked to reduce caloric intake by 25% of maintenance calories, and the third, a control group, continued eating normally.
The calorie-restriction group tracked intake on MyFitnessPal, an app that logs the calorie content of different foods. Both the intermittent-fasting and calorie-restriction groups were assigned a dietitian to help with adherence.
After 6 months, participants in the intermittent-fasting group lost about 4.3% of body weight – the equivalent of 10 pounds of weight loss for a person weighing 230 pounds – whereas participants in the calorie-restriction group lost about 2.5% of body weight.
The difference between the two groups was not significant, so one approach isn’t necessarily better than the other for weight loss.
“Let’s not think of this as an approach that’s better than calorie restriction,” William Yancy, MD, MHS, an internist and weight management specialist at Duke Lifestyle and Weight Management Center, Durham, N.C., said in an interview. “It’s an alternative approach to calorie restriction.”
Participants’ willingness to adhere to the diet likely accounted for the percentage difference between the groups, study author Vasiliki Pavlou, RDN, told this news organization. Ms. Pavlou presented the findings at the Nutrition 2023 conference.
“People that have type 2 diabetes, they’ve already been to the doctor, they’ve already been told to count calories,” said Ms. Pavlou, a doctoral student at the University of Illinois at Chicago. “There were many weeks where they came to us with nothing on MyFitnessPal and we’d have to encourage them to start tracking again.”
The intermittent-fasting group adhered to the eating time window 6 out of 7 days of the week, with a 1-hour grace period for the noon-to-8-p.m. window. In comparison, one-third of the calorie-restriction group didn’t stay within 200 calories of the goal, according to Ms. Pavlou.
That meant the fasting group cut about 100 calories more per day than the calorie-restriction group, which was reflected in their weight loss, Ms. Pavlou said.
A1c levels dropped by about 1% in both the intermittent-fasting and calorie-restriction groups – a meaningful decrease, said Dr. Yancy. “I think a 0.5% difference would have some clinical significance in terms of complications from diabetes,” he said. “So 1% would be even more clinically meaningful.”
However, fewer participants taking insulin in the calorie-restriction group could explain the difference, according to Ms. Pavlou. “Usually, when someone goes on insulin, their pancreas is already not functioning as well,” she said. “And it’s way harder to see improvements in their A1c and glycemic control.”
Up to 90% of people with type 2 diabetes are overweight or obese. Weight loss is one of the major components of type 2 diabetes care, according to the American Diabetes Association, and studies have shown that even a 5% reduction in body weight can reduce blood glucose concentration and A1c. Some studies suggest diabetes remission can occur after a 10% loss in body weight, but Dr. Yancy said it depends on the person.
“It depends on the individual, their metabolic situation, how long they’ve had diabetes, what kind of approach they’re following, maybe what medicines they’re taking,” Dr. Yancy said. “There’s a lot of different factors involved in remission.”
The study cohort generally had advanced diabetes and was taking a mix of medications, so the results might not be applicable to people with a more recent diabetes diagnosis, according to Ms. Pavlou.
Dr. Yancy said intermittent fasting could work well for the right person. The success of the approach could depend on a person’s eating habits and whether their meals usually fall outside the time-restricted window, or it could depend on how well a person follows rules, according to Dr. Yancy.
“Some people might not eat much after 8 o’clock, and some people might skip breakfast,” Dr. Yancy said. “And if that’s the case, then it’s not going to make a big impact on their weight probably.”
Medication is also an important consideration. Not eating can be dangerous for patients taking short-acting insulin or sulfonylureas, according to Dr. Yancy.
Ms. Pavlou said these findings show intermittent fasting is another option for patients with type 2 diabetes trying to lose weight. “If you’ve tried calorie counting, that’s not working for you or if you’re kind of burnt out, this is something else that you could try,” she said.
“We have a lot of patients that need to lose weight, and we have patients who respond differently to different approaches,” said Dr. Yancy. “So having various approaches is really valuable.”
The manuscript is currently under review at JAMA Internal Medicine, said Ms. Pavlou.
A version of this article appeared on Medscape.com.
AT NUTRITION 2023
Does use of continuous or flash glucose monitors decrease hypoglycemia episodes in T2D?
Evidence summary
Continuous glucose monitoring: Nonsignificant reductions in event rates
A 2021 multicenter RCT (N = 175) evaluated CGM effectiveness in patients with basal insulin–treated T2D.1 Patients (mean age, 57 years; mean A1C, 9.1%) wore a blinded CGM device for baseline glucose measurement (minimum of 168 hours) before being randomly assigned to either CGM (n = 116) or traditional blood glucose monitoring (BGM; n = 59). At 8-month follow-up, patients in the BGM group again had blinded sensors placed. A significant reduction in hypoglycemia duration was observed for the CGM group vs the BGM group at 8 months for glucose values < 70 mg/mL (adjusted mean difference [aMD] = –0.24%; 95% CI, –0.42 to –0.05) and < 54 mg/dL (aMD = –0.10%; 95% CI, –0.15 to –0.04). A nonsignificant decrease in severe hypoglycemic events requiring resuscitative assistance occurred for BGM (2%) vs CGM (1%) patients. Study limitations included virtual visits due to COVID-19 and a short follow-up period.
A 2022 multicenter prospective study (N = 174) examined CGM effects on hypoglycemia frequency and severity in adults with T2D.2 Patients with insulin-requiring T2D (mean age, 61 years; mean A1C, 8.0%) participated in a 12-month study with 6 months of self-monitored blood glucose (SMBG) followed by 6 months of CGM use. The primary outcome was the rate of severe hypoglycemic events. A nonsignificant decrease was observed in the CGM group compared to the SMBG group for hypoglycemic event rate, per participant per 6-month period (relative risk [RR] = 0.43; 95% CI, 0.07-2.64). Four moderate hypoglycemic adverse events occurred in the SMBG phase vs 2 in the CGM phase. Financial support by the study sponsor decreases the study’s validity.
A 2021 prospective study (N = 90) evaluated the use of CGM to improve glycemic control.3 Patients younger than 66 years with insulin-treated T2D and an A1C > 7.5% participated in a 7-day blinded CGM cycle every 4 months for 1 year. A nonsignificant decrease in hypoglycemia duration was observed for glucose values < 70 mg/dL and < 54 mg/dL at 12 months. No change in hypoglycemic event rate was seen with the use of CGM. Funding by the device manufacturer was a limitation of this study.
Flash glucose monitoring: Mixed results on hypoglycemia events
A 2019 open-label RCT (N = 82) assessed the effectiveness of FGM on diabetes control.4 Patients with insulin-treated T2D were randomly assigned to the intervention or standard-care groups. The intervention group (n = 46; mean age, 66 years; mean A1C, 8.3%) used the FGM system for 10 weeks, while the standard-care group (n = 36; mean age, 70 years; mean A1C, 8.9%) maintained use of their glucometers. Both groups received similar types and duration of counseling. Treatment satisfaction was the primary outcome; total hypoglycemic events was a secondary outcome. No significant difference in the number of hypoglycemic episodes was observed between the intervention and control groups at 55 to 70 mg/dL (RR = 0.79; 95% CI, 0.44-1.4) or < 54 mg/dL (RR = 1.27; 95% CI, 0.38-4.2). No adverse events of severe hypoglycemia occurred during the study. Funding by the device manufacturer was a limitation of this study.
A 2017 open-label, multicenter RCT (N = 224) assessed FGM efficacy.5 Adults (mean age, 59 years; mean A1C, 8.8%) with T2D on intensive insulin therapy were randomized to FGM (n = 149) or SMBG (n = 75) after a 14-day masked baseline period. The 6-month treatment phase was unblinded. The duration of hypoglycemic events (glucose values < 70 mg/dL and < 55 mg/dL) was obtained from the sensors. Compared to the SMBG group, the FGM group spent 43% less time at < 70 mg/dL (aMD = –0.47 ± 0.13 h/d; P = .0006) and 53% less time at < 55 mg/dL (aMD = –0.22 ± 0.068 h/d; P = .0014). Hypoglycemic event rates significantly decreased by 28% (aMD = –0.16 ± 0.065; P = 0.016) and 44% (aMD = –0.12 ± 0.037; P = .0017) for glucose levels < 70 mg/dL and < 55 mg/dL, respectively. A nonsignificant difference occurred in severe hypoglycemic events requiring third-party assistance for the FGM (2%) vs control (1%) groups. Involvement of the device manufacturer and unblinded group allocations are study limitations.
A 2021 single-arm, multicenter prospective study looked at the impact of FGM on glycemic control in adults with insulin-treated T2D (N = 90; mean age, 64 years; mean A1C, 7.5%).6 After a 14-day baseline period consisting of masked sensor readings paired with self-monitored fingerstick tests, participants were followed for 11 weeks using the sensor to monitor glucose levels. The primary outcome was amount of time spent in hypoglycemia (< 70 mg/dL), with secondary outcomes including time and events in hypoglycemia (< 70, < 55, or < 45 mg/dL). No significant decrease in hypoglycemia duration or hypoglycemic event rates at < 70, < 55, or < 45 mg/dL was observed for FGM compared to baseline. Adverse events were observed in 64% of participants; 94% of the events were hypoglycemia related. Serious adverse events were reported for 5.3% of participants. The single-arm study format, lack of generalizability due to the single-race study population, and sponsor support were study limitations.
Editor’s takeaway
This reasonably good evidence shows a decrease in measured or monitored hypoglycemia, a disease-oriented outcome, but it did not reach statistical significance for symptomatic hypoglycemia (1% vs 2%), a patient-oriented outcome. Nevertheless, in patients reporting symptomatic hypoglycemia, a continuous or flash glucose monitor may allow for more aggressive glucose control.
1. Martens T, Beck RW, Bailey R, et al. Effect of continuous glucose monitoring on glycemic control in patients with type 2 diabetes treated with basal insulin: a randomized clinical trial. JAMA. 2021;325:2262-2272. doi: 10.1001/jama.2021.7444
2. Beck SE, Kelly C, Price DA. Non-adjunctive continuous glucose monitoring for control of hypoglycaemia (COACH): results of a post-approval observational study. Diabet Med. 2022;39:e14739. doi: 10.1111/dme.14739
3. Ribeiro RT, Andrade R, Nascimento do O D, et al. Impact of blinded retrospective continuous glucose monitoring on clinical decision making and glycemic control in persons with type 2 diabetes on insulin therapy. Nutr Metab Cardiovasc Dis. 2021;31:1267-1275. doi: 10.1016/j.numecd.2020.12.024
4. Yaron M, Roitman E, Aharon-Hananel G, et al. Effect of flash glucose monitoring technology on glycemic control and treatment satisfaction in patients with type 2 diabetes. Diabetes Care. 2019;42:1178-1184. doi: 10.2337/dc18-0166
5. Haak T, Hanaire H, Ajjan R, et al. Flash glucose-sensing technology as a replacement for blood glucose monitoring for the management of insulin-treated type 2 diabetes: a multicenter, open-label randomized controlled trial. Diabetes Ther. 2017;8:55-73. doi: 10.1007/s13300-016-0223-6
6. Ogawa W, Hirota Y, Osonoi T, et al. Effect of the FreeStyle Libre™ flash glucose monitoring system on glycemic control in individuals with type 2 diabetes treated with basal-bolus insulin therapy: an open label, prospective, multicenter trial in Japan. J Diabetes Investig. 2021;12:82-90. doi: 10.1111/jdi.13327
Evidence summary
Continuous glucose monitoring: Nonsignificant reductions in event rates
A 2021 multicenter RCT (N = 175) evaluated CGM effectiveness in patients with basal insulin–treated T2D.1 Patients (mean age, 57 years; mean A1C, 9.1%) wore a blinded CGM device for baseline glucose measurement (minimum of 168 hours) before being randomly assigned to either CGM (n = 116) or traditional blood glucose monitoring (BGM; n = 59). At 8-month follow-up, patients in the BGM group again had blinded sensors placed. A significant reduction in hypoglycemia duration was observed for the CGM group vs the BGM group at 8 months for glucose values < 70 mg/mL (adjusted mean difference [aMD] = –0.24%; 95% CI, –0.42 to –0.05) and < 54 mg/dL (aMD = –0.10%; 95% CI, –0.15 to –0.04). A nonsignificant decrease in severe hypoglycemic events requiring resuscitative assistance occurred for BGM (2%) vs CGM (1%) patients. Study limitations included virtual visits due to COVID-19 and a short follow-up period.
A 2022 multicenter prospective study (N = 174) examined CGM effects on hypoglycemia frequency and severity in adults with T2D.2 Patients with insulin-requiring T2D (mean age, 61 years; mean A1C, 8.0%) participated in a 12-month study with 6 months of self-monitored blood glucose (SMBG) followed by 6 months of CGM use. The primary outcome was the rate of severe hypoglycemic events. A nonsignificant decrease was observed in the CGM group compared to the SMBG group for hypoglycemic event rate, per participant per 6-month period (relative risk [RR] = 0.43; 95% CI, 0.07-2.64). Four moderate hypoglycemic adverse events occurred in the SMBG phase vs 2 in the CGM phase. Financial support by the study sponsor decreases the study’s validity.
A 2021 prospective study (N = 90) evaluated the use of CGM to improve glycemic control.3 Patients younger than 66 years with insulin-treated T2D and an A1C > 7.5% participated in a 7-day blinded CGM cycle every 4 months for 1 year. A nonsignificant decrease in hypoglycemia duration was observed for glucose values < 70 mg/dL and < 54 mg/dL at 12 months. No change in hypoglycemic event rate was seen with the use of CGM. Funding by the device manufacturer was a limitation of this study.
Flash glucose monitoring: Mixed results on hypoglycemia events
A 2019 open-label RCT (N = 82) assessed the effectiveness of FGM on diabetes control.4 Patients with insulin-treated T2D were randomly assigned to the intervention or standard-care groups. The intervention group (n = 46; mean age, 66 years; mean A1C, 8.3%) used the FGM system for 10 weeks, while the standard-care group (n = 36; mean age, 70 years; mean A1C, 8.9%) maintained use of their glucometers. Both groups received similar types and duration of counseling. Treatment satisfaction was the primary outcome; total hypoglycemic events was a secondary outcome. No significant difference in the number of hypoglycemic episodes was observed between the intervention and control groups at 55 to 70 mg/dL (RR = 0.79; 95% CI, 0.44-1.4) or < 54 mg/dL (RR = 1.27; 95% CI, 0.38-4.2). No adverse events of severe hypoglycemia occurred during the study. Funding by the device manufacturer was a limitation of this study.
A 2017 open-label, multicenter RCT (N = 224) assessed FGM efficacy.5 Adults (mean age, 59 years; mean A1C, 8.8%) with T2D on intensive insulin therapy were randomized to FGM (n = 149) or SMBG (n = 75) after a 14-day masked baseline period. The 6-month treatment phase was unblinded. The duration of hypoglycemic events (glucose values < 70 mg/dL and < 55 mg/dL) was obtained from the sensors. Compared to the SMBG group, the FGM group spent 43% less time at < 70 mg/dL (aMD = –0.47 ± 0.13 h/d; P = .0006) and 53% less time at < 55 mg/dL (aMD = –0.22 ± 0.068 h/d; P = .0014). Hypoglycemic event rates significantly decreased by 28% (aMD = –0.16 ± 0.065; P = 0.016) and 44% (aMD = –0.12 ± 0.037; P = .0017) for glucose levels < 70 mg/dL and < 55 mg/dL, respectively. A nonsignificant difference occurred in severe hypoglycemic events requiring third-party assistance for the FGM (2%) vs control (1%) groups. Involvement of the device manufacturer and unblinded group allocations are study limitations.
A 2021 single-arm, multicenter prospective study looked at the impact of FGM on glycemic control in adults with insulin-treated T2D (N = 90; mean age, 64 years; mean A1C, 7.5%).6 After a 14-day baseline period consisting of masked sensor readings paired with self-monitored fingerstick tests, participants were followed for 11 weeks using the sensor to monitor glucose levels. The primary outcome was amount of time spent in hypoglycemia (< 70 mg/dL), with secondary outcomes including time and events in hypoglycemia (< 70, < 55, or < 45 mg/dL). No significant decrease in hypoglycemia duration or hypoglycemic event rates at < 70, < 55, or < 45 mg/dL was observed for FGM compared to baseline. Adverse events were observed in 64% of participants; 94% of the events were hypoglycemia related. Serious adverse events were reported for 5.3% of participants. The single-arm study format, lack of generalizability due to the single-race study population, and sponsor support were study limitations.
Editor’s takeaway
This reasonably good evidence shows a decrease in measured or monitored hypoglycemia, a disease-oriented outcome, but it did not reach statistical significance for symptomatic hypoglycemia (1% vs 2%), a patient-oriented outcome. Nevertheless, in patients reporting symptomatic hypoglycemia, a continuous or flash glucose monitor may allow for more aggressive glucose control.
1. Martens T, Beck RW, Bailey R, et al. Effect of continuous glucose monitoring on glycemic control in patients with type 2 diabetes treated with basal insulin: a randomized clinical trial. JAMA. 2021;325:2262-2272. doi: 10.1001/jama.2021.7444
2. Beck SE, Kelly C, Price DA. Non-adjunctive continuous glucose monitoring for control of hypoglycaemia (COACH): results of a post-approval observational study. Diabet Med. 2022;39:e14739. doi: 10.1111/dme.14739
3. Ribeiro RT, Andrade R, Nascimento do O D, et al. Impact of blinded retrospective continuous glucose monitoring on clinical decision making and glycemic control in persons with type 2 diabetes on insulin therapy. Nutr Metab Cardiovasc Dis. 2021;31:1267-1275. doi: 10.1016/j.numecd.2020.12.024
4. Yaron M, Roitman E, Aharon-Hananel G, et al. Effect of flash glucose monitoring technology on glycemic control and treatment satisfaction in patients with type 2 diabetes. Diabetes Care. 2019;42:1178-1184. doi: 10.2337/dc18-0166
5. Haak T, Hanaire H, Ajjan R, et al. Flash glucose-sensing technology as a replacement for blood glucose monitoring for the management of insulin-treated type 2 diabetes: a multicenter, open-label randomized controlled trial. Diabetes Ther. 2017;8:55-73. doi: 10.1007/s13300-016-0223-6
6. Ogawa W, Hirota Y, Osonoi T, et al. Effect of the FreeStyle Libre™ flash glucose monitoring system on glycemic control in individuals with type 2 diabetes treated with basal-bolus insulin therapy: an open label, prospective, multicenter trial in Japan. J Diabetes Investig. 2021;12:82-90. doi: 10.1111/jdi.13327
EVIDENCE-BASED REVIEW:
NO. In adults with insulin-treated type 2 diabetes (T2D), continuous glucose monitoring (CGM) and flash glucose monitoring (FGM) do not decrease symptomatic hypoglycemia episodes (strength of recommendation [SOR], B) but do lower time in hypoglycemia (SOR, C; disease-oriented evidence).
CGM, in which glucose levels are sent automatically in numeric and graphic format to a patient’s smart device for their potential action, did not change the hypoglycemic event rate (SOR, B; 2 prospective studies). CGM significantly reduced hypoglycemia duration in an 8-month randomized controlled trial (RCT; SOR, C) but not in a 1-year prospective study (SOR, C).
FGM, in which glucose levels are sent on demand to a device, did not significantly reduce hypoglycemic episodes (SOR, B; 1 small RCT and 1 prospective study). Hypoglycemia duration was reduced significantly with FGM in a 6-month RCT (SOR, B) but not in a 1-year prospective study (SOR, B).

An Atypical Discussion of the Link Between Metabolic Syndrome and Type 2 Diabetes—and the Use of Precision Medicine to Treat the Whole Patient

Metabolic syndrome, type 2 diabetes mellitus (T2DM), and the “diabetes syndrome,” are interrelated, serious health conditions that share common risk factors and mechanisms. While they are each distinct conditions, a significant association exists between them, with metabolic syndrome often being considered a precursor to the development of typical T2DM.
Metabolic syndrome is a cluster of individual metabolic abnormalities that includes a combination of risk factors such as abdominal obesity, high blood pressure, elevated insulin levels, high triglyceride levels, and low levels of high-density lipoprotein (HDL) cholesterol related to genes and epigenetic changes associated with insulin resistance. These risk factors increase the likelihood of developing cardiovascular diseases, such as heart disease and stroke, and, when combined with significant damage to β -cell function and the influence of concordant environmental precipitants, result in hyperglycemia/overt diabetes—classically defined as T2DM.
It is estimated that there will be a staggering 3.1 billion people living with T2DM by 2050, according to a recent article in The Lancet. This devastating number will place a heavy burden on the health care system.
However, this typical pathophysiologic definition of T2DM is imprecise. Twenty percent of patients with T2DM have islet-cell antibodies that are typical of the immune destruction of β-cells in patients with type 1 diabetes mellitus (T1DM). Furthermore, approximately 40% of patients with T1DM have insulin resistance.
Thus, to better understand and distinguish the disease processes unique to each individual, we have defined a new beta cell classification for all forms of diabetes mellitus (DM). In this classification, there are 4 common pathophysiologic causes of all DM (including classic T2DM), with resultant damage to the β-cells (ie, genetic and epigenetic changes, inflammation, an abnormal environment, and insulin resistance), which results in 11 mechanisms of hyperglycemia, represented as “the egregious eleven” in Figure 1.
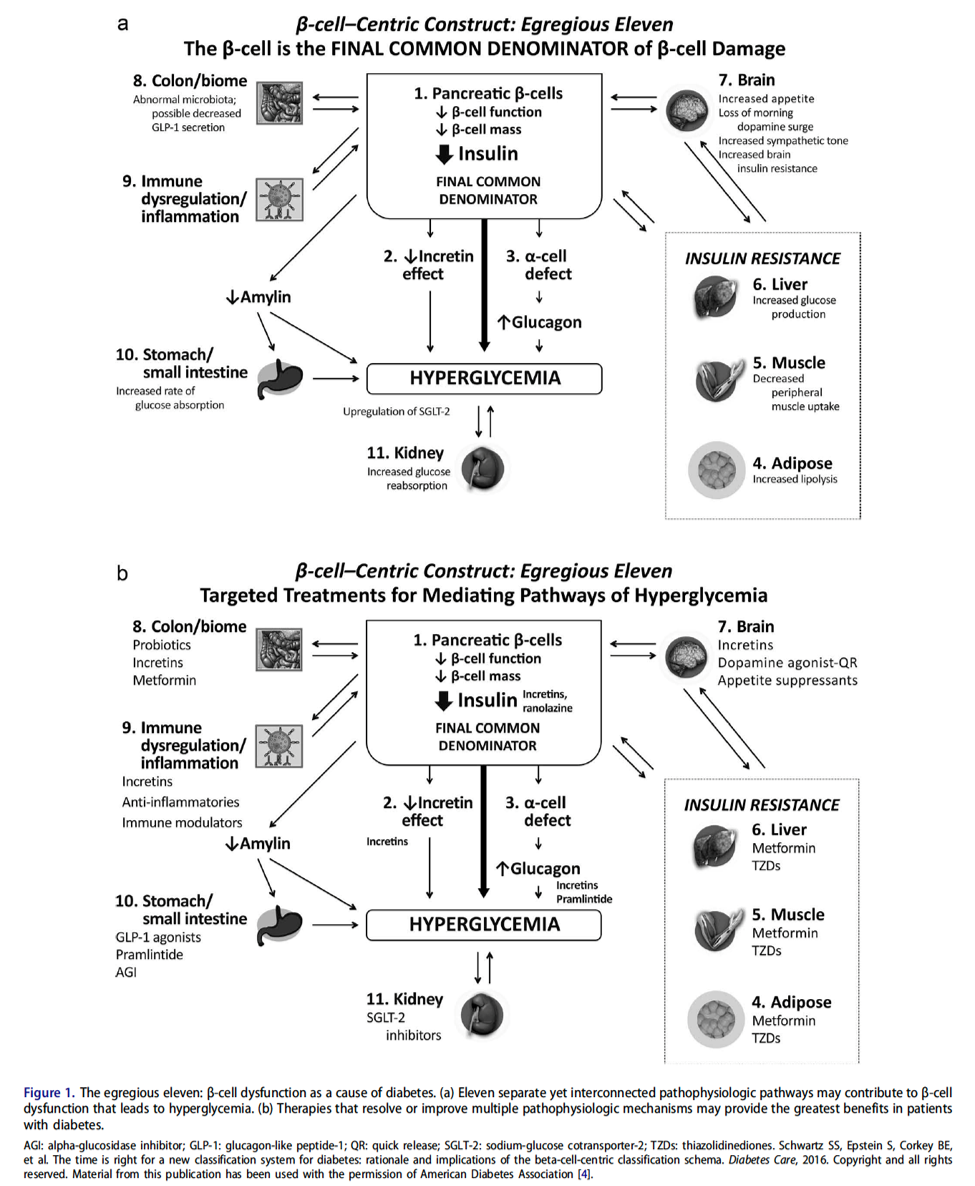
Additionally, Figure 2 illustrates the association between overlapping genes/epigenetic changes responsible for DM and the increased susceptibility to developing various microvascular complications commonly observed in all forms of DM, including classic T2DM. These complications, now recognized as components of the diabetes syndrome, encompass a range of conditions with shared interrelated pathophysiologic mechanisms, such as arteriosclerotic vascular disease (ASVD), dementia, some cancers, nonalcoholic fatty liver disease or nonalcoholic steatohepatitis (NAFLD/NASH), or psoriasis.
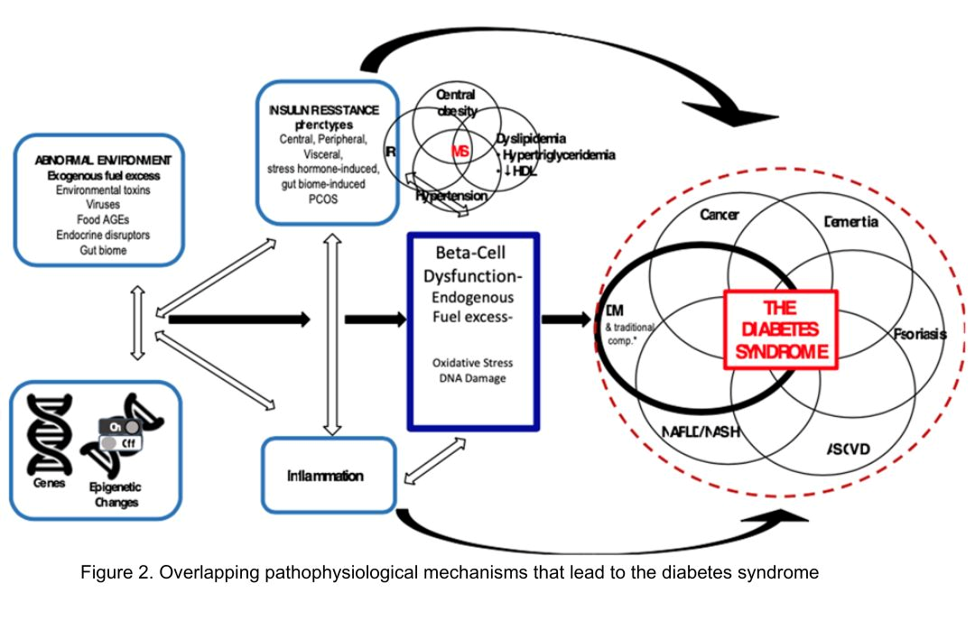
The likelihood of developing a specific type of DM, with classic complications or associated conditions, is contingent on an individual’s genes, epigenetic factors, inflammation, insulin resistance, and environmental exposures over time. It has now been postulated that these factors can be identified in a particular individual by a set of genomics, metabolomics, proteomics, and markers of these processes.
This more precise approach has the added benefit of giving rise to a more accurate individualization of therapy—precision medicine.
Precision medicine is an approach to healthcare that considers an individual's specific characteristics, such as genetic makeup, lifestyle, and environmental factors, to tailor medical treatments and interventions. In the context of this discussion on T2DM, precision medicine’s goal is to provide targeted therapies and interventions based on an individual's unique -omic profile to improve treatment outcomes and minimize side effects. An additional benefit of precision medicine use in diabetes syndrome is giving the diabetes specialist the opportunity to treat the whole patient, looking for complications and associated conditions earlier via defining the presence or absence of various markers of their individual pathophysiology. Additionally, we have come to recognize that many of the medications for treating T2DM (eg, glucagon-like peptide 1 receptor agonists [GLP-1 RA], dipeptidyl peptidase 4 inhibitors [DPP-4 inhibitors], sodium-glucose cotransporter-2 inhibitors [SGLT-2 inhibitors], metformin, Cycloset [bromocriptine mesylate]) can offer other benefits for the patient—treating not only multiple mechanisms of hyperglycemia (the egregious eleven: use the fewest number of agents in combination to treat the most number of mechanisms of hyperglycemia) but also recognize that they can prevent and treat the complications and associated conditions of the diabetes syndrome: cardiovascular, renal, liver, some cancers, psoriasis, and dementia.
The classic link between metabolic syndrome and T2DM is important to consider when applying precision medicine approaches to the management of T2DM. Here are some examples of how precision medicine is being applied in the management of T2DM:
Genetic testing: Genetic testing can help identify specific genetic variants or mutations that may influence an individual's risk of developing T2DM or their response to certain medications. By understanding a person's genetic predisposition, clinicians can make more informed decisions about treatment options and develop personalized strategies for their patients.
Pharmacogenomics: Certain genetic variations can impact how a person metabolizes and responds to specific diabetes medications. By analyzing an individual's genetic profile, medications that are more likely to be effective and have fewer adverse effects for that patient may be selected.
Continuous glucose monitoring (CGM): CGM devices provide real-time information about an individual’s blood glucose levels, allowing for more precise management of diabetes. By continuously monitoring glucose levels, patterns can be identified, allowing for adjustments to medication dosages, dietary recommendations, and lifestyle modifications on an individualized basis.
Lifestyle interventions: Precision medicine also recognizes that lifestyle factors play a crucial role in the development and management of T2DM. Lifestyle interventions, such as diet and exercise plans, based on an individual's preferences, metabolic profile, and response to different interventions can be personalized (ie, some individuals may benefit more from a low-carbohydrate diet, while others may respond better to a Mediterranean-style diet).
Predictive modeling and risk stratification: Precision medicine leverages data analytics and predictive modeling to assess an individual's risk of developing complications associated with T2DM. By analyzing various factors such as medical history, genetics, lifestyle, and biomarkers, individuals who are at a higher risk of developing complications can be identified, and their treatment plans can be tailored accordingly. Precision medicine enables early identification of individuals who are at a higher risk of developing T2DM based on their metabolic syndrome status.
In summary, precision medicine for T2DM considers the link between metabolic syndrome and diabetes syndrome to develop personalized approaches for prevention, early intervention, and treatment. By understanding an individual's metabolic and genetic profile, targeted strategies to optimize management and improve outcomes for patients with metabolic syndrome and those at risk of developing diabetes can be implemented.
It is important to note that while precision medicine holds promise in improving diabetes management, it is still an evolving field, and its widespread implementation is not yet fully realized. Collaboration between clinicians, researchers, and technological advancements will continue to drive the progress of precision medicine in T2DM management.
Metabolic syndrome, type 2 diabetes mellitus (T2DM), and the “diabetes syndrome,” are interrelated, serious health conditions that share common risk factors and mechanisms. While they are each distinct conditions, a significant association exists between them, with metabolic syndrome often being considered a precursor to the development of typical T2DM.
Metabolic syndrome is a cluster of individual metabolic abnormalities that includes a combination of risk factors such as abdominal obesity, high blood pressure, elevated insulin levels, high triglyceride levels, and low levels of high-density lipoprotein (HDL) cholesterol related to genes and epigenetic changes associated with insulin resistance. These risk factors increase the likelihood of developing cardiovascular diseases, such as heart disease and stroke, and, when combined with significant damage to β -cell function and the influence of concordant environmental precipitants, result in hyperglycemia/overt diabetes—classically defined as T2DM.
It is estimated that there will be a staggering 3.1 billion people living with T2DM by 2050, according to a recent article in The Lancet. This devastating number will place a heavy burden on the health care system.
However, this typical pathophysiologic definition of T2DM is imprecise. Twenty percent of patients with T2DM have islet-cell antibodies that are typical of the immune destruction of β-cells in patients with type 1 diabetes mellitus (T1DM). Furthermore, approximately 40% of patients with T1DM have insulin resistance.
Thus, to better understand and distinguish the disease processes unique to each individual, we have defined a new beta cell classification for all forms of diabetes mellitus (DM). In this classification, there are 4 common pathophysiologic causes of all DM (including classic T2DM), with resultant damage to the β-cells (ie, genetic and epigenetic changes, inflammation, an abnormal environment, and insulin resistance), which results in 11 mechanisms of hyperglycemia, represented as “the egregious eleven” in Figure 1.
Additionally, Figure 2 illustrates the association between overlapping genes/epigenetic changes responsible for DM and the increased susceptibility to developing various microvascular complications commonly observed in all forms of DM, including classic T2DM. These complications, now recognized as components of the diabetes syndrome, encompass a range of conditions with shared interrelated pathophysiologic mechanisms, such as arteriosclerotic vascular disease (ASVD), dementia, some cancers, nonalcoholic fatty liver disease or nonalcoholic steatohepatitis (NAFLD/NASH), or psoriasis.
The likelihood of developing a specific type of DM, with classic complications or associated conditions, is contingent on an individual’s genes, epigenetic factors, inflammation, insulin resistance, and environmental exposures over time. It has now been postulated that these factors can be identified in a particular individual by a set of genomics, metabolomics, proteomics, and markers of these processes.
This more precise approach has the added benefit of giving rise to a more accurate individualization of therapy—precision medicine.
Precision medicine is an approach to healthcare that considers an individual's specific characteristics, such as genetic makeup, lifestyle, and environmental factors, to tailor medical treatments and interventions. In the context of this discussion on T2DM, precision medicine’s goal is to provide targeted therapies and interventions based on an individual's unique -omic profile to improve treatment outcomes and minimize side effects. An additional benefit of precision medicine use in diabetes syndrome is giving the diabetes specialist the opportunity to treat the whole patient, looking for complications and associated conditions earlier via defining the presence or absence of various markers of their individual pathophysiology. Additionally, we have come to recognize that many of the medications for treating T2DM (eg, glucagon-like peptide 1 receptor agonists [GLP-1 RA], dipeptidyl peptidase 4 inhibitors [DPP-4 inhibitors], sodium-glucose cotransporter-2 inhibitors [SGLT-2 inhibitors], metformin, Cycloset [bromocriptine mesylate]) can offer other benefits for the patient—treating not only multiple mechanisms of hyperglycemia (the egregious eleven: use the fewest number of agents in combination to treat the most number of mechanisms of hyperglycemia) but also recognize that they can prevent and treat the complications and associated conditions of the diabetes syndrome: cardiovascular, renal, liver, some cancers, psoriasis, and dementia.
The classic link between metabolic syndrome and T2DM is important to consider when applying precision medicine approaches to the management of T2DM. Here are some examples of how precision medicine is being applied in the management of T2DM:
Genetic testing: Genetic testing can help identify specific genetic variants or mutations that may influence an individual's risk of developing T2DM or their response to certain medications. By understanding a person's genetic predisposition, clinicians can make more informed decisions about treatment options and develop personalized strategies for their patients.
Pharmacogenomics: Certain genetic variations can impact how a person metabolizes and responds to specific diabetes medications. By analyzing an individual's genetic profile, medications that are more likely to be effective and have fewer adverse effects for that patient may be selected.
Continuous glucose monitoring (CGM): CGM devices provide real-time information about an individual’s blood glucose levels, allowing for more precise management of diabetes. By continuously monitoring glucose levels, patterns can be identified, allowing for adjustments to medication dosages, dietary recommendations, and lifestyle modifications on an individualized basis.
Lifestyle interventions: Precision medicine also recognizes that lifestyle factors play a crucial role in the development and management of T2DM. Lifestyle interventions, such as diet and exercise plans, based on an individual's preferences, metabolic profile, and response to different interventions can be personalized (ie, some individuals may benefit more from a low-carbohydrate diet, while others may respond better to a Mediterranean-style diet).
Predictive modeling and risk stratification: Precision medicine leverages data analytics and predictive modeling to assess an individual's risk of developing complications associated with T2DM. By analyzing various factors such as medical history, genetics, lifestyle, and biomarkers, individuals who are at a higher risk of developing complications can be identified, and their treatment plans can be tailored accordingly. Precision medicine enables early identification of individuals who are at a higher risk of developing T2DM based on their metabolic syndrome status.
In summary, precision medicine for T2DM considers the link between metabolic syndrome and diabetes syndrome to develop personalized approaches for prevention, early intervention, and treatment. By understanding an individual's metabolic and genetic profile, targeted strategies to optimize management and improve outcomes for patients with metabolic syndrome and those at risk of developing diabetes can be implemented.
It is important to note that while precision medicine holds promise in improving diabetes management, it is still an evolving field, and its widespread implementation is not yet fully realized. Collaboration between clinicians, researchers, and technological advancements will continue to drive the progress of precision medicine in T2DM management.