User login
Implementation of a Symptom–Triggered Protocol for Severe Alcohol Withdrawal Treatment in a Medical Step-down Unit
From Stamford Hospital, Stamford, CT.
Objective: This single-center, quasi-experimental study of adult patients admitted or transferred to a medical step-down unit with alcohol withdrawal diagnoses sought to determine if symptom–triggered therapy (STT) is more effective than combined fixed-scheduled (FS) and STT in severe alcohol withdrawal.
Methods: In the preintervention group (72 episodes), patients were treated with FS and STT based on physician preference. In the postintervention group (69 episodes), providers were required to utilize only the STT protocol.
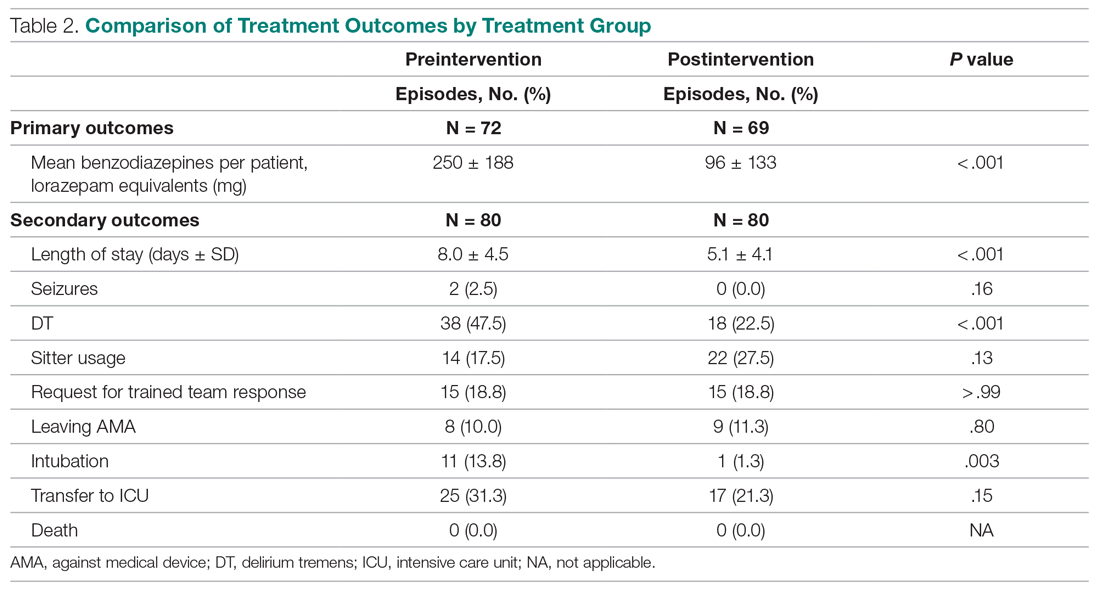
Results: Implementation of the intervention was associated with a significant reduction in average (per patient) cumulative benzodiazepine dose, from 250 mg to 96 mg (P < .001) and a decrease in average length of stay from 8.0 days to 5.1 days (P < .001). Secondary safety measures included a reduction in the proportion of patients who experienced delirium tremens from 47.5% to 22.5% (P < .001), and a reduction in intubation rates from 13.8% to 1.3% (P = .003).
Conclusion: The STT protocol proved to be more effective and safer in treating severe alcohol withdrawal patients than usual care employing STT with FS. We believe the successful implementation of a STT protocol in high-acuity patients requires frequent monitoring to assess withdrawal severity combined with appropriate and timely dosing of benzodiazepines.
Keywords: alcohol withdrawal delirium; alcohol withdrawal syndrome; treatment protocol; benzodiazepine; lorazepam.
Management of severe alcohol withdrawal and delirium tremens (DT) is challenging and requires significant resources, including close monitoring and intensive treatment, frequently in an intensive care unit (ICU).1 Early diagnosis and therapeutic intervention are important to limit potential complications associated with DT.2 Benzodiazepines are first-line therapeutic agents, but the definition of optimal use and dosing regimens has been limited, due to a lack of randomized controlled trials. In lower acuity patients admitted to a detoxification unit, systematic symptom–triggered benzodiazepine therapy (STT) has been established to be more effective than fixed-schedule (FS) dosing.3-5 Patients treated using STT require lower total benzodiazepine dosing and achieve shorter treatment durations. However, in higher-acuity patients admitted to general medical services, analyses have not shown an advantage of STT over combined FS and STT.6
Methods
The purpose of this study was to determine whether implementation of STT is more effective than FS dosing combined with episodic STT in the management of hospitalized high-acuity alcohol withdrawal patients. We conducted a preintervention and postintervention quasi-experimental study in the step-down unit (SDU) of a 305-bed community teaching hospital. The study population consisted of adult inpatients 18 years or older admitted or transferred to the 12-bed SDU with alcohol withdrawal, as defined by primary or secondary International Classification of Diseases, Tenth Revision diagnoses. SDU admission criteria included patients with prior DT or those who had received multiple doses of benzodiazepines in the emergency department. In-hospital transfer to the SDU was at the physician’s discretion, if the patient required escalating doses of benzodiazepines or the use of increasing resources, such as those for behavioral emergencies. The majority of patients admitted or transferred to the SDU were assigned to medical house staff teams under hospitalist supervision, and, on occasion, under community physicians. The nurse-to-patient ratio in the SDU was 1:3.
Study groups
The preintervention group consisted of 80 successive treatment episodes involving patients admitted or transferred to the SDU from
In the preintervention group, fixed, scheduled doses of lorazepam or chlordiazepoxide and as-needed lorazepam were prescribed and adjusted based upon physician judgment. Monitoring of symptom severity was scored using the revised Clinical Institute Withdrawal Assessment for Alcohol scale (CIWA-Ar). Benzodiazepine dosing occurred if the CIWA-Ar score had increased 2 or more points from the last score.
In the postintervention group, the STT protocol included the creation of a standardized physician order set for benzodiazepine “sliding scale” administration. The STT protocol allowed for escalating doses for higher withdrawal scores. Symptom severity was scored using MINDS (Minnesota Detoxification Scale) criteria.1 Lorazepam as-needed dosing was based upon MINDS scores. A MINDS score less than 10 resulted in no medication, MINDS 10-12 required 2 mg, MINDS 13-16 required 4 mg, MINDS 17-19 required 6 mg, and MINDS 20 required 8 mg and a call to the physician. Transfer to the ICU was recommended if the MINDS score was ≥ 20 for 3 consecutive hours. Monitoring intervals occurred more frequently at 30 minutes unless the MINDS score was less than 10. After 7 days, the MINDS protocol was recommended to be discontinued, as the patient might have had iatrogenic delirium.
The STT protocol was introduced during a didactic session for the hospitalists and a separate session for internal medicine and family residents. Each registered nurse working in the SDU was trained in the use of the STT protocol and MINDS during nursing huddles.
Patients were excluded from evaluation if they were transferred to the SDU after 7 or more days in the hospital, if they had stayed in the hospital more than 30 days, were chronically on benzodiazepine therapy (to avoid confounding withdrawal symptoms), or if they left the hospital against medical advice (AMA). To avoid bias in the results, the patients with early discontinuation of treatment were included in analyses of secondary outcomes, thus resulting in all 80 episodes analyzed.
Measures and data
The primary outcome measure was benzodiazepine dose intensity, expressed in total lorazepam-equivalents. Secondary measures included average length of stay (including general medical, surgical, and ICU days), seizure incidence, DT incidence, sitter use, behavioral emergency responses, rates of leaving AMA, intubation, transfer to the ICU, and death.
Benzodiazepine dosing and length of stay were obtained from the data warehouse of the hospital’s electronic health record (EHR; Meditech). Benzodiazepine dosing was expressed in total lorazepam-equivalents, with conversion as follows: lorazepam orally and intravenously 1 mg = chlordiazepoxide 25 mg = diazepam 5 mg. All other measures were obtained from chart review of the patients’ EMR entries. The Stamford Hospital Institutional Review Board approved this study.
Analysis
Data analyses for this study were performed using SPSS version 25.0 (IBM). Categorical data were reported as frequency (count) and percent within category. Continuous data were reported as mean (SD). Categorical data were analyzed using χ2 analysis; continuous data were analyzed using t-tests. A P value of .05 was considered significant for each analysis.
Results
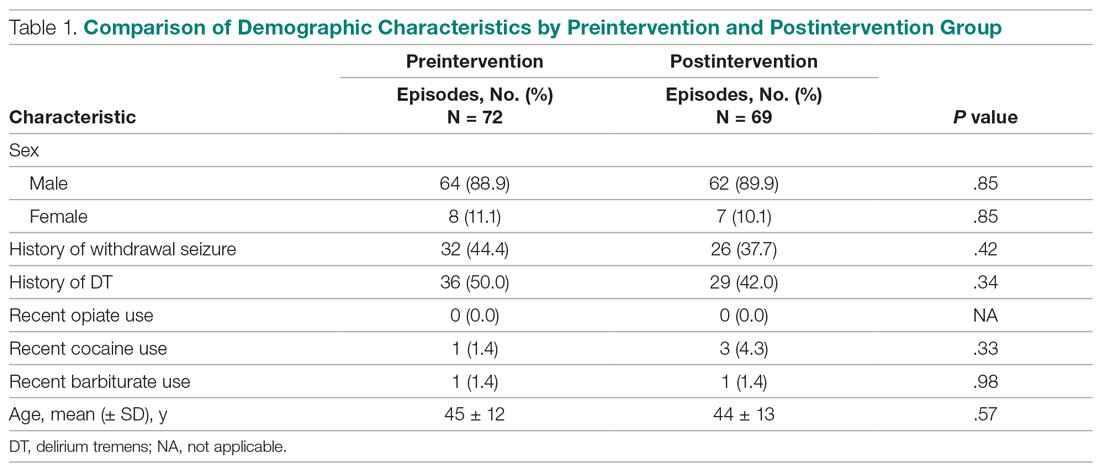
During the preintervention period, 72 episodes (58 patients) met inclusion criteria, and 69 episodes (55 patients) met inclusion criteria during the postintervention period. Ten patients were represented in both groups. Eight preintervention episodes were excluded from the primary analysis because the patient left AMA. Eleven postintervention episodes were excluded: 9 due to patients leaving AMA, 1 due to chronic benzodiazepine usage, and 1 due to transfer to the SDU unit after 7 days. Baseline characteristics and medication use profiles of the preintervention and postintervention groups are summarized in Table 1.
Implementation of the intervention was associated with a significant reduction in average (per patient) cumulative benzodiazepine dose, from 250 mg to 96 mg (P < .001), as shown in Table 2. Average length of stay decreased from 8.0 days to 5.1 days (P < .001). Secondary safety measures were notable for a reduction in DT incidence, from 47.5% to 22.5% (P < .001), and lower rates of intubation, from 13.8% to 1.3% (P = .003). Seven-day readmission rates were 0% preintervention and 1.4% postintervention.
Discussion
We found that hospitalized patients with severe alcohol withdrawal treated with STT required fewer benzodiazepines and had a lower length of stay than patients treated with a conventional combined STT and FS regimen. Implementation of the change from the STT and FS approach to the STT approach in the SDU resulted in concerns that waiting for symptoms to appear could result in more severe withdrawal and prolonged treatment.3 To address this, the intervention included monitoring and dosing every 30 minutes, as compared to monitoring and dosing every 1 hour preintervention. In addition, a sliding-scale approach to match alcohol withdrawal score with dosage was employed in postintervention patients.
Employment of the STT protocol also resulted in decreased complications, including lower rates of DT and transfer to the ICU. This new intervention resulted in significantly decreased time required to control severe symptoms. In the preintervention phase, if a patient’s symptoms escalated despite administration of the as-needed dose of benzodiazepine, there was often a delay in administration of additional doses due to the time needed for nurses to reach a physician and subsequent placement of a new order. In the postintervention phase, the STT protocol allowed nursing staff to give benzodiazepines without delay when needed. We believe this reduced the number of calls by nursing staff to physicians requesting additional medications, and that this improved teamwork when managing these patients.
As part of the intervention, a decision was made to use the MINDS scale rather than the CIWA-Ar scale to assess withdrawal severity. This was because the CIWA-Ar has only been validated in patients with uncomplicated alcohol withdrawal syndrome and has not been researched extensively in patients requiring ICU-level care.1 MINDS assessment has proven to be reliable and reflects severity of withdrawal. Furthermore, MINDS requires less time to administer—3 to 5 minutes vs 5 to 15 minutes for the CIWA-Ar scale. CIWA-Ar, unlike MINDS, requires subjective input from the patient, which is less reliable for higher acuity patients. Our study is unique in that it focused on high-acuity patients and it showed both a significant reduction in quantity of benzodiazepines prescribed and length of stay. Previous studies on lower acuity patients in detoxification units have confirmed that STT is more effective than a FS approach.3-5 In patients of higher acuity, STT has not proven to be superior.
A key lesson learned was the need for proper education of nursing staff. Concurrent nursing audits were necessary to ensure that scoring was performed in an accurate and timely manner. In addition, it was challenging to predict which patients might develop DTs versus those requiring a brief inpatient stay. While there was initial concern that an STT protocol could result in underdosing, we found that patients had fewer DT episodes and fewer ICU transfers.
This study had several limitations. These include a relatively small sample size and the data being less recent. As there has been no intervening change to the therapeutic paradigm of DT treatment, the findings remain pertinent to the present time. The study employed a simple pre/post design and was conducted in a single setting. We are not aware of any temporal or local trends likely to influence these results. Admissions and transfers to the SDU for severe alcohol withdrawal were based on physician discretion. However, patient characteristics in both groups were similar (Table 1). We note that the postintervention STT protocol allowed for more frequent benzodiazepine dosing, though benzodiazepine use did decrease. Different alcohol withdrawal scores (MINDS vs. CIWA-Ar) were used for postintervention and preintervention, although previous research has shown that MINDS and CIWA-Ar scores correlate well.7 Finally, some patients of higher acuity and complexity were excluded, potentially limiting the generalizability of our results.
Conclusion
Our STT protocol proved to be more effective and safer in treating severe alcohol withdrawal patients than usual care employing STT with FS. We believe the successful implementation of a STT protocol in high-acuity patients also requires frequent monitoring using the MINDS scale, integrated with benzodiazepine sliding-scale dosing to match symptom severity. This bundled approach resulted in a significant reduction of benzodiazepine usage and reduced length of stay. Timely treatment of these patients also reduced the percent of patients developing DTs, and reduced intubation rates and transfers to the ICU. Further studies may be warranted at other sites to confirm the effectiveness of this STT protocol.
Corresponding author: Paul W. Huang, MD, Stamford Hospital, One Hospital Plaza, PO Box 9317, Stamford, CT 06904; [email protected].
Financial disclosures: None.
1. DeCarolis DD, Rice KL, Ho L, et al. Symptom-driven lorazepam protocol for treatment of severe alcohol withdrawal delirium in the intensive care unit. Pharmacotherapy. 2007;27(4):510-518.
2. DeBellis R, Smith BS, Choi S, Malloy M. Management of delirium tremens. J Intensive Care Med. 2005;20(3):164-173.
3. Saitz R, Mayo-Smith MF, Roberts MS, et al. Individualized treatment for alcohol withdrawal. A randomized double-blind controlled trial. JAMA. 1994;272(7):519-523.
4. Sachdeva A, Chandra M, Deshpande SN. A comparative study of fixed tapering dose regimen versus symptom-triggered regimen of lorazepam for alcohol detoxification. Alcohol Alcohol. 2014;49(3):287-291.
5. Daeppen JB, Gache P, Landry U, et al. Symptom-triggered vs fixed-schedule doses of benzodiazepine for alcohol withdrawal: a randomized treatment trial. Arch Intern Med. 2002;162(10):1117-1121.
6. Jaeger TM, Lohr RH, Pankratz VS. Symptom-triggered therapy for alcohol withdrawal syndrome in medical inpatients. Mayo Clin Proc. 2001;76(7):695-701.
7. Littlefield AJ, Heavner MS, Eng CC, et al. Correlation Between mMINDS and CIWA-Ar Scoring Tools in Patients With Alcohol Withdrawal Syndrome. Am J Crit Care. 2018;27(4):280-286.
From Stamford Hospital, Stamford, CT.
Objective: This single-center, quasi-experimental study of adult patients admitted or transferred to a medical step-down unit with alcohol withdrawal diagnoses sought to determine if symptom–triggered therapy (STT) is more effective than combined fixed-scheduled (FS) and STT in severe alcohol withdrawal.
Methods: In the preintervention group (72 episodes), patients were treated with FS and STT based on physician preference. In the postintervention group (69 episodes), providers were required to utilize only the STT protocol.
Results: Implementation of the intervention was associated with a significant reduction in average (per patient) cumulative benzodiazepine dose, from 250 mg to 96 mg (P < .001) and a decrease in average length of stay from 8.0 days to 5.1 days (P < .001). Secondary safety measures included a reduction in the proportion of patients who experienced delirium tremens from 47.5% to 22.5% (P < .001), and a reduction in intubation rates from 13.8% to 1.3% (P = .003).
Conclusion: The STT protocol proved to be more effective and safer in treating severe alcohol withdrawal patients than usual care employing STT with FS. We believe the successful implementation of a STT protocol in high-acuity patients requires frequent monitoring to assess withdrawal severity combined with appropriate and timely dosing of benzodiazepines.
Keywords: alcohol withdrawal delirium; alcohol withdrawal syndrome; treatment protocol; benzodiazepine; lorazepam.
Management of severe alcohol withdrawal and delirium tremens (DT) is challenging and requires significant resources, including close monitoring and intensive treatment, frequently in an intensive care unit (ICU).1 Early diagnosis and therapeutic intervention are important to limit potential complications associated with DT.2 Benzodiazepines are first-line therapeutic agents, but the definition of optimal use and dosing regimens has been limited, due to a lack of randomized controlled trials. In lower acuity patients admitted to a detoxification unit, systematic symptom–triggered benzodiazepine therapy (STT) has been established to be more effective than fixed-schedule (FS) dosing.3-5 Patients treated using STT require lower total benzodiazepine dosing and achieve shorter treatment durations. However, in higher-acuity patients admitted to general medical services, analyses have not shown an advantage of STT over combined FS and STT.6
Methods
The purpose of this study was to determine whether implementation of STT is more effective than FS dosing combined with episodic STT in the management of hospitalized high-acuity alcohol withdrawal patients. We conducted a preintervention and postintervention quasi-experimental study in the step-down unit (SDU) of a 305-bed community teaching hospital. The study population consisted of adult inpatients 18 years or older admitted or transferred to the 12-bed SDU with alcohol withdrawal, as defined by primary or secondary International Classification of Diseases, Tenth Revision diagnoses. SDU admission criteria included patients with prior DT or those who had received multiple doses of benzodiazepines in the emergency department. In-hospital transfer to the SDU was at the physician’s discretion, if the patient required escalating doses of benzodiazepines or the use of increasing resources, such as those for behavioral emergencies. The majority of patients admitted or transferred to the SDU were assigned to medical house staff teams under hospitalist supervision, and, on occasion, under community physicians. The nurse-to-patient ratio in the SDU was 1:3.
Study groups
The preintervention group consisted of 80 successive treatment episodes involving patients admitted or transferred to the SDU from
In the preintervention group, fixed, scheduled doses of lorazepam or chlordiazepoxide and as-needed lorazepam were prescribed and adjusted based upon physician judgment. Monitoring of symptom severity was scored using the revised Clinical Institute Withdrawal Assessment for Alcohol scale (CIWA-Ar). Benzodiazepine dosing occurred if the CIWA-Ar score had increased 2 or more points from the last score.
In the postintervention group, the STT protocol included the creation of a standardized physician order set for benzodiazepine “sliding scale” administration. The STT protocol allowed for escalating doses for higher withdrawal scores. Symptom severity was scored using MINDS (Minnesota Detoxification Scale) criteria.1 Lorazepam as-needed dosing was based upon MINDS scores. A MINDS score less than 10 resulted in no medication, MINDS 10-12 required 2 mg, MINDS 13-16 required 4 mg, MINDS 17-19 required 6 mg, and MINDS 20 required 8 mg and a call to the physician. Transfer to the ICU was recommended if the MINDS score was ≥ 20 for 3 consecutive hours. Monitoring intervals occurred more frequently at 30 minutes unless the MINDS score was less than 10. After 7 days, the MINDS protocol was recommended to be discontinued, as the patient might have had iatrogenic delirium.
The STT protocol was introduced during a didactic session for the hospitalists and a separate session for internal medicine and family residents. Each registered nurse working in the SDU was trained in the use of the STT protocol and MINDS during nursing huddles.
Patients were excluded from evaluation if they were transferred to the SDU after 7 or more days in the hospital, if they had stayed in the hospital more than 30 days, were chronically on benzodiazepine therapy (to avoid confounding withdrawal symptoms), or if they left the hospital against medical advice (AMA). To avoid bias in the results, the patients with early discontinuation of treatment were included in analyses of secondary outcomes, thus resulting in all 80 episodes analyzed.
Measures and data
The primary outcome measure was benzodiazepine dose intensity, expressed in total lorazepam-equivalents. Secondary measures included average length of stay (including general medical, surgical, and ICU days), seizure incidence, DT incidence, sitter use, behavioral emergency responses, rates of leaving AMA, intubation, transfer to the ICU, and death.
Benzodiazepine dosing and length of stay were obtained from the data warehouse of the hospital’s electronic health record (EHR; Meditech). Benzodiazepine dosing was expressed in total lorazepam-equivalents, with conversion as follows: lorazepam orally and intravenously 1 mg = chlordiazepoxide 25 mg = diazepam 5 mg. All other measures were obtained from chart review of the patients’ EMR entries. The Stamford Hospital Institutional Review Board approved this study.
Analysis
Data analyses for this study were performed using SPSS version 25.0 (IBM). Categorical data were reported as frequency (count) and percent within category. Continuous data were reported as mean (SD). Categorical data were analyzed using χ2 analysis; continuous data were analyzed using t-tests. A P value of .05 was considered significant for each analysis.
Results
During the preintervention period, 72 episodes (58 patients) met inclusion criteria, and 69 episodes (55 patients) met inclusion criteria during the postintervention period. Ten patients were represented in both groups. Eight preintervention episodes were excluded from the primary analysis because the patient left AMA. Eleven postintervention episodes were excluded: 9 due to patients leaving AMA, 1 due to chronic benzodiazepine usage, and 1 due to transfer to the SDU unit after 7 days. Baseline characteristics and medication use profiles of the preintervention and postintervention groups are summarized in Table 1.
Implementation of the intervention was associated with a significant reduction in average (per patient) cumulative benzodiazepine dose, from 250 mg to 96 mg (P < .001), as shown in Table 2. Average length of stay decreased from 8.0 days to 5.1 days (P < .001). Secondary safety measures were notable for a reduction in DT incidence, from 47.5% to 22.5% (P < .001), and lower rates of intubation, from 13.8% to 1.3% (P = .003). Seven-day readmission rates were 0% preintervention and 1.4% postintervention.
Discussion
We found that hospitalized patients with severe alcohol withdrawal treated with STT required fewer benzodiazepines and had a lower length of stay than patients treated with a conventional combined STT and FS regimen. Implementation of the change from the STT and FS approach to the STT approach in the SDU resulted in concerns that waiting for symptoms to appear could result in more severe withdrawal and prolonged treatment.3 To address this, the intervention included monitoring and dosing every 30 minutes, as compared to monitoring and dosing every 1 hour preintervention. In addition, a sliding-scale approach to match alcohol withdrawal score with dosage was employed in postintervention patients.
Employment of the STT protocol also resulted in decreased complications, including lower rates of DT and transfer to the ICU. This new intervention resulted in significantly decreased time required to control severe symptoms. In the preintervention phase, if a patient’s symptoms escalated despite administration of the as-needed dose of benzodiazepine, there was often a delay in administration of additional doses due to the time needed for nurses to reach a physician and subsequent placement of a new order. In the postintervention phase, the STT protocol allowed nursing staff to give benzodiazepines without delay when needed. We believe this reduced the number of calls by nursing staff to physicians requesting additional medications, and that this improved teamwork when managing these patients.
As part of the intervention, a decision was made to use the MINDS scale rather than the CIWA-Ar scale to assess withdrawal severity. This was because the CIWA-Ar has only been validated in patients with uncomplicated alcohol withdrawal syndrome and has not been researched extensively in patients requiring ICU-level care.1 MINDS assessment has proven to be reliable and reflects severity of withdrawal. Furthermore, MINDS requires less time to administer—3 to 5 minutes vs 5 to 15 minutes for the CIWA-Ar scale. CIWA-Ar, unlike MINDS, requires subjective input from the patient, which is less reliable for higher acuity patients. Our study is unique in that it focused on high-acuity patients and it showed both a significant reduction in quantity of benzodiazepines prescribed and length of stay. Previous studies on lower acuity patients in detoxification units have confirmed that STT is more effective than a FS approach.3-5 In patients of higher acuity, STT has not proven to be superior.
A key lesson learned was the need for proper education of nursing staff. Concurrent nursing audits were necessary to ensure that scoring was performed in an accurate and timely manner. In addition, it was challenging to predict which patients might develop DTs versus those requiring a brief inpatient stay. While there was initial concern that an STT protocol could result in underdosing, we found that patients had fewer DT episodes and fewer ICU transfers.
This study had several limitations. These include a relatively small sample size and the data being less recent. As there has been no intervening change to the therapeutic paradigm of DT treatment, the findings remain pertinent to the present time. The study employed a simple pre/post design and was conducted in a single setting. We are not aware of any temporal or local trends likely to influence these results. Admissions and transfers to the SDU for severe alcohol withdrawal were based on physician discretion. However, patient characteristics in both groups were similar (Table 1). We note that the postintervention STT protocol allowed for more frequent benzodiazepine dosing, though benzodiazepine use did decrease. Different alcohol withdrawal scores (MINDS vs. CIWA-Ar) were used for postintervention and preintervention, although previous research has shown that MINDS and CIWA-Ar scores correlate well.7 Finally, some patients of higher acuity and complexity were excluded, potentially limiting the generalizability of our results.
Conclusion
Our STT protocol proved to be more effective and safer in treating severe alcohol withdrawal patients than usual care employing STT with FS. We believe the successful implementation of a STT protocol in high-acuity patients also requires frequent monitoring using the MINDS scale, integrated with benzodiazepine sliding-scale dosing to match symptom severity. This bundled approach resulted in a significant reduction of benzodiazepine usage and reduced length of stay. Timely treatment of these patients also reduced the percent of patients developing DTs, and reduced intubation rates and transfers to the ICU. Further studies may be warranted at other sites to confirm the effectiveness of this STT protocol.
Corresponding author: Paul W. Huang, MD, Stamford Hospital, One Hospital Plaza, PO Box 9317, Stamford, CT 06904; [email protected].
Financial disclosures: None.
From Stamford Hospital, Stamford, CT.
Objective: This single-center, quasi-experimental study of adult patients admitted or transferred to a medical step-down unit with alcohol withdrawal diagnoses sought to determine if symptom–triggered therapy (STT) is more effective than combined fixed-scheduled (FS) and STT in severe alcohol withdrawal.
Methods: In the preintervention group (72 episodes), patients were treated with FS and STT based on physician preference. In the postintervention group (69 episodes), providers were required to utilize only the STT protocol.
Results: Implementation of the intervention was associated with a significant reduction in average (per patient) cumulative benzodiazepine dose, from 250 mg to 96 mg (P < .001) and a decrease in average length of stay from 8.0 days to 5.1 days (P < .001). Secondary safety measures included a reduction in the proportion of patients who experienced delirium tremens from 47.5% to 22.5% (P < .001), and a reduction in intubation rates from 13.8% to 1.3% (P = .003).
Conclusion: The STT protocol proved to be more effective and safer in treating severe alcohol withdrawal patients than usual care employing STT with FS. We believe the successful implementation of a STT protocol in high-acuity patients requires frequent monitoring to assess withdrawal severity combined with appropriate and timely dosing of benzodiazepines.
Keywords: alcohol withdrawal delirium; alcohol withdrawal syndrome; treatment protocol; benzodiazepine; lorazepam.
Management of severe alcohol withdrawal and delirium tremens (DT) is challenging and requires significant resources, including close monitoring and intensive treatment, frequently in an intensive care unit (ICU).1 Early diagnosis and therapeutic intervention are important to limit potential complications associated with DT.2 Benzodiazepines are first-line therapeutic agents, but the definition of optimal use and dosing regimens has been limited, due to a lack of randomized controlled trials. In lower acuity patients admitted to a detoxification unit, systematic symptom–triggered benzodiazepine therapy (STT) has been established to be more effective than fixed-schedule (FS) dosing.3-5 Patients treated using STT require lower total benzodiazepine dosing and achieve shorter treatment durations. However, in higher-acuity patients admitted to general medical services, analyses have not shown an advantage of STT over combined FS and STT.6
Methods
The purpose of this study was to determine whether implementation of STT is more effective than FS dosing combined with episodic STT in the management of hospitalized high-acuity alcohol withdrawal patients. We conducted a preintervention and postintervention quasi-experimental study in the step-down unit (SDU) of a 305-bed community teaching hospital. The study population consisted of adult inpatients 18 years or older admitted or transferred to the 12-bed SDU with alcohol withdrawal, as defined by primary or secondary International Classification of Diseases, Tenth Revision diagnoses. SDU admission criteria included patients with prior DT or those who had received multiple doses of benzodiazepines in the emergency department. In-hospital transfer to the SDU was at the physician’s discretion, if the patient required escalating doses of benzodiazepines or the use of increasing resources, such as those for behavioral emergencies. The majority of patients admitted or transferred to the SDU were assigned to medical house staff teams under hospitalist supervision, and, on occasion, under community physicians. The nurse-to-patient ratio in the SDU was 1:3.
Study groups
The preintervention group consisted of 80 successive treatment episodes involving patients admitted or transferred to the SDU from
In the preintervention group, fixed, scheduled doses of lorazepam or chlordiazepoxide and as-needed lorazepam were prescribed and adjusted based upon physician judgment. Monitoring of symptom severity was scored using the revised Clinical Institute Withdrawal Assessment for Alcohol scale (CIWA-Ar). Benzodiazepine dosing occurred if the CIWA-Ar score had increased 2 or more points from the last score.
In the postintervention group, the STT protocol included the creation of a standardized physician order set for benzodiazepine “sliding scale” administration. The STT protocol allowed for escalating doses for higher withdrawal scores. Symptom severity was scored using MINDS (Minnesota Detoxification Scale) criteria.1 Lorazepam as-needed dosing was based upon MINDS scores. A MINDS score less than 10 resulted in no medication, MINDS 10-12 required 2 mg, MINDS 13-16 required 4 mg, MINDS 17-19 required 6 mg, and MINDS 20 required 8 mg and a call to the physician. Transfer to the ICU was recommended if the MINDS score was ≥ 20 for 3 consecutive hours. Monitoring intervals occurred more frequently at 30 minutes unless the MINDS score was less than 10. After 7 days, the MINDS protocol was recommended to be discontinued, as the patient might have had iatrogenic delirium.
The STT protocol was introduced during a didactic session for the hospitalists and a separate session for internal medicine and family residents. Each registered nurse working in the SDU was trained in the use of the STT protocol and MINDS during nursing huddles.
Patients were excluded from evaluation if they were transferred to the SDU after 7 or more days in the hospital, if they had stayed in the hospital more than 30 days, were chronically on benzodiazepine therapy (to avoid confounding withdrawal symptoms), or if they left the hospital against medical advice (AMA). To avoid bias in the results, the patients with early discontinuation of treatment were included in analyses of secondary outcomes, thus resulting in all 80 episodes analyzed.
Measures and data
The primary outcome measure was benzodiazepine dose intensity, expressed in total lorazepam-equivalents. Secondary measures included average length of stay (including general medical, surgical, and ICU days), seizure incidence, DT incidence, sitter use, behavioral emergency responses, rates of leaving AMA, intubation, transfer to the ICU, and death.
Benzodiazepine dosing and length of stay were obtained from the data warehouse of the hospital’s electronic health record (EHR; Meditech). Benzodiazepine dosing was expressed in total lorazepam-equivalents, with conversion as follows: lorazepam orally and intravenously 1 mg = chlordiazepoxide 25 mg = diazepam 5 mg. All other measures were obtained from chart review of the patients’ EMR entries. The Stamford Hospital Institutional Review Board approved this study.
Analysis
Data analyses for this study were performed using SPSS version 25.0 (IBM). Categorical data were reported as frequency (count) and percent within category. Continuous data were reported as mean (SD). Categorical data were analyzed using χ2 analysis; continuous data were analyzed using t-tests. A P value of .05 was considered significant for each analysis.
Results
During the preintervention period, 72 episodes (58 patients) met inclusion criteria, and 69 episodes (55 patients) met inclusion criteria during the postintervention period. Ten patients were represented in both groups. Eight preintervention episodes were excluded from the primary analysis because the patient left AMA. Eleven postintervention episodes were excluded: 9 due to patients leaving AMA, 1 due to chronic benzodiazepine usage, and 1 due to transfer to the SDU unit after 7 days. Baseline characteristics and medication use profiles of the preintervention and postintervention groups are summarized in Table 1.
Implementation of the intervention was associated with a significant reduction in average (per patient) cumulative benzodiazepine dose, from 250 mg to 96 mg (P < .001), as shown in Table 2. Average length of stay decreased from 8.0 days to 5.1 days (P < .001). Secondary safety measures were notable for a reduction in DT incidence, from 47.5% to 22.5% (P < .001), and lower rates of intubation, from 13.8% to 1.3% (P = .003). Seven-day readmission rates were 0% preintervention and 1.4% postintervention.
Discussion
We found that hospitalized patients with severe alcohol withdrawal treated with STT required fewer benzodiazepines and had a lower length of stay than patients treated with a conventional combined STT and FS regimen. Implementation of the change from the STT and FS approach to the STT approach in the SDU resulted in concerns that waiting for symptoms to appear could result in more severe withdrawal and prolonged treatment.3 To address this, the intervention included monitoring and dosing every 30 minutes, as compared to monitoring and dosing every 1 hour preintervention. In addition, a sliding-scale approach to match alcohol withdrawal score with dosage was employed in postintervention patients.
Employment of the STT protocol also resulted in decreased complications, including lower rates of DT and transfer to the ICU. This new intervention resulted in significantly decreased time required to control severe symptoms. In the preintervention phase, if a patient’s symptoms escalated despite administration of the as-needed dose of benzodiazepine, there was often a delay in administration of additional doses due to the time needed for nurses to reach a physician and subsequent placement of a new order. In the postintervention phase, the STT protocol allowed nursing staff to give benzodiazepines without delay when needed. We believe this reduced the number of calls by nursing staff to physicians requesting additional medications, and that this improved teamwork when managing these patients.
As part of the intervention, a decision was made to use the MINDS scale rather than the CIWA-Ar scale to assess withdrawal severity. This was because the CIWA-Ar has only been validated in patients with uncomplicated alcohol withdrawal syndrome and has not been researched extensively in patients requiring ICU-level care.1 MINDS assessment has proven to be reliable and reflects severity of withdrawal. Furthermore, MINDS requires less time to administer—3 to 5 minutes vs 5 to 15 minutes for the CIWA-Ar scale. CIWA-Ar, unlike MINDS, requires subjective input from the patient, which is less reliable for higher acuity patients. Our study is unique in that it focused on high-acuity patients and it showed both a significant reduction in quantity of benzodiazepines prescribed and length of stay. Previous studies on lower acuity patients in detoxification units have confirmed that STT is more effective than a FS approach.3-5 In patients of higher acuity, STT has not proven to be superior.
A key lesson learned was the need for proper education of nursing staff. Concurrent nursing audits were necessary to ensure that scoring was performed in an accurate and timely manner. In addition, it was challenging to predict which patients might develop DTs versus those requiring a brief inpatient stay. While there was initial concern that an STT protocol could result in underdosing, we found that patients had fewer DT episodes and fewer ICU transfers.
This study had several limitations. These include a relatively small sample size and the data being less recent. As there has been no intervening change to the therapeutic paradigm of DT treatment, the findings remain pertinent to the present time. The study employed a simple pre/post design and was conducted in a single setting. We are not aware of any temporal or local trends likely to influence these results. Admissions and transfers to the SDU for severe alcohol withdrawal were based on physician discretion. However, patient characteristics in both groups were similar (Table 1). We note that the postintervention STT protocol allowed for more frequent benzodiazepine dosing, though benzodiazepine use did decrease. Different alcohol withdrawal scores (MINDS vs. CIWA-Ar) were used for postintervention and preintervention, although previous research has shown that MINDS and CIWA-Ar scores correlate well.7 Finally, some patients of higher acuity and complexity were excluded, potentially limiting the generalizability of our results.
Conclusion
Our STT protocol proved to be more effective and safer in treating severe alcohol withdrawal patients than usual care employing STT with FS. We believe the successful implementation of a STT protocol in high-acuity patients also requires frequent monitoring using the MINDS scale, integrated with benzodiazepine sliding-scale dosing to match symptom severity. This bundled approach resulted in a significant reduction of benzodiazepine usage and reduced length of stay. Timely treatment of these patients also reduced the percent of patients developing DTs, and reduced intubation rates and transfers to the ICU. Further studies may be warranted at other sites to confirm the effectiveness of this STT protocol.
Corresponding author: Paul W. Huang, MD, Stamford Hospital, One Hospital Plaza, PO Box 9317, Stamford, CT 06904; [email protected].
Financial disclosures: None.
1. DeCarolis DD, Rice KL, Ho L, et al. Symptom-driven lorazepam protocol for treatment of severe alcohol withdrawal delirium in the intensive care unit. Pharmacotherapy. 2007;27(4):510-518.
2. DeBellis R, Smith BS, Choi S, Malloy M. Management of delirium tremens. J Intensive Care Med. 2005;20(3):164-173.
3. Saitz R, Mayo-Smith MF, Roberts MS, et al. Individualized treatment for alcohol withdrawal. A randomized double-blind controlled trial. JAMA. 1994;272(7):519-523.
4. Sachdeva A, Chandra M, Deshpande SN. A comparative study of fixed tapering dose regimen versus symptom-triggered regimen of lorazepam for alcohol detoxification. Alcohol Alcohol. 2014;49(3):287-291.
5. Daeppen JB, Gache P, Landry U, et al. Symptom-triggered vs fixed-schedule doses of benzodiazepine for alcohol withdrawal: a randomized treatment trial. Arch Intern Med. 2002;162(10):1117-1121.
6. Jaeger TM, Lohr RH, Pankratz VS. Symptom-triggered therapy for alcohol withdrawal syndrome in medical inpatients. Mayo Clin Proc. 2001;76(7):695-701.
7. Littlefield AJ, Heavner MS, Eng CC, et al. Correlation Between mMINDS and CIWA-Ar Scoring Tools in Patients With Alcohol Withdrawal Syndrome. Am J Crit Care. 2018;27(4):280-286.
1. DeCarolis DD, Rice KL, Ho L, et al. Symptom-driven lorazepam protocol for treatment of severe alcohol withdrawal delirium in the intensive care unit. Pharmacotherapy. 2007;27(4):510-518.
2. DeBellis R, Smith BS, Choi S, Malloy M. Management of delirium tremens. J Intensive Care Med. 2005;20(3):164-173.
3. Saitz R, Mayo-Smith MF, Roberts MS, et al. Individualized treatment for alcohol withdrawal. A randomized double-blind controlled trial. JAMA. 1994;272(7):519-523.
4. Sachdeva A, Chandra M, Deshpande SN. A comparative study of fixed tapering dose regimen versus symptom-triggered regimen of lorazepam for alcohol detoxification. Alcohol Alcohol. 2014;49(3):287-291.
5. Daeppen JB, Gache P, Landry U, et al. Symptom-triggered vs fixed-schedule doses of benzodiazepine for alcohol withdrawal: a randomized treatment trial. Arch Intern Med. 2002;162(10):1117-1121.
6. Jaeger TM, Lohr RH, Pankratz VS. Symptom-triggered therapy for alcohol withdrawal syndrome in medical inpatients. Mayo Clin Proc. 2001;76(7):695-701.
7. Littlefield AJ, Heavner MS, Eng CC, et al. Correlation Between mMINDS and CIWA-Ar Scoring Tools in Patients With Alcohol Withdrawal Syndrome. Am J Crit Care. 2018;27(4):280-286.
Morning Discharges and Patient Length of Stay in Inpatient General Internal Medicine
There is substantial interest in improving patient flow and reducing hospital length of stay (LOS).1-4 Impaired hospital flow may negatively impact both patient satisfaction and safety through, for example, emergency department (ED) overcrowding.5,6 Impaired hospital flow is associated with downstream effects on patient care, hospital costs, and availability of beds.7-9
A number of quality-improvement interventions aim to improve patient flow, including efforts to increase the number of discharges that occur before noon.10,11 Morning discharges have been hypothesized to free hospital beds earlier, thus reducing ED wait times for incoming patients and increasing beds for elective surgeries.11 Morning discharges may also be more predictable for staff and patients. However, it is unclear whether efforts to increase the number of morning discharges have a negative impact on inpatient LOS by incentivizing physicians to keep patients in the hospital for an extra night to facilitate discharge in the early morning rather than the late afternoon. Morning discharges have been associated with both increased12 and decreased LOS.10,11,13-15
The purpose of this study was to examine the associations between morning discharges and ED LOS and hospital LOS in general internal medicine (GIM) at seven hospitals. GIM patients represent nearly 40% of ED admissions to a hospital,16 and thus are an important determinant of patient flow through the ED and hospital. We hypothesized that patients who were admitted to GIM on days with more morning discharges would have shorter ED LOS and hospital LOS.
METHODS
Design, Setting, and Participants
This was a retrospective cohort study conducted using the General Medicine Inpatient Initiative (GEMINI) clinical dataset.16 The dataset includes all GIM admissions at seven large hospital sites in Toronto and Mississauga, Ontario, Canada. These include five academic hospitals and two community-based teaching hospitals. Each hospital is publicly funded and provides tertiary and/or quaternary care to diverse multiethnic populations. Research ethics board approval was obtained from all participating sites.
GIM care is delivered by several interdisciplinary clinical teams functioning in parallel. Attending physicians are predominantly internists who practice as hospitalists in discrete service blocks, typically lasting 2 weeks at a time. Although GIM patients are preferentially admitted to GIM wards, participating hospitals did not have strict policies regarding cohorting GIM patients to specific wards (ie, holding patients in ED until a specific bed becomes available) that would confound the association between morning discharge and ED wait times. Approximately 75% of GIM patients are cared for on dedicated GIM wards at participating hospitals, with the remainder cared for on other medical or surgical wards.
We included all hospitalized patients who were admitted to hospital and discharged from GIM between April 1, 2010, and October 31, 2017, from the seven GEMINI hospitals. We included only patients admitted through the ED. As such, we did not include elective admissions or interfacility transfers who would not experience ED wait times. We excluded patients who were discharged without a provincial health insurance number (N = 2,169; 1.1% of total sample) because they could not be linked across visits to measure readmissions.
Data Source
The GEMINI dataset has been rigorously validated and previously described in detail.16 GEMINI collects both administrative health data reported to the Canadian Institute for Health Information (including data about patient demographics, comorbidities, and discharge destination) as well as electronic clinical data extracted from hospital computer systems (including attending physicians, in-hospital patient room transfers, and laboratory test results). Data are collected for each individual hospital encounter, and the provincial health insurance number is used to link patients across encounters.
Exposures and Outcomes
The two primary outcomes were ED LOS and hospital LOS. ED LOS was calculated as the difference between the time from triage by nursing staff to a patient’s exit from the ED, measured in hours. We also examined 30-day readmission to GIM at any participating hospital as a balancing measure against premature discharges and inpatient mortality because it could modify hospital LOS.
Patient Characteristics
Baseline patient characteristics were measured, including age, sex, Charlson Comorbidity Index score,17 day of admission (categorized as weekend/holiday or weekday), time of admission to hospital (
Statistical Analysis
The study population and physician characteristics were summarized with descriptive statistics. The balance of baseline patient characteristics across morning discharge quartiles was assessed using standardized differences. A standardized difference of less than 0.1 reflects good balance.20
Unadjusted estimates of patient outcomes were reported across morning discharge quartiles. To model the overall association between morning discharge and outcomes, the number of morning GIM discharges on the day of admission was subtracted from the mean number of morning discharges at each hospital and considered as a continuous exposure. We used generalized linear mixed models to estimate the effect of morning discharges on patient outcomes. We fit negative binomial regression models with log link to examine the association between the number of morning discharges (centered by subtracting the hospital mean) and the two main outcomes, ED LOS and hospital LOS. Given the overdispersion of the study population due to the unequal mean and variance, a negative binomial model was preferred over a Poisson regression, as the mean and variance were not equal.21 For our secondary outcomes of binary measures (30-day readmission and morality), we fit logistic regression models. Adjustment for multiple comparisons was not performed.
Multivariable analysis was conducted to adjust for the baseline characteristics described above as well as the total number of GIM discharges on the day of admission and GIM census on the day of admission. Hospital and study month (to account for secular time trends) were included as fixed effects, and patients and admitting physicians were included as crossed random effects to account for the nested structure of admissions within patients and admissions within physicians within hospitals.
A sensitivity analysis was performed to assess for nonlinear associations between morning discharges and the four outcomes (hospital LOS, ED LOS, in-hospital mortality, and readmission) by inputting the term as a restricted cubic spline, with up to five knots
RESULTS
Study Population and Patient Characteristics
The study population consisted of 189,781 hospitalizations involving 115,630 unique patients. The median patient age was 73 years (interquartile range [IQR], 57-84), 50.3% were female, 43.8% had a high Charlson Comorbidity Index score, and 11.1% were admitted to GIM in the prior 30 days (Table 1). The median ED LOS was 14.5 hours (IQR, 10.0-23.1), and the mean was 18.1 hours (SD, 12.2). The median hospital LOS was 4.6 days (IQR, 2.4-9.0), and the mean was 8.6 days (SD, 18.7).
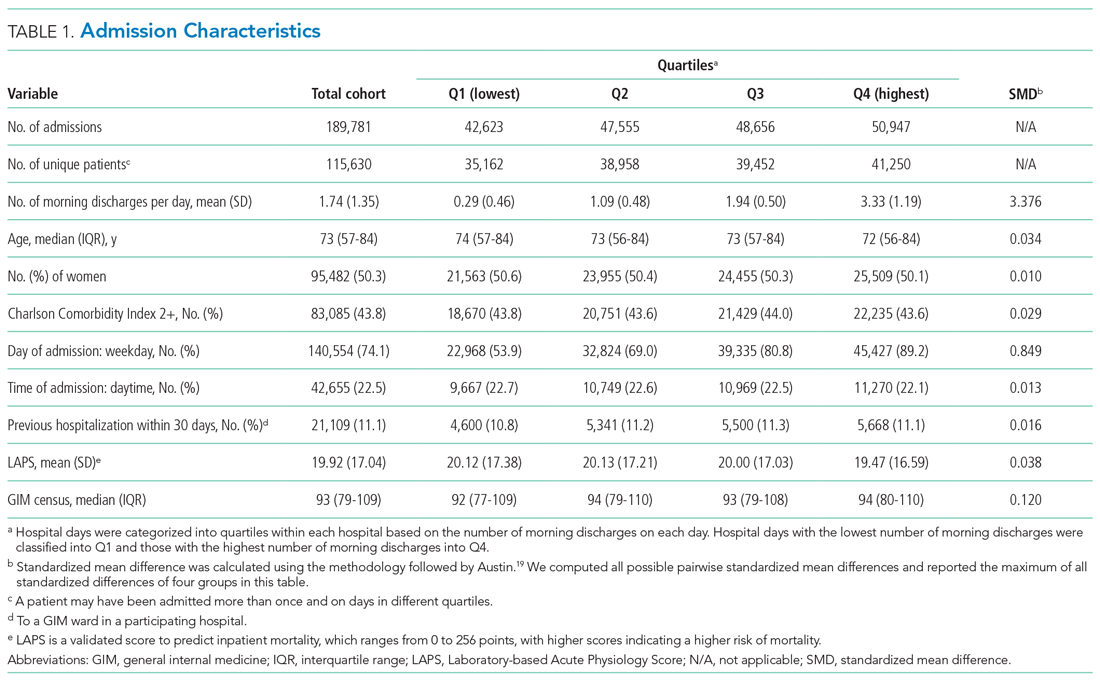
In total, 36,043 (19.0%) discharges occurred between 8:00
Outcomes
Unadjusted clinical outcomes by number of morning discharges are presented in Table 2. The median unadjusted ED LOS was 14.4 (SD, 14.1), 14.3 (SD, 13.2), 14.5 (SD, 13.0), and 14.8 (SD, 13.0) hours for the first to fourth quartiles (fewest to largest number of morning discharges), respectively. The median unadjusted hospital LOS was 4.6 (SD, 6.5), 4.6 (SD, 6.9), 4.7 (SD, 6.4), and 4.6 (SD, 6.4) days for the first to fourth quartiles, respectively.

Unadjusted inpatient mortality was 6.1%, 5.5%, 5.5%, and 5.2% across the first to fourth quartiles, respectively. Unadjusted 30-day readmission to GIM was 12.2%, 12.6%, 12.6%, and 12.5% across the first to fourth quartiles, respectively.
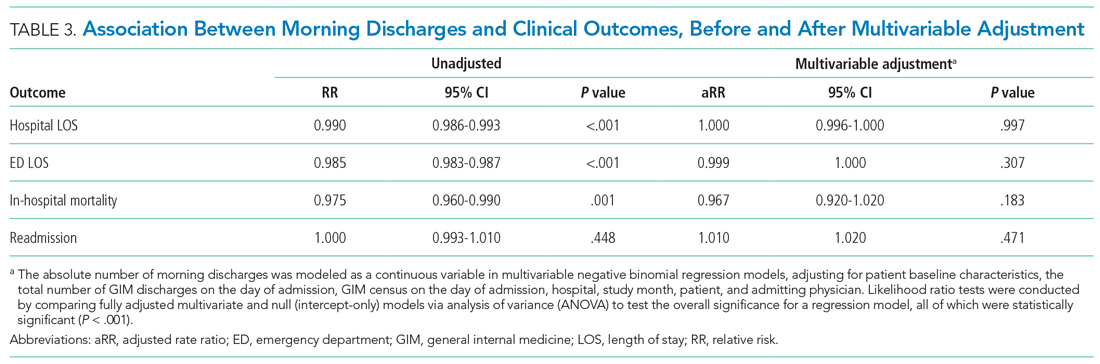
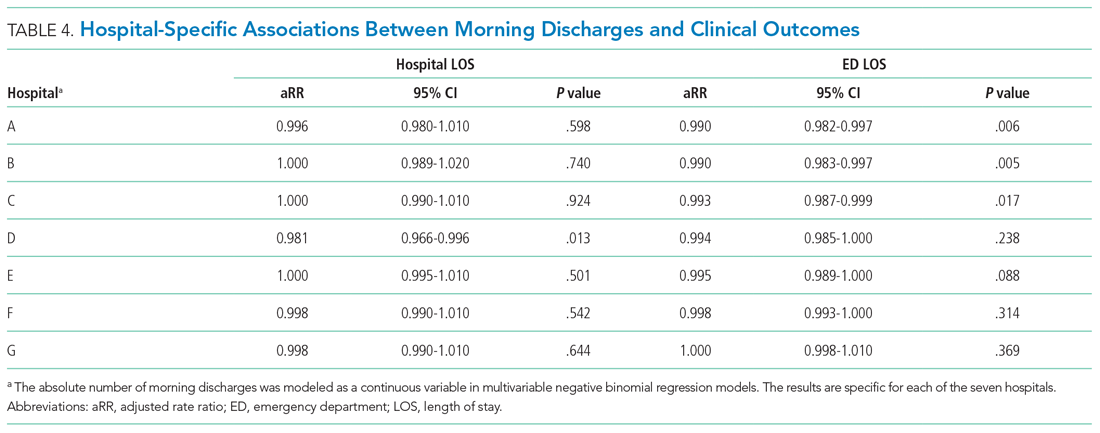
After multivariable adjustment, there was no significant association between morning discharge and hospital LOS (aRR, 1.000; 95% CI, 0.996-1.000; P = .997), ED LOS (aRR, 0.999; 95% CI, 0.997-1.000; P = .307), in-hospital mortality (aRR, 0.967; 95% CI, 0.920-1.020; P =.183), or 30-day readmission (aRR, 1.010; 95% CI, 0.991-1.020; P = .471) (Table 3, Appendix Table 2, Appendix Table 3, Appendix Table 4, Appendix Table 5). When examining each hospital separately, we found that morning discharge was significantly associated with hospital LOS at only one hospital (Hospital D; aRR, 0.981; 95% CI, 0.966-0.996; P = .013). Morning discharge was statistically significantly associated with ED LOS at three hospitals (A, B, and C), but the aRR was at least 0.99 in all three cases (Table 4).
In sensitivity analyses, we found no improvements in model fit when adding spline terms to the model, suggesting no significant nonlinear associations between morning discharges and the outcomes of interest.
DISCUSSION
This large multicenter cohort study found no significant overall association between the number of morning discharges and ED or hospital LOS in GIM. At one hospital, there was a 1.9% reduction in adjusted ED LOS for every additional morning discharge, but no difference in hospital LOS. We also did not observe differences in readmission or inpatient mortality associated with the number of morning discharges. Our observational findings suggest that there is unlikely to be a strong association between morning discharge and patient throughput in GIM. Given that there may be other downstream benefits of morning discharge, such as freeing beds for daytime surgeries,23 further research is needed to determine the effectiveness of specific interventions.
Several studies have posited morning discharge as a method of improving both patient care and hospital flow metrics.10,11,13-15,23 Quality improvement initiatives targeting morning discharges have included stakeholder meetings, incentives programs, discharge-centered breakfast programs, and creating deadlines for discharge orders.24-29 Although these initiatives have gained support, critics have suggested that their supporting evidence is not robust. Werthemier et al10 found a 9.0% reduction of observed to expected LOS associated with increasing the number of early discharges. However, a response article suggested that their findings were confounded by other hospital initiatives, such as allocation of medical and social services to weekends.30 Other observational studies have concluded that hospital LOS is not affected by the number of morning discharges, but this research has been limited by single-center analysis and relatively smaller sample sizes.12 Our study further calls into question the association between morning discharge and patient throughput.
An additional reason for the controversy is that physicians may actively work to discharge patients late in the day to avoid an additional night in hospital. A qualitative study by Minichiello et al31 evaluated staff perceptions regarding afternoon discharges. Physicians and medical students believed that afternoon discharges were a result of waiting for test results and procedures, with staff aiming to discharge patients immediately after obtaining results or finishing necessary procedures. As such, there are concerns that incentivizing morning discharge may lead physicians in the opposite direction, to consciously or unconsciously keep patients overnight in order to facilitate an early morning discharge.30
Our study’s greatest strength was the large sample size over 7 years at seven hospitals in two cities, including both academic and community hospitals with different models of care. To our knowledge, this is the first cohort study that has analyzed the association between early discharge and LOS using multiple centers. To avoid the confounding and reverse causality that may exist when examining the relationship between LOS and morning discharge at the patient level (eg, patients who stay in hospital longer may have more “planned” discharges and leave in the morning), we examined the association based on variation across different days within the GIM service of each hospital. Further, we included robust risk adjustment using clinical and laboratory data. Finally, since our study included a diverse patient population served by participating centers in a system with universal insurance for hospital care, our findings are likely generalizable to other urban and suburban hospitals.
There are several important limitations of our analysis. First, we could only include GIM patients, who represent nearly 40% of ED admissions to hospital at participating centers. A more holistic analysis across all hospital services could be justified; however, given that many quality improvement initiatives occur at the level of a single hospital service, we felt our approach would be informative for future research and improvement efforts. Approximately 75% of GIM patients at participating hospitals were cared for on a GIM ward, with 25% cared for on off-service units. We were unable to include the total hospital census in our models, and this could affect LOS and waiting times for GIM patients, particularly those admitted to off-service units. GIM census is likely highly correlated with hospital census, and we were able to adjust for this. Nevertheless, this remains an important potential source of unmeasured confounding. Second, we did not model the effects of morning discharges from GIM on patient-flow measures for non-GIM patients. Given the lack of effects for GIM patients, who would be more likely to be directly affected, it is unlikely that large effects would be seen for other hospital patients, but we did not measure effects on surgical delays or cancellations, for example.23 Third, we report 30-day readmission to GIM at participating hospitals only, rather than all readmissions. However, prior research in our region demonstrated that 82% of hospital readmissions occur to the same site.32 Thus, our measure, which includes admission to any participating hospital, likely captures more than 80% of all readmissions, and this was a secondary outcome in our analysis. Finally, qualitative metrics, such as patient or provider satisfaction, were not measured in our study. Earlier discharge may impact patient care in other ways by being more predictable for staff, improving bed allocation for daytime procedures, making medication pick-ups easier to arrange, or making consultations with allied health services more convenient.11,28,33 Conversely, if pressured to discharge before noon, providers may feel rushed to complete tasks and may face disruptions to typical workflow.24 As such, future research is needed to provide a more complete understanding of the impact of early-morning discharge beyond hospital flow.
CONCLUSION
The number of morning discharges was not significantly associated with shorter ED LOS or hospital LOS for GIM patients. Our observational findings suggest that increasing morning discharges alone may not substantially improve patient flow in GIM. Further research is needed to evaluate specific morning discharge interventions and assess hospital-wide effects.
1. Trzeciak S, Rivers EP. Emergency department overcrowding in the United States: an emerging threat to patient safety and public health. Emerg Med J. 2003;20(5):402-405. https://doi.org/10.1136/emj.20.5.402
2. McKenna P, Heslin SM, Viccellio P, Mallon WK, Hernandez C, Morley EJ. Emergency department and hospital crowding: causes, consequences, and cures. Clin Exp Emerg Med. 2019;6(3):189-195. https://doi.org/10.15441/ceem.18.022
3. Bernstein SL, Aronsky D, Duseja R, et al. The effect of emergency department crowding on clinically oriented outcomes. Acad Emerg Med. 2009;16(1):1-10. https://doi.org/10.1111/j.1553-2712.2008.00295.x
4. Derlet RW, Richards JR. Overcrowding in the nation’s emergency departments: complex causes and disturbing effects. Ann Emerg Med. 2000;35(1):63-68. https://doi.org/10.1016/s0196-0644(00)70105-3
5. Pines JM, Iyer S, Disbot M, Hollander JE, Shofer FS, Datner EM. The effect of emergency department crowding on patient satisfaction for admitted patients. Acad Emerg Med. 2008;15(9):825-831. https://doi.org/10.1111/j.1553-2712.2008.00200.x
6. Carter EJ, Pouch SM, Larson EL. The relationship between emergency department crowding and patient outcomes: a systematic review. J Nurs Scholarsh. 2014;46(2):106-115. https://doi.org/10.1111/jnu.1205
7. Bueno H, Ross JS, Wang Y, et al. Trends in length of stay and short-term outcomes among Medicare patients hospitalized for heart failure, 1993-2006. JAMA. 2010;303(21):2141-2147. https://doi.org/10.1001/jama.2010.748
8. Rotter T, Kinsman L, James E, et al. Clinical pathways: effects on professional practice, patient outcomes, length of stay and hospital costs. Cochrane Database Syst Rev. 2010;(3):Cd006632. https://doi.org/ 10.1002/14651858.CD006632.pub2
9. Zodda D, Underwood J. Improving emergency department throughput: evidence-based strategies aimed at reducing boarding and overcrowding. Phys Leadership J. 2019;6(3):70-73.
10. Wertheimer B, Jacobs REA, Bailey M, et al. Discharge before noon: an achievable hospital goal. J Hosp Med. 2014;9(4):210-214. https://doi.org/10.1002/jhm.2154
11. Kane M, Weinacker A, Arthofer R, et al. A multidisciplinary initiative to increase inpatient discharges before noon. J Nurs Adm. 2016;46(12):630-635. https://doi.org/10.1097/NNA.0000000000000418
12. Rajkomar A, Valencia V, Novelero M, Mourad M, Auerbach A. The association between discharge before noon and length of stay in medical and surgical patients. J Hosp Med. 2016;11(12):859-861. https://doi.org/10.1002/jhm.2529
13. Patel H, Morduchowicz S, Mourad M. Using a systematic framework of interventions to improve early discharges. Jt Comm J Qual Patient Saf. 2017;43(4):189-196. https://doi.org/10.1016/j.jcjq.2016.12.003
14. El-Eid GR, Kaddoum R, Tamim H, Hitti EA. Improving hospital discharge time: a successful implementation of Six Sigma methodology. Medicine (Baltimore). 2015;94(12):e633. https://doi.org/10.1097/MD.0000000000000633
15. Mathews KS, Corso P, Bacon S, Jenq GY. Using the red/yellow/green discharge tool to improve the timeliness of hospital discharges. Jt Comm J Qual Patient Saf. 2014;40(6):243-252. https://doi.org/10.1016/s1553-7250(14)40033-3
16. Verma AA, Pasricha SV, Jung HY, et al. Assessing the quality of clinical and administrative data extracted from hospitals: the General Medicine Inpatient Initiative (GEMINI) experience. J Am Med Inform Assoc. 2021; 28(3):578-587. doi: 10.1093/jamia/ocaa225.
17. Quan H, Li B, Couris CM, et al. Updating and validating the Charlson comorbidity index and score for risk adjustment in hospital discharge abstracts using data from 6 countries. Am J Epidemiol. 2011;173(60:676-682. https://doi.org/10.1093/aje/kwq433
18. Escobar GJ, Greene JD, Scheirer P, Gardner MN, Draper D, Kipnis P. Risk-adjusting hospital inpatient mortality using automated inpatient, outpatient, and laboratory databases. Med Care. 2008;46(3):232-239. https://doi.org/10.1097/MLR.0b013e3181589bb6
19. Austin PC. Using the standardized difference to compare the prevalence of a binary variable between two groups in observational research. Commun Stat Simul Comput. 2009;38(60:1228-1234. https://doi.org/10.1080/03610910902859574
20. van Walraven C, Escobar GJ, Greene JD, Forster AJ. The Kaiser Permanente inpatient risk adjustment methodology was valid in an external patient population. J Clin Epidemiol. 2010;63(7):798-803. https://doi.org/10.1016/j.jclinepi.2009.08.020
21. Hilbe JM. Negative binomial regression. In: Modeling Count Data. Cambridge University Press. 2014:126-160.
22. Harrell FE Jr. Regression Modeling Strategies: With Applications to Linear Models, Logistic and Ordinal Regression, and Survival Analysis. 2nd ed. Springer; 2015.
23. Durvasula R, Kayihan A, Del Bene S, et al. A multidisciplinary care pathway significantly increases the number of early morning discharges in a large academic medical center. Qual Manag Health Care. 2015;24(1):45-51. https://doi.org/10.1097/QMH.0000000000000049
24. Goolsarran N, Olowo G, Ling Y, Abbasi S, Taub E, Teressa G. Outcomes of a resident-led early hospital discharge intervention. J Gen Intern Med. 2020;35(2):437-443. https://doi.org/10.1007/s11606-019-05563-w
25. Beck MJ, Okerblom D, Kumar A, Bandyopadhyay S, Scalzi LV. Lean intervention improves patient discharge times, improves emergency department throughput and reduces congestion. Hosp Pract (1995). 2016;44(5):252-259. https://doi.org/10.1080/21548331.2016.1254559
26. Karling A, Tang KW. Discharge before noon: a study in a medical emergency ward. 2015. Accessed February 11, 2021. http://publications.lib.chalmers.se/records/fulltext/231873/231873.pdf
27. Mathews K, Corso P, Bacon S, Jenq GY. Using the red/yellow/green discharge tool to improve the timeliness of hospital discharges. Jt Comm J Qual Patient Saf. 2014;40(6):243-252. https://doi.org/10.1016/s1553-7250(14)40033-3
28. Goodson AS, DeGuzman, PB, Honeycutt A, Summy C, Manly F. Total joint replacement discharge brunch: meeting patient education needs and a hospital initiative of discharge by noon. Orthop Nurs. 2014;33(3):159-162. https://doi.org/10.1097/NOR.0000000000000048
29. Kravet SJ, Levine RB, Rubin HR, Wright SM. Discharging patients earlier in the day: a concept worth evaluating. Health Care Manag (Frederick). 2007;26(2):142-146. https://doi.org/10.1097/01.HCM.0000268617.33491.60
30. Shine D. Discharge before noon: an urban legend. Am J Med. 2015;128(5):445-446. https://doi.org/10.1016/j.amjmed.2014.12.011
31. Minichiello TM, Auerbach AD, Wachter RM. Caregiver perceptions of the reasons for delayed hospital discharge. Eff Clin Pract. 2001;4(6):250-255.
32. Staples JA, Thiruchelvam D, Redelmeier DA. Site of hospital readmission and mortality: a population-based retrospective cohort study. CMAJ Open. 2014;2:E77-E85. https://doi.org/10.9778/cmajo.20130053
33. Bowles KH, Foust JB, Naylor MD. Hospital discharge referral decision making: a multidisciplinary perspective. Appl Nurs Res. 2003;16(3):134-143. https://doi.org/10.1016/s0897-1897(03)00048-x
There is substantial interest in improving patient flow and reducing hospital length of stay (LOS).1-4 Impaired hospital flow may negatively impact both patient satisfaction and safety through, for example, emergency department (ED) overcrowding.5,6 Impaired hospital flow is associated with downstream effects on patient care, hospital costs, and availability of beds.7-9
A number of quality-improvement interventions aim to improve patient flow, including efforts to increase the number of discharges that occur before noon.10,11 Morning discharges have been hypothesized to free hospital beds earlier, thus reducing ED wait times for incoming patients and increasing beds for elective surgeries.11 Morning discharges may also be more predictable for staff and patients. However, it is unclear whether efforts to increase the number of morning discharges have a negative impact on inpatient LOS by incentivizing physicians to keep patients in the hospital for an extra night to facilitate discharge in the early morning rather than the late afternoon. Morning discharges have been associated with both increased12 and decreased LOS.10,11,13-15
The purpose of this study was to examine the associations between morning discharges and ED LOS and hospital LOS in general internal medicine (GIM) at seven hospitals. GIM patients represent nearly 40% of ED admissions to a hospital,16 and thus are an important determinant of patient flow through the ED and hospital. We hypothesized that patients who were admitted to GIM on days with more morning discharges would have shorter ED LOS and hospital LOS.
METHODS
Design, Setting, and Participants
This was a retrospective cohort study conducted using the General Medicine Inpatient Initiative (GEMINI) clinical dataset.16 The dataset includes all GIM admissions at seven large hospital sites in Toronto and Mississauga, Ontario, Canada. These include five academic hospitals and two community-based teaching hospitals. Each hospital is publicly funded and provides tertiary and/or quaternary care to diverse multiethnic populations. Research ethics board approval was obtained from all participating sites.
GIM care is delivered by several interdisciplinary clinical teams functioning in parallel. Attending physicians are predominantly internists who practice as hospitalists in discrete service blocks, typically lasting 2 weeks at a time. Although GIM patients are preferentially admitted to GIM wards, participating hospitals did not have strict policies regarding cohorting GIM patients to specific wards (ie, holding patients in ED until a specific bed becomes available) that would confound the association between morning discharge and ED wait times. Approximately 75% of GIM patients are cared for on dedicated GIM wards at participating hospitals, with the remainder cared for on other medical or surgical wards.
We included all hospitalized patients who were admitted to hospital and discharged from GIM between April 1, 2010, and October 31, 2017, from the seven GEMINI hospitals. We included only patients admitted through the ED. As such, we did not include elective admissions or interfacility transfers who would not experience ED wait times. We excluded patients who were discharged without a provincial health insurance number (N = 2,169; 1.1% of total sample) because they could not be linked across visits to measure readmissions.
Data Source
The GEMINI dataset has been rigorously validated and previously described in detail.16 GEMINI collects both administrative health data reported to the Canadian Institute for Health Information (including data about patient demographics, comorbidities, and discharge destination) as well as electronic clinical data extracted from hospital computer systems (including attending physicians, in-hospital patient room transfers, and laboratory test results). Data are collected for each individual hospital encounter, and the provincial health insurance number is used to link patients across encounters.
Exposures and Outcomes
The two primary outcomes were ED LOS and hospital LOS. ED LOS was calculated as the difference between the time from triage by nursing staff to a patient’s exit from the ED, measured in hours. We also examined 30-day readmission to GIM at any participating hospital as a balancing measure against premature discharges and inpatient mortality because it could modify hospital LOS.
Patient Characteristics
Baseline patient characteristics were measured, including age, sex, Charlson Comorbidity Index score,17 day of admission (categorized as weekend/holiday or weekday), time of admission to hospital (
Statistical Analysis
The study population and physician characteristics were summarized with descriptive statistics. The balance of baseline patient characteristics across morning discharge quartiles was assessed using standardized differences. A standardized difference of less than 0.1 reflects good balance.20
Unadjusted estimates of patient outcomes were reported across morning discharge quartiles. To model the overall association between morning discharge and outcomes, the number of morning GIM discharges on the day of admission was subtracted from the mean number of morning discharges at each hospital and considered as a continuous exposure. We used generalized linear mixed models to estimate the effect of morning discharges on patient outcomes. We fit negative binomial regression models with log link to examine the association between the number of morning discharges (centered by subtracting the hospital mean) and the two main outcomes, ED LOS and hospital LOS. Given the overdispersion of the study population due to the unequal mean and variance, a negative binomial model was preferred over a Poisson regression, as the mean and variance were not equal.21 For our secondary outcomes of binary measures (30-day readmission and morality), we fit logistic regression models. Adjustment for multiple comparisons was not performed.
Multivariable analysis was conducted to adjust for the baseline characteristics described above as well as the total number of GIM discharges on the day of admission and GIM census on the day of admission. Hospital and study month (to account for secular time trends) were included as fixed effects, and patients and admitting physicians were included as crossed random effects to account for the nested structure of admissions within patients and admissions within physicians within hospitals.
A sensitivity analysis was performed to assess for nonlinear associations between morning discharges and the four outcomes (hospital LOS, ED LOS, in-hospital mortality, and readmission) by inputting the term as a restricted cubic spline, with up to five knots
RESULTS
Study Population and Patient Characteristics
The study population consisted of 189,781 hospitalizations involving 115,630 unique patients. The median patient age was 73 years (interquartile range [IQR], 57-84), 50.3% were female, 43.8% had a high Charlson Comorbidity Index score, and 11.1% were admitted to GIM in the prior 30 days (Table 1). The median ED LOS was 14.5 hours (IQR, 10.0-23.1), and the mean was 18.1 hours (SD, 12.2). The median hospital LOS was 4.6 days (IQR, 2.4-9.0), and the mean was 8.6 days (SD, 18.7).
In total, 36,043 (19.0%) discharges occurred between 8:00
Outcomes
Unadjusted clinical outcomes by number of morning discharges are presented in Table 2. The median unadjusted ED LOS was 14.4 (SD, 14.1), 14.3 (SD, 13.2), 14.5 (SD, 13.0), and 14.8 (SD, 13.0) hours for the first to fourth quartiles (fewest to largest number of morning discharges), respectively. The median unadjusted hospital LOS was 4.6 (SD, 6.5), 4.6 (SD, 6.9), 4.7 (SD, 6.4), and 4.6 (SD, 6.4) days for the first to fourth quartiles, respectively.
Unadjusted inpatient mortality was 6.1%, 5.5%, 5.5%, and 5.2% across the first to fourth quartiles, respectively. Unadjusted 30-day readmission to GIM was 12.2%, 12.6%, 12.6%, and 12.5% across the first to fourth quartiles, respectively.
After multivariable adjustment, there was no significant association between morning discharge and hospital LOS (aRR, 1.000; 95% CI, 0.996-1.000; P = .997), ED LOS (aRR, 0.999; 95% CI, 0.997-1.000; P = .307), in-hospital mortality (aRR, 0.967; 95% CI, 0.920-1.020; P =.183), or 30-day readmission (aRR, 1.010; 95% CI, 0.991-1.020; P = .471) (Table 3, Appendix Table 2, Appendix Table 3, Appendix Table 4, Appendix Table 5). When examining each hospital separately, we found that morning discharge was significantly associated with hospital LOS at only one hospital (Hospital D; aRR, 0.981; 95% CI, 0.966-0.996; P = .013). Morning discharge was statistically significantly associated with ED LOS at three hospitals (A, B, and C), but the aRR was at least 0.99 in all three cases (Table 4).
In sensitivity analyses, we found no improvements in model fit when adding spline terms to the model, suggesting no significant nonlinear associations between morning discharges and the outcomes of interest.
DISCUSSION
This large multicenter cohort study found no significant overall association between the number of morning discharges and ED or hospital LOS in GIM. At one hospital, there was a 1.9% reduction in adjusted ED LOS for every additional morning discharge, but no difference in hospital LOS. We also did not observe differences in readmission or inpatient mortality associated with the number of morning discharges. Our observational findings suggest that there is unlikely to be a strong association between morning discharge and patient throughput in GIM. Given that there may be other downstream benefits of morning discharge, such as freeing beds for daytime surgeries,23 further research is needed to determine the effectiveness of specific interventions.
Several studies have posited morning discharge as a method of improving both patient care and hospital flow metrics.10,11,13-15,23 Quality improvement initiatives targeting morning discharges have included stakeholder meetings, incentives programs, discharge-centered breakfast programs, and creating deadlines for discharge orders.24-29 Although these initiatives have gained support, critics have suggested that their supporting evidence is not robust. Werthemier et al10 found a 9.0% reduction of observed to expected LOS associated with increasing the number of early discharges. However, a response article suggested that their findings were confounded by other hospital initiatives, such as allocation of medical and social services to weekends.30 Other observational studies have concluded that hospital LOS is not affected by the number of morning discharges, but this research has been limited by single-center analysis and relatively smaller sample sizes.12 Our study further calls into question the association between morning discharge and patient throughput.
An additional reason for the controversy is that physicians may actively work to discharge patients late in the day to avoid an additional night in hospital. A qualitative study by Minichiello et al31 evaluated staff perceptions regarding afternoon discharges. Physicians and medical students believed that afternoon discharges were a result of waiting for test results and procedures, with staff aiming to discharge patients immediately after obtaining results or finishing necessary procedures. As such, there are concerns that incentivizing morning discharge may lead physicians in the opposite direction, to consciously or unconsciously keep patients overnight in order to facilitate an early morning discharge.30
Our study’s greatest strength was the large sample size over 7 years at seven hospitals in two cities, including both academic and community hospitals with different models of care. To our knowledge, this is the first cohort study that has analyzed the association between early discharge and LOS using multiple centers. To avoid the confounding and reverse causality that may exist when examining the relationship between LOS and morning discharge at the patient level (eg, patients who stay in hospital longer may have more “planned” discharges and leave in the morning), we examined the association based on variation across different days within the GIM service of each hospital. Further, we included robust risk adjustment using clinical and laboratory data. Finally, since our study included a diverse patient population served by participating centers in a system with universal insurance for hospital care, our findings are likely generalizable to other urban and suburban hospitals.
There are several important limitations of our analysis. First, we could only include GIM patients, who represent nearly 40% of ED admissions to hospital at participating centers. A more holistic analysis across all hospital services could be justified; however, given that many quality improvement initiatives occur at the level of a single hospital service, we felt our approach would be informative for future research and improvement efforts. Approximately 75% of GIM patients at participating hospitals were cared for on a GIM ward, with 25% cared for on off-service units. We were unable to include the total hospital census in our models, and this could affect LOS and waiting times for GIM patients, particularly those admitted to off-service units. GIM census is likely highly correlated with hospital census, and we were able to adjust for this. Nevertheless, this remains an important potential source of unmeasured confounding. Second, we did not model the effects of morning discharges from GIM on patient-flow measures for non-GIM patients. Given the lack of effects for GIM patients, who would be more likely to be directly affected, it is unlikely that large effects would be seen for other hospital patients, but we did not measure effects on surgical delays or cancellations, for example.23 Third, we report 30-day readmission to GIM at participating hospitals only, rather than all readmissions. However, prior research in our region demonstrated that 82% of hospital readmissions occur to the same site.32 Thus, our measure, which includes admission to any participating hospital, likely captures more than 80% of all readmissions, and this was a secondary outcome in our analysis. Finally, qualitative metrics, such as patient or provider satisfaction, were not measured in our study. Earlier discharge may impact patient care in other ways by being more predictable for staff, improving bed allocation for daytime procedures, making medication pick-ups easier to arrange, or making consultations with allied health services more convenient.11,28,33 Conversely, if pressured to discharge before noon, providers may feel rushed to complete tasks and may face disruptions to typical workflow.24 As such, future research is needed to provide a more complete understanding of the impact of early-morning discharge beyond hospital flow.
CONCLUSION
The number of morning discharges was not significantly associated with shorter ED LOS or hospital LOS for GIM patients. Our observational findings suggest that increasing morning discharges alone may not substantially improve patient flow in GIM. Further research is needed to evaluate specific morning discharge interventions and assess hospital-wide effects.
There is substantial interest in improving patient flow and reducing hospital length of stay (LOS).1-4 Impaired hospital flow may negatively impact both patient satisfaction and safety through, for example, emergency department (ED) overcrowding.5,6 Impaired hospital flow is associated with downstream effects on patient care, hospital costs, and availability of beds.7-9
A number of quality-improvement interventions aim to improve patient flow, including efforts to increase the number of discharges that occur before noon.10,11 Morning discharges have been hypothesized to free hospital beds earlier, thus reducing ED wait times for incoming patients and increasing beds for elective surgeries.11 Morning discharges may also be more predictable for staff and patients. However, it is unclear whether efforts to increase the number of morning discharges have a negative impact on inpatient LOS by incentivizing physicians to keep patients in the hospital for an extra night to facilitate discharge in the early morning rather than the late afternoon. Morning discharges have been associated with both increased12 and decreased LOS.10,11,13-15
The purpose of this study was to examine the associations between morning discharges and ED LOS and hospital LOS in general internal medicine (GIM) at seven hospitals. GIM patients represent nearly 40% of ED admissions to a hospital,16 and thus are an important determinant of patient flow through the ED and hospital. We hypothesized that patients who were admitted to GIM on days with more morning discharges would have shorter ED LOS and hospital LOS.
METHODS
Design, Setting, and Participants
This was a retrospective cohort study conducted using the General Medicine Inpatient Initiative (GEMINI) clinical dataset.16 The dataset includes all GIM admissions at seven large hospital sites in Toronto and Mississauga, Ontario, Canada. These include five academic hospitals and two community-based teaching hospitals. Each hospital is publicly funded and provides tertiary and/or quaternary care to diverse multiethnic populations. Research ethics board approval was obtained from all participating sites.
GIM care is delivered by several interdisciplinary clinical teams functioning in parallel. Attending physicians are predominantly internists who practice as hospitalists in discrete service blocks, typically lasting 2 weeks at a time. Although GIM patients are preferentially admitted to GIM wards, participating hospitals did not have strict policies regarding cohorting GIM patients to specific wards (ie, holding patients in ED until a specific bed becomes available) that would confound the association between morning discharge and ED wait times. Approximately 75% of GIM patients are cared for on dedicated GIM wards at participating hospitals, with the remainder cared for on other medical or surgical wards.
We included all hospitalized patients who were admitted to hospital and discharged from GIM between April 1, 2010, and October 31, 2017, from the seven GEMINI hospitals. We included only patients admitted through the ED. As such, we did not include elective admissions or interfacility transfers who would not experience ED wait times. We excluded patients who were discharged without a provincial health insurance number (N = 2,169; 1.1% of total sample) because they could not be linked across visits to measure readmissions.
Data Source
The GEMINI dataset has been rigorously validated and previously described in detail.16 GEMINI collects both administrative health data reported to the Canadian Institute for Health Information (including data about patient demographics, comorbidities, and discharge destination) as well as electronic clinical data extracted from hospital computer systems (including attending physicians, in-hospital patient room transfers, and laboratory test results). Data are collected for each individual hospital encounter, and the provincial health insurance number is used to link patients across encounters.
Exposures and Outcomes
The two primary outcomes were ED LOS and hospital LOS. ED LOS was calculated as the difference between the time from triage by nursing staff to a patient’s exit from the ED, measured in hours. We also examined 30-day readmission to GIM at any participating hospital as a balancing measure against premature discharges and inpatient mortality because it could modify hospital LOS.
Patient Characteristics
Baseline patient characteristics were measured, including age, sex, Charlson Comorbidity Index score,17 day of admission (categorized as weekend/holiday or weekday), time of admission to hospital (
Statistical Analysis
The study population and physician characteristics were summarized with descriptive statistics. The balance of baseline patient characteristics across morning discharge quartiles was assessed using standardized differences. A standardized difference of less than 0.1 reflects good balance.20
Unadjusted estimates of patient outcomes were reported across morning discharge quartiles. To model the overall association between morning discharge and outcomes, the number of morning GIM discharges on the day of admission was subtracted from the mean number of morning discharges at each hospital and considered as a continuous exposure. We used generalized linear mixed models to estimate the effect of morning discharges on patient outcomes. We fit negative binomial regression models with log link to examine the association between the number of morning discharges (centered by subtracting the hospital mean) and the two main outcomes, ED LOS and hospital LOS. Given the overdispersion of the study population due to the unequal mean and variance, a negative binomial model was preferred over a Poisson regression, as the mean and variance were not equal.21 For our secondary outcomes of binary measures (30-day readmission and morality), we fit logistic regression models. Adjustment for multiple comparisons was not performed.
Multivariable analysis was conducted to adjust for the baseline characteristics described above as well as the total number of GIM discharges on the day of admission and GIM census on the day of admission. Hospital and study month (to account for secular time trends) were included as fixed effects, and patients and admitting physicians were included as crossed random effects to account for the nested structure of admissions within patients and admissions within physicians within hospitals.
A sensitivity analysis was performed to assess for nonlinear associations between morning discharges and the four outcomes (hospital LOS, ED LOS, in-hospital mortality, and readmission) by inputting the term as a restricted cubic spline, with up to five knots
RESULTS
Study Population and Patient Characteristics
The study population consisted of 189,781 hospitalizations involving 115,630 unique patients. The median patient age was 73 years (interquartile range [IQR], 57-84), 50.3% were female, 43.8% had a high Charlson Comorbidity Index score, and 11.1% were admitted to GIM in the prior 30 days (Table 1). The median ED LOS was 14.5 hours (IQR, 10.0-23.1), and the mean was 18.1 hours (SD, 12.2). The median hospital LOS was 4.6 days (IQR, 2.4-9.0), and the mean was 8.6 days (SD, 18.7).
In total, 36,043 (19.0%) discharges occurred between 8:00
Outcomes
Unadjusted clinical outcomes by number of morning discharges are presented in Table 2. The median unadjusted ED LOS was 14.4 (SD, 14.1), 14.3 (SD, 13.2), 14.5 (SD, 13.0), and 14.8 (SD, 13.0) hours for the first to fourth quartiles (fewest to largest number of morning discharges), respectively. The median unadjusted hospital LOS was 4.6 (SD, 6.5), 4.6 (SD, 6.9), 4.7 (SD, 6.4), and 4.6 (SD, 6.4) days for the first to fourth quartiles, respectively.
Unadjusted inpatient mortality was 6.1%, 5.5%, 5.5%, and 5.2% across the first to fourth quartiles, respectively. Unadjusted 30-day readmission to GIM was 12.2%, 12.6%, 12.6%, and 12.5% across the first to fourth quartiles, respectively.
After multivariable adjustment, there was no significant association between morning discharge and hospital LOS (aRR, 1.000; 95% CI, 0.996-1.000; P = .997), ED LOS (aRR, 0.999; 95% CI, 0.997-1.000; P = .307), in-hospital mortality (aRR, 0.967; 95% CI, 0.920-1.020; P =.183), or 30-day readmission (aRR, 1.010; 95% CI, 0.991-1.020; P = .471) (Table 3, Appendix Table 2, Appendix Table 3, Appendix Table 4, Appendix Table 5). When examining each hospital separately, we found that morning discharge was significantly associated with hospital LOS at only one hospital (Hospital D; aRR, 0.981; 95% CI, 0.966-0.996; P = .013). Morning discharge was statistically significantly associated with ED LOS at three hospitals (A, B, and C), but the aRR was at least 0.99 in all three cases (Table 4).
In sensitivity analyses, we found no improvements in model fit when adding spline terms to the model, suggesting no significant nonlinear associations between morning discharges and the outcomes of interest.
DISCUSSION
This large multicenter cohort study found no significant overall association between the number of morning discharges and ED or hospital LOS in GIM. At one hospital, there was a 1.9% reduction in adjusted ED LOS for every additional morning discharge, but no difference in hospital LOS. We also did not observe differences in readmission or inpatient mortality associated with the number of morning discharges. Our observational findings suggest that there is unlikely to be a strong association between morning discharge and patient throughput in GIM. Given that there may be other downstream benefits of morning discharge, such as freeing beds for daytime surgeries,23 further research is needed to determine the effectiveness of specific interventions.
Several studies have posited morning discharge as a method of improving both patient care and hospital flow metrics.10,11,13-15,23 Quality improvement initiatives targeting morning discharges have included stakeholder meetings, incentives programs, discharge-centered breakfast programs, and creating deadlines for discharge orders.24-29 Although these initiatives have gained support, critics have suggested that their supporting evidence is not robust. Werthemier et al10 found a 9.0% reduction of observed to expected LOS associated with increasing the number of early discharges. However, a response article suggested that their findings were confounded by other hospital initiatives, such as allocation of medical and social services to weekends.30 Other observational studies have concluded that hospital LOS is not affected by the number of morning discharges, but this research has been limited by single-center analysis and relatively smaller sample sizes.12 Our study further calls into question the association between morning discharge and patient throughput.
An additional reason for the controversy is that physicians may actively work to discharge patients late in the day to avoid an additional night in hospital. A qualitative study by Minichiello et al31 evaluated staff perceptions regarding afternoon discharges. Physicians and medical students believed that afternoon discharges were a result of waiting for test results and procedures, with staff aiming to discharge patients immediately after obtaining results or finishing necessary procedures. As such, there are concerns that incentivizing morning discharge may lead physicians in the opposite direction, to consciously or unconsciously keep patients overnight in order to facilitate an early morning discharge.30
Our study’s greatest strength was the large sample size over 7 years at seven hospitals in two cities, including both academic and community hospitals with different models of care. To our knowledge, this is the first cohort study that has analyzed the association between early discharge and LOS using multiple centers. To avoid the confounding and reverse causality that may exist when examining the relationship between LOS and morning discharge at the patient level (eg, patients who stay in hospital longer may have more “planned” discharges and leave in the morning), we examined the association based on variation across different days within the GIM service of each hospital. Further, we included robust risk adjustment using clinical and laboratory data. Finally, since our study included a diverse patient population served by participating centers in a system with universal insurance for hospital care, our findings are likely generalizable to other urban and suburban hospitals.
There are several important limitations of our analysis. First, we could only include GIM patients, who represent nearly 40% of ED admissions to hospital at participating centers. A more holistic analysis across all hospital services could be justified; however, given that many quality improvement initiatives occur at the level of a single hospital service, we felt our approach would be informative for future research and improvement efforts. Approximately 75% of GIM patients at participating hospitals were cared for on a GIM ward, with 25% cared for on off-service units. We were unable to include the total hospital census in our models, and this could affect LOS and waiting times for GIM patients, particularly those admitted to off-service units. GIM census is likely highly correlated with hospital census, and we were able to adjust for this. Nevertheless, this remains an important potential source of unmeasured confounding. Second, we did not model the effects of morning discharges from GIM on patient-flow measures for non-GIM patients. Given the lack of effects for GIM patients, who would be more likely to be directly affected, it is unlikely that large effects would be seen for other hospital patients, but we did not measure effects on surgical delays or cancellations, for example.23 Third, we report 30-day readmission to GIM at participating hospitals only, rather than all readmissions. However, prior research in our region demonstrated that 82% of hospital readmissions occur to the same site.32 Thus, our measure, which includes admission to any participating hospital, likely captures more than 80% of all readmissions, and this was a secondary outcome in our analysis. Finally, qualitative metrics, such as patient or provider satisfaction, were not measured in our study. Earlier discharge may impact patient care in other ways by being more predictable for staff, improving bed allocation for daytime procedures, making medication pick-ups easier to arrange, or making consultations with allied health services more convenient.11,28,33 Conversely, if pressured to discharge before noon, providers may feel rushed to complete tasks and may face disruptions to typical workflow.24 As such, future research is needed to provide a more complete understanding of the impact of early-morning discharge beyond hospital flow.
CONCLUSION
The number of morning discharges was not significantly associated with shorter ED LOS or hospital LOS for GIM patients. Our observational findings suggest that increasing morning discharges alone may not substantially improve patient flow in GIM. Further research is needed to evaluate specific morning discharge interventions and assess hospital-wide effects.
1. Trzeciak S, Rivers EP. Emergency department overcrowding in the United States: an emerging threat to patient safety and public health. Emerg Med J. 2003;20(5):402-405. https://doi.org/10.1136/emj.20.5.402
2. McKenna P, Heslin SM, Viccellio P, Mallon WK, Hernandez C, Morley EJ. Emergency department and hospital crowding: causes, consequences, and cures. Clin Exp Emerg Med. 2019;6(3):189-195. https://doi.org/10.15441/ceem.18.022
3. Bernstein SL, Aronsky D, Duseja R, et al. The effect of emergency department crowding on clinically oriented outcomes. Acad Emerg Med. 2009;16(1):1-10. https://doi.org/10.1111/j.1553-2712.2008.00295.x
4. Derlet RW, Richards JR. Overcrowding in the nation’s emergency departments: complex causes and disturbing effects. Ann Emerg Med. 2000;35(1):63-68. https://doi.org/10.1016/s0196-0644(00)70105-3
5. Pines JM, Iyer S, Disbot M, Hollander JE, Shofer FS, Datner EM. The effect of emergency department crowding on patient satisfaction for admitted patients. Acad Emerg Med. 2008;15(9):825-831. https://doi.org/10.1111/j.1553-2712.2008.00200.x
6. Carter EJ, Pouch SM, Larson EL. The relationship between emergency department crowding and patient outcomes: a systematic review. J Nurs Scholarsh. 2014;46(2):106-115. https://doi.org/10.1111/jnu.1205
7. Bueno H, Ross JS, Wang Y, et al. Trends in length of stay and short-term outcomes among Medicare patients hospitalized for heart failure, 1993-2006. JAMA. 2010;303(21):2141-2147. https://doi.org/10.1001/jama.2010.748
8. Rotter T, Kinsman L, James E, et al. Clinical pathways: effects on professional practice, patient outcomes, length of stay and hospital costs. Cochrane Database Syst Rev. 2010;(3):Cd006632. https://doi.org/ 10.1002/14651858.CD006632.pub2
9. Zodda D, Underwood J. Improving emergency department throughput: evidence-based strategies aimed at reducing boarding and overcrowding. Phys Leadership J. 2019;6(3):70-73.
10. Wertheimer B, Jacobs REA, Bailey M, et al. Discharge before noon: an achievable hospital goal. J Hosp Med. 2014;9(4):210-214. https://doi.org/10.1002/jhm.2154
11. Kane M, Weinacker A, Arthofer R, et al. A multidisciplinary initiative to increase inpatient discharges before noon. J Nurs Adm. 2016;46(12):630-635. https://doi.org/10.1097/NNA.0000000000000418
12. Rajkomar A, Valencia V, Novelero M, Mourad M, Auerbach A. The association between discharge before noon and length of stay in medical and surgical patients. J Hosp Med. 2016;11(12):859-861. https://doi.org/10.1002/jhm.2529
13. Patel H, Morduchowicz S, Mourad M. Using a systematic framework of interventions to improve early discharges. Jt Comm J Qual Patient Saf. 2017;43(4):189-196. https://doi.org/10.1016/j.jcjq.2016.12.003
14. El-Eid GR, Kaddoum R, Tamim H, Hitti EA. Improving hospital discharge time: a successful implementation of Six Sigma methodology. Medicine (Baltimore). 2015;94(12):e633. https://doi.org/10.1097/MD.0000000000000633
15. Mathews KS, Corso P, Bacon S, Jenq GY. Using the red/yellow/green discharge tool to improve the timeliness of hospital discharges. Jt Comm J Qual Patient Saf. 2014;40(6):243-252. https://doi.org/10.1016/s1553-7250(14)40033-3
16. Verma AA, Pasricha SV, Jung HY, et al. Assessing the quality of clinical and administrative data extracted from hospitals: the General Medicine Inpatient Initiative (GEMINI) experience. J Am Med Inform Assoc. 2021; 28(3):578-587. doi: 10.1093/jamia/ocaa225.
17. Quan H, Li B, Couris CM, et al. Updating and validating the Charlson comorbidity index and score for risk adjustment in hospital discharge abstracts using data from 6 countries. Am J Epidemiol. 2011;173(60:676-682. https://doi.org/10.1093/aje/kwq433
18. Escobar GJ, Greene JD, Scheirer P, Gardner MN, Draper D, Kipnis P. Risk-adjusting hospital inpatient mortality using automated inpatient, outpatient, and laboratory databases. Med Care. 2008;46(3):232-239. https://doi.org/10.1097/MLR.0b013e3181589bb6
19. Austin PC. Using the standardized difference to compare the prevalence of a binary variable between two groups in observational research. Commun Stat Simul Comput. 2009;38(60:1228-1234. https://doi.org/10.1080/03610910902859574
20. van Walraven C, Escobar GJ, Greene JD, Forster AJ. The Kaiser Permanente inpatient risk adjustment methodology was valid in an external patient population. J Clin Epidemiol. 2010;63(7):798-803. https://doi.org/10.1016/j.jclinepi.2009.08.020
21. Hilbe JM. Negative binomial regression. In: Modeling Count Data. Cambridge University Press. 2014:126-160.
22. Harrell FE Jr. Regression Modeling Strategies: With Applications to Linear Models, Logistic and Ordinal Regression, and Survival Analysis. 2nd ed. Springer; 2015.
23. Durvasula R, Kayihan A, Del Bene S, et al. A multidisciplinary care pathway significantly increases the number of early morning discharges in a large academic medical center. Qual Manag Health Care. 2015;24(1):45-51. https://doi.org/10.1097/QMH.0000000000000049
24. Goolsarran N, Olowo G, Ling Y, Abbasi S, Taub E, Teressa G. Outcomes of a resident-led early hospital discharge intervention. J Gen Intern Med. 2020;35(2):437-443. https://doi.org/10.1007/s11606-019-05563-w
25. Beck MJ, Okerblom D, Kumar A, Bandyopadhyay S, Scalzi LV. Lean intervention improves patient discharge times, improves emergency department throughput and reduces congestion. Hosp Pract (1995). 2016;44(5):252-259. https://doi.org/10.1080/21548331.2016.1254559
26. Karling A, Tang KW. Discharge before noon: a study in a medical emergency ward. 2015. Accessed February 11, 2021. http://publications.lib.chalmers.se/records/fulltext/231873/231873.pdf
27. Mathews K, Corso P, Bacon S, Jenq GY. Using the red/yellow/green discharge tool to improve the timeliness of hospital discharges. Jt Comm J Qual Patient Saf. 2014;40(6):243-252. https://doi.org/10.1016/s1553-7250(14)40033-3
28. Goodson AS, DeGuzman, PB, Honeycutt A, Summy C, Manly F. Total joint replacement discharge brunch: meeting patient education needs and a hospital initiative of discharge by noon. Orthop Nurs. 2014;33(3):159-162. https://doi.org/10.1097/NOR.0000000000000048
29. Kravet SJ, Levine RB, Rubin HR, Wright SM. Discharging patients earlier in the day: a concept worth evaluating. Health Care Manag (Frederick). 2007;26(2):142-146. https://doi.org/10.1097/01.HCM.0000268617.33491.60
30. Shine D. Discharge before noon: an urban legend. Am J Med. 2015;128(5):445-446. https://doi.org/10.1016/j.amjmed.2014.12.011
31. Minichiello TM, Auerbach AD, Wachter RM. Caregiver perceptions of the reasons for delayed hospital discharge. Eff Clin Pract. 2001;4(6):250-255.
32. Staples JA, Thiruchelvam D, Redelmeier DA. Site of hospital readmission and mortality: a population-based retrospective cohort study. CMAJ Open. 2014;2:E77-E85. https://doi.org/10.9778/cmajo.20130053
33. Bowles KH, Foust JB, Naylor MD. Hospital discharge referral decision making: a multidisciplinary perspective. Appl Nurs Res. 2003;16(3):134-143. https://doi.org/10.1016/s0897-1897(03)00048-x
1. Trzeciak S, Rivers EP. Emergency department overcrowding in the United States: an emerging threat to patient safety and public health. Emerg Med J. 2003;20(5):402-405. https://doi.org/10.1136/emj.20.5.402
2. McKenna P, Heslin SM, Viccellio P, Mallon WK, Hernandez C, Morley EJ. Emergency department and hospital crowding: causes, consequences, and cures. Clin Exp Emerg Med. 2019;6(3):189-195. https://doi.org/10.15441/ceem.18.022
3. Bernstein SL, Aronsky D, Duseja R, et al. The effect of emergency department crowding on clinically oriented outcomes. Acad Emerg Med. 2009;16(1):1-10. https://doi.org/10.1111/j.1553-2712.2008.00295.x
4. Derlet RW, Richards JR. Overcrowding in the nation’s emergency departments: complex causes and disturbing effects. Ann Emerg Med. 2000;35(1):63-68. https://doi.org/10.1016/s0196-0644(00)70105-3
5. Pines JM, Iyer S, Disbot M, Hollander JE, Shofer FS, Datner EM. The effect of emergency department crowding on patient satisfaction for admitted patients. Acad Emerg Med. 2008;15(9):825-831. https://doi.org/10.1111/j.1553-2712.2008.00200.x
6. Carter EJ, Pouch SM, Larson EL. The relationship between emergency department crowding and patient outcomes: a systematic review. J Nurs Scholarsh. 2014;46(2):106-115. https://doi.org/10.1111/jnu.1205
7. Bueno H, Ross JS, Wang Y, et al. Trends in length of stay and short-term outcomes among Medicare patients hospitalized for heart failure, 1993-2006. JAMA. 2010;303(21):2141-2147. https://doi.org/10.1001/jama.2010.748
8. Rotter T, Kinsman L, James E, et al. Clinical pathways: effects on professional practice, patient outcomes, length of stay and hospital costs. Cochrane Database Syst Rev. 2010;(3):Cd006632. https://doi.org/ 10.1002/14651858.CD006632.pub2
9. Zodda D, Underwood J. Improving emergency department throughput: evidence-based strategies aimed at reducing boarding and overcrowding. Phys Leadership J. 2019;6(3):70-73.
10. Wertheimer B, Jacobs REA, Bailey M, et al. Discharge before noon: an achievable hospital goal. J Hosp Med. 2014;9(4):210-214. https://doi.org/10.1002/jhm.2154
11. Kane M, Weinacker A, Arthofer R, et al. A multidisciplinary initiative to increase inpatient discharges before noon. J Nurs Adm. 2016;46(12):630-635. https://doi.org/10.1097/NNA.0000000000000418
12. Rajkomar A, Valencia V, Novelero M, Mourad M, Auerbach A. The association between discharge before noon and length of stay in medical and surgical patients. J Hosp Med. 2016;11(12):859-861. https://doi.org/10.1002/jhm.2529
13. Patel H, Morduchowicz S, Mourad M. Using a systematic framework of interventions to improve early discharges. Jt Comm J Qual Patient Saf. 2017;43(4):189-196. https://doi.org/10.1016/j.jcjq.2016.12.003
14. El-Eid GR, Kaddoum R, Tamim H, Hitti EA. Improving hospital discharge time: a successful implementation of Six Sigma methodology. Medicine (Baltimore). 2015;94(12):e633. https://doi.org/10.1097/MD.0000000000000633
15. Mathews KS, Corso P, Bacon S, Jenq GY. Using the red/yellow/green discharge tool to improve the timeliness of hospital discharges. Jt Comm J Qual Patient Saf. 2014;40(6):243-252. https://doi.org/10.1016/s1553-7250(14)40033-3
16. Verma AA, Pasricha SV, Jung HY, et al. Assessing the quality of clinical and administrative data extracted from hospitals: the General Medicine Inpatient Initiative (GEMINI) experience. J Am Med Inform Assoc. 2021; 28(3):578-587. doi: 10.1093/jamia/ocaa225.
17. Quan H, Li B, Couris CM, et al. Updating and validating the Charlson comorbidity index and score for risk adjustment in hospital discharge abstracts using data from 6 countries. Am J Epidemiol. 2011;173(60:676-682. https://doi.org/10.1093/aje/kwq433
18. Escobar GJ, Greene JD, Scheirer P, Gardner MN, Draper D, Kipnis P. Risk-adjusting hospital inpatient mortality using automated inpatient, outpatient, and laboratory databases. Med Care. 2008;46(3):232-239. https://doi.org/10.1097/MLR.0b013e3181589bb6
19. Austin PC. Using the standardized difference to compare the prevalence of a binary variable between two groups in observational research. Commun Stat Simul Comput. 2009;38(60:1228-1234. https://doi.org/10.1080/03610910902859574
20. van Walraven C, Escobar GJ, Greene JD, Forster AJ. The Kaiser Permanente inpatient risk adjustment methodology was valid in an external patient population. J Clin Epidemiol. 2010;63(7):798-803. https://doi.org/10.1016/j.jclinepi.2009.08.020
21. Hilbe JM. Negative binomial regression. In: Modeling Count Data. Cambridge University Press. 2014:126-160.
22. Harrell FE Jr. Regression Modeling Strategies: With Applications to Linear Models, Logistic and Ordinal Regression, and Survival Analysis. 2nd ed. Springer; 2015.
23. Durvasula R, Kayihan A, Del Bene S, et al. A multidisciplinary care pathway significantly increases the number of early morning discharges in a large academic medical center. Qual Manag Health Care. 2015;24(1):45-51. https://doi.org/10.1097/QMH.0000000000000049
24. Goolsarran N, Olowo G, Ling Y, Abbasi S, Taub E, Teressa G. Outcomes of a resident-led early hospital discharge intervention. J Gen Intern Med. 2020;35(2):437-443. https://doi.org/10.1007/s11606-019-05563-w
25. Beck MJ, Okerblom D, Kumar A, Bandyopadhyay S, Scalzi LV. Lean intervention improves patient discharge times, improves emergency department throughput and reduces congestion. Hosp Pract (1995). 2016;44(5):252-259. https://doi.org/10.1080/21548331.2016.1254559
26. Karling A, Tang KW. Discharge before noon: a study in a medical emergency ward. 2015. Accessed February 11, 2021. http://publications.lib.chalmers.se/records/fulltext/231873/231873.pdf
27. Mathews K, Corso P, Bacon S, Jenq GY. Using the red/yellow/green discharge tool to improve the timeliness of hospital discharges. Jt Comm J Qual Patient Saf. 2014;40(6):243-252. https://doi.org/10.1016/s1553-7250(14)40033-3
28. Goodson AS, DeGuzman, PB, Honeycutt A, Summy C, Manly F. Total joint replacement discharge brunch: meeting patient education needs and a hospital initiative of discharge by noon. Orthop Nurs. 2014;33(3):159-162. https://doi.org/10.1097/NOR.0000000000000048
29. Kravet SJ, Levine RB, Rubin HR, Wright SM. Discharging patients earlier in the day: a concept worth evaluating. Health Care Manag (Frederick). 2007;26(2):142-146. https://doi.org/10.1097/01.HCM.0000268617.33491.60
30. Shine D. Discharge before noon: an urban legend. Am J Med. 2015;128(5):445-446. https://doi.org/10.1016/j.amjmed.2014.12.011
31. Minichiello TM, Auerbach AD, Wachter RM. Caregiver perceptions of the reasons for delayed hospital discharge. Eff Clin Pract. 2001;4(6):250-255.
32. Staples JA, Thiruchelvam D, Redelmeier DA. Site of hospital readmission and mortality: a population-based retrospective cohort study. CMAJ Open. 2014;2:E77-E85. https://doi.org/10.9778/cmajo.20130053
33. Bowles KH, Foust JB, Naylor MD. Hospital discharge referral decision making: a multidisciplinary perspective. Appl Nurs Res. 2003;16(3):134-143. https://doi.org/10.1016/s0897-1897(03)00048-x
© 2021 Society of Hospital Medicine
A Resident-Led Intervention to Increase Initiation of Buprenorphine Maintenance for Hospitalized Patients With Opioid Use Disorder
Nearly 48,000 Americans died from overdoses involving opioids in 2018, continuing a national crisis that has led to 446,000 deaths since 1999.1 Annually, opioids are responsible for more than 500,000 admissions, approximately 1% of all hospitalizations, costing the United States nearly $15 billion.2,3 Among hospitalized patients, chronic opioid use is associated with increased mortality, severe infectious complications, and higher rates of readmission.4 Opioid use disorder (OUD) is a chronic, relapsing medical condition with biopsychosocial origins and significant morbidity and mortality.5 Opioid agonist therapy (OAT) with buprenorphine or methadone maintenance, the evidence-based standard of treatment, reduces the mortality rate by half, decreases overdoses and hospital readmissions, and improves retention in care.6-10
OAT maintenance refers to using buprenorphine or methadone for long-term treatment of OUD rather than for acute treatment of opioid withdrawal. Despite evidence supporting OAT maintenance, clinicians start medications for only 11% to 15% of hospitalized patients with OUD, depending on practice contexts.11,12 Three significant barriers—stigma, insufficient clinician education, and restrictive regulations—prevent clinicians from starting OAT.13 Clinicians who do not have the Drug Enforcement Administration (DEA)–issued DATA-2000 waiver (X-waiver) for outpatient prescribing can order buprenorphine for admitted patients but cannot prescribe it at discharge.14 In hospitals where they exist, addiction medicine consult services offer primary teams guidance on pharmacotherapy, leading to reduced hospital readmissions and increased engagement in outpatient addiction treatment.15-17 However, in most hospitals around the country, such specialty services do not exist.18 In some hospitals without addiction medicine consult services, hospitalists with expertise in OUD have started assisting primary teams in starting OAT, but to our knowledge, no prior studies have described the impact of these interventions on patients or clinician experience with OAT.19
This quality improvement project aimed to increase the rate at which internal medicine resident teams at Johns Hopkins Hospital (JHH) in Baltimore, Maryland, started hospitalized patients with OUD on buprenorphine maintenance. We hypothesized that resident education and measures to increase the availability of X-waivered physicians would increase the rate of initiating buprenorphine maintenance. We additionally hypothesized that these interventions would increase knowledge about and comfort with buprenorphine across the residency. This represents the first study to examine the effects of clinician education and a team of X-waivered residents and hospitalists who assist in starting buprenorphine maintenance in a hospital without an addiction medicine consult service.
METHODS
Setting
This study took place from July 2018 to June 2019 at JHH, a large, academic, urban hospital in Baltimore. Prior to the intervention, internal medicine residents at JHH commonly used short courses of buprenorphine to treat withdrawal, but they did not have access to hospital-specific resources to assist with starting maintenance OAT. During the study period, JHH had a Substance Use Disorders team staffed by peer recovery specialists that could be consulted by hospitalists and residents to provide psychosocial support and link admitted patients to treatment after discharge. There were no providers on the team to guide pharmacotherapy or to write discharge buprenorphine prescriptions. The Osler Medical Residency Training Program at JHH has 140 internal medicine residents and 16 combined medicine-pediatrics residents. All residents receive 1 hour of formal education about opioid use disorder annually. In addition, 28 of those 156 residents, those in the Urban Health Primary Care track, spend 1 month on an Addiction Medicine rotation in which they complete the 8-hour training required to receive the X-waiver. Those residents are encouraged to apply for the X-waiver once they obtain a medical license subsidized by a Health Resources & Services Administration (HRSA) grant. Four internal medicine attending physicians on teaching services and one resident had X-waivers prior to the intervention.
Intervention
In November 2018, we administered a survey to residents to identify barriers to starting buprenorphine maintenance and to measure knowledge and confidence with using buprenorphine for OUD (Appendix Figure 1 and Figure 2). We focused on buprenorphine because providers at JHH were familiar with this medication and because Baltimore has widespread access to buprenorphine, with more than 490 local buprenorphine providers.20 Five residents piloted the survey and provided feedback. We then administered the survey to all internal medicine and medicine-pediatrics residents. Based on the results, we developed a targeted educational conference and also created the Buprenorphine Bridge Team (BBT).
In January 2019, we presented the educational conference for residents devoted to the use of buprenorphine for OUD and introduced the BBT. The conference started with a patient testimonial and included peer recovery specialists, pharmacists, nurses, and social workers. We summarized the evidence for buprenorphine and offered a practical guide to start treatment in a one-page protocol. This protocol included guidance on selecting patients, shared decision-making around OUD treatment, avoiding precipitated withdrawal, dosing buprenorphine, and establishing follow-up (Appendix Figure 3). We asked for input on this protocol from nursing leadership, social work teams, and peer recovery specialists. Dosing was adapted from the Guidelines from the American Society of Addiction Medicine, with expert input from physicians from the Addiction Medicine Consult service at Johns Hopkins Bayview Medical Center, also in Baltimore.5 We instructed residents to obtain discharge buprenorphine prescriptions from an X-waivered physician on their team or from the newly established BBT. We asked resident teams to set up a postdischarge appointment for patients with an X-waivered provider, either in a community practice or at the JHH After Care Clinic, a transitional care clinic for discharged patients.21
The BBT is a resident-led group of X-waivered JHH residents and hospitalists who volunteer to write discharge buprenorphine prescriptions for patients. The BBT serves to ensure primary teams have access to an X-waivered prescriber. It is not a consult service. We asked primary teams to contact the BBT after initiating buprenorphine and after securing a follow-up appointment. In response to each request, a member of the BBT reviews the patient chart, confirms the follow-up plan, writes a prescription for buprenorphine along with intranasal naloxone, and leaves a brief note. During the 6-month postintervention period, the team consisted of three residents and three hospitalist attendings. Each week, two members (residents or attendings) staffed the team Monday to Friday, 8
In May 2019, 5 months after the education session and implementation of the BBT, we administered a follow-up survey.
Outcomes
As a secondary outcome, we measured engagement in OUD treatment after discharge by calculating the proportion of patients started on buprenorphine who filled a buprenorphine prescription within 30 days after discharge. We chose 30 days based on the National Committee for Quality Assurance’s Healthcare Effectiveness Data and Information Set (HEDIS) measure for engagement of treatment for alcohol and other drugs.23 We obtained the data from the Chesapeake Regional Information System for our Patients (CRISP) Prescription Drug Monitoring Program, which monitors all prescriptions for controlled substances dispensed in Maryland and five neighboring states. As a balancing measure, we counted patients newly started on methadone maintenance for OUD before and after the intervention. Additional secondary process outcomes included frequency of BBT requests, the volume of buprenorphine prescriptions written by the team, and time required to complete a BBT request.
Clinician-level outcomes, measured with electronically administered pre- and postintervention surveys to residents, included knowledge about and comfort with buprenorphine. Of the 16 questions in the pre- and postimplementation surveys, we analyzed the 6 questions concerning knowledge and comfort that remained identical in the pre- and postintervention surveys and used 5-point Likert scale responses. As an incentive, we randomly distributed three $50 gift cards to survey completers.
Analysis
We used an interrupted time series analysis to evaluate the association between the intervention bundle and a change in the rate that medical teams started patients with OUD on buprenorphine maintenance. This approach allowed us to control for preintervention trends. To evaluate the impact of our interventions, our pre- and postintervention periods include the same residents during the 2018-2019 academic year. Both periods consisted of twelve 2-week intervals (preintervention: July 26, 2019, to January 9, 2019; postintervention: January 10, 2019, to June 26, 2019).
To evaluate for changes in engagement in OUD treatment after discharge, we used two-sample t tests. To evaluate for changes in resident-reported comfort and knowledge with initiating buprenorphine maintenance, we used Wilcoxon rank sum tests for survey data and Wilcoxon signed rank tests for paired data. All analyses employed two-sided P values with statistical significance evaluated at the .05 alpha level. We analyzed data using R version 3.6.3 (Foundation for Statistical Computing). The Institutional Review Board at JHH reviewed and approved the study protocol as a quality improvement project (IRB00193365).
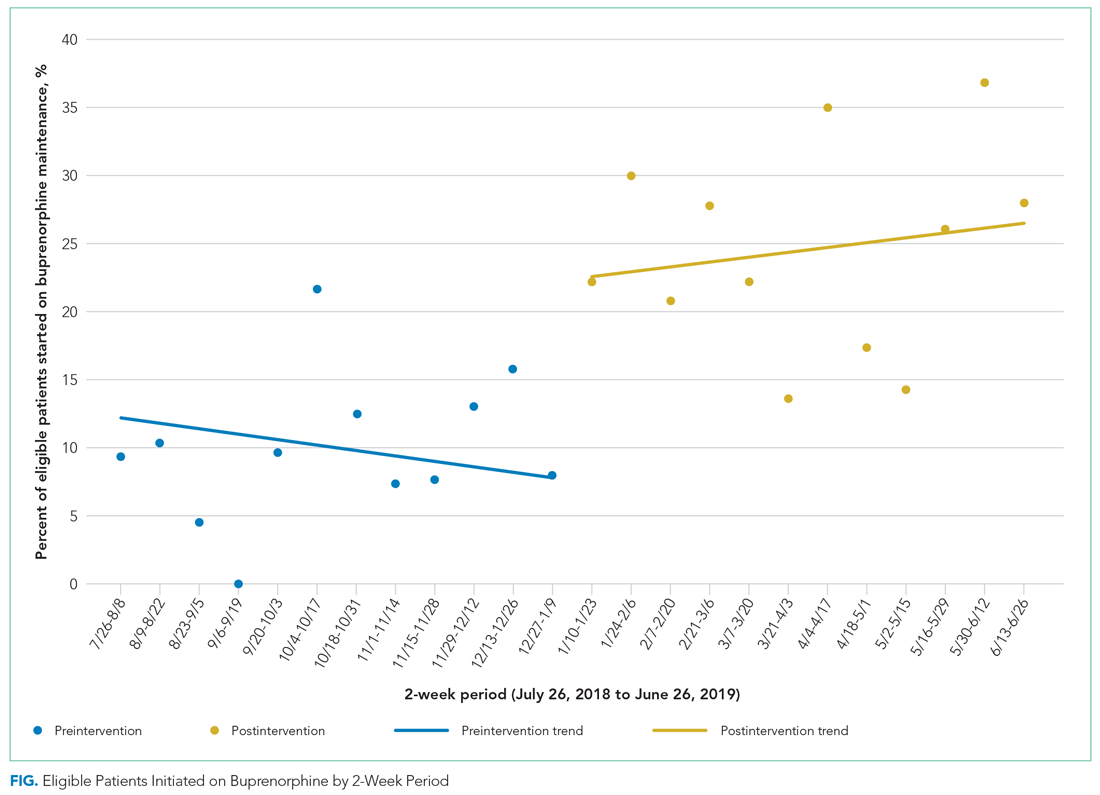
Before the intervention, 13 of the 30 patients (40%) newly started on buprenorphine maintenance during their admission filled a follow-up buprenorphine prescription within 30 days of discharge. After the intervention, 31 of 64 patients (46%) filled a buprenorphine prescription within 30 days (P = .612). Two patients were started on methadone maintenance, one prior to and one after the intervention.
During the 6-month postintervention period, the BBT received 75 requests and wrote 70 prescriptions for buprenorphine. The median time required to complete a BBT request was 15 minutes (minimum, 5 minutes; maximum, 60 minutes).
Of 156 internal medicine and medicine-pediatrics residents, 89 residents (57%) completed the baseline survey and 66 residents (42%) completed the follow-up survey. Forty residents completed both surveys. After the intervention, residents were significantly more likely to feel comfortable dosing buprenorphine (P < .0001) and counseling patients about its use (P = .0237) and were more likely to report ease of establishing follow-up (P < .0001). Self-reported knowledge about preventing precipitated withdrawal increased significantly (P = .0191), as did knowledge about the effectiveness of buprenorphine (P = .0003) independent of formal drug counseling (P = .0066) (Table). Paired survey data also found statistically significant results for all questions except those about preventing precipitated withdrawal and efficacy. For the latter, respondents who completed both surveys were more knowledgeable before the intervention than the overall group that completed the baseline survey (Appendix Table).
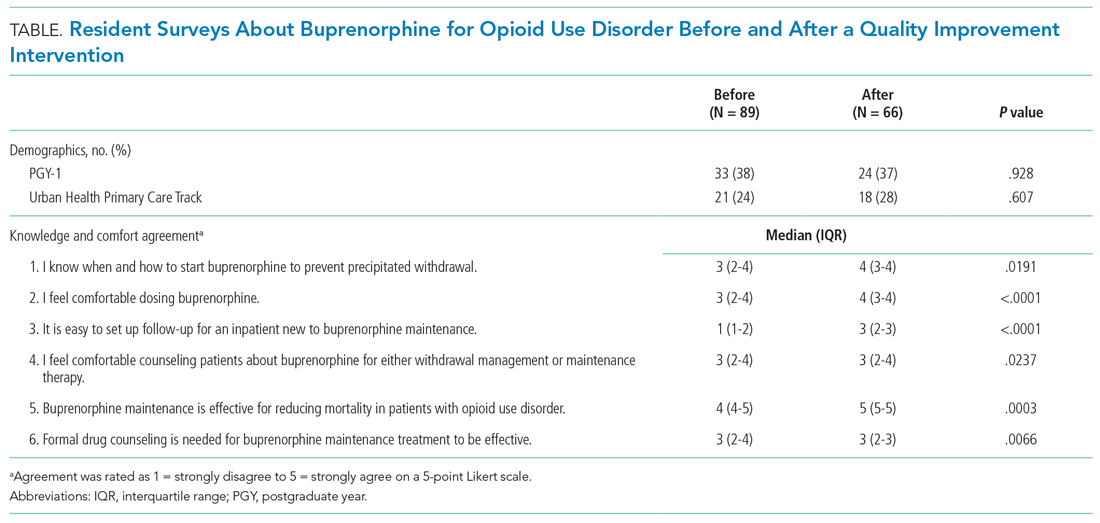
This study shows how a resident-led quality improvement project comprising clinician education and implementation of a novel BBT was associated with an increased rate of starting buprenorphine maintenance in hospitalized patients with OUD and improved resident knowledge about and comfort with buprenorphine. To our knowledge, this is the first study demonstrating how education and a team of X-waivered generalists can help primary teams initiate and discharge patients on buprenorphine maintenance in a hospital without an addiction medicine consult service.
Prior to the intervention, resident internal medicine teams at JHH started 10% of hospitalized patients with OUD on buprenorphine maintenance, consistent with prior studies showing rates of 11% to 15% for initiating OAT for hospitalized patients.11,12 After the intervention, the rate of initiating buprenorphine maintenance more than doubled, rising to 24% of eligible patients. Resident internal medicine teams at JHH started buprenorphine maintenance for 37 more patients over the 24-week postintervention period than would have been predicted prior to the intervention, or an additional three patients every 2 weeks.
Between 40% and 46% of hospitalized patients newly started on buprenorphine maintenance filled an outpatient buprenorphine prescription within 30 days of discharge. We are not aware of comparative data for 30-day follow-up for hospitalized patients newly started on buprenorphine maintenance. Data from other contexts show 5% to 10% of veterans were engaged in addiction treatment 30 days after initiation from inpatient or outpatient encounters. An analysis of an academic medical center in Oregon found engagement with an addiction medicine consult service increased after hospital engagement for patients with any substance use disorder from 23% to 39% using the 34-day HEDIS measure for engagement.17,24,25
The BBT required approximately 15 minutes per request and wrote an average of three prescriptions per week, demonstrating the feasibility of this approach and the high demand for this service. One strength of our approach is that residents gained experience starting buprenorphine independently using the aforementioned protocol instead of deferring to a full consult service. It is likely that this resident engagement in initiating longitudinal OUD care contributed to the success of this initiative, as did existing resident familiarity with using buprenorphine for opioid withdrawal.
This approach to resident education—promoting direct, first-person experience with medications in a clinical context—aligns with recommendations from a recent review about substance use disorder education for health professionals.26 Our interventions increased resident knowledge and comfort with buprenorphine, consistent with prior studies showing increased resident confidence in management of substance use disorders after curricular innovations.24,25
A few contextual features were essential for this project’s viability. Maryland allows American medical graduates to obtain a medical license after 1 year of postgraduate training. This allowed three residents to obtain X-waivers. These residents had access to HRSA funding to subsidize the expenses of applying for state licensure and DEA registration. BBT members volunteered their time while working on other services. Last, we were able to take advantage of buprenorphine-providing clinics in Baltimore, including the JHH After Care Clinic, to accept patients for follow-up appointments after discharge.
Limitations
The BBT required motivated clinicians willing to volunteer for additional clinical responsibilities during inpatient rotations and supportive faculty and residency leadership. Attending physicians, nurse practitioners, or physician assistants could staff a similar BBT in hospitals without residents or in hospitals where residents cannot obtain DEA registration. Crucially, other hospitals may not have access to practices with X-waivered physicians for outpatient follow-up. A recent study found X-waivered primary care physicians were less likely to be affiliated with hospital health systems. Other studies have shown limitations in access to buprenorphine at the county level based on geography and racial/ethnic segregation.27-29
Most patients hospitalized with OUD did not have ICD-10 codes associated with OUD. We addressed this by assuming patients had OUD if buprenorphine or methadone was ordered during their hospitalization, even if the medication was never administered. This may have overcounted patients prescribed these medications for indications other than OUD, and it may have undercounted patients with OUD for whom buprenorphine or methadone were never considered. The opioid withdrawal order set at JHH automatically offers an option to use buprenorphine to treat withdrawal. Patients with OUD for whom buprenorphine or methadone were never ordered likely did not experience withdrawal or were in withdrawal so mild that it escaped the attention of the team, which limits the generalizability of our intervention.
We identified several limitations to the internal validity of our study. First, we used a before-and-after study design without a control group. We could not ethically withhold access to evidence-based, mortality-reducing medications from patients. Without a control group, we cannot rule out the possibility that underlying temporal trends made residents more likely to start buprenorphine maintenance independent of our intervention. We attempted to control for unmeasured confounders by using an interrupted time series analysis to control for preintervention trends, comparing the same group of residents before and after our interventions, and selecting an intervention period during which residents were given only educational sessions and materials provided by our team. Our results may be biased by clustered data because certain residents may have been more likely to initiate buprenorphine, but these effects are likely marginal because resident schedules are balanced between outpatient and inpatient rotations during each 6-month period.
Finally, this project focused on buprenorphine, not on other medications for OUD, including methadone or naltrexone, or nonpharmacologic treatments for OUD.
Sustainability and Next Steps
Since the start of the BBT in January 2019, five additional PGY-2 residents obtained their medical licenses and X-waivers. These residents, with the support of two attending hospitalists, led the BBT and coordinated education sessions that were incorporated into the curriculum during the 2019-2020 academic year. These educational sessions will continue indefinitely. In 2020, JHH started an Addiction Medicine Consult Service staffed by physicians, NPs, and a pharmacist. The BBT continues to operate in conjunction with this service.
We found substantial variability in the rate of buprenorphine maintenance initiation despite our interventions. This is an area for future improvement. In a free-response prompt in our follow-up survey, residents requested additional education sessions and an order set to assist with initiation of buprenorphine. To address these gaps, three educational sessions were added, one of which included education on starting methadone maintenance therapy. We also added a new order set for starting buprenorphine maintenance. We hypothesize that these interventions will improve consistency.
In order for a similar program to be disseminated to other institutions, educational initiatives and a team of dedicated X-waivered prescribers are key. Materials to assist with this process are available in the Appendix.
CONCLUSION
This study shows how a resident-led intervention comprising clinician education and a team of X-waivered generalists was associated with improved treatment of OUD for hospitalized patients. We encourage residents and all clinicians at other hospitals without addiction medicine consult services to design, implement, and study similar interventions that directly increase the use of buprenorphine or methadone maintenance to treat OUD.
Preliminary results from this project were presented at the AMERSA National Conference on November 7, 2019.
1. Wilson N, Kariisa M, Seth P, Iv HS, Davis NL. Drug and opioid-involved overdose deaths – United States, 2017–2018. MMWR Morb Mortal Wkly Rep. 2020;69(11):290-297. http://dx.doi.org/10.15585/mmwr.mm6911a4
2. Berk J, Rogers KM, Wilson DJ, Thakrar A, Feldman L. Missed opportunities for treatment of opioid use disorder in the hospital setting: updating an outdated policy. J Hosp Med. 2020;15(10):619-621. https://doi.org/10.12788/jhm.3352
3. Ronan MV, Herzig SJ. Hospitalizations related to opioid abuse/dependence and associated serious infections increased sharply, 2002–12. Health Aff (Millwood). 2016;35(5):832-837. https://doi.org/10.1377/hlthaff.2015.1424
4. Mosher HJ, Jiang L, Vaughan Sarrazin MS, Cram P, Kaboli PJ, Vander Weg MW. Prevalence and characteristics of hospitalized adults on chronic opioid therapy. J Hosp Med. 2014;9(2):82-87. https://doi.org/10.1002/jhm.2113
5. Crotty K, Freedman KI, Kampman KM. Executive summary of the focused update of the ASAM national practice guideline for the treatment of opioid use disorder. J Addict Med. 2020;14(2):99-112. https://doi.org/10.1097/adm.0000000000000635
6. Leshner AI, Mancher M, eds. Medications for Opioid Use Disorder Save Lives. The National Academies Press; 2019. https://www.nap.edu/catalog/25310
7. Sordo L, Barrio G, Bravo MJ, et al. Mortality risk during and after opioid substitution treatment: systematic review and meta-analysis of cohort studies. BMJ. 2017;357: j1550. https://doi.org/10.1136/bmj.j1550
8. Larochelle MR, Bernson D, Land T, et al. Medication for opioid use disorder after nonfatal opioid overdose and association with mortality. Ann Intern Med. 2018;169(3):137-145. https://dx.doi.org/10.7326%2FM17-3107
9. Schuckit MA. Treatment of opioid-use disorders. N Engl J Med. 2016;375(4):357-368. https://doi.org/10.1056/nejmra1604339
10. Moreno JL, Wakeman SE, Duprey MS, Roberts RJ, Jacobson JS, Devlin JW. Predictors for 30-day and 90-day hospital readmission among patients with opioid use disorder. J Addict Med. 2019;13(4):306-313. https://doi.org/10.1097/adm.0000000000000499
11. Rosenthal ES, Karchmer AW, Theisen-Toupal J, Castillo RA, Rowley CF. Suboptimal addiction interventions for patients hospitalized with injection drug use-associated infective endocarditis. Am J Med. 2016;129(5):481-485. https://doi.org/10.1016/j.amjmed.2015.09.024
12. Priest KC, Lovejoy TI, Englander H, Shull S, McCarty D. Opioid agonist therapy during hospitalization within the Veterans Health Administration: a pragmatic retrospective cohort analysis. J Gen Intern Med. 2020;35(8):2365-2374. https://doi.org/10.1007/s11606-020-05815-0
13. Madras BK, Ahmad NJ, Wen J, Sharfstein J; Prevention, Treatment, and Recovery Working Group of the Action Collaborative on Countering the U.S. Opioid Epidemic. Improving access to evidence-based medical treatment for opioid use disorder: strategies to address key barriers within the treatment system. NAM Perspectives. April 27, 2020. https://doi.org/10.31478/202004b
14. Fiscella K, Wakeman SE, Beletsky L. Buprenorphine deregulation and mainstreaming treatment for opioid use disorder: x the X Waiver. JAMA Psychiatry. 2019;76(3):229-230. https://doi.org/10.1001/jamapsychiatry.2018.3685
15. Priest KC, McCarty D. Role of the hospital in the 21st century opioid overdose epidemic: the addiction medicine consult service. J Addict Med. 2019;13(2):104-112. https://doi.org/10.1097/adm.0000000000000496
16. Weimer M, Morford K, Donroe J. Treatment of opioid use disorder in the acute hospital setting: a critical review of the literature (2014–2019). Curr Addict Rep. 2019;6(4):339-354.
17. Englander H, Dobbertin K, Lind BK, et al. Inpatient addiction medicine consultation and post-hospital substance use disorder treatment engagement: a propensity-matched analysis. J Gen Intern Med. 2019;34(12):2796-2803. https://doi.org/10.1007/s11606-019-05251-9
18. Englander H, Priest KC, Snyder H, Martin M, Calcaterra S, Gregg J. A call to action: hospitalists’ role in addressing substance use disorder. J Hosp Med. 2019;14(3):E1-E4. https://doi.org/10.12788/jhm.3311
19. Bottner R, Moriates C, Tirado C. The role of hospitalists in treating opioid use disorder. J Addict Med. 2020;14(2):178. https://doi.org/10.1097/adm.0000000000000545
20. Behavioral health treatment services locator. Substance Abuse and Mental Health Services Administration. Accessed May 14, 2020. https://findtreatment.samhsa.gov/
21. Groesbeck K, Whiteman LN, Stewart RW. Reducing readmission rates by improving transitional care. South Med J. 2015;108(12):758-760. https://doi.org/10.14423/smj.0000000000000376
22. Heslin KC, Owens PL, Karaca Z, Barrett ML, Moore BJ, Elixhauser A. Trends in opioid-related inpatient stays shifted after the US transitioned to ICD-10-CM diagnosis coding in 2015 Med Care. 2017;55(11):918-923. https://doi.org/10.1097/mlr.0000000000000805
23. Initiation and engagement of alcohol and other drug abuse or dependence treatment (IET). NCQA. Accessed April 20, 2020. https://www.ncqa.org/hedis/measures/initiation-and-engagement-of-alcohol-and-other-drug-abuse-or-dependence-treatment/
24. Wyse JJ, Robbins JL, McGinnis KA, et al. Predictors of timely opioid agonist treatment initiation among veterans with and without HIV. Drug Alcohol Depend. 2019;198:70-75. https://doi.org/10.1016/j.drugalcdep.2019.01.038
25. Harris AHS, Humphreys K, Finney JW. Veterans Affairs facility performance on Washington Circle indicators and casemix-adjusted effectiveness. J Subst Abuse Treat. 2007;33(4):333-339. https://doi.org/10.1016/j.jsat.2006.12.015
26. Muzyk A, Smothers ZPW, Andolsek KM, et al. Interprofessional substance use disorder education in health professions education programs: a scoping review. Acad Med. 2020;95(3):470-480. https://doi.org/10.1097/acm.0000000000003053
27. Saloner B, Lin L, Simon K. Geographic location of buprenorphine-waivered physicians and integration with health systems. J Subst Abuse Treat. 2020;115:108034. https://doi.org/10.1016/j.jsat.2020.108034
28. Jones CW, Christman Z, Smith CM, et al. Comparison between buprenorphine provider availability and opioid deaths among US counties. J Subst Abuse Treat. 2018;93:19-25. https://doi.org/10.1016/j.jsat.2018.07.008
29. Goedel WC, Shapiro A, Cerdá M, Tsai JW, Hadland SE, Marshall BDL. Association of racial/ethnic segregation with treatment capacity for opioid use disorder in counties in the United States. JAMA Netw Open. 2020;3(4):e203711. https://doi.org/10.1001/jamanetworkopen.2020.3711
Nearly 48,000 Americans died from overdoses involving opioids in 2018, continuing a national crisis that has led to 446,000 deaths since 1999.1 Annually, opioids are responsible for more than 500,000 admissions, approximately 1% of all hospitalizations, costing the United States nearly $15 billion.2,3 Among hospitalized patients, chronic opioid use is associated with increased mortality, severe infectious complications, and higher rates of readmission.4 Opioid use disorder (OUD) is a chronic, relapsing medical condition with biopsychosocial origins and significant morbidity and mortality.5 Opioid agonist therapy (OAT) with buprenorphine or methadone maintenance, the evidence-based standard of treatment, reduces the mortality rate by half, decreases overdoses and hospital readmissions, and improves retention in care.6-10
OAT maintenance refers to using buprenorphine or methadone for long-term treatment of OUD rather than for acute treatment of opioid withdrawal. Despite evidence supporting OAT maintenance, clinicians start medications for only 11% to 15% of hospitalized patients with OUD, depending on practice contexts.11,12 Three significant barriers—stigma, insufficient clinician education, and restrictive regulations—prevent clinicians from starting OAT.13 Clinicians who do not have the Drug Enforcement Administration (DEA)–issued DATA-2000 waiver (X-waiver) for outpatient prescribing can order buprenorphine for admitted patients but cannot prescribe it at discharge.14 In hospitals where they exist, addiction medicine consult services offer primary teams guidance on pharmacotherapy, leading to reduced hospital readmissions and increased engagement in outpatient addiction treatment.15-17 However, in most hospitals around the country, such specialty services do not exist.18 In some hospitals without addiction medicine consult services, hospitalists with expertise in OUD have started assisting primary teams in starting OAT, but to our knowledge, no prior studies have described the impact of these interventions on patients or clinician experience with OAT.19
This quality improvement project aimed to increase the rate at which internal medicine resident teams at Johns Hopkins Hospital (JHH) in Baltimore, Maryland, started hospitalized patients with OUD on buprenorphine maintenance. We hypothesized that resident education and measures to increase the availability of X-waivered physicians would increase the rate of initiating buprenorphine maintenance. We additionally hypothesized that these interventions would increase knowledge about and comfort with buprenorphine across the residency. This represents the first study to examine the effects of clinician education and a team of X-waivered residents and hospitalists who assist in starting buprenorphine maintenance in a hospital without an addiction medicine consult service.
METHODS
Setting
This study took place from July 2018 to June 2019 at JHH, a large, academic, urban hospital in Baltimore. Prior to the intervention, internal medicine residents at JHH commonly used short courses of buprenorphine to treat withdrawal, but they did not have access to hospital-specific resources to assist with starting maintenance OAT. During the study period, JHH had a Substance Use Disorders team staffed by peer recovery specialists that could be consulted by hospitalists and residents to provide psychosocial support and link admitted patients to treatment after discharge. There were no providers on the team to guide pharmacotherapy or to write discharge buprenorphine prescriptions. The Osler Medical Residency Training Program at JHH has 140 internal medicine residents and 16 combined medicine-pediatrics residents. All residents receive 1 hour of formal education about opioid use disorder annually. In addition, 28 of those 156 residents, those in the Urban Health Primary Care track, spend 1 month on an Addiction Medicine rotation in which they complete the 8-hour training required to receive the X-waiver. Those residents are encouraged to apply for the X-waiver once they obtain a medical license subsidized by a Health Resources & Services Administration (HRSA) grant. Four internal medicine attending physicians on teaching services and one resident had X-waivers prior to the intervention.
Intervention
In November 2018, we administered a survey to residents to identify barriers to starting buprenorphine maintenance and to measure knowledge and confidence with using buprenorphine for OUD (Appendix Figure 1 and Figure 2). We focused on buprenorphine because providers at JHH were familiar with this medication and because Baltimore has widespread access to buprenorphine, with more than 490 local buprenorphine providers.20 Five residents piloted the survey and provided feedback. We then administered the survey to all internal medicine and medicine-pediatrics residents. Based on the results, we developed a targeted educational conference and also created the Buprenorphine Bridge Team (BBT).
In January 2019, we presented the educational conference for residents devoted to the use of buprenorphine for OUD and introduced the BBT. The conference started with a patient testimonial and included peer recovery specialists, pharmacists, nurses, and social workers. We summarized the evidence for buprenorphine and offered a practical guide to start treatment in a one-page protocol. This protocol included guidance on selecting patients, shared decision-making around OUD treatment, avoiding precipitated withdrawal, dosing buprenorphine, and establishing follow-up (Appendix Figure 3). We asked for input on this protocol from nursing leadership, social work teams, and peer recovery specialists. Dosing was adapted from the Guidelines from the American Society of Addiction Medicine, with expert input from physicians from the Addiction Medicine Consult service at Johns Hopkins Bayview Medical Center, also in Baltimore.5 We instructed residents to obtain discharge buprenorphine prescriptions from an X-waivered physician on their team or from the newly established BBT. We asked resident teams to set up a postdischarge appointment for patients with an X-waivered provider, either in a community practice or at the JHH After Care Clinic, a transitional care clinic for discharged patients.21
The BBT is a resident-led group of X-waivered JHH residents and hospitalists who volunteer to write discharge buprenorphine prescriptions for patients. The BBT serves to ensure primary teams have access to an X-waivered prescriber. It is not a consult service. We asked primary teams to contact the BBT after initiating buprenorphine and after securing a follow-up appointment. In response to each request, a member of the BBT reviews the patient chart, confirms the follow-up plan, writes a prescription for buprenorphine along with intranasal naloxone, and leaves a brief note. During the 6-month postintervention period, the team consisted of three residents and three hospitalist attendings. Each week, two members (residents or attendings) staffed the team Monday to Friday, 8
In May 2019, 5 months after the education session and implementation of the BBT, we administered a follow-up survey.
Outcomes
As a secondary outcome, we measured engagement in OUD treatment after discharge by calculating the proportion of patients started on buprenorphine who filled a buprenorphine prescription within 30 days after discharge. We chose 30 days based on the National Committee for Quality Assurance’s Healthcare Effectiveness Data and Information Set (HEDIS) measure for engagement of treatment for alcohol and other drugs.23 We obtained the data from the Chesapeake Regional Information System for our Patients (CRISP) Prescription Drug Monitoring Program, which monitors all prescriptions for controlled substances dispensed in Maryland and five neighboring states. As a balancing measure, we counted patients newly started on methadone maintenance for OUD before and after the intervention. Additional secondary process outcomes included frequency of BBT requests, the volume of buprenorphine prescriptions written by the team, and time required to complete a BBT request.
Clinician-level outcomes, measured with electronically administered pre- and postintervention surveys to residents, included knowledge about and comfort with buprenorphine. Of the 16 questions in the pre- and postimplementation surveys, we analyzed the 6 questions concerning knowledge and comfort that remained identical in the pre- and postintervention surveys and used 5-point Likert scale responses. As an incentive, we randomly distributed three $50 gift cards to survey completers.
Analysis
We used an interrupted time series analysis to evaluate the association between the intervention bundle and a change in the rate that medical teams started patients with OUD on buprenorphine maintenance. This approach allowed us to control for preintervention trends. To evaluate the impact of our interventions, our pre- and postintervention periods include the same residents during the 2018-2019 academic year. Both periods consisted of twelve 2-week intervals (preintervention: July 26, 2019, to January 9, 2019; postintervention: January 10, 2019, to June 26, 2019).
To evaluate for changes in engagement in OUD treatment after discharge, we used two-sample t tests. To evaluate for changes in resident-reported comfort and knowledge with initiating buprenorphine maintenance, we used Wilcoxon rank sum tests for survey data and Wilcoxon signed rank tests for paired data. All analyses employed two-sided P values with statistical significance evaluated at the .05 alpha level. We analyzed data using R version 3.6.3 (Foundation for Statistical Computing). The Institutional Review Board at JHH reviewed and approved the study protocol as a quality improvement project (IRB00193365).
Before the intervention, 13 of the 30 patients (40%) newly started on buprenorphine maintenance during their admission filled a follow-up buprenorphine prescription within 30 days of discharge. After the intervention, 31 of 64 patients (46%) filled a buprenorphine prescription within 30 days (P = .612). Two patients were started on methadone maintenance, one prior to and one after the intervention.
During the 6-month postintervention period, the BBT received 75 requests and wrote 70 prescriptions for buprenorphine. The median time required to complete a BBT request was 15 minutes (minimum, 5 minutes; maximum, 60 minutes).
Of 156 internal medicine and medicine-pediatrics residents, 89 residents (57%) completed the baseline survey and 66 residents (42%) completed the follow-up survey. Forty residents completed both surveys. After the intervention, residents were significantly more likely to feel comfortable dosing buprenorphine (P < .0001) and counseling patients about its use (P = .0237) and were more likely to report ease of establishing follow-up (P < .0001). Self-reported knowledge about preventing precipitated withdrawal increased significantly (P = .0191), as did knowledge about the effectiveness of buprenorphine (P = .0003) independent of formal drug counseling (P = .0066) (Table). Paired survey data also found statistically significant results for all questions except those about preventing precipitated withdrawal and efficacy. For the latter, respondents who completed both surveys were more knowledgeable before the intervention than the overall group that completed the baseline survey (Appendix Table).
This study shows how a resident-led quality improvement project comprising clinician education and implementation of a novel BBT was associated with an increased rate of starting buprenorphine maintenance in hospitalized patients with OUD and improved resident knowledge about and comfort with buprenorphine. To our knowledge, this is the first study demonstrating how education and a team of X-waivered generalists can help primary teams initiate and discharge patients on buprenorphine maintenance in a hospital without an addiction medicine consult service.
Prior to the intervention, resident internal medicine teams at JHH started 10% of hospitalized patients with OUD on buprenorphine maintenance, consistent with prior studies showing rates of 11% to 15% for initiating OAT for hospitalized patients.11,12 After the intervention, the rate of initiating buprenorphine maintenance more than doubled, rising to 24% of eligible patients. Resident internal medicine teams at JHH started buprenorphine maintenance for 37 more patients over the 24-week postintervention period than would have been predicted prior to the intervention, or an additional three patients every 2 weeks.
Between 40% and 46% of hospitalized patients newly started on buprenorphine maintenance filled an outpatient buprenorphine prescription within 30 days of discharge. We are not aware of comparative data for 30-day follow-up for hospitalized patients newly started on buprenorphine maintenance. Data from other contexts show 5% to 10% of veterans were engaged in addiction treatment 30 days after initiation from inpatient or outpatient encounters. An analysis of an academic medical center in Oregon found engagement with an addiction medicine consult service increased after hospital engagement for patients with any substance use disorder from 23% to 39% using the 34-day HEDIS measure for engagement.17,24,25
The BBT required approximately 15 minutes per request and wrote an average of three prescriptions per week, demonstrating the feasibility of this approach and the high demand for this service. One strength of our approach is that residents gained experience starting buprenorphine independently using the aforementioned protocol instead of deferring to a full consult service. It is likely that this resident engagement in initiating longitudinal OUD care contributed to the success of this initiative, as did existing resident familiarity with using buprenorphine for opioid withdrawal.
This approach to resident education—promoting direct, first-person experience with medications in a clinical context—aligns with recommendations from a recent review about substance use disorder education for health professionals.26 Our interventions increased resident knowledge and comfort with buprenorphine, consistent with prior studies showing increased resident confidence in management of substance use disorders after curricular innovations.24,25
A few contextual features were essential for this project’s viability. Maryland allows American medical graduates to obtain a medical license after 1 year of postgraduate training. This allowed three residents to obtain X-waivers. These residents had access to HRSA funding to subsidize the expenses of applying for state licensure and DEA registration. BBT members volunteered their time while working on other services. Last, we were able to take advantage of buprenorphine-providing clinics in Baltimore, including the JHH After Care Clinic, to accept patients for follow-up appointments after discharge.
Limitations
The BBT required motivated clinicians willing to volunteer for additional clinical responsibilities during inpatient rotations and supportive faculty and residency leadership. Attending physicians, nurse practitioners, or physician assistants could staff a similar BBT in hospitals without residents or in hospitals where residents cannot obtain DEA registration. Crucially, other hospitals may not have access to practices with X-waivered physicians for outpatient follow-up. A recent study found X-waivered primary care physicians were less likely to be affiliated with hospital health systems. Other studies have shown limitations in access to buprenorphine at the county level based on geography and racial/ethnic segregation.27-29
Most patients hospitalized with OUD did not have ICD-10 codes associated with OUD. We addressed this by assuming patients had OUD if buprenorphine or methadone was ordered during their hospitalization, even if the medication was never administered. This may have overcounted patients prescribed these medications for indications other than OUD, and it may have undercounted patients with OUD for whom buprenorphine or methadone were never considered. The opioid withdrawal order set at JHH automatically offers an option to use buprenorphine to treat withdrawal. Patients with OUD for whom buprenorphine or methadone were never ordered likely did not experience withdrawal or were in withdrawal so mild that it escaped the attention of the team, which limits the generalizability of our intervention.
We identified several limitations to the internal validity of our study. First, we used a before-and-after study design without a control group. We could not ethically withhold access to evidence-based, mortality-reducing medications from patients. Without a control group, we cannot rule out the possibility that underlying temporal trends made residents more likely to start buprenorphine maintenance independent of our intervention. We attempted to control for unmeasured confounders by using an interrupted time series analysis to control for preintervention trends, comparing the same group of residents before and after our interventions, and selecting an intervention period during which residents were given only educational sessions and materials provided by our team. Our results may be biased by clustered data because certain residents may have been more likely to initiate buprenorphine, but these effects are likely marginal because resident schedules are balanced between outpatient and inpatient rotations during each 6-month period.
Finally, this project focused on buprenorphine, not on other medications for OUD, including methadone or naltrexone, or nonpharmacologic treatments for OUD.
Sustainability and Next Steps
Since the start of the BBT in January 2019, five additional PGY-2 residents obtained their medical licenses and X-waivers. These residents, with the support of two attending hospitalists, led the BBT and coordinated education sessions that were incorporated into the curriculum during the 2019-2020 academic year. These educational sessions will continue indefinitely. In 2020, JHH started an Addiction Medicine Consult Service staffed by physicians, NPs, and a pharmacist. The BBT continues to operate in conjunction with this service.
We found substantial variability in the rate of buprenorphine maintenance initiation despite our interventions. This is an area for future improvement. In a free-response prompt in our follow-up survey, residents requested additional education sessions and an order set to assist with initiation of buprenorphine. To address these gaps, three educational sessions were added, one of which included education on starting methadone maintenance therapy. We also added a new order set for starting buprenorphine maintenance. We hypothesize that these interventions will improve consistency.
In order for a similar program to be disseminated to other institutions, educational initiatives and a team of dedicated X-waivered prescribers are key. Materials to assist with this process are available in the Appendix.
CONCLUSION
This study shows how a resident-led intervention comprising clinician education and a team of X-waivered generalists was associated with improved treatment of OUD for hospitalized patients. We encourage residents and all clinicians at other hospitals without addiction medicine consult services to design, implement, and study similar interventions that directly increase the use of buprenorphine or methadone maintenance to treat OUD.
Preliminary results from this project were presented at the AMERSA National Conference on November 7, 2019.
Nearly 48,000 Americans died from overdoses involving opioids in 2018, continuing a national crisis that has led to 446,000 deaths since 1999.1 Annually, opioids are responsible for more than 500,000 admissions, approximately 1% of all hospitalizations, costing the United States nearly $15 billion.2,3 Among hospitalized patients, chronic opioid use is associated with increased mortality, severe infectious complications, and higher rates of readmission.4 Opioid use disorder (OUD) is a chronic, relapsing medical condition with biopsychosocial origins and significant morbidity and mortality.5 Opioid agonist therapy (OAT) with buprenorphine or methadone maintenance, the evidence-based standard of treatment, reduces the mortality rate by half, decreases overdoses and hospital readmissions, and improves retention in care.6-10
OAT maintenance refers to using buprenorphine or methadone for long-term treatment of OUD rather than for acute treatment of opioid withdrawal. Despite evidence supporting OAT maintenance, clinicians start medications for only 11% to 15% of hospitalized patients with OUD, depending on practice contexts.11,12 Three significant barriers—stigma, insufficient clinician education, and restrictive regulations—prevent clinicians from starting OAT.13 Clinicians who do not have the Drug Enforcement Administration (DEA)–issued DATA-2000 waiver (X-waiver) for outpatient prescribing can order buprenorphine for admitted patients but cannot prescribe it at discharge.14 In hospitals where they exist, addiction medicine consult services offer primary teams guidance on pharmacotherapy, leading to reduced hospital readmissions and increased engagement in outpatient addiction treatment.15-17 However, in most hospitals around the country, such specialty services do not exist.18 In some hospitals without addiction medicine consult services, hospitalists with expertise in OUD have started assisting primary teams in starting OAT, but to our knowledge, no prior studies have described the impact of these interventions on patients or clinician experience with OAT.19
This quality improvement project aimed to increase the rate at which internal medicine resident teams at Johns Hopkins Hospital (JHH) in Baltimore, Maryland, started hospitalized patients with OUD on buprenorphine maintenance. We hypothesized that resident education and measures to increase the availability of X-waivered physicians would increase the rate of initiating buprenorphine maintenance. We additionally hypothesized that these interventions would increase knowledge about and comfort with buprenorphine across the residency. This represents the first study to examine the effects of clinician education and a team of X-waivered residents and hospitalists who assist in starting buprenorphine maintenance in a hospital without an addiction medicine consult service.
METHODS
Setting
This study took place from July 2018 to June 2019 at JHH, a large, academic, urban hospital in Baltimore. Prior to the intervention, internal medicine residents at JHH commonly used short courses of buprenorphine to treat withdrawal, but they did not have access to hospital-specific resources to assist with starting maintenance OAT. During the study period, JHH had a Substance Use Disorders team staffed by peer recovery specialists that could be consulted by hospitalists and residents to provide psychosocial support and link admitted patients to treatment after discharge. There were no providers on the team to guide pharmacotherapy or to write discharge buprenorphine prescriptions. The Osler Medical Residency Training Program at JHH has 140 internal medicine residents and 16 combined medicine-pediatrics residents. All residents receive 1 hour of formal education about opioid use disorder annually. In addition, 28 of those 156 residents, those in the Urban Health Primary Care track, spend 1 month on an Addiction Medicine rotation in which they complete the 8-hour training required to receive the X-waiver. Those residents are encouraged to apply for the X-waiver once they obtain a medical license subsidized by a Health Resources & Services Administration (HRSA) grant. Four internal medicine attending physicians on teaching services and one resident had X-waivers prior to the intervention.
Intervention
In November 2018, we administered a survey to residents to identify barriers to starting buprenorphine maintenance and to measure knowledge and confidence with using buprenorphine for OUD (Appendix Figure 1 and Figure 2). We focused on buprenorphine because providers at JHH were familiar with this medication and because Baltimore has widespread access to buprenorphine, with more than 490 local buprenorphine providers.20 Five residents piloted the survey and provided feedback. We then administered the survey to all internal medicine and medicine-pediatrics residents. Based on the results, we developed a targeted educational conference and also created the Buprenorphine Bridge Team (BBT).
In January 2019, we presented the educational conference for residents devoted to the use of buprenorphine for OUD and introduced the BBT. The conference started with a patient testimonial and included peer recovery specialists, pharmacists, nurses, and social workers. We summarized the evidence for buprenorphine and offered a practical guide to start treatment in a one-page protocol. This protocol included guidance on selecting patients, shared decision-making around OUD treatment, avoiding precipitated withdrawal, dosing buprenorphine, and establishing follow-up (Appendix Figure 3). We asked for input on this protocol from nursing leadership, social work teams, and peer recovery specialists. Dosing was adapted from the Guidelines from the American Society of Addiction Medicine, with expert input from physicians from the Addiction Medicine Consult service at Johns Hopkins Bayview Medical Center, also in Baltimore.5 We instructed residents to obtain discharge buprenorphine prescriptions from an X-waivered physician on their team or from the newly established BBT. We asked resident teams to set up a postdischarge appointment for patients with an X-waivered provider, either in a community practice or at the JHH After Care Clinic, a transitional care clinic for discharged patients.21
The BBT is a resident-led group of X-waivered JHH residents and hospitalists who volunteer to write discharge buprenorphine prescriptions for patients. The BBT serves to ensure primary teams have access to an X-waivered prescriber. It is not a consult service. We asked primary teams to contact the BBT after initiating buprenorphine and after securing a follow-up appointment. In response to each request, a member of the BBT reviews the patient chart, confirms the follow-up plan, writes a prescription for buprenorphine along with intranasal naloxone, and leaves a brief note. During the 6-month postintervention period, the team consisted of three residents and three hospitalist attendings. Each week, two members (residents or attendings) staffed the team Monday to Friday, 8
In May 2019, 5 months after the education session and implementation of the BBT, we administered a follow-up survey.
Outcomes
As a secondary outcome, we measured engagement in OUD treatment after discharge by calculating the proportion of patients started on buprenorphine who filled a buprenorphine prescription within 30 days after discharge. We chose 30 days based on the National Committee for Quality Assurance’s Healthcare Effectiveness Data and Information Set (HEDIS) measure for engagement of treatment for alcohol and other drugs.23 We obtained the data from the Chesapeake Regional Information System for our Patients (CRISP) Prescription Drug Monitoring Program, which monitors all prescriptions for controlled substances dispensed in Maryland and five neighboring states. As a balancing measure, we counted patients newly started on methadone maintenance for OUD before and after the intervention. Additional secondary process outcomes included frequency of BBT requests, the volume of buprenorphine prescriptions written by the team, and time required to complete a BBT request.
Clinician-level outcomes, measured with electronically administered pre- and postintervention surveys to residents, included knowledge about and comfort with buprenorphine. Of the 16 questions in the pre- and postimplementation surveys, we analyzed the 6 questions concerning knowledge and comfort that remained identical in the pre- and postintervention surveys and used 5-point Likert scale responses. As an incentive, we randomly distributed three $50 gift cards to survey completers.
Analysis
We used an interrupted time series analysis to evaluate the association between the intervention bundle and a change in the rate that medical teams started patients with OUD on buprenorphine maintenance. This approach allowed us to control for preintervention trends. To evaluate the impact of our interventions, our pre- and postintervention periods include the same residents during the 2018-2019 academic year. Both periods consisted of twelve 2-week intervals (preintervention: July 26, 2019, to January 9, 2019; postintervention: January 10, 2019, to June 26, 2019).
To evaluate for changes in engagement in OUD treatment after discharge, we used two-sample t tests. To evaluate for changes in resident-reported comfort and knowledge with initiating buprenorphine maintenance, we used Wilcoxon rank sum tests for survey data and Wilcoxon signed rank tests for paired data. All analyses employed two-sided P values with statistical significance evaluated at the .05 alpha level. We analyzed data using R version 3.6.3 (Foundation for Statistical Computing). The Institutional Review Board at JHH reviewed and approved the study protocol as a quality improvement project (IRB00193365).
Before the intervention, 13 of the 30 patients (40%) newly started on buprenorphine maintenance during their admission filled a follow-up buprenorphine prescription within 30 days of discharge. After the intervention, 31 of 64 patients (46%) filled a buprenorphine prescription within 30 days (P = .612). Two patients were started on methadone maintenance, one prior to and one after the intervention.
During the 6-month postintervention period, the BBT received 75 requests and wrote 70 prescriptions for buprenorphine. The median time required to complete a BBT request was 15 minutes (minimum, 5 minutes; maximum, 60 minutes).
Of 156 internal medicine and medicine-pediatrics residents, 89 residents (57%) completed the baseline survey and 66 residents (42%) completed the follow-up survey. Forty residents completed both surveys. After the intervention, residents were significantly more likely to feel comfortable dosing buprenorphine (P < .0001) and counseling patients about its use (P = .0237) and were more likely to report ease of establishing follow-up (P < .0001). Self-reported knowledge about preventing precipitated withdrawal increased significantly (P = .0191), as did knowledge about the effectiveness of buprenorphine (P = .0003) independent of formal drug counseling (P = .0066) (Table). Paired survey data also found statistically significant results for all questions except those about preventing precipitated withdrawal and efficacy. For the latter, respondents who completed both surveys were more knowledgeable before the intervention than the overall group that completed the baseline survey (Appendix Table).
This study shows how a resident-led quality improvement project comprising clinician education and implementation of a novel BBT was associated with an increased rate of starting buprenorphine maintenance in hospitalized patients with OUD and improved resident knowledge about and comfort with buprenorphine. To our knowledge, this is the first study demonstrating how education and a team of X-waivered generalists can help primary teams initiate and discharge patients on buprenorphine maintenance in a hospital without an addiction medicine consult service.
Prior to the intervention, resident internal medicine teams at JHH started 10% of hospitalized patients with OUD on buprenorphine maintenance, consistent with prior studies showing rates of 11% to 15% for initiating OAT for hospitalized patients.11,12 After the intervention, the rate of initiating buprenorphine maintenance more than doubled, rising to 24% of eligible patients. Resident internal medicine teams at JHH started buprenorphine maintenance for 37 more patients over the 24-week postintervention period than would have been predicted prior to the intervention, or an additional three patients every 2 weeks.
Between 40% and 46% of hospitalized patients newly started on buprenorphine maintenance filled an outpatient buprenorphine prescription within 30 days of discharge. We are not aware of comparative data for 30-day follow-up for hospitalized patients newly started on buprenorphine maintenance. Data from other contexts show 5% to 10% of veterans were engaged in addiction treatment 30 days after initiation from inpatient or outpatient encounters. An analysis of an academic medical center in Oregon found engagement with an addiction medicine consult service increased after hospital engagement for patients with any substance use disorder from 23% to 39% using the 34-day HEDIS measure for engagement.17,24,25
The BBT required approximately 15 minutes per request and wrote an average of three prescriptions per week, demonstrating the feasibility of this approach and the high demand for this service. One strength of our approach is that residents gained experience starting buprenorphine independently using the aforementioned protocol instead of deferring to a full consult service. It is likely that this resident engagement in initiating longitudinal OUD care contributed to the success of this initiative, as did existing resident familiarity with using buprenorphine for opioid withdrawal.
This approach to resident education—promoting direct, first-person experience with medications in a clinical context—aligns with recommendations from a recent review about substance use disorder education for health professionals.26 Our interventions increased resident knowledge and comfort with buprenorphine, consistent with prior studies showing increased resident confidence in management of substance use disorders after curricular innovations.24,25
A few contextual features were essential for this project’s viability. Maryland allows American medical graduates to obtain a medical license after 1 year of postgraduate training. This allowed three residents to obtain X-waivers. These residents had access to HRSA funding to subsidize the expenses of applying for state licensure and DEA registration. BBT members volunteered their time while working on other services. Last, we were able to take advantage of buprenorphine-providing clinics in Baltimore, including the JHH After Care Clinic, to accept patients for follow-up appointments after discharge.
Limitations
The BBT required motivated clinicians willing to volunteer for additional clinical responsibilities during inpatient rotations and supportive faculty and residency leadership. Attending physicians, nurse practitioners, or physician assistants could staff a similar BBT in hospitals without residents or in hospitals where residents cannot obtain DEA registration. Crucially, other hospitals may not have access to practices with X-waivered physicians for outpatient follow-up. A recent study found X-waivered primary care physicians were less likely to be affiliated with hospital health systems. Other studies have shown limitations in access to buprenorphine at the county level based on geography and racial/ethnic segregation.27-29
Most patients hospitalized with OUD did not have ICD-10 codes associated with OUD. We addressed this by assuming patients had OUD if buprenorphine or methadone was ordered during their hospitalization, even if the medication was never administered. This may have overcounted patients prescribed these medications for indications other than OUD, and it may have undercounted patients with OUD for whom buprenorphine or methadone were never considered. The opioid withdrawal order set at JHH automatically offers an option to use buprenorphine to treat withdrawal. Patients with OUD for whom buprenorphine or methadone were never ordered likely did not experience withdrawal or were in withdrawal so mild that it escaped the attention of the team, which limits the generalizability of our intervention.
We identified several limitations to the internal validity of our study. First, we used a before-and-after study design without a control group. We could not ethically withhold access to evidence-based, mortality-reducing medications from patients. Without a control group, we cannot rule out the possibility that underlying temporal trends made residents more likely to start buprenorphine maintenance independent of our intervention. We attempted to control for unmeasured confounders by using an interrupted time series analysis to control for preintervention trends, comparing the same group of residents before and after our interventions, and selecting an intervention period during which residents were given only educational sessions and materials provided by our team. Our results may be biased by clustered data because certain residents may have been more likely to initiate buprenorphine, but these effects are likely marginal because resident schedules are balanced between outpatient and inpatient rotations during each 6-month period.
Finally, this project focused on buprenorphine, not on other medications for OUD, including methadone or naltrexone, or nonpharmacologic treatments for OUD.
Sustainability and Next Steps
Since the start of the BBT in January 2019, five additional PGY-2 residents obtained their medical licenses and X-waivers. These residents, with the support of two attending hospitalists, led the BBT and coordinated education sessions that were incorporated into the curriculum during the 2019-2020 academic year. These educational sessions will continue indefinitely. In 2020, JHH started an Addiction Medicine Consult Service staffed by physicians, NPs, and a pharmacist. The BBT continues to operate in conjunction with this service.
We found substantial variability in the rate of buprenorphine maintenance initiation despite our interventions. This is an area for future improvement. In a free-response prompt in our follow-up survey, residents requested additional education sessions and an order set to assist with initiation of buprenorphine. To address these gaps, three educational sessions were added, one of which included education on starting methadone maintenance therapy. We also added a new order set for starting buprenorphine maintenance. We hypothesize that these interventions will improve consistency.
In order for a similar program to be disseminated to other institutions, educational initiatives and a team of dedicated X-waivered prescribers are key. Materials to assist with this process are available in the Appendix.
CONCLUSION
This study shows how a resident-led intervention comprising clinician education and a team of X-waivered generalists was associated with improved treatment of OUD for hospitalized patients. We encourage residents and all clinicians at other hospitals without addiction medicine consult services to design, implement, and study similar interventions that directly increase the use of buprenorphine or methadone maintenance to treat OUD.
Preliminary results from this project were presented at the AMERSA National Conference on November 7, 2019.
1. Wilson N, Kariisa M, Seth P, Iv HS, Davis NL. Drug and opioid-involved overdose deaths – United States, 2017–2018. MMWR Morb Mortal Wkly Rep. 2020;69(11):290-297. http://dx.doi.org/10.15585/mmwr.mm6911a4
2. Berk J, Rogers KM, Wilson DJ, Thakrar A, Feldman L. Missed opportunities for treatment of opioid use disorder in the hospital setting: updating an outdated policy. J Hosp Med. 2020;15(10):619-621. https://doi.org/10.12788/jhm.3352
3. Ronan MV, Herzig SJ. Hospitalizations related to opioid abuse/dependence and associated serious infections increased sharply, 2002–12. Health Aff (Millwood). 2016;35(5):832-837. https://doi.org/10.1377/hlthaff.2015.1424
4. Mosher HJ, Jiang L, Vaughan Sarrazin MS, Cram P, Kaboli PJ, Vander Weg MW. Prevalence and characteristics of hospitalized adults on chronic opioid therapy. J Hosp Med. 2014;9(2):82-87. https://doi.org/10.1002/jhm.2113
5. Crotty K, Freedman KI, Kampman KM. Executive summary of the focused update of the ASAM national practice guideline for the treatment of opioid use disorder. J Addict Med. 2020;14(2):99-112. https://doi.org/10.1097/adm.0000000000000635
6. Leshner AI, Mancher M, eds. Medications for Opioid Use Disorder Save Lives. The National Academies Press; 2019. https://www.nap.edu/catalog/25310
7. Sordo L, Barrio G, Bravo MJ, et al. Mortality risk during and after opioid substitution treatment: systematic review and meta-analysis of cohort studies. BMJ. 2017;357: j1550. https://doi.org/10.1136/bmj.j1550
8. Larochelle MR, Bernson D, Land T, et al. Medication for opioid use disorder after nonfatal opioid overdose and association with mortality. Ann Intern Med. 2018;169(3):137-145. https://dx.doi.org/10.7326%2FM17-3107
9. Schuckit MA. Treatment of opioid-use disorders. N Engl J Med. 2016;375(4):357-368. https://doi.org/10.1056/nejmra1604339
10. Moreno JL, Wakeman SE, Duprey MS, Roberts RJ, Jacobson JS, Devlin JW. Predictors for 30-day and 90-day hospital readmission among patients with opioid use disorder. J Addict Med. 2019;13(4):306-313. https://doi.org/10.1097/adm.0000000000000499
11. Rosenthal ES, Karchmer AW, Theisen-Toupal J, Castillo RA, Rowley CF. Suboptimal addiction interventions for patients hospitalized with injection drug use-associated infective endocarditis. Am J Med. 2016;129(5):481-485. https://doi.org/10.1016/j.amjmed.2015.09.024
12. Priest KC, Lovejoy TI, Englander H, Shull S, McCarty D. Opioid agonist therapy during hospitalization within the Veterans Health Administration: a pragmatic retrospective cohort analysis. J Gen Intern Med. 2020;35(8):2365-2374. https://doi.org/10.1007/s11606-020-05815-0
13. Madras BK, Ahmad NJ, Wen J, Sharfstein J; Prevention, Treatment, and Recovery Working Group of the Action Collaborative on Countering the U.S. Opioid Epidemic. Improving access to evidence-based medical treatment for opioid use disorder: strategies to address key barriers within the treatment system. NAM Perspectives. April 27, 2020. https://doi.org/10.31478/202004b
14. Fiscella K, Wakeman SE, Beletsky L. Buprenorphine deregulation and mainstreaming treatment for opioid use disorder: x the X Waiver. JAMA Psychiatry. 2019;76(3):229-230. https://doi.org/10.1001/jamapsychiatry.2018.3685
15. Priest KC, McCarty D. Role of the hospital in the 21st century opioid overdose epidemic: the addiction medicine consult service. J Addict Med. 2019;13(2):104-112. https://doi.org/10.1097/adm.0000000000000496
16. Weimer M, Morford K, Donroe J. Treatment of opioid use disorder in the acute hospital setting: a critical review of the literature (2014–2019). Curr Addict Rep. 2019;6(4):339-354.
17. Englander H, Dobbertin K, Lind BK, et al. Inpatient addiction medicine consultation and post-hospital substance use disorder treatment engagement: a propensity-matched analysis. J Gen Intern Med. 2019;34(12):2796-2803. https://doi.org/10.1007/s11606-019-05251-9
18. Englander H, Priest KC, Snyder H, Martin M, Calcaterra S, Gregg J. A call to action: hospitalists’ role in addressing substance use disorder. J Hosp Med. 2019;14(3):E1-E4. https://doi.org/10.12788/jhm.3311
19. Bottner R, Moriates C, Tirado C. The role of hospitalists in treating opioid use disorder. J Addict Med. 2020;14(2):178. https://doi.org/10.1097/adm.0000000000000545
20. Behavioral health treatment services locator. Substance Abuse and Mental Health Services Administration. Accessed May 14, 2020. https://findtreatment.samhsa.gov/
21. Groesbeck K, Whiteman LN, Stewart RW. Reducing readmission rates by improving transitional care. South Med J. 2015;108(12):758-760. https://doi.org/10.14423/smj.0000000000000376
22. Heslin KC, Owens PL, Karaca Z, Barrett ML, Moore BJ, Elixhauser A. Trends in opioid-related inpatient stays shifted after the US transitioned to ICD-10-CM diagnosis coding in 2015 Med Care. 2017;55(11):918-923. https://doi.org/10.1097/mlr.0000000000000805
23. Initiation and engagement of alcohol and other drug abuse or dependence treatment (IET). NCQA. Accessed April 20, 2020. https://www.ncqa.org/hedis/measures/initiation-and-engagement-of-alcohol-and-other-drug-abuse-or-dependence-treatment/
24. Wyse JJ, Robbins JL, McGinnis KA, et al. Predictors of timely opioid agonist treatment initiation among veterans with and without HIV. Drug Alcohol Depend. 2019;198:70-75. https://doi.org/10.1016/j.drugalcdep.2019.01.038
25. Harris AHS, Humphreys K, Finney JW. Veterans Affairs facility performance on Washington Circle indicators and casemix-adjusted effectiveness. J Subst Abuse Treat. 2007;33(4):333-339. https://doi.org/10.1016/j.jsat.2006.12.015
26. Muzyk A, Smothers ZPW, Andolsek KM, et al. Interprofessional substance use disorder education in health professions education programs: a scoping review. Acad Med. 2020;95(3):470-480. https://doi.org/10.1097/acm.0000000000003053
27. Saloner B, Lin L, Simon K. Geographic location of buprenorphine-waivered physicians and integration with health systems. J Subst Abuse Treat. 2020;115:108034. https://doi.org/10.1016/j.jsat.2020.108034
28. Jones CW, Christman Z, Smith CM, et al. Comparison between buprenorphine provider availability and opioid deaths among US counties. J Subst Abuse Treat. 2018;93:19-25. https://doi.org/10.1016/j.jsat.2018.07.008
29. Goedel WC, Shapiro A, Cerdá M, Tsai JW, Hadland SE, Marshall BDL. Association of racial/ethnic segregation with treatment capacity for opioid use disorder in counties in the United States. JAMA Netw Open. 2020;3(4):e203711. https://doi.org/10.1001/jamanetworkopen.2020.3711
1. Wilson N, Kariisa M, Seth P, Iv HS, Davis NL. Drug and opioid-involved overdose deaths – United States, 2017–2018. MMWR Morb Mortal Wkly Rep. 2020;69(11):290-297. http://dx.doi.org/10.15585/mmwr.mm6911a4
2. Berk J, Rogers KM, Wilson DJ, Thakrar A, Feldman L. Missed opportunities for treatment of opioid use disorder in the hospital setting: updating an outdated policy. J Hosp Med. 2020;15(10):619-621. https://doi.org/10.12788/jhm.3352
3. Ronan MV, Herzig SJ. Hospitalizations related to opioid abuse/dependence and associated serious infections increased sharply, 2002–12. Health Aff (Millwood). 2016;35(5):832-837. https://doi.org/10.1377/hlthaff.2015.1424
4. Mosher HJ, Jiang L, Vaughan Sarrazin MS, Cram P, Kaboli PJ, Vander Weg MW. Prevalence and characteristics of hospitalized adults on chronic opioid therapy. J Hosp Med. 2014;9(2):82-87. https://doi.org/10.1002/jhm.2113
5. Crotty K, Freedman KI, Kampman KM. Executive summary of the focused update of the ASAM national practice guideline for the treatment of opioid use disorder. J Addict Med. 2020;14(2):99-112. https://doi.org/10.1097/adm.0000000000000635
6. Leshner AI, Mancher M, eds. Medications for Opioid Use Disorder Save Lives. The National Academies Press; 2019. https://www.nap.edu/catalog/25310
7. Sordo L, Barrio G, Bravo MJ, et al. Mortality risk during and after opioid substitution treatment: systematic review and meta-analysis of cohort studies. BMJ. 2017;357: j1550. https://doi.org/10.1136/bmj.j1550
8. Larochelle MR, Bernson D, Land T, et al. Medication for opioid use disorder after nonfatal opioid overdose and association with mortality. Ann Intern Med. 2018;169(3):137-145. https://dx.doi.org/10.7326%2FM17-3107
9. Schuckit MA. Treatment of opioid-use disorders. N Engl J Med. 2016;375(4):357-368. https://doi.org/10.1056/nejmra1604339
10. Moreno JL, Wakeman SE, Duprey MS, Roberts RJ, Jacobson JS, Devlin JW. Predictors for 30-day and 90-day hospital readmission among patients with opioid use disorder. J Addict Med. 2019;13(4):306-313. https://doi.org/10.1097/adm.0000000000000499
11. Rosenthal ES, Karchmer AW, Theisen-Toupal J, Castillo RA, Rowley CF. Suboptimal addiction interventions for patients hospitalized with injection drug use-associated infective endocarditis. Am J Med. 2016;129(5):481-485. https://doi.org/10.1016/j.amjmed.2015.09.024
12. Priest KC, Lovejoy TI, Englander H, Shull S, McCarty D. Opioid agonist therapy during hospitalization within the Veterans Health Administration: a pragmatic retrospective cohort analysis. J Gen Intern Med. 2020;35(8):2365-2374. https://doi.org/10.1007/s11606-020-05815-0
13. Madras BK, Ahmad NJ, Wen J, Sharfstein J; Prevention, Treatment, and Recovery Working Group of the Action Collaborative on Countering the U.S. Opioid Epidemic. Improving access to evidence-based medical treatment for opioid use disorder: strategies to address key barriers within the treatment system. NAM Perspectives. April 27, 2020. https://doi.org/10.31478/202004b
14. Fiscella K, Wakeman SE, Beletsky L. Buprenorphine deregulation and mainstreaming treatment for opioid use disorder: x the X Waiver. JAMA Psychiatry. 2019;76(3):229-230. https://doi.org/10.1001/jamapsychiatry.2018.3685
15. Priest KC, McCarty D. Role of the hospital in the 21st century opioid overdose epidemic: the addiction medicine consult service. J Addict Med. 2019;13(2):104-112. https://doi.org/10.1097/adm.0000000000000496
16. Weimer M, Morford K, Donroe J. Treatment of opioid use disorder in the acute hospital setting: a critical review of the literature (2014–2019). Curr Addict Rep. 2019;6(4):339-354.
17. Englander H, Dobbertin K, Lind BK, et al. Inpatient addiction medicine consultation and post-hospital substance use disorder treatment engagement: a propensity-matched analysis. J Gen Intern Med. 2019;34(12):2796-2803. https://doi.org/10.1007/s11606-019-05251-9
18. Englander H, Priest KC, Snyder H, Martin M, Calcaterra S, Gregg J. A call to action: hospitalists’ role in addressing substance use disorder. J Hosp Med. 2019;14(3):E1-E4. https://doi.org/10.12788/jhm.3311
19. Bottner R, Moriates C, Tirado C. The role of hospitalists in treating opioid use disorder. J Addict Med. 2020;14(2):178. https://doi.org/10.1097/adm.0000000000000545
20. Behavioral health treatment services locator. Substance Abuse and Mental Health Services Administration. Accessed May 14, 2020. https://findtreatment.samhsa.gov/
21. Groesbeck K, Whiteman LN, Stewart RW. Reducing readmission rates by improving transitional care. South Med J. 2015;108(12):758-760. https://doi.org/10.14423/smj.0000000000000376
22. Heslin KC, Owens PL, Karaca Z, Barrett ML, Moore BJ, Elixhauser A. Trends in opioid-related inpatient stays shifted after the US transitioned to ICD-10-CM diagnosis coding in 2015 Med Care. 2017;55(11):918-923. https://doi.org/10.1097/mlr.0000000000000805
23. Initiation and engagement of alcohol and other drug abuse or dependence treatment (IET). NCQA. Accessed April 20, 2020. https://www.ncqa.org/hedis/measures/initiation-and-engagement-of-alcohol-and-other-drug-abuse-or-dependence-treatment/
24. Wyse JJ, Robbins JL, McGinnis KA, et al. Predictors of timely opioid agonist treatment initiation among veterans with and without HIV. Drug Alcohol Depend. 2019;198:70-75. https://doi.org/10.1016/j.drugalcdep.2019.01.038
25. Harris AHS, Humphreys K, Finney JW. Veterans Affairs facility performance on Washington Circle indicators and casemix-adjusted effectiveness. J Subst Abuse Treat. 2007;33(4):333-339. https://doi.org/10.1016/j.jsat.2006.12.015
26. Muzyk A, Smothers ZPW, Andolsek KM, et al. Interprofessional substance use disorder education in health professions education programs: a scoping review. Acad Med. 2020;95(3):470-480. https://doi.org/10.1097/acm.0000000000003053
27. Saloner B, Lin L, Simon K. Geographic location of buprenorphine-waivered physicians and integration with health systems. J Subst Abuse Treat. 2020;115:108034. https://doi.org/10.1016/j.jsat.2020.108034
28. Jones CW, Christman Z, Smith CM, et al. Comparison between buprenorphine provider availability and opioid deaths among US counties. J Subst Abuse Treat. 2018;93:19-25. https://doi.org/10.1016/j.jsat.2018.07.008
29. Goedel WC, Shapiro A, Cerdá M, Tsai JW, Hadland SE, Marshall BDL. Association of racial/ethnic segregation with treatment capacity for opioid use disorder in counties in the United States. JAMA Netw Open. 2020;3(4):e203711. https://doi.org/10.1001/jamanetworkopen.2020.3711
© 2021 Society of Hospital Medicine
The financial advantages of medical scribes extend beyond increased visits
ABSTRACT
Purpose Medical scribes are known to increase revenue by increasing visits to a medical practice. We examined whether medical scribes are associated with markers of financial benefit independent of increased visits.
Methods We conducted a pre- and post-observational study with a control group, examining changes in the percentage of visits (1) coded as level of service 4 or 5, (2) with at least 1 hierarchical condition category code billed, and (3) at which orders for 3 pay-for-performance quality measures (screening for breast, cervical, and colon cancer) were placed, if due. We looked at changes in outcomes among scribed providers and compared them to nonscribed providers. We used generalized estimating equations with robust standard errors to account for repeated measures and the hierarchical nature of the data, controlling for patient demographics.
Results We examined 41,371 visits to 17 scribed providers and 230,297 visits to 78 nonscribed providers. In adjusted analyses, and compared to nonscribed providers, scribes were associated with an increase of:
- Frutiger LT Std9.2 percentage points in level-of-service 4 or 5 billing (Frutiger LT StdP < .001)
- 3.6 percentage points in hierarchical condition category coding (Frutiger LT StdP < .001)
- 4.0 percentage points in breast cancer screening orders (Frutiger LT StdP = .01)
- 4.9 percentage points in colon cancer screening orders (Frutiger LT StdPFrutiger LT Std = .04).
Conclusions This study suggests that scribes are associated with financial benefit in addition to increased visit volume. Primary care practices should consider the financial benefit of scribes independent of their ability to add patient volume.
Increasingly, medical scribes are used in ambulatory care settings across the United States.1 Scribes are trained personnel who accompany providers during visits to provide documentation support and assist with other administrative tasks. They are associated with reduced documentation time for providers2-6 and improved provider satisfaction,7-11 without detriment to4-16 (or with possible improvement in17-20) patient satisfaction in ambulatory care settings. At the same time, concerns remain that using scribes might inhibit patient communication, harm clinical reasoning, reduce the effectiveness of clinical decision-support tools, and simply serve as a work-around to fixing inefficiencies in the electronic medical record (EMR).21-23
A driving force for the increased use of medical scribes is the expectation that they reduce the cost of providing care. Cost-efficiency is typically described as resulting from a reduction in physician time per patient seen, which allows increased patient volume and, in turn, drives increased physician productivity.2,8,10,18,24-27 Whether scribes result in cost savings remains unclear; some papers suggest that scribes are cost efficient in ambulatory care,2,10,18 while others have been unable to identify cost savings, particularly in primary care.4
One reason why scribes might not be associated with cost savings is that their financial benefit might be undercounted. Studies that focus on increased volume miss the opportunity to capture financial benefits conferred through mechanisms that are independent of seeing more patients:
- Scribes might help providers address and document more, and more complex, medical problems, allowing higher level-of-service (LOS) billing. For example, a provider chooses a lower LOS because they have insufficiently documented a visit to support a higher LOS; by assisting with documentation, the scribe might allow the provider to choose a higher LOS.
- Scribes might prompt a provider to use decision-support tools for risk coding (using appropriate medical codes to capture the patient’s level of medical complexity), thereby increasing reimbursement.
- Scribes might extend the time available during the visit for the provider to address pay-for-performance quality measures, such as cancer screening.
Continue to: Making visits count, not counting visits
Making visits count, not counting visits. In this study, we examined whether medical scribes in primary care are associated with improved markers of revenue that are independent of seeing more patients. Specifically, we examined whether scribes are associated with increased LOS coding, risk coding, and orders for pay-for-performance measures for all primary care visits and for nonpreventive primary care visits.
Methods
Design
This observational study compared the change in outcomes before implementation of scribes and during implementation of scribes, between scribed providers and nonscribed providers. We compared visits during the year prior to the implementation of scribes (July 2017–June 2018) with the year during their implementation (July 2018–2019).
The Cambridge Health Alliance Institutional Review Board considered this study exempt from review.
Setting
This study was conducted at a safety-net community academic health system that uses an EMR developed by Epic Systems [Verona, WI]. This EMR includes decision-support tools that prompt providers when pay-for-performance quality measures are due and when hierarchical condition category (HCC) codes—ie, specific diagnoses used by Medicare and other payers to reimburse providers for the complexity of their patients—might apply to the visit.
These EMR decision-support tools use algorithms that draw on age, gender, diagnoses that were billed previously or are on the problem list, laboratory findings, and prior imaging. They alert physicians when a patient is due for pay-for-performance quality measures, such as cancer screenings, and when HCC codes might be applicable.
Continue to: During the study period...
During the study period, the EMR decision-support tool for HCC coding underwent several changes designed to improve HCC coding. In addition, systematic changes to primary care visits took place, leading to an increase in the number of patients seen and screenings required.
Outcomes
We examined 2 categories of outcomes that confer financial benefit to many institutions: billing measures and pay-for-performance measures.
Billing measures included the percentage of visits (1) coded as LOS 4 or 5 and (2) with at least 1 HCC code billed (among those for which the decision-support tool identified at least 1 potential HCC code).
Pay-for-performance measures. We examined whether any of 3 pay-for-performance quality measures were addressed during the visit, selecting 3 that are commonly addressed by primary care providers (PCPs) and that require PCPs to sign an order for screening during a primary care visit: breast cancer (mammography order), cervical cancer (Papanicolaou smear order), and colon cancer (an order for fecal occult blood testing or colonoscopy).
Intervention
Scribes were employees of Cambridge Health Alliance who had recently graduated from college and were interested in a career as a health care professional. Scribes received 3 days of training on how to function effectively in their role; 1 day of training in EMR functionality; and 2 hours of training on decision-support tools for pay-for-performance quality measures and risk coding. Scribes continued learning on the job through feedback from supervising PCPs. Scribes documented patient encounters, recording histories and findings on the physical exam and transcribing discussion of treatment plans and the PCP’s instructions to patients.
Continue to: The 14 scribes worked with 17 physician...
The 14 scribes worked with 17 physician and nurse practitioner PCPs beginning in July 2018. Participation by PCPs was voluntary; they received no compensation for participating in the scribe program. PCPs were not required to see additional patients to participate. PCPs who chose to work with a scribe were similar to those who declined a scribe, as regards gender, race, type of provider (MD or NP), tenure at the institution, and percentage of time in clinical work (see Table W-1).
The control group comprised providers who elected not to work with a scribe but who worked in the same clinics as the intervention providers.
Scribes were assigned to a PCP based on availability during the PCP’s scheduled hours and worked with 1 PCP throughout the intervention (except for 1 PCP who worked with 2 scribes). All PCPs worked with their scribe(s) part time; on average, 49% of intervention PCPs’ visits were scribed.
Inclusion and exclusion criteria
Because the first year at an institution is a learning period for PCPs, we excluded those who worked at the institution for < 1 year before the start of the scribe program (n = 12). Based on the extensive clinical experience of 1 PCP (WA) with scribes, we excluded the first 200 visits or 6 weeks (whichever occurred first) with a scribe among all scribed providers, to account for an initial learning period (n = 2202, of 15,372 scribed visits [14%]). We also excluded 2 providers who left during the pre-intervention period or were in the intervention period for < 1 month.
To ensure that we captured visits to providers with clinically significant exposure to scribes, we required scribed providers to have ≥ 20% of their visits scribed during the intervention period. To minimize the potential for contamination, we excluded nonscribed visits to scribed providers during the intervention period (n = 2211), because such nonscribed visits were largely due to visits outside the scribe’s scheduled time.
Continue to: Analysis
Analysis
We compared demographic characteristics for patients and providers using the chi-square test for categorical variables and the t test for continuous variables. We compared the change in outcomes from before implementation of scribes to during implementation of scribes among scribed providers, compared to nonscribed providers, using generalized estimating equations with robust standard errors to account for repeated measures (ie, multiple visits by the same patients) and the hierarchical nature of the data (ie, patients nested within providers). We then recalculated these estimates, controlling for patient demographics (age, gender, race, and ethnicity). We repeated these analyses for patients presenting for nonpreventive visits.
Results
Visit characteristics
We examined 271,768 visits, including 41,371 visits to 17 scribed providers and 230,397 visits to 78 nonscribed providers (Table 1). Patients were most likely to be female, > 21 years of age, have English as their language of care, and be non-White. Most visits were by established patients and were nonpreventive.
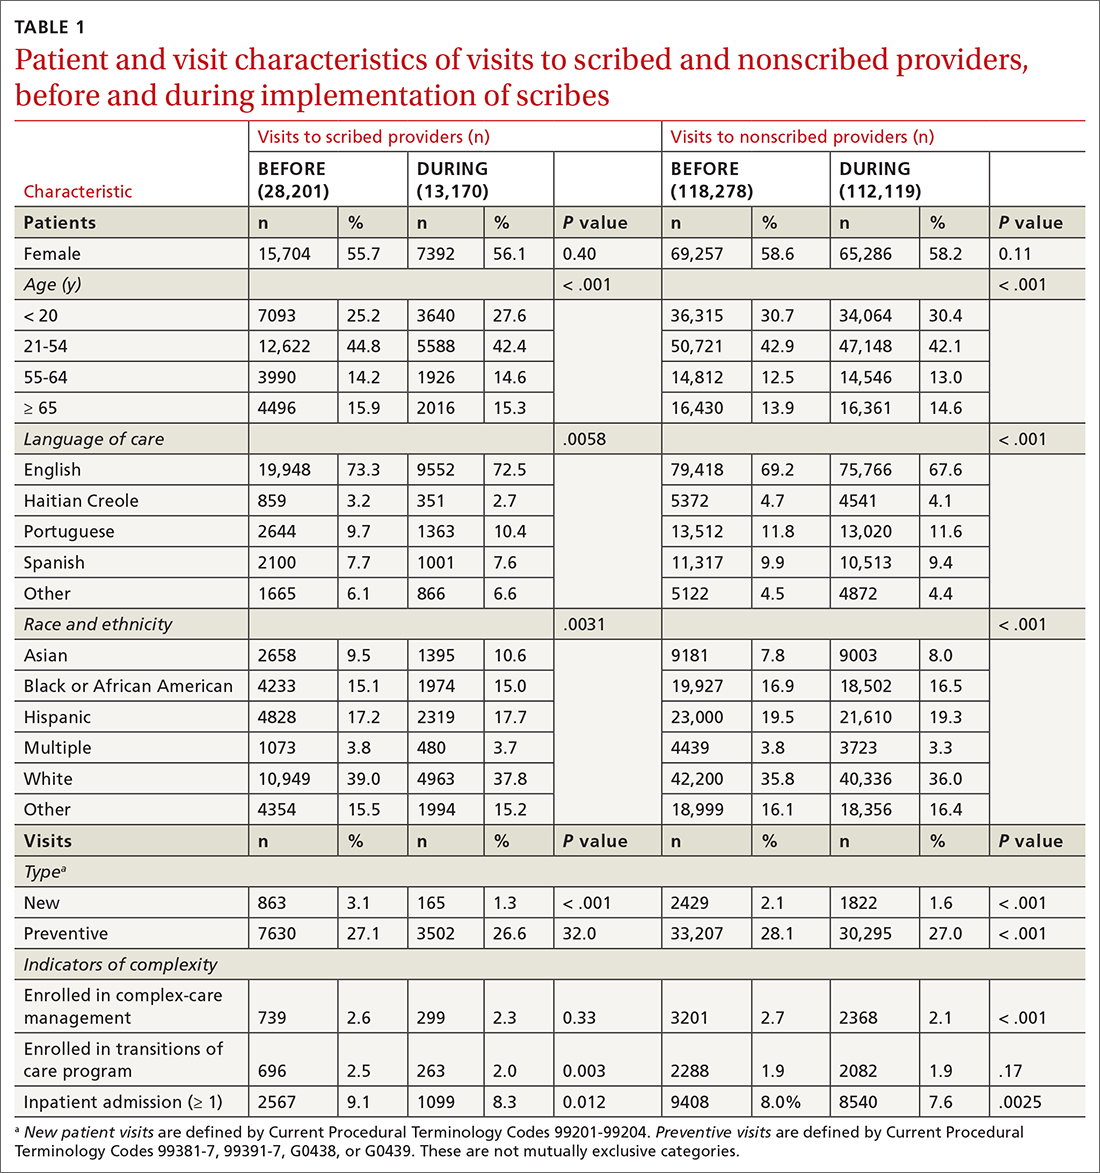
We noted no clinically significant differences in characteristics between visits with scribed providers and visits with nonscribed providers, and over time. Patient complexity measures, including care management enrollment and hospital admissions, were also similar between groups, and over time.
Billing measures
HCC coding. In 28.6% of visits, the decision-support tool identified at least 1 potential HCC code. Among these, the percentage of visits with at least 1 HCC code billed increased by 10.1 percentage points (from 3.9% before implementation of scribes to 14.0%) among scribed providers, compared to increasing by 6.5 percentage points (from 2.9% before implementation to 9.3%) among nonscribed providers (TABLE 2). Scribes were therefore associated with an additional 3.6 percentage-point increase in visits with at least 1 HCC code billed (P < .0001)—a difference that remained significant after adjusting for patient demographics (P < .0001).
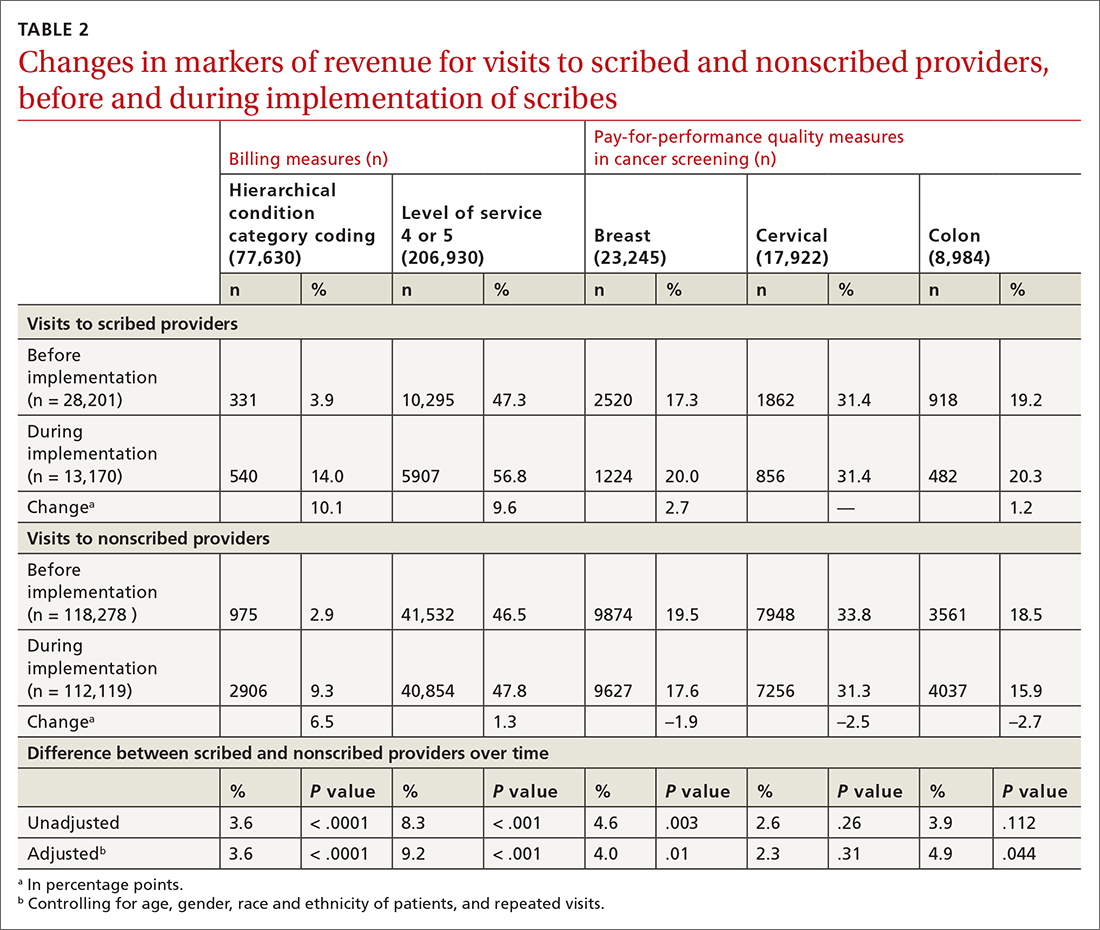
LOS coding. Scribed providers increased the number of visits billed as LOS 4 or 5 by 9.6 percentage points (from 47.3% before implementation to 56.8%); during the same period, nonscribed providers increased the number of visits billed as LOS 4 or 5 by 1.3 percentage points (from 46.5% before implementation to 47.8%) (TABLE 2). Scribes were therefore associated with an additional 8.3 percentage points in LOS 4 or 5 billing (P < .001) (TABLE 2). This difference remained significant after adjusting for patient demographics (P < .001).
Continue to: Pay-for-performance quality measures
Pay-for-performance quality measures
Breast cancer screening. Scribed providers increased the number of visits at which breast cancer screening was ordered by 2.7 percentage points (from 17.3% before implementation of scribes to 20.0%); during the same period, the number of visits at which breast cancer screening was ordered by nonscribed providers decreased by 1.9 percentage points (from 19.5% to 17.6%). Scribes were therefore associated with an increase of 4.6 percentage points in breast cancer screening orders, compared to nonscribed providers (P < .003) (TABLE 2). That difference remained significant after adjusting for patient demographics (P = .01).
Colon cancer screening. Similarly, scribed providers increased the number of visits at which colon cancer screening was ordered by 1.2 percentage points (from 19.2% before implementation of scribes to 20.3%); during the same period, the number of visits at which colon cancer screening was ordered by nonscribed providers decreased by 2.7 percentage points (from 18.5% to 15.9%) (P = .112). After adjusting for patient demographics, scribes were associated with an increase of 4.9 percentage points in colon cancer screening orders, compared to nonscribed providers (P = .044) (TABLE 2).
Cervical cancer screening. The rate at which cervical cancer screening was ordered did not change among scribed providers and decreased (by 2.5 percentage points) among nonscribed providers—a difference that was not statistically significant (P = .26).
Nonpreventive visits. Our findings overall did not change in analyses focused on nonpreventive visits, in which scribes were associated with an increase of 8.2 percentage points in LOS 4 or 5 billing (P < .001); an increase of 3.1 percentage points in HCC coding (P < .001); and an increase of 3.2 percentage points in breast cancer screening orders (P = .03) (TABLE 3). Although scribes were associated with an increase of 1.5 percentage points in cervical cancer screening orders and an increase of 3.1 percentage points in colon cancer screening orders, these increases did not reach statistical significance.
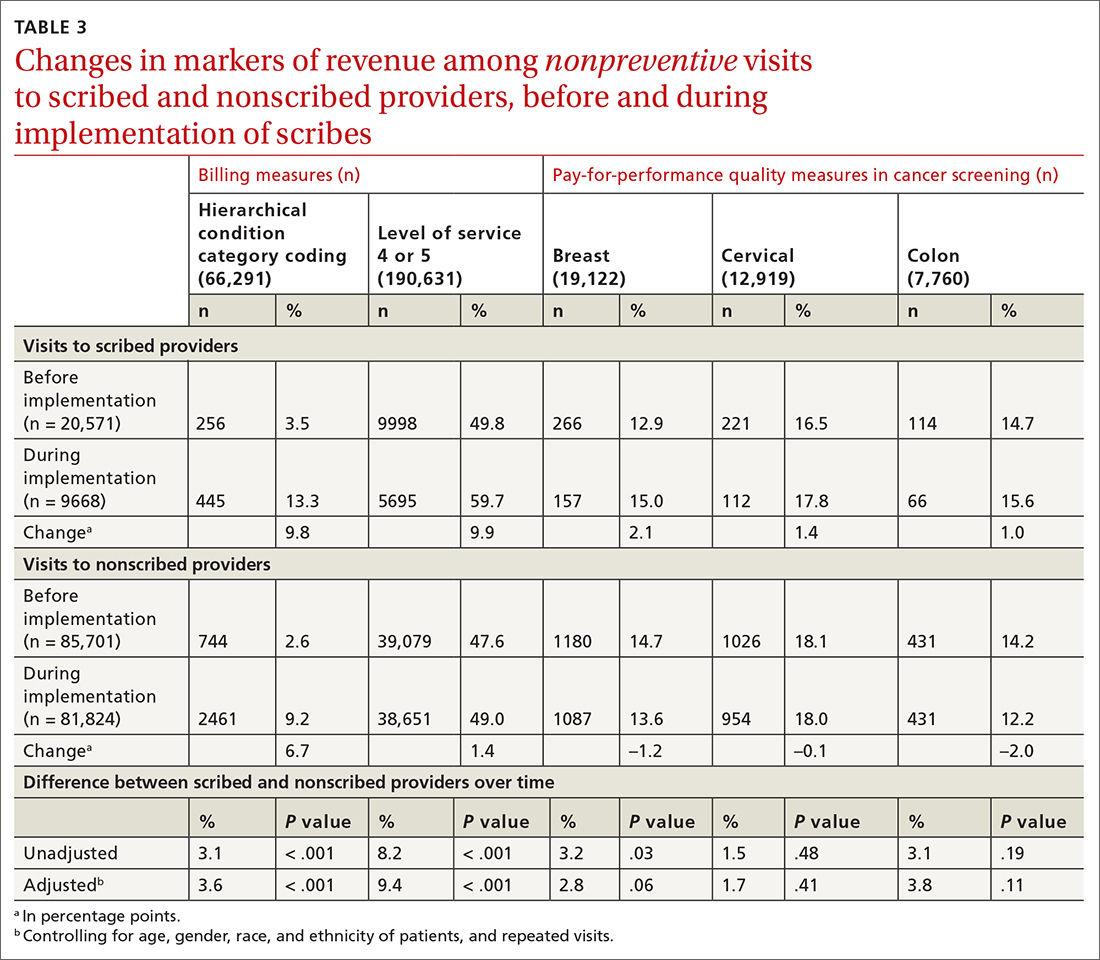
Discussion
We found that implementation of scribes is associated with (1) an increase in LOS coding and risk coding and (2) a higher frequency of addressing 2 of 3 pay-for-performance quality measures in primary care. In adjusted analyses in our study, and compared to nonscribed providers, scribes were associated with an additional 9.2 percentage points in LOS 4 or 5 billing; 3.6 percentage points in HCC coding; 4.0 percentage points in breast cancer screening orders; and 4.9 percentage points in colon cancer screening orders. Cervical cancer screening orders followed a similar pattern, with an increase of 2.3 percentage points in the adjusted screening order rate among scribed providers, compared to nonscribed providers, during implementation of scribes—although the increase was not significant. These findings did not change in analyses focused on nonpreventive visits.
Continue to: Our findings are consistent
Our findings are consistent with those of earlier studies. Prior examinations in ambulatory specialties found that scribes increased HCC coding,4 LOS billing,24 and pay-for-performance metrics.18 The only study to examine these areas in primary care found that scribes were associated with increased pay-for-performance measure documentation,20 a change that is necessary but insufficient to realize increased pay-for-performance revenue. Therefore, our study confirms, for the first time, that PCPs can better address pay-for-performance measures, LOS billing, and HCC coding when working with a scribe in primary care.
Demands on primary care visits are increasing.28 Physicians are required to provide more documentation; there is greater emphasis on PCPs meeting pay-for-performance measures; and there are more data in the EMR to review. In this context, addressing pay-for-performance measures and gaps in risk coding is likely to be increasingly challenging. Our study suggests that scribes might provide a mechanism to increase risk coding, LOS billing, and pay-for-performance measures, despite increased demands on primary care visits.
Increase in LOS billing. In the settings in which we work, a fee-for-service LOS 4 primary care visit generates, on average, $20 to $75 more in revenue than an LOS 3 visit. Using an average of $50 additional revenue for LOS 4 billing, we estimate that a full-time scribe is associated with roughly $7,000 in additional revenue annually. We arrived at this estimate using an average of 1500 visits at LOS ≤ 3 for every PCP full-time equivalent. A 9.2 percentage–point increase in LOS 4 billing would lead to roughly 140 additional LOS 4 visits, with each visit generating an additional $50 in revenue.
This analysis does not account for increased revenue associated with increased pay for HCC coding identified in our study.
Furthermore, in our conservative assumption, the entire increase in LOS billing was from level 3 to level 4; in fact, a small percentage of that increase would be from level 2 and another small percentage would be to level 5—both of which would generate additional revenue. Our assumption therefore underestimates the full financial value associated with scribes in the absence of increased patient volume. Nonetheless, the assumption suggests that increases in LOS billing offset a substantial percentage of a scribe’s salary.
Continue to: Limitations of this study
Limitations of this study. Our study should be interpreted in the context of several limitations:
- The study was conducted at 1 institution. Our findings might not be generalizable beyond this setting.
- The study measures the impact of scribes when providers work with scribes part time. Because providers who utilize a scribe for all, or nearly all, their visits are likely to use a scribe more efficiently, our study might underestimate the full impact of a scribe.
- In some settings, team members such as medical assistants are trained to assist with documentation and other responsibilities (such as closing care gaps) in addition to other patient care responsibilities.29-32 The extent to which our findings transfer to other models is unclear; studies comparing the impact of other models (which might provide even stronger outcomes) to the impact of medical scribes would be an interesting area for further research.
- In addition to the variability of models, there is likely variability in the quality and interactions of medical scribes, which might impact outcomes. We did not examine the qualities of scribes that led to outcomes in this study.
- We examined the impact of scribes on quality measure–ordering behaviors of providers, not on whether quality measures actually improved. Because scribes are associated with more face-to-face time with patients,27 they might allow for increased attention being paid by physicians to barriers to pay-for-performance measures (eg, patient education). This could increase the likelihood that patients complete a multitude of screenings, and thus improve adherence and follow-up. However, the impact of scribes on quality measures is a topic for future study.
Value beyond volume. Any limitations notwithstanding, our study suggests that scribes are associated with financial benefit in addition to the benefit of increased volume. Primary care practices should therefore consider the financial benefit of scribes independent of their ability to add patient volume. By recognizing this additive value, primary care practices might more fully capture the benefit of scribes, which might then allow practices to employ scribes with less demand to increase volume. This added support without increased volume would, in turn, likely reduce provider burnout (and the costly associated turnover) and increase patient satisfaction, leading to a synergistic financial benefit.
CORRESPONDENCE
Wayne Altman, MD, FAAFP, Tufts University School of Medicine, 200 Harrison Avenue, Boston, MA 02111; wayne. [email protected]
1. Gellert GA, Ramirez R, Webster SL. The rise of the medical scribe industry: implications for the advancement of electronic health records. JAMA. 2015;313:1315-1316. doi: 10.1001/jama.2014.1712
2. Cho J, Sanchez K, Ganor O, et al. Utilizing a physician scribe in a pediatric plastic surgical practice: a time-driven activity-based costing study. Plast Reconstr Surg Glob Open. 2019;7:e2460. doi: 10.1097/GOX.0000000000002460
3. Danak SU, Guetterman TC, Plegue MA, et al. Influence of scribes on patient-physician communication in primary care encounters: mixed methods study. JMIR Med Inform. 2019;7:e14797. doi: 10.2196/14797
4. Martel ML, Imdieke BH, Holm KM, et al. Developing a medical scribe program at an academic hospital: the Hennepin County Medical Center experience. Jt Comm J Qual Patient Saf. 2018;44:238-249. doi: 10.1016/j.jcjq.2018.01.001
5. Mishra P, Kiang JC, Grant RW. Association of medical scribes in primary care with physician workflow and patient experience. JAMA Intern Med. 2018;178:1467-1472. doi: 10.1001/ jamainternmed.2018.3956
6. Taylor KA, McQuilkin D, Hughes RG. Medical scribe impact on patient and provider experience. Mil Med. 2019;184:388-393. doi: 10.1093/milmed/usz030
7. Gidwani R, Nguyen C, Kofoed A, et al. Impact of scribes on physician satisfaction, patient satisfaction, and charting efficiency: a randomized controlled trial. Ann Fam Med. 2017;15:427-433. doi: 10.1370/afm.2122.
8. Heckman J, Mukamal KJ, Christensen A, et al. Medical scribes, provider and patient experience, and patient throughput: a trial in an academic general internal medicine practice. J Gen Intern Med. 2019;35:770-774. doi: 10.1007/s11606-019-05352-5
9. Koshy S, Feustel PJ, Hong M, et al. Scribes in an ambulatory urology practice: patient and physician satisfaction. J Urol. 2010;184:258-262. doi: 10.1016/j.juro.2010.03.040
10. McCormick BJ, Deal A, Borawski KM, et al. Implementation of medical scribes in an academic urology practice: an analysis of productivity, revenue, and satisfaction. World J Urol. 2018;36:1691-1697. doi: 10.1007/s00345-018-2293-8
11. Pozdnyakova A, Laiteerapong N, Volerman A, et al. Impact of medical scribes on physician and patient satisfaction in primary care. J Gen Intern Med. Jul 2018;33:1109-1115. doi: 10.1007/ s11606-018-4434-6
12. Bank AJ, Obetz C, Konrardy A, et al. Impact of scribes on patient interaction, productivity, and revenue in a cardiology clinic: a prospective study. Clinicoecon Outcomes Res. 2013;5:399-406. doi: 10.2147/CEOR.S49010
13. Danila MI, Melnick JA, Curtis JR, et al. Use of scribes for documentation assistance in rheumatology and endocrinology clinics: impact on clinic workflow and patient and physician satisfaction. J Clin Rheumatol. 2018;24:116-121. doi: 10.1097/ RHU.0000000000000620
14. Keefe KR, Levi JR, Brook CD. The impact of medical scribes on patient satisfaction in an academic otolaryngology clinic. Ann Otol Rhinol Laryngol. 2020;129:238-244. doi: 10.1177/0003489419884337
15. Lowry C, Orr K, Embry B, et al. Primary care scribes: writing a new story for safety net clinics. BMJ Open Qual. 2017;6:e000124. doi: 10.1136/bmjoq-2017-000124
16. Rohlfing ML, Keefe KR, Komshian SR, et al. Clinical scribes and their association with patient experience in the otolaryngology clinic. Laryngoscope. 2020;130:e134-e139. doi: 10.1002/ lary.28075
17. Arya R, Salovich DM, Ohman-Strickland P, et al. Impact of scribes on performance indicators in the emergency department. Acad Emerg Med. 2010;17:490-494. doi: 10.1111/j.1553- 2712.2010.00718.x
18. Ewelukwa O, Perez R, Carter LE, et al. Incorporation of scribes into the inflammatory bowel disease clinic improves quality of care and physician productivity. Inflamm Bowel Dis. 2018;24: 552-557. doi: 10.1093/ibd/izx078
19. Misra-Hebert AD, Yan C, Rothberg MB. Physician, scribe, and patient perspectives on clinical scribes in primary care. J Gen Intern Med. 2017;32:244. doi: 10.1007/s11606-016-3888-7
20. Platt J, Altman W. Can medical scribes improve quality measure documentation? J Fam Pract. Jun 2019;68:e1-e7.
21. Guglielmo WJ. What a scribe can do for you. Med Econ. Jan 6 2006;83:42,44-46.
22. Richmond M. Don’t use scribes for order entry. Emergency Medicine News. 2009;31:6-7. doi: 10.1097/01.EEM.0000360578.87654.cc
23. Schiff GD, Zucker L. Medical scribes: salvation for primary care or workaround for poor EMR usability? J Gen Intern Med. 2016;31:979-981. doi: 10.1007/s11606-016-3788-x
24. Bank AJ, Gage RM. Annual impact of scribes on physician productivity and revenue in a cardiology clinic. Clinicoecon Outcomes Res. 2015;7:489-495. doi: 10.2147/CEOR.S89329
25. Heaton HA, Castaneda-Guarderas A, Trotter ER, et al. Effect of scribes on patient throughput, revenue, and patient and provider satisfaction: a systematic review and meta-analysis. Am J Emerg Med. 2016;34:2018-2028. doi: 10.1016/j.ajem.2016.07.056
26. Earls ST, Savageau JA, Begley S, et al. Can scribes boost FPs’ efficiency and job satisfaction? J Fam Pract. 2017;66:206-214.
27. Zallman L, Finnegan K, Roll D, et al. Impact of medical scribes in primary care on productivity, face-to-face time, and patient comfort. J Am Board Fam Med. 2018;31:612-619. doi: 10.3122/ jabfm.2018.04.170325
28. Abbo ED, Zhang Q, Zelder M, et al. The increasing number of clinical items addressed during the time of adult primary care visits. J Gen Intern Med. 2008;23:2058-2065. doi: 10.1007/s11606- 008-0805-8
29. Ammann Howard K, Helé K, Salibi N, et al. Adapting the EHR scribe model to community health centers: the experience of Shasta Community Health Center’s pilot. Blue Shield of California Foundation; 2012. Accessed April 28, 2021. https:// blueshieldcafoundation.org/sites/default/files/publications/ downloadable/Shasta%20EHR%20Scribes%20Final%20Report.pdf
30. Anderson P, Halley MD. A new approach to making your doctor– nurse team more productive. Fam Pract Manag. 2008;15:35-40.
31. Blash L, Dower C, Chapman SA. University of Utah community clinics—medical assistant teams enhance patient-centered, physician-efficient care. Center for the Health Professions at UCSF; April 2011. Revised November 2011. Accessed April 28, 2021. https://healthforce.ucsf.edu/sites/healthforce.ucsf.edu/ files/publication-pdf/3.1%202011_04_University_of_Utah_Community_Clinics--Medical_Assistant_Teams_Enhance_PatientCentered_Physician-Efficient%20Care.pdf
32. Reuben DB, Knudsen J, Senelick W, et al. The effect of a physician partner program on physician efficiency and patient satisfaction. JAMA Intern Med. 2014;174:1190-1193. doi: 10.1001/ jamainternmed.2014.1315
ABSTRACT
Purpose Medical scribes are known to increase revenue by increasing visits to a medical practice. We examined whether medical scribes are associated with markers of financial benefit independent of increased visits.
Methods We conducted a pre- and post-observational study with a control group, examining changes in the percentage of visits (1) coded as level of service 4 or 5, (2) with at least 1 hierarchical condition category code billed, and (3) at which orders for 3 pay-for-performance quality measures (screening for breast, cervical, and colon cancer) were placed, if due. We looked at changes in outcomes among scribed providers and compared them to nonscribed providers. We used generalized estimating equations with robust standard errors to account for repeated measures and the hierarchical nature of the data, controlling for patient demographics.
Results We examined 41,371 visits to 17 scribed providers and 230,297 visits to 78 nonscribed providers. In adjusted analyses, and compared to nonscribed providers, scribes were associated with an increase of:
- Frutiger LT Std9.2 percentage points in level-of-service 4 or 5 billing (Frutiger LT StdP < .001)
- 3.6 percentage points in hierarchical condition category coding (Frutiger LT StdP < .001)
- 4.0 percentage points in breast cancer screening orders (Frutiger LT StdP = .01)
- 4.9 percentage points in colon cancer screening orders (Frutiger LT StdPFrutiger LT Std = .04).
Conclusions This study suggests that scribes are associated with financial benefit in addition to increased visit volume. Primary care practices should consider the financial benefit of scribes independent of their ability to add patient volume.
Increasingly, medical scribes are used in ambulatory care settings across the United States.1 Scribes are trained personnel who accompany providers during visits to provide documentation support and assist with other administrative tasks. They are associated with reduced documentation time for providers2-6 and improved provider satisfaction,7-11 without detriment to4-16 (or with possible improvement in17-20) patient satisfaction in ambulatory care settings. At the same time, concerns remain that using scribes might inhibit patient communication, harm clinical reasoning, reduce the effectiveness of clinical decision-support tools, and simply serve as a work-around to fixing inefficiencies in the electronic medical record (EMR).21-23
A driving force for the increased use of medical scribes is the expectation that they reduce the cost of providing care. Cost-efficiency is typically described as resulting from a reduction in physician time per patient seen, which allows increased patient volume and, in turn, drives increased physician productivity.2,8,10,18,24-27 Whether scribes result in cost savings remains unclear; some papers suggest that scribes are cost efficient in ambulatory care,2,10,18 while others have been unable to identify cost savings, particularly in primary care.4
One reason why scribes might not be associated with cost savings is that their financial benefit might be undercounted. Studies that focus on increased volume miss the opportunity to capture financial benefits conferred through mechanisms that are independent of seeing more patients:
- Scribes might help providers address and document more, and more complex, medical problems, allowing higher level-of-service (LOS) billing. For example, a provider chooses a lower LOS because they have insufficiently documented a visit to support a higher LOS; by assisting with documentation, the scribe might allow the provider to choose a higher LOS.
- Scribes might prompt a provider to use decision-support tools for risk coding (using appropriate medical codes to capture the patient’s level of medical complexity), thereby increasing reimbursement.
- Scribes might extend the time available during the visit for the provider to address pay-for-performance quality measures, such as cancer screening.
Continue to: Making visits count, not counting visits
Making visits count, not counting visits. In this study, we examined whether medical scribes in primary care are associated with improved markers of revenue that are independent of seeing more patients. Specifically, we examined whether scribes are associated with increased LOS coding, risk coding, and orders for pay-for-performance measures for all primary care visits and for nonpreventive primary care visits.
Methods
Design
This observational study compared the change in outcomes before implementation of scribes and during implementation of scribes, between scribed providers and nonscribed providers. We compared visits during the year prior to the implementation of scribes (July 2017–June 2018) with the year during their implementation (July 2018–2019).
The Cambridge Health Alliance Institutional Review Board considered this study exempt from review.
Setting
This study was conducted at a safety-net community academic health system that uses an EMR developed by Epic Systems [Verona, WI]. This EMR includes decision-support tools that prompt providers when pay-for-performance quality measures are due and when hierarchical condition category (HCC) codes—ie, specific diagnoses used by Medicare and other payers to reimburse providers for the complexity of their patients—might apply to the visit.
These EMR decision-support tools use algorithms that draw on age, gender, diagnoses that were billed previously or are on the problem list, laboratory findings, and prior imaging. They alert physicians when a patient is due for pay-for-performance quality measures, such as cancer screenings, and when HCC codes might be applicable.
Continue to: During the study period...
During the study period, the EMR decision-support tool for HCC coding underwent several changes designed to improve HCC coding. In addition, systematic changes to primary care visits took place, leading to an increase in the number of patients seen and screenings required.
Outcomes
We examined 2 categories of outcomes that confer financial benefit to many institutions: billing measures and pay-for-performance measures.
Billing measures included the percentage of visits (1) coded as LOS 4 or 5 and (2) with at least 1 HCC code billed (among those for which the decision-support tool identified at least 1 potential HCC code).
Pay-for-performance measures. We examined whether any of 3 pay-for-performance quality measures were addressed during the visit, selecting 3 that are commonly addressed by primary care providers (PCPs) and that require PCPs to sign an order for screening during a primary care visit: breast cancer (mammography order), cervical cancer (Papanicolaou smear order), and colon cancer (an order for fecal occult blood testing or colonoscopy).
Intervention
Scribes were employees of Cambridge Health Alliance who had recently graduated from college and were interested in a career as a health care professional. Scribes received 3 days of training on how to function effectively in their role; 1 day of training in EMR functionality; and 2 hours of training on decision-support tools for pay-for-performance quality measures and risk coding. Scribes continued learning on the job through feedback from supervising PCPs. Scribes documented patient encounters, recording histories and findings on the physical exam and transcribing discussion of treatment plans and the PCP’s instructions to patients.
Continue to: The 14 scribes worked with 17 physician...
The 14 scribes worked with 17 physician and nurse practitioner PCPs beginning in July 2018. Participation by PCPs was voluntary; they received no compensation for participating in the scribe program. PCPs were not required to see additional patients to participate. PCPs who chose to work with a scribe were similar to those who declined a scribe, as regards gender, race, type of provider (MD or NP), tenure at the institution, and percentage of time in clinical work (see Table W-1).
The control group comprised providers who elected not to work with a scribe but who worked in the same clinics as the intervention providers.
Scribes were assigned to a PCP based on availability during the PCP’s scheduled hours and worked with 1 PCP throughout the intervention (except for 1 PCP who worked with 2 scribes). All PCPs worked with their scribe(s) part time; on average, 49% of intervention PCPs’ visits were scribed.
Inclusion and exclusion criteria
Because the first year at an institution is a learning period for PCPs, we excluded those who worked at the institution for < 1 year before the start of the scribe program (n = 12). Based on the extensive clinical experience of 1 PCP (WA) with scribes, we excluded the first 200 visits or 6 weeks (whichever occurred first) with a scribe among all scribed providers, to account for an initial learning period (n = 2202, of 15,372 scribed visits [14%]). We also excluded 2 providers who left during the pre-intervention period or were in the intervention period for < 1 month.
To ensure that we captured visits to providers with clinically significant exposure to scribes, we required scribed providers to have ≥ 20% of their visits scribed during the intervention period. To minimize the potential for contamination, we excluded nonscribed visits to scribed providers during the intervention period (n = 2211), because such nonscribed visits were largely due to visits outside the scribe’s scheduled time.
Continue to: Analysis
Analysis
We compared demographic characteristics for patients and providers using the chi-square test for categorical variables and the t test for continuous variables. We compared the change in outcomes from before implementation of scribes to during implementation of scribes among scribed providers, compared to nonscribed providers, using generalized estimating equations with robust standard errors to account for repeated measures (ie, multiple visits by the same patients) and the hierarchical nature of the data (ie, patients nested within providers). We then recalculated these estimates, controlling for patient demographics (age, gender, race, and ethnicity). We repeated these analyses for patients presenting for nonpreventive visits.
Results
Visit characteristics
We examined 271,768 visits, including 41,371 visits to 17 scribed providers and 230,397 visits to 78 nonscribed providers (Table 1). Patients were most likely to be female, > 21 years of age, have English as their language of care, and be non-White. Most visits were by established patients and were nonpreventive.
We noted no clinically significant differences in characteristics between visits with scribed providers and visits with nonscribed providers, and over time. Patient complexity measures, including care management enrollment and hospital admissions, were also similar between groups, and over time.
Billing measures
HCC coding. In 28.6% of visits, the decision-support tool identified at least 1 potential HCC code. Among these, the percentage of visits with at least 1 HCC code billed increased by 10.1 percentage points (from 3.9% before implementation of scribes to 14.0%) among scribed providers, compared to increasing by 6.5 percentage points (from 2.9% before implementation to 9.3%) among nonscribed providers (TABLE 2). Scribes were therefore associated with an additional 3.6 percentage-point increase in visits with at least 1 HCC code billed (P < .0001)—a difference that remained significant after adjusting for patient demographics (P < .0001).
LOS coding. Scribed providers increased the number of visits billed as LOS 4 or 5 by 9.6 percentage points (from 47.3% before implementation to 56.8%); during the same period, nonscribed providers increased the number of visits billed as LOS 4 or 5 by 1.3 percentage points (from 46.5% before implementation to 47.8%) (TABLE 2). Scribes were therefore associated with an additional 8.3 percentage points in LOS 4 or 5 billing (P < .001) (TABLE 2). This difference remained significant after adjusting for patient demographics (P < .001).
Continue to: Pay-for-performance quality measures
Pay-for-performance quality measures
Breast cancer screening. Scribed providers increased the number of visits at which breast cancer screening was ordered by 2.7 percentage points (from 17.3% before implementation of scribes to 20.0%); during the same period, the number of visits at which breast cancer screening was ordered by nonscribed providers decreased by 1.9 percentage points (from 19.5% to 17.6%). Scribes were therefore associated with an increase of 4.6 percentage points in breast cancer screening orders, compared to nonscribed providers (P < .003) (TABLE 2). That difference remained significant after adjusting for patient demographics (P = .01).
Colon cancer screening. Similarly, scribed providers increased the number of visits at which colon cancer screening was ordered by 1.2 percentage points (from 19.2% before implementation of scribes to 20.3%); during the same period, the number of visits at which colon cancer screening was ordered by nonscribed providers decreased by 2.7 percentage points (from 18.5% to 15.9%) (P = .112). After adjusting for patient demographics, scribes were associated with an increase of 4.9 percentage points in colon cancer screening orders, compared to nonscribed providers (P = .044) (TABLE 2).
Cervical cancer screening. The rate at which cervical cancer screening was ordered did not change among scribed providers and decreased (by 2.5 percentage points) among nonscribed providers—a difference that was not statistically significant (P = .26).
Nonpreventive visits. Our findings overall did not change in analyses focused on nonpreventive visits, in which scribes were associated with an increase of 8.2 percentage points in LOS 4 or 5 billing (P < .001); an increase of 3.1 percentage points in HCC coding (P < .001); and an increase of 3.2 percentage points in breast cancer screening orders (P = .03) (TABLE 3). Although scribes were associated with an increase of 1.5 percentage points in cervical cancer screening orders and an increase of 3.1 percentage points in colon cancer screening orders, these increases did not reach statistical significance.
Discussion
We found that implementation of scribes is associated with (1) an increase in LOS coding and risk coding and (2) a higher frequency of addressing 2 of 3 pay-for-performance quality measures in primary care. In adjusted analyses in our study, and compared to nonscribed providers, scribes were associated with an additional 9.2 percentage points in LOS 4 or 5 billing; 3.6 percentage points in HCC coding; 4.0 percentage points in breast cancer screening orders; and 4.9 percentage points in colon cancer screening orders. Cervical cancer screening orders followed a similar pattern, with an increase of 2.3 percentage points in the adjusted screening order rate among scribed providers, compared to nonscribed providers, during implementation of scribes—although the increase was not significant. These findings did not change in analyses focused on nonpreventive visits.
Continue to: Our findings are consistent
Our findings are consistent with those of earlier studies. Prior examinations in ambulatory specialties found that scribes increased HCC coding,4 LOS billing,24 and pay-for-performance metrics.18 The only study to examine these areas in primary care found that scribes were associated with increased pay-for-performance measure documentation,20 a change that is necessary but insufficient to realize increased pay-for-performance revenue. Therefore, our study confirms, for the first time, that PCPs can better address pay-for-performance measures, LOS billing, and HCC coding when working with a scribe in primary care.
Demands on primary care visits are increasing.28 Physicians are required to provide more documentation; there is greater emphasis on PCPs meeting pay-for-performance measures; and there are more data in the EMR to review. In this context, addressing pay-for-performance measures and gaps in risk coding is likely to be increasingly challenging. Our study suggests that scribes might provide a mechanism to increase risk coding, LOS billing, and pay-for-performance measures, despite increased demands on primary care visits.
Increase in LOS billing. In the settings in which we work, a fee-for-service LOS 4 primary care visit generates, on average, $20 to $75 more in revenue than an LOS 3 visit. Using an average of $50 additional revenue for LOS 4 billing, we estimate that a full-time scribe is associated with roughly $7,000 in additional revenue annually. We arrived at this estimate using an average of 1500 visits at LOS ≤ 3 for every PCP full-time equivalent. A 9.2 percentage–point increase in LOS 4 billing would lead to roughly 140 additional LOS 4 visits, with each visit generating an additional $50 in revenue.
This analysis does not account for increased revenue associated with increased pay for HCC coding identified in our study.
Furthermore, in our conservative assumption, the entire increase in LOS billing was from level 3 to level 4; in fact, a small percentage of that increase would be from level 2 and another small percentage would be to level 5—both of which would generate additional revenue. Our assumption therefore underestimates the full financial value associated with scribes in the absence of increased patient volume. Nonetheless, the assumption suggests that increases in LOS billing offset a substantial percentage of a scribe’s salary.
Continue to: Limitations of this study
Limitations of this study. Our study should be interpreted in the context of several limitations:
- The study was conducted at 1 institution. Our findings might not be generalizable beyond this setting.
- The study measures the impact of scribes when providers work with scribes part time. Because providers who utilize a scribe for all, or nearly all, their visits are likely to use a scribe more efficiently, our study might underestimate the full impact of a scribe.
- In some settings, team members such as medical assistants are trained to assist with documentation and other responsibilities (such as closing care gaps) in addition to other patient care responsibilities.29-32 The extent to which our findings transfer to other models is unclear; studies comparing the impact of other models (which might provide even stronger outcomes) to the impact of medical scribes would be an interesting area for further research.
- In addition to the variability of models, there is likely variability in the quality and interactions of medical scribes, which might impact outcomes. We did not examine the qualities of scribes that led to outcomes in this study.
- We examined the impact of scribes on quality measure–ordering behaviors of providers, not on whether quality measures actually improved. Because scribes are associated with more face-to-face time with patients,27 they might allow for increased attention being paid by physicians to barriers to pay-for-performance measures (eg, patient education). This could increase the likelihood that patients complete a multitude of screenings, and thus improve adherence and follow-up. However, the impact of scribes on quality measures is a topic for future study.
Value beyond volume. Any limitations notwithstanding, our study suggests that scribes are associated with financial benefit in addition to the benefit of increased volume. Primary care practices should therefore consider the financial benefit of scribes independent of their ability to add patient volume. By recognizing this additive value, primary care practices might more fully capture the benefit of scribes, which might then allow practices to employ scribes with less demand to increase volume. This added support without increased volume would, in turn, likely reduce provider burnout (and the costly associated turnover) and increase patient satisfaction, leading to a synergistic financial benefit.
CORRESPONDENCE
Wayne Altman, MD, FAAFP, Tufts University School of Medicine, 200 Harrison Avenue, Boston, MA 02111; wayne. [email protected]
ABSTRACT
Purpose Medical scribes are known to increase revenue by increasing visits to a medical practice. We examined whether medical scribes are associated with markers of financial benefit independent of increased visits.
Methods We conducted a pre- and post-observational study with a control group, examining changes in the percentage of visits (1) coded as level of service 4 or 5, (2) with at least 1 hierarchical condition category code billed, and (3) at which orders for 3 pay-for-performance quality measures (screening for breast, cervical, and colon cancer) were placed, if due. We looked at changes in outcomes among scribed providers and compared them to nonscribed providers. We used generalized estimating equations with robust standard errors to account for repeated measures and the hierarchical nature of the data, controlling for patient demographics.
Results We examined 41,371 visits to 17 scribed providers and 230,297 visits to 78 nonscribed providers. In adjusted analyses, and compared to nonscribed providers, scribes were associated with an increase of:
- Frutiger LT Std9.2 percentage points in level-of-service 4 or 5 billing (Frutiger LT StdP < .001)
- 3.6 percentage points in hierarchical condition category coding (Frutiger LT StdP < .001)
- 4.0 percentage points in breast cancer screening orders (Frutiger LT StdP = .01)
- 4.9 percentage points in colon cancer screening orders (Frutiger LT StdPFrutiger LT Std = .04).
Conclusions This study suggests that scribes are associated with financial benefit in addition to increased visit volume. Primary care practices should consider the financial benefit of scribes independent of their ability to add patient volume.
Increasingly, medical scribes are used in ambulatory care settings across the United States.1 Scribes are trained personnel who accompany providers during visits to provide documentation support and assist with other administrative tasks. They are associated with reduced documentation time for providers2-6 and improved provider satisfaction,7-11 without detriment to4-16 (or with possible improvement in17-20) patient satisfaction in ambulatory care settings. At the same time, concerns remain that using scribes might inhibit patient communication, harm clinical reasoning, reduce the effectiveness of clinical decision-support tools, and simply serve as a work-around to fixing inefficiencies in the electronic medical record (EMR).21-23
A driving force for the increased use of medical scribes is the expectation that they reduce the cost of providing care. Cost-efficiency is typically described as resulting from a reduction in physician time per patient seen, which allows increased patient volume and, in turn, drives increased physician productivity.2,8,10,18,24-27 Whether scribes result in cost savings remains unclear; some papers suggest that scribes are cost efficient in ambulatory care,2,10,18 while others have been unable to identify cost savings, particularly in primary care.4
One reason why scribes might not be associated with cost savings is that their financial benefit might be undercounted. Studies that focus on increased volume miss the opportunity to capture financial benefits conferred through mechanisms that are independent of seeing more patients:
- Scribes might help providers address and document more, and more complex, medical problems, allowing higher level-of-service (LOS) billing. For example, a provider chooses a lower LOS because they have insufficiently documented a visit to support a higher LOS; by assisting with documentation, the scribe might allow the provider to choose a higher LOS.
- Scribes might prompt a provider to use decision-support tools for risk coding (using appropriate medical codes to capture the patient’s level of medical complexity), thereby increasing reimbursement.
- Scribes might extend the time available during the visit for the provider to address pay-for-performance quality measures, such as cancer screening.
Continue to: Making visits count, not counting visits
Making visits count, not counting visits. In this study, we examined whether medical scribes in primary care are associated with improved markers of revenue that are independent of seeing more patients. Specifically, we examined whether scribes are associated with increased LOS coding, risk coding, and orders for pay-for-performance measures for all primary care visits and for nonpreventive primary care visits.
Methods
Design
This observational study compared the change in outcomes before implementation of scribes and during implementation of scribes, between scribed providers and nonscribed providers. We compared visits during the year prior to the implementation of scribes (July 2017–June 2018) with the year during their implementation (July 2018–2019).
The Cambridge Health Alliance Institutional Review Board considered this study exempt from review.
Setting
This study was conducted at a safety-net community academic health system that uses an EMR developed by Epic Systems [Verona, WI]. This EMR includes decision-support tools that prompt providers when pay-for-performance quality measures are due and when hierarchical condition category (HCC) codes—ie, specific diagnoses used by Medicare and other payers to reimburse providers for the complexity of their patients—might apply to the visit.
These EMR decision-support tools use algorithms that draw on age, gender, diagnoses that were billed previously or are on the problem list, laboratory findings, and prior imaging. They alert physicians when a patient is due for pay-for-performance quality measures, such as cancer screenings, and when HCC codes might be applicable.
Continue to: During the study period...
During the study period, the EMR decision-support tool for HCC coding underwent several changes designed to improve HCC coding. In addition, systematic changes to primary care visits took place, leading to an increase in the number of patients seen and screenings required.
Outcomes
We examined 2 categories of outcomes that confer financial benefit to many institutions: billing measures and pay-for-performance measures.
Billing measures included the percentage of visits (1) coded as LOS 4 or 5 and (2) with at least 1 HCC code billed (among those for which the decision-support tool identified at least 1 potential HCC code).
Pay-for-performance measures. We examined whether any of 3 pay-for-performance quality measures were addressed during the visit, selecting 3 that are commonly addressed by primary care providers (PCPs) and that require PCPs to sign an order for screening during a primary care visit: breast cancer (mammography order), cervical cancer (Papanicolaou smear order), and colon cancer (an order for fecal occult blood testing or colonoscopy).
Intervention
Scribes were employees of Cambridge Health Alliance who had recently graduated from college and were interested in a career as a health care professional. Scribes received 3 days of training on how to function effectively in their role; 1 day of training in EMR functionality; and 2 hours of training on decision-support tools for pay-for-performance quality measures and risk coding. Scribes continued learning on the job through feedback from supervising PCPs. Scribes documented patient encounters, recording histories and findings on the physical exam and transcribing discussion of treatment plans and the PCP’s instructions to patients.
Continue to: The 14 scribes worked with 17 physician...
The 14 scribes worked with 17 physician and nurse practitioner PCPs beginning in July 2018. Participation by PCPs was voluntary; they received no compensation for participating in the scribe program. PCPs were not required to see additional patients to participate. PCPs who chose to work with a scribe were similar to those who declined a scribe, as regards gender, race, type of provider (MD or NP), tenure at the institution, and percentage of time in clinical work (see Table W-1).
The control group comprised providers who elected not to work with a scribe but who worked in the same clinics as the intervention providers.
Scribes were assigned to a PCP based on availability during the PCP’s scheduled hours and worked with 1 PCP throughout the intervention (except for 1 PCP who worked with 2 scribes). All PCPs worked with their scribe(s) part time; on average, 49% of intervention PCPs’ visits were scribed.
Inclusion and exclusion criteria
Because the first year at an institution is a learning period for PCPs, we excluded those who worked at the institution for < 1 year before the start of the scribe program (n = 12). Based on the extensive clinical experience of 1 PCP (WA) with scribes, we excluded the first 200 visits or 6 weeks (whichever occurred first) with a scribe among all scribed providers, to account for an initial learning period (n = 2202, of 15,372 scribed visits [14%]). We also excluded 2 providers who left during the pre-intervention period or were in the intervention period for < 1 month.
To ensure that we captured visits to providers with clinically significant exposure to scribes, we required scribed providers to have ≥ 20% of their visits scribed during the intervention period. To minimize the potential for contamination, we excluded nonscribed visits to scribed providers during the intervention period (n = 2211), because such nonscribed visits were largely due to visits outside the scribe’s scheduled time.
Continue to: Analysis
Analysis
We compared demographic characteristics for patients and providers using the chi-square test for categorical variables and the t test for continuous variables. We compared the change in outcomes from before implementation of scribes to during implementation of scribes among scribed providers, compared to nonscribed providers, using generalized estimating equations with robust standard errors to account for repeated measures (ie, multiple visits by the same patients) and the hierarchical nature of the data (ie, patients nested within providers). We then recalculated these estimates, controlling for patient demographics (age, gender, race, and ethnicity). We repeated these analyses for patients presenting for nonpreventive visits.
Results
Visit characteristics
We examined 271,768 visits, including 41,371 visits to 17 scribed providers and 230,397 visits to 78 nonscribed providers (Table 1). Patients were most likely to be female, > 21 years of age, have English as their language of care, and be non-White. Most visits were by established patients and were nonpreventive.
We noted no clinically significant differences in characteristics between visits with scribed providers and visits with nonscribed providers, and over time. Patient complexity measures, including care management enrollment and hospital admissions, were also similar between groups, and over time.
Billing measures
HCC coding. In 28.6% of visits, the decision-support tool identified at least 1 potential HCC code. Among these, the percentage of visits with at least 1 HCC code billed increased by 10.1 percentage points (from 3.9% before implementation of scribes to 14.0%) among scribed providers, compared to increasing by 6.5 percentage points (from 2.9% before implementation to 9.3%) among nonscribed providers (TABLE 2). Scribes were therefore associated with an additional 3.6 percentage-point increase in visits with at least 1 HCC code billed (P < .0001)—a difference that remained significant after adjusting for patient demographics (P < .0001).
LOS coding. Scribed providers increased the number of visits billed as LOS 4 or 5 by 9.6 percentage points (from 47.3% before implementation to 56.8%); during the same period, nonscribed providers increased the number of visits billed as LOS 4 or 5 by 1.3 percentage points (from 46.5% before implementation to 47.8%) (TABLE 2). Scribes were therefore associated with an additional 8.3 percentage points in LOS 4 or 5 billing (P < .001) (TABLE 2). This difference remained significant after adjusting for patient demographics (P < .001).
Continue to: Pay-for-performance quality measures
Pay-for-performance quality measures
Breast cancer screening. Scribed providers increased the number of visits at which breast cancer screening was ordered by 2.7 percentage points (from 17.3% before implementation of scribes to 20.0%); during the same period, the number of visits at which breast cancer screening was ordered by nonscribed providers decreased by 1.9 percentage points (from 19.5% to 17.6%). Scribes were therefore associated with an increase of 4.6 percentage points in breast cancer screening orders, compared to nonscribed providers (P < .003) (TABLE 2). That difference remained significant after adjusting for patient demographics (P = .01).
Colon cancer screening. Similarly, scribed providers increased the number of visits at which colon cancer screening was ordered by 1.2 percentage points (from 19.2% before implementation of scribes to 20.3%); during the same period, the number of visits at which colon cancer screening was ordered by nonscribed providers decreased by 2.7 percentage points (from 18.5% to 15.9%) (P = .112). After adjusting for patient demographics, scribes were associated with an increase of 4.9 percentage points in colon cancer screening orders, compared to nonscribed providers (P = .044) (TABLE 2).
Cervical cancer screening. The rate at which cervical cancer screening was ordered did not change among scribed providers and decreased (by 2.5 percentage points) among nonscribed providers—a difference that was not statistically significant (P = .26).
Nonpreventive visits. Our findings overall did not change in analyses focused on nonpreventive visits, in which scribes were associated with an increase of 8.2 percentage points in LOS 4 or 5 billing (P < .001); an increase of 3.1 percentage points in HCC coding (P < .001); and an increase of 3.2 percentage points in breast cancer screening orders (P = .03) (TABLE 3). Although scribes were associated with an increase of 1.5 percentage points in cervical cancer screening orders and an increase of 3.1 percentage points in colon cancer screening orders, these increases did not reach statistical significance.
Discussion
We found that implementation of scribes is associated with (1) an increase in LOS coding and risk coding and (2) a higher frequency of addressing 2 of 3 pay-for-performance quality measures in primary care. In adjusted analyses in our study, and compared to nonscribed providers, scribes were associated with an additional 9.2 percentage points in LOS 4 or 5 billing; 3.6 percentage points in HCC coding; 4.0 percentage points in breast cancer screening orders; and 4.9 percentage points in colon cancer screening orders. Cervical cancer screening orders followed a similar pattern, with an increase of 2.3 percentage points in the adjusted screening order rate among scribed providers, compared to nonscribed providers, during implementation of scribes—although the increase was not significant. These findings did not change in analyses focused on nonpreventive visits.
Continue to: Our findings are consistent
Our findings are consistent with those of earlier studies. Prior examinations in ambulatory specialties found that scribes increased HCC coding,4 LOS billing,24 and pay-for-performance metrics.18 The only study to examine these areas in primary care found that scribes were associated with increased pay-for-performance measure documentation,20 a change that is necessary but insufficient to realize increased pay-for-performance revenue. Therefore, our study confirms, for the first time, that PCPs can better address pay-for-performance measures, LOS billing, and HCC coding when working with a scribe in primary care.
Demands on primary care visits are increasing.28 Physicians are required to provide more documentation; there is greater emphasis on PCPs meeting pay-for-performance measures; and there are more data in the EMR to review. In this context, addressing pay-for-performance measures and gaps in risk coding is likely to be increasingly challenging. Our study suggests that scribes might provide a mechanism to increase risk coding, LOS billing, and pay-for-performance measures, despite increased demands on primary care visits.
Increase in LOS billing. In the settings in which we work, a fee-for-service LOS 4 primary care visit generates, on average, $20 to $75 more in revenue than an LOS 3 visit. Using an average of $50 additional revenue for LOS 4 billing, we estimate that a full-time scribe is associated with roughly $7,000 in additional revenue annually. We arrived at this estimate using an average of 1500 visits at LOS ≤ 3 for every PCP full-time equivalent. A 9.2 percentage–point increase in LOS 4 billing would lead to roughly 140 additional LOS 4 visits, with each visit generating an additional $50 in revenue.
This analysis does not account for increased revenue associated with increased pay for HCC coding identified in our study.
Furthermore, in our conservative assumption, the entire increase in LOS billing was from level 3 to level 4; in fact, a small percentage of that increase would be from level 2 and another small percentage would be to level 5—both of which would generate additional revenue. Our assumption therefore underestimates the full financial value associated with scribes in the absence of increased patient volume. Nonetheless, the assumption suggests that increases in LOS billing offset a substantial percentage of a scribe’s salary.
Continue to: Limitations of this study
Limitations of this study. Our study should be interpreted in the context of several limitations:
- The study was conducted at 1 institution. Our findings might not be generalizable beyond this setting.
- The study measures the impact of scribes when providers work with scribes part time. Because providers who utilize a scribe for all, or nearly all, their visits are likely to use a scribe more efficiently, our study might underestimate the full impact of a scribe.
- In some settings, team members such as medical assistants are trained to assist with documentation and other responsibilities (such as closing care gaps) in addition to other patient care responsibilities.29-32 The extent to which our findings transfer to other models is unclear; studies comparing the impact of other models (which might provide even stronger outcomes) to the impact of medical scribes would be an interesting area for further research.
- In addition to the variability of models, there is likely variability in the quality and interactions of medical scribes, which might impact outcomes. We did not examine the qualities of scribes that led to outcomes in this study.
- We examined the impact of scribes on quality measure–ordering behaviors of providers, not on whether quality measures actually improved. Because scribes are associated with more face-to-face time with patients,27 they might allow for increased attention being paid by physicians to barriers to pay-for-performance measures (eg, patient education). This could increase the likelihood that patients complete a multitude of screenings, and thus improve adherence and follow-up. However, the impact of scribes on quality measures is a topic for future study.
Value beyond volume. Any limitations notwithstanding, our study suggests that scribes are associated with financial benefit in addition to the benefit of increased volume. Primary care practices should therefore consider the financial benefit of scribes independent of their ability to add patient volume. By recognizing this additive value, primary care practices might more fully capture the benefit of scribes, which might then allow practices to employ scribes with less demand to increase volume. This added support without increased volume would, in turn, likely reduce provider burnout (and the costly associated turnover) and increase patient satisfaction, leading to a synergistic financial benefit.
CORRESPONDENCE
Wayne Altman, MD, FAAFP, Tufts University School of Medicine, 200 Harrison Avenue, Boston, MA 02111; wayne. [email protected]
1. Gellert GA, Ramirez R, Webster SL. The rise of the medical scribe industry: implications for the advancement of electronic health records. JAMA. 2015;313:1315-1316. doi: 10.1001/jama.2014.1712
2. Cho J, Sanchez K, Ganor O, et al. Utilizing a physician scribe in a pediatric plastic surgical practice: a time-driven activity-based costing study. Plast Reconstr Surg Glob Open. 2019;7:e2460. doi: 10.1097/GOX.0000000000002460
3. Danak SU, Guetterman TC, Plegue MA, et al. Influence of scribes on patient-physician communication in primary care encounters: mixed methods study. JMIR Med Inform. 2019;7:e14797. doi: 10.2196/14797
4. Martel ML, Imdieke BH, Holm KM, et al. Developing a medical scribe program at an academic hospital: the Hennepin County Medical Center experience. Jt Comm J Qual Patient Saf. 2018;44:238-249. doi: 10.1016/j.jcjq.2018.01.001
5. Mishra P, Kiang JC, Grant RW. Association of medical scribes in primary care with physician workflow and patient experience. JAMA Intern Med. 2018;178:1467-1472. doi: 10.1001/ jamainternmed.2018.3956
6. Taylor KA, McQuilkin D, Hughes RG. Medical scribe impact on patient and provider experience. Mil Med. 2019;184:388-393. doi: 10.1093/milmed/usz030
7. Gidwani R, Nguyen C, Kofoed A, et al. Impact of scribes on physician satisfaction, patient satisfaction, and charting efficiency: a randomized controlled trial. Ann Fam Med. 2017;15:427-433. doi: 10.1370/afm.2122.
8. Heckman J, Mukamal KJ, Christensen A, et al. Medical scribes, provider and patient experience, and patient throughput: a trial in an academic general internal medicine practice. J Gen Intern Med. 2019;35:770-774. doi: 10.1007/s11606-019-05352-5
9. Koshy S, Feustel PJ, Hong M, et al. Scribes in an ambulatory urology practice: patient and physician satisfaction. J Urol. 2010;184:258-262. doi: 10.1016/j.juro.2010.03.040
10. McCormick BJ, Deal A, Borawski KM, et al. Implementation of medical scribes in an academic urology practice: an analysis of productivity, revenue, and satisfaction. World J Urol. 2018;36:1691-1697. doi: 10.1007/s00345-018-2293-8
11. Pozdnyakova A, Laiteerapong N, Volerman A, et al. Impact of medical scribes on physician and patient satisfaction in primary care. J Gen Intern Med. Jul 2018;33:1109-1115. doi: 10.1007/ s11606-018-4434-6
12. Bank AJ, Obetz C, Konrardy A, et al. Impact of scribes on patient interaction, productivity, and revenue in a cardiology clinic: a prospective study. Clinicoecon Outcomes Res. 2013;5:399-406. doi: 10.2147/CEOR.S49010
13. Danila MI, Melnick JA, Curtis JR, et al. Use of scribes for documentation assistance in rheumatology and endocrinology clinics: impact on clinic workflow and patient and physician satisfaction. J Clin Rheumatol. 2018;24:116-121. doi: 10.1097/ RHU.0000000000000620
14. Keefe KR, Levi JR, Brook CD. The impact of medical scribes on patient satisfaction in an academic otolaryngology clinic. Ann Otol Rhinol Laryngol. 2020;129:238-244. doi: 10.1177/0003489419884337
15. Lowry C, Orr K, Embry B, et al. Primary care scribes: writing a new story for safety net clinics. BMJ Open Qual. 2017;6:e000124. doi: 10.1136/bmjoq-2017-000124
16. Rohlfing ML, Keefe KR, Komshian SR, et al. Clinical scribes and their association with patient experience in the otolaryngology clinic. Laryngoscope. 2020;130:e134-e139. doi: 10.1002/ lary.28075
17. Arya R, Salovich DM, Ohman-Strickland P, et al. Impact of scribes on performance indicators in the emergency department. Acad Emerg Med. 2010;17:490-494. doi: 10.1111/j.1553- 2712.2010.00718.x
18. Ewelukwa O, Perez R, Carter LE, et al. Incorporation of scribes into the inflammatory bowel disease clinic improves quality of care and physician productivity. Inflamm Bowel Dis. 2018;24: 552-557. doi: 10.1093/ibd/izx078
19. Misra-Hebert AD, Yan C, Rothberg MB. Physician, scribe, and patient perspectives on clinical scribes in primary care. J Gen Intern Med. 2017;32:244. doi: 10.1007/s11606-016-3888-7
20. Platt J, Altman W. Can medical scribes improve quality measure documentation? J Fam Pract. Jun 2019;68:e1-e7.
21. Guglielmo WJ. What a scribe can do for you. Med Econ. Jan 6 2006;83:42,44-46.
22. Richmond M. Don’t use scribes for order entry. Emergency Medicine News. 2009;31:6-7. doi: 10.1097/01.EEM.0000360578.87654.cc
23. Schiff GD, Zucker L. Medical scribes: salvation for primary care or workaround for poor EMR usability? J Gen Intern Med. 2016;31:979-981. doi: 10.1007/s11606-016-3788-x
24. Bank AJ, Gage RM. Annual impact of scribes on physician productivity and revenue in a cardiology clinic. Clinicoecon Outcomes Res. 2015;7:489-495. doi: 10.2147/CEOR.S89329
25. Heaton HA, Castaneda-Guarderas A, Trotter ER, et al. Effect of scribes on patient throughput, revenue, and patient and provider satisfaction: a systematic review and meta-analysis. Am J Emerg Med. 2016;34:2018-2028. doi: 10.1016/j.ajem.2016.07.056
26. Earls ST, Savageau JA, Begley S, et al. Can scribes boost FPs’ efficiency and job satisfaction? J Fam Pract. 2017;66:206-214.
27. Zallman L, Finnegan K, Roll D, et al. Impact of medical scribes in primary care on productivity, face-to-face time, and patient comfort. J Am Board Fam Med. 2018;31:612-619. doi: 10.3122/ jabfm.2018.04.170325
28. Abbo ED, Zhang Q, Zelder M, et al. The increasing number of clinical items addressed during the time of adult primary care visits. J Gen Intern Med. 2008;23:2058-2065. doi: 10.1007/s11606- 008-0805-8
29. Ammann Howard K, Helé K, Salibi N, et al. Adapting the EHR scribe model to community health centers: the experience of Shasta Community Health Center’s pilot. Blue Shield of California Foundation; 2012. Accessed April 28, 2021. https:// blueshieldcafoundation.org/sites/default/files/publications/ downloadable/Shasta%20EHR%20Scribes%20Final%20Report.pdf
30. Anderson P, Halley MD. A new approach to making your doctor– nurse team more productive. Fam Pract Manag. 2008;15:35-40.
31. Blash L, Dower C, Chapman SA. University of Utah community clinics—medical assistant teams enhance patient-centered, physician-efficient care. Center for the Health Professions at UCSF; April 2011. Revised November 2011. Accessed April 28, 2021. https://healthforce.ucsf.edu/sites/healthforce.ucsf.edu/ files/publication-pdf/3.1%202011_04_University_of_Utah_Community_Clinics--Medical_Assistant_Teams_Enhance_PatientCentered_Physician-Efficient%20Care.pdf
32. Reuben DB, Knudsen J, Senelick W, et al. The effect of a physician partner program on physician efficiency and patient satisfaction. JAMA Intern Med. 2014;174:1190-1193. doi: 10.1001/ jamainternmed.2014.1315
1. Gellert GA, Ramirez R, Webster SL. The rise of the medical scribe industry: implications for the advancement of electronic health records. JAMA. 2015;313:1315-1316. doi: 10.1001/jama.2014.1712
2. Cho J, Sanchez K, Ganor O, et al. Utilizing a physician scribe in a pediatric plastic surgical practice: a time-driven activity-based costing study. Plast Reconstr Surg Glob Open. 2019;7:e2460. doi: 10.1097/GOX.0000000000002460
3. Danak SU, Guetterman TC, Plegue MA, et al. Influence of scribes on patient-physician communication in primary care encounters: mixed methods study. JMIR Med Inform. 2019;7:e14797. doi: 10.2196/14797
4. Martel ML, Imdieke BH, Holm KM, et al. Developing a medical scribe program at an academic hospital: the Hennepin County Medical Center experience. Jt Comm J Qual Patient Saf. 2018;44:238-249. doi: 10.1016/j.jcjq.2018.01.001
5. Mishra P, Kiang JC, Grant RW. Association of medical scribes in primary care with physician workflow and patient experience. JAMA Intern Med. 2018;178:1467-1472. doi: 10.1001/ jamainternmed.2018.3956
6. Taylor KA, McQuilkin D, Hughes RG. Medical scribe impact on patient and provider experience. Mil Med. 2019;184:388-393. doi: 10.1093/milmed/usz030
7. Gidwani R, Nguyen C, Kofoed A, et al. Impact of scribes on physician satisfaction, patient satisfaction, and charting efficiency: a randomized controlled trial. Ann Fam Med. 2017;15:427-433. doi: 10.1370/afm.2122.
8. Heckman J, Mukamal KJ, Christensen A, et al. Medical scribes, provider and patient experience, and patient throughput: a trial in an academic general internal medicine practice. J Gen Intern Med. 2019;35:770-774. doi: 10.1007/s11606-019-05352-5
9. Koshy S, Feustel PJ, Hong M, et al. Scribes in an ambulatory urology practice: patient and physician satisfaction. J Urol. 2010;184:258-262. doi: 10.1016/j.juro.2010.03.040
10. McCormick BJ, Deal A, Borawski KM, et al. Implementation of medical scribes in an academic urology practice: an analysis of productivity, revenue, and satisfaction. World J Urol. 2018;36:1691-1697. doi: 10.1007/s00345-018-2293-8
11. Pozdnyakova A, Laiteerapong N, Volerman A, et al. Impact of medical scribes on physician and patient satisfaction in primary care. J Gen Intern Med. Jul 2018;33:1109-1115. doi: 10.1007/ s11606-018-4434-6
12. Bank AJ, Obetz C, Konrardy A, et al. Impact of scribes on patient interaction, productivity, and revenue in a cardiology clinic: a prospective study. Clinicoecon Outcomes Res. 2013;5:399-406. doi: 10.2147/CEOR.S49010
13. Danila MI, Melnick JA, Curtis JR, et al. Use of scribes for documentation assistance in rheumatology and endocrinology clinics: impact on clinic workflow and patient and physician satisfaction. J Clin Rheumatol. 2018;24:116-121. doi: 10.1097/ RHU.0000000000000620
14. Keefe KR, Levi JR, Brook CD. The impact of medical scribes on patient satisfaction in an academic otolaryngology clinic. Ann Otol Rhinol Laryngol. 2020;129:238-244. doi: 10.1177/0003489419884337
15. Lowry C, Orr K, Embry B, et al. Primary care scribes: writing a new story for safety net clinics. BMJ Open Qual. 2017;6:e000124. doi: 10.1136/bmjoq-2017-000124
16. Rohlfing ML, Keefe KR, Komshian SR, et al. Clinical scribes and their association with patient experience in the otolaryngology clinic. Laryngoscope. 2020;130:e134-e139. doi: 10.1002/ lary.28075
17. Arya R, Salovich DM, Ohman-Strickland P, et al. Impact of scribes on performance indicators in the emergency department. Acad Emerg Med. 2010;17:490-494. doi: 10.1111/j.1553- 2712.2010.00718.x
18. Ewelukwa O, Perez R, Carter LE, et al. Incorporation of scribes into the inflammatory bowel disease clinic improves quality of care and physician productivity. Inflamm Bowel Dis. 2018;24: 552-557. doi: 10.1093/ibd/izx078
19. Misra-Hebert AD, Yan C, Rothberg MB. Physician, scribe, and patient perspectives on clinical scribes in primary care. J Gen Intern Med. 2017;32:244. doi: 10.1007/s11606-016-3888-7
20. Platt J, Altman W. Can medical scribes improve quality measure documentation? J Fam Pract. Jun 2019;68:e1-e7.
21. Guglielmo WJ. What a scribe can do for you. Med Econ. Jan 6 2006;83:42,44-46.
22. Richmond M. Don’t use scribes for order entry. Emergency Medicine News. 2009;31:6-7. doi: 10.1097/01.EEM.0000360578.87654.cc
23. Schiff GD, Zucker L. Medical scribes: salvation for primary care or workaround for poor EMR usability? J Gen Intern Med. 2016;31:979-981. doi: 10.1007/s11606-016-3788-x
24. Bank AJ, Gage RM. Annual impact of scribes on physician productivity and revenue in a cardiology clinic. Clinicoecon Outcomes Res. 2015;7:489-495. doi: 10.2147/CEOR.S89329
25. Heaton HA, Castaneda-Guarderas A, Trotter ER, et al. Effect of scribes on patient throughput, revenue, and patient and provider satisfaction: a systematic review and meta-analysis. Am J Emerg Med. 2016;34:2018-2028. doi: 10.1016/j.ajem.2016.07.056
26. Earls ST, Savageau JA, Begley S, et al. Can scribes boost FPs’ efficiency and job satisfaction? J Fam Pract. 2017;66:206-214.
27. Zallman L, Finnegan K, Roll D, et al. Impact of medical scribes in primary care on productivity, face-to-face time, and patient comfort. J Am Board Fam Med. 2018;31:612-619. doi: 10.3122/ jabfm.2018.04.170325
28. Abbo ED, Zhang Q, Zelder M, et al. The increasing number of clinical items addressed during the time of adult primary care visits. J Gen Intern Med. 2008;23:2058-2065. doi: 10.1007/s11606- 008-0805-8
29. Ammann Howard K, Helé K, Salibi N, et al. Adapting the EHR scribe model to community health centers: the experience of Shasta Community Health Center’s pilot. Blue Shield of California Foundation; 2012. Accessed April 28, 2021. https:// blueshieldcafoundation.org/sites/default/files/publications/ downloadable/Shasta%20EHR%20Scribes%20Final%20Report.pdf
30. Anderson P, Halley MD. A new approach to making your doctor– nurse team more productive. Fam Pract Manag. 2008;15:35-40.
31. Blash L, Dower C, Chapman SA. University of Utah community clinics—medical assistant teams enhance patient-centered, physician-efficient care. Center for the Health Professions at UCSF; April 2011. Revised November 2011. Accessed April 28, 2021. https://healthforce.ucsf.edu/sites/healthforce.ucsf.edu/ files/publication-pdf/3.1%202011_04_University_of_Utah_Community_Clinics--Medical_Assistant_Teams_Enhance_PatientCentered_Physician-Efficient%20Care.pdf
32. Reuben DB, Knudsen J, Senelick W, et al. The effect of a physician partner program on physician efficiency and patient satisfaction. JAMA Intern Med. 2014;174:1190-1193. doi: 10.1001/ jamainternmed.2014.1315

Evaluation of Pharmacologic Interventions for Weight Management in a Veteran Population
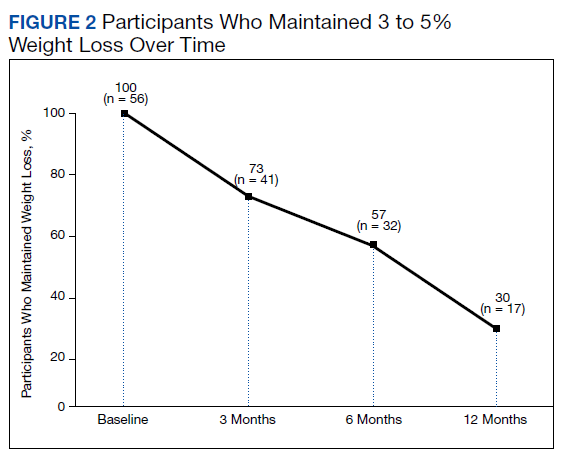
The American Heart Association, the American College of Cardiology, and the Obesity Society define overweight as a body mass index (BMI) of 25 to 29.9 and obesity as a BMI ≥ 30. Morbid obesity is defined as a BMI ≥ 35 or 40.2,3 Based on these BMI cutoffs, the Endocrine Society recommends diet and lifestyle as the foundation of weight management and pharmacotherapy for those with a BMI ≥ 30 without comorbidities. In patients with a BMI ≥ 27, weight management medications may be considered if a patient has comorbid hypertension, T2DM, dyslipidemia, metabolic syndrome, obstructive sleep apnea, or nonalcoholic fatty liver disease. Patients with BMI > 40 are eligible for weight loss surgery.4
Lifestyle and dietary interventions are the foundation of current weight management guidelines from the Endocrine Society.4 At a minimum, guidelines recommended enrolling motivated patients in a high-intensity lifestyle intervention class of at least 14 sessions in the first 6 months to reach a goal weight loss of 5 to 10% from baseline and to maintain a reduction of 3 to 5% from baseline.3 Medications are recommended as an adjunct to lifestyle and dietary changes. Most weight management medications work in the brain to stimulate satiety signaling, which helps motivated patients adhere to their dietary interventions, assist those who have been unsuccessful in earlier weight loss attempts, and help maintain weight.3,4
Guidelines recommend 7 weight management medications, including orlistat (both prescription strength and over-the-counter), liraglutide, phentermine, phentermine/topiramate, lorcaserin, and naltrexone/bupropion. Using medications to assist with weight loss increases likelihood that patients will achieve 5 to 10% weight loss from baseline.5,6 Studies looking at long-term effects of these medications on weight loss have found improvements in blood pressure (BP), biomarkers for cardiovascular disease, and T2DM-related comorbidities.3,5,7
Positive effects on comorbidities have been found to be related to drug class and mechanism of action (MOA); those that also are approved for T2DM have demonstrated the most favorable cardiovascular effects.7 Other medications that work as stimulants or as modulators of serotonin pathways are associated with increased risks, prompting the US Food and Drug Administration (FDA) to remove some medications from the market.7,8 In January 2020, lorcaserin was taken off the market because of increased risk of cancer found in postmarketing surveillance.9 The benefit of weight loss must be weighed against the risk of medication use.
Monthly follow-up is recommended with weight management medications in the beginning to assess safety and efficacy; medications should be discontinued if weight loss is inadequate in the first 3 months.1,3,4 Limited studies have assessed the long-term use of weight management medications in a real-world setting. Medications are prescribed for weight management at Veteran Health Indiana (VHI) in outpatient clinics, including primary care, endocrinology, and gastrointestinal (GI) specialties. However, prescribing practices, outcomes, and adherence to guideline recommendations have not been studied. Data from this study will be used to better understand how VHI can serve its veterans through diet, lifestyle, and pharmacologic interventions.
Methods
We conducted a single-center, retrospective chart review for patients started on weight management medications at VHI. A patient list was generated based on prescription fills from June 1, 2017 to June 30, 2019. All data were obtained using the Computerized Patient Record System and patients were not contacted. This study was approved by the Indiana University Health Institutional Review Board and the VHI Research and Development Committee.
At the time of study, orlistat, liraglutide, phentermine/topiramate,
Patients were included in the study if they received a prescription of any 1 of the 5 available medications during the enrollment period. Patients were excluded if they received a prescription from or were treated by a civilian health care provider, if they never used the medication, or if their weight loss was attributed to a cancer diagnosis. These criteria produced 86 patients of whom 96 unique weight loss prescriptions were generated. Data were collected for each instance of medication use so that some patients were included multiple times. In this case, data collection for the failed medication ended when failure was documented, and new data points began when new medication was prescribed; all data collected were per medication, not per patient. This method was used to account for medication failure and provide accurate weight loss results based on medication choice within this institution.
The primary outcomes included total weight loss and weight loss as a percentage of baseline weight at 3, 6, 12, and > 12 months of therapy. Secondary outcomes included weight loss of 5% from baseline, rate of successful weight maintenance after initial weight loss of 5% from baseline, adverse drug reaction (ADR) monitoring, and use of weight management medications across clinics at VHI.
Demographic data included race, age, sex, baseline weight, BMI, and comorbid medical conditions. Comorbidities were collected based on the most recent primary care clinical note before initiating medication. Medication data collected included medications used to manage comorbidities. Data related to weight management medication included prescribing clinic, reason for medication discontinuation, or bariatric surgery intervention if applicable.
Efficacy outcome data included weight and BMI across therapy duration. Safety outcomes data included heart rate, BP, and ADRs that resulted in medication discontinuation as documented in the electronic health record (EHR).
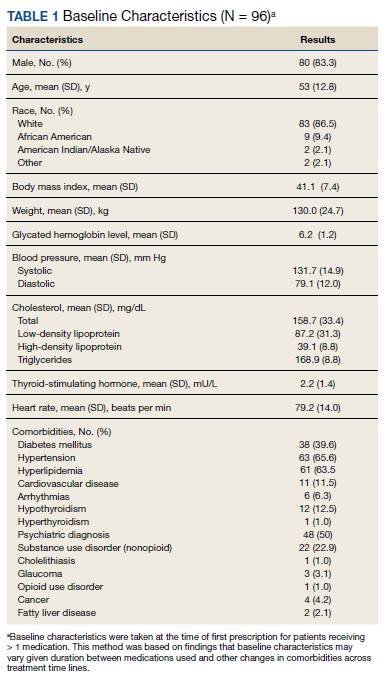
We used descriptive statistics, including mean, standard deviation (SD), range, and percentage. For continuous data, Kruskal-Wallis tests were used because of nonparametric data distribution among the different medications with a prespecified α = 0.05. With the observed sample sizes and SDs in this study, post hoc poststudy power calculations showed that the study had 80% power at a 5% significance level to detect weight changes of 8.6 kg, 7.3 kg, and 12.4 kg at 3, 6, and 12 months, respectively, using nonparametric tests.
Results
A total of 86 patients were identified based on prescription fills, which produced 99 unique instances of medication use. Of the 99 identified, 3 met exclusion criteria and were not included in the final analysis. Among included veterans, 16 were female and 80 were male (Table 1). Most of those included identified as White race (86%), male (83%), and mean age 53 years. At baseline, mean weight was 130 kg and mean BMI 41.
Comorbidities and Medication Use
Hypertension (66%), hyperlipidemia (64%), and psychiatric diagnoses (50%) were most common comorbid conditions. Substance use (23%) and T2DM (40%) were the most common comorbidities influencing medication choice. Substance use evaluation included amphetamines and cocaine for this analysis.
Phentermine/topiramate is the preferred first-line agent unless patients have contraindications for use, in which case naltrexone/bupropion is recommended, based on guidelines for weight management medications within the VHI system. However, for patients with comorbid T2DM, liraglutide is preferred because of its beneficial effects for both weight loss and blood glucose control.2 Most patients at VHI were started on liraglutide (44%) or phentermine/topiramate (42%), which was in line with recommendations. Our sample included ≥ 1 prescription for each medication available at our facility, although the number of patients on each medication was not equal. Of note, the one patient taking lorcaserin at the time of study discontinued therapy in response to recent FDA guidance.9
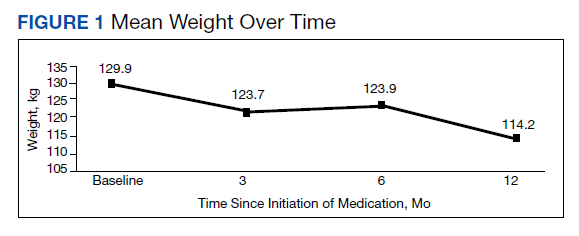
Medications for comorbid conditions could contribute to weight gain. Of the patient sample, β blockers (n = 24) and anticonvulsants, including gabapentin and pregabalin (n = 22) were the most common Other medications that could have contributed to weight gain included sulfonylureas (n = 5), antipsychotics (n = 4), tricyclic antidepressants (n = 2), and hormone replacement therapies (n = 2).
Primary Outcomes
The mean weight of participants dropped from 129.9 to 114.2 kg over the 12 months of weight management medication therapy for a absolute difference of 15.8 kg (Figure 1 and eTable 1 available at doi:10.12788/fp.0117). Weight loss was recorded at 3, 6, 12, and > 12 months of weight management therapy. At each time point, weight loss was statistically significant (P < .001) compared with baseline (Table 2), even though not every patient had weight loss records at each time point.
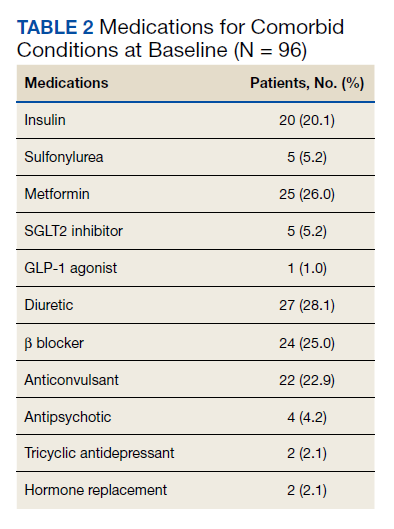
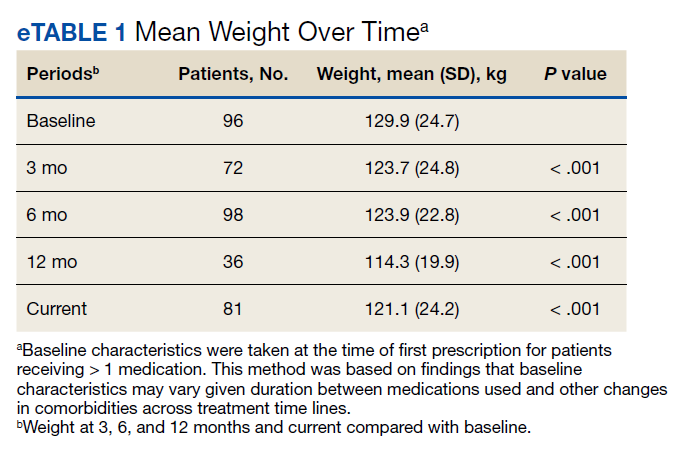
When classified by medication choice,
Secondary Outcomes
More than one-half of the patients analyzed lost 5 to 10% from baseline while taking weight management medication.

Among patients who lost at least 5% from baseline, we performed further analysis to assess weight maintenance of 3 to 5% from baseline for 12 months.

We found that most of our prescriptions (n = 50) were entered by the endocrinology department in conjunction with the MOVE! program (eTable 3 available at doi:10.12788/fp.0117). All 4 of our primary care clinics prescribed weight loss medication; however, 1 clinic prescribed the most. Other prescriptions came from community-based outpatient clinics or other specialties, including gastroenterology, orthopedics, and sleep medicine.
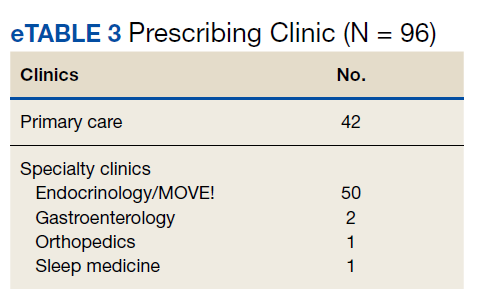
Nineteen (18%) patients experienced an adverse event (AE) that led to medication discontinuation, which was recorded in their chart (eTable 4 available at doi:10.12788/fp.0117). Most common AEs were GI upset with liraglutide or orlistat or dull aching and pain with phentermine/topiramate. Two severe AEs occurred: One patient experienced a change in mental health status and suicide attempt with naltrexone/bupropion; and 1 patient discontinued phentermine/topiramate because of a change in neurologic status.
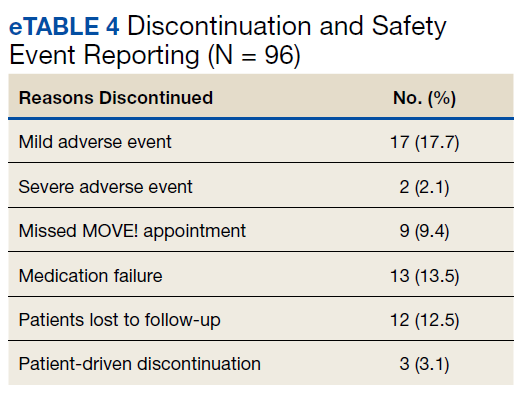
Primarily medications were stopped because of inadequate weight loss (n = 13), and most patients tried additional medications. However, 1 medication failure resulted in sleeve gastrectomy. Other reasons for medication discontinuation included missed MOVE! appointments, patient lost to follow-up, and patient-elected discontinuation.
Discussion
This study evaluated the use and outcomes of weight management medication among veterans at VHI. The study aimed to better understand the efficacy and safety of these medications while exposing potential weaknesses in care and to promote avenues to improve weight loss and maintenance.
Clinical trials for weight management medications reported weight loss of 8 to 10 kg over 56 weeks: 21 to 63% of patients losing at least 5% from baseline weight.10-14 The findings from our study found a higher average weight loss (−15.8 kg) than that reported in trials and a consistent percentage of patients (58.3%) who achieved at least 5% weight loss. It is promising to see that when used in a noncontrolled setting, these medications were able to produce weight loss consistent with results seen in large, controlled trials.
Pi-Sunyer and colleagues found continued weight loss after the initial 5% weight loss to an eventual 10% weight loss in many patients.10 Additionally, Smith and colleagues found that nearly 68% of their participants who took lorcaserin were able to maintain 3 to 5% weight loss over 12 months.13 Sjöström and colleagues acknowledged that many patients taking orlistat for an extended period began to gain weight, although at one-half the rate than that seen in the placebo group.12 This study found that fewer patients were able to maintain their weight loss over 12 months, with only 30% of patients maintaining 3 to 5% weight loss from baseline. This difference in weight maintenance likely was because of the uncontrolled nature of this study. Once patients reach their initial weight loss goal, even the most motivated patients will have trouble maintaining that weight.4 Despite the challenges associated with maintaining weight loss, the quality of life benefits patients gained and potential reductions in health care spending support using resources to improve these outcomes.2,14,15
Pi-Sunyer and colleagues reported high incidences of nausea (40%), vomiting (16%), diarrhea (21%), and constipation (20%) with liraglutide.10 Sjöström and colleagues reported 7% of patients experienced GI upset with orlistat.12 Comparatively, only 17% of our patients reported AEs that required discontinuation, including GI upset. One patient in our study discontinued naltrexone/bupropion because of a significant change in mental status and suicide attempt. Clinical trials did not report a greater risk of depression or suicidality compared with placebo; however, there is a warning on the labeling of naltrexone/bupropion for increased suicidality with the use of antidepressant agents.16,17 The neurologic AE that required discontinuation of phentermine/topiramate at our institution is unique based on published information.11,18
The data from this study reinforced the observation that weight maintenance is the most challenging aspect of weight loss. Although our data showed clinically meaningful weight loss from baseline, many patients regained their weight, and some exceeded their baseline weight. Beyond providing these medications, this evidence suggests the need for close, continued follow-up through patients’ weight loss journey.
Limitations
Because this is a retrospective chart review, data collection was influenced by and limited to information that had been recorded in the EHR. AEs that resulted in medication discontinuation were assessed from the patient’s chart, which might not be correct if providers did not update the records. Follow-up was not always scheduled at regular intervals after medication initiation, resulting in varying sample numbers at each time point, potentially interfering with true weight loss averages. Although not included in this analysis, it might be beneficial to evaluate adherence to recommendations for follow-up with laboratory and weight monitoring to better capture where future monitoring can be improved. Second, there was an unbalanced number of patients taking each medication. Specifically, we saw a change in weight with orlistat that exceeded what is consistently seen in larger, more controlled trials. Although this is an effect of the real world, small sample sizes cannot be generalized to the larger population and might result in data reflecting that of an outlier. Last, there is a lack of generalizability because of the veteran population demographic, which is more male and lacks ethnic diversity. This study also was carried out at a single, educational tertiary medical center, which might not apply to all populations.
Conclusions
Despite the limitations discussed, this study shows that the use of weight management medications in a general veteran population produces initial weight loss consistent with previous studies. However, there is room for continued improvement in follow-up strategies to promote greater weight maintenance after initial weight loss. Considering the high health care costs, personal burden, and potential long-term complications associated with obesity, efforts to promote development of programs that support weight management and maintenance are imperative.
Acknowledgment
This material is the result of work supported with resources and the use of facilities at Veteran Health Indiana.
1. Centers for Disease Control and Prevention. Adult obesity facts. Accessed April 2020. https://www.cdc.gov/obesity/data/adult.html
2. The Management of Overweight and Obesity Working Group. VA/DoD Clinical Practice Guideline for Screening and Management of Overweight and Obesity. Accessed March 13, 2021. https://www.healthquality.va.gov/guidelines/CD/obesity/VADoDCPGManagementOfOverweightAndObesityFinal.pdf
3. Jensen MD, Ryan DH, Apovian CM, et al; American College of Cardiology/American Heart Association Task Force on Practice Guidelines; Obesity Society. 2013 AHA/ACC/TOS guideline for the management of overweight and obesity in adults: a report of the American College of Cardiology/American Heart Association Task Force on Practice Guidelines and the Obesity Society. J Am Coll Cardiol. 2014;63(25, pt B):2985-3023. doi:10.1016/j.jacc.2013.11.004
4. Apovian CM, Aronne LJ, Bessesen DH, et al; Endocrine Society. Pharmacological management of obesity: an Endocrine Society clinical practice guideline. J Clin Endocrinol Metab 2015;100(2):342-362. doi:10.1210/jc.2014-3415
5. Rucker D, Padwal R, Li SK, Curioni C, Lau DCW. Long term pharmacotherapy for obesity and overweight: updated meta-analysis. BMJ. 2007;335(7631):1194-1199. doi:10.1136/bmj.39385.413113.25
6. Siebenhofer A, Winterholer, S, Jeitler K, et al. Long-term effects of weight-reducing drugs in people with hypertension. Cochrane Database Syst Rev 2021;1:CD007654. doi:10.1002/14651858.CD007654.pub5
7. Bramante CT, Raatz S, Bomber EM, Oberle MM, Ryder JR. Cardiovascular risks and benefits of medications used for weight loss. Front Endocrinol (Lausanne). 2020;10:883. doi:10.3389/fendo.2019.00883
8. Christensen R, Kristensen PK, Bartels EM, Bliddal H, Astrup A. Efficacy and safety of the weight-loss drug rimonabant: a meta-analysis of randomized trials. Lancet. 2007;370(9600):1706-1713. doi:10.1016/S0140-6736(07)61721-8
9. US Food and Drug Administration. FDA requests the withdrawal of the weight-loss drug Blevique, Belvique XR (lorcaserin) from the market. Accessed April 2020. https://www.fda.gov/drugs/drug-safety-and-availability/fda-requests-withdrawal-weight-loss-drug-belviq-belviq-xr-lorcaserin-market
10. Pi-Sunyer X, Astrup A, Fujioka K, et al; SCALE Obesity and Prediabetes NN8022-1839 Study Group. A randomized, controlled trial of 3.0 mg of liraglutide in weight management. N Engl J Med. 2015;373(1):11-22. doi:10.1056/NEJMoa1411892
11. Gadde KM, Allison DB, Ryan DH, et al. Effects of low-dose, controlled-release phentermine plus topiramate combination on weight and associated comorbidities in overweight and obese adults (CONQUER): a randomized, placebo-controlled, phase 3 trial. Lancet. 2011;377(9774):1341-1352. doi:10.1016/S0140-6736(11)60205-5
12. Sjöström L, Rissanen A, Andersen T, et al. Randomised placebo-controlled trial of orlistat for weight loss and prevention of weight regain in obese patients. European Multicentre Orlistat Study Group. Lancet. 1998;352(9123):167-172. doi:10.1016/s0140-6736(97)11509-4
13. Smith SR, Weissman NJ, Anderson CM, et al; Behavioral Modification and Lorcaserin for Overweight and Obesity Management (BLOOM) Study Group. Multicenter, placebo-controlled trial of lorcaserin for weight loss. N Engl J Med. 2010;363(3):245-256. doi:10.1056/NEJMoa0909809
14. Warkentin LM, Das D, Majumdar SR, Johnson JA, Padwal RS. The effect of weight loss on health-related quality of life: systematic review and meta-analysis of randomized trials. Obes Rev. 2014;15(3):169-182. doi:10.1111/obr.12113
15. Finkelstein EA, Trogdon JG, Cohen JW, Dietz W. Annual medical spending attributable to obesity: payer-and service-specific estimates. Health Aff (Millwood). 2009;28(5):w822-831. doi:10.1377/hlthaff.28.5.w822
16. Greenway FL, Fujioka K, Plodkowski RA, et al; COR-I Study Group. Effect of naltrexone plus bupropion on weight loss in overweight and obese adults (COR-I): a multicenter, randomized, double-blind, placebo-controlled phase 3 trial. Lancet. 2010;376(9741):595-605. doi:10.1016/S0140-6736(10)60888-4
17. Contrave. Prescribing information. Nalpropion Pharmaceuticals, Inc; 2019.
18. Qsymia. Prescribing information. VIVUS Inc; 2018.
The American Heart Association, the American College of Cardiology, and the Obesity Society define overweight as a body mass index (BMI) of 25 to 29.9 and obesity as a BMI ≥ 30. Morbid obesity is defined as a BMI ≥ 35 or 40.2,3 Based on these BMI cutoffs, the Endocrine Society recommends diet and lifestyle as the foundation of weight management and pharmacotherapy for those with a BMI ≥ 30 without comorbidities. In patients with a BMI ≥ 27, weight management medications may be considered if a patient has comorbid hypertension, T2DM, dyslipidemia, metabolic syndrome, obstructive sleep apnea, or nonalcoholic fatty liver disease. Patients with BMI > 40 are eligible for weight loss surgery.4
Lifestyle and dietary interventions are the foundation of current weight management guidelines from the Endocrine Society.4 At a minimum, guidelines recommended enrolling motivated patients in a high-intensity lifestyle intervention class of at least 14 sessions in the first 6 months to reach a goal weight loss of 5 to 10% from baseline and to maintain a reduction of 3 to 5% from baseline.3 Medications are recommended as an adjunct to lifestyle and dietary changes. Most weight management medications work in the brain to stimulate satiety signaling, which helps motivated patients adhere to their dietary interventions, assist those who have been unsuccessful in earlier weight loss attempts, and help maintain weight.3,4
Guidelines recommend 7 weight management medications, including orlistat (both prescription strength and over-the-counter), liraglutide, phentermine, phentermine/topiramate, lorcaserin, and naltrexone/bupropion. Using medications to assist with weight loss increases likelihood that patients will achieve 5 to 10% weight loss from baseline.5,6 Studies looking at long-term effects of these medications on weight loss have found improvements in blood pressure (BP), biomarkers for cardiovascular disease, and T2DM-related comorbidities.3,5,7
Positive effects on comorbidities have been found to be related to drug class and mechanism of action (MOA); those that also are approved for T2DM have demonstrated the most favorable cardiovascular effects.7 Other medications that work as stimulants or as modulators of serotonin pathways are associated with increased risks, prompting the US Food and Drug Administration (FDA) to remove some medications from the market.7,8 In January 2020, lorcaserin was taken off the market because of increased risk of cancer found in postmarketing surveillance.9 The benefit of weight loss must be weighed against the risk of medication use.
Monthly follow-up is recommended with weight management medications in the beginning to assess safety and efficacy; medications should be discontinued if weight loss is inadequate in the first 3 months.1,3,4 Limited studies have assessed the long-term use of weight management medications in a real-world setting. Medications are prescribed for weight management at Veteran Health Indiana (VHI) in outpatient clinics, including primary care, endocrinology, and gastrointestinal (GI) specialties. However, prescribing practices, outcomes, and adherence to guideline recommendations have not been studied. Data from this study will be used to better understand how VHI can serve its veterans through diet, lifestyle, and pharmacologic interventions.
Methods
We conducted a single-center, retrospective chart review for patients started on weight management medications at VHI. A patient list was generated based on prescription fills from June 1, 2017 to June 30, 2019. All data were obtained using the Computerized Patient Record System and patients were not contacted. This study was approved by the Indiana University Health Institutional Review Board and the VHI Research and Development Committee.
At the time of study, orlistat, liraglutide, phentermine/topiramate,
Patients were included in the study if they received a prescription of any 1 of the 5 available medications during the enrollment period. Patients were excluded if they received a prescription from or were treated by a civilian health care provider, if they never used the medication, or if their weight loss was attributed to a cancer diagnosis. These criteria produced 86 patients of whom 96 unique weight loss prescriptions were generated. Data were collected for each instance of medication use so that some patients were included multiple times. In this case, data collection for the failed medication ended when failure was documented, and new data points began when new medication was prescribed; all data collected were per medication, not per patient. This method was used to account for medication failure and provide accurate weight loss results based on medication choice within this institution.
The primary outcomes included total weight loss and weight loss as a percentage of baseline weight at 3, 6, 12, and > 12 months of therapy. Secondary outcomes included weight loss of 5% from baseline, rate of successful weight maintenance after initial weight loss of 5% from baseline, adverse drug reaction (ADR) monitoring, and use of weight management medications across clinics at VHI.
Demographic data included race, age, sex, baseline weight, BMI, and comorbid medical conditions. Comorbidities were collected based on the most recent primary care clinical note before initiating medication. Medication data collected included medications used to manage comorbidities. Data related to weight management medication included prescribing clinic, reason for medication discontinuation, or bariatric surgery intervention if applicable.
Efficacy outcome data included weight and BMI across therapy duration. Safety outcomes data included heart rate, BP, and ADRs that resulted in medication discontinuation as documented in the electronic health record (EHR).
We used descriptive statistics, including mean, standard deviation (SD), range, and percentage. For continuous data, Kruskal-Wallis tests were used because of nonparametric data distribution among the different medications with a prespecified α = 0.05. With the observed sample sizes and SDs in this study, post hoc poststudy power calculations showed that the study had 80% power at a 5% significance level to detect weight changes of 8.6 kg, 7.3 kg, and 12.4 kg at 3, 6, and 12 months, respectively, using nonparametric tests.
Results
A total of 86 patients were identified based on prescription fills, which produced 99 unique instances of medication use. Of the 99 identified, 3 met exclusion criteria and were not included in the final analysis. Among included veterans, 16 were female and 80 were male (Table 1). Most of those included identified as White race (86%), male (83%), and mean age 53 years. At baseline, mean weight was 130 kg and mean BMI 41.
Comorbidities and Medication Use
Hypertension (66%), hyperlipidemia (64%), and psychiatric diagnoses (50%) were most common comorbid conditions. Substance use (23%) and T2DM (40%) were the most common comorbidities influencing medication choice. Substance use evaluation included amphetamines and cocaine for this analysis.
Phentermine/topiramate is the preferred first-line agent unless patients have contraindications for use, in which case naltrexone/bupropion is recommended, based on guidelines for weight management medications within the VHI system. However, for patients with comorbid T2DM, liraglutide is preferred because of its beneficial effects for both weight loss and blood glucose control.2 Most patients at VHI were started on liraglutide (44%) or phentermine/topiramate (42%), which was in line with recommendations. Our sample included ≥ 1 prescription for each medication available at our facility, although the number of patients on each medication was not equal. Of note, the one patient taking lorcaserin at the time of study discontinued therapy in response to recent FDA guidance.9
Medications for comorbid conditions could contribute to weight gain. Of the patient sample, β blockers (n = 24) and anticonvulsants, including gabapentin and pregabalin (n = 22) were the most common Other medications that could have contributed to weight gain included sulfonylureas (n = 5), antipsychotics (n = 4), tricyclic antidepressants (n = 2), and hormone replacement therapies (n = 2).
Primary Outcomes
The mean weight of participants dropped from 129.9 to 114.2 kg over the 12 months of weight management medication therapy for a absolute difference of 15.8 kg (Figure 1 and eTable 1 available at doi:10.12788/fp.0117). Weight loss was recorded at 3, 6, 12, and > 12 months of weight management therapy. At each time point, weight loss was statistically significant (P < .001) compared with baseline (Table 2), even though not every patient had weight loss records at each time point.
When classified by medication choice,
Secondary Outcomes
More than one-half of the patients analyzed lost 5 to 10% from baseline while taking weight management medication.
Among patients who lost at least 5% from baseline, we performed further analysis to assess weight maintenance of 3 to 5% from baseline for 12 months.
We found that most of our prescriptions (n = 50) were entered by the endocrinology department in conjunction with the MOVE! program (eTable 3 available at doi:10.12788/fp.0117). All 4 of our primary care clinics prescribed weight loss medication; however, 1 clinic prescribed the most. Other prescriptions came from community-based outpatient clinics or other specialties, including gastroenterology, orthopedics, and sleep medicine.
Nineteen (18%) patients experienced an adverse event (AE) that led to medication discontinuation, which was recorded in their chart (eTable 4 available at doi:10.12788/fp.0117). Most common AEs were GI upset with liraglutide or orlistat or dull aching and pain with phentermine/topiramate. Two severe AEs occurred: One patient experienced a change in mental health status and suicide attempt with naltrexone/bupropion; and 1 patient discontinued phentermine/topiramate because of a change in neurologic status.
Primarily medications were stopped because of inadequate weight loss (n = 13), and most patients tried additional medications. However, 1 medication failure resulted in sleeve gastrectomy. Other reasons for medication discontinuation included missed MOVE! appointments, patient lost to follow-up, and patient-elected discontinuation.
Discussion
This study evaluated the use and outcomes of weight management medication among veterans at VHI. The study aimed to better understand the efficacy and safety of these medications while exposing potential weaknesses in care and to promote avenues to improve weight loss and maintenance.
Clinical trials for weight management medications reported weight loss of 8 to 10 kg over 56 weeks: 21 to 63% of patients losing at least 5% from baseline weight.10-14 The findings from our study found a higher average weight loss (−15.8 kg) than that reported in trials and a consistent percentage of patients (58.3%) who achieved at least 5% weight loss. It is promising to see that when used in a noncontrolled setting, these medications were able to produce weight loss consistent with results seen in large, controlled trials.
Pi-Sunyer and colleagues found continued weight loss after the initial 5% weight loss to an eventual 10% weight loss in many patients.10 Additionally, Smith and colleagues found that nearly 68% of their participants who took lorcaserin were able to maintain 3 to 5% weight loss over 12 months.13 Sjöström and colleagues acknowledged that many patients taking orlistat for an extended period began to gain weight, although at one-half the rate than that seen in the placebo group.12 This study found that fewer patients were able to maintain their weight loss over 12 months, with only 30% of patients maintaining 3 to 5% weight loss from baseline. This difference in weight maintenance likely was because of the uncontrolled nature of this study. Once patients reach their initial weight loss goal, even the most motivated patients will have trouble maintaining that weight.4 Despite the challenges associated with maintaining weight loss, the quality of life benefits patients gained and potential reductions in health care spending support using resources to improve these outcomes.2,14,15
Pi-Sunyer and colleagues reported high incidences of nausea (40%), vomiting (16%), diarrhea (21%), and constipation (20%) with liraglutide.10 Sjöström and colleagues reported 7% of patients experienced GI upset with orlistat.12 Comparatively, only 17% of our patients reported AEs that required discontinuation, including GI upset. One patient in our study discontinued naltrexone/bupropion because of a significant change in mental status and suicide attempt. Clinical trials did not report a greater risk of depression or suicidality compared with placebo; however, there is a warning on the labeling of naltrexone/bupropion for increased suicidality with the use of antidepressant agents.16,17 The neurologic AE that required discontinuation of phentermine/topiramate at our institution is unique based on published information.11,18
The data from this study reinforced the observation that weight maintenance is the most challenging aspect of weight loss. Although our data showed clinically meaningful weight loss from baseline, many patients regained their weight, and some exceeded their baseline weight. Beyond providing these medications, this evidence suggests the need for close, continued follow-up through patients’ weight loss journey.
Limitations
Because this is a retrospective chart review, data collection was influenced by and limited to information that had been recorded in the EHR. AEs that resulted in medication discontinuation were assessed from the patient’s chart, which might not be correct if providers did not update the records. Follow-up was not always scheduled at regular intervals after medication initiation, resulting in varying sample numbers at each time point, potentially interfering with true weight loss averages. Although not included in this analysis, it might be beneficial to evaluate adherence to recommendations for follow-up with laboratory and weight monitoring to better capture where future monitoring can be improved. Second, there was an unbalanced number of patients taking each medication. Specifically, we saw a change in weight with orlistat that exceeded what is consistently seen in larger, more controlled trials. Although this is an effect of the real world, small sample sizes cannot be generalized to the larger population and might result in data reflecting that of an outlier. Last, there is a lack of generalizability because of the veteran population demographic, which is more male and lacks ethnic diversity. This study also was carried out at a single, educational tertiary medical center, which might not apply to all populations.
Conclusions
Despite the limitations discussed, this study shows that the use of weight management medications in a general veteran population produces initial weight loss consistent with previous studies. However, there is room for continued improvement in follow-up strategies to promote greater weight maintenance after initial weight loss. Considering the high health care costs, personal burden, and potential long-term complications associated with obesity, efforts to promote development of programs that support weight management and maintenance are imperative.
Acknowledgment
This material is the result of work supported with resources and the use of facilities at Veteran Health Indiana.
The American Heart Association, the American College of Cardiology, and the Obesity Society define overweight as a body mass index (BMI) of 25 to 29.9 and obesity as a BMI ≥ 30. Morbid obesity is defined as a BMI ≥ 35 or 40.2,3 Based on these BMI cutoffs, the Endocrine Society recommends diet and lifestyle as the foundation of weight management and pharmacotherapy for those with a BMI ≥ 30 without comorbidities. In patients with a BMI ≥ 27, weight management medications may be considered if a patient has comorbid hypertension, T2DM, dyslipidemia, metabolic syndrome, obstructive sleep apnea, or nonalcoholic fatty liver disease. Patients with BMI > 40 are eligible for weight loss surgery.4
Lifestyle and dietary interventions are the foundation of current weight management guidelines from the Endocrine Society.4 At a minimum, guidelines recommended enrolling motivated patients in a high-intensity lifestyle intervention class of at least 14 sessions in the first 6 months to reach a goal weight loss of 5 to 10% from baseline and to maintain a reduction of 3 to 5% from baseline.3 Medications are recommended as an adjunct to lifestyle and dietary changes. Most weight management medications work in the brain to stimulate satiety signaling, which helps motivated patients adhere to their dietary interventions, assist those who have been unsuccessful in earlier weight loss attempts, and help maintain weight.3,4
Guidelines recommend 7 weight management medications, including orlistat (both prescription strength and over-the-counter), liraglutide, phentermine, phentermine/topiramate, lorcaserin, and naltrexone/bupropion. Using medications to assist with weight loss increases likelihood that patients will achieve 5 to 10% weight loss from baseline.5,6 Studies looking at long-term effects of these medications on weight loss have found improvements in blood pressure (BP), biomarkers for cardiovascular disease, and T2DM-related comorbidities.3,5,7
Positive effects on comorbidities have been found to be related to drug class and mechanism of action (MOA); those that also are approved for T2DM have demonstrated the most favorable cardiovascular effects.7 Other medications that work as stimulants or as modulators of serotonin pathways are associated with increased risks, prompting the US Food and Drug Administration (FDA) to remove some medications from the market.7,8 In January 2020, lorcaserin was taken off the market because of increased risk of cancer found in postmarketing surveillance.9 The benefit of weight loss must be weighed against the risk of medication use.
Monthly follow-up is recommended with weight management medications in the beginning to assess safety and efficacy; medications should be discontinued if weight loss is inadequate in the first 3 months.1,3,4 Limited studies have assessed the long-term use of weight management medications in a real-world setting. Medications are prescribed for weight management at Veteran Health Indiana (VHI) in outpatient clinics, including primary care, endocrinology, and gastrointestinal (GI) specialties. However, prescribing practices, outcomes, and adherence to guideline recommendations have not been studied. Data from this study will be used to better understand how VHI can serve its veterans through diet, lifestyle, and pharmacologic interventions.
Methods
We conducted a single-center, retrospective chart review for patients started on weight management medications at VHI. A patient list was generated based on prescription fills from June 1, 2017 to June 30, 2019. All data were obtained using the Computerized Patient Record System and patients were not contacted. This study was approved by the Indiana University Health Institutional Review Board and the VHI Research and Development Committee.
At the time of study, orlistat, liraglutide, phentermine/topiramate,
Patients were included in the study if they received a prescription of any 1 of the 5 available medications during the enrollment period. Patients were excluded if they received a prescription from or were treated by a civilian health care provider, if they never used the medication, or if their weight loss was attributed to a cancer diagnosis. These criteria produced 86 patients of whom 96 unique weight loss prescriptions were generated. Data were collected for each instance of medication use so that some patients were included multiple times. In this case, data collection for the failed medication ended when failure was documented, and new data points began when new medication was prescribed; all data collected were per medication, not per patient. This method was used to account for medication failure and provide accurate weight loss results based on medication choice within this institution.
The primary outcomes included total weight loss and weight loss as a percentage of baseline weight at 3, 6, 12, and > 12 months of therapy. Secondary outcomes included weight loss of 5% from baseline, rate of successful weight maintenance after initial weight loss of 5% from baseline, adverse drug reaction (ADR) monitoring, and use of weight management medications across clinics at VHI.
Demographic data included race, age, sex, baseline weight, BMI, and comorbid medical conditions. Comorbidities were collected based on the most recent primary care clinical note before initiating medication. Medication data collected included medications used to manage comorbidities. Data related to weight management medication included prescribing clinic, reason for medication discontinuation, or bariatric surgery intervention if applicable.
Efficacy outcome data included weight and BMI across therapy duration. Safety outcomes data included heart rate, BP, and ADRs that resulted in medication discontinuation as documented in the electronic health record (EHR).
We used descriptive statistics, including mean, standard deviation (SD), range, and percentage. For continuous data, Kruskal-Wallis tests were used because of nonparametric data distribution among the different medications with a prespecified α = 0.05. With the observed sample sizes and SDs in this study, post hoc poststudy power calculations showed that the study had 80% power at a 5% significance level to detect weight changes of 8.6 kg, 7.3 kg, and 12.4 kg at 3, 6, and 12 months, respectively, using nonparametric tests.
Results
A total of 86 patients were identified based on prescription fills, which produced 99 unique instances of medication use. Of the 99 identified, 3 met exclusion criteria and were not included in the final analysis. Among included veterans, 16 were female and 80 were male (Table 1). Most of those included identified as White race (86%), male (83%), and mean age 53 years. At baseline, mean weight was 130 kg and mean BMI 41.
Comorbidities and Medication Use
Hypertension (66%), hyperlipidemia (64%), and psychiatric diagnoses (50%) were most common comorbid conditions. Substance use (23%) and T2DM (40%) were the most common comorbidities influencing medication choice. Substance use evaluation included amphetamines and cocaine for this analysis.
Phentermine/topiramate is the preferred first-line agent unless patients have contraindications for use, in which case naltrexone/bupropion is recommended, based on guidelines for weight management medications within the VHI system. However, for patients with comorbid T2DM, liraglutide is preferred because of its beneficial effects for both weight loss and blood glucose control.2 Most patients at VHI were started on liraglutide (44%) or phentermine/topiramate (42%), which was in line with recommendations. Our sample included ≥ 1 prescription for each medication available at our facility, although the number of patients on each medication was not equal. Of note, the one patient taking lorcaserin at the time of study discontinued therapy in response to recent FDA guidance.9
Medications for comorbid conditions could contribute to weight gain. Of the patient sample, β blockers (n = 24) and anticonvulsants, including gabapentin and pregabalin (n = 22) were the most common Other medications that could have contributed to weight gain included sulfonylureas (n = 5), antipsychotics (n = 4), tricyclic antidepressants (n = 2), and hormone replacement therapies (n = 2).
Primary Outcomes
The mean weight of participants dropped from 129.9 to 114.2 kg over the 12 months of weight management medication therapy for a absolute difference of 15.8 kg (Figure 1 and eTable 1 available at doi:10.12788/fp.0117). Weight loss was recorded at 3, 6, 12, and > 12 months of weight management therapy. At each time point, weight loss was statistically significant (P < .001) compared with baseline (Table 2), even though not every patient had weight loss records at each time point.
When classified by medication choice,
Secondary Outcomes
More than one-half of the patients analyzed lost 5 to 10% from baseline while taking weight management medication.
Among patients who lost at least 5% from baseline, we performed further analysis to assess weight maintenance of 3 to 5% from baseline for 12 months.
We found that most of our prescriptions (n = 50) were entered by the endocrinology department in conjunction with the MOVE! program (eTable 3 available at doi:10.12788/fp.0117). All 4 of our primary care clinics prescribed weight loss medication; however, 1 clinic prescribed the most. Other prescriptions came from community-based outpatient clinics or other specialties, including gastroenterology, orthopedics, and sleep medicine.
Nineteen (18%) patients experienced an adverse event (AE) that led to medication discontinuation, which was recorded in their chart (eTable 4 available at doi:10.12788/fp.0117). Most common AEs were GI upset with liraglutide or orlistat or dull aching and pain with phentermine/topiramate. Two severe AEs occurred: One patient experienced a change in mental health status and suicide attempt with naltrexone/bupropion; and 1 patient discontinued phentermine/topiramate because of a change in neurologic status.
Primarily medications were stopped because of inadequate weight loss (n = 13), and most patients tried additional medications. However, 1 medication failure resulted in sleeve gastrectomy. Other reasons for medication discontinuation included missed MOVE! appointments, patient lost to follow-up, and patient-elected discontinuation.
Discussion
This study evaluated the use and outcomes of weight management medication among veterans at VHI. The study aimed to better understand the efficacy and safety of these medications while exposing potential weaknesses in care and to promote avenues to improve weight loss and maintenance.
Clinical trials for weight management medications reported weight loss of 8 to 10 kg over 56 weeks: 21 to 63% of patients losing at least 5% from baseline weight.10-14 The findings from our study found a higher average weight loss (−15.8 kg) than that reported in trials and a consistent percentage of patients (58.3%) who achieved at least 5% weight loss. It is promising to see that when used in a noncontrolled setting, these medications were able to produce weight loss consistent with results seen in large, controlled trials.
Pi-Sunyer and colleagues found continued weight loss after the initial 5% weight loss to an eventual 10% weight loss in many patients.10 Additionally, Smith and colleagues found that nearly 68% of their participants who took lorcaserin were able to maintain 3 to 5% weight loss over 12 months.13 Sjöström and colleagues acknowledged that many patients taking orlistat for an extended period began to gain weight, although at one-half the rate than that seen in the placebo group.12 This study found that fewer patients were able to maintain their weight loss over 12 months, with only 30% of patients maintaining 3 to 5% weight loss from baseline. This difference in weight maintenance likely was because of the uncontrolled nature of this study. Once patients reach their initial weight loss goal, even the most motivated patients will have trouble maintaining that weight.4 Despite the challenges associated with maintaining weight loss, the quality of life benefits patients gained and potential reductions in health care spending support using resources to improve these outcomes.2,14,15
Pi-Sunyer and colleagues reported high incidences of nausea (40%), vomiting (16%), diarrhea (21%), and constipation (20%) with liraglutide.10 Sjöström and colleagues reported 7% of patients experienced GI upset with orlistat.12 Comparatively, only 17% of our patients reported AEs that required discontinuation, including GI upset. One patient in our study discontinued naltrexone/bupropion because of a significant change in mental status and suicide attempt. Clinical trials did not report a greater risk of depression or suicidality compared with placebo; however, there is a warning on the labeling of naltrexone/bupropion for increased suicidality with the use of antidepressant agents.16,17 The neurologic AE that required discontinuation of phentermine/topiramate at our institution is unique based on published information.11,18
The data from this study reinforced the observation that weight maintenance is the most challenging aspect of weight loss. Although our data showed clinically meaningful weight loss from baseline, many patients regained their weight, and some exceeded their baseline weight. Beyond providing these medications, this evidence suggests the need for close, continued follow-up through patients’ weight loss journey.
Limitations
Because this is a retrospective chart review, data collection was influenced by and limited to information that had been recorded in the EHR. AEs that resulted in medication discontinuation were assessed from the patient’s chart, which might not be correct if providers did not update the records. Follow-up was not always scheduled at regular intervals after medication initiation, resulting in varying sample numbers at each time point, potentially interfering with true weight loss averages. Although not included in this analysis, it might be beneficial to evaluate adherence to recommendations for follow-up with laboratory and weight monitoring to better capture where future monitoring can be improved. Second, there was an unbalanced number of patients taking each medication. Specifically, we saw a change in weight with orlistat that exceeded what is consistently seen in larger, more controlled trials. Although this is an effect of the real world, small sample sizes cannot be generalized to the larger population and might result in data reflecting that of an outlier. Last, there is a lack of generalizability because of the veteran population demographic, which is more male and lacks ethnic diversity. This study also was carried out at a single, educational tertiary medical center, which might not apply to all populations.
Conclusions
Despite the limitations discussed, this study shows that the use of weight management medications in a general veteran population produces initial weight loss consistent with previous studies. However, there is room for continued improvement in follow-up strategies to promote greater weight maintenance after initial weight loss. Considering the high health care costs, personal burden, and potential long-term complications associated with obesity, efforts to promote development of programs that support weight management and maintenance are imperative.
Acknowledgment
This material is the result of work supported with resources and the use of facilities at Veteran Health Indiana.
1. Centers for Disease Control and Prevention. Adult obesity facts. Accessed April 2020. https://www.cdc.gov/obesity/data/adult.html
2. The Management of Overweight and Obesity Working Group. VA/DoD Clinical Practice Guideline for Screening and Management of Overweight and Obesity. Accessed March 13, 2021. https://www.healthquality.va.gov/guidelines/CD/obesity/VADoDCPGManagementOfOverweightAndObesityFinal.pdf
3. Jensen MD, Ryan DH, Apovian CM, et al; American College of Cardiology/American Heart Association Task Force on Practice Guidelines; Obesity Society. 2013 AHA/ACC/TOS guideline for the management of overweight and obesity in adults: a report of the American College of Cardiology/American Heart Association Task Force on Practice Guidelines and the Obesity Society. J Am Coll Cardiol. 2014;63(25, pt B):2985-3023. doi:10.1016/j.jacc.2013.11.004
4. Apovian CM, Aronne LJ, Bessesen DH, et al; Endocrine Society. Pharmacological management of obesity: an Endocrine Society clinical practice guideline. J Clin Endocrinol Metab 2015;100(2):342-362. doi:10.1210/jc.2014-3415
5. Rucker D, Padwal R, Li SK, Curioni C, Lau DCW. Long term pharmacotherapy for obesity and overweight: updated meta-analysis. BMJ. 2007;335(7631):1194-1199. doi:10.1136/bmj.39385.413113.25
6. Siebenhofer A, Winterholer, S, Jeitler K, et al. Long-term effects of weight-reducing drugs in people with hypertension. Cochrane Database Syst Rev 2021;1:CD007654. doi:10.1002/14651858.CD007654.pub5
7. Bramante CT, Raatz S, Bomber EM, Oberle MM, Ryder JR. Cardiovascular risks and benefits of medications used for weight loss. Front Endocrinol (Lausanne). 2020;10:883. doi:10.3389/fendo.2019.00883
8. Christensen R, Kristensen PK, Bartels EM, Bliddal H, Astrup A. Efficacy and safety of the weight-loss drug rimonabant: a meta-analysis of randomized trials. Lancet. 2007;370(9600):1706-1713. doi:10.1016/S0140-6736(07)61721-8
9. US Food and Drug Administration. FDA requests the withdrawal of the weight-loss drug Blevique, Belvique XR (lorcaserin) from the market. Accessed April 2020. https://www.fda.gov/drugs/drug-safety-and-availability/fda-requests-withdrawal-weight-loss-drug-belviq-belviq-xr-lorcaserin-market
10. Pi-Sunyer X, Astrup A, Fujioka K, et al; SCALE Obesity and Prediabetes NN8022-1839 Study Group. A randomized, controlled trial of 3.0 mg of liraglutide in weight management. N Engl J Med. 2015;373(1):11-22. doi:10.1056/NEJMoa1411892
11. Gadde KM, Allison DB, Ryan DH, et al. Effects of low-dose, controlled-release phentermine plus topiramate combination on weight and associated comorbidities in overweight and obese adults (CONQUER): a randomized, placebo-controlled, phase 3 trial. Lancet. 2011;377(9774):1341-1352. doi:10.1016/S0140-6736(11)60205-5
12. Sjöström L, Rissanen A, Andersen T, et al. Randomised placebo-controlled trial of orlistat for weight loss and prevention of weight regain in obese patients. European Multicentre Orlistat Study Group. Lancet. 1998;352(9123):167-172. doi:10.1016/s0140-6736(97)11509-4
13. Smith SR, Weissman NJ, Anderson CM, et al; Behavioral Modification and Lorcaserin for Overweight and Obesity Management (BLOOM) Study Group. Multicenter, placebo-controlled trial of lorcaserin for weight loss. N Engl J Med. 2010;363(3):245-256. doi:10.1056/NEJMoa0909809
14. Warkentin LM, Das D, Majumdar SR, Johnson JA, Padwal RS. The effect of weight loss on health-related quality of life: systematic review and meta-analysis of randomized trials. Obes Rev. 2014;15(3):169-182. doi:10.1111/obr.12113
15. Finkelstein EA, Trogdon JG, Cohen JW, Dietz W. Annual medical spending attributable to obesity: payer-and service-specific estimates. Health Aff (Millwood). 2009;28(5):w822-831. doi:10.1377/hlthaff.28.5.w822
16. Greenway FL, Fujioka K, Plodkowski RA, et al; COR-I Study Group. Effect of naltrexone plus bupropion on weight loss in overweight and obese adults (COR-I): a multicenter, randomized, double-blind, placebo-controlled phase 3 trial. Lancet. 2010;376(9741):595-605. doi:10.1016/S0140-6736(10)60888-4
17. Contrave. Prescribing information. Nalpropion Pharmaceuticals, Inc; 2019.
18. Qsymia. Prescribing information. VIVUS Inc; 2018.
1. Centers for Disease Control and Prevention. Adult obesity facts. Accessed April 2020. https://www.cdc.gov/obesity/data/adult.html
2. The Management of Overweight and Obesity Working Group. VA/DoD Clinical Practice Guideline for Screening and Management of Overweight and Obesity. Accessed March 13, 2021. https://www.healthquality.va.gov/guidelines/CD/obesity/VADoDCPGManagementOfOverweightAndObesityFinal.pdf
3. Jensen MD, Ryan DH, Apovian CM, et al; American College of Cardiology/American Heart Association Task Force on Practice Guidelines; Obesity Society. 2013 AHA/ACC/TOS guideline for the management of overweight and obesity in adults: a report of the American College of Cardiology/American Heart Association Task Force on Practice Guidelines and the Obesity Society. J Am Coll Cardiol. 2014;63(25, pt B):2985-3023. doi:10.1016/j.jacc.2013.11.004
4. Apovian CM, Aronne LJ, Bessesen DH, et al; Endocrine Society. Pharmacological management of obesity: an Endocrine Society clinical practice guideline. J Clin Endocrinol Metab 2015;100(2):342-362. doi:10.1210/jc.2014-3415
5. Rucker D, Padwal R, Li SK, Curioni C, Lau DCW. Long term pharmacotherapy for obesity and overweight: updated meta-analysis. BMJ. 2007;335(7631):1194-1199. doi:10.1136/bmj.39385.413113.25
6. Siebenhofer A, Winterholer, S, Jeitler K, et al. Long-term effects of weight-reducing drugs in people with hypertension. Cochrane Database Syst Rev 2021;1:CD007654. doi:10.1002/14651858.CD007654.pub5
7. Bramante CT, Raatz S, Bomber EM, Oberle MM, Ryder JR. Cardiovascular risks and benefits of medications used for weight loss. Front Endocrinol (Lausanne). 2020;10:883. doi:10.3389/fendo.2019.00883
8. Christensen R, Kristensen PK, Bartels EM, Bliddal H, Astrup A. Efficacy and safety of the weight-loss drug rimonabant: a meta-analysis of randomized trials. Lancet. 2007;370(9600):1706-1713. doi:10.1016/S0140-6736(07)61721-8
9. US Food and Drug Administration. FDA requests the withdrawal of the weight-loss drug Blevique, Belvique XR (lorcaserin) from the market. Accessed April 2020. https://www.fda.gov/drugs/drug-safety-and-availability/fda-requests-withdrawal-weight-loss-drug-belviq-belviq-xr-lorcaserin-market
10. Pi-Sunyer X, Astrup A, Fujioka K, et al; SCALE Obesity and Prediabetes NN8022-1839 Study Group. A randomized, controlled trial of 3.0 mg of liraglutide in weight management. N Engl J Med. 2015;373(1):11-22. doi:10.1056/NEJMoa1411892
11. Gadde KM, Allison DB, Ryan DH, et al. Effects of low-dose, controlled-release phentermine plus topiramate combination on weight and associated comorbidities in overweight and obese adults (CONQUER): a randomized, placebo-controlled, phase 3 trial. Lancet. 2011;377(9774):1341-1352. doi:10.1016/S0140-6736(11)60205-5
12. Sjöström L, Rissanen A, Andersen T, et al. Randomised placebo-controlled trial of orlistat for weight loss and prevention of weight regain in obese patients. European Multicentre Orlistat Study Group. Lancet. 1998;352(9123):167-172. doi:10.1016/s0140-6736(97)11509-4
13. Smith SR, Weissman NJ, Anderson CM, et al; Behavioral Modification and Lorcaserin for Overweight and Obesity Management (BLOOM) Study Group. Multicenter, placebo-controlled trial of lorcaserin for weight loss. N Engl J Med. 2010;363(3):245-256. doi:10.1056/NEJMoa0909809
14. Warkentin LM, Das D, Majumdar SR, Johnson JA, Padwal RS. The effect of weight loss on health-related quality of life: systematic review and meta-analysis of randomized trials. Obes Rev. 2014;15(3):169-182. doi:10.1111/obr.12113
15. Finkelstein EA, Trogdon JG, Cohen JW, Dietz W. Annual medical spending attributable to obesity: payer-and service-specific estimates. Health Aff (Millwood). 2009;28(5):w822-831. doi:10.1377/hlthaff.28.5.w822
16. Greenway FL, Fujioka K, Plodkowski RA, et al; COR-I Study Group. Effect of naltrexone plus bupropion on weight loss in overweight and obese adults (COR-I): a multicenter, randomized, double-blind, placebo-controlled phase 3 trial. Lancet. 2010;376(9741):595-605. doi:10.1016/S0140-6736(10)60888-4
17. Contrave. Prescribing information. Nalpropion Pharmaceuticals, Inc; 2019.
18. Qsymia. Prescribing information. VIVUS Inc; 2018.